MARCH 4, 2014 - Granville Village · PDF fileChapter 70 Education Aid $ 9,546,823 ... 14 Total...
20
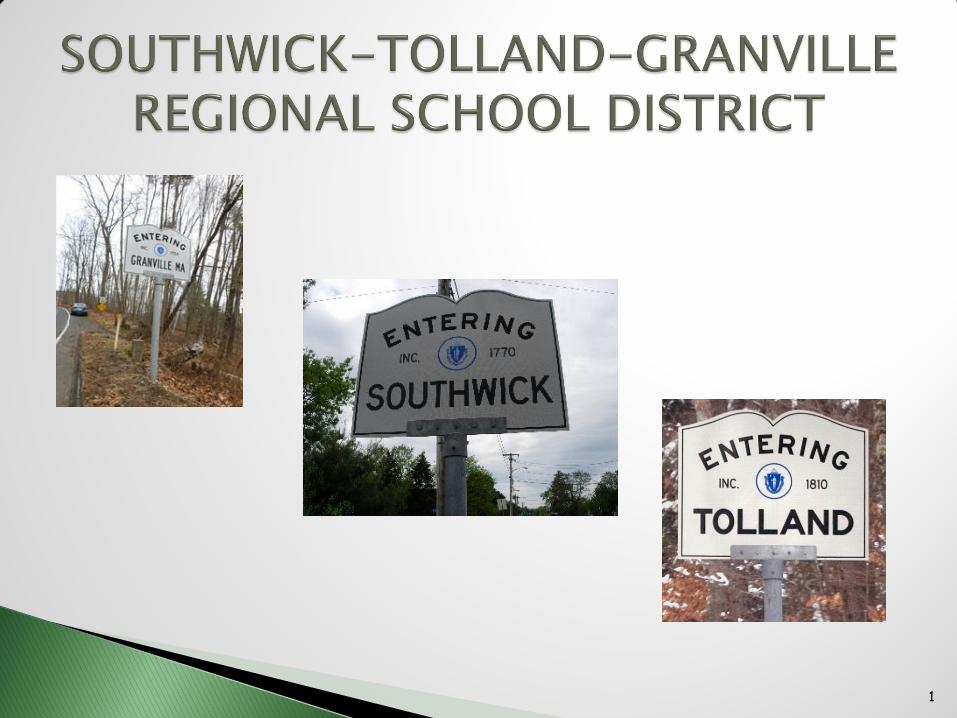
1
Transcript of MARCH 4, 2014 - Granville Village · PDF fileChapter 70 Education Aid $ 9,546,823 ... 14 Total...
1
MARCH 4, 2014
2
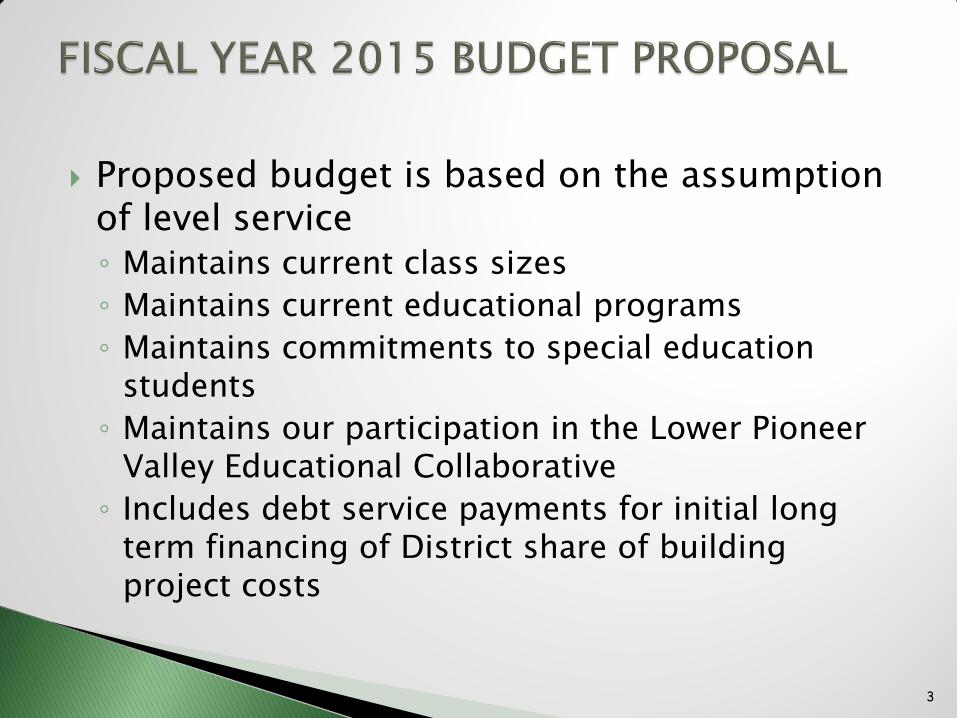
Proposed budget is based on the assumption of level service ◦ Maintains current class sizes
◦ Maintains current educational programs
◦ Maintains commitments to special education students
◦ Maintains our participation in the Lower Pioneer Valley Educational Collaborative
◦ Includes debt service payments for initial long term financing of District share of building project costs
3
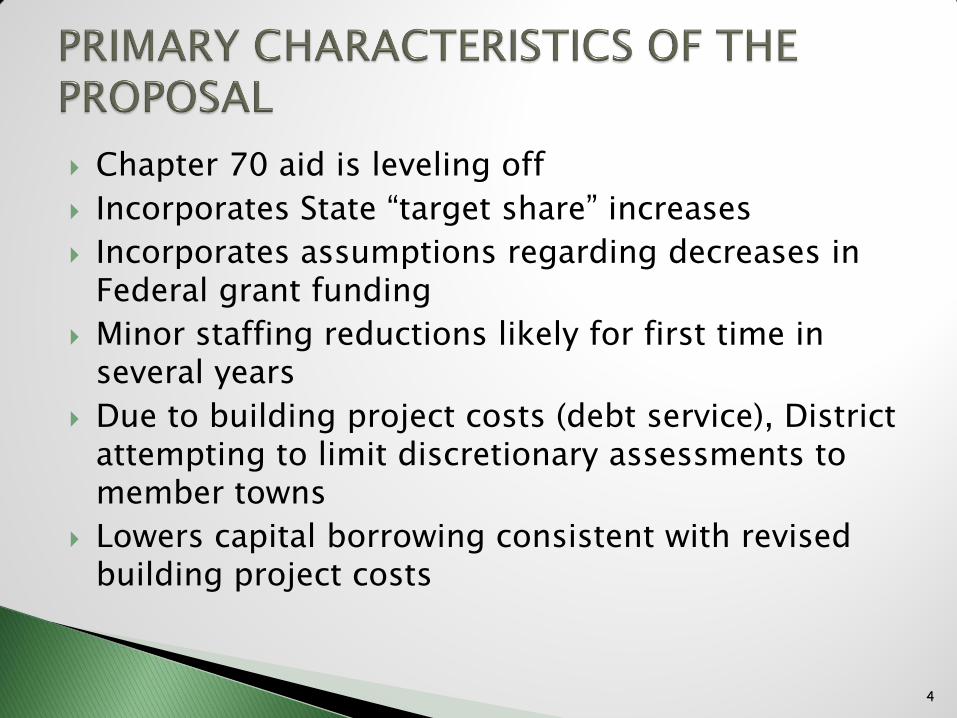
Chapter 70 aid is leveling off
Incorporates State “target share” increases
Incorporates assumptions regarding decreases in Federal grant funding
Minor staffing reductions likely for first time in several years
Due to building project costs (debt service), District attempting to limit discretionary assessments to member towns
Lowers capital borrowing consistent with revised building project costs
4

STGRSD revenue assumptions rely on Gov. Patrick’s “House 1” budget proposal & DOR Cherry Sheets
DESE target share funding goals accelerated
Affects “minimum local contribution”
STGRSD Chapter 70 school aid increases by $41,800 (<.5%)
5
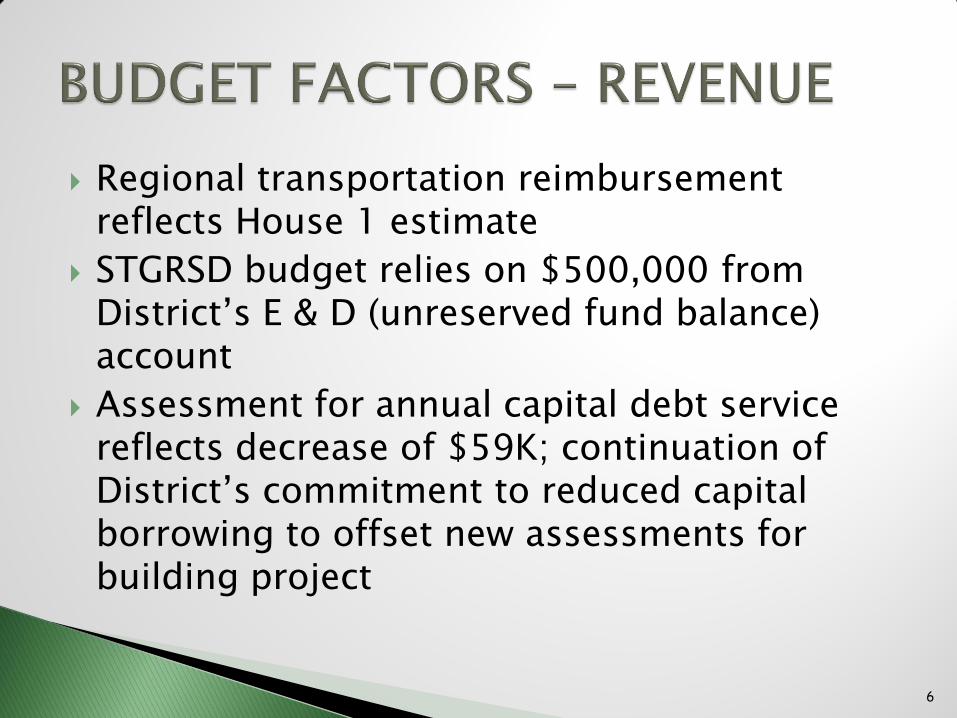
Regional transportation reimbursement reflects House 1 estimate
STGRSD budget relies on $500,000 from District’s E & D (unreserved fund balance) account
Assessment for annual capital debt service reflects decrease of $59K; continuation of District’s commitment to reduced capital borrowing to offset new assessments for building project
6
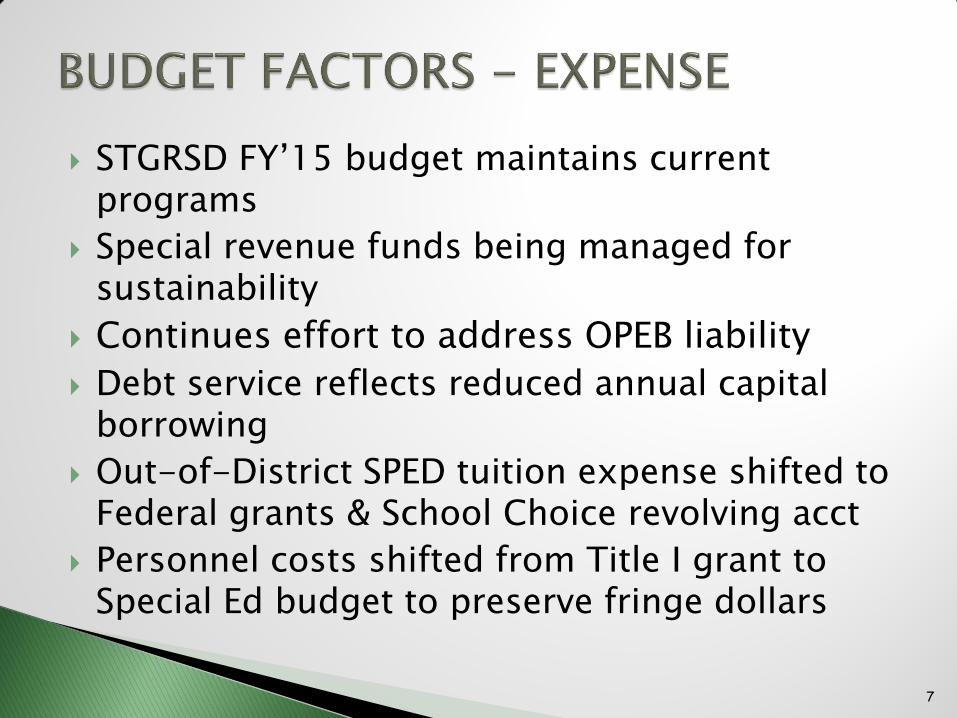
STGRSD FY’15 budget maintains current programs
Special revenue funds being managed for sustainability
Continues effort to address OPEB liability
Debt service reflects reduced annual capital borrowing
Out-of-District SPED tuition expense shifted to Federal grants & School Choice revolving acct
Personnel costs shifted from Title I grant to Special Ed budget to preserve fringe dollars
7
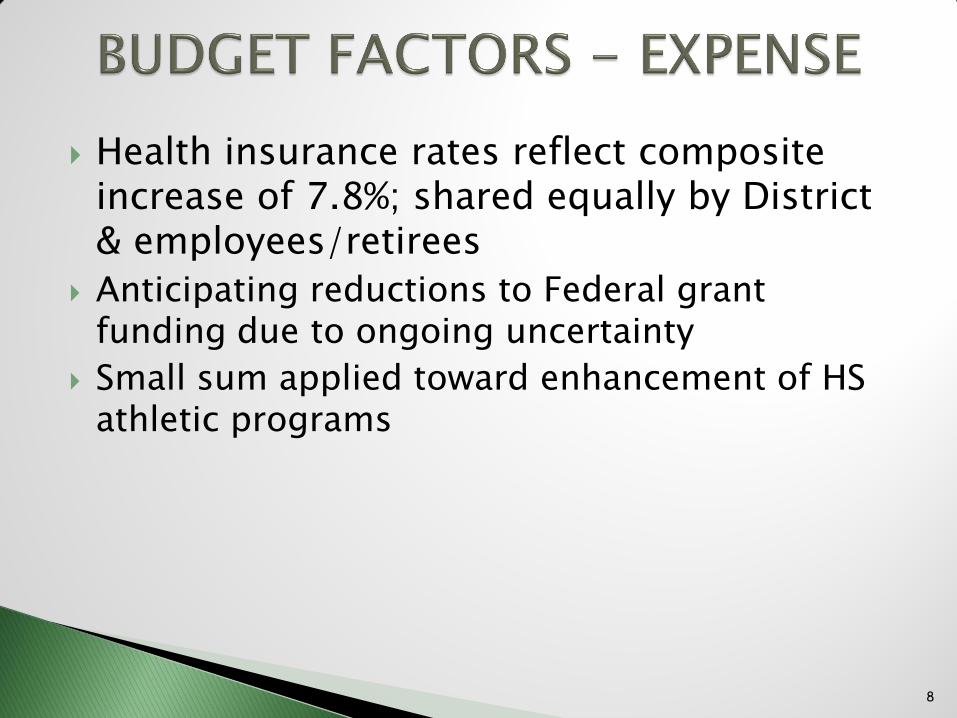
Health insurance rates reflect composite increase of 7.8%; shared equally by District & employees/retirees
Anticipating reductions to Federal grant funding due to ongoing uncertainty
Small sum applied toward enhancement of HS athletic programs
8

9
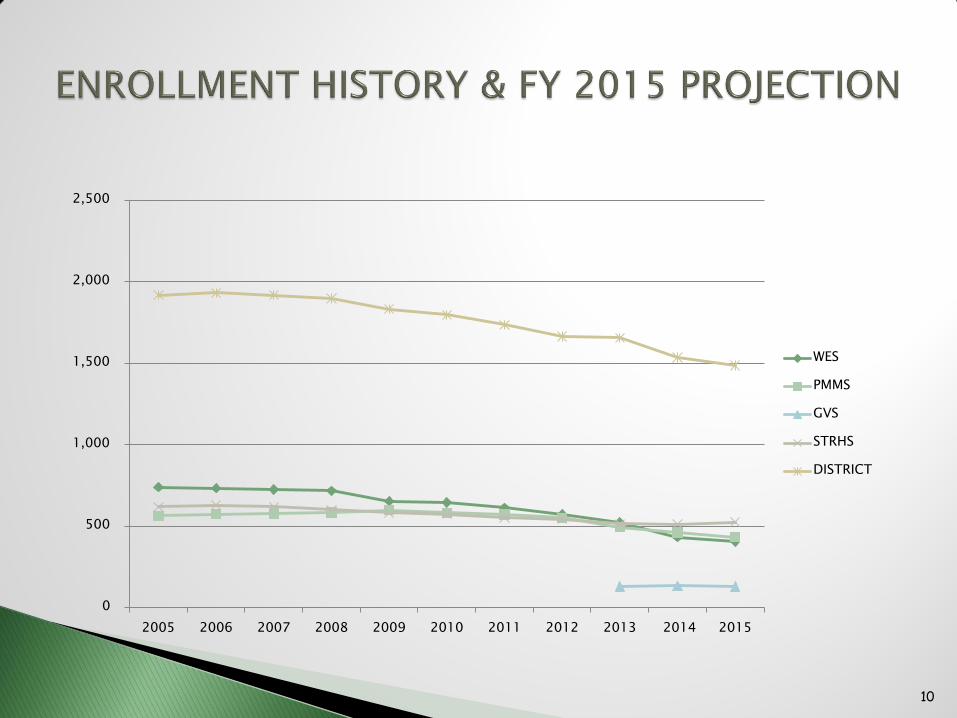
FISCAL YEAR WES GVS PMMS STRHS
DISTRICT
TOTAL CHANGE % CHANGE
2006 731 - 573 628 1,932 15 0.78%
2007 723 - 577 617 1,917 (15) -0.78%
2008 715 - 582 599 1,896 (21) -1.10%
2009 652 - 598 581 1,831 (65) -3.43%
2010 644 - 581 572 1,797 (34) -1.86%
2011 612 - 570 552 1,734 (63) -3.51%
2012 573 - 550 541 1,664 (70) -4.04%
2013 521 129 492 514 1,656 (8) -0.48%
2014 431 133 460 511 1,535 (121) -7.31%
2015 402 128 432 524 1,486 (49) -3.19%
10
0
500
1,000
1,500
2,000
2,500
2005 2006 2007 2008 2009 2010 2011 2012 2013 2014 2015
WES
PMMS
GVS
STRHS
DISTRICT

11
STRSD & STGRSD GRANVILLE SCHOOL DISTRICT
FISCAL
YEAR CHAP. 70
REG'L
TRANS.
REIMBURS. TOTAL
INCREASE/
(DECREASE)
% INCR./
(DECR.) CHAP. 70
INCREASE/
(DECREASE)
% INCR./
(DECR.)
2006 $7,241,643 $600,106 $7,841,749 $367,064 4.9% $1,194,161 $14,650 1.2%
2007 $7,812,889 $721,267 $8,534,156 $692,407 8.8% $1,307,669 $113,508 9.5%
2008 $8,037,753 $739,035 $8,776,788 $242,632 2.8% $1,331,035 $23,366 1.8%
2009 $8,380,674 $835,154 $9,215,828 $439,040 5.0% $1,344,685 $13,650 1.0%
2010 $8,213,061 $519,653 $8,732,714 -$483,114 -5.2% $1,317,791 ($26,894) -2.0%
2011 $8,140,267 $592,979 $8,733,246 $532 0.0% $1,324,266 $6,475 0.5%
2012 $8,183,967 $632,283 $8,816,250 $83,004 1.0% $1,247,466 ($76,800) -5.8%
2013 $9,514,423 $733,883 $10,248,306 $1,432,056 16.2%
2014 $9,555,823 $788,786 $10,344,609 $96,303 0.9%
2015 $9,588,623 $731,219 $10,319,842 -$24,767 -0.2%

12
SOUTHWICK-TOLLAND-GRANVILLE REGIONAL SCHOOL DISTRICT PROPOSED FY2015 BUDGET
February 28, 2014
APPROVED ADJUSTED PROPOSED DOLLAR PERCENTAGE BUDGET BUDGET BUDGET DIFFERENCE DIFFERENCE
REVENUES FY2014 FY2014 FY2015 Draft #2A FY15 vs. FY14 FY15 vs. FY14 Southwick Assessment $ 8,729,654 $ 8,729,654 $ 9,041,375 $ 311,721 3.57%
Southwick Assessment (School Bldg. Proj.) $ 1,009,390 $ 1,009,390 $ 1,005,875 $ (3,515) -0.35%
Tolland Assessment $ 415,329 $ 415,329 $ 427,039 $ 11,710 2.82%
Tolland Assessment (School Bldg. Proj.) $ 43,902 $ 43,902 $ 43,749 $ (153) -0.35%
Granville Assessment $ 1,552,744 $ 1,552,744 $ 1,582,958 $ 30,214 1.95%
Granville Assessment (School Bldg. Proj.) $ 152,814 $ 152,814 $ 152,282 $ (532) -0.35%
Medicaid Reimbursement $ 60,000 $ 60,000 $ 75,000 $ 15,000 25.00%
Reg'l Transportation Reimbursement $ 660,096 $ 660,096 $ 731,219 $ 71,123 10.77%
Stabilization Account $ - $ - $ - $ - 0.00%
Chapter 70 Education Aid $ 9,546,823 $ 9,546,823 $ 9,588,623 $ 41,800 0.44%
Restricted Surplus (E & D) $ 500,000 $ 500,000 $ 500,000 $ - 0.00%
Local Tuition $ 50,000 $ 50,000 $ 60,000 $ 10,000 20.00%
Fee Charges $ 30,000 $ 30,000 $ 20,000 $ (10,000) -33.33%
E-Rate Universal Service Funds $ 10,000 $ 10,000 $ 22,000 $ 12,000 120.00% TOTAL REVENUES $ 22,760,752 $ 22,760,752 $ 23,250,120 $ 489,368 2.15%
EXPENDITURES
General Administration $ 7,010,869 $ 7,010,869 $ 6,996,056 $ (14,813) -0.21%
Debt Service (Capital Improvement) $ 434,649 $ 434,649 $ 375,325 $ (59,324) -13.65%
Debt Service (School Building Project) $ 1,206,106 $ 1,206,106 $ 1,201,906 $ (4,200) -0.35%
Woodland Elementary School $ 2,741,670 $ 2,741,670 $ 2,855,519 $ 113,849 4.15%
Granville Village School $ 1,123,374 $ 1,123,374 $ 1,108,091 $ (15,283) -1.36%
Powder Mill Middle School $ 3,100,087 $ 3,100,087 $ 3,154,765 $ 54,678 1.76%
Regional High School $ 4,098,799 $ 4,098,799 $ 4,419,845 $ 321,046 7.83%
Special Education $ 3,045,198 $ 3,045,198 $ 3,246,661 $ 201,463 6.62% TOTAL EXPENDITURES $ 22,760,752 $ 22,760,752 $ 23,358,168 $ 597,416 2.62%
PROPOSED FY14 BUDGET $ 22,760,752 $ 22,760,752 $ 23,358,168 $ (108,048)
GRANTS $ 823,297 $ 823,297 $ 758,506 $ (64,791) CIRCUIT BREAKER $ 225,000 $ 225,000 $ 225,000 $ -
SCHOOL CHOICE $ 500,000 $ 500,000 $ 600,000 $ 100,000
13
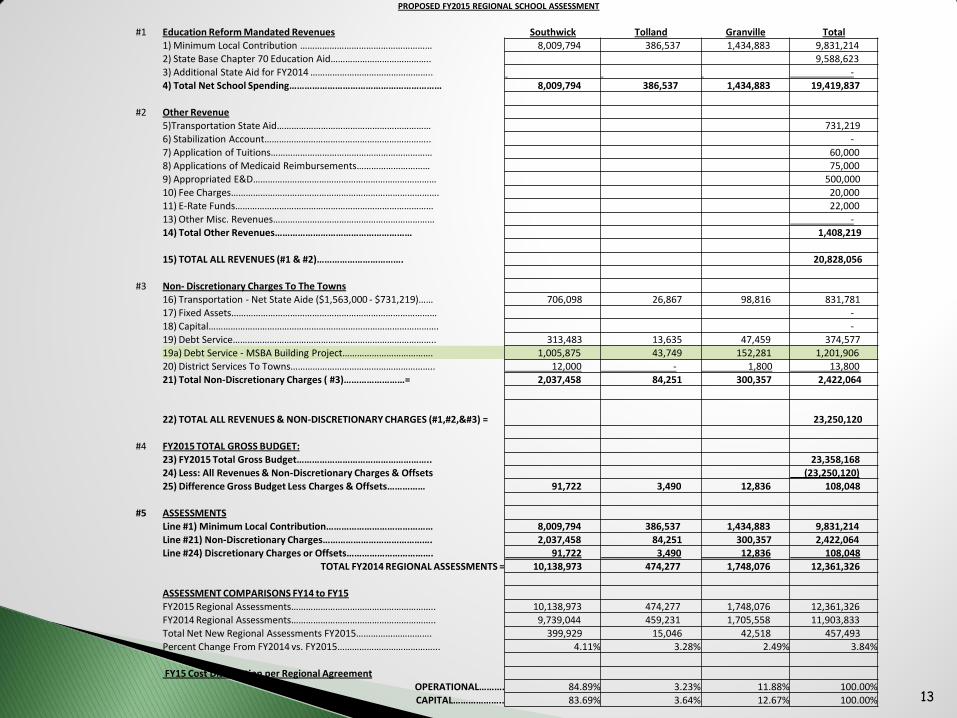
PROPOSED FY2015 REGIONAL SCHOOL ASSESSMENT
#1 Education Reform Mandated Revenues Southwick Tolland Granville Total
1) Minimum Local Contribution ……………………………………………… 8,009,794 386,537 1,434,883 9,831,214 2) State Base Chapter 70 Education Aid………………………………….. 9,588,623
3) Additional State Aid for FY2014 ………………………………………….. -
4) Total Net School Spending…………………………………………………… 8,009,794 386,537 1,434,883 19,419,837
#2 Other Revenue
5)Transportation State Aid……………………………………………………… 731,219 6) Stabilization Account………………………………………………………….. -
7) Application of Tuitions………………………………………………………… 60,000
8) Applications of Medicaid Reimbursements………………………… 75,000
9) Appropriated E&D………………………………………………………………… 500,000
10) Fee Charges…………………………………………………………………………. 20,000 11) E-Rate Funds……………………………………………………………………… 22,000
13) Other Misc. Revenues………………………………………………………… - 14) Total Other Revenues……………………………………………… 1,408,219
15) TOTAL ALL REVENUES (#1 & #2)……………………………. 20,828,056
#3 Non- Discretionary Charges To The Towns 16) Transportation - Net State Aide ($1,563,000 - $731,219)…… 706,098 26,867 98,816 831,781 17) Fixed Assets………………………………………………………………………… -
18) Capital…………………………………………………………………………………. -
19) Debt Service……………………………………………………………………….. 313,483 13,635 47,459 374,577 19a) Debt Service - MSBA Building Project………………………………. 1,005,875 43,749 152,281 1,201,906
20) District Services To Towns………………………………………………….. 12,000 - 1,800 13,800 21) Total Non-Discretionary Charges ( #3)……………………= 2,037,458 84,251 300,357 2,422,064
22) TOTAL ALL REVENUES & NON-DISCRETIONARY CHARGES (#1,#2,) = 23,250,120
#4 FY2015 TOTAL GROSS BUDGET:
23) FY2015 Total Gross Budget…………………………………………….. 23,358,168
24) Less: All Revenues & Non-Discretionary Charges & Offsets (23,250,120)
25) Difference Gross Budget Less Charges & Offsets…………… 91,722 3,490 12,836 108,048
#5 ASSESSMENTS Line #1) Minimum Local Contribution…………………………………… 8,009,794 386,537 1,434,883 9,831,214
Line #21) Non-Discretionary Charges……………………………………. 2,037,458 84,251 300,357 2,422,064 Line #24) Discretionary Charges or Offsets……………………………. 91,722 3,490 12,836 108,048
TOTAL FY2014 REGIONAL ASSESSMENTS = 10,138,973 474,277 1,748,076 12,361,326
ASSESSMENT COMPARISONS FY14 to FY15
FY2015 Regional Assessments………………………………………………….. 10,138,973 474,277 1,748,076 12,361,326
FY2014 Regional Assessments………………………………………………….. 9,739,044 459,231 1,705,558 11,903,833
Total Net New Regional Assessments FY2015…………………………. 399,929 15,046 42,518 457,493 Percent Change From FY2014 vs. FY2015…………………………………... 4.11% 3.28% 2.49% 3.84%
FY15 Cost Distribution per Regional Agreement
OPERATIONAL………. 84.89% 3.23% 11.88% 100.00%
CAPITAL……………….. 83.69% 3.64% 12.67% 100.00%

14
SOUTHWICK TOLLAND GRANVILLE
FISCAL YEAR ASSESSMENT $ INCREASE % INCREASE ASSESSMENT $ INCREASE % INCREASE ASSESSMENT $ INCREASE % INCREASE
2006 $6,451,499 $415,163 6.88% $244,236 $5,400 2.26%
2007 $6,966,429 $514,930 7.98% * $283,246 $39,010 15.97%
2008 $7,593,266 $626,837 9.00% $311,330 $28,084 9.92%
2009 $8,048,274 $455,008 5.99% * $336,691 $25,361 8.15%
2010 $8,120,196 $71,922 0.89% $348,619 $11,928 3.54%
2011 $8,109,414 -$10,782 -0.13% $359,401 $10,782 3.09%
2012 $8,215,316 $105,902 1.31% $383,014 $23,613 6.57%
2013 $8,420,696 $205,380 2.50% $388,757 $5,743 1.50% $1,505,814 - -
2014 $8,729,654 $308,958 3.67% $415,329 $26,572 6.84% $1,552,744 $46,930 3.12%
2015 $9,041,375 $311,721 3.57% $427,039 $11,710 2.82% $1,582,958 $30,214 1.95%
*Extra allocations beyond assessment from Town of
Southwick & Tolland
FY2007 for $50,000; FY2009 for
$150,000
15
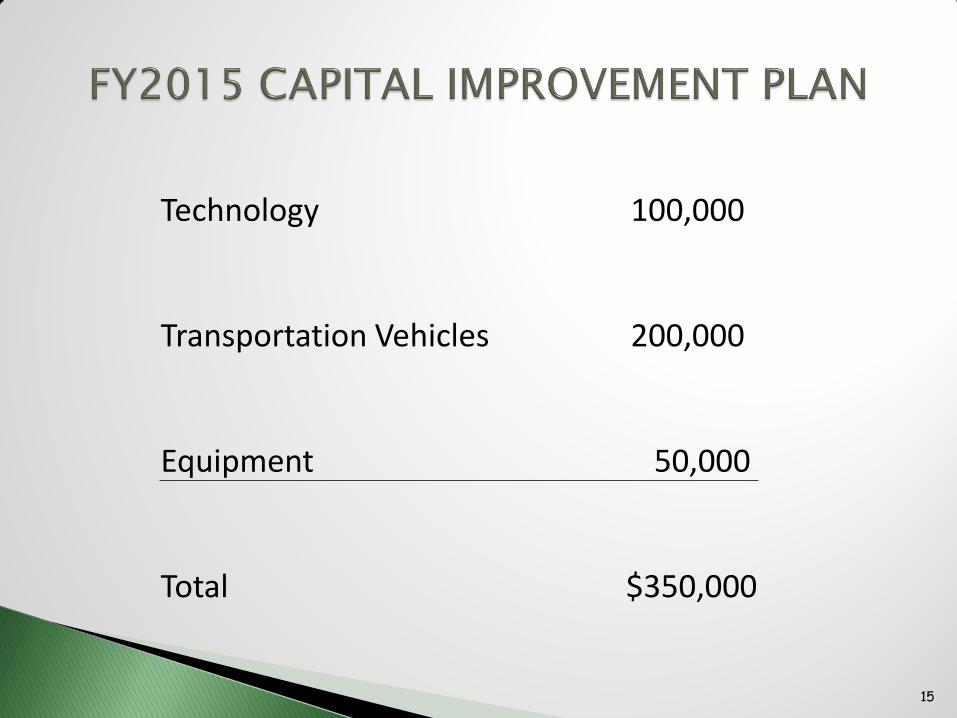
Technology 100,000
Transportation Vehicles 200,000
Equipment 50,000
Total $350,000

16
--------------------------------- Expenditures Per Pupil Within The District-----------------------------------------
----------
--expenditures per
pupil--
fte pupils fte pupils instruc-
classroom
& other profes- instructn'l guidance, operations insurance, total
at the tuitioned total admini- tional specialist teaching sional dev- materials, counseling pupil and retirement within the outside total expenditures
district district
out of
dist pupils stration leadership teachers services elopment
equip &
tech & testing services
maintenan
ce & other district the district expenditures per pupil
AGAWAM 4,070 133 4,203 485 633 4,708 1,163 116 547 443 1,156 922 2,100 12,273 32,560 54,273,406 12,913
AMHERST 1,196 90 1,286 787 1,153 6,804 2,621 631 496 469 1,084 1,379 3,941 19,365 15,022 24,504,767 19,062
BELCHERTOWN 2,476 134 2,610 429 830 4,135 953 144 326 369 1,245 982 1,661 11,073 18,406 29,877,383 11,449
CHICOPEE 7,565 286 7,851 524 1,084 5,129 1,055 341 225 237 1,439 1,064 1,937 13,036 17,345 103,576,736 13,193
EASTHAMPTON 1,601 320 1,921 538 698 4,719 823 49 220 515 1,044 943 1,816 11,365 14,107 22,702,168 11,821
EAST LONGMEADOW 2,724 91 2,815 486 615 5,308 1,258 203 249 440 985 804 1,538 11,887 40,212 36,028,781 12,799
GRANBY 1,002 71 1,073 544 649 4,928 906 43 166 829 1,549 785 1,313 11,709 19,171 13,096,588 12,206
GREENFIELD 2,095 498 2,594 553 1,119 4,290 1,001 22 939 114 1,136 1,164 2,455 12,793 11,715 32,643,845 12,586
HADLEY 671 129 801 691 702 4,615 579 148 427 180 1,388 957 1,478 11,166 11,486 8,982,120 11,218
HATFIELD 414 72 486 943 776 5,003 1,531 153 276 335 1,431 1,303 1,418 13,168 11,886 6,312,251 12,977
HOLYOKE 5,585 1,005 6,591 601 1,136 5,852 1,705 289 916 448 1,818 1,242 2,224 16,231 15,754 106,491,291 16,158
LONGMEADOW 2,851 70 2,921 546 805 5,301 1,167 270 340 486 805 1,109 1,520 12,348 68,782 39,997,728 13,695
LUDLOW 2,831 101 2,932 474 746 4,346 954 138 377 419 1,270 809 2,416 11,950 30,352 36,886,990 12,583
MONSON 1,244 62 1,306 439 976 4,198 1,352 213 205 534 1,471 802 1,624 11,813 22,896 16,109,663 12,337
NORTHAMPTON 2,723 303 3,026 492 767 4,322 1,351 166 411 474 862 955 2,249 12,049 16,759 37,883,915 12,521
PALMER 1,522 103 1,625 387 677 5,016 821 142 277 325 1,429 735 2,385 12,193 26,400 21,274,427 13,092
SOUTHAMPTON 553 39 592 395 622 4,621 857 136 265 219 715 571 1,305 9,708 17,310 6,048,788 10,212
SOUTH HADLEY 1,935 204 2,139 546 705 5,251 1,190 300 742 386 1,200 1,043 2,025 13,388 15,901 29,150,735 13,628
SPRINGFIELD 24,747 3,951 28,698 550 1,257 4,848 1,051 322 1,102 400 1,783 1,132 2,437 14,883 13,426 421,357,659 14,682
WARE 1,253 155 1,408 468 1,094 4,394 1,208 36 130 405 1,651 1,001 2,322 12,708 11,159 17,657,047 12,537
WESTFIELD 0
WESTHAMPTON 145 19 164 449 1,030 4,994 1,224 135 294 311 999 798 1,959 12,194 18,760 2,122,092 12,955
WEST SPRINGFIELD 3,892 145 4,037 296 709 4,658 1,158 245 320 567 1,404 820 1,587 11,764 43,170 52,040,118 12,890
AMHERST PELHAM 1,519 138 1,657 987 1,390 6,533 1,588 155 304 652 1,639 1,481 3,526 18,255 23,457 30,957,738 18,688
BERKSHIRE HILLS 1,364 111 1,475 820 1,364 5,782 1,022 116 213 452 1,964 1,278 3,358 16,370 12,845 23,752,485 16,106
CENTRAL BERKSHIRE 1,766 155 1,921 544 925 5,078 1,232 242 335 481 1,612 1,279 2,892 14,621 8,689 27,166,242 14,143
FRONTIER 619 79 698 544 1,008 6,058 1,353 280 517 720 1,637 1,385 2,973 16,476 19,214 11,718,605 16,786
GATEWAY 1,016 118 1,135 750 1,179 4,717 1,404 33 313 514 2,116 1,234 2,412 14,672 14,166 16,585,338 14,619
GILL MONTAGUE 1,045 249 1,293 626 1,118 4,864 1,392 369 738 542 1,671 1,463 3,265 16,048 9,227 19,058,529 14,736
HAMPDEN
WILBRAHAM 3,383 65 3,448 474 726 4,868 1,061 139 263 485 1,401 964 1,791 12,172 47,767 44,273,214 12,840
HAMPSHIRE 764 105 868 438 957 5,498 840 138 670 563 1,751 936 2,611 14,404 16,437 12,721,551 14,649
MOHAWK TRAIL 1,000 120 1,120 545 1,342 5,375 1,638 119 397 440 2,075 1,636 3,195 16,762 12,192 18,216,806 16,272
SOUTHWICK TOLLAND 1,744 118 1,863 345 894 4,908 857 207 233 507 1,270 747 1,291 11,259 23,432 22,408,669 12,032
TANTASQUA 1,762 46 1,808 346 625 5,786 751 173 398 527 1,241 1,265 1,530 12,642 3,259 22,427,248 12,403
17
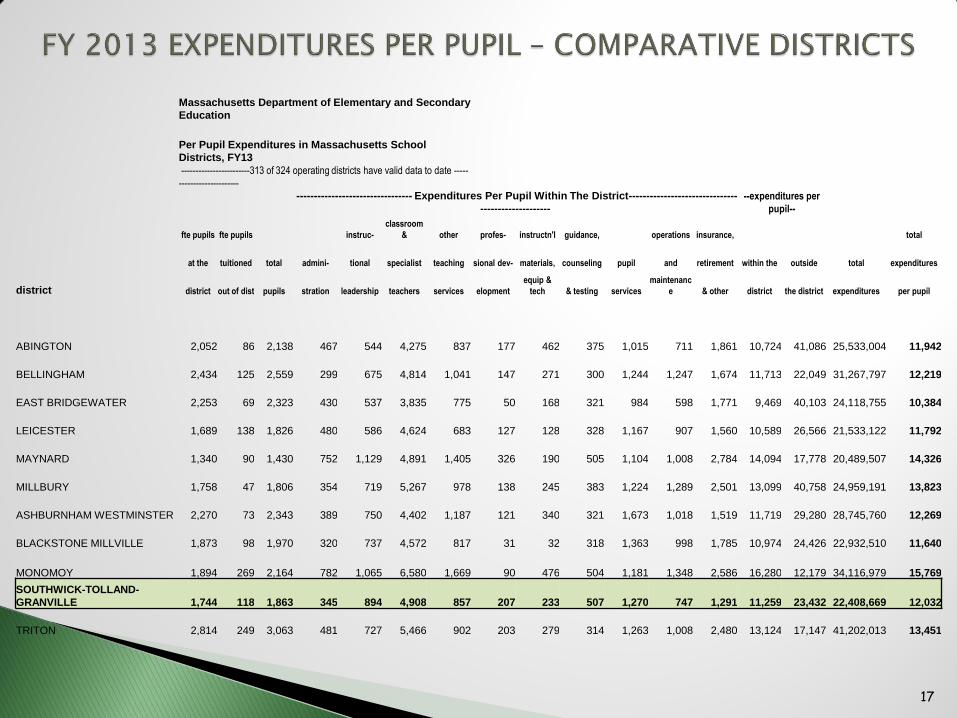
Massachusetts Department of Elementary and Secondary
Education
Per Pupil Expenditures in Massachusetts School
Districts, FY13
------------------------313 of 324 operating districts have valid data to date -----
---------------------
--------------------------------- Expenditures Per Pupil Within The District-------------------------------
--------------------
--expenditures per
pupil--
fte pupils fte pupils instruc-
classroom
& other profes- instructn'l guidance, operations insurance, total
at the tuitioned total admini- tional specialist teaching sional dev- materials, counseling pupil and retirement within the outside total expenditures
district district out of dist pupils stration leadership teachers services elopment
equip &
tech & testing services
maintenanc
e & other district the district expenditures per pupil
ABINGTON 2,052 86 2,138 467 544 4,275 837 177 462 375 1,015 711 1,861 10,724 41,086 25,533,004 11,942
BELLINGHAM 2,434 125 2,559 299 675 4,814 1,041 147 271 300 1,244 1,247 1,674 11,713 22,049 31,267,797 12,219
EAST BRIDGEWATER 2,253 69 2,323 430 537 3,835 775 50 168 321 984 598 1,771 9,469 40,103 24,118,755 10,384
LEICESTER 1,689 138 1,826 480 586 4,624 683 127 128 328 1,167 907 1,560 10,589 26,566 21,533,122 11,792
MAYNARD 1,340 90 1,430 752 1,129 4,891 1,405 326 190 505 1,104 1,008 2,784 14,094 17,778 20,489,507 14,326
MILLBURY 1,758 47 1,806 354 719 5,267 978 138 245 383 1,224 1,289 2,501 13,099 40,758 24,959,191 13,823
ASHBURNHAM WESTMINSTER 2,270 73 2,343 389 750 4,402 1,187 121 340 321 1,673 1,018 1,519 11,719 29,280 28,745,760 12,269
BLACKSTONE MILLVILLE 1,873 98 1,970 320 737 4,572 817 31 32 318 1,363 998 1,785 10,974 24,426 22,932,510 11,640
MONOMOY 1,894 269 2,164 782 1,065 6,580 1,669 90 476 504 1,181 1,348 2,586 16,280 12,179 34,116,979 15,769
SOUTHWICK-TOLLAND-
GRANVILLE 1,744 118 1,863 345 894 4,908 857 207 233 507 1,270 747 1,291 11,259 23,432 22,408,669 12,032
TRITON 2,814 249 3,063 481 727 5,466 902 203 279 314 1,263 1,008 2,480 13,124 17,147 41,202,013 13,451
18
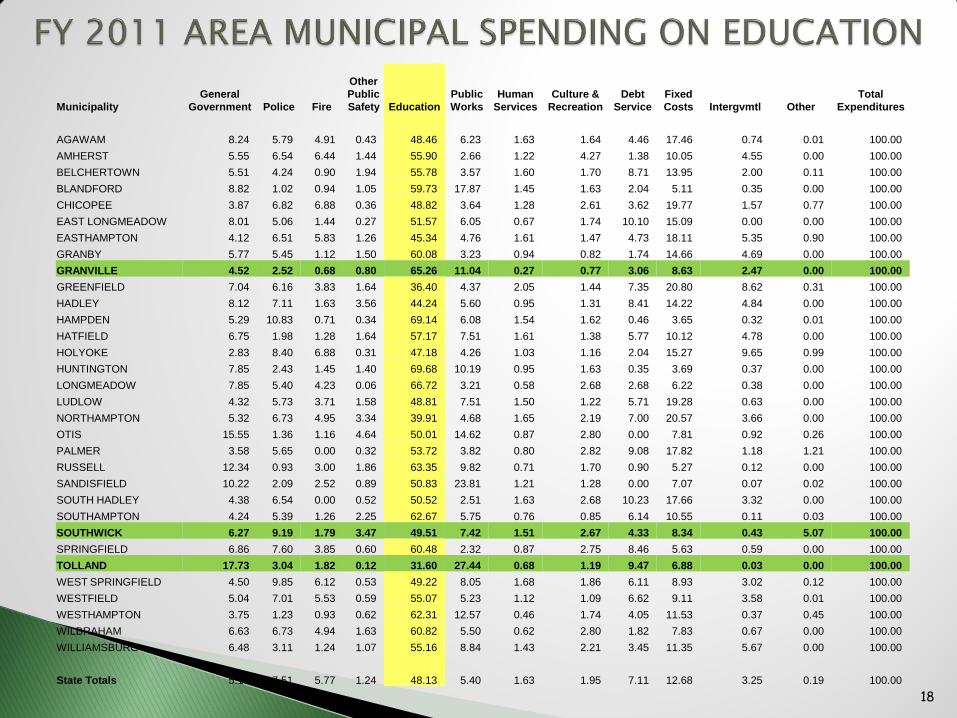
Municipality
General
Government Police Fire
Other
Public
Safety Education
Public
Works
Human
Services
Culture &
Recreation
Debt
Service
Fixed
Costs Intergvmtl Other
Total
Expenditures
AGAWAM 8.24 5.79 4.91 0.43 48.46 6.23 1.63 1.64 4.46 17.46 0.74 0.01 100.00
AMHERST 5.55 6.54 6.44 1.44 55.90 2.66 1.22 4.27 1.38 10.05 4.55 0.00 100.00
BELCHERTOWN 5.51 4.24 0.90 1.94 55.78 3.57 1.60 1.70 8.71 13.95 2.00 0.11 100.00
BLANDFORD 8.82 1.02 0.94 1.05 59.73 17.87 1.45 1.63 2.04 5.11 0.35 0.00 100.00
CHICOPEE 3.87 6.82 6.88 0.36 48.82 3.64 1.28 2.61 3.62 19.77 1.57 0.77 100.00
EAST LONGMEADOW 8.01 5.06 1.44 0.27 51.57 6.05 0.67 1.74 10.10 15.09 0.00 0.00 100.00
EASTHAMPTON 4.12 6.51 5.83 1.26 45.34 4.76 1.61 1.47 4.73 18.11 5.35 0.90 100.00
GRANBY 5.77 5.45 1.12 1.50 60.08 3.23 0.94 0.82 1.74 14.66 4.69 0.00 100.00
GRANVILLE 4.52 2.52 0.68 0.80 65.26 11.04 0.27 0.77 3.06 8.63 2.47 0.00 100.00
GREENFIELD 7.04 6.16 3.83 1.64 36.40 4.37 2.05 1.44 7.35 20.80 8.62 0.31 100.00
HADLEY 8.12 7.11 1.63 3.56 44.24 5.60 0.95 1.31 8.41 14.22 4.84 0.00 100.00
HAMPDEN 5.29 10.83 0.71 0.34 69.14 6.08 1.54 1.62 0.46 3.65 0.32 0.01 100.00
HATFIELD 6.75 1.98 1.28 1.64 57.17 7.51 1.61 1.38 5.77 10.12 4.78 0.00 100.00
HOLYOKE 2.83 8.40 6.88 0.31 47.18 4.26 1.03 1.16 2.04 15.27 9.65 0.99 100.00
HUNTINGTON 7.85 2.43 1.45 1.40 69.68 10.19 0.95 1.63 0.35 3.69 0.37 0.00 100.00
LONGMEADOW 7.85 5.40 4.23 0.06 66.72 3.21 0.58 2.68 2.68 6.22 0.38 0.00 100.00
LUDLOW 4.32 5.73 3.71 1.58 48.81 7.51 1.50 1.22 5.71 19.28 0.63 0.00 100.00
NORTHAMPTON 5.32 6.73 4.95 3.34 39.91 4.68 1.65 2.19 7.00 20.57 3.66 0.00 100.00
OTIS 15.55 1.36 1.16 4.64 50.01 14.62 0.87 2.80 0.00 7.81 0.92 0.26 100.00
PALMER 3.58 5.65 0.00 0.32 53.72 3.82 0.80 2.82 9.08 17.82 1.18 1.21 100.00
RUSSELL 12.34 0.93 3.00 1.86 63.35 9.82 0.71 1.70 0.90 5.27 0.12 0.00 100.00
SANDISFIELD 10.22 2.09 2.52 0.89 50.83 23.81 1.21 1.28 0.00 7.07 0.07 0.02 100.00
SOUTH HADLEY 4.38 6.54 0.00 0.52 50.52 2.51 1.63 2.68 10.23 17.66 3.32 0.00 100.00
SOUTHAMPTON 4.24 5.39 1.26 2.25 62.67 5.75 0.76 0.85 6.14 10.55 0.11 0.03 100.00
SOUTHWICK 6.27 9.19 1.79 3.47 49.51 7.42 1.51 2.67 4.33 8.34 0.43 5.07 100.00
SPRINGFIELD 6.86 7.60 3.85 0.60 60.48 2.32 0.87 2.75 8.46 5.63 0.59 0.00 100.00
TOLLAND 17.73 3.04 1.82 0.12 31.60 27.44 0.68 1.19 9.47 6.88 0.03 0.00 100.00
WEST SPRINGFIELD 4.50 9.85 6.12 0.53 49.22 8.05 1.68 1.86 6.11 8.93 3.02 0.12 100.00
WESTFIELD 5.04 7.01 5.53 0.59 55.07 5.23 1.12 1.09 6.62 9.11 3.58 0.01 100.00
WESTHAMPTON 3.75 1.23 0.93 0.62 62.31 12.57 0.46 1.74 4.05 11.53 0.37 0.45 100.00
WILBRAHAM 6.63 6.73 4.94 1.63 60.82 5.50 0.62 2.80 1.82 7.83 0.67 0.00 100.00
WILLIAMSBURG 6.48 3.11 1.24 1.07 55.16 8.84 1.43 2.21 3.45 11.35 5.67 0.00 100.00
State Totals 5.15 7.51 5.77 1.24 48.13 5.40 1.63 1.95 7.11 12.68 3.25 0.19 100.00
Slight reduction in school building project debt service
May 2013 bond proceeds to fund project expenses thru fall 2014
Plan to use temporary financing for project cash flow needs thru completion
Final project costs will determine size of remaining bond issue
19

20
SOUTHWICK -TOLLAND-GRANVILLE
REGIONAL SCHOOL DISTRICT
THANK YOU FOR YOUR SUPPORT