MARCH 2014 RESULTS PRESENTATION Madrid, 2014
21
MARCH 2014 RESULTS PRESENTATION Madrid, 2014
-
Upload
acton-camacho -
Category
Documents
-
view
19 -
download
1
description
MARCH 2014 RESULTS PRESENTATION Madrid, 2014. Disclaimer. - PowerPoint PPT Presentation
Transcript of MARCH 2014 RESULTS PRESENTATION Madrid, 2014

MARCH 2014 RESULTS PRESENTATIONMadrid, 2014
2
Disclaimer
In addition to figures prepared in accordance with IFRS, PRISA presents non-GAAP financial performance measures, e.g., EBITDA, EBITDA margin, adjusted EBITDA, adjusted EBITDA margin, adjusted EBIT, adjusted net profit, free cash flow, gross debt and net debt, among others. These non-GAAP measures should be considered in addition to, but not as a substitute for, the information prepared in accordance with IFRS. Non-GAAP financial performance measures are not subject to IFRS or any other generally accepted accounting principles. For further information relevant to the interpretation of these terms, please refer to the “Reconciliation Section” of the 1Q 2014 earnings press release filed with the Securities and Exchange Commission and posted on prisa.com.
This document may contain “forward-looking statements” as defined in Section 27A of the Securities Act and Section 21E of the Exchange Act, including statements about the financial conditions, results of operations, earnings outlook and prospects of the Company. In addition, any statements that refer to projections, forecasts or other characterizations of future events or circumstances, including any underlying assumptions, are forward-looking statements.
Forward-looking statements are based on management’s current expectations and are inherently subject to uncertainties and changes in circumstance and their potential effects and each speaks only as of the date of such statement. There can be no assurance that future developments will be those that have been anticipated.
These forward-looking statements are typically identified by words such as “plan,” “believe,” “expect,” “anticipate,” “intend,” “outlook,” “estimate,” “forecast,” “project,” “continue,” “could,” “may,” “might,” “possible,” “potential,” “predict,” “should,” “would” and other similar words and expressions, but the absence of these words does not mean that a statement is not forward-looking. These forward-looking statements involve a number of risks, uncertainties or other assumptions that may cause actual results or performance to be materially different from those expressed or implied by these forward-looking statements. These risks and uncertainties include, but are not limited to, those factors described in our filings with the Securities and Exchange Commission under “Risk Factors”.

3
Executive summary
Improving macro environment in Spain & Portugal…1
… Although still fragile recovery in advertising investment2
PRISA maintains the leadership position in all businesses where it is present3 Press: #1 generalist press Radio: #1 music & generalist in Spain, Colombia & Chile Education: #1 Spain, Brazil, Mexico, Argentina Chile, Colombia FTA TV Portugal: #1 audience in 24hrs and prime time Pay TV Spain: #1 in 2013 and 1Q 2014 (number of subscribers)
Strong cost & capex control efforts undertaken6
Solid, strong performance in Latam activities in constant currency, but negative FX impact4
Group digital development continues to grow5
Group focussed on executing debt reduction plan7
Improving macro conditions since 2013 Improvement expected to continue in 2014-2015
Quarterly improvement in Spanish & Portuguese advertising sectors Advertising Group revenues fall by 6.7% in Spain & grow by 3.1% in Portugal in 1Q 2014
Adjusted revenues at constant currency grow by +3.1%
Digital ad revenues grow by 6.9%: in Press they reach 29% of total division ad revenues Unique browsers to PRISA sites grow by 16.6% Digital education systems continue to grow in Brazil, Mexico & Colombia
Sale of General Publishing business has been agreed Sale of 3.69% stake in Mediaset España undertaken in April 2014. Debt buyback action in progress Acceptance of the offer received from Telefónica for the purchase of PRISA’s 56% stake in Canal+
All costs reduced except for football rights
4
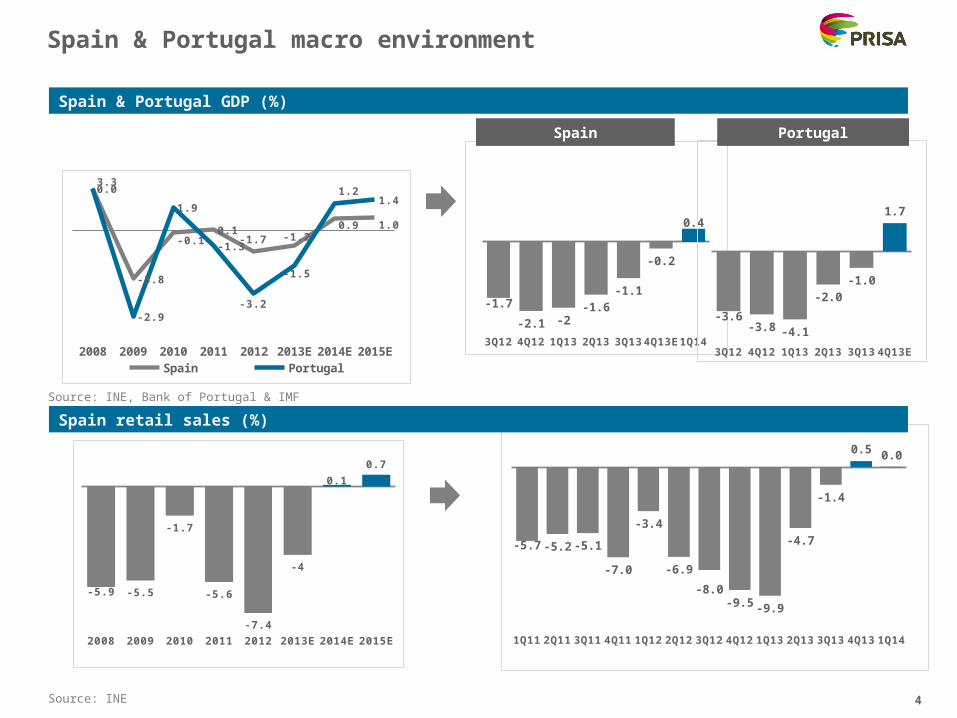
Spain & Portugal macro environment
3Q12 4Q12 1Q13 2Q13 3Q13 4Q13E 1Q14
-1.7
-2.1 -2-1.6
-1.1
-0.2
0.4
3Q12 4Q12 1Q13 2Q13 3Q13 4Q13E
-3.6-3.8 -4.1
-2.0-1.0
1.7
Spain Portugal
2008 2009 2010 2011 2012 2013E 2014E 2015E
-5.9 -5.5
-1.7
-5.6
-7.4
-4
0.1
0.7
2008 2009 2010 2011 2012 2013E 2014E 2015E
3.3
-3.8
-0.10.1
-1.7 -1.20.9 1.0
0.0
-2.9
1.9
-1.3
-3.2
-1.5
1.21.4
Spain Portugal
Source: INE
1Q11 2Q11 3Q11 4Q11 1Q12 2Q12 3Q12 4Q12 1Q13 2Q13 3Q13 4Q13 1Q14
-5.7 -5.2 -5.1
-7.0
-3.4
-6.9
-8.0-9.5 -9.9
-4.7
-1.4
0.5 0.0
Spain & Portugal GDP (%)
Spain retail sales (%)
Source: INE, Bank of Portugal & IMF

5
Iberia advertising market
1Q 2Q 3Q 4Q 1Q 2Q 3Q 4Q 1Q 2Q 3Q 4Q 1Q
-0.6
-9 -8.4 -9.2
-15.1 -16.2 -16.9
-23.1
-16.8
-13
-3 -1.7 -1.3
Source: i2p, March, 2014
Spain advertising market growth (%)
2005 2006 2007 2008 2009 2010 2011 2012 2013 2014E
8.8
6.2 5.4
-11.4
-21.9
2.3
-7
-18
-10.1
1.7
2011 2012 2013 2014
Sunday paper
Magazines
Press
Radio
Outdoor
Cinema
Television
Internet
-23.8
-18.7
-14.8
-10.6
-11.5
-10.3
-7.5
-2.5
-8.1
-7.3
-2.6
1
2.2
20.7
4
4.8
2014E
2013
Evolution of advertising investment in Spain per sector (%)
Source: i2p, March, 2014

6
Latin America macro & FX environment
Jan-13 Mar-13 May-13 Jul-13 Sep-13 Nov-13 Jan-14 Mar-1490
95
100
105
110
115
120
Brazil Mexico Colombia Chile
Source: World Bank, IMF
2007 2008 2009 2010 2011 2012 2013 2014 2015-6%
-4%
-2%
0%
2%
4%
6%
8%
Brazil Mexico Colombia Chile
* All Group and business unit figures are Adjusted (exclude non-recurring items, detailed in the press release)Source: Bloomberg
Latam GDP growth (%)
Latam FX evolution
Brazil Mexico Colombia Chile
Q1 2013 1,51 9,58 1.358,01 357,95
Q2 2013 1,58 9,55 1.425,55 371,18
Q3 2013 1,73 9,75 1.440,29 382,70
Q4 2013 1,67 9,57 1.405,41 379,55
Q1 2014 1,72 9,66 1.463,12 402,54
1Q14/1Q13 -14,0% -0,8% -7,7% -12,5%
7
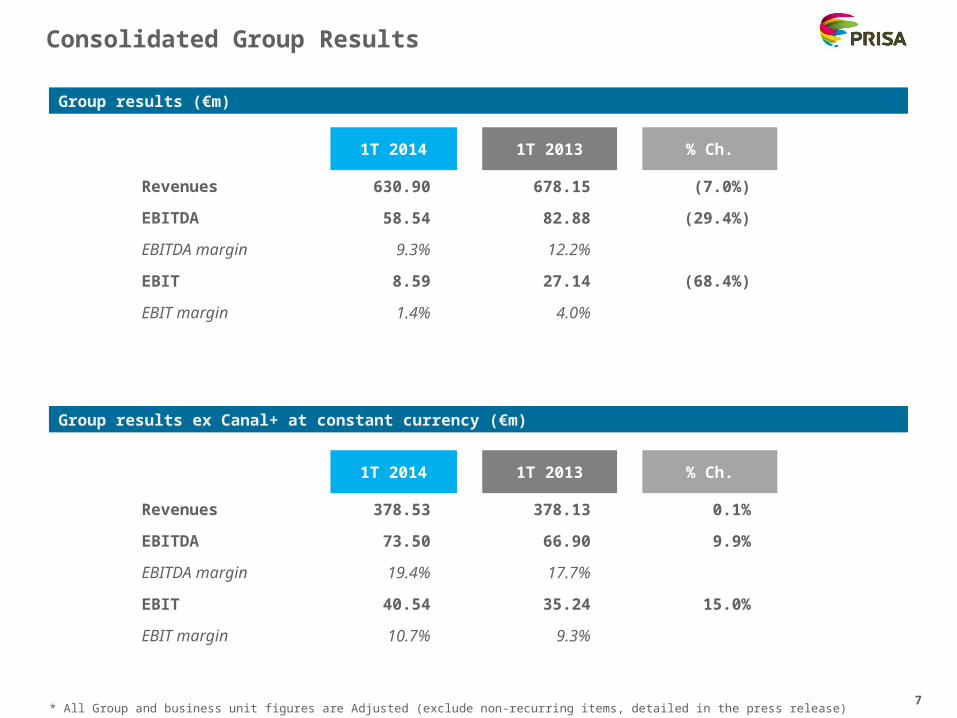
Consolidated Group Results
* All Group and business unit figures are Adjusted (exclude non-recurring items, detailed in the press release)
1T 2014 1T 2013 % Ch.
Revenues 630.90 678.15 (7.0%)
EBITDA 58.54 82.88 (29.4%)
EBITDA margin 9.3% 12.2%
EBIT 8.59 27.14 (68.4%)
EBIT margin 1.4% 4.0%
Group results (€m)
Group results ex Canal+ at constant currency (€m)
1T 2014 1T 2013 % Ch.
Revenues 378.53 378.13 0.1%
EBITDA 73.50 66.90 9.9%
EBITDA margin 19.4% 17.7%
EBIT 40.54 35.24 15.0%
EBIT margin 10.7% 9.3%
* All Group and business unit figures are Adjusted (exclude non-recurring items, detailed in the press release)

8
Consolidated Group Results – Canal+ & FX impact
90
Revenues
Opex 281
339
Ex Canal+
311
378
305
379
Ex Canal+, local currency
311
378
% Ch
(1.9%)
0.1%
% Ch
(9.7%)
(10.4%)
572
631
Group adjusted
595
678
1Q14 1Q13 % Ch
(3.8%)
(7.0%)
EBITDA 58 67 74 67 9.9%(13.4%)59 83 (29.4%)
Spain 105 113 105 113 (6.6%)(6.6%)397 413 (3.8%)
International 234 265 274 265 3.1%12.0%234 265 (12,0%)
Spain 123 136 123 136 (9.6%)(9.6%)414 420 (1,4%)
International 158 175 182 175 4.0%9.8 %158 175 (9.8%)
Spain (18) (23) (18) (23) 23.9%23.9%(17) (7) (134%)
International 76 90 91 90 1.3%(16.1%)76 (16.1%)
(€m) 1Q14 1Q13 1Q14 1Q13

9
(40)(8) (4)
(5) (2)
15 3 3
Revenue Evolution
34.5% 13.3% 4.4% 9.2% 0.9% 32.1% 5.1% 7.0%
33.3% 12.9% 4.8% 8.8% 0.8% 29.1% 4.3% 6.1%1Q 2013*
1Q 2014*
+7%
631
+9%
678
(*) As % of total revenues
-3% +10%-4% -15%n.a. -4% +3%
** Constant Currency
Group results (€m)

10
Expenses 1Q 2013
Purchases Staff Costs External Services &
Other
Football Expenses 1Q 2014
595
572
(15)
(11)
(9.2)
13
(35)
Focus on efficiency & cost control
-13% -8.3% -5.0% +7.5%
1Q 2013 1Q 2014
81 73
4946
Spain International
130 119
-8.3%
-6.5%
-9.5%
Opex reduction
Staff costs (€m)
-3.9%
11
1Q 13 1Q 14 1Q 14 (ex-FX)
62
46
60
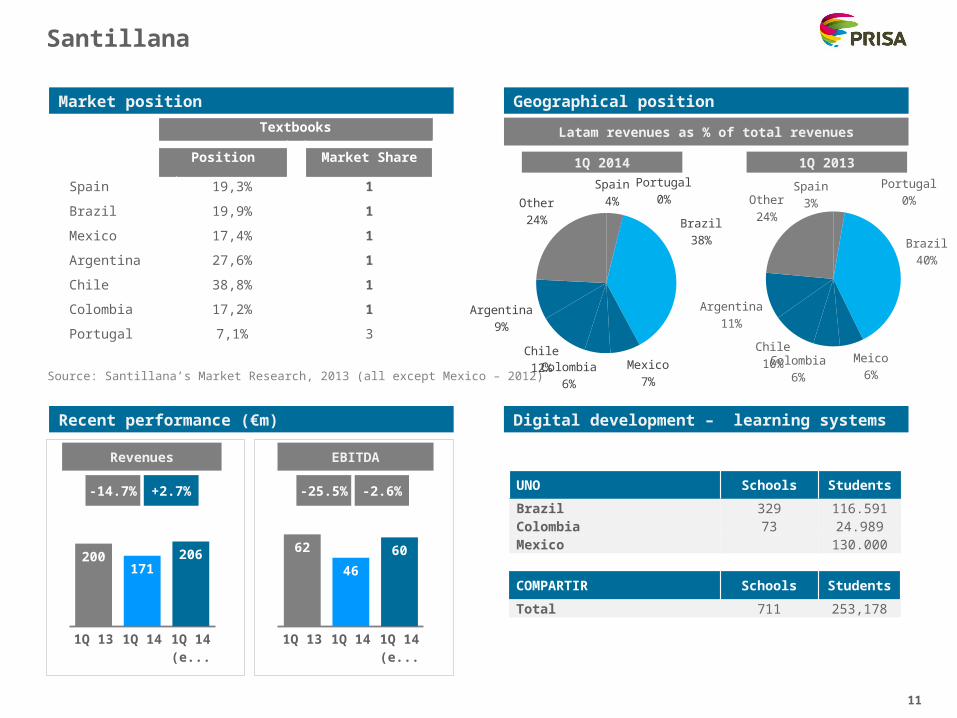
Santillana
Source: Santillana’s Market Research, 2013 (all except Mexico – 2012)
1Q 13 1Q 14 1Q 14 (ex-FX)
200171
206
EBITDARevenues
Latam revenues as % of total revenues
1Q 2014 1Q 2013
Textbooks
Position Market Share
Spain 19,3% 1
Brazil 19,9% 1
Mexico 17,4% 1
Argentina 27,6% 1
Chile 38,8% 1
Colombia 17,2% 1
Portugal 7,1% 3
Recent performance (€m) Digital development – learning systems
Market position Geographical position
COMPARTIR Schools Students
Total 711 253,178
UNO Schools Students
Brazil 329 116.591Colombia 73 24.989Mexico 130.000
-14.7% +2.7% -25.5% -2.6%
Spain4%
Portugal0%
Brazil38%
Mexico7%
Colombia6%
Chile12%
Argentina9%
Other24%
Spain3%
Portugal0%
Brazil40%
Meico6%
Colombia6%
Chile10%
Argentina11%
Other24%
12
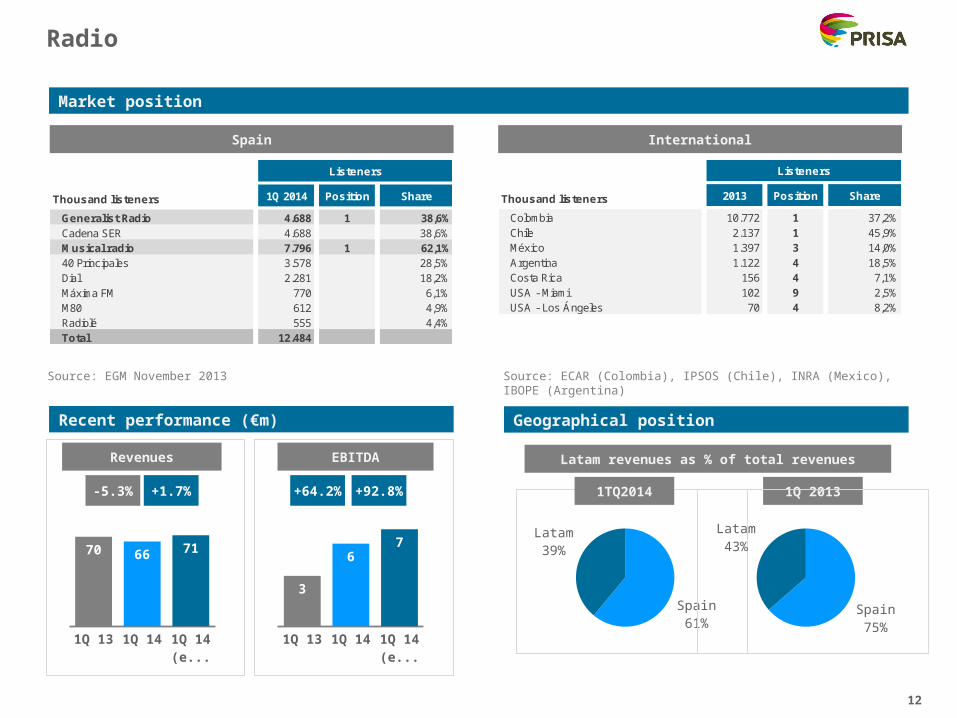
Radio
Source: EGM November 2013
1Q 2013
Latam revenues as % of total revenues
Spain61%
Latam39%
1TQ2014
Spain75%
Latam43%
Recent performance (€m)
Market position
Geographical position
1Q 13 1Q 14 1Q 14 (ex-FX)
3
67
1Q 13 1Q 14 1Q 14 (ex-FX)
70 66 71
EBITDARevenues
-5.3% +1.7% +64.2% +92.8%
Spain International
Listeners Oyentes
Thousand listeners 2013 Position Share
Colombia 10.772 1 37,2%Chile 2.137 1 45,9%México 1.397 3 14,0%Argentina 1.122 4 18,5%Costa Rica 156 4 7,1%USA - Miami 102 9 2,5%USA - Los Ángeles 70 4 8,2%
Source: ECAR (Colombia), IPSOS (Chile), INRA (Mexico), IBOPE (Argentina)
Listeners
Thousand listeners 1Q 2014 Position Share
Generalist Radio 4.688 1 38,6%Cadena SER 4.688 38,6%Musical radio 7.796 1 62,1%40 Principales 3.578 28,5%Dial 2.281 18,2%Máxima FM 770 6,1%M80 612 4,9%Radiolé 555 4,4%Total 12.484

13
Radio (Digital development)
Online audience evolution
Online radio listening hours (million hours)
1Q 13 1Q 14
7.4 7.9
Spain
+6.6%
Mar 13 Apr 13 May 13 Jun 13 Jul 13 Aug 13 Sep 13 Oct 13 Nov 13 Dec 13 Jan 14 Feb 14 Mar 14
13 13 14 14 14 13 14 16 16 14 16 16 18
25 28 28 26 28 27 2629 28 27
29 2630
Spain International
1Q 13 1Q 14
7.69.6
International
+26.4%

14
Press
Source: OJD March 2014
-2.0%
EBITDARevenues
-13.7%
2010 2011 2012 2013 1Q 14
10.313.4
19.9
25.528.9
Market position
Digital advertising / total advertising (%)
Digital development
Recent Performance (€m)
PRISA ABC El Mundo
7.1%6.8%
1.3%
Digital advertising (% growth)
Source: AEDE March 2014
1Q 13 1Q 14
3.22.8
1Q 13 1Q 14
67 65
El País31%
Mundo17%
ABC15%
Razón10%
Vanguardia16%
Periódico10%

15
Media Capital
Source: Gfk. Audience share for 1Q 2014
+1.5%
EBITDARevenues
TVI24.3%
RTP115.4%
RTP22.0%SIC
19.7%
Rest38.5%
24 hours Prime time
+42.5%
Recent performance (€m)
Market position
1Q 13 1Q 14
4
6
1Q 13 1Q 14
39 40
Advertising revenues evolution (%)
TVI26.9%
RTP114.1%
RTP21.7%
SIC24.3%
Rest32.9%
1Q13 2Q13 3Q13 4Q13E 1Q14
-11.6
-19.0
-0.4
3.2 5.3
Media Capital advertising

16
Canal+
Source: internal estimates (1Q 2014)
EBITDARevenues
-96.1%
Subscribers
Canal+43%
Ono21%
Imagenio19%
GolTV6%
Rest11%
Recent performance Digital development – YOMVI users
-2.7%
Market position Key Performance Indicators
1Q 2014
Dec 2013
Satellite subscribers (‘000s) 1.632 1,621
Average ARPU (€) 43.5 42.7
Churn 16.5% 18.0%
iPlus (subscribers) 649,214 630,005
iPlus (penetration) 40% 39%
Yomvi (‘000s users DTH) 541 470
Yomvi (penetration) 33.2% 29%
Yomvi (downloads) 4.4m 4.6m
Mar Apr May Jun Jul Aug Sep Oct Nov Dec Jan Feb Mar
346 347 329278 257
339
414444 452 470
517 512541
14 16 15 14 22 18 22 28 29 28 32 32 37
Satellite OTT
2013 2014
1Q 13 1Q 14
16
11Q 13 1Q 14
300 292

17
Cash Flow generation & adjusted net debt position
* All Group and business unit figures are Adjusted (exclude non-recurring items, detailed in the press release)
Grupo Prisa Net Debt (€m)
€6m Cash interest
€19m PIK Interest
€8m Accrued unpaid interest
€5m DLJ preferred dividend
€10m Taxes paid
€9m Redundancy expenses
€16m FX impact
€12m Change in consolidation perimeter

18
Cash generation at Holdco level- 1Q 2014
* All Group and business unit figures are Adjusted (exclude non-recurring items, detailed in the press release)
Cash generation at Holdco level 1Q 14 (€m)
€9m Redundancies
€2m Perimeter effect
19
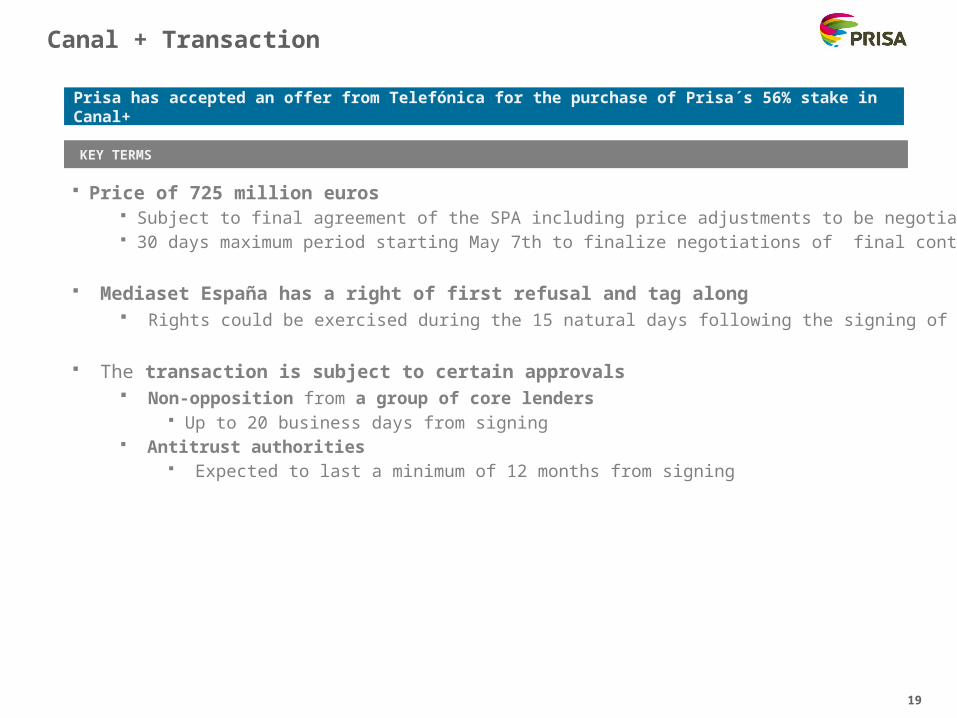
Canal + Transaction
Prisa has accepted an offer from Telefónica for the purchase of Prisa´s 56% stake in Canal+
Price of 725 million euros Subject to final agreement of the SPA including price adjustments to be negotiated 30 days maximum period starting May 7th to finalize negotiations of final contract
Mediaset España has a right of first refusal and tag along Rights could be exercised during the 15 natural days following the signing of the contract
The transaction is subject to certain approvals Non-opposition from a group of core lenders
Up to 20 business days from signing Antitrust authorities
Expected to last a minimum of 12 months from signing
KEY TERMS
20
Conclusions
1. Focus on operating improvement and growth
2. PRISA to benefit if macro recovery in Spain and Portugal consolidates
3. Latam to maintain its positive trend, but FX remains volatile
4. Digital learning Systems transforming the education business and contributing to growth
5. Continued effort in cost control with strong operating leverage
6. Execution of debt reduction plan

THANK YOU.