Manufacturing and the data conundrum
29
Commissioned by Manufacturing and the data conundrum Too much? Too little? Or just right? A report by The Economist Intelligence Unit
-
Upload
the-economist-group -
Category
Data & Analytics
-
view
261 -
download
0
Transcript of Manufacturing and the data conundrum

Commissioned by
Manufacturing and the data conundrum Too much? Too little? Or just right?A report by The Economist Intelligence Unit

1© The Economist Intelligence Unit Limited 2014
Manufacturing and the data conundrum: Too much? Too little? Or just right?
Contents
I. Executive summary 2
II. Ready or not, here it comes 4
III. Quality first 7 Case study: Meritor: Towards data-driven production perfection 9
IV. Where theory meets reality 10 Case study: ABB/Sandvik: Reducing deviations, eliminating imperfections 12
V. From monitoring to alerting, predicting and solving 13
VI. The plentiful returns of data success 15 Case study: GE’s factory built to produce data 17
VII. Conclusion 18
Appendix: Survey results 20

2 © The Economist Intelligence Unit Limited 2014
Manufacturing and the data conundrum: Too much? Too little? Or just right?
About the research
This Economist Intelligence Unit study, commissioned by Wipro, examines how manufacturers now collect, analyse and use the complex, real-time data generated in production processes. By far the most important finding is the increased understanding of how to use process data to improve product quality, but manufacturers are also realising gains in reliability, throughput and maintenance practices by tuning into what their production processes are telling them.
This report, a follow-up to our 2013 omnibus report on data usage, The data directive: How data is driving corporate strategy—and what still lies ahead, is based in part on a survey of 50 C-suite and senior factory executives from North America (50%) and Europe (50%) from companies that produce a broad range of industrial goods. These include electronics (12%), machinery (12%), chemicals and gases (12%), vehicle parts (10%), rubber or plastics (10%) and more. Respondents are from intermediate to very large organisations; 32% have global revenues in excess of US$5bn, 32% have revenues of between US$1bn and US$5bn and 36% have revenues of US$500m-$1bn. To complement
the survey, the EIU conducted in-depth interviews with senior manufacturing executives and academics, as well as related additional research.
The report was written by Steven Weiner and edited by David Line. Our thanks are due to all survey participants and interviewees for their time and insights.
Interviewees (listed alphabetically by organisation) included:
• Peter Zornio, chief strategic officer, Emerson Process Management
• Stephan Biller, chief manufacturing scientist, GE Global Research
• Joe ElBehairy, vice president, engineering, quality and product strategy, Meritor
• Kent Potts, manager of industrialisation, Meritor
• Daniel W Apley, professor, industrial engineering and management sciences, Northwestern University
• Shiyu Zhou, professor, Department of Industrial Engineering, University of Wisconsin-Madison
Executive summaryI
(% respondents)
Respondents by job title
34%14%
16%
10%
6%
10%
Chief operating officer
Chief financial officer
Chief technology officer
Chief quality officer
Other “C-suite” role
Chief safety officer
Chief, supply chain management
Chief strategyofficer
Head of plant/factory
2%
4%
4%
(% respondents)
Respondent companies by revenue
36%12%
32%
20%
US$500m to US$1bn
US$1bn to US$5bn
US$20bn or more
US$5bn to US$20bn

3© The Economist Intelligence Unit Limited 2014
Manufacturing and the data conundrum: Too much? Too little? Or just right?
Key findings from the survey include:
l Manufacturers have significantly ramped up their shop floor data collection. Some 86% of survey respondents report major increases in the amount of production and quality-control data stored for analysis over the past two years. But it hasn’t been easy—only 14% of those surveyed report no problems managing the data glut from real-time production sensors and associated reporting and analytical models.
l A minority of manufacturers has an advanced data-management strategy. Fewer than half of respondents (42%) have what they consider to be a well-defined data-management strategy. A further 44% say they understand why shop floor data is valuable and, consequently, are putting in place resources to realise that value. There is no doubting its importance, though: every single manufacturer surveyed reports that data collection is a priority concern for their business.
l Manufacturers find it difficult to integrate data from diverse sources—and to find the skilled personnel to analyse it. Difficulty integrating data from multiple sources and formats is the most commonly cited problem in managing greater volumes of data, picked by 35% of respondents—no surprise, given the age of most manufacturing plants and that technology is transitory while infrastructure is durable. Companies also find that because of the speed of data-technology advancement they often lack the internal expertise necessary to maximize the benefits of collected information (cited by 33%).
l While data collection from monitoring is common, data analysis to predict issues or solve problems is less so. While almost all manufacturers find it normal to monitor production processes—for example, 90% or more say their companies have mature data analysis capabilities for such essentials as asset and facility management, safety, process design and supply chain management—less than half have in place predictive data analytics, and less than 40% use data analytics to find solutions to production problems.
l Data is delivering stellar quality and production-efficiency gains… Using insights gathered from production-data analysis, two-thirds of companies report annual savings of 10% or more in terms of the cost of quality (that is, net losses incurred due to defects) and production efficiencies, and about one-third say their savings on both measures have been in the range of 11% to 25%. This may explain why more than three-quarters of respondents identify aggressive data programmes as an important way to boost efficiency and lower costs.
l …but collecting data doesn’t automatically yield benefits.Despite many manufacturers reporting impressive savings from data analysis, 62% are not sure they have been able to keep up with the large volumes of data they collect, and just 50% are sure they can generate useful insights from it, as it comes from too many sources and in a variety of formats and speeds.

4 © The Economist Intelligence Unit Limited 2014
Manufacturing and the data conundrum: Too much? Too little? Or just right?
Manufacturers have used data to measure production since at least 3000 BC, when the oldest discovered cuneiform tablets were marked with pictographic words and numbers. All it took was a reed or stick to mark damp clay, and the number of sheep, bags of grain or output of spears was readable, but only to the literate overseer.
Similarly, today’s industrial data, displayed on computer screens, is understandable and useful only to the trained overseer. But there is far more of it, and it is available instantly, so that as issues arise process adjustments can be made quickly. In today’s ideal digitally networked production environment, complex data can be used far more easily than ever to improve product quality, boost throughput, improve shop floor reliability, enhance safety and predict maintenance requirements, eliminating unscheduled downtime.
That is the ideal, at any rate. In the past decade, as more manufacturers have implemented a broader array of digital controls—in the process linking together production machinery that used to operate independently—it has become an appealing vision of what making things might actually become everywhere.
“Today’s integrated operations go above and beyond what has been the traditional realm of process control,” says Peter Zornio, chief strategic officer of Emerson Process Management, a unit of St Louis, Illinois-based Emerson Electric Company. “We think there are three big ideas at the heart of
Ready or not, here it comesIIit. The first is pervasive sensing. You can get more and more data points than ever before.
“Second, integrated operations means multiple disciplines can analyse and discuss data from the plant together, not just one discipline at a time. And third is the realm of big data and equally big analytics.”
Stephan Biller, chief manufacturing scientist for GE Global Research—a group responsible, among other things, for finding ways to make General Electric’s 400 factories as efficient as possible—says the latest iteration of thinking there is called the “brilliant factory.” The brilliant factory idea works together with the industrial internet and software development that GE calls “Predictivity,” mirroring what theorists believe can be a manufacturing world so all-knowing that it routinely predicts production and product problems and solves them, too.
“It’s the entire digital thread from engineering and design, to manufacturing engineering, the factory and our suppliers,” says Dr Biller of the GE factory. “What’s new is envisioning the feedback loop from the factory in real time, through factory engineering and from the service shops. The amount of data is quite astounding.”
In fact, at GE’s new battery production plant in Schenectady, New York, 10,000 variables of data are collected, in some cases every 250 milliseconds. “We now have an infrastructure in the plant, data highways, that match what we have in the public Internet,” says Dr Biller.
“Today’s integrated operations go above and beyond what has been the traditional realm of process control.”Peter Zornio, chief strategic officer, Emerson Process Management

5© The Economist Intelligence Unit Limited 2014
Manufacturing and the data conundrum: Too much? Too little? Or just right?
The allure of this vision is pervasive. In a survey of manufacturers conducted by The Economist Intelligence Unit for this paper, 86% say that during the last two years they have significantly increased the amount of production and quality-control data stored for analysis. Nearly two-thirds say they use sensor-generated data from networked machines—an essential element of the integrated factory—and 20% say they plan to use data from networked production machinery (Figure 1). Equally telling, two-thirds of those surveyed say they also use sensor-generated data from external sources, off their shop floor, for comparison purposes—a move into the more complex and analytically difficult world now
generally called “big data”.
But not everything is settled when it comes to collection and use of digitised data. Most factories are decades old and predate in their design any consideration of this type of technology. The most recently completed complex greenfield oil refinery in the US began operations in 1977, for example. Despite the decades of post-World War II quality improvement programs—such as the teachings of statistical process control guru W Edwards Deming, the scholarship of Joseph Juran, Japanese kaizen process improvement teams, Six Sigma programmes, the Toyota Way and Lean
Manifold data sourcesWhat sources of data are used by your company to lower the cost of quality and improve manufacturing efficiency? Select all that apply.(% respondents)
Figure 1
Sensor-generated data from individual machines
Sensor-generated data from networked machines
Supplier-provided test data
Supply chain management system/supplier data
Enterprise data (ERP)
RFID
After sales failure data
Customer feedback system—Compliance/incidents management data
Operator logs
Manufacturing execution system (MES) process historian
Sensor-generated data from external sources forcomparative purposes
42 8
62 20
1866
52 16
90 6
78 18
88 10
88 10
86 12
74 24
34 14
82 10
964
Accounting/finance data
Demand forecasts
Use now Plan to use

6 © The Economist Intelligence Unit Limited 2014
Manufacturing and the data conundrum: Too much? Too little? Or just right?
Manufacturing—tens of thousands of factories in North America and Europe are light years removed from advanced, cutting-edge digital processes.
Most of these plants installed control systems along the way, many of them proprietary systems that have been locally customised and continue to operate—producing, perhaps, batch reports on operations at the end of the day.
“Migrations from systems of this nature are not for the faint of heart,” notes a senior executive in the control systems industry. He tells the story of one large factory, with annual revenue of US$500m, where production is controlled by orders written on coloured pieces of paper, one colour for each day of the week. If every workstation in the plant is using the same colour, the process is in sync.
It is therefore no surprise, in this environment, that only 14% of surveyed companies say they have experienced no problems as they manage increasing volumes of machine-generated process and quality data. Companies wrestle with efficiency and quality-improvement data from so many sources that confusion and apples-to-oranges comparisons are easily made. The number-one source of data, used by 96% of surveyed companies, is old-fashioned customer feedback, followed by process historian systems (90%), existing enterprise resource planning
systems (88%), accounting and financial data (88%), pre-existing supply chain management systems (86%) and after-sales failure data (82%; Figure 1).
“There is an enormous amount of data, and it’s a challenge to figure out how to integrate it,” says Daniel W Apley, professor of industrial engineering and management sciences at Northwestern University in Evanston, Illinois. “What you would like to use it for is to identify root causes of quality problems and product variation. People have been talking about this for decades. But the truth is, there are still many open research challenges and no real established methodology that can be used to trace quality problems back to the root causes when there are thousands of upstream process variables that are potential root causes. When there are thousands of variables, you typically need data for hundreds of thousands, or millions of parts in order to find meaningful statistical associations between problems and root causes.”
As GE’s Dr Biller says, “When you think about all the tasks that people have to do—the maintenance system, scheduling, material handling, incoming material, the machines themselves and their error codes, how much material is in each of the buffers, does the part pass or fail—and each plant has 10 to 15 individual systems. This is what makes the task somewhat difficult.”

7© The Economist Intelligence Unit Limited 2014
Manufacturing and the data conundrum: Too much? Too little? Or just right?
Respondents to the EIU survey conducted for this report see product quality management as the area in which greater volumes of data are most likely to make the biggest difference. Nearly three-quarters (72%) pick this in their top three business areas likely to see gains from more data, a much larger proportion than for any of the other areas and 28 percentage points more than the proportion picking process controls, the number-two area of potential gains (Figure 2).
Shiyu Zhou, a professor in the Department of Industrial Engineering at the University of Wisconsin-Madison, says that discussions about the need for better data analytics are “typically reactive” to customer queries or complaints—which often link back to quality issues. In fact, he says, it has become easier than ever to hear the voice of the customer because of data-driven product designs that report performance issues automatically to manufacturer service departments. Examples, he says, are medical equipment, such as magnetic resonance imagers or CT scanners, or jet aircraft engines that are linked to the Internet and communicate on their own when service is needed. Emerging problems, in turn, lead to an enhanced need to boost analytic capacity linked directly to shop floor production processes.
The machines themselves, in other words, feed the need for process data, leading to installation of more linked machines, and more actionable data in the factory. In this view, products that ask for service are like the razor blade, which by steadily growing duller creates the need for more
Quality firstIIIrazor blades, and a strategy for making them.
At Meritor, a maker of drivetrains, axles brakes and other commercial vehicle components, customers tend to focus on one metric—the number of rejected parts per million (PPM)—to evaluate suppliers. “When you take into account high-level manufacturing processes—we do casting, forgings, stampings, machining, heat treating and assembly—and every truck buyer wants to have the truck the way they want it with specific transmission, axles, and brakes—the variations are in the thousands,” says Joe ElBehairy, Meritor’s vice president for engineering, quality and product strategy.
What’s more, truck demand can swing wildly in volume, which stresses manufacturing systems, where long and stable production runs most often reduce product variation. To respond, Meritor has as much as quintupled the amount of data it collects at its 28 manufacturing plants.
Meritor began to track defect rates not just by part, but also by individual production operations. It also decided to differentiate between reject PPM of products shipped to customers and supplier PPM, which takes into account quality levels from component suppliers.
In 2013, Meritor’s reject rate was 139 PPM. During the first quarter of 2014, with more plants working to improve the traceability of production issues, the rate fell to 67. One plant, producing an entirely new type of air brake, achieved perfection—zero PPM (see case study on page 9).

8 © The Economist Intelligence Unit Limited 2014
Manufacturing and the data conundrum: Too much? Too little? Or just right?
Where data can make the differenceIn which of the following areas do you see greater volumes of data yielding the biggest gains? Select the top three.(% respondents)
Figure 2
Product quality management
Process controls
Supply chain management/sourcing
Targeted capital spending
Safety & facility management
Process design and improvements
Predictive maintenance/asset management
Operations management
72
44
42
36
30
30
20
12
10
Throughput improvement
“A key element is that we realise, as a company, that quality is valuable to our customers,” says Mr ElBehairy. “Some of the principles we applied are not new or earth-shattering, but we’ve been able to apply them to the complexity that we provide in our products.”
With the proper analysis of complex production data potentially yielding such dramatic gains in quality and efficiency, it is perhaps no surprise that the rush to collect it still outpaces planning to use it. Indeed, just 42% of companies responding to the EIU survey say they have a well-defined data management strategy, although a slightly larger proportion (44%) say they understand the value of shop floor data and are working to capture that value. This is despite the fact that all realise the paramount importance of data: every single company surveyed places a priority on data collection.
GE’s Dr Biller emphasises that an important part of any change in data strategy, and consequent
alterations to production processes, is careful and considered planning. “It’s a step process,” he says. “First you gather data and network it. Then you give the people in the plant the ability to operate the system using the data. You need to go through the steps rather slowly so that people in the plant understand what we’re trying to do, and so that we can work with them as a collaborator. Most of the time, the people in the plant know far more about it than you do.”
Equally important to realising value from this kind of initiative, says the senior executive from the control systems industry, is absolute commitment from senior management, especially the CEO, to building an integrated data process. “You can put in all the components to make it work, the computers and software, but if you don’t have leadership skills and trust, it can lead to failure no matter what system you have,” he says. “Having commitment from the CEO is an absolute prerequisite.”
“First you gather data and network it. Then you give the people in the plant the ability to operate the system using the data. You need to go through the steps rather slowly so that people in the plant understand what we’re trying to do, and so that we can work with them as a collaborator.”Stephan Biller, chief manufacturing scientist for GE Global Research

9© The Economist Intelligence Unit Limited 2014
Manufacturing and the data conundrum: Too much? Too little? Or just right?
Like most manufacturers, Meritor, of Michigan, has been on a long and determined drive to improve processes and products at its 28 factories in a dozen countries. The company makes drivetrain, braking and other components for trucks, trailers, off-highway, defence and speciality vehicles.
The latest iteration of company strategy, dubbed M2016, made operational excellence a renewed priority. “We adopted as our top metric reject parts per million [PPM],” says Joe ElBehairy, vice president for engineering, quality and product strategy. In 2013, companywide this figure was 139 reject PPM. With a goal of lowering that to 75 PPM by 2016, Meritor has turned, in part, to carefully heeded, real-time shop floor data.
“Our data collection is an order of magnitude larger than it was several years ago,” says Mr ElBehairy. “Some of it is related to safety, but a lot of our data gathering is related to traceability.” If something goes wrong, Meritor wants to know where and why it happened.
“And it’s not just collecting data, but real-time acting on that data,” says Kent Potts, industrialisation manager and leader of a quality improvement push at Meritor’s factory in York, South Carolina.
At York, three workstations assemble calipers for Meritor’s EX+ air disc brake from start to finish. More than 40 steps are required for the basic brake, but that’s only the beginning of the product’s complexity. Originally launched with 14 different specifications of weight, stopping power, pads, packaging and the like, EX+ assembly ballooned to 169 specifications after sales volume rose sharply following a contract award two years ago. A major customer wanted the brakes, but insisted that rejects had to be 10 PPM or less.
To comply, the York plant added sensors, monitoring gear, a programmable controller system and its own custom programming. Employees were trained on an error-proofing system that verifies that the correct parts and processes are applied for each brake. Bar codes are used to keep track of parts, and Meritor devised a system called “fit to light”, in which a computer keeps track of the assembly steps for each brake and turns on lights over the correct bin for the next component. Reach for the wrong component, and a red light flashes.
Meritor used tools that communicate with the programmable controllers and socket trays so that the tools could be used for multiple assembly operations and brake specifications. The programmable controllers verify that the correct socket and torque gun recipe is used for each assembly process; each piece receives the correct customised treatment. “Additionally, process data are stored in our manufacturing genealogy database for each air disc brake that’s assembled. The data includes the brake serial number, who assembled it, the component parts installed and process data such as fastener torques,” says Mr Potts.
The result of this application of real-time networked data to improve shop floor processes has been better than any manufacturer usually expects. During the year from March 2013 to March 2014, the York factory had a zero defect rate. No product rejects. Error-free production also permitted improvement of the on-time delivery rate to 98%—the best of any Meritor plant.
Techniques like these and tighter attention to quality lowered the company’s overall reject PPM in the first quarter of 2014 to 67, below the 2016 goal. Now, the goal is to sustain the progress.
Case study: Meritor: Towards data-driven production perfection
10 © The Economist Intelligence Unit Limited 2014
Manufacturing and the data conundrum: Too much? Too little? Or just right?
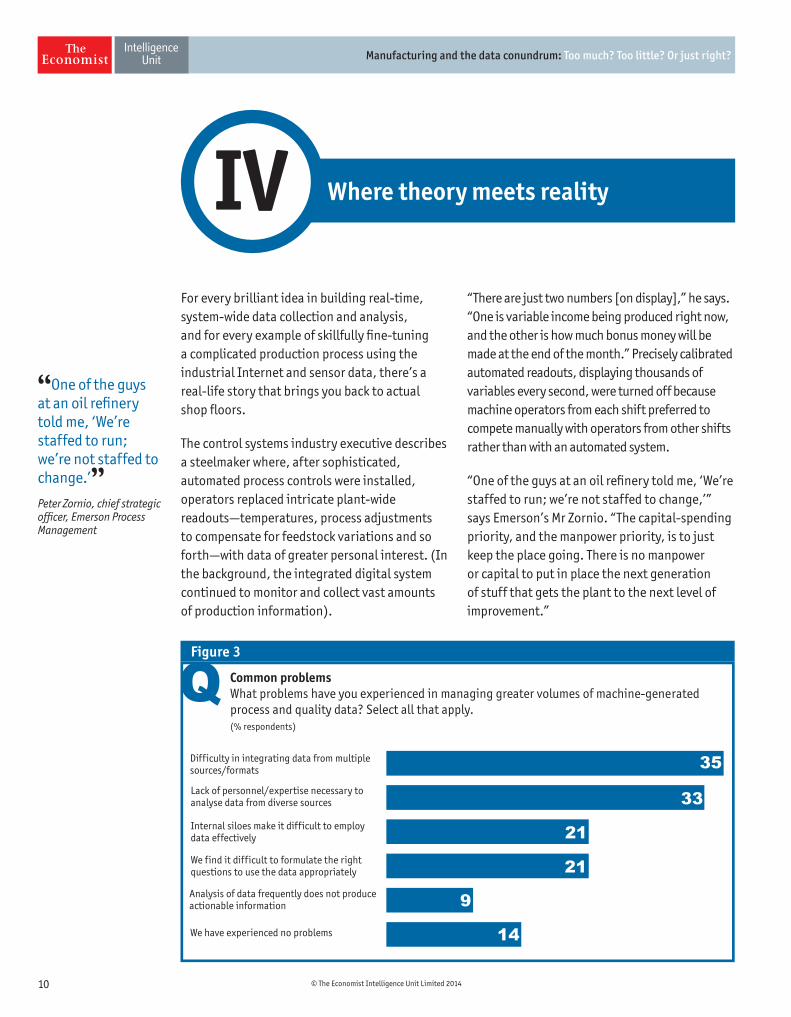
For every brilliant idea in building real-time, system-wide data collection and analysis, and for every example of skillfully fine-tuning a complicated production process using the industrial Internet and sensor data, there’s a real-life story that brings you back to actual shop floors.
The control systems industry executive describes a steelmaker where, after sophisticated, automated process controls were installed, operators replaced intricate plant-wide readouts—temperatures, process adjustments to compensate for feedstock variations and so forth—with data of greater personal interest. (In the background, the integrated digital system continued to monitor and collect vast amounts of production information).
Where theory meets realityIV“There are just two numbers [on display],” he says. “One is variable income being produced right now, and the other is how much bonus money will be made at the end of the month.” Precisely calibrated automated readouts, displaying thousands of variables every second, were turned off because machine operators from each shift preferred to compete manually with operators from other shifts rather than with an automated system.
“One of the guys at an oil refinery told me, ‘We’re staffed to run; we’re not staffed to change,’” says Emerson’s Mr Zornio. “The capital-spending priority, and the manpower priority, is to just keep the place going. There is no manpower or capital to put in place the next generation of stuff that gets the plant to the next level of improvement.”
Common problemsWhat problems have you experienced in managing greater volumes of machine-generated process and quality data? Select all that apply.(% respondents)
Figure 3
Difficulty in integrating data from multiple sources/formats
Lack of personnel/expertise necessary to analyse data from diverse sources
We find it difficult to formulate the right questions to use the data appropriately
Analysis of data frequently does not produce actionable information
Internal siloes make it difficult to employ data effectively
35
33
21
21
9
We have experienced no problems 14
“One of the guys at an oil refinery told me, ‘We’re staffed to run; we’re not staffed to change.’”Peter Zornio, chief strategic officer, Emerson Process Management

11© The Economist Intelligence Unit Limited 2014
Manufacturing and the data conundrum: Too much? Too little? Or just right?
Companies that responded to the EIU survey raise a series of impediments to the enhanced use of complex, machine-generated data to improve their processes. Number one on the list, cited by 35% of manufacturers, is difficulty integrating data from multiple sources and formats (Figure 3).
“The bottleneck is not in sensing; we have incredible sensing technology,” says Northwestern’s Professor Apley. “It gets back to the thousands of variables and identifying which is the root cause of the problem.” Older, proprietary systems, including some enormously popular ERP systems, produce only summary, batch reports; newer ones may crank out data, in different formats, four times each second.
“Most of these older factories are not networked,” says Dr Biller of GE. “The data stays within the production machinery. If you want to improve a system’s performance, you have to get the data out of the machine, then integrate it into an IT system—some kind of intelligent platform.”
But simply installing that platform isn’t the whole answer, either. Thirty-three percent of surveyed companies say an important issue is finding highly trained people to use it. A related problem—asking the right questions of your systems to generate the right answers, was cited as an issue by 21% of surveyed companies. Also problematic: companies organised into feuding siloes that don’t share essential information (also cited by 21%).
Talent, says Northwestern’s Professor Apley, is thin on the ground. “Relative to 20 years ago, it is more difficult now to find young people who are highly trained in analytics and data sciences and who want to go into manufacturing,” he
says. “They are often more drawn to financial companies, or companies like Google and Facebook.” Even so, Northwestern is among the universities that have recently launched an engineering-oriented masters of science in analytics program. The student body is roughly one-third international and two-thirds domestic students, and so far, all have received multiple job offers. “There are just so many companies looking for people who have the skills to analyse large amounts of data,” Professor Apley says.
Mr Zornio has found siloing can be a significant issue because when “every facility makes their own decision” about which efficiency controls to put in place, interplant uniformity becomes impossible. Nonetheless, centrally controlled manufacturers may make decisions about best practices that individual facilities resist because of inevitable local variability.
“In this big-data world, you may know that you don’t have the people who can look at all the data and figure out what needs to be done,” he says.
But suppose you do have the people. The next tripwire, says the senior executive from the control systems industry, is “information overload. There’s not enough intelligence in software to sort out this overload.
“For example, let’s say there’s a machine that sends out an alarm to the operator. It needs grease or whatever. But what if three or four machines do this? Then suddenly you have alarm overload, and then you have to have alarm management. It is easy to find 500 things to do in a plant. But it’s damn tough to find the 497 things we are not going to do. That’s the real challenge.”
“It is more difficult now to find young people who are highly trained in analytics and data sciences and who want to go into manufacturing. They are often more drawn to financial companies, or companies like Google and Facebook.”Daniel Apley, professor of industrial engineering and management sciences, Northwestern University

12 © The Economist Intelligence Unit Limited 2014
Manufacturing and the data conundrum: Too much? Too little? Or just right?
ABB, based in Zurich, Switzerland, makes power, automation and electrical products and provides a range of industrial control services. One of its recent successes came in helping Sandvik Materials Technology of Sandviken, Sweden (about 190 km north of Stockholm), which makes specialty stainless steel, titanium and alloys for equally specialised uses.
Sandvik faced the problem that as the uses of steel grew more intricate, with greater precision required from each delivery, production equipment had to keep pace. In 2013, as part of a long-term process improvement effort, Sandvik’s attention turned to an important component of the production system—a bidirectional rolling mill, or Steckel mill, used to make metal strips thinner and thinner with each pass through the rollers.
Sandvik had no plan to replace the equipment. Instead, it opted to improve how it used the mill with a few new sensors feeding digital controls. Based on a tightly defined model of perfection, these would continually adjust rolling speeds, pressures and the number of passes through the mill to compensate for variation.
First, Sandvik installed additional sensors to measure precisely the width of the rolled metal and its temperature, which changes during rolling as the metal interacts with the machinery. In some factories, dozens or even hundreds of sensors might be required, but Sandvik made do with just nine. To control the process, the company needed more data, but not a flood of it.
Every rolling job begins with a detailed model of what the exactly right outcome should be. This means the system—provided by ABB—must take multiple factors into account, including the material being rolled; its thickness, width and grade; the target thickness; the number of passes through the mill that should be required; and the adaptations to rolling pressure, temperatures, rolling speed, torque and flatness that must be made. Increasingly, customers want thinner steel, but thinner steel strips can easily be brittle and prone to deformation and in-process separation.
“We run all kinds of special steels, the entire range from stainless to high-alloy,” says Patrick Högström, hot rolling mills production manager at Sandvik. “The variety of steel grades and sheet dimensions make production very complex and knowledge intensive. The model makes it possible to optimise rolling in a completely different way from what a human being is capable of. It becomes smoother, and with noticeably less scrap, which means increased yield.”
Thanks to the new sensors and related process controls, Sandvik can now roll specialty metal to thinner tolerances while maintaining the metallic properties, such as strength and formability, required for the final use. Compared with its old process, the new controls have reduced the degree of deviation from perfection by 35%, and the average volume of imperfections has dropped by 80%.
Case study: ABB/Sandvik: Reducing deviations, eliminating imperfections

13© The Economist Intelligence Unit Limited 2014
Manufacturing and the data conundrum: Too much? Too little? Or just right?
Even with the many complications between shop floor data theory and practice, companies surveyed by the EIU have found a number of comfort zones where the benefits of real-time machine-generated information are accessible.
More than 80% of companies report “mature” data analysis capabilities when it comes to everyday issues of safety, facilities management, supply chain management, formulation of capital spending plans, process design, the use of process controls, asset maintenance and generalised product quality management. In other words, when production processes
From monitoring to alerting, predicting and solvingV
are normal, their comfort level with digital technology is at high levels.
But outside of monitoring normal operations, confidence levels drop precipitously. For example, when it comes to analysing responses to alerts about problems and their causes, half or more of surveyed companies lack mature capabilities. Two-thirds of companies report analytical weakness when it comes to dealing with asset maintenance and throughput alerts, and 76% lack mature capabilities to analyse potential process design issues (Figure 4).
Reporting yes; alerting/predicting/solving—not yetFor which of the following functions and areas does your company have mature data analysis capabilities?(% respondents)
Figure 4
0%
20%
40%
60%
80%
100%Asset maintenance/management
Product quality management
Process controls
Throughput
Operations managementProcess design
Capital spending
Supply chain management
Safety and facilities management
Reporting normal operationsAlerting about problems
Predicting future problemsPrescribing solutions to problems

14 © The Economist Intelligence Unit Limited 2014
Manufacturing and the data conundrum: Too much? Too little? Or just right?
Although state-of-the-art digital systems can predict problems and suggest solutions in advance of actual need, more than half of manufacturers aren’t confident that their analytical skills are up to the task. Just 22% of surveyed companies have predictive analytical capabilities for production throughput, for example; just 16% have mature analytical capacity to generate potential solutions.
In terms of functions, the highest levels of predictive capability are found in supply chain management (44%) and safety and facility management (48%). Mature analytical capabilities to prescribe solutions are most prevalent for asset maintenance (38%) and product quality management (38%).
Of course, when evaluating the current state of manufacturing’s digital readiness, two additional issues must be considered. First, not all factories actually need the most advanced possible integrated, real-time data. “If you operate a smaller factory, and you have a supervisor who can see where everything is, you don’t need all that much data to run it efficiently,” says Dr Biller. “If I have a plant that can already run at optimal efficiency, I don’t want to implement sophisticated technology
because there is no return on investment from it. Once you ‘lean out’ a plant and make every process as simple as possible you don’t want to automate it.”
Second, even the most sophisticated, integrated digital system is of limited use if companies don’t ask the right questions about their processes or quality issues. Data collection and analysis return rewards only when root causes of issues are addressed, rather than just symptoms of those issues. One practice used in Six Sigma quality-improvement systems is to repeatedly use the question “Why?” until the root cause is identified. For example: A door hinge isn’t working as it should. Why? Because it is slightly too large for the fitting. Why? Is it because the wrong materials have been used to make it, leading to slight deformations of the part? Are processes slightly maladjusted, leading to hinges of the wrong size? Is the part designed the way it should have been?
“Why” questions apply equally to the use of shop-floor data analytics. “You must ask the right question to arrive at the right answer,” the old adage goes, and nothing about the modern digital world has changed the truth of this.
15© The Economist Intelligence Unit Limited 2014
Manufacturing and the data conundrum: Too much? Too little? Or just right?
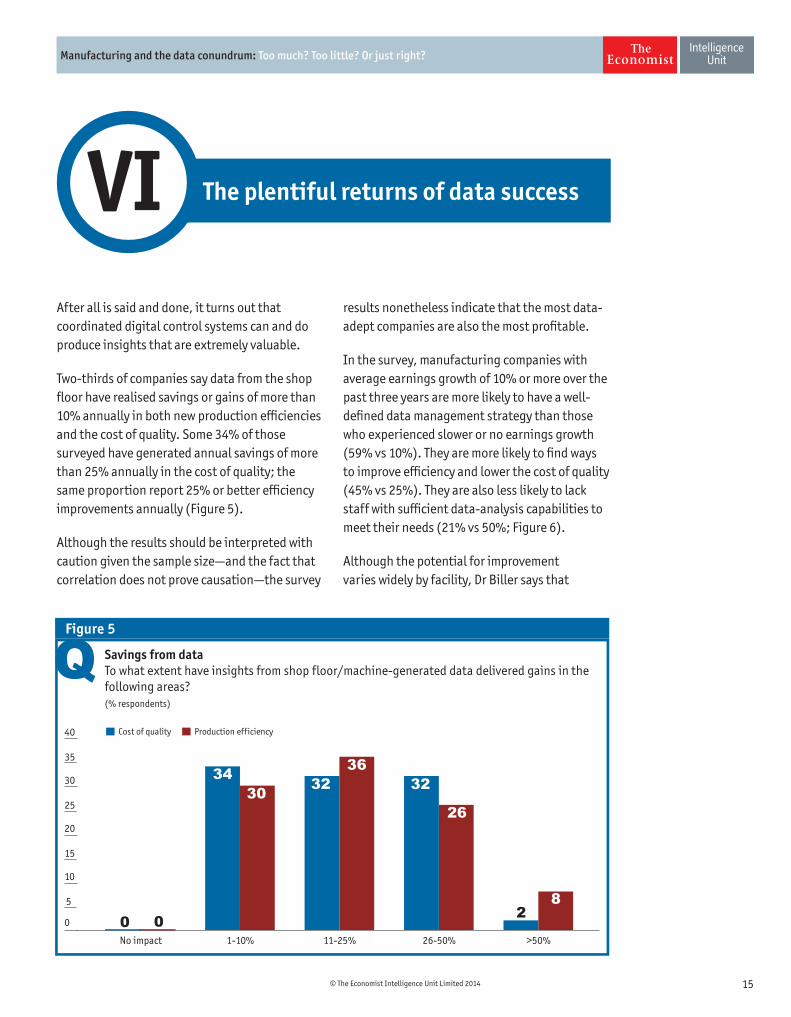
After all is said and done, it turns out that coordinated digital control systems can and do produce insights that are extremely valuable.
Two-thirds of companies say data from the shop floor have realised savings or gains of more than 10% annually in both new production efficiencies and the cost of quality. Some 34% of those surveyed have generated annual savings of more than 25% annually in the cost of quality; the same proportion report 25% or better efficiency improvements annually (Figure 5).
Although the results should be interpreted with caution given the sample size—and the fact that correlation does not prove causation—the survey
The plentiful returns of data successVIresults nonetheless indicate that the most data-adept companies are also the most profitable.
In the survey, manufacturing companies with average earnings growth of 10% or more over the past three years are more likely to have a well-defined data management strategy than those who experienced slower or no earnings growth (59% vs 10%). They are more likely to find ways to improve efficiency and lower the cost of quality (45% vs 25%). They are also less likely to lack staff with sufficient data-analysis capabilities to meet their needs (21% vs 50%; Figure 6).
Although the potential for improvement varies widely by facility, Dr Biller says that
Savings from dataTo what extent have insights from shop floor/machine-generated data delivered gains in the following areas?(% respondents)
Figure 5
Production efficiencyCost of quality
0
5
10
15
20
25
30
35
40
>50%26-50%11-25%1-10%No impact
26
34
8
30 3236
32
0 20

16 © The Economist Intelligence Unit Limited 2014
Manufacturing and the data conundrum: Too much? Too little? Or just right?
optimising factory systems provides substantial opportunities. “If you look at the supply chain and driving out excess inventory, we talk about savings of perhaps 6% to 20%; we think 10% is actually a conservative number for those implementations,” he says. “At GE, where we carry US$15bn in inventory, a 10% saving can be huge. How about optimising scheduling to improve throughput? Ten percent is a pretty conservative number for that, and that means you can save in plant and equipment investment because we don’t have to buy additional machines. Machine optimisation can produce gains of 20%. The benefits can be huge.”
Current gains also involve more than money or ROI that justifies the necessary investments in sensors, RFID and bar code equipment, computers, software, training, process realignment, improved production machinery and continual product improvements. Evangelists for widely integrated production systems believe a new industrial revolution is in process. Fully 50% of surveyed companies agree with the statement: “A rigorous and advanced data analysis capability can be a differentiator for our
company.” This marks an important attitudinal step for manufacturing companies into real-time controls and rapid responses to production variations.
“Ultimately, the goals of decades of work on inspection and quality control boil down to understanding variation,” says Professor Apley. “Perfect manufacturing hypothetically produces the same part, identically, with no variations. What we see now is that huge amounts of data are collected, but largely underutilised. But data analytics is a new and rapidly expanding area that has great potential for helping to understand variation.”
“Think of the manufacturing revolution that’s happening,” says Dr Biller. “Yes, we want to make all of our factories more agile, but the great part of this is that we’re building an ecosystem that allows people all over the world to innovate. We’re all working on how we can turn that into traditional manufacturing, and then traditional manufacturing into smart manufacturing.
“We have every science and engineering discipline working for GE in research. Of course,
“At GE, where we carry US$15bn in inventory, a 10% saving can be huge. How about optimising scheduling to improve throughput? Ten percent is a pretty conservative number for that.”Stephan Biller, chief manufacturing scientist, GE Global Research
Profiting from data(% respondents)
Figure 6
Low growthHigh growth
Well-defined data-managementstrategy
Routinely analyse data tofind ways to improve efficiency
and lower cost of quality
Lack key staff with skillsto analyse data
0
10
20
30
40
50
60
70
5059
10
45
25 21
“High growth” = average EBITDA growth of 10% or more for each of past three years“Low growth” = average EBITDA growth of under 10% for each of past three years

17© The Economist Intelligence Unit Limited 2014
Manufacturing and the data conundrum: Too much? Too little? Or just right?
The General Electric factory in Schenectady, New York, was built, on one level, to make the company’s new-technology Durathon battery. But for the GE Global Research arm, the factory’s most important product is data.
GE has packed more than 10,000 sensors into the US$170m plant. All of them are linked into the most tightly integrated digital control and information systems of any of the company’s 400 global factories. The sensors monitor performance indicators for every manufacturing process, building information such as energy use, temperatures and humidity, and even extend to the rooftop weather station. If something goes wrong, the sensors, using wi-fi links to staff members wielding hand-held computers, send alerts, and can, if necessary, send text messages to plant employees at home.
The plant, which began battery production in July 2012, is the test bed and most pronounced expression of GE’s research into ways to create and use the emerging industrial Internet—called by some the “Internet of things”—to build what the company calls the “Brilliant Factory”.
“This plant has one of the most advanced implementations of our process suite from GE Intelligent Platforms,” GE’s process controls business, says Stephan Biller, chief manufacturing scientist for GE Global Research of nearby Niskayuna, New York. “Initially we used the data to improve our own processes. What input parameters do we have to change? If a battery fails, was it the humidity of that particular process, or the temperature, or operators who we didn’t train well enough? All of this was useful in improving the process.”
With precise manufacturing parameters set for the Durathon—which stores and produces electric power on demand using a sodium-nickel chemical process—GE has begun to use the geyser of data to improve efficiency and throughput.
“The questions now are how do we improve costs and get more out of that factory?” says Dr Biller. “The key is to think of the entire system, not just parts of it, and by doing this, you can reach an optimal state. I don’t want to optimise each individual machine by itself, but as part of a whole system. This permits me to find the bottlenecks. That’s not a trivial task, and it’s systems thinking that gives you the gains.”
Case study: GE’s factory built to produce data
smaller manufacturers can’t do that. But remember, 80% of our parts are designed and
made by suppliers. We want them and all the links to be part of this digital thread.”

18 © The Economist Intelligence Unit Limited 2014
Manufacturing and the data conundrum: Too much? Too little? Or just right?
What do these findings mean for manufacturers large and small? Several conclusions seem apparent.
Firstly, as the science-fiction novelist William Gibson noted, the future has already arrived—it’s just not evenly distributed. This is as true of manufacturing as any other field. At the cutting edge are companies that operate with complete transparency from end to end of their design, supply, production, shipping and quality control processes. They typically have a good grip, through sensors, RFID tags, bar codes and other devices, on how things are going in their factories. They can electronically send precise adjustments to production gear and workstations. They can measure quickly whether a part isn’t performing as it should. They can schedule supplies and shipments accurately and respond to problems effectively. Small variations at one part of their data chain don’t produce major surprises elsewhere because their systems, integrated and networked, see the potential impact and fix it. GE and others imagine a perfect factory that will never stop producing, ever, because every potential variable is monitored and adjusted and every product is exactly what it should be.
However, the reality is that very few of today’s aggressive, heads-up manufacturers are close to this vision yet. This is partly because the process of integrating data systems and analysis into manufacturing is far from simple. In this arena, one size definitely does not fit all. In fact
ConclusionVIIthere really is no standard approach other than to match a company’s appetite for change. In addition, the transition is rarely straightforward because most factories are not new and many may not be ideal environments for complex data collection and analysis. Older machinery, computer systems that don’t provide real-time data or that are incompatible with others in a production process, and time-honoured production habits clash with the promise of efficiency and quality improvements from the digital world.
Secondly, the research shows that once manufacturers have decided to implement analytical models they need to think carefully about how data needs to be stored, processed and used. Volumes of data have become so large that some companies aren’t certain where to store it all. Many still don’t know how to use the information, or even how to formulate production questions that fit the capacity of sensors and software to provide answers. Many lack the resources, and probably the trained personnel, to look at much more than monitoring of simply networked shop-floor data. Companies that now use multiple separate types of monitoring—with each machine or portion of the production process isolated digitally from the others— won’t find it easy to create such networks. But it is worth the try, and in this technological environment, with relatively inexpensive wireless data collection commonplace, the financial commitment is manageable.

19© The Economist Intelligence Unit Limited 2014
Manufacturing and the data conundrum: Too much? Too little? Or just right?
Thirdly, customers will increasingly see the digitised processing, collection and analysis of complex data by manufacturers as a guarantor of quality—over and above traditional accreditations. This will become another means of differentiation among peers; companies that lag in this area may find themselves compelled by competition to ramp up their complex data analysis capabilities.
Finally, the research has shown that the embrace of shop-floor data even on a relatively small scale can be beneficial for even the smallest
of producers. By monitoring production machinery and processes, efficiencies can be gained and product quality is likely to improve. Therefore the question for manufacturing is not whether advanced, integrated, systemic data capabilities are beneficial or the pathway to greater productivity and operations excellence—certainly, they are, and in many cases, the gains from adoption of the latest digital control techniques can be substantial. The real issue is how manufacturers can make this vision of the future a reality today.

20 © The Economist Intelligence Unit Limited 2014
Manufacturing and the data conundrum: Too much? Too little? Or just right?
Appendix: Survey results
Note: Percentages may not total 100 due to rounding or the ability of respondents to choose multiple responses
What is your job title? (% respondents)
Chief financial officer
Chief quality officer
Other “C-suite” role
Chief, supply chain management
Head of plant/factory
Chief strategy officer
Chief operating officer
Chief technology officer
Chief safety officer
34
16
14
10
10
6
4
4
2

21© The Economist Intelligence Unit Limited 2014
Manufacturing and the data conundrum: Too much? Too little? Or just right?
In what country is your company headquartered?(% respondents)
United States of America
United Kingdom
Germany
Netherlands
Canada
Japan
Denmark
34
14
8
8
8
6
6
Sweden6
Italy4
France2
Switzerland2
Finland2
Which category best describes the types of goods made in your company’s factories?(% respondents)
Electronic goods
Machinery
Chemicals/industrial gases and related products
Rubber and/or plastics
Automotive/vehicle parts
Aircraft and/or aircraft components
Primary metals
Medical devices and supplies
Building products
12
12
12
10
10
8
8
6
6
Petroleum refining and related activities
Glass, stone, clay and/or concrete
4
4
Fabricated metal products
Electrical gear
4
4

22 © The Economist Intelligence Unit Limited 2014
Manufacturing and the data conundrum: Too much? Too little? Or just right?
What are your company’s global annual revenues in US dollars? (% respondents)
$500m to $1bn
$1bn to $5bn
$20bn or more
$5bn to $20bn
36
32
12
20
Which of the following statements best describes your company’s approach to data management as it applies to using shop-floor data to improve the efficiency of its core production processes? (% respondents)
We understand the value of our shop-floor data and are currently marshalling resources to take better advantage of them
We have a well-defined data management strategy
We collect data but it is very difficult to make use of the information from our varying IT systems
We do not collect enough data to produce significant manufacturing efficiency gains
We do not prioritise data collection
44
42
14
0
0
In your business, in which of the following areas do you see greater volumes of data yielding the biggest gains? Select the top three.(% respondents)
Product quality management
Process controls
Operations management
Process design and improvements
Predictive maintenance/asset management
Supply chain management/sourcing
Safety & facility management
Throughput improvement
Targeted capital spending
72
44
42
30
30
20
12
10
36

23© The Economist Intelligence Unit Limited 2014
Manufacturing and the data conundrum: Too much? Too little? Or just right?
Reporting normal operations Alerting about problems Predicting future problems Prescribing solutions to problems
Asset maintenance/management
Product quality management
Process controls
Throughput
Operations management
Process design
Capital spending
Supply chain management/sourcing
Safety & facility management
32 18 3890
5284 26 38
88 54 38 28
3274 22 16
5282 36 26
90 24 2428
3092 16 14
92 4446 30
46 48 2892
For which of the following functions and areas does your company have mature data analysis capabilities? Select all that apply. (% respondents)
Regarding production efficiency and cost of quality, how would you describe your company’s experience with regard to analysis of machine-generated data from the shop-floor? Select the best answer.(% respondents)
We frequently, but not always, identify production problems and ways to lower the cost of quality from the data we collect
We now routinely find ways to improve manufacturing efficiency and lower the cost of quality from the data we collect
We infrequently identify production problems and ways to lower the cost of quality from the data we collect
We are yet to use data to improve manufacturing efficiency and lower the cost of quality
54
36
10
0

24 © The Economist Intelligence Unit Limited 2014
Manufacturing and the data conundrum: Too much? Too little? Or just right?
What sources of data are used by your company to lower the cost of quality and improve manufacturing efficiency? (% respondents)
Use currently Plan to use Do not plan to use Does not apply
Sensor-generated data from individual machines
Sensor-generated data from networked machines
Sensor-generated data from external sources for comparative purposes
Operator logs
Manufacturing execution system (MES) process historian
Supplier-provided test data
Enterprise data (ERP)
Accounting/finance data
Supply chain management system/supplier data
Demand forecasts
RFID
After sales failure data
Customer feedback system—Compliance/incidents management data
8 3442 16
2062 10 8
66 18 10 6
52 16 30 2
90 6 4
78 18 2 2
88 10 2
88 10 2
86 12 2
74 24 2
34 14 28 24
82 10 6 2
96 4
Yes
No
86
14
Over the past two years, have you significantly increased the amount of production and quality-control data you store for analysis? (% respondents)
What problems have you experienced in managing greater volumes of machine-generated process and quality data? Select all that apply.(% respondents)
Difficulty in integrating data from multiple sources/formats
Lack of personnel/expertise necessary to analyse data from diverse sources
We find it difficult to formulate the right questions to use the data appropriately
Internal siloes make it difficult to employ data to effectively
We have experienced no problems
Analysis of data frequently does not produce actionable information
35
33
21
14
9
21

25© The Economist Intelligence Unit Limited 2014
Manufacturing and the data conundrum: Too much? Too little? Or just right?
Up to 10% annual savings/gain 11-25% annual savings/gain 26-50% annual savings/gain More than 50% savings/gain
Cost of quality
Production efficiency
32 32 234
3630 26 8
To what extent have insights from shop floor/machine-generated data delivered gains in the following areas? (% respondents)
Do you agree with the following statements? (% respondents)
Agree Neutral/no opinion Disagree
Aggressive data collection and analysis are an important way to improve manufacturing efficiency
Aggressive data collection and analysis are an important way to lower the cost of quality
Our analytical capabilities have not been able to keep up with the large volumes of data we now collect
We are unable to derive insights from data as it comes from too many sources
A rigorous and advanced data analysis capability can be a differentiator for our company
Our competitors do a better job than we do with data collection and analysis
The cost of setting-up and maintaining a strong analytics function is larger than what our company can afford
2078 2
76 20 4
28 34 38
20 30 50
4250 8
16 84
6 22 72

26 © The Economist Intelligence Unit Limited 2014
Manufacturing and the data conundrum: Too much? Too little? Or just right?

While every effort has been taken to verify the accuracy of this information, The Economist Intelligence Unit Ltd. cannot accept any responsibility or liability for reliance by any person on this report or any of the information, opinions or conclusions set out in this report.
About WiproWipro Ltd (NYSE:WIT) is a leading information technology, consulting and business process services company that delivers solutions to enable its clients to do business better. Wipro delivers winning business outcomes through its deep industry experience and a 360 degree view of “Business through Technology”—helping clients create successful and adaptive businesses. A company recognised globally for its comprehensive portfolio of services, a practitioner’s approach to delivering innovation, and an organisation-wide commitment to sustainability, Wipro has a workforce of over 140,000, serving clients in 175+ cities across six continents. For more information, please visit www.wipro.com
About Wipro Council for Industry Research (WCIR)Wipro set up the Council for Industry Research, comprising domain and technology experts from the organisation, to address the needs of customers. It specifically surveys innovative strategies that will help customers gain competitive advantage in the market. The Council, together with leading academic institutions and industry bodies, studies market trends that provide organisations a better insight into IT and business strategies. For more information, please visit www.wipro.com/insights/
This report was commissioned by Wipro

LONDON20 Cabot SquareLondonE14 4QWUnited KingdomTel: (44.20) 7576 8000Fax: (44.20) 7576 8500E-mail: [email protected]
NEW YORK750 Third Avenue5th FloorNew York, NY 10017, USTel: (1.212) 554 0600Fax: (1.212) 586 0248E-mail: [email protected]
HONG KONG6001, Central Plaza18 Harbour RoadWanchaiHong KongTel: (852) 2585 3888Fax: (852) 2802 7638E-mail: [email protected]
GENEVARue de l’Athénée 321206 GenevaSwitzerlandTel: (41) 22 566 2470Fax: (41) 22 346 9347E-mail: [email protected]