Case Study: The Cash Application Conundrum Lisa Tanner Manager Credit and Collections.
Upload
scott-perryCategory
view
232download
0description
Member FINRA/SIPCPage 1 of 5
LPL F INANCIAL RESEARCH
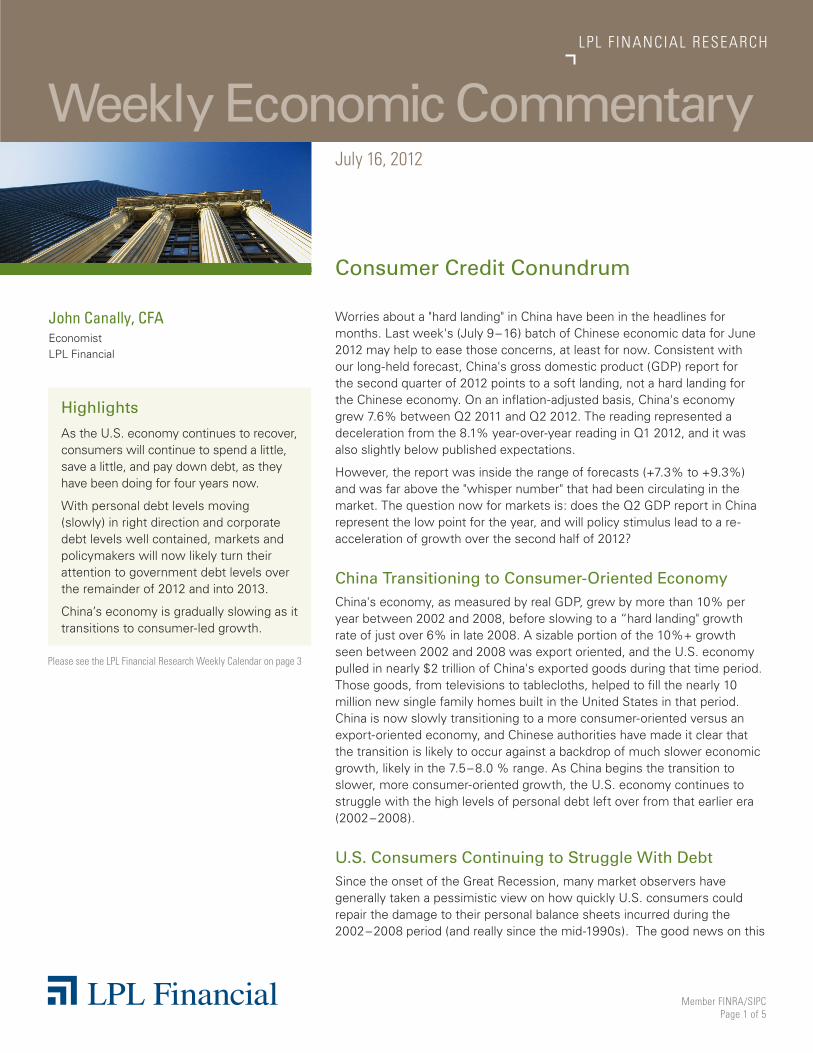
Weekly Economic CommentaryJuly 16, 2012
John Canally, CFAEconomist LPL Financial
Consumer Credit Conundrum
Highlights
As the U.S. economy continues to recover, consumers will continue to spend a little, save a little, and pay down debt, as they have been doing for four years now.
With personal debt levels moving (slowly) in right direction and corporate debt levels well contained, markets and policymakers will now likely turn their attention to government debt levels over the remainder of 2012 and into 2013.
China’s economy is gradually slowing as it transitions to consumer-led growth.
Worries about a "hard landing" in China have been in the headlines for months. Last week's (July 9 – 16) batch of Chinese economic data for June 2012 may help to ease those concerns, at least for now. Consistent with our long-held forecast, China's gross domestic product (GDP) report for the second quarter of 2012 points to a soft landing, not a hard landing for the Chinese economy. On an inflation-adjusted basis, China's economy grew 7.6% between Q2 2011 and Q2 2012. The reading represented a deceleration from the 8.1% year-over-year reading in Q1 2012, and it was also slightly below published expectations.
However, the report was inside the range of forecasts (+7.3% to +9.3%) and was far above the "whisper number" that had been circulating in the market. The question now for markets is: does the Q2 GDP report in China represent the low point for the year, and will policy stimulus lead to a re-acceleration of growth over the second half of 2012?
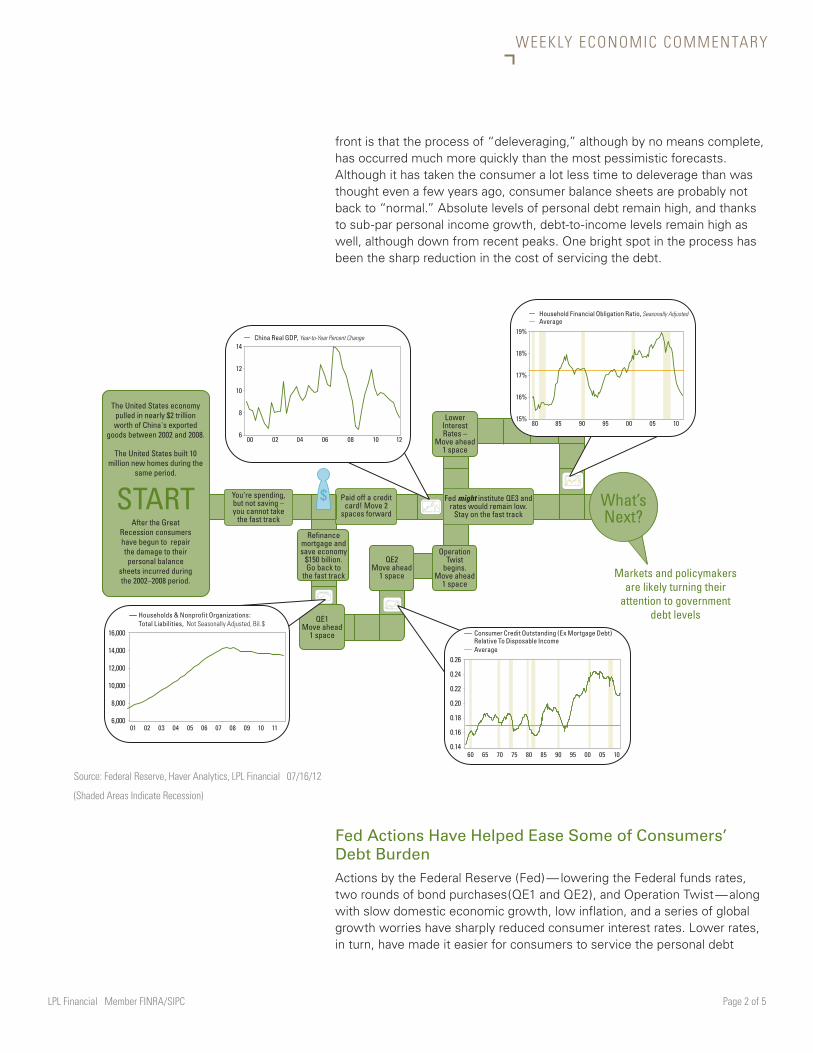
China Transitioning to Consumer-Oriented Economy China's economy, as measured by real GDP, grew by more than 10% per year between 2002 and 2008, before slowing to a “hard landing" growth rate of just over 6% in late 2008. A sizable portion of the 10%+ growth seen between 2002 and 2008 was export oriented, and the U.S. economy pulled in nearly $2 trillion of China's exported goods during that time period. Those goods, from televisions to tablecloths, helped to fill the nearly 10 million new single family homes built in the United States in that period. China is now slowly transitioning to a more consumer-oriented versus an export-oriented economy, and Chinese authorities have made it clear that the transition is likely to occur against a backdrop of much slower economic growth, likely in the 7.5 – 8.0 % range. As China begins the transition to slower, more consumer-oriented growth, the U.S. economy continues to struggle with the high levels of personal debt left over from that earlier era (2002 – 2008).
U.S. Consumers Continuing to Struggle With DebtSince the onset of the Great Recession, many market observers have generally taken a pessimistic view on how quickly U.S. consumers could repair the damage to their personal balance sheets incurred during the 2002 – 2008 period (and really since the mid-1990s). The good news on this
Please see the LPL Financial Research Weekly Calendar on page 3
LPL Financial Member FINRA/SIPC Page 2 of 5
WEEKLY ECONOMIC COMMENTARY
front is that the process of “deleveraging,” although by no means complete, has occurred much more quickly than the most pessimistic forecasts. Although it has taken the consumer a lot less time to deleverage than was thought even a few years ago, consumer balance sheets are probably not back to “normal.” Absolute levels of personal debt remain high, and thanks to sub-par personal income growth, debt-to-income levels remain high as well, although down from recent peaks. One bright spot in the process has been the sharp reduction in the cost of servicing the debt.
Source: Federal Reserve, Haver Analytics, LPL Financial 07/16/12
(Shaded Areas Indicate Recession)
QE1Move ahead
1 space
QE2Move ahead
1 space
Refinancemortgage andsave economy
$150 billion.Go back to
the fast track
What’sNext?
STARTOperation
Twistbegins.
Move ahead1 space
LowerInterestRates –
Move ahead1 space
The United States economy pulled in nearly $2 trillion worth of China's exported
goods between 2002 and 2008.
The United States built 10 million new homes during the
same period.
After the Great Recession consumers have begun to repair the damage to their personal balance
sheets incurred during the 2002–2008 period.
Paid off a credit card! Move 2
spaces forward
You’re spending, but not saving – you cannot take
the fast track
Fed might institute QE3 and rates would remain low.
Stay on the fast track
$040200 08 10 1206
14
12
10
8
6
China Real GDP, Year-to-Year Percent Change
0095908580 05 10
14.25
13.50
12.75
12.00
11.25
10.50
Household Debt Service Ratio, Seasonally Adjusted, %Average0504030201 0706 08 111009
16,000
14,000
12,000
10,000
8,000
6,000
Households & Nonprofit Organizations: Total Liabilities, Not Seasonally Adjusted, Bil.$
908580 05 100095
19%
18%
17%
16%
15%
Household Financial Obligation Ratio, Seasonally AdjustedAverage
040200 08 10 1206
14
12
10
8
6
China Real GDP, Year-to-Year Percent Change
908580 05 100095
19%
18%
17%
16%
15%
Household Financial Obligation Ratio, Seasonally AdjustedAverage
0504030201 0706 08 111009
16,000
14,000
12,000
10,000
8,000
6,000
Households & Nonprofit Organizations: Total Liabilities, Not Seasonally Adjusted, Bil.$
0095908580 05 1075706560
0.26
0.24
0.22
0.20
0.18
0.16
0.14
Consumer Credit Outstanding (Ex Mortgage Debt) Relative To Disposable IncomeAverage
Markets and policymakers are likely turning their
attention to government debt levels
Fed Actions Have Helped Ease Some of Consumers’ Debt Burden Actions by the Federal Reserve (Fed) — lowering the Federal funds rates, two rounds of bond purchases(QE1 and QE2), and Operation Twist — along with slow domestic economic growth, low inflation, and a series of global growth worries have sharply reduced consumer interest rates. Lower rates, in turn, have made it easier for consumers to service the personal debt
LPL Financial Member FINRA/SIPC Page 3 of 5
WEEKLY ECONOMIC COMMENTARY
(pay credit cards, student loans, mortgages, etc.) that has not already been eliminated (either voluntarily or involuntarily). Mortgage rates, which were close to 7% as recently as the middle of 2008, are now well below 4.0%, and could be headed lower if the Fed decides to pursue a third round of quantitative easing (QE3) and target the mortgage market. Economy-wide, the drop in mortgage rates, along with a drop in mortgage debt outstanding, translated into $150 billion in lower mortgage payments in 2011 versus 2008. To put that dollar amount in perspective, $150 billion dollars is what Americans spent on furniture, lighting fixtures, carpets, floor coverings, and window coverings in the past 12 months.
Rates on auto and truck and personal loans have seen similar declines. In 2007, the average rate on a five-year loan for a new car or truck was around 8.0%. Today, the rate is well under 5.0%. The rate on a two-year personal bank loan in 2007 was close to 14%. Today, rates on unsecured personal loans are under 11%. Interest rates on credit cards have moved down as well. On balance, personal interest payments on non-mortgage debt have been cut in half since late 2008, while mortgage interest payments have been cut by 25%. While some of that reduction in interest represents
Fed Global Notables
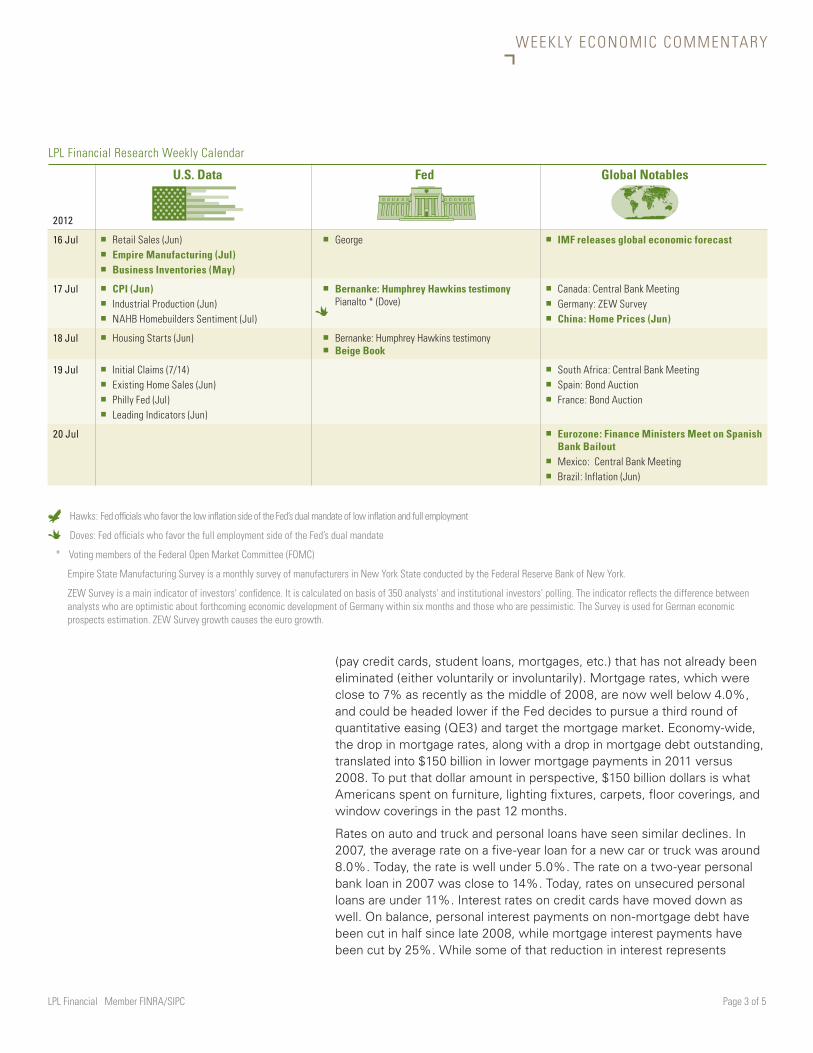
LPL Financial Research Weekly Calendar
U.S. Data
2012
16 Jul � Retail Sales (Jun) � Empire Manufacturing (Jul) � Business Inventories (May)
� George � IMF releases global economic forecast
17 Jul � CPI (Jun) � Industrial Production (Jun) � NAHB Homebuilders Sentiment (Jul)
� Bernanke: Humphrey Hawkins testimony Pianalto * (Dove)
� Canada: Central Bank Meeting � Germany: ZEW Survey � China: Home Prices (Jun)
18 Jul � Housing Starts (Jun) � �
Bernanke: Humphrey Hawkins testimony Beige Book
19 Jul � Initial Claims (7/14) � Existing Home Sales (Jun) � Philly Fed (Jul) � Leading Indicators (Jun)
� South Africa: Central Bank Meeting � Spain: Bond Auction � France: Bond Auction
20 Jul � Eurozone: Finance Ministers Meet on Spanish Bank Bailout
� Mexico: Central Bank Meeting � Brazil: Inflation (Jun)
Hawks: Fed officials who favor the low inflation side of the Fed’s dual mandate of low inflation and full employment
Doves: Fed officials who favor the full employment side of the Fed’s dual mandate
* Voting members of the Federal Open Market Committee (FOMC)
Empire State Manufacturing Survey is a monthly survey of manufacturers in New York State conducted by the Federal Reserve Bank of New York.
ZEW Survey is a main indicator of investors' confidence. It is calculated on basis of 350 analysts' and institutional investors' polling. The indicator reflects the difference between analysts who are optimistic about forthcoming economic development of Germany within six months and those who are pessimistic. The Survey is used for German economic prospects estimation. ZEW Survey growth causes the euro growth.
LPL Financial Member FINRA/SIPC Page 4 of 5
WEEKLY ECONOMIC COMMENTARY
“involuntary” reduction in principle (on mortgages, credit cards, personal loans,etc.), the drop in rates has certainly eased the cost of servicing debt, and sped up the process of consumer balance sheet repair.
The cost of servicing the debt is captured in the nearby figure on the financial obligations ratio, or FOR. The FOR is an estimate of the ratio of financial obligations payments to disposable personal income. The FOR includes automobile lease payments, rental payments on tenant-occupied property, homeowners' insurance, and property tax payments. From a peak of near 19% in late 2008/early 2009, the FOR has fallen to 16%, the lowest in 12 years, and very close to the all-time low of 15%, hit in the early 1980s.
The drop in the FOR reflects the big drop in consumer interest rates (discussed above), along with the modest drop in overall debt levels (nearby figure) which has come about both voluntarily (consumers consciously paying down consumer, housing, and credit card debt) and involuntarily (bankruptcy, foreclosure, etc.). The nearby figure on overall debt levels relative to personal income paints a slightly more dire picture, showing that while debt-to-income levels have moved lower since 2008, and are at the lowest level in more than 10 years, they remain well above their long-term average.
What’s Next?The truth about consumers’ financial health lies somewhere between still-elevated debt levels, the debt-to-income ratio,and the FOR. As the economy continues to recover, consumers will continue to spend a little, save a little,and pay down debt, as they have been doing for four years now. As this process continues to unfold, the implications for the broader economy include a slower-than-normal pace of spending, and increased caution in taking on new debt. However, it does appear that most of the hard work, at least on the consumer front, may be behind us. With personal debt levels moving (slowly) in right direction and corporate debt levels well contained (a topic for a future Weekly Economy Commentary), markets and policymakers are now likely to turn their attention to government debt levels (mainly federal but state and local as well) over the remainder of 2012 and into 2013. �
LPL Financial Research 2012 Forecasts � GDP 2%*
� Federal Funds Rate 0%^
� Private Payrolls +200K/mo.†
Please see our 2012 Outlook for more details on LPL Financial Research forecasts.
WEEKLY ECONOMIC COMMENTARY
Member FINRA/SIPCPage 5 of 5
RES 3772 0712Tracking #1-084092 (Exp. 07/13)
Not FDIC/NCUA Insured | Not Bank/Credit Union Guaranteed | May Lose Value | Not Guaranteed by any Government Agency | Not a Bank/Credit Union Deposit
This research material has been prepared by LPL Financial.
To the extent you are receiving investment advice from a separately registered independent investment advisor, please note that LPL Financial is not an affiliate of and makes no representation with respect to such entity.
IMPORTANT DISCLOSURES The opinions voiced in this material are for general information only and are not intended to provide specific advice or recommendations for any individual. To determine which investment(s) may be appropriate for you, consult your financial advisor prior to investing. All performance reference is historical and is no guarantee of future results. All indices are unmanaged and cannot be invested into directly.
* Gross Domestic Product (GDP) is the monetary value of all the finished goods and services produced within a country's borders in a specific time period, though GDP is usually calculated on an annual basis. It includes all of private and public consumption, government outlays, investments and exports less imports that occur within a defined territory.
^ Federal Funds Rate is the interest rate at which depository institutions actively trade balances held at the Federal Reserve, called federal funds, with each other, usually overnight, on an uncollateralized basis.
† Private Sector – the total nonfarm payroll accounts for approximately 80% of the workers who produce the entire gross domestic product of the United States. The nonfarm payroll statistic is reported monthly, on the first Friday of the month, and is used to assist government policy makers and economists determine the current state of the economy and predict future levels of economic activity. It doesn’t include: - general government employees - private household employees - employees of nonprofit organizations that provide assistance to individuals - farm employees
The economic forecasts set forth in the presentation may not develop as predicted and there can be no guarantee that strategies promoted will be successful.
Chinese Purchasing Managers Index: The PMI includes a package of indices to measure manufacturing sector performance. A reading above 50 percent indicates economic expansion, while that below 50 percent indicates contraction.
Leading indicator: An economic indicator that changes before the economy has changed. Examples of leading indicators include production workweek, building permits, unemployment insurance claims, money supply, inventory changes, and stock prices. The Fed watches many of these indicators as it decides what to do about interest rates.
The Consumer Price Index (CPI) is a measure of the average change over time in the prices paid by urban consumers for a market basket of consumer goods and services.
International investing involves special risks, such as currency fluctuation and political instability, and may not be suitable for all investors.
Quantitative Easing is a government monetary policy occasionally used to increase the money supply by buying government securities or other securities from the market. Quantitative easing increases the money supply by flooding financial institutions with capital in an effort to promote increased lending and liquidity.
Empire State Manufacturing Survey is a monthly survey of manufacturers in New York State conducted by the Federal Reserve Bank of New York. The Federal Open Market Committee action known as Operation Twist began in 1961. The intent was to flatten the yield curve in order to promote capital inflows and strengthen the dollar. The Fed utilized open market operations to shorten the maturity of public debt in the open market. The action has subsequently been reexamined in isolation and found to have been more effective than originally thought. As a result of this reappraisal, similar action has been suggested as an alternative to quantitative easing by central banks.
The Federal Open Market Committee (FOMC), a committee within the Federal Reserve System, is charged under the United States law with overseeing the nation’s open market operations (i.e., the Fed’s buying and selling of United States Treasure securities).
Member FINRA/SIPCPage 1 of 2
Jeffrey Kleintop, CFAChief Market Strategist LPL Financial
LPL F INANCIAL RESEARCH
Weekly Market CommentaryJuly 16, 2012
Giving Credit
HighlightsCertainly, too much debt is a bad thing for anyone. But too little can be equally disastrous. Tight credit and an unwillingness to borrow in Europe is exacerbating that region’s recession.
Bank lending data in China is beginning to accelerate, and in the United States lending is now growing at a normal pace.
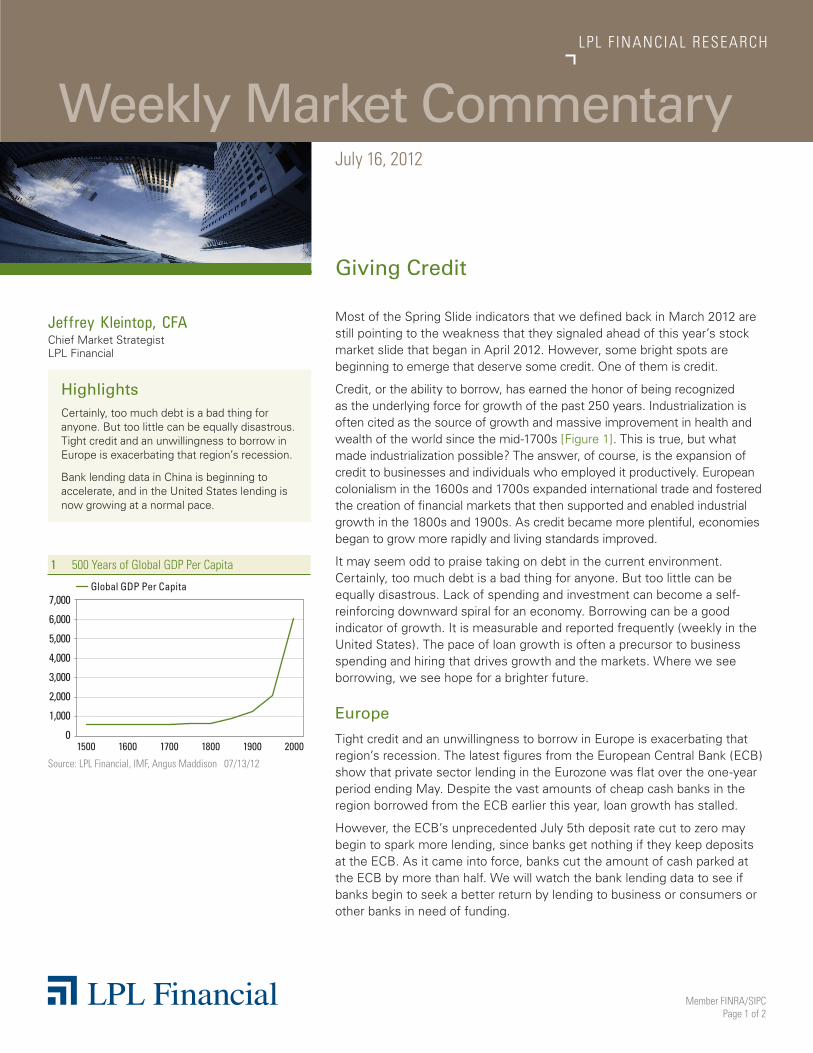
Most of the Spring Slide indicators that we defined back in March 2012 are still pointing to the weakness that they signaled ahead of this year’s stock market slide that began in April 2012. However, some bright spots are beginning to emerge that deserve some credit. One of them is credit.
Credit, or the ability to borrow, has earned the honor of being recognized as the underlying force for growth of the past 250 years. Industrialization is often cited as the source of growth and massive improvement in health and wealth of the world since the mid-1700s [Figure 1]. This is true, but what made industrialization possible? The answer, of course, is the expansion of credit to businesses and individuals who employed it productively. European colonialism in the 1600s and 1700s expanded international trade and fostered the creation of financial markets that then supported and enabled industrial growth in the 1800s and 1900s. As credit became more plentiful, economies began to grow more rapidly and living standards improved.
It may seem odd to praise taking on debt in the current environment. Certainly, too much debt is a bad thing for anyone. But too little can be equally disastrous. Lack of spending and investment can become a self-reinforcing downward spiral for an economy. Borrowing can be a good indicator of growth. It is measurable and reported frequently (weekly in the United States). The pace of loan growth is often a precursor to business spending and hiring that drives growth and the markets. Where we see borrowing, we see hope for a brighter future.
Europe
Tight credit and an unwillingness to borrow in Europe is exacerbating that region’s recession. The latest figures from the European Central Bank (ECB) show that private sector lending in the Eurozone was flat over the one-year period ending May. Despite the vast amounts of cheap cash banks in the region borrowed from the ECB earlier this year, loan growth has stalled.
However, the ECB’s unprecedented July 5th deposit rate cut to zero may begin to spark more lending, since banks get nothing if they keep deposits at the ECB. As it came into force, banks cut the amount of cash parked at the ECB by more than half. We will watch the bank lending data to see if banks begin to seek a better return by lending to business or consumers or other banks in need of funding.
1 500 Years of Global GDP Per Capita
Source: LPL Financial, IMF, Angus Maddison 07/13/12
19001800170016001500 2000
7,000
6,000
5,000
4,000
3,000
2,000
1,000
0
Global GDP Per Capita
WEEKLY MARKET COMMENTARY
Member FINRA/SIPCPage 2 of 2
RES 3771 0712Tracking #1-084042 (Exp. 07/13)
Not FDIC or NCUA/NCUSIF Insured | No Bank or Credit Union Guarantee | May Lose Value | Not Guaranteed by any Government Agency | Not a Bank/Credit Union Deposit
This research material has been prepared by LPL Financial.
To the extent you are receiving investment advice from a separately registered independent investment advisor, please note that LPL Financial is not an affiliate of and makes no representation with respect to such entity.
China
Bank lending data in China is beginning to accelerate, showing that the rate cuts may be starting to take effect at changing the trajectory of economic growth. China’s total bank lending rose in June, following the government’s recent easing of monetary policy to reverse the economic slowdown. Bank lending in June was up 45% from a year ago and above expectations.
The People’s Bank of China cut interest rates for the second time (on July 5, 2012) in less than a month, seeking to make loans more affordable to businesses.
(Please see today’s Weekly Economic Commentary for more details on credit in China and the United States.)
United States
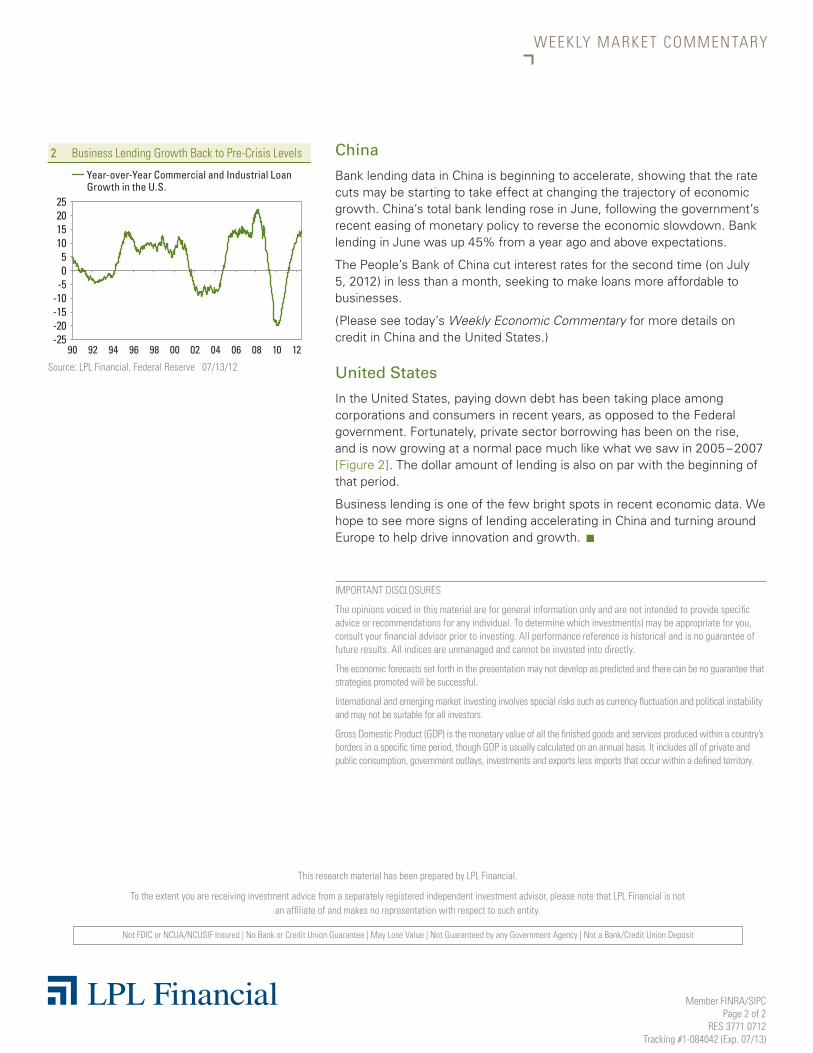
In the United States, paying down debt has been taking place among corporations and consumers in recent years, as opposed to the Federal government. Fortunately, private sector borrowing has been on the rise, and is now growing at a normal pace much like what we saw in 2005 – 2007 [Figure 2]. The dollar amount of lending is also on par with the beginning of that period.
Business lending is one of the few bright spots in recent economic data. We hope to see more signs of lending accelerating in China and turning around Europe to help drive innovation and growth. n
2 Business Lending Growth Back to Pre-Crisis Levels
Source: LPL Financial, Federal Reserve 07/13/12
080400 06029894 969290 1210
2520151050
-5-10-15-20-25
Year-over-Year Commercial and Industrial Loan Growth in the U.S.
IMPORTANT DISCLOSURES
The opinions voiced in this material are for general information only and are not intended to provide specific advice or recommendations for any individual. To determine which investment(s) may be appropriate for you, consult your financial advisor prior to investing. All performance reference is historical and is no guarantee of future results. All indices are unmanaged and cannot be invested into directly.
The economic forecasts set forth in the presentation may not develop as predicted and there can be no guarantee that strategies promoted will be successful.
International and emerging market investing involves special risks such as currency fluctuation and political instability and may not be suitable for all investors.
Gross Domestic Product (GDP) is the monetary value of all the finished goods and services produced within a country’s borders in a specific time period, though GDP is usually calculated on an annual basis. It includes all of private and public consumption, government outlays, investments and exports less imports that occur within a defined territory.