MANUAL ON SEA LEVEL MEASUREMENT AND · PDF fileLEVELLING 24 4.1 Geodetic Fixing ... Sea Level...
52
MANUAL ON SEA LEVEL MEASUREMENT AND INTERPRETATION Volume II - Emerging Technologies Manuals and Guides 14 Intergovernmental Oceanographic Commission 1994 UNESCO
-
Upload
duongnguyet -
Category
Documents
-
view
218 -
download
0
Transcript of MANUAL ON SEA LEVEL MEASUREMENT AND · PDF fileLEVELLING 24 4.1 Geodetic Fixing ... Sea Level...
1
MANUAL ON SEA LEVELMEASUREMENT AND INTERPRETATIONVolume II - Emerging Technologies
Manuals and Guides 14IntergovernmentalOceanographicCommission
1994 UNESCO
i
CONTENTS
Page
1. INTRODUCTION 1
2. TIDE GAUGES 3
2.1 Stilling Well Gauges 3
2.2 Datum Probes 3
2.3 Acoustic Tide Gauges 4
2.4 Pressure Sensors 7
2.5 Precise Datum Control for Pressure Tide Gauges 13
3. DATA TRANSMISSION 20
3.1 Data links for tide gauges 20
3.2 Satellite data links 21
4. LEVELLING 24
4.1 Geodetic Fixing of Tide Gauges 24
4.2 Global Positioning System 26
4.3 Absolute Gravity Measurements 26
5. DATA PROCESSING 29
5.1 PC Based Software 29
6. SEA LEVEL CENTRES 32
6.1 TOGA Sea Level Centre 34
6.2 WOCE Sea Level Data Assembly Centres 34
6.3 The Permanent Service for Mean Sea Level (PSMSL) 37
7. TRAINING COURSES 41
8. APPENDICES 42
Appendix 1. List of Suppliers 42
Appendix 2. Contact names and addresses 44
Appendix 3. Abbreviations and Acronyms 49
1
1. INTRODUCTION
In 1985 the Intergovernmental Oceanographic Commission (IOC) published its Manual onSea Level Measurement and Interpretation (Manuals and Guides No. 14 UNESCO). This newpublication is complementary to the previous version, extending and updating the material onmeasurements. Several detailed reviews of interpretation of sea level data have beenpublished since 1985, e.g. IPCC 1990.
The introduction to the 1985 Manual recognised the importance of climate change as aninfluence on sea levels, but failed to anticipate the dramatic increase in both scientific andpopular interest in sea level as a result of the anticipated "greenhouse" global climatewarming. In their report (1990) the Intergovernmental Panel on Climate Change (IPCC)predicted sea level rises of 18cms by 2030 and of 66cms by 2100 (These have since beenrevised slightly downwards - see Wigley and Raper, 1992). The IPCC also showed thatchanging sea level could be of great economic and social significance for coastal areas.These conclusions were reinforced by the Second World Climate Conference (Jager andFerguson 1990). In response to the concern about climate change, the World MeteorologicalOrganisation has established a Global Climate Observing System (GCOS) to be developed bythe joint efforts of World Meteorological Organisation (WMO), IOC, International Council ofScientific Unions (ICSU) and United Nations Environment Programmes (UNEP). Theoceanographic component of this will be provided by the Global Ocean ObservingSystem (GOOS) under the auspices of the IOC in collaboration with WMO, ICSU and UNEP.This was confirmed at the 16th session of the IOC Assembly (resolution XVI-8). The IOCGlobal Sea Level Observing System (GLOSS) will be an important component of the totalGlobal Ocean Observing System (IOC, 1990 GLOSS Implementation Plan).
The response to these demands by the sea level measuring community has been rapid andsubstantial. In many countries there have been significant developments in the methods ofmeasuring sea level and in the fixing of tide gauge benchmark in geocentric coordinates.Satellites are now measuring sea level by altimetry on a routine basis and it is increasinglynecessary to integrate these with the ground-based longer term sea level measurements. TheGLOSS basic network of some 300 stations has been consolidated, with many countriesestablishing national GLOSS committees for coordinating across agencies. The majoroceanographic programmes Tropical Ocean Global Atmosphere (TOGA) programme andWorld Ocean Circulation Experiment (WOCE) have given a new impetus to obtainingaccurate and widely distributed measurements.
At its second meeting in Miami (October 1990) the IOC Group of Experts on GLOSSrecognised these developments. Within the GLOSS programme, workshops have been heldon measurements of sea level in hazardous regions (IOC reports 1988 and 1991). The Groupof Experts considered that the time was right for a revised manual which would contain theessence of the developments in a form accessible to people working on sea levelmeasurement and analysis. The draft Manual - II was reviewed by the IOC Group of Expertson GLOSS (October 1993). This second volume has been prepared under the editorship ofDavid Blackman of the Proudman Oceanographic Laboratory, Bidston Observatory, UK. TheIOC is grateful to him and to the other authors from the GLOSS Group of Experts for theircontributions.
D.T. Pugh Chairman IOC GLOSS Group of Experts
2
REFERENCES
Intergovernmental Oceanographic Commission (IOC). 1990. Global Sea Level ObservingSystem (GLOSS) implementation plan. Intergovernmental Oceanographic Commission,Technical Series, No. 35, 90pp.
Intergovernmental Oceanographic Commission (IOC). 1988. Workshop on sea-levelmeasurements in hostile conditions, Bidston, UK, 28-31 March 1988. Summary reportand submitted papers. Intergovernmental Oceanographic Commission, WorkshopReport, No. 54, 81pp.
Intergovernmental Oceanographic Commission (IOC). 1991. Workshop on sea-levelmeasurements in Antarctica, Leningrad, USSR, 28-31 May 1990. IntergovernmentalOceanographic Commission, Workshop Report, No. 69, 8pp. and annexes andWorkshop Report, No. 69 - Supplement "Submitted papers", 102pp.
Intergovernmental Oceanographic Commission (IOC). 1992. Joint IAPSO-IOC Workshop onsea-level measurements and quality control, Paris, 12-13 October 1992.Intergovernmental Oceanographic Commission, Workshop Report, No. 81, 166pp.
Jager, J. and Ferguson, H.L. 1990. Proceedings of the second World Climate Conference.Geneva, 29 Oct - 7 Nov 1990. In: Climate change: science, impacts and policy.Cambridge University Press. 578pp.
Wigley, T.M.L. and Raper, S.C.B., 1992. Indications for climate and sea level of revised IPCCscenarios. Nature, 357, 293-300.
3
2. TIDE GAUGES
The most common type of tide gauge used worldwide remains the stilling well float gauge.However, other technologies, such as bubbler pressure gauges, are now used routinely inmany countries. Acoustic techniques, which measuring the travel time of pulses reflectedfrom the air/sea interface with automatic compensation for variations in sound velocity, alsonow have improved performance. A number of stepped sensor techniques have beenattempted and new electronic and mechanical techniques have improved resolution,reliability and robustness (e.g. by Etrometa, see Appendix 1). Microwave and lasertechniques, measuring the travel time of pulses reflected from the air/sea interface, have beenused for wave measurements but are not yet sufficiently accurate for sea level measurements.In all types of system the long term stability in relating sea level measurements to a knownland datum can be improved by the use of effective and regular datum control.
2.1 STILLING WELL GAUGES
On a global basis, probably the most common type of tide gauge consists of a stilling wellcontaining a counterbalanced float. This technology was discussed extensively in Volume I ofthis Manual.
In this system the sea level is measured by determining the length of the float wire relative to alevel fixed to the bench marks. The advantages of this system are that it is relatively simple toinstall and operate, and that it provides a very direct measurement of the sea level. Thestilling well is not left completely open to the sea, but is vented via a small hole near thebottom of the well. This method of allowing water to enter the well provides a mechanicalfiltering of high frequency (notably surface gravity wave) variability. This venting methoddoes, however, introduce some dynamical errors and other problems, but careful design andoperation of these systems can partially deal with these effects (Shih & Baer 1991).
A "perfect" sea level gauge has not yet been achieved and all existing measurementtechniques can suffer from errors or instabilities which need to be carefully understood andcontrolled when the highest accuracy measurements are needed.
2.2 DATUM PROBES
The function of a datum probe or switch is to identify the time when the sea level is at a knownfixed level relative to the tide gauge datum. By relating this time to the tide gauge record anydatum error or offset in the record can be identified. With a chart recorder a mark can bemade automatically on the chart at the time the datum switch operates, indicating when thesea level rises or falls past the fixed switch level. At these times the recorded tidal levelshould be the level of the datum switch. If it is not then the tide gauge or recorder is in errorand an offset can be applied to the record to compensate for this error. Where a data loggingsystem is used the times of switching can be recorded in the data logger for subsequentinterpolation of the recorded levels to the times of switching.
Ideally the datum switch should be mounted at about mid-tidal level outside a stilling well.However direct exposure to waves and swell make it impractical to deal with the large
4
number of switchings and it is usually necessary to protect the switch within its own smallstilling enclosure. Careful design of this enclosure should minimise any errors introduced,particularly if use is only made of sea level crossings in calm conditions giving rise to onlysingle switchings. An acoustic type of switch has been found to be robust, reliable and tohave small hysteresis (e.g. Bestobell Mobrey, Appendix 1).
2.3 ACOUSTIC TIDE GAUGES
A number of acoustic tide gauges have been developed which depend on measuring thetravel time of acoustic pulses reflected vertically from the air/sea interface. This type ofmeasurement can be made in the open with the acoustic transducer mounted vertically abovethe sea surface, but in certain conditions the reflected signals may be lost. To ensurecontinuous, reliable operation the acoustic pulses are generally contained within a verticaltube or well which can provide some degree of surface stilling. Averaging of a number ofmeasurements will also have a stilling effect and give improved accuracy.
To accurately convert the time of travel of the acoustic pulses to sea level requires aknowledge of the velocity of sound between the acoustic transducer and the sea surface. Thevelocity of sound can vary significantly with changes in temperature and humidity (about0.17%/ºC) and some form of compensation is necessary for accurate sea level measurements.The simplest method is to continuously measure the air temperature at a point in the aircolumn and use this to calculate the sound velocity to be used. To account for temperaturegradients in the air column temperature sensors may be required at a number of differentlevels.
A more accurate method of compensation is by use of an acoustic reflector at a fixed level inthe air column. By relating the reflection from the sea surface to that from the fixed reflector,direct compensation for variations in sound velocity between the acoustic transducer and thefixed reflector can be achieved. However this still does not account for any variations insound velocity between the fixed reflector and the sea surface. To achieve full compensationwould require a number of fixed reflectors covering the full tidal range.
2.3.1 ACOUSTIC GAUGES WITH SOUNDING TUBES
The National Oceanic and Atmospheric Administration (NOAA), National OceanService (NOS) - (USA), has been involved in a multi-year implementation of a Next GenerationWater Level Measurement System (NGWLMS) within the US national tide gauge network andat selected global sites. At the present time (October 1992), 110 of the 189 stations of thenational network have these new systems, as do 22 NOAA Global Sea Level sites around theworld (Gill et al., 1992). The new systems are being operated alongside the presentanalogue-to-digital (ADR) gauges at all stations for a minimum period of one year to providedatum ties to and data continuity with the historical time series. Dual systems will bemaintained at a few stations for several years to provide long term comparison information.The same technology gauges have also been deployed in several other countries (e.g.Australia, see Lennon et al., 1992).
The NGWLMS tide gauge uses an Aquatrak water level sensor (Dartex Inc.) with a Sutrondata processing and transmission system. The Aquatrak sensor sends a shock wave of
5
6
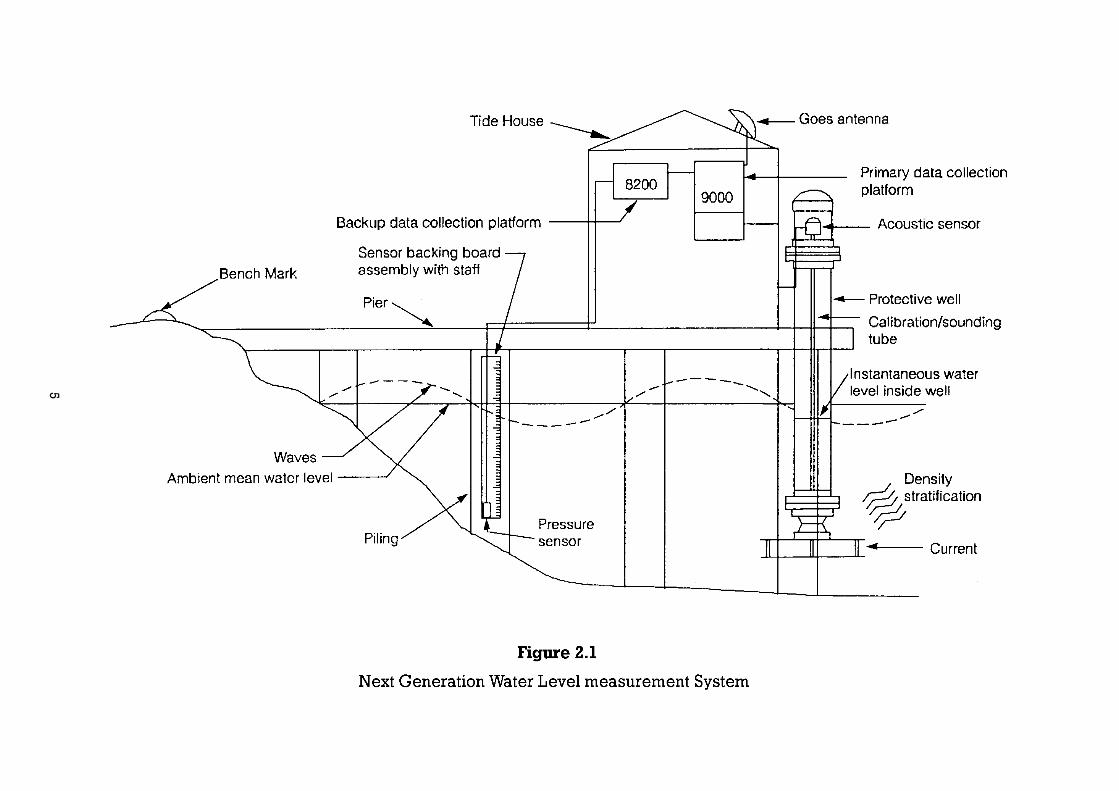
acoustic energy down a 1/2-inch diameter PVC sounding tube and measures the travel timefor the reflected signals from a calibration reference point and from the water surface. Twotemperature sensors give an indication of temperature gradients down the tube. Thecalibration reference allows the controller to adjust the measurements for variations in soundvelocity due to changes in temperature and humidity. The sensor controller performs thenecessary calculations to determine the distance to the water surface. The sounding tube ismounted inside a 6-inch diameter PVC protective well which has a symmetrical 2-inchdiameter double cone orifice. The protective well is more open to the local dynamics than thetraditional stilling well and does not filter much of the wind waves and chop. In areas of highvelocity tidal currents and high energy sea swell and waves, parallel plates are mountedbelow the orifice to reduce the pull down effects (Shih and Baer, 1991). Figure 2.1 is aschematic of a typical NGWLMS installation. To obtain the best accuracy the acoustic sensoris calibrated by reference to a stainless steel tube of certified length, and the zero offset isdetermined.
The NGWLMS also has the capability of handling up to 11 different ancillary oceanographicand meteorological sensors. The field units are programmed to take measurements at 6-minute intervals with each measurement consisting of 181 one-second interval water levelsamples centred on each tenth of an hour. Software rejects outliers etc. and measurementshave typically 0.01 foot resolution. Data are transmitted via telephone or satellite connections.
Papers by Gill and Mero (1990a, 1990b) and Gill et al. (1992) describe the acoustic sensorcalibration methods and temperature gradient induced errors, while Gill et al. (1992), Lennonet al. (1992) and Vassie et al. (1992) present comparisons between NGWLMS andconventional (stilling well or bubbler) systems in the USA, Australia and the UK. For example,US comparisons (Gill et al., 1992) between NGWLMS and ADR data have shown smalldifferences, on the order of millimetres, for the various tidal and datum parameters, which aregenerally within the uncertainty of the instrumentation. Such differences are very small whencompared to typical tidal ranges and even seasonal and interannual sea level variations. Thedifferences in mean sea level from the two systems are being looked at more closely in orderto ensure no long term bias. Much work remains to be done on the long termintercomparisons between technologies.
2.3.2 ACOUSTIC GAUGES WITHOUT SOUNDING TUBES
An instrument manufactured by MORS Environment uses a 41.5 KHz transducer with a beamwidth of 5º which can be operated in an existing stilling well or in the open. A temperaturesensor in the air column is used to compensate for variations in the velocity of sound, and themeasurement range is between 0.6 and 15 metres.
A similar instrument by Sonar Research and Development has been developed whichoperates at 50 KHz with a beamwidth of 4º. It can be operated in the open or in a plastic tubeof about 25cm diameter. Compensation for variation in the velocity of sound is achieved byuse of a bar reflector mounted 75cm from the acoustic transducer. An accuracy of 0.05% isclaimed over a range of 15 metres.
For both these systems, datum control needs to be verified externally e.g. by long periodictide pole checks.
7
2.4 PRESSURE SENSORS
The principle of all pressure systems is to measure the hydrostatic pressure of the watercolumn at a fixed point and convert that pressure into a level.
2.4.1 PNEUMATIC BUBBLER SYSTEMS
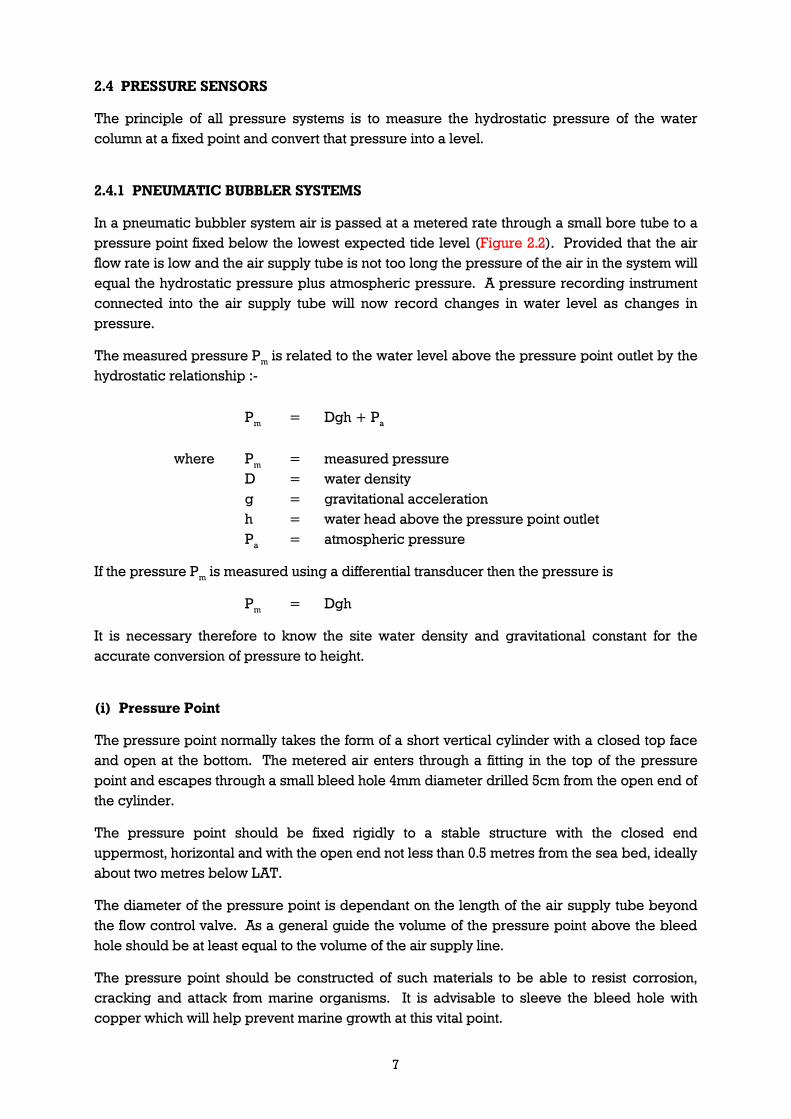
In a pneumatic bubbler system air is passed at a metered rate through a small bore tube to apressure point fixed below the lowest expected tide level (Figure 2.2). Provided that the airflow rate is low and the air supply tube is not too long the pressure of the air in the system willequal the hydrostatic pressure plus atmospheric pressure. A pressure recording instrumentconnected into the air supply tube will now record changes in water level as changes inpressure.
The measured pressure Pm is related to the water level above the pressure point outlet by thehydrostatic relationship :-
Pm = Dgh + Pa
where Pm = measured pressureD = water densityg = gravitational accelerationh = water head above the pressure point outletPa = atmospheric pressure
If the pressure Pm is measured using a differential transducer then the pressure is
Pm = Dgh
It is necessary therefore to know the site water density and gravitational constant for theaccurate conversion of pressure to height.
(i) Pressure Point
The pressure point normally takes the form of a short vertical cylinder with a closed top faceand open at the bottom. The metered air enters through a fitting in the top of the pressurepoint and escapes through a small bleed hole 4mm diameter drilled 5cm from the open end ofthe cylinder.
The pressure point should be fixed rigidly to a stable structure with the closed enduppermost, horizontal and with the open end not less than 0.5 metres from the sea bed, ideallyabout two metres below LAT.
The diameter of the pressure point is dependant on the length of the air supply tube beyondthe flow control valve. As a general guide the volume of the pressure point above the bleedhole should be at least equal to the volume of the air supply line.
The pressure point should be constructed of such materials to be able to resist corrosion,cracking and attack from marine organisms. It is advisable to sleeve the bleed hole withcopper which will help prevent marine growth at this vital point.
8
9
(ii) Air Supply Tube
The tube supplying air to the pressure point should be of a corrosion free non-kinkingmaterial. Nylon tube within a protective sheath should be used. Tubing with an outsidediameter of 6mm and a bore of 4mm is recommended for systems with tube length up to200 metres.
As the air enters the pressure point it becomes compressed and pushes the water down untilit reaches the bleed hole where it escapes and bubbles up to the surface.
The tubing should be protected where necessary by laying it in conduit, sheathing or metalcasing. It should be securely fixed to withstand the most severe weather conditions. Wheretubing is laid along piers, quays or wharfs it must be positioned so as to avoid abrasivescuffing from vessels and mooring lines.
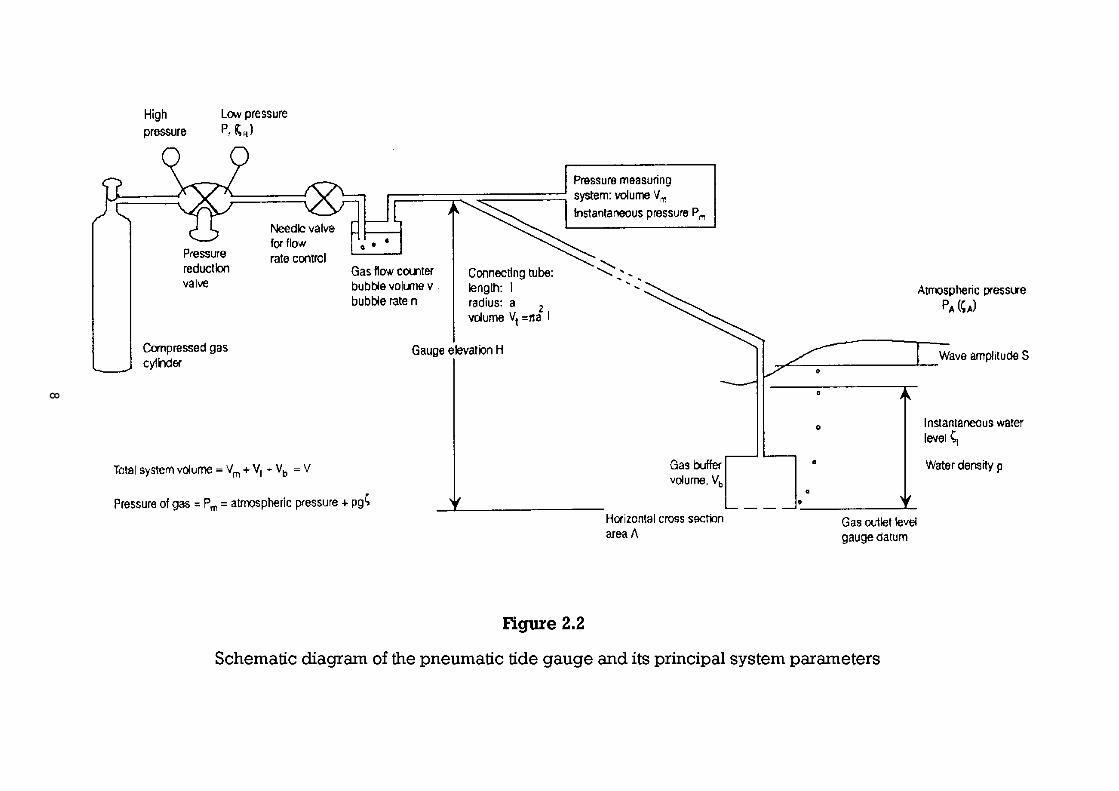
(iii) Pneumatic Controls
The pneumatic control panel should be designed to provide :-
a) Air to the pressure point metered at a constant and controllable rate.
b) The ability to purge the system with air at a very high flow rate.
c) Protection against over pressurisation for the controls and instruments.
The diagram (Figure 2.3) shows a typical circuit for a pneumatic control panel incorporatingthese features.
Figure 2.3Schematic diagram of control equipment
10
The air supply may be derived from high pressure air bottles or a compressor. Where acompressor is used the air receiver should be large enough to provide a supply for five daysin the event of compressor breakdown or failure of the electricity supply.
The air must be passed through moisture and particle filters before being regulated to supplya constant pressure of between 3 to 4 bars. A pressure gauge should be fitted to the unit toindicate this pressure. A relief valve is required to prevent the pressure downstream of thisregulator exceeding 5 bars.
A flow control valve and indicator operating from the supply pressure is required to meter airto the pressure point. The flow rate required is dependant on the tidal range and the volumeof the system but must be sufficient to maintain a flow of bubbles from the pressure point onthe fastest rising tide.
Tappings for the tidal recording instruments are taken from a point on the supply to thepressure point downstream of the flow control valve. A pressure gauge should beincorporated to indicate this downstream pressure. A relief valve must be incorporated toprotect the instruments from overpressurising.
A purging system is required to enable an unrestricted air flow to pass from the supply to thepressure point. During purging the instrument must be isolated from the supply.
It is essential that all pneumatic valves, connectors and fittings used in the construction of thepneumatic panel are of the highest quality since any leakage in the system downstream of theflow control valve will produce an error in the indicated system pressure. Leakage elsewherein the system will increase the volume of air consumed which can be critical when the air issupplied from high pressure air cylinders.
(iv) Design Criteria for Pneumatic Bubbler Systems
Care must be exercised in the design of pneumatic systems in order to minimise errors inmeasurement. Where sources of error cannot be eliminated their effect must be known sothat corrections can be applied to the measured pressures. The major criteria are listedbelow together with equations from which the magnitude of measuring errors can bededuced.
(v) Minimum Gas Flow Rate
Gas must be passed into the bubbler system at a rate that is sufficient to maintain the systempressure equal to the water pressure at the pressure point at the fastest rising tide, so that thebleed hole emits bubbles at all times.
f > V Rmax (ml/sec)10
where f = gas flow rate
V = total volume of system (ml)
Rmax = max rate of rise in water level (m/sec)
11
(vi) Static Pressure Head
For all designs the measuring point will be at higher elevation than the pressure point outlet.Consequently the pressure of the gas in the system will differ at the two points in accordancewith the difference in elevation and the gas pressure :-
Pm = ( ρ - Poa ( H + 1 ) ) gh
γA
where Pm = measured pressure
ρ = water density
Poa = air density at atmospheric pressure
H = elevation of measuring point above pressure point outlet
γA = water level equivalent of atmospheric pressure
h = depth of water above pressure point outlet
g = gravitational acceleration
(vii) Dynamic Pressure Gradient
When gas is passed through a tube a pressure gradient along the tube will result due to thegas viscosity, the magnitude of the pressure drop being dependent on tube dimensions andgas flow rate in the following relationship :-
∆P = 8ηl ( f - ∆Pm ( Vm + Π a2 l ) ) Πa2 Pm 2
where ∆P = pressure drop
η = gas viscosity at system temperature
l = length of tube
a = radius of tube
f = gas flow rate
∆Pm = incremental change in Pm in unit time
Pm = instantaneous pressure at measuring device
Vm = volume of measuring device
In most designs of pressure transducer Vm is very small and can be ignored; the relation thenbecomes :-
∆P = 8ηl ( f - ∆Pm Π a2 l ) Πa2 2Pm
12
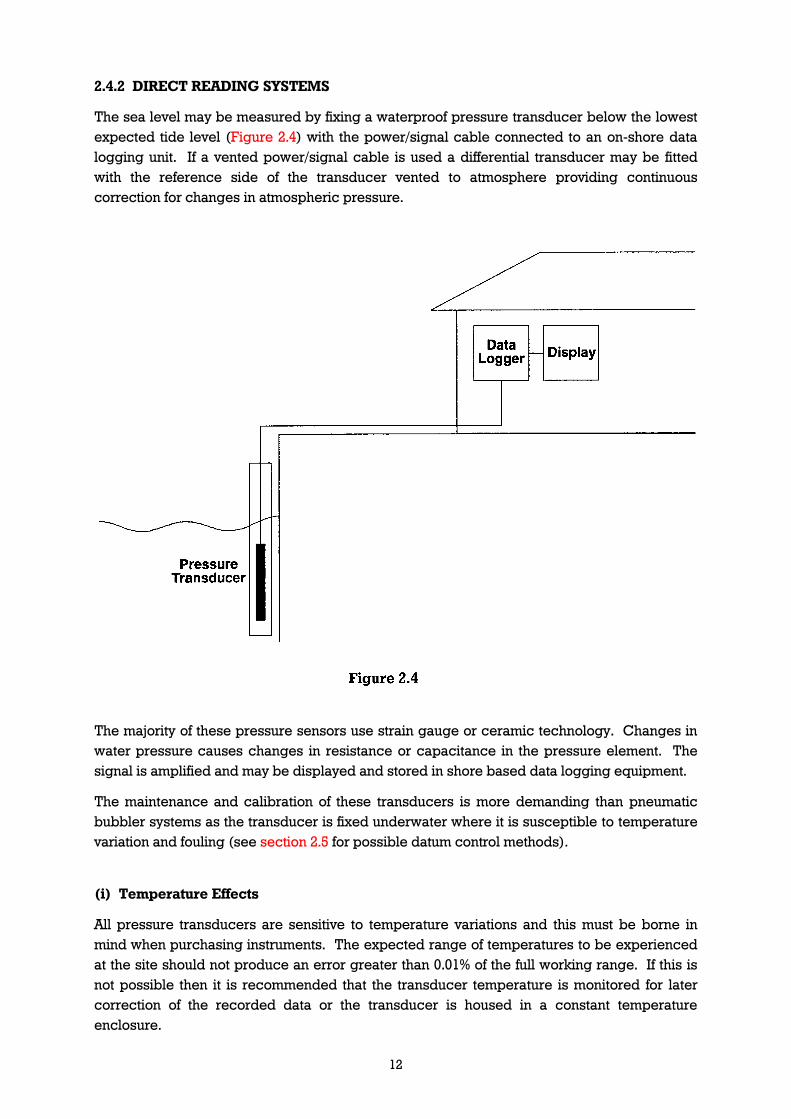
2.4.2 DIRECT READING SYSTEMS
The sea level may be measured by fixing a waterproof pressure transducer below the lowestexpected tide level (Figure 2.4) with the power/signal cable connected to an on-shore datalogging unit. If a vented power/signal cable is used a differential transducer may be fittedwith the reference side of the transducer vented to atmosphere providing continuouscorrection for changes in atmospheric pressure.
The majority of these pressure sensors use strain gauge or ceramic technology. Changes inwater pressure causes changes in resistance or capacitance in the pressure element. Thesignal is amplified and may be displayed and stored in shore based data logging equipment.
The maintenance and calibration of these transducers is more demanding than pneumaticbubbler systems as the transducer is fixed underwater where it is susceptible to temperaturevariation and fouling (see section 2.5 for possible datum control methods).
(i) Temperature Effects
All pressure transducers are sensitive to temperature variations and this must be borne inmind when purchasing instruments. The expected range of temperatures to be experiencedat the site should not produce an error greater than 0.01% of the full working range. If this isnot possible then it is recommended that the transducer temperature is monitored for latercorrection of the recorded data or the transducer is housed in a constant temperatureenclosure.

13
(ii) Pressure Systems Datum
The datum of a pneumatic system is the elevation of the pressure point bleed hole. The datumof a transducer mounted underwater is the sensor diaphragm or pressure cell.
2.4.3 HOSTILE CONDITIONS
All systems must be built and installed to withstand the severest weather conditions withprotection against damage from vessels and flotsam.
(i) Effect of Waves
Surface waves will produce a rapid cyclic change in pressure in a bubbler system. The errorso produced is dependent on wave amplitude in the following relation
E = V S
A Po
where E = error
V = total system volume
A = horizontal cross sectional area of pressure point
S = pressure amplitude of short period wave
Po = water head pressure at outlet below trough of a wave
In general the average error will not exceed 0.05% of the wave amplitude.
(ii) Effect of Currents
Areas of strong currents should be avoided when siting bubbler measuring systems. Thepresence of a pressure point in the tidal current will distort the velocity field, so that thepressure sensed cannot be interpreted simply as the undisturbed hydrostatic pressure.Depending on whether the bleed hole faces into or away from the current the measuredpressure will be greater or less than the hydrostatic pressure. If a pressure point has to befixed in strong currents it should be positioned so that the bleed hole is tangential to the maincurrent flow to minimise the error.
(iii) Density Variations
Since the water levels measured by pressure systems are a function of the water pressure atthe pressure point outlet, variations in the water density can lead to errors in both bubbler anddirect reading systems. Such density variations are most pronounced at sites situated close toor on river estuaries. If an estuarine site must be used, specific gravity measurements shouldbe taken and corrections applied.
2.5 PRECISE DATUM CONTROL FOR PRESSURE TIDE GAUGES
Many different types of tide gauge are now in use around the world. These include traditionalfloat and stilling well gauges (Noye, 1974a, b, c; IOC, 1985; Pugh, 1987), acoustic gauges (Gilland Mero, 1990a) and gauges based on the principle of measuring sub-surface pressure(Pugh, 1972). Pressure tide gauges are more convenient to use than others, especially in
14
environmentally hostile areas, but their data are often difficult to relate to a land datum tobetter than a few centimetres. Methods used at present to impose a datum on pressure timeseries include simultaneous measurements at a nearby stilling well; tide poles or stilling tubesand observers; water level switches in mini-stilling wells; and the use of comparators, orprecisely calibrated reference pressure devices. Each of these has drawbacks.
The stilling well method probably produces usable results, as long as comparisons areperformed over several complete tidal cycles to remove the effect of any lag in the well.However, a stilling well will not always be present and it will have its own systematic errorsources (Lennon, 1971). A tide pole is very tedious for the observer and is useful only for firstorder checks in calm conditions. Switches show great promise and it is possible that reliableswitch systems may eventually be developed. However, present ones do not entirelyeliminate the effect of waves, even given the mini-stilling wells, and they are probablyaccurate to only a few centimetres, which is not good enough for long term recording. Theyalso tend to foul in the dirty water often present in harbours. Finally, although the comparatorsused routinely by the UK Tide Gauge Inspectorate (UK TGI) appear to provide datum controlof centimetre accuracy or better, they do not provide a near-continuous datum check, areclumsy to operate and are not well documented (Committee on Tide Gauges, 1986).
Pressure tide gauges already comprise a major subset of those in the Global Sea LevelObserving System (GLOSS) network (IOC, 1990) and provide the best form of instrumentationfor extending the network to environmentally hostile areas (IOC, 1988). Therefore, it is clearthat a simple method is required to provide precise and near-continuous datum control to thetime series from pressure gauges.
A method has been developed at the Proudman Oceanographic Laboratory (POL) for theprecise datum control of sea level records from pressure tide gauges. By means of anadditional pressure point at approximately mean sea level, it has been found that an effectivetemporal discrimination of the sea level record can be used to impose a datum upon itself.Two experiments, one based on bubbler gauge technology and one on pressure transducersinstalled directly in the sea, have demonstrated that the method is capable of providingmillimetric precision datum control.
2.5.1 A BRIEF DESCRIPTION OF THE METHOD
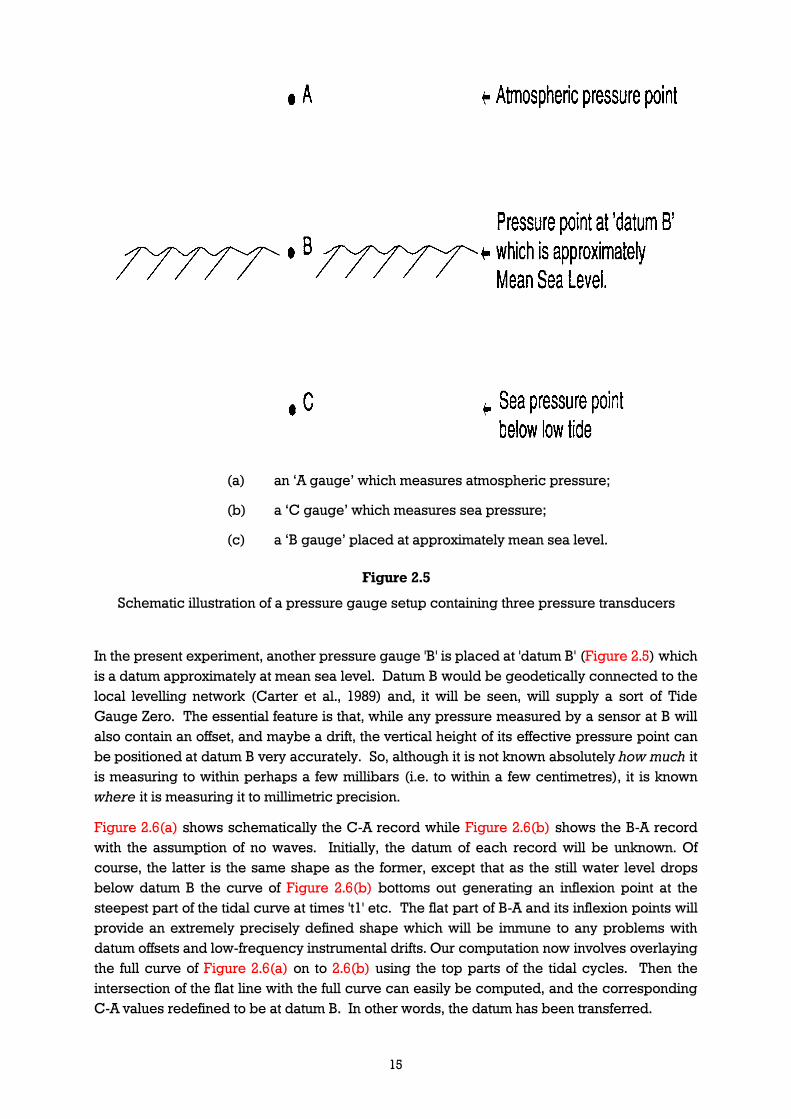
A schematic pressure gauge setup is shown in Figure 2.5 with a pressure sensor in thewater ('C') and another in the atmosphere ('A'). Around the UK national tide gauge network(called the 'A Class' network), the pressure difference C-A is usually recorded in a singlechannel of a differential transducer connected to a bubbler gauge (Pugh, 1972). At the SouthAtlantic sites of POL's ACCLAIM (Antarctic Circumpolar Current Levels by Altimetry andIsland Measurements) network, C and A are separate absolute transducer channels (Spenceret al., 1993). In both cases, Paroscientific digiquartz sensors are employed (Banaszek, 1985).It is the difference C-A which gives sea level, after sea water density correction, and whichmust be constrained to a land datum. In practice, both C and A, or their difference, maymeasure pressure changes extremely well, but it would be common for their data to containuncalibrated offset pressures and small low-frequency drifts specific to each individualpressure transducer. In addition, other parts of the apparatus may also introduce biases anddrifts (e.g. through insufficient gas flow in a bubbler gauge) or the ocean itself may drift (i.e.through density changes).
15
In the present experiment, another pressure gauge 'B' is placed at 'datum B' (Figure 2.5) whichis a datum approximately at mean sea level. Datum B would be geodetically connected to thelocal levelling network (Carter et al., 1989) and, it will be seen, will supply a sort of TideGauge Zero. The essential feature is that, while any pressure measured by a sensor at B willalso contain an offset, and maybe a drift, the vertical height of its effective pressure point canbe positioned at datum B very accurately. So, although it is not known absolutely how much itis measuring to within perhaps a few millibars (i.e. to within a few centimetres), it is knownwhere it is measuring it to millimetric precision.
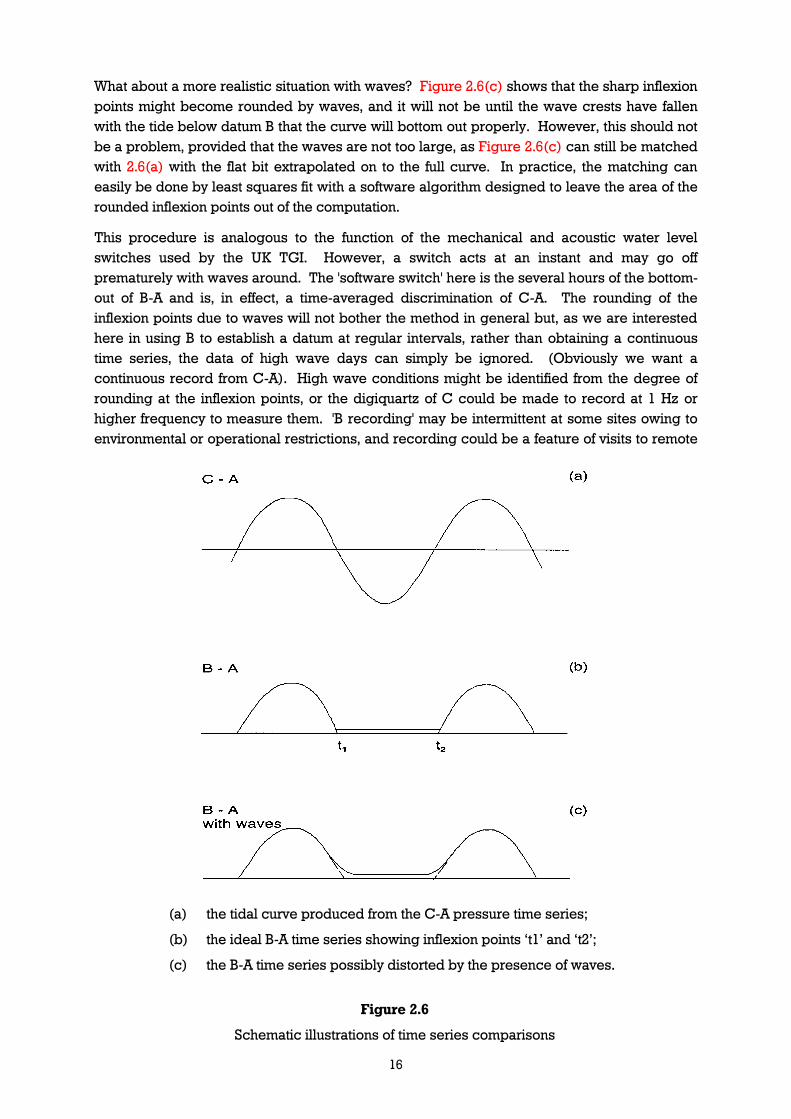
Figure 2.6(a) shows schematically the C-A record while Figure 2.6(b) shows the B-A recordwith the assumption of no waves. Initially, the datum of each record will be unknown. Ofcourse, the latter is the same shape as the former, except that as the still water level dropsbelow datum B the curve of Figure 2.6(b) bottoms out generating an inflexion point at thesteepest part of the tidal curve at times 't1' etc. The flat part of B-A and its inflexion points willprovide an extremely precisely defined shape which will be immune to any problems withdatum offsets and low-frequency instrumental drifts. Our computation now involves overlayingthe full curve of Figure 2.6(a) on to 2.6(b) using the top parts of the tidal cycles. Then theintersection of the flat line with the full curve can easily be computed, and the correspondingC-A values redefined to be at datum B. In other words, the datum has been transferred.
(a) an ‘A gauge’ which measures atmospheric pressure;
(b) a ‘C gauge’ which measures sea pressure;
(c) a ‘B gauge’ placed at approximately mean sea level.
Figure 2.5
Schematic illustration of a pressure gauge setup containing three pressure transducers
16
What about a more realistic situation with waves? Figure 2.6(c) shows that the sharp inflexionpoints might become rounded by waves, and it will not be until the wave crests have fallenwith the tide below datum B that the curve will bottom out properly. However, this should notbe a problem, provided that the waves are not too large, as Figure 2.6(c) can still be matchedwith 2.6(a) with the flat bit extrapolated on to the full curve. In practice, the matching caneasily be done by least squares fit with a software algorithm designed to leave the area of therounded inflexion points out of the computation.
This procedure is analogous to the function of the mechanical and acoustic water levelswitches used by the UK TGI. However, a switch acts at an instant and may go offprematurely with waves around. The 'software switch' here is the several hours of the bottom-out of B-A and is, in effect, a time-averaged discrimination of C-A. The rounding of theinflexion points due to waves will not bother the method in general but, as we are interestedhere in using B to establish a datum at regular intervals, rather than obtaining a continuoustime series, the data of high wave days can simply be ignored. (Obviously we want acontinuous record from C-A). High wave conditions might be identified from the degree ofrounding at the inflexion points, or the digiquartz of C could be made to record at 1 Hz orhigher frequency to measure them. 'B recording' may be intermittent at some sites owing toenvironmental or operational restrictions, and recording could be a feature of visits to remote
(a) the tidal curve produced from the C-A pressure time series;
(b) the ideal B-A time series showing inflexion points ‘t1’ and ‘t2’;
(c) the B-A time series possibly distorted by the presence of waves.
Figure 2.6
Schematic illustrations of time series comparisons
17
islands or summer stays at polar bases. In our experience, such a procedure might beadequate to provide long term datum control to a continuous C-A record, as long as good (i.e.previously tested, relatively stable) transducers were used and the visits were at least onceevery year. However, where possible, it would be desirable to have the B sensor installedpermanently as there is great appeal in being able to check the datum with every low tide(i.e. twice a day in most places).
In order to work properly, the method obviously needs a sizable tidal range so that B will behalf the time in water and half the time in air. It will not work in lakes or microtidal areas butmost coastal and many island sites have usable tidal ranges, even if only at springs. Clearly,'tide' here means any real signal. 'Surge' will do quite as well as long as the same signal isobserved in the top halves of B-A and C-A to enable them to match up. The method does notrequire the actual installed height of C or A to be known. Where it is difficult to install a fixedgauge C below the water, because of shallow gradients perhaps, then a pop-up, or bottommounted and diver replaced gauge, could be used. Example locations where this mightapply include the Tropical Atlantic, where POL and French groups have operated suchgauges for several years, and Heard and Macquarie Islands, where the University of Flindershas made similar measurements. In fact, the height of A should be kept constant, with itsreadings compared regularly to a precise barometer, but that is for meteorological datapurposes, not tide gauge considerations.
What do we expect the accuracy of the method to be? That depends on how flat thebottoming-out of B-A is. If completely flat, the method is theoretically perfect but there will besystematic errors depending on the hardware. Fifteen minute or higher frequency samplingwould be better than hourly heights in order to clearly resolve the inflexion points but,whatever the sampling, it is important for A, B and C to record pressure simultaneously and ina similar fashion.
To summarise, the most important feature of the method is its ability to impose a datum as afunction of time and its ability to handle slow drifts in any, or all, of the A, B and C transducers.As any drifts will manifest themselves as changes in the vertical conversion factor to imposethe curve of Figure 2.6(b) on to that of Figure 2.6(a), they can be continuously adjusted for byconstant constraint of C-A to the B datum imposed by the least squares adjustment.
2.5.2 EXPERIMENTAL RESULTS
In brief, the method has been shown to work well in two experiments at Holyhead (where themean tidal range is 3.6m) using both bubbler and digiquartz-in-the-sea systems. An internalPOL report (Smith et al., 1991), from which the above sections were extracted, gives furtherdetails and has been circulated to members of the GLOSS Experts group and to a number oftide gauge authorities. Additional copies may be obtained from the Permanent Service forMean Sea Level (PSMSL).
Since the 1991 Holyhead experiments, purpose built equipment based on the same principlehas been constructed for the digiquartz-in-the-sea technique for use at South Atlantic siteswhere the mean range is typically 1 metre. It is intended that these will be operating at leasttwo sites in the second half of 1992. Some of the 'A Class' bubblers around the UK will also bemodified along these lines. POL would be interested in working with any group which mightbe interested in jointly developing this technique.
18
REFERENCES
Banaszek, A.D., 1985. Procedures and problems associated with the calibration and use ofpressure sensors for sea level measurements. In, Advances in underwater technologyand offshore engineering, 4, 103-127. (London: Graham and Trotman).
Carter, W.E., Aubrey, D.G., Baker, T.F., Boucher, C., Le Provost, C., Pugh, D.T., Peltier, W.R.,Zumberge, M., Rapp, R.H., Schutz, R.E., Emery, K.O. and Enfield, D.B, 1989. Geodeticfixing of tide gauge bench marks. Woods Hole Oceanographic Institution TechnicalReport WHOI-89-31, 44pp.
Committee on Tide Gauges. 1986. Tide Gauge Requirements. Ministry of AgricultureFisheries and Food.
Gill, S.K. and Mero, T.N. 1990a. Next generation water level measurement system: implementation into the NOAA National Water Level Observation Network.pp.133-146in, Towards an integrated system for measuring long term changes in global sea level,(ed. H.F. Eden). (Report of a workshop held Woods Hole Oceanographic Institution,May 1990). Washington, DC.: Joint Oceanographic Institutions Inc. (JOI). 178pp. &appendix.
Gill, S.K. and Mero, T.N. 1990b. Preliminary comparisons of NOAA's new and old water levelmeasurement system. pp 172-180 in Oceans '90, New York: IEEE, 604pp.
Gill, S.K., Mero, T.N. and Parker, B.B. 1992. NOAA operational experience with acoustic sealevel measurement. pp.13-25 in, IOC Workshop Report No. 81, Joint IAPSO-IOCworkshop on sea level measurements and quality control. IntergovernmentalOceanographic Commission, Paris.
Intergovernmental Oceanographic Commission (IOC). 1985. Manual on sea levelmeasurement and interpretation. Intergovernmental Oceanographic Commission,Manuals and Guides, No. 14, 83pp.
Intergovernmental Oceanographic Commission (IOC). 1988 Workshop on sea-levelmeasurements in hostile conditions, Bidston, UK, 28-31 March 1988. Summary reportand submitted papers. Intergovernmental Oceanographic Commission, WorkshopReport No. 54, 81pp.
Intergovernmental Oceanographic Commission (IOC). 1990. Global Sea Level ObservingSystem (GLOSS) implementation plan. Intergovernmental Oceanographic Commission,Technical Series, No. 35, 90pp.
Lennon, G.W. 1971. Sea level instrumentation, its limitations and the optimisation of theperformance of conventional gauges in Great Britain. International HydrographicReview, 48(2), 129-147.
Lennon, G.W., Woodland, M.J. and Suskin, A.A. 1992. Acoustic sea level measurements inAustralia. pp.26-39 in, IOC Workshop Report No.81, Joint IAPSO-IOC workshop on sealevel measurements and quality control. Intergovernmental OceanographicCommission, Paris.
19
Noye, B.J. 1974a. Tide-well systems I: some non-linear effects of the conventional tide well.Journal of Marine Research, 32(2), 129-135.
Noye, B.J. 1974b. Tide-well systems II: the frequency response of a linear tide-well system.Journal of Marine Research, 32(2), 155-181.
Noye, B.J. 1974c. Tide-well systems III: improved interpretation of tide-well records. Journal ofMarine Research, 32(2), 193-194.
Pugh, D.T. 1972. The physics of pneumatic tide gauges. International Hydrographic Review,49(2), 71-97.
Pugh, D.T. 1987. Tides, surges and mean sea-level: a handbook for engineers and scientists.Chichester: John Wiley and Sons, 472pp.
Shih, H.H. and Baer, L. 1991. Some errors in tide measurement caused by dynamicenvironment. In Tidal Hydrodynamics (editor Bruce B. Parker) pp 641-671.
Smith, D.E., Spencer, R., Vassie, J.M. and Woodworth, P.L. 1991. Precise datum control forpressure sea level records. POL Internal Document.
Spencer, R., Foden, P.R., McGarry, C., Harrison, A.J., Vassie, J.M., Baker, T.F., Smithson, M.J.,Harangozo, S.A., and Woodworth, P.L. 1993. The ACCLAIM programme in the SouthAtlantic and Southern Oceans. International Hydrographic Review, 70, 7-21.
Vassie, J.M., Woodworth, P.L., Smith, D.E. and Spencer, R. 1992. Comparison of NGWLMS,bubbler and float gauges at Holyhead. pp 40-51 in, IOC Workshop Report No.81, JointIAPSO-IOC workshop on sea level measurements and quality control.Intergovernmental Oceanographic Commission, Paris.
20
3. DATA TRANSMISSION
3.1 DATA LINKS FOR TIDE GAUGES
Sea level data measured and recorded at a tide gauge installation is frequently required foruse at some other location. The method of data transmission used depends very much on thetime response required, and the distance involved. Time scales can vary from almostinstantaneous information to a one year record or longer, and the distance scales from a fewhundred metres to thousands of kilometres.
For long time scales it is possible to physically transfer the tide gauge record over anydistance, but for shorter time scales it may be necessary to transfer the data in the form ofelectrical signals. This can be done by telephone line, either dedicated or through the publicswitched telephone network (PSTN), by direct radio link, by satellite link, or by a combinationof these.
For example, if instantaneous data is required then a dedicated telephone line, or direct radiolink is needed. The PSTN can be used as a very near real time link, and the slight risk of anunobtainable line can usually be accommodated in many applications.
All data links from tide gauge installations require the measurement taken to be converted toan electrical form which can be processed to provide a digital measurement in millimetresabove a Chart Datum. For example, in a float operated gauge, the float wire pulley shaft canbe used to drive a shaft encoder or potentiometer to give an electrical signal with a linearrelation to sea level. The scaling of this signal can be set by the gearing ratio used and thedatum can be set by adjustment of the gear meshing. In a pressure operated tide gauge thepressure transducer used may have a non-linear electrical output which has to be conditionedelectronically to give a suitable linear output related to Chart Datum. The parameters used inthis conditioning have to be derived from laboratory calibration of the pressure transducercharacteristics, and the value of sea water density used.
Apart from the case where an instantaneous measurement is required, the transducer outputshould be integrated over the period between data samples in order to filter out any shorterterm variations in sea level. A suitable sampling period for tidal and longer period sea levelvariations is fifteen minutes. These fifteen minute averaged values should be time tagged andstored in a solid state buffer memory. The memory should be large enough to store all of thedata measured during the longest anticipated period between interrogations.
Complex equipments of this type use microprocessors to control and implement theprocesses and calculations required. This allows the system to be quite flexible and toaccommodate a number of different sensors and interrogation requirements. Informationabout the status and condition of the equipment can be transmitted along with the sea levelmeasurements, so that faults can be quickly rectified to minimise loss of data. The time atwhich the sea level reaches a fixed datum switch can also be recorded and transmitted sothat the gauge datum can be checked during each tidal cycle.
Less complex, purpose built equipments have been used for particular applications. Oneexample is the system used by the UK Storm Tide Warning Service (STWS) at Bracknell toobtain real time data from a number of the permanent tide gauge installations on the East
21
Coast of the United Kingdom. In this system the output from potentiometers on float gauges iscontinuously digitised and transmitted along dedicated telephone lines to Bracknell whererecords are made and compared with predictions on chart recorders. The system can alsotransmit and record a signal when the sea level makes contact with a datum probe (Bestobell)at a known vertical position.
A number of systems have been designed for use by Water Authorities to allow aninstantaneous measurement to be transmitted using the PSTN. Some of these systems areinterrogated manually and others use special decoding and recording equipment which canalso be used with automatic dialling facilities. Other systems have been developed usingradio links to obtain and record data at a central station, either on demand or on a continuousbasis.
For the United Kingdom national network of permanent tide gauge installations a centraliseddata recording and monitoring system called DATARING has been developed using thePSTN (Rae 1988). This system uses a microprocessor at each installation to process andcontrol data from a number of different sensors and inputs. The processed data are stored ina buffer memory awaiting interrogation. At the main control station a desk top computercontrols the automatic dialling of each tide gauge installation at regular intervals, and also thechecking and transfer of the data in each buffer memory into the computer memory. Theclocks at each installation are automatically checked and corrected by reference to a masterclock, and information about the operation of the equipment at each site is flagged so thatcorrective action can be quickly taken if necessary. Data are transferred to a main computerwhere further check procedures are carried out on the data before it is processed and storedby the British Oceanographic Data Centre (BODC) in preparation for tidal analysis. Otherusers such as the Storm Tide Warning Service and the Water Authorities can access any of thetide gauge sites independently through the PSTN using a small computer and telephonemodem.
Within the framework of the IGOSS sea-level programme in the Pacific (ISLP-Pac) theSpecialised Oceanographic Centre (SOC) for ISLP-Pac (Honolulu, USA) collects sea-leveldata in near real time via cable, telex, telephone and satellite from 92 Pacific sea levelstations.
3.2 SATELLITE DATA LINKS
Data from very remote or inaccessible tide gauge installations or from widespread national orinternational tide gauge networks can be transmitted by geostationary or orbiting satellitesystems. A number of suitable satellite systems are available for use, including ARGOS, GOES(METEOSAT, GMS), and INMARSAT, each having different characteristics.
The ARGOS system operates worldwide using two NOAA sun-synchronous low polar orbitingsatellites with a period of 101 minutes. A platform transmitter terminal (PTT) has a datacapacity of 256 bits per satellite pass and, depending on location there may be a delay of upto several hours before data is available to users through the French Space Agency (CNES)Toulouse Space Centre. The number of accessible satellite passes to be expected is latitudedependent, varying from about 7 per day at the equator to 28 per day at the poles.
22
GOES-E (USA), GOES-W (USA), METEOSAT (Europe), and GMS (Japan) are equatorialgeostationary satellites which together offer compatible worldwide coverage, except forlatitudes greater than about 75º. Each data collection platform (DCP) is allocated fixed twominute time slots during which 649 bytes of data can be transmitted to a satellite. Up to onetime slot per hour can be allocated to each DCP, so that if necessary data could be availableto users within about one hour of measurement.
INMARSAT Standard-C also uses equatorial geostationary satellites to give worldwidecoverage except for latitudes greater than about 75º. This system allows two way datacommunication in near real-time at a rate of 600 bits per second, with a data message up to256 Kbytes.
As part of the World Ocean Climate Experiment (WOCE) a number of sea level stations havebeen established on islands in the South Atlantic, at Ascension, St. Helena, Tristan da Cunha,Falklands and Signy. At each station sea pressure (Paroscientific, Digiquartz), seatemperature and barometric pressure are continuously recorded and in addition hourlyaveraged values of these parameters are transmitted twice per day through the METEOSATsystem using an Applied Satellite Technology transmitter. These data are retransmitted fromthe European Organisation for the Exploitation of Meteorological Satellites (EUMETSAT)receiving centre on the Global Telecommunications System (GTS) to the UK MeteorologicalOffice. From there they are retransmitted by telex to a computer at the ProudmanOceanographic Laboratory (POL) where they are processed prior to input to the BritishOceanographic Data Centre (Palin and Rae 1987).
Many of the sea level stations installed on the Pacific and Atlantic coasts of the USA and onislands in the Pacific Ocean transmit data to the GOES-E and GOES-W satellites. These dataare received at the National Environmental Satellite and Data Information Service (NESDIS)facility at Wallops Island, Virginia, from where they are retransmitted to the NESDIS CentralData Distribution Facility (CDDF) at Camp Springs, Maryland. Appropriate data are thenrouted to the Tropical Ocean Global Atmosphere (TOGA) Sea Level Centre and the PacificTsunami Warning Centre (PTWC) in Hawaii, and to the National Ocean Service (NOS) of theNational Oceanic and Atmospheric Administration (NOAA) at Rockville, Maryland. Data cannormally be available within a few minutes of being received from a DCP.
Satellite transmitting sea level gauges which are part of the Pacific Island network (Wyrtki etal., 1988) use Handar Multiple Access Data Acquisition Modules. Input to these units isnormally derived from two independent stilling well and float gauges (Fisher and Porter,Leupold and Stevens) or from a float gauge and a sea pressure transducer (Robinson-Halpern, Honeywell). Installations which are part of the NOS Next Generation Water LevelMeasurement System (NGWLMS, Mero and Stoney 1988) use Sutron 9000 Remote TerminalUnits. The primary sea level sensor used is an Aquatrak Model 3000 air acoustic water levelsensor (Bartex), with a back-up sea pressure transducer (Druck).
Data transmission through ARGOS, METEOSAT and GOES satellites may now be arrangedthrough Collecte Localisation Satellites (CLS). Addresses of the suppliers of the equipmentand services referred to are given in Appendix 1.
23
REFERENCES
Mero, T.N. and Stoney, W.M. 1988. A description of the National Ocean Service NextGeneration Water Level Measurement System. Proceedings of the Third BiennialNational Ocean Service International Hydrographic Conference, Baltimore, Maryland;April 12-15, 1988.
Palin, R.I.R. and Rae, J.B. 1987. Data transmission and acquisition systems for shore-basedsea-level measurements. pp 1-6 in, 5th International Conference on Electronics forOcean Technology, Heriot-Watt University, Edinburgh, 24-26 March 1987. London:Institution of Electronic and Radio Engineers. 223pp. (Institution of Electronic and RadioEngineers Publication No. 72).
Rae, J.B. 1988. Centralised data collection and monitoring systems for coastal tide gaugemeasurements. pp 19-25 in, Tidal measurement and instrumentation. Papers presentedat the Hydrographic Society Seminar, April 1987, London, (ed. J.A. Kitching). Dagenham,Essex: Hydrographic Society. 35pp. (Hydrographic Society Special Publication No. 19).
Wyrtki, K., Caldwell, P., Constantine, K., Kilonsky, B.J., Mitchum, G.T., Mizamoto, B., Murphy,T. and Nakahara, S., 1988. The Pacific Island Sea Level Network. University of Hawaii,JIMAR 88-0137, Data Report 002, 71pp.
24
4. LEVELLING
4.1 GEODETIC FIXING OF TIDE GAUGES
The first Manual on Sea Level Measurements and Interpretation (pages 21 to 29) describeshow sea level measurements are related to a nearby bench mark called the tide gauge benchmark (TGBM). This should be a round headed bolt either in bedrock or a substantialstructure such as a quay wall. The first manual also describes how the TGBM should beregularly connected by spirit levelling to a local network of bench marks extending over oneor two kilometres to check the stability of the TGBM. This ensures that the relative sea levelmeasured by the tide gauge is not only relative to the TGBM but is also representative of thesurrounding area. The manual also states that the bench marks should be connected to thenational levelling network so that their elevations are given with respect to the nationallevelling datum point.
First order geodetic spirit levelling is accurate to 1 or 2mm over distances of a few kilometresand therefore annual relevellings are very suitable for detecting any vertical movements of theTGBM with respect to the local benchmarks. However, spirit levelling over very longdistances has been found to be influenced by significant systematic errors. The long distanceconnections to the national datum point, therefore, only give a nominal height for the tidegauge and are not normally useful for determining the crustal movements at the tide gauge,which are usually only a few millimetres per year. Due to these systematic errors, nationalrelevellings or readjustments of previous levellings can give spurious apparent changes in theheight of the TGBM. This is the reason that the PSMSL requires mean sea level data definedwith respect to the TGBM rather than with respect to the national datum point.
Over the past few years, advances in modern geodetic techniques have given new methodsfor geodetic fixing of tide gauge bench marks. These are the techniques of space geodesyand absolute gravity. The space geodesy measurements can be used to geocentrically fix theTGBM and therefore the mean sea level at the tide gauge will be defined in a globalgeocentric reference frame. This will therefore give an absolute mean sea level, rather thanmean sea level relative to each local TGBM. The sea level is then defined in the samegeocentric reference frame that is used for satellite altimetry and can therefore be directlycompared with the altimetric sea levels.
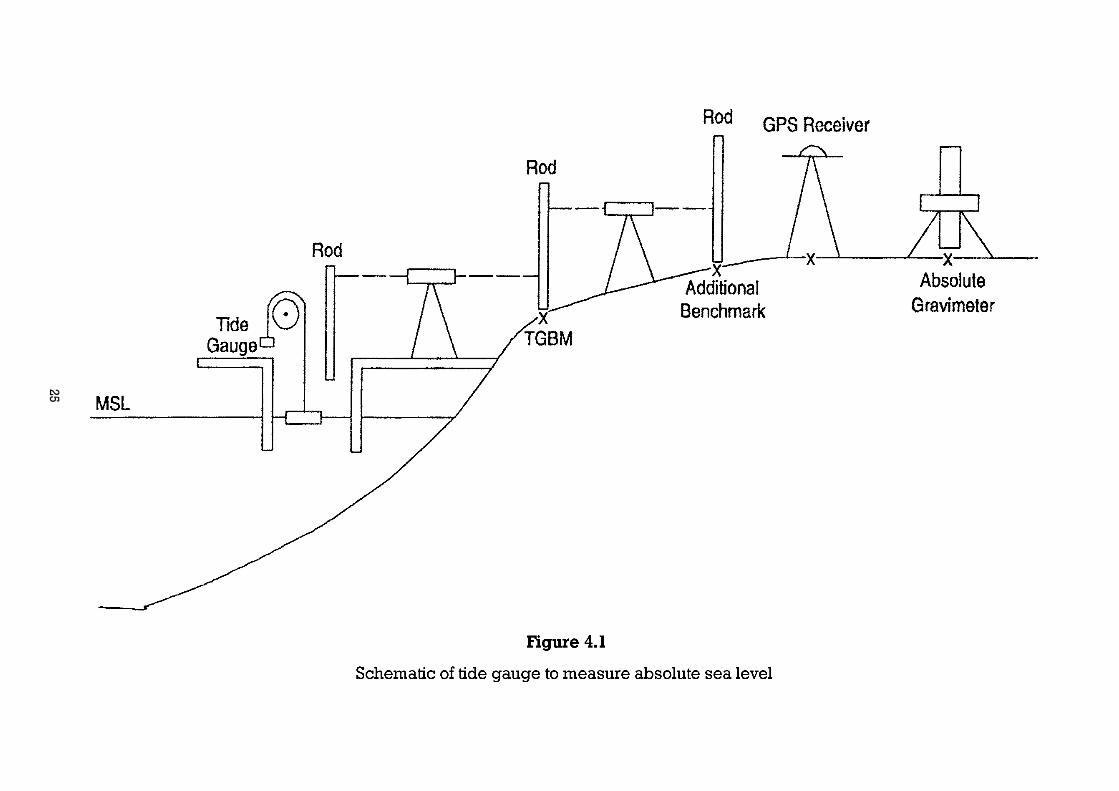
Repeated space geodesy measurements at the tide gauge, (for example, annually for adecade or so), will enable the vertical crustal movement to be determined and removed fromthe mean sea level trend to give the true sea level trend due to climatic influences. Measuringchanges of gravity near the tide gauge using an absolute gravimeter allows a completelyindependent determination of the vertical crustal movements. Figure 4.1 shows a schematicdiagram of a tide gauge system to measure absolute sea levels.
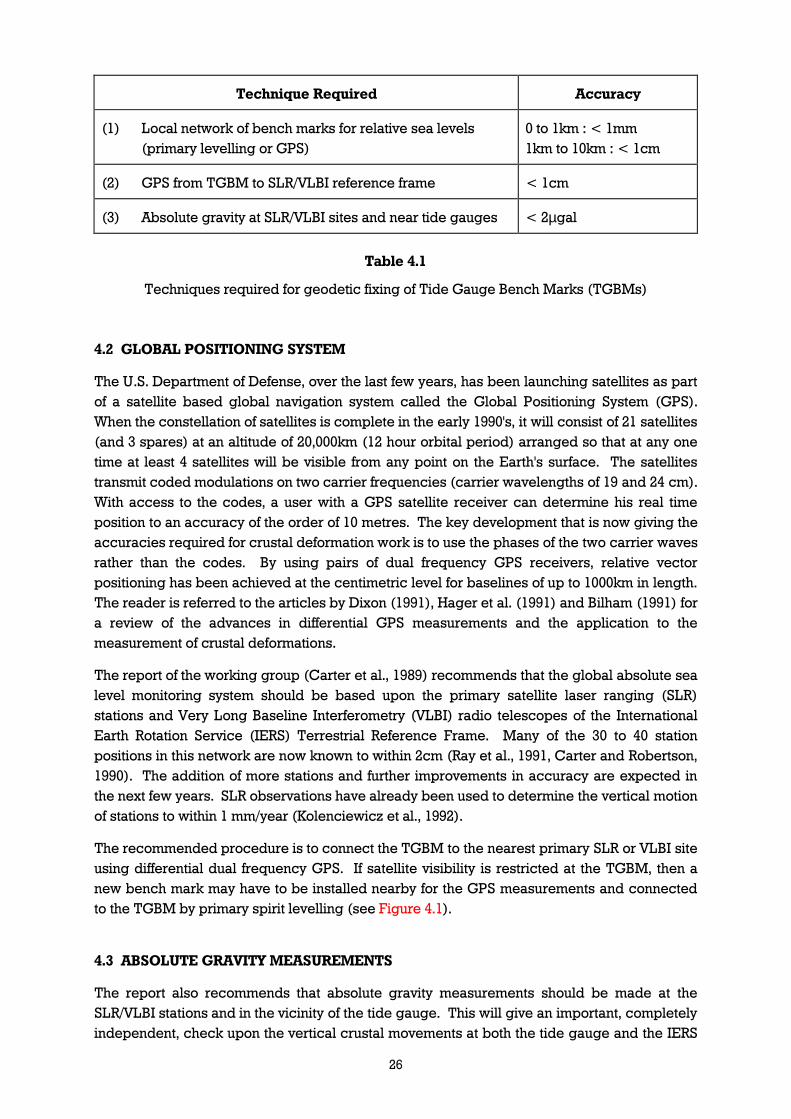
An international working group was set up by the International Association for the PhysicalSciences of the Ocean under its Commission on Mean Sea Level and Tides to recommend astrategy for the geodetic fixing of tide gauge bench marks (Carter et al., 1989). The followingsections briefly describe the methods that are now recommended. The reader is referred toCarter et al., 1989 for further details. Table 4.1 summarises the accuracies required for thevarious measurements.
25
26
Technique Required Accuracy
(1) Local network of bench marks for relative sea levels(primary levelling or GPS)
0 to 1km : < 1mm1km to 10km : < 1cm
(2) GPS from TGBM to SLR/VLBI reference frame < 1cm
(3) Absolute gravity at SLR/VLBI sites and near tide gauges < 2µgal
Table 4.1
Techniques required for geodetic fixing of Tide Gauge Bench Marks (TGBMs)
4.2 GLOBAL POSITIONING SYSTEM
The U.S. Department of Defense, over the last few years, has been launching satellites as partof a satellite based global navigation system called the Global Positioning System (GPS).When the constellation of satellites is complete in the early 1990's, it will consist of 21 satellites(and 3 spares) at an altitude of 20,000km (12 hour orbital period) arranged so that at any onetime at least 4 satellites will be visible from any point on the Earth's surface. The satellitestransmit coded modulations on two carrier frequencies (carrier wavelengths of 19 and 24 cm).With access to the codes, a user with a GPS satellite receiver can determine his real timeposition to an accuracy of the order of 10 metres. The key development that is now giving theaccuracies required for crustal deformation work is to use the phases of the two carrier wavesrather than the codes. By using pairs of dual frequency GPS receivers, relative vectorpositioning has been achieved at the centimetric level for baselines of up to 1000km in length.The reader is referred to the articles by Dixon (1991), Hager et al. (1991) and Bilham (1991) fora review of the advances in differential GPS measurements and the application to themeasurement of crustal deformations.
The report of the working group (Carter et al., 1989) recommends that the global absolute sealevel monitoring system should be based upon the primary satellite laser ranging (SLR)stations and Very Long Baseline Interferometry (VLBI) radio telescopes of the InternationalEarth Rotation Service (IERS) Terrestrial Reference Frame. Many of the 30 to 40 stationpositions in this network are now known to within 2cm (Ray et al., 1991, Carter and Robertson,1990). The addition of more stations and further improvements in accuracy are expected inthe next few years. SLR observations have already been used to determine the vertical motionof stations to within 1 mm/year (Kolenciewicz et al., 1992).
The recommended procedure is to connect the TGBM to the nearest primary SLR or VLBI siteusing differential dual frequency GPS. If satellite visibility is restricted at the TGBM, then anew bench mark may have to be installed nearby for the GPS measurements and connectedto the TGBM by primary spirit levelling (see Figure 4.1).
4.3 ABSOLUTE GRAVITY MEASUREMENTS
The report also recommends that absolute gravity measurements should be made at theSLR/VLBI stations and in the vicinity of the tide gauge. This will give an important, completelyindependent, check upon the vertical crustal movements at both the tide gauge and the IERS
27
sites. At remote sites, such as on oceanic islands that are far removed from the VLBI/SLRstations, absolute gravity may be the only feasible method of determining the vertical crustalmovement at the tide gauge.
For a review of the recent advances in absolute gravimetry, the reader is referred to Marsonand Faller (1986) and Torge (1989). The principle of the absolute gravimeter is themeasurement of the acceleration of a mass in free fall (or rise and fall) in a vacuum using alaser length standard and a rubidium frequency time standard. The mass is a retro-reflectorwhich forms one arm of a Michelson laser interferometer. A lot of effort has been put intoreducing or eliminating various sources of systematic error. A great deal of experience hasbeen gained during the past few years using portable absolute gravimeters built by the JointInstitute of Laboratory Astrophysics (JILA), Boulder, Colorado (Torge et al., 1987, Peter et al.,1989, Lambert et al., 1989). The gravity value is obtained by making repeat drops over one ortwo days at each site and corrections are made for tides and atmospheric pressure variations.At good sites repeat visits show that a precision of about 2 µgals can be achieved. Theabsolute accuracy is harder to estimate but is believed to be about 6 µgals. After moredevelopments to reduce the errors still further, a new portable absolute gravimeter isavailable commercially from the AXIS Instruments Company, Boulder, Colorado (supercededby Micro g). The specifications for this instrument are a precision of ±1 µgal and an accuracyof ±2 µgals.
The gravity gradient in free air, at the Earth's surface, is 3 µgal/cm. In practice, for crustaldeformation work, since a large area of the Earth's surface is usually displacedsimultaneously, the measured gravity change is of the order of 2 µgal/cm. Thus, it can beseen that absolute gravity and space geodetic techniques are both approaching theequivalent accuracy of 1cm that is required for measuring vertical crustal movements.
In order to avoid the higher microseismic noise for gravity measurements immediatelyadjacent to the coastline, the report recommends that the absolute gravity measurementsshould be made at sites 1 to 10km inland. The gravity site (which is normally in a buildingwith reasonable temperature control) has also then to be connected to the TGBM by spiritlevelling or GPS. Inland sites also enable a higher accuracy to be achieved for the calculationof the ocean tide loading and attraction correction to the gravity measurements. However,measurements for a few months with a well calibrated continuously recording relativegravimeter should enable corrections to be made to a few tenths of a microgal at any distancefrom the coastline (Baker et al., 1991).
28
REFERENCES
Baker, T.F., Edge, R.J. and Jeffries, G., 1991. Tidal gravity and ocean tide loading in Europe.Geophysical Journal International, 107, 1-11.
Bilham, R., 1991. Earthquakes and sea level: space and terrestrial metrology on a changingplanet. Reviews of Geophysics, 29, 1-29.
Carter, W.E. and Robertson, D.S., 1990. Definition of a terrestrial reference frame using IRISVLBI observations: approaching millimetre accuracy. In: C. Boucher and G.A.Wilkins(Editors). Symposium, 105: Earth rotation and coordinate reference frames. Springer-Verlag, New York. pp 115-122.
Carter, W.E., Aubrey, D.G., Baker, T.F., Boucher, C., Le Provost, C., Pugh, D.T., Peltier, W.R.,Zumberge, M., Rapp, R.H., Schutz, R.E., Emery, K.O. and Enfield, D.B., 1989. Geodeticfixing of tide gauge bench marks. Woods Hole Oceanographic Institution TechnicalReport WHOI-89-31/CRC-89-5. Woods Hole Oceanographic Institution, Woods Hole,Mass. 02543, USA.
Dixon, T.H., 1991. An introduction to the Global Positioning System and some geologicalapplications. Review of Geophysics, 29, 249-276.
Hager, B.H., King. R.W. and Murray, M.H., 1991. Measurement of crustal deformation usingthe Global Positioning System. Annual Reviews of Earth and Planetary Sciences, 19,351-382.
Kolenkiewicz, R., Smith, D.E., Pavlis, E.C. and Torrence, M.H., 1992. Direct estimation ofvertical variations of satellite laser tracking sites from SL8 LAGEOS analysis. AnnalesGeophysicae, 10(1), 111.
Lambert, A., Liard, J.O., Courtier, N., Goodacre, A.K., McConnell, R.K. and Faller, J.E., 1989.Canadian absolute gravity programme: Applications in geodesy and geodynamics.EOS, 70, 1447-1460.
Marson, I. and Faller, J.E., 1986. g - the acceleration of gravity: its measurement and itsimportance. Journal of Physics E: Scientific Instruments, 19, 22-32.
Peter, G., Moose, R.E., Wessells, C.W., Faller, J.E. and Niebauer, T.M., 1989. High precisionabsolute gravity observations in the United States. Journal of Geophysical Research, 94,5659-5674.
Ray, J.R., Ma, C., Ryan, J.W., Clark, T.A., Eanes, R.J., Watkins, M.M., Schutz, B.E. and Tapley,B.D., 1991. Comparison of VLBI and SLR geocentric site coordinates. GeophysicalResearch Letters, 18, 231-234.
Torge, W., 1989. Gravimetry. W. de Gruyter, Berlin, 465pp.
Torge, W., R`der, R.H., Schnhll, M., Wenzel, H.-G. and Faller, J.E., 1987. First results with thetransportable absolute gravity meter JILAG-3. Bulletin Geodesique, 61, 161-176.
29
5. DATA PROCESSING
In the 1985 IOC Manual, Section 4 on data reduction covered all aspects regarding theprocessing of chart/graphical records. A variety of typical problems were discussed andsolutions suggested. Whilst some of these problems were specific to chart records(e.g. continuity) the majority could equally well apply to the processing of digital records.
5.1 PC BASED SOFTWARE
The aim of data processing software should be to ensure the scientific validity of the data.Three main aspects should be considered :
a) linking of the data to a reference level e.g. permanent benchmark
b) timing; identification of missing scans etc.
c) correction of spikes and filling of short gaps
Many organisations have developed their own processing software to validate incoming datain varied formats and media and are specific to their requirements. However twoorganisations have developed PC based software as a contribution to GLOSS and otherprograms with the aim of enabling participating countries to be able to process and validatetheir own records. Contact names and addresses are given in Appendix 2.
5.1.1 TOGA SOFTWARE
The Tropical Ocean Global Atmosphere (TOGA) Programme Sea LevelCentre (TSLC) (Honolulu, USA) in collaboration with the US National Oceanographic DataCentre (NODC) has prepared a package (Caldwell, 1991) for sea level data processingdesigned for any IBM PC or compatible microcomputers under the DOS operating system(DOS 3.1 or later). The package is geared towards people with some experience of DOS andsea level data processing; it is interactive and self-descriptive. The package andaccompanying manual are freely available and updates and modifications are delivered tousers. The software occupies 1.9 Mbytes of hard disk, although not all of the programs needto be loaded at the same time. The goal of the software is the establishment of a permanentarchive of hourly, daily and monthly data, written in a standardised format suitable forincorporation into international archives where sea level data are available to the scientificcommunity for exchange and analysis.
The package includes software for:
a) Tidal Analysis and Prediction
This software facilitates the use of the tidal analysis and prediction programs of the Institute ofOcean Sciences, Victoria, British Colombia (Foreman, 1977). It consists of self-descriptive,interactive batch jobs and programs which prepare the input and output to the Foremanprograms.
30
b) Quality Control
Quality control ensures the scientific validity of the data. The software contains plottingprograms which are considered to be an integral part of the package as they are the primarymeans used to quality control the input data and verify the processed data. This componentconsists of three sections:
• Inspection of reference level stability: This allows comparison with tide staffmeasurements and is usually carried out on a monthly basis, with valuescompared month to month.
• Correction of timing errors: This is normally carried out annually; timing problemsare detected on plots of residuals and corrections of a whole number of hours canbe applied.
• Filling gaps and correcting data spikes: The software produces a list of gaps;where possible these are replaced by data from auxiliary gauges. If this is notpossible gaps can be filled by interpolation. It is recommended that gaps lessthan 24 hours only are replaced. This method can also be used for correctingindividual incorrect points (spikes) and glitches (1 - 6 consecutive obviouslywrong points).
c) Filtering Software
Programs are provided for obtaining daily values from hourly sea level data by a two-stageprocess. Firstly the dominant diurnal and semi-diurnal components are removed andsecondly a 119-point convolution filter, centred on noon, is applied to remove the remaininghigh frequency energy and to prevent aliasing. Monthly values are calculated from the dailyvalues with a simple average. Programs to enable comparison of two daily or monthly seriesare also included.
5.1.2 FIAMS SOFTWARE
The Flinders Institute for Atmospheric and Marine Sciences (FIAMS) has prepared time-series software (FIAMS, July 1990) for sea level processing designed for use on PersonalComputers under the DOS operating system. The package includes software for:
a) Data Entry and Utilities
A program is provided for manual entry of data. There is also the capability to reformat datafiles and the facility to change the time zone and units of constituents. Other utilities includecomparison of two card-image tidal level files and software to check for obvious errors in thedata. Simple statistics can be calculated (i.e. maximum, minimum, mean for each file) anddata files can be split into monthly files.
b) Analysis and Prediction
This software facilitates the use of the extensively modified tidal analysis (TIRA) andprediction (ELSIE) programs first developed at the Proudman Oceanographic Laboratory,
31
Bidston Observatory, Birkenhead, Merseyside, UK (Murray, 1963) and consists of self-descriptive, interactive batch jobs and programs which prepare input and output to theprograms. Hourly tidal predictions or high and low water predictions can be calculated.Residuals can be computed and statistics and histograms of the residuals produced.Generation and display of constituent differences from two appropriately formattedconstituent files is also possible. Programs are also provided to compute and plot the resultsfrom the spectral analysis of time-series.
c) Quality Control
Quality control ensures the scientific validity of the data. The software contains plottingprograms which are the primary means used to quality control the input data and verify theprocessed data by comparison with predictions. Data can be compared by plotting thedifference between two series and/or observed and predicted levels. A program for fillinggaps using a Cosine-Lanczos filter in Fourier Transform space is provided.
REFERENCES
Bloomfield, P., 1976. Fourier Analysis of Time Series: An Introduction. New York: John Wileyand Sons. pp 129-137.
Caldwell, P.C., April 1991. Sea Level Data Processing Software on IBM PC CompatibleMicrocomputers. TOGA Sea Level Centre, University of Hawaii.
FIAMS., July 1990. Tidal Time-Series Software Designed for use on a Personal Computer.FIAMS Tidal Laboratory. The Flinders University of South Australia.
Foreman, M., 1997. Manual for Tidal Height Analysis and Prediction. Institute of OceanSciences, Patricia Bay, Victoria, British Columbia. Pacific Marine Science Report 77-10."Unpublished Manuscript".
Murray, M.T., 1962. Tide Prediction with an Electronic Digital Computer. CahiersOceanographiques. XIV, 10.
Murray, M.T., 1963. Tidal Analysis with an Electronic Digital Computer. CahiersOceanographiques. XV.
32
6. SEA LEVEL CENTRES
Sea level data have been collected for many years and historically, in some cases, data mayhave been archived at a national level, albeit in a rather ad hoc fashion, with little or nouniformity between one centre and the next. The one exception to this nationally basedsystem is the Permanent Service for Mean Sea Level (PSMSL), an international sea levelcentre, responsible for monthly and annual mean sea levels, which is described in more detailbelow in section 6.3. More recently there has been a need for sea level measurements to bemade available as part of large scale science programmes, for example the Tropical OceanGlobal Atmosphere (TOGA) Programme and the World Ocean CirculationExperiment (WOCE).
The advantages of maintaining data in a recognised centre include the protection of the longterm value of the data by storing them in a professionally managed archive, making valueadded products available - and high quality data will be available to a wide user community.Interactions between scientists, data collectors and data centres will result in data banks ofbenefit to the scientific community. In addition to the above, research workers will beencouraged to edit and document their data. The data will be available in a single formatrather than in a multiplicity of formats.
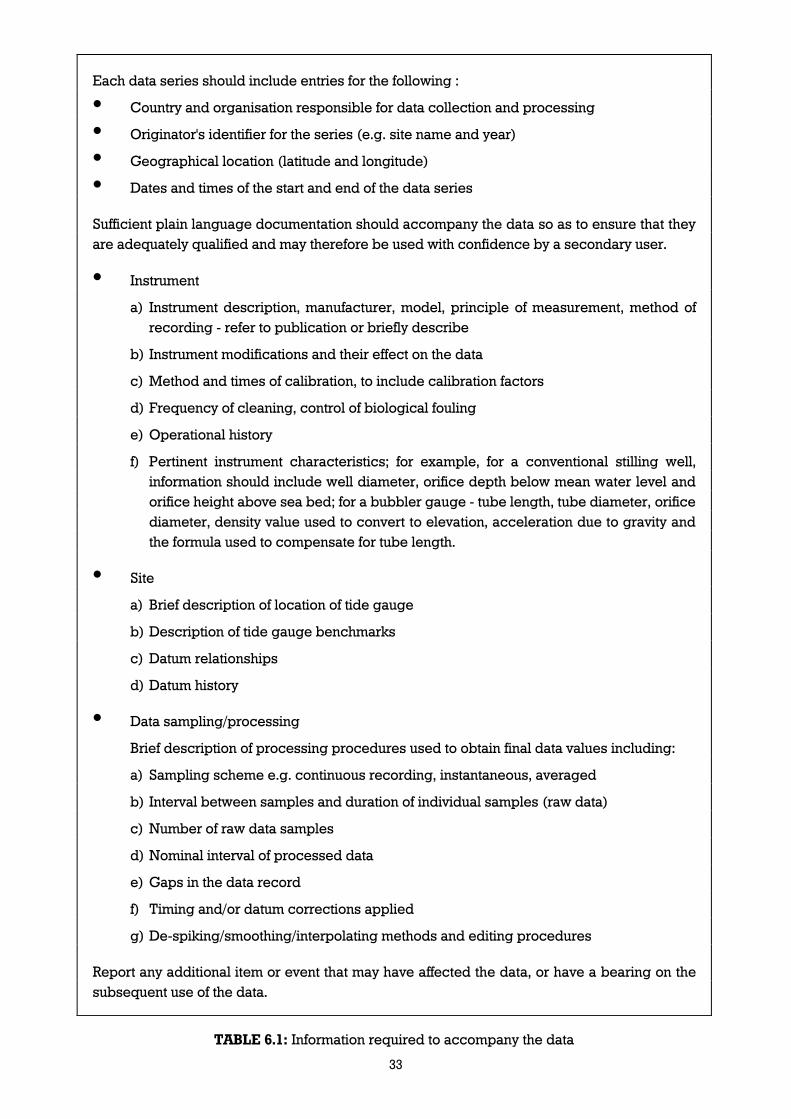
To be fully effective, a sea level data bank must be more than simply a collection of numericalvalues; these must also be qualified by additional information concerning methods ofmeasurement and subsequent data processing. The accompanying information needed isgiven in Table 6.1. A certain amount of validation and quality control will be carried out on thedata by the data centre. This may vary depending on the function of the data centre, butshould include checking data values for spikes, gaps and physically unreasonable values.For hourly values the residuals produced by tidal analysis of the data can be screened tocheck for datum shifts, timing problems and other errors. Data from adjacent stations may becompared to check out unusual signals. Qualifying information accompanying the data canalso be checked.
Science programmes like TOGA and WOCE bring with them their own special needs - forexample, there is a demand for quality controlled data, easy access for researchers to thedata and for the data to be made available on a reasonable time scale. Perhaps moreimportantly, scientific experiments have a finite lifetime, and so at the end of a project, thedata must be passed on to a long term archive to protect both the data and the investment ineffort and money in the collection of the data.
Moreover, it is becoming increasingly important to have access to long time series of data forstudies relating to climate change. The length of sea level records is a unique asset here withsome records extending back 100 years or more. As more science turns to look at long termtrends these interdecadal data sets will assume even greater importance. Thus it is essentialthat these valuable data sets are maintained.
In addition to compiling a high quality bank of sea level data these data must be made readilyavailable to users in a suitable form. This may be a magnetic tape in the IOC standard formatGF3 of sea level data series or it may be some other value added product - for example, theIGOSS Sea Level Programme in the Pacific (ISLP-Pac) produces monthly mean sea level
33
Each data series should include entries for the following :
• Country and organisation responsible for data collection and processing
• Originator's identifier for the series (e.g. site name and year)
• Geographical location (latitude and longitude)
• Dates and times of the start and end of the data series
Sufficient plain language documentation should accompany the data so as to ensure that theyare adequately qualified and may therefore be used with confidence by a secondary user.
• Instrument
a) Instrument description, manufacturer, model, principle of measurement, method ofrecording - refer to publication or briefly describe
b) Instrument modifications and their effect on the data
c) Method and times of calibration, to include calibration factors
d) Frequency of cleaning, control of biological fouling
e) Operational history
f) Pertinent instrument characteristics; for example, for a conventional stilling well,information should include well diameter, orifice depth below mean water level andorifice height above sea bed; for a bubbler gauge - tube length, tube diameter, orificediameter, density value used to convert to elevation, acceleration due to gravity andthe formula used to compensate for tube length.
• Site
a) Brief description of location of tide gauge
b) Description of tide gauge benchmarks
c) Datum relationships
d) Datum history
• Data sampling/processing
Brief description of processing procedures used to obtain final data values including:
a) Sampling scheme e.g. continuous recording, instantaneous, averaged
b) Interval between samples and duration of individual samples (raw data)
c) Number of raw data samples
d) Nominal interval of processed data
e) Gaps in the data record
f) Timing and/or datum corrections applied
g) De-spiking/smoothing/interpolating methods and editing procedures
Report any additional item or event that may have affected the data, or have a bearing on thesubsequent use of the data.
TABLE 6.1: Information required to accompany the data
34
anomaly maps. These are distributed as hard copy maps, but additionally, the data that goesto make up the maps are available over computer networks.
A brief description is given below of a selection of the major sea level centres currently inexistence showing the variety of work in progress. Contact names and addresses are given inAppendix 2.
6.1 TOGA SEA LEVEL CENTRE
Through interest in ocean-atmosphere coupling and the predictability of climate changesfrom months to years, the World Climate Research Programme initiated the Tropical OceanGlobal Atmosphere (TOGA) Programme, a ten-year programme that began in 1985 andcontinues until 1995. One of the key observational components of the TOGA programme is thesea level. In 1985, the TOGA Sea Level Centre (SLC) was created at the University of Hawaii(UH) to concentrate the efforts of acquiring, processing, and archiving sea level data from thetropics.
The data are received at the TOGA SLC from the sea-level stations located in tropical andsub-tropical zones of the World's Oceans.
The TOGA programme requires daily sea level values from sites identified in theimplementation plan (International TOGA Programme Office, 1987). However, requests aremade for hourly heights, which have proven necessary for thorough quality control.
As the quantity of data collected by the TOGA SLC increased, expertise in data managementwas provided by the National Oceanographic Data Centre (NODC) with the establishment ofthe Joint Archive for Sea Level (JASL) at UH in 1987. The JASL supports the TOGA SLC in thecollection, quality assurance, management, and dissemination of the data.
The TOGA SLC prepares scientifically valid, well-documented, standardised sea level datasets of hourly, daily, and monthly values. As of July 1993, 239 stations (Figure 6.1) with 2650station-years of quality assured data from the tropical oceans have been passed to PSMSLand the World Data Centre-A for Oceanography, which ensures wide spread advertisement ofthe data availability and allows easy access for the scientific and public communities (TOGASea Level Centre: Annual Report for the year ending July 1993. Data Report No. 11).
6.2 WOCE SEA LEVEL DATA ASSEMBLY CENTRES
The international WOCE programme is establishing two sea level data assembly centres,responsibility for this has been vested jointly in the University of Hawaii and the BritishOceanographic Data Centre. The first goal of WOCE requires sea level data for joint use withsatellite altimetry data and for geostrophic computations of specific currents, for example,through straits. Sea level data will also serve as a check on the validity of numerical modeloutputs. The second goal of WOCE, determining the representativeness of the WOCE dataset for the long term behaviour of the ocean, will be addressed by comparing by comparingsea level measurements made during WOCE with those held by the Permanent Service forMean Sea Level. The University of Hawaii will build upon its experience gained in the TOGAexperiment and will make higher frequency (i.e. hourly) data available in a more timely way.The sea level data set for WOCE must be not only delivered more quickly, but also must have
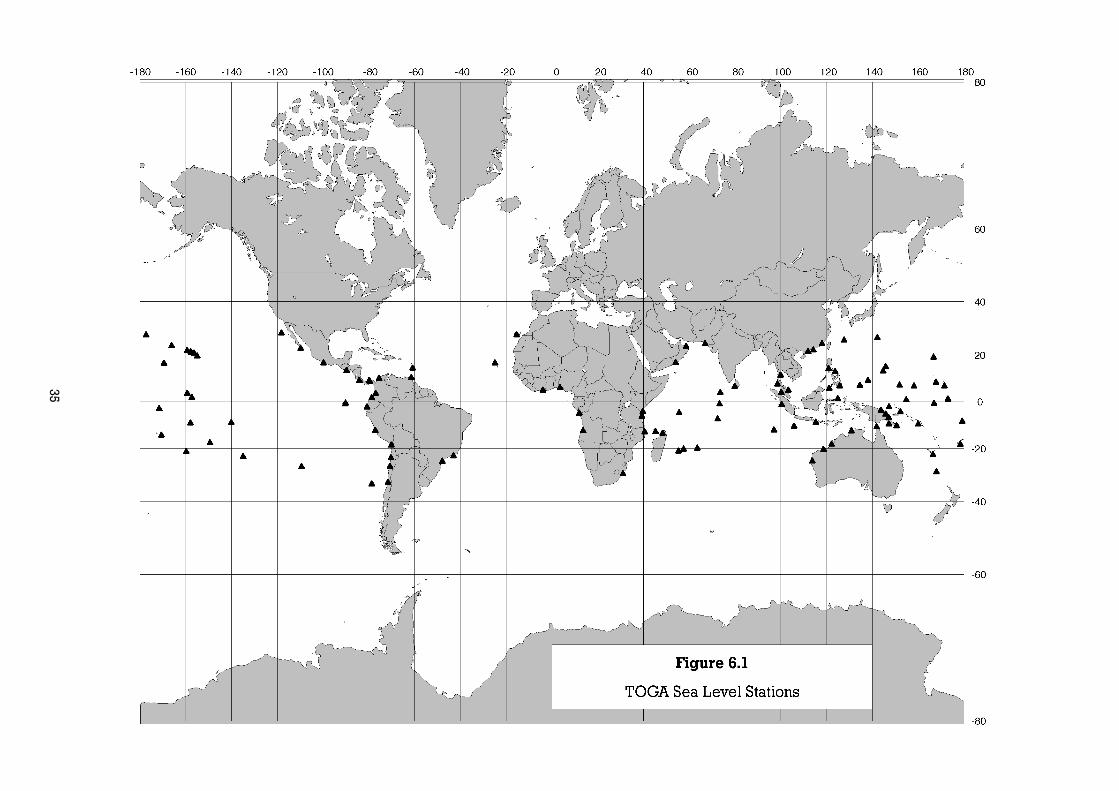
35
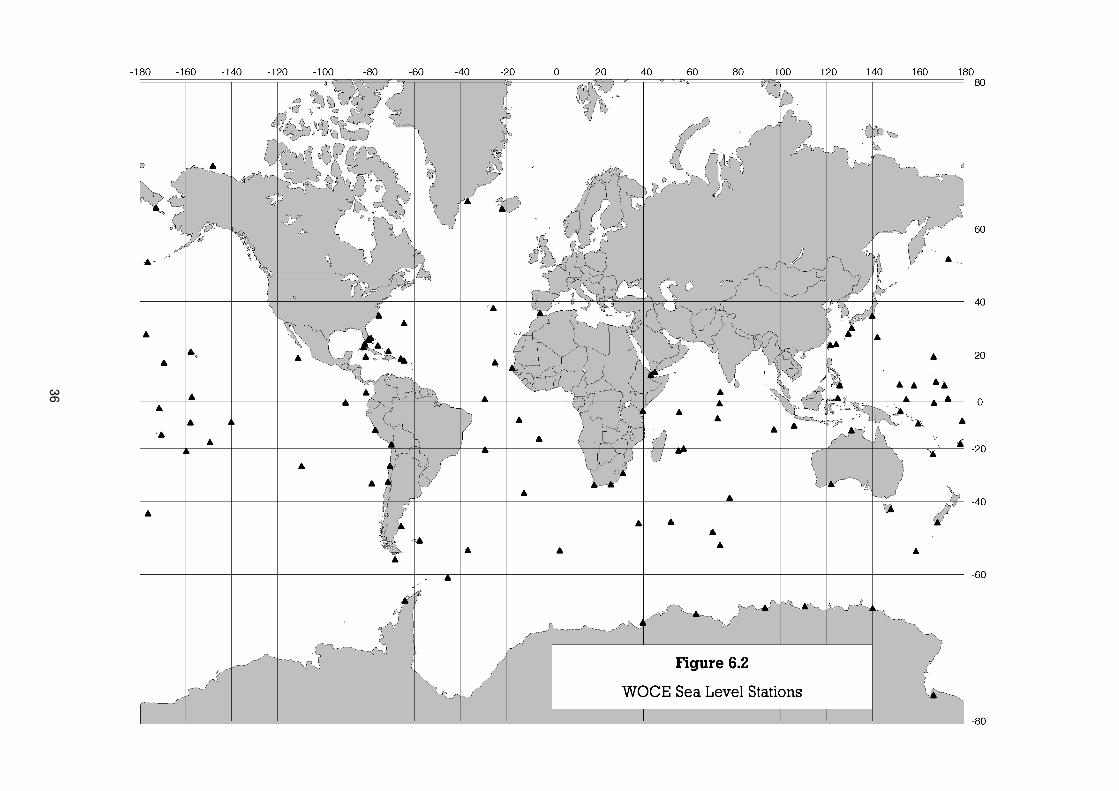
36
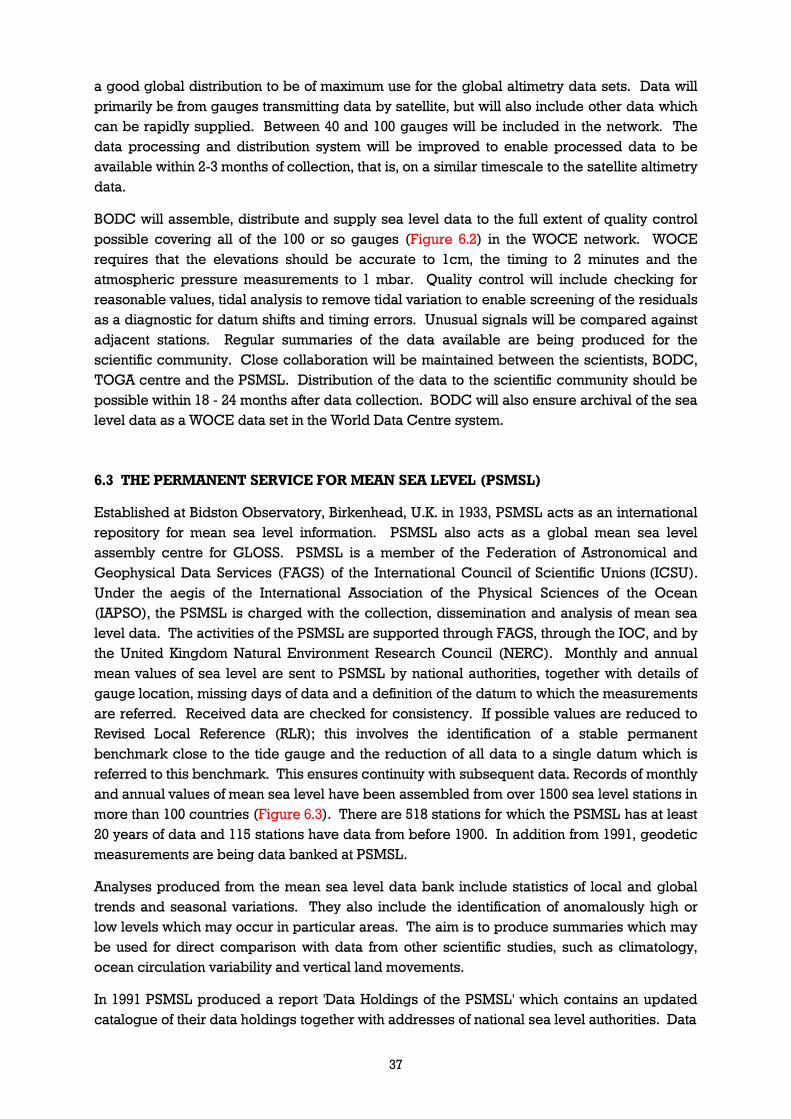
37
a good global distribution to be of maximum use for the global altimetry data sets. Data willprimarily be from gauges transmitting data by satellite, but will also include other data whichcan be rapidly supplied. Between 40 and 100 gauges will be included in the network. Thedata processing and distribution system will be improved to enable processed data to beavailable within 2-3 months of collection, that is, on a similar timescale to the satellite altimetrydata.
BODC will assemble, distribute and supply sea level data to the full extent of quality controlpossible covering all of the 100 or so gauges (Figure 6.2) in the WOCE network. WOCErequires that the elevations should be accurate to 1cm, the timing to 2 minutes and theatmospheric pressure measurements to 1 mbar. Quality control will include checking forreasonable values, tidal analysis to remove tidal variation to enable screening of the residualsas a diagnostic for datum shifts and timing errors. Unusual signals will be compared againstadjacent stations. Regular summaries of the data available are being produced for thescientific community. Close collaboration will be maintained between the scientists, BODC,TOGA centre and the PSMSL. Distribution of the data to the scientific community should bepossible within 18 - 24 months after data collection. BODC will also ensure archival of the sealevel data as a WOCE data set in the World Data Centre system.
6.3 THE PERMANENT SERVICE FOR MEAN SEA LEVEL (PSMSL)
Established at Bidston Observatory, Birkenhead, U.K. in 1933, PSMSL acts as an internationalrepository for mean sea level information. PSMSL also acts as a global mean sea levelassembly centre for GLOSS. PSMSL is a member of the Federation of Astronomical andGeophysical Data Services (FAGS) of the International Council of Scientific Unions (ICSU).Under the aegis of the International Association of the Physical Sciences of the Ocean(IAPSO), the PSMSL is charged with the collection, dissemination and analysis of mean sealevel data. The activities of the PSMSL are supported through FAGS, through the IOC, and bythe United Kingdom Natural Environment Research Council (NERC). Monthly and annualmean values of sea level are sent to PSMSL by national authorities, together with details ofgauge location, missing days of data and a definition of the datum to which the measurementsare referred. Received data are checked for consistency. If possible values are reduced toRevised Local Reference (RLR); this involves the identification of a stable permanentbenchmark close to the tide gauge and the reduction of all data to a single datum which isreferred to this benchmark. This ensures continuity with subsequent data. Records of monthlyand annual values of mean sea level have been assembled from over 1500 sea level stations inmore than 100 countries (Figure 6.3). There are 518 stations for which the PSMSL has at least20 years of data and 115 stations have data from before 1900. In addition from 1991, geodeticmeasurements are being data banked at PSMSL.
Analyses produced from the mean sea level data bank include statistics of local and globaltrends and seasonal variations. They also include the identification of anomalously high orlow levels which may occur in particular areas. The aim is to produce summaries which maybe used for direct comparison with data from other scientific studies, such as climatology,ocean circulation variability and vertical land movements.
In 1991 PSMSL produced a report 'Data Holdings of the PSMSL' which contains an updatedcatalogue of their data holdings together with addresses of national sea level authorities. Data
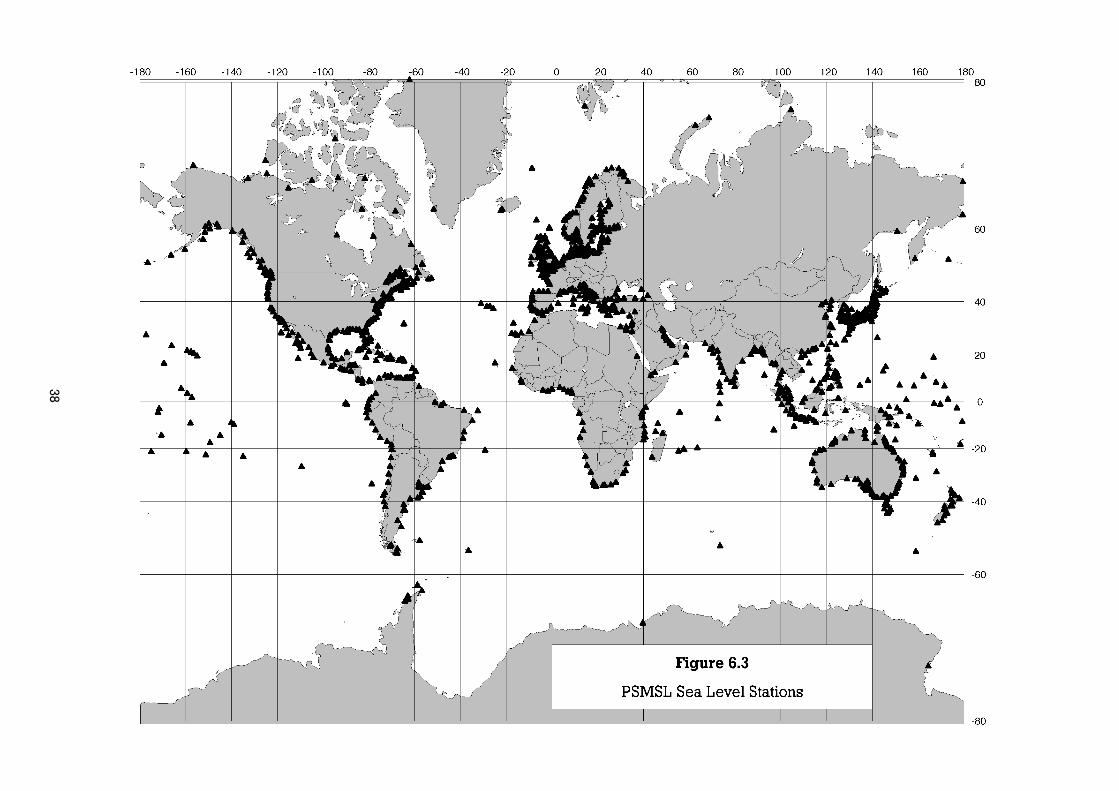
38
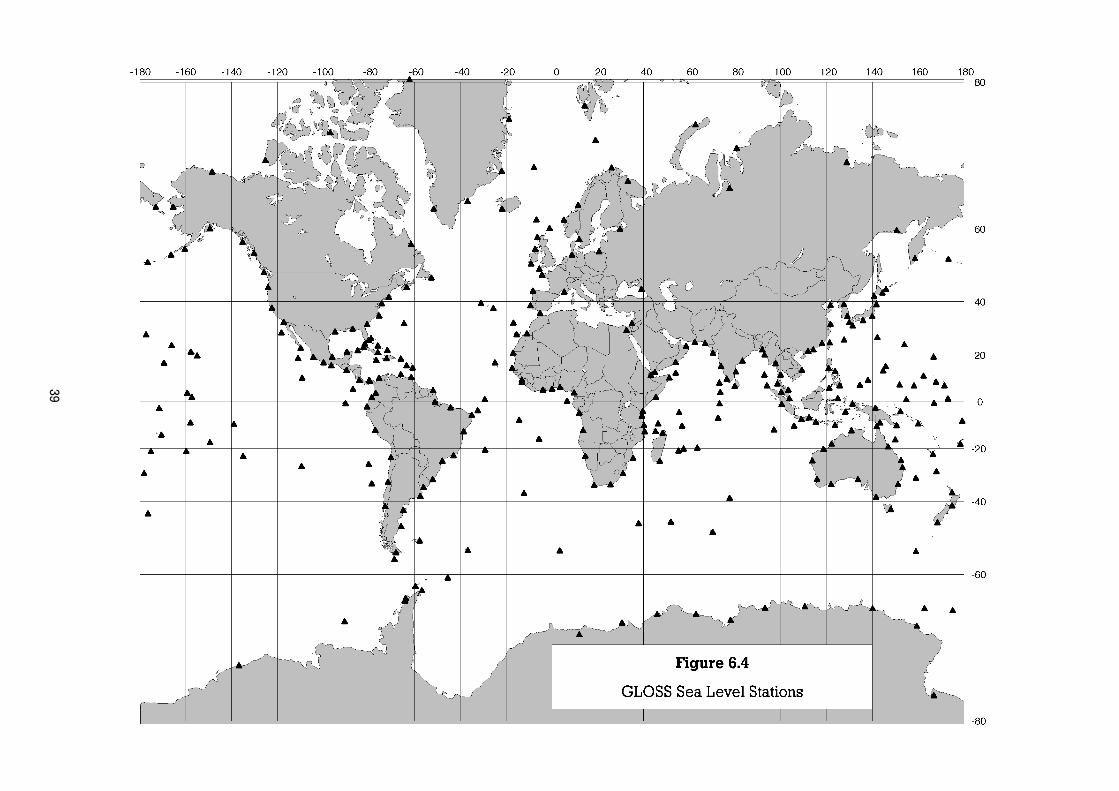
39
40
are available from them either across Internet, or on magnetic tape in GF3 format, or, for smallselections of data, on floppy disk or as hardcopy listings. PSMSL can also provide copies ofthe GLOSS Handbook, a PC package giving details and site maps of each gauge (Figure 6.4)within the GLOSS network.
41
7. TRAINING COURSES
The IOC co-ordinated Global Sea Level Observing System (GLOSS) is one of the key existingelements of the Global Ocean Observing System (GOOS).
The success of GLOSS depends on the enthusiasm and expertise of the people responsiblefor the operation and maintenance of each GLOSS gauge, and for the reduction of data andsupply of mean sea levels to the data centres. The role of training is crucial, in order to instilland maintain common, high standards throughout the GLOSS network.
Up to 1993, training courses have been held in Brazil (1993), France (1990), the People'sRepublic of China (1984), and the United Kingdom, 9 courses, (1983-1991).
In addition to the continuation of training courses for technicians (preferably on a regionalbasis) more emphasis should be given to the training of scientists to enable them to use fullyand efficiently data resulting from GOOS for scientific and practical applications.
Core topics for the technicians' course should include:
1. Installation, maintenance and operation of tide gauges
2. Tide gauge levelling to local benchmarks
3. Absolute geodetic fixing
4. Data reduction and banking
5. Exchange of sea level data - e.g. TOGA, WOCE
6. Uses of MSL - Climate, Geodesy
7. Uses of higher frequency sea level data (hourly heights or similar) on a globalbasis e.g. the symbiosis with satellite altimetry data
8. GLOSS and the IOC, including IGOSS and PSMSL
9. GLOSS organisation and Publicity
10. Discussions on sea-level measurement in each participant's country
Information on intended future training courses can be obtained from the GLOSS TechnicalSecretary at the IOC.
42
APPENDIX 1
SUPPLIERS OF TIDE GAUGE EQUIPMENT AND SERVICES
FLOAT GAUGES
Fieldings Fisher and Porter Equipment, 1928N Warbler Place, Orange, California 92667,USA.
Kyowa Shoko Co., Ltd, 17-11, Nihonbashi Kayabacho 2 chome, Chuo-ku, Tokyo, 103,JAPAN
Leupold and Stevens Inc., PO Box 688, Beaverton, Oregon 97075, USA.
PRESSURE GAUGES
Aanderaa Instruments, Fanaveien 13B, 5050 Bergen, Norway.
Endeco Inc., 13 Atlantis Drive, Marion, MA, USA.
MORS Environment Division, 2-4 rue Isaac Newton, BP90, 93152 Le Blanc Mesnil,France.
OTT, GMBH, 8960 Kempten, Jugerstrasse 4-12, Postf. 2120, Germany.
Pacer Systems Inc., 900 Technology Park Drive, Billerica, MA 01821, USA.
Valeport Marine Scientific Ltd., Unit 7, Townstal Industrial Estate, Dartmouth, DevonTQ6 9LX, UK.
W.S. Ocean Systems Ltd., Unit 4, Omni Business Centre, Omega Park, Alton, HantsGU34 2QD, UK.
ACOUSTIC GAUGES
Bartex Inc., 613E Bayview Hillsmore, Annapolis, MD 21403, USA.
Sonar Research and Development Ltd., Unit 1B, Grovehill Industrial Estate, Beverley,Humberside HU17 OJW, UK.
STEPPED GAUGES AND DATUM SWITCHES
Bestobell Mobrey, 190-196 Bath Road, Slough, Berkshire SL1 4DN, UK.
Etrometa, Kerkewal 49, PO Box 132, 8400 AC Gorredijk, The Netherlands.
43
PRESSURE TRANSDUCERS
Druck Ltd., Fir Tree Lane, Groby, Leicester LE6 OFH, UK.
Honeywell Corp., 677 Ala Moana Blvd., Suite 301, Honolulu, Hawaii 96813.
Paroscientific Inc., 4500, 148th Avenue, NE Redmond, WA 98052, USA.
Robinson-Halpern Co., 1 Apollo Road, Plymouth Meeting, PA 19462, USA.
DATA COLLECTION PLATFORMS
Applied Satellite Technology, Unit 72, Hellesdon Park Road, Hellesdon Industrial Estate,Norwich NR6 5DR, UK.
Handar, 1380 Borregas Avenue, Sunnyvale, California 94086, USA.
Sutron Corporation, 2190 Fox Mill Road, Herndon, Virginia 22071, USA.
SATELLITE DATA SYSTEMS
CLS ARGOS, 18 Avenue Edouard Belin, 31055 Toulouse Cedex, France.
Suite 10, 1801 McCormick Drive, Landover, MD 20785, USA.
INMARSAT, 40 Melton Street, London NW1 2EQ, UK.
44
APPENDIX 2
INTERNATIONAL CONTACTS
A. Intergovernmental Oceanographic Commission (IOC)
Dr. A. TOLKACHEVGLOSS Technical SecretaryGOOS Support OfficeIntergovernmental Oceanographic Commission (IOC)UNESCO1 rue Miollis75732 Paris Cedex 15FRANCE
Tel: (33 1) 45 68 39 78
Fax: (33 1) 40 56 93 16
E-mail: [email protected]
B. Permanent Service for Mean Sea Level (PSMSL)
Dr. P. WOODWORTHDirector, Permanent Service for Mean Sea Level (PSMSL)Bidston ObservatoryBirkenhead, Merseyside L43 7RAUNITED KINGDOM
Tel: (44 151) 653 86 33
Fax: (44 151) 653 62 69
E-mail: [email protected]
C. Specialised Oceanographic Centre for the IGOSS Sea Level Programme in thePacific
Dr. M. MERRIFIELDDepartment of OceanographyUniversity of Hawaii at Manoa1000 Pope Road MSB 307Honolulu, Hawaii 96822USA
Tel: (1 808) 956 6161
Fax: (1 808) 956 2352
Tlx: 650-247-8678
E-mail: [email protected]
45
Prof. K. WYRTKIDepartment of OceanographyUniversity of Hawaii at Manoa1000 Pope Road MSB 307Honolulu, Hawaii 96822USA
Tel: (1 808) 956 6161
Fax: (1 808) 956 7729
Tlx: 650-247-8678
D. TOGA Sea Level Centre
Prof. K. WYRTKI and Dr. M. MERRIFIELD
(same address as above)
E. WOCE Sea Level Data Analysis Centres
Dr. M. MERRIFIELD
(same address as above)
Dr. L.J. RICKARDSBritish Oceanographic Data Centre (BODC)Proudman Oceanographic LaboratoryBidston ObservatoryBidston, BirkenheadMerseyside L43 7RAUNITED KINGDOM
Tel: (44 151) 653 8633
Tlx: 628591 OCEANB G
Fax: (44 151) 652 3950
E-mail: [email protected]
46
F. Specialized Oceanographic Centre for the IGOSS Sea Level Pilot Project in theNorth and Tropical Atlantic
Dr. Andre BOLDUCMEDSDepartment of Fisheries and Oceans200 Kent StreetOttawa, ONTARIO KIA OE6CANADA
Tel: (1 613) 990 0231
Fax: (1 613) 990 5510
Tlx: 534228
E-mail: [email protected]
G. Regional Co-ordinators for GLOSS
IOC Regional Committee for the Co-operative Investigation in the North and CentralWestern Indian Ocean (IOCINCWIO)
Mr. Mika ODIDOKenya Marine & Fisheries Research Institute (KMFRI)P.O. Box 81651MombasaKENYA
Tel: (254 11) 47 19 32
Fax: (254 11) 47 22 15
Tlx: 21151 PUBLIC MBSA Attn: KMFRI
IOC Regional Committee for the Central Eastern Atlantic (IOCEA)
Mr. Larry AWOSIKANigerian Institute for Oceanography andMarine Research (NIOMR)Federal Ministry of Agriculture and NaturalResources DevelopmentP.M.B. 12729 Victoria IslandLagosNIGERIA
Tel: (234 1) 61 73 85
Fax: (234 1) 61 95 17
Tlx: OCEANOGRAF
47
IOC Sub-Commission for the Caribbean and Adjacent Regions (IOCARIBE)
Dr. G. MAULVice-President IOCARIBEDirectorDivision of Marine and Environmental SystemsFlorida Institute of TechnologyMelbourne, Florida 32901-6988USA
Tel: (1 407) 768 8000
Fax: (1 407) 984 6461
E-mail: [email protected]
H. Co-operating International Organisations
International Hydrographic Bureau (IHB)
Mr. Hans-Peter ROHDE(Hydrography)International Hydrographic Bureau7, Avenue President J.F. KennedyB.P. 445MC 98011 MONACO CEDEXPrincipality of Monaco
Tel: (33) 93 50 65 87
Fax: (33) 93 25 20 03
Tlx: 479164 MC INHORG
Email: [email protected]
IAPSO Sea-Level Commission
Dr. C. Le PROVOSTDirecteur de RechercheInstitut de Mechanique de GrenobleBP 53X38402 St. Martin d’Heres Cedex
Tel: (33) 76 82 50 65
Fax: (33) 76 82 50 01 / 76 82 52 71
Email: [email protected]
48
PC BASED TIDAL SOFTWARE SUPPLIERS
Mr. P. CALDWELLTOGA Sea Level CentreUniversity of Hawaii at Manoa1000 Pope Road MSB 307Honolulu, Hawaii 96822USA
Tel: (1 808) 956 7037
Fax: (1 808) 956 4104
Tlx: 650-247-8678
Email: [email protected]
Professor T. MurtyFIAMSFlinders University of South AustraliaBedford ParkSOUTH AUSTRALIA 5042
Tel: (61 8) 201 2298
Fax: (61 8) 015 2676
Tlx: 89624 FLINDU AA
Email: [email protected]

49
APPENDIX 3
ABBREVIATIONS AND ACRONYMS
ACCLAIM Antarctic Circumpolar Currents Levels by Altimetry and IslandMeasurement
ARGOS Automatic Remote Geomagnetic Observatory System
BODC British Oceanographic Data Centre
CDDF Central Data Distribution Facility
CLS Collecte Localisation Satellites
CNES Centre National d'Etudes Spatiales
DATARING Data Acquisition for Tidal Applications for the Remote Interrogation ofNetwork Gauges
DCP Data Collection Platform
DOS Disk Operating System
EUMETSAT European Organisation for the Exploitation of Meteorological Satellites
FIAMS Flinders Institute for Atmospheric and Marine Sciences
FAGS Federation of Astronomical and Geophysical Services
GCOS Global Climate Observing System
GF3 General Format 3
GLOSS Global Sea Level Observing System
GMS Geostationary Meteorology Satellite
GOES Geostationary Operational Environmental Satellite System
GOOS Global Ocean Observing System
GPS Global Positioning System
GTS Global Telecommunications System
IAPSO International Association for the Physical Sciences of the Ocean
ICSU International Council of Scientific Unions
IERS International Earth Rotation Service
IGOSS Integrated Global Ocean Services System
INMARSAT International Maritime Satellite Organisation
IOC Intergovernmental Oceanographic Commission
50
IPCC Intergovernmental Panel on Climate Change
ISLP-Pac IGOSS Sea Level Programme in the Pacific
JASL Joint Archive for Sea Level
LAT Lowest Astronomical Tide
METEOSAT Geostationary Meteorological Satellite
NERC Natural Environment Research Council
NESDIS National Environmental Satellite and Data Information Service
NGWLMS Next Generation Water Level Measurement System
NOAA National Oceanic and Atmospheric Administration
NOS National Ocean Service
POL Proudman Oceanographic Laboratory
PSMSL Permanent Service for Mean Sea Level
PSTN Public Switched Telephone Network
PTT Platform Transmitter Terminal
PTWC Pacific Tsunami Warning Centre
RLR Revised Local Reference
SLC Sea Level Centre
SLR Satellite Laser Ranging
SOC Specialised Oceanographic Centre
STWS Storm Tide Warning Service
TGBM Tide Gauge Bench Mark
TGI Tide Gauge Inspectorate
TOGA Tropical Ocean Global Atmosphere
UH University of Hawaii
UNEP United Nations Environment Programme
UNESCO United Nations Educational, Scientific and Cultural Organisation
VLBI Very Long Baseline Interferometry
WMO World Meteorological Organisation
WOCE World Ocean Circulation Experiment