MANAGERIAL REPORT€¦ · are planning to sell these products to their authorized dealers. ......
31
Workload Balancing Production Strategy Hart Venture Capital Investment Strategy Truck Leasing Strategy MANAGERIAL REPORT 1303041015 Uğur Altuntaş MIS
Transcript of MANAGERIAL REPORT€¦ · are planning to sell these products to their authorized dealers. ......
Workload Balancing
Production Strategy
Hart Venture Capital
Investment Strategy
Truck Leasing Strategy
MANAGERIAL REPORT
1303041015
Uğur Altuntaş
MIS

CONTENTS
EXECUTIVE SUMMARY ............................................................................................................................. 1
WORKLOAD BALANCING ......................................................................................................................... 3
1-) Decision Variables .......................................................................................................................... 3
2-) Objective Function Definition ........................................................................................................ 3
3-) Solutions ......................................................................................................................................... 4
PRODUCTION STRATEGY ....................................................................................................................... 10
1-) Decision Variables ........................................................................................................................ 12
2-) Objective Function Definition ...................................................................................................... 12
3-) Solutions ....................................................................................................................................... 13
HART VENTURE CAPITAL ....................................................................................................................... 16
1-) Decision Variables ........................................................................................................................ 17
2-) Objective Function Definition ...................................................................................................... 17
3-) Solutions ....................................................................................................................................... 17
INVESTMENT STRATEGY ........................................................................................................................ 20
1. Decision Variables ......................................................................................................................... 20
2. Objective Function Definition ........................................................................................................ 20
3. Solutions ........................................................................................................................................ 21
TRUCK LEASING STRATEGY .................................................................................................................... 25
1-) Decision Variables ........................................................................................................................ 26
2-) Objective Function Definition ...................................................................................................... 26
3-) Solutions ....................................................................................................................................... 27
1
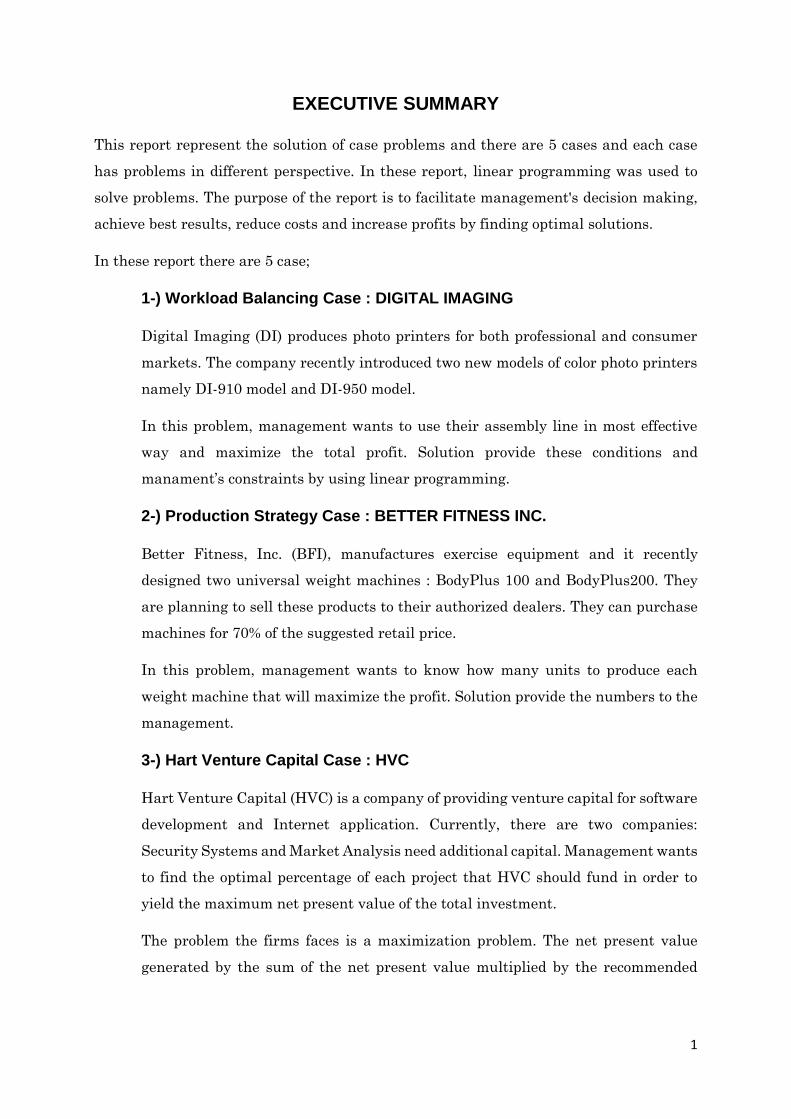
EXECUTIVE SUMMARY
This report represent the solution of case problems and there are 5 cases and each case
has problems in different perspective. In these report, linear programming was used to
solve problems. The purpose of the report is to facilitate management's decision making,
achieve best results, reduce costs and increase profits by finding optimal solutions.
In these report there are 5 case;
1-) Workload Balancing Case : DIGITAL IMAGING
Digital Imaging (DI) produces photo printers for both professional and consumer
markets. The company recently introduced two new models of color photo printers
namely DI-910 model and DI-950 model.
In this problem, management wants to use their assembly line in most effective
way and maximize the total profit. Solution provide these conditions and
manament’s constraints by using linear programming.
2-) Production Strategy Case : BETTER FITNESS INC.
Better Fitness, Inc. (BFI), manufactures exercise equipment and it recently
designed two universal weight machines : BodyPlus 100 and BodyPlus200. They
are planning to sell these products to their authorized dealers. They can purchase
machines for 70% of the suggested retail price.
In this problem, management wants to know how many units to produce each
weight machine that will maximize the profit. Solution provide the numbers to the
management.
3-) Hart Venture Capital Case : HVC
Hart Venture Capital (HVC) is a company of providing venture capital for software
development and Internet application. Currently, there are two companies:
Security Systems and Market Analysis need additional capital. Management wants
to find the optimal percentage of each project that HVC should fund in order to
yield the maximum net present value of the total investment.
The problem the firms faces is a maximization problem. The net present value
generated by the sum of the net present value multiplied by the recommended

2
percentage of two investments will be the objective function.Solution provide the
optimal percentage of each project by using linear programming.
4-) Investment Strategy Case : J.D. WILLIAMS INC.
J.D. Williams Inc. has a client who wishes to invest $800.000 with the firm in order
to maximize his yield after a period of one year. The firm wants to allocate the funds
while accommodating some requirements related to portfolio composition of the
investment. The portfolio must have investments in 3 funds: growth stock fund,
income fund and money market fund.
Based on the knowledge of J.D. Williams Inc. linear programming was used to
determine the best investment portfolio that will minimize risk and maximize
annual yield. This solution provide the management an asset allocation model that
provides investment strategy to obtain optimal investment combinations.
5-) Truck Leasing Strategy Case : REEP CONSTRUCTION
In this case, Bob Reep the owner and president of Reep Construction. Bob
recently won a contract for the excavation and site preparation of a new rest area
on the Pennsylvania Turnpike.To complete his new project, he need to lease new
trucks. So, he need to figure out a way to accommodate a short term leasing plan
for trucks within budget to complete his new project. So, Bob wants to know
optimal leasing plan that minimize his cost.
According to the required number of trucks and fuel cost, linear programming
was used that minimize total cost. Solution provide optimal leasing plan and
additional costs associated with optimal leasing plan to Bob Reep.
The recommendations in this report are based on the linear programming, which is an
optimal solution method to achieve the best outcome. So, managers can apply the
recommendations in this report.

3
WORKLOAD BALANCING
Digital Imaging (DI) produces color printers for both the professional and consumer
markets. The company introduced two new color printers and company wants to determine
how many units of each printer to produce to maximize profit.
DI – 910 DI – 950 Time Available
(minutes)
Line 1 3 mins 6 mins 480
Line 2 4 mins 2 mins 480
Profit/unit $42 $87
Table 1.0 : Workload Balancing Variables
1-) Decision Variables
X : Number of Units to Produce of DI-910 printer
Y : Number of Units to Produce of DI-950 printer
2-) Objective Function Definition
Objective function is maximizing the profit by determining how many units of each printer
to produce.
Max Z = 42X + 87Y
Subject to
3X + 6Y <= 480
4X + 2Y <= 480

4
3-) Solutions
1-) The recommended number of units of each printer to produce to maximize total
contribution to profit for an 8 hour shift as follow:
X = 0, Y = 80
42 * (0) + 87 * (80) = $6.960,00
Figure 1.0 : Workload Balancing Question 1 Excel Solution
Figure 1.1 : Workload Balancing Question 1 Graphical Solution.

5
Figure 1.2: Workload Balancing Question 1 Feasible area points
The values of point A and C at the feasible area are known. I need to find my point B. To
find the point B, i got the equations of intersecting lines. Then i use MMulti and Minverse
formulas of excel. After that i put the points in Z function then i got automatically the
result of Z.
As a result i choose the Point A because it has highest Z value.
But management may not accept the solution because of;
• Supply of DI-950 model is more than market’s demand
• May be there is a demand for DI-910 in the market
• There may be a problem for 320 minutes that is not used on Line 2
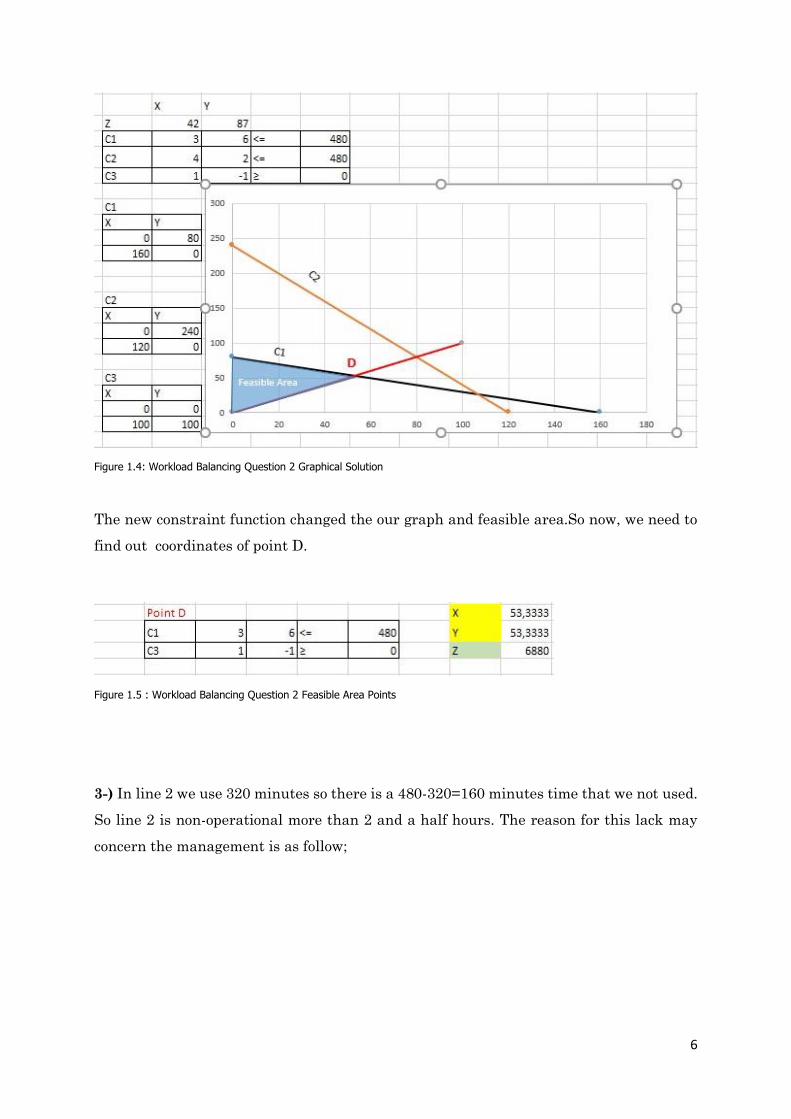
2-) In question 2, management wants to number of DI-910 printers produced must be at
least as great as the number of DI-950 units produced.So we just add X-Y =>0 constraint
function and follow the steps as in question 1 solution.
Figure 1.3: Workload Balancing Question 2 Excel Solution
6
Figure 1.4: Workload Balancing Question 2 Graphical Solution
The new constraint function changed the our graph and feasible area.So now, we need to
find out coordinates of point D.
Figure 1.5 : Workload Balancing Question 2 Feasible Area Points
3-) In line 2 we use 320 minutes so there is a 480-320=160 minutes time that we not used.
So line 2 is non-operational more than 2 and a half hours. The reason for this lack may
concern the management is as follow;

7
Figure 1.6 : Workload Balancing Question 3 Used Shift
Management should concern about this lack because it may some effects on the efficiency
because as the plant is automated the time lag between supply and demand of lines may
lead to inefficiency and operating cost will also be incurred for time lag even without
operation. Also, unused resources may lose money to company
4-) In question 4 management wants to better balance between total time on line 1 and
line 2. So management set the new balance as the difference between two lines 30 minutes
or less. So this is a new constraint and we need new constraint function. This function will
be ;
(3X+6Y) – (4X+2Y) <=30 ➔ -X + 4Y <= 30
We add the new constraints function to excel and follow the same steps as before.
Figure 1.7 : Workload Balancing Question 4 Excel Solution
With a new constraints our profit and lack times have changed. The difference between
profits is $6880 - $6815 = $65 ,
And the lack time difference is 30 minutes.

8
Figure 1.8 : Workload Balancing Question 4 Graphical Solution
Figure 1.9 : Workload Balancing Question 4 Feasible Area Points
We choose E because its more profitable.
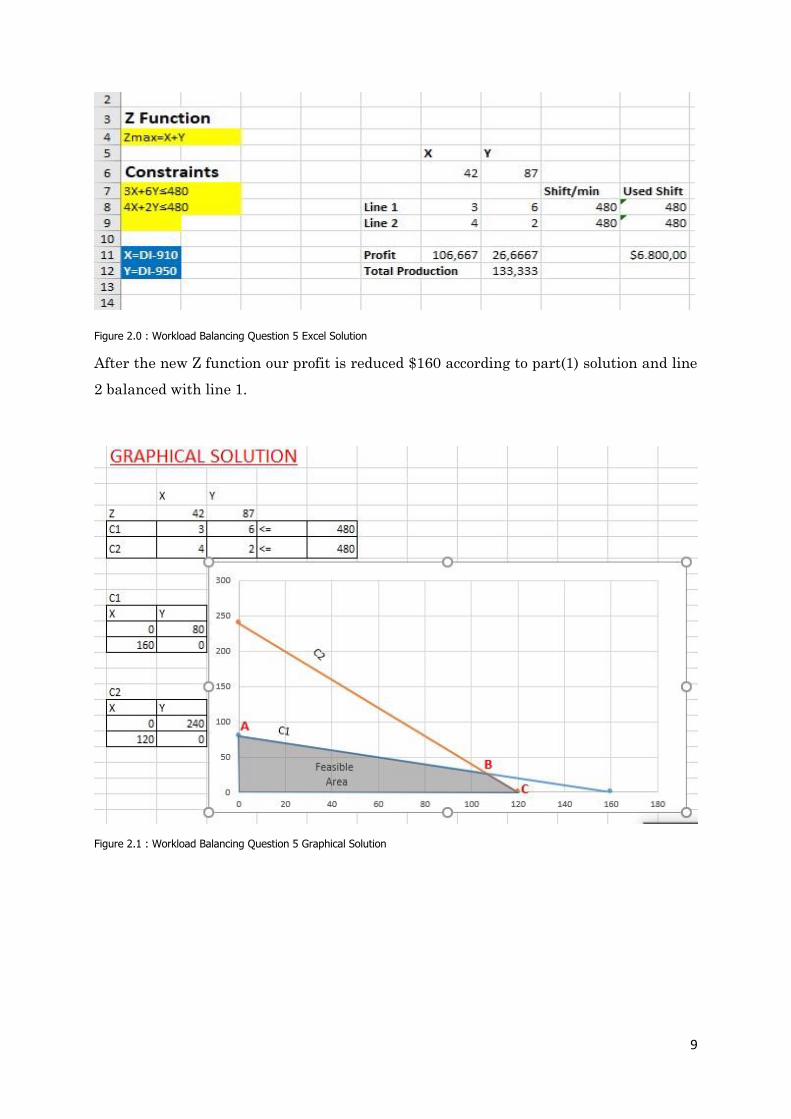
5-) In question 5 management set the new objective from maximizing profits to
maximizing production. This give us new Z function as;
Max Z = X+Y
9
Figure 2.0 : Workload Balancing Question 5 Excel Solution
After the new Z function our profit is reduced $160 according to part(1) solution and line
2 balanced with line 1.
Figure 2.1 : Workload Balancing Question 5 Graphical Solution
10
Figure 2.2 : Workload Balancing Question 5 Feasible Area Points
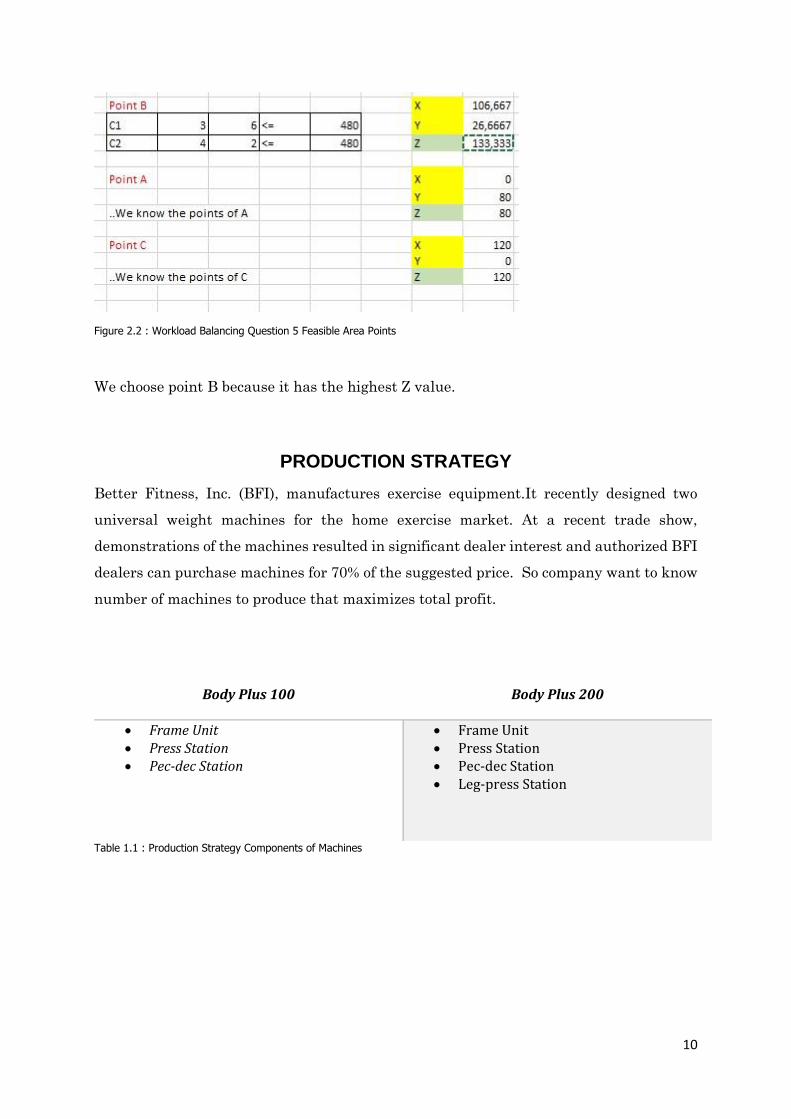
We choose point B because it has the highest Z value.
PRODUCTION STRATEGY
Better Fitness, Inc. (BFI), manufactures exercise equipment.It recently designed two
universal weight machines for the home exercise market. At a recent trade show,
demonstrations of the machines resulted in significant dealer interest and authorized BFI
dealers can purchase machines for 70% of the suggested price. So company want to know
number of machines to produce that maximizes total profit.
Body Plus 100 Body Plus 200
• Frame Unit • Press Station • Pec-dec Station
• Frame Unit • Press Station • Pec-dec Station • Leg-press Station
Table 1.1 : Production Strategy Components of Machines
11
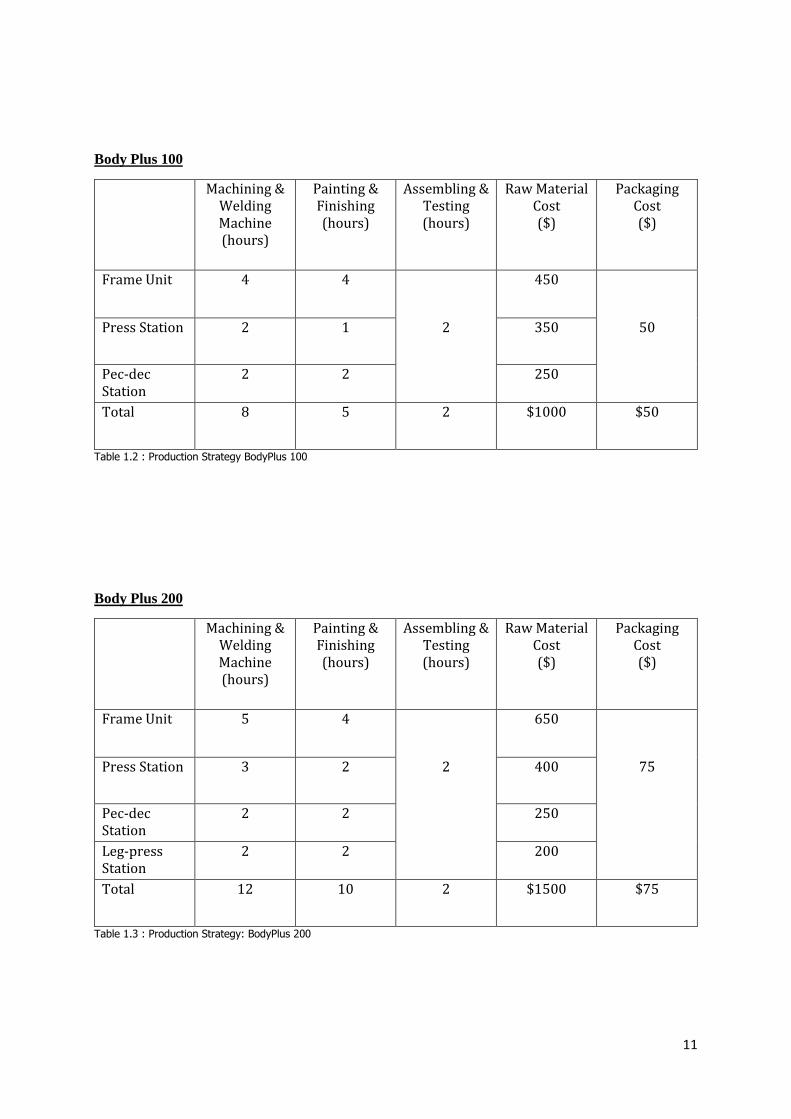
Body Plus 100
Machining & Welding Machine (hours)
Painting & Finishing (hours)
Assembling & Testing (hours)
Raw Material Cost ($)
Packaging Cost ($)
Frame Unit 4 4 450
Press Station 2 1 2 350 50
Pec-dec Station
2 2 250
Total 8 5 2 $1000 $50
Table 1.2 : Production Strategy BodyPlus 100
Body Plus 200
Machining & Welding Machine (hours)
Painting & Finishing (hours)
Assembling & Testing (hours)
Raw Material Cost ($)
Packaging Cost ($)
Frame Unit 5 4 650
Press Station 3 2 2 400 75
Pec-dec Station
2 2 250
Leg-press Station
2 2 200
Total 12 10 2 $1500 $75
Table 1.3 : Production Strategy: BodyPlus 200

12
Time Capacity (hours)
Cost/hours
Machining & Welding Machine
600 20
Painting & Finishing 450 15
Assembling & Testing & Packaging
140 12
Table 1.4 : Production Strategy Machine Capacity and Cost
1-) Decision Variables
X : Number of Units to Produce of BodyPlus 100
Y : Number of Units to Produce of BodyPlus 200
2-) Objective Function Definition
Table 1.5 : Production Strategy Profits/units
Objective function is maximize the total profit by determining how many units to produce
of each machine
Max Z = 371X + 461Y
Body Plus 100
Body Plus 200
Retail Price $2400
Labor Cost = (20*8)+(15*5)+(12*2) =$259
Raw Material Cost = $1000 + $50 = $1050
Dealer price = 0.70* $2400 =$1680
Profit = $371
Retail Price $3500
Labor Cost = (20*12)+(15*10)+(12*2) =$414
Raw Material Cost = $1500 + $75 = $1575
Dealer price = 0.70* $3500 =$2450
Profit = $461

13
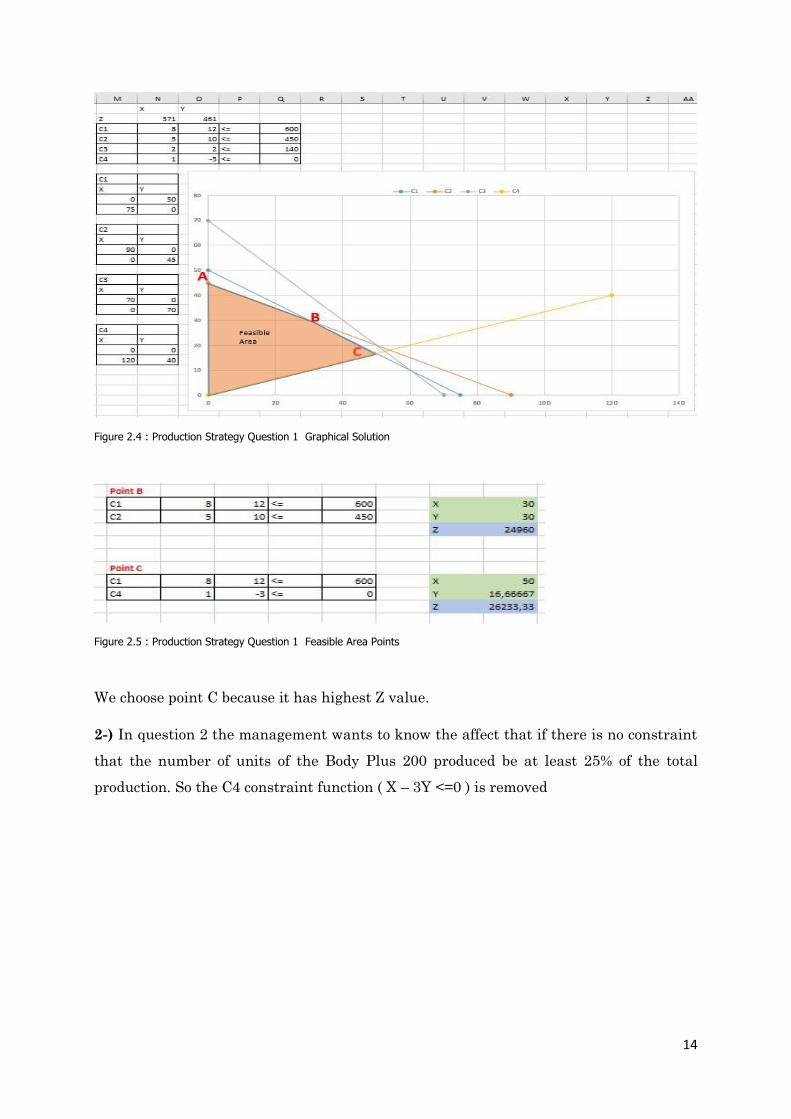
Subject to
1-) 8X + 12Y <= 600
2-) 5X + 10Y <= 450
3-) 2X + 2Y <=140
4-) X – 3Y <=0
3-) Solutions
1-) Recommended number of BodyPlus 100 and BodyPlus200 machines to produce as
follows;
X = 50, Y = 16
371 * (50) + 461* (16) = $25.926
Figure 2.3 : Production Strategy Question 1 Excel Solution
14
Figure 2.4 : Production Strategy Question 1 Graphical Solution
Figure 2.5 : Production Strategy Question 1 Feasible Area Points
We choose point C because it has highest Z value.
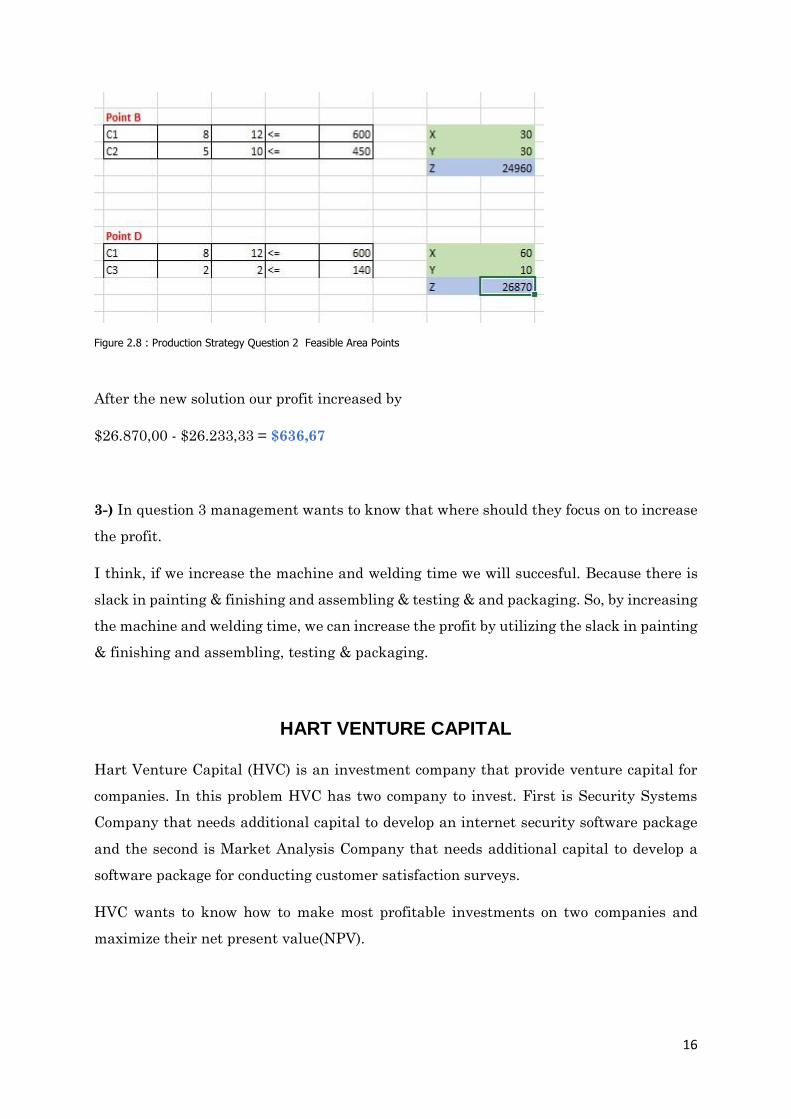
2-) In question 2 the management wants to know the affect that if there is no constraint
that the number of units of the Body Plus 200 produced be at least 25% of the total
production. So the C4 constraint function ( X – 3Y <=0 ) is removed

15
Figure 2.6 : Production Strategy Question 2 Excel Solution
Figure 2.7 : Production Strategy Question 2 Graphical Solution
16
Figure 2.8 : Production Strategy Question 2 Feasible Area Points
After the new solution our profit increased by
$26.870,00 - $26.233,33 = $636,67
3-) In question 3 management wants to know that where should they focus on to increase
the profit.
I think, if we increase the machine and welding time we will succesful. Because there is
slack in painting & finishing and assembling & testing & and packaging. So, by increasing
the machine and welding time, we can increase the profit by utilizing the slack in painting
& finishing and assembling, testing & packaging.
HART VENTURE CAPITAL
Hart Venture Capital (HVC) is an investment company that provide venture capital for
companies. In this problem HVC has two company to invest. First is Security Systems
Company that needs additional capital to develop an internet security software package
and the second is Market Analysis Company that needs additional capital to develop a
software package for conducting customer satisfaction surveys.
HVC wants to know how to make most profitable investments on two companies and
maximize their net present value(NPV).
17
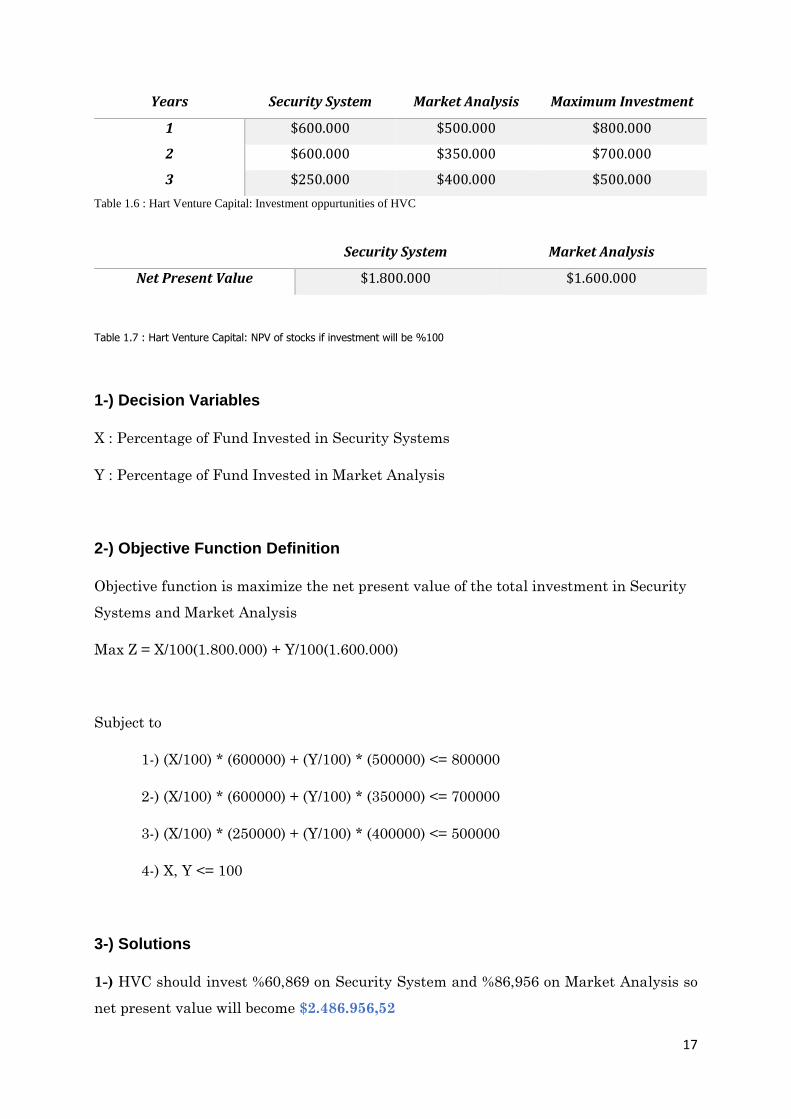
Years Security System Market Analysis Maximum Investment
1 $600.000 $500.000 $800.000
2 $600.000 $350.000 $700.000
3 $250.000 $400.000 $500.000
Table 1.6 : Hart Venture Capital: Investment oppurtunities of HVC
Table 1.7 : Hart Venture Capital: NPV of stocks if investment will be %100
1-) Decision Variables
X : Percentage of Fund Invested in Security Systems
Y : Percentage of Fund Invested in Market Analysis
2-) Objective Function Definition
Objective function is maximize the net present value of the total investment in Security
Systems and Market Analysis
Max Z = X/100(1.800.000) + Y/100(1.600.000)
Subject to
1-) (X/100) * (600000) + (Y/100) * (500000) <= 800000
2-) (X/100) * (600000) + (Y/100) * (350000) <= 700000
3-) (X/100) * (250000) + (Y/100) * (400000) <= 500000
4-) X, Y <= 100
3-) Solutions
1-) HVC should invest %60,869 on Security System and %86,956 on Market Analysis so
net present value will become $2.486.956,52
Security System Market Analysis
Net Present Value $1.800.000 $1.600.000

18
Figure 2.9 : Hart Venture Capital Question 1 Excel Solution
Figure 3.0 : Hart Venture Capital Question 1 Graphical Solution
Figure 3.1 : Hart Venture Capital Question 1 Feasible Area Points
19
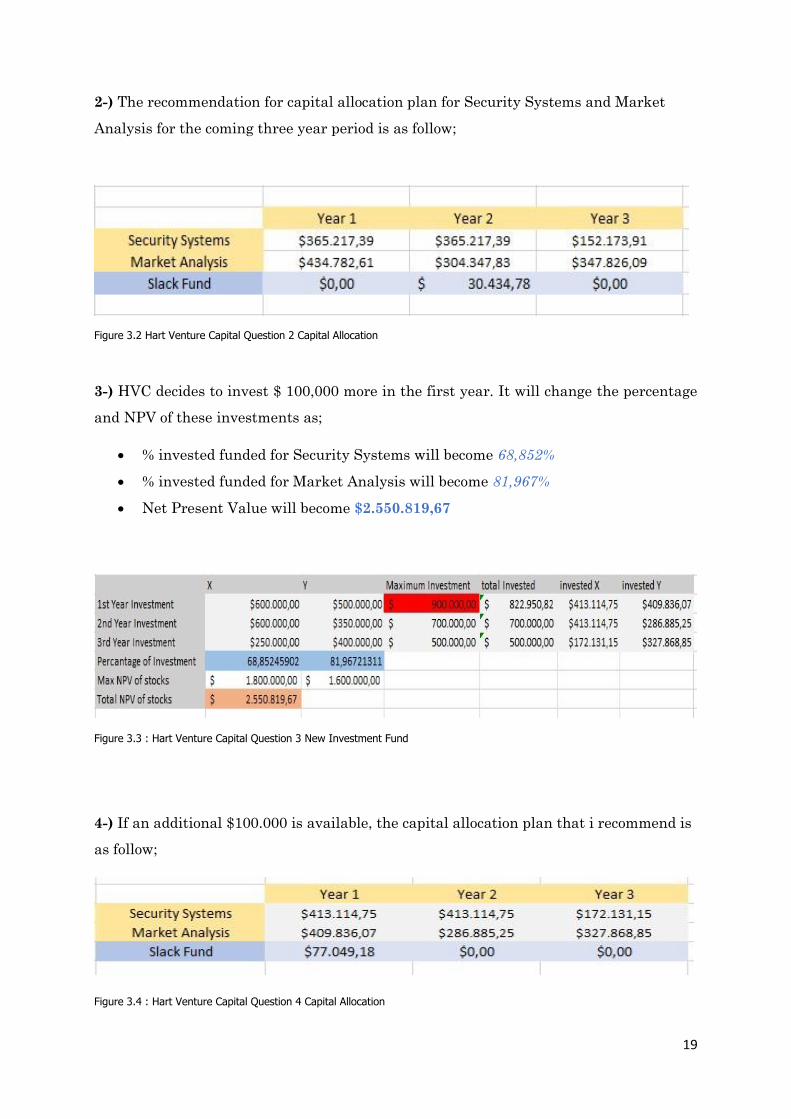
2-) The recommendation for capital allocation plan for Security Systems and Market
Analysis for the coming three year period is as follow;
Figure 3.2 Hart Venture Capital Question 2 Capital Allocation
3-) HVC decides to invest $ 100,000 more in the first year. It will change the percentage
and NPV of these investments as;
• % invested funded for Security Systems will become 68,852%
• % invested funded for Market Analysis will become 81,967%
• Net Present Value will become $2.550.819,67
Figure 3.3 : Hart Venture Capital Question 3 New Investment Fund
4-) If an additional $100.000 is available, the capital allocation plan that i recommend is
as follow;
Figure 3.4 : Hart Venture Capital Question 4 Capital Allocation

20
5-) With additional $100.000 , NPV value increased $63.863,15 with $77.049,18 slack. So
it is profitable investment and slack can be used in another profitable investments of
HVC.
INVESTMENT STRATEGY
J.D. Williams is an investment advisory firm that manages $120 million in funds for its
clients. The company utilizes several financial approaches in advising their clients how to achieve
optimal portfolio returns.
J.D. Williams has recently contracted with a new client and would like to determine
what is the best way to allocate the client's $800,000 in available funds for optimal
growth. The subsequent sections of this report provide an outline of the investment
recommendation provided to the client.
.
Amount Invested of Total Portfolio (%)
Risk of the Money Invested in (%)
Annual Yield (%)
Growth Stock Fund 0.20 – 0.40 0.10 0.18
Income Fund 0.20 – 0.50 0.07 0.01
Money Market Fund >= (at least) 0.30 0.01 0.075
Table 1.8 : Investment Strategy Variables
1. Decision Variables
G = $ amount of investment in growth stock fund
I = $ amount of investment in income fund
M = $ amount of investment in money market fund
2. Objective Function Definition
Objective function is maximize the total return of the portfolio.
Z = 0.18G + 0.125I + 0.075M
21
Subject to
1G + 1I + 1M <= 800.000
0.10G + 0.7I + 0.01M <= 0.05*(G+I+M)
0.20 <= G <= 0.40
0.20 <= I <= 0.50
0.30 <= M
3. Solutions
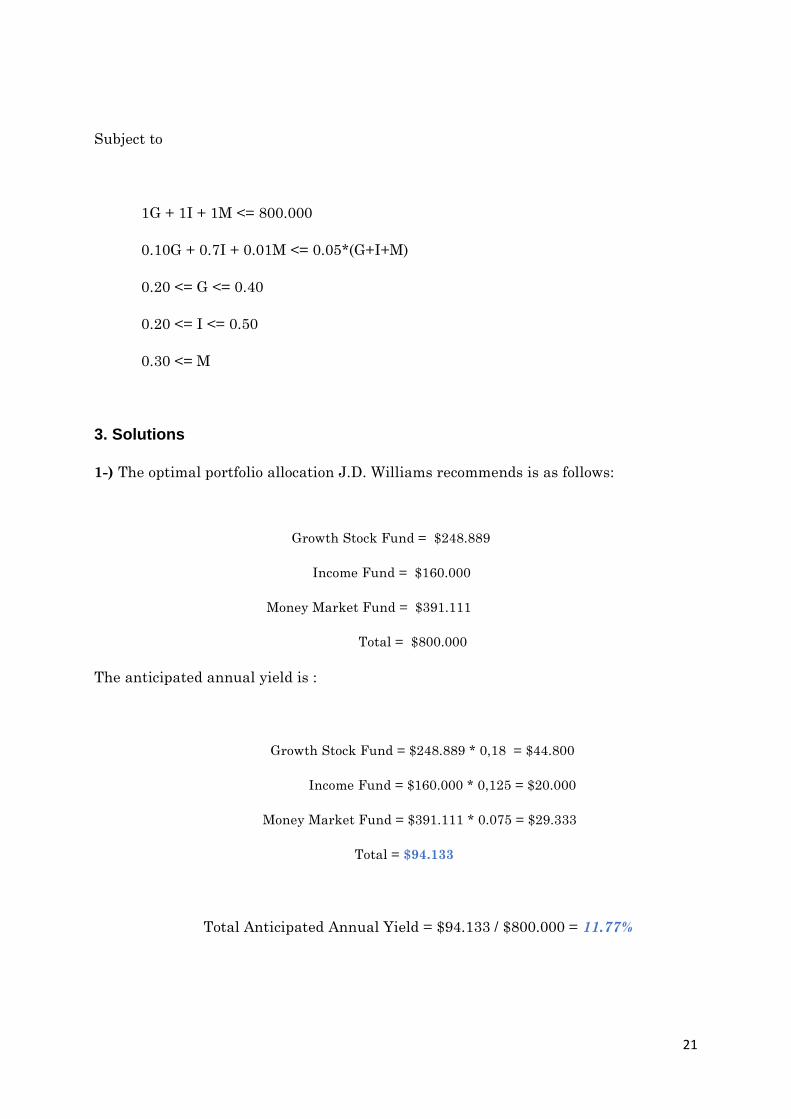
1-) The optimal portfolio allocation J.D. Williams recommends is as follows:
Growth Stock Fund = $248.889
Income Fund = $160.000
Money Market Fund = $391.111
Total = $800.000
The anticipated annual yield is :
Growth Stock Fund = $248.889 * 0,18 = $44.800
Income Fund = $160.000 * 0,125 = $20.000
Money Market Fund = $391.111 * 0.075 = $29.333
Total = $94.133
Total Anticipated Annual Yield = $94.133 / $800.000 = 11.77%
22
Figure 3.5 : Investment Strategy Question 1 Excel Solution
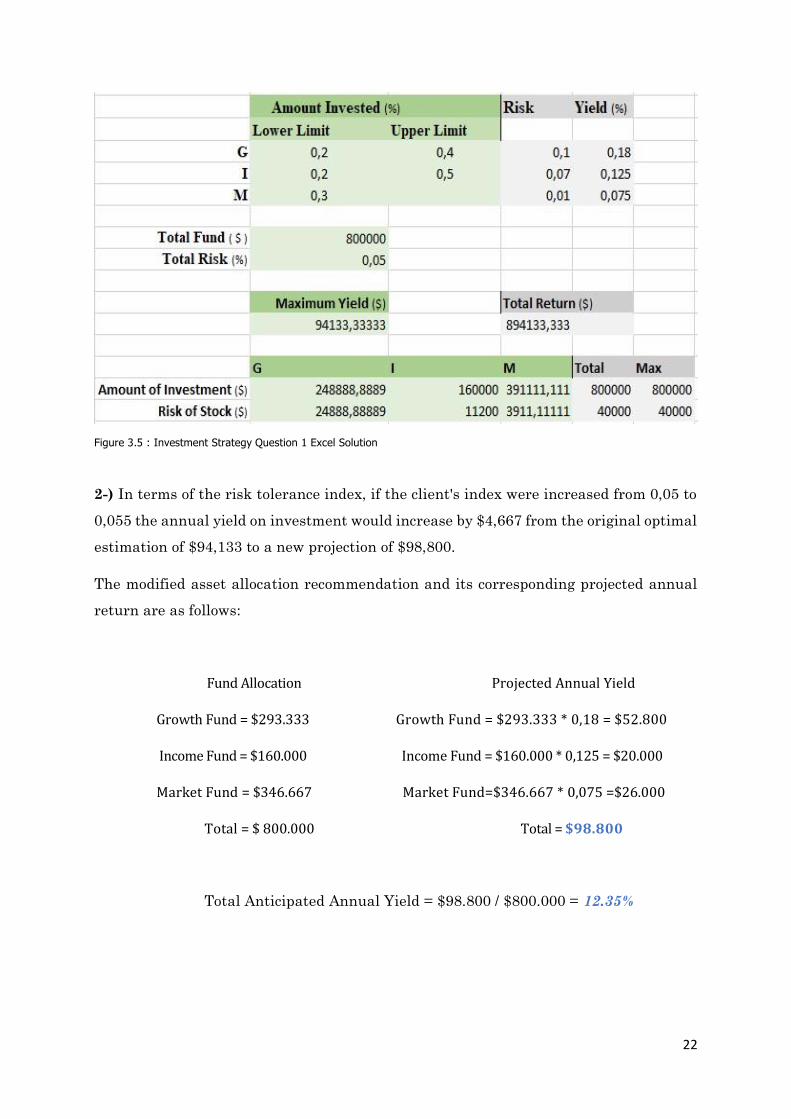
2-) In terms of the risk tolerance index, if the client's index were increased from 0,05 to
0,055 the annual yield on investment would increase by $4,667 from the original optimal
estimation of $94,133 to a new projection of $98,800.
The modified asset allocation recommendation and its corresponding projected annual
return are as follows:
Fund Allocation Projected Annual Yield
Growth Fund = $293.333 Growth Fund = $293.333 * 0,18 = $52.800
Income Fund = $160.000 Income Fund = $160.000 * 0,125 = $20.000
Market Fund = $346.667 Market Fund=$346.667 * 0,075 =$26.000
Total = $ 800.000 Total = $98.800
Total Anticipated Annual Yield = $98.800 / $800.000 = 12.35%
23
Figure 3.6: Investment Strategy Question 2 Excel Solution
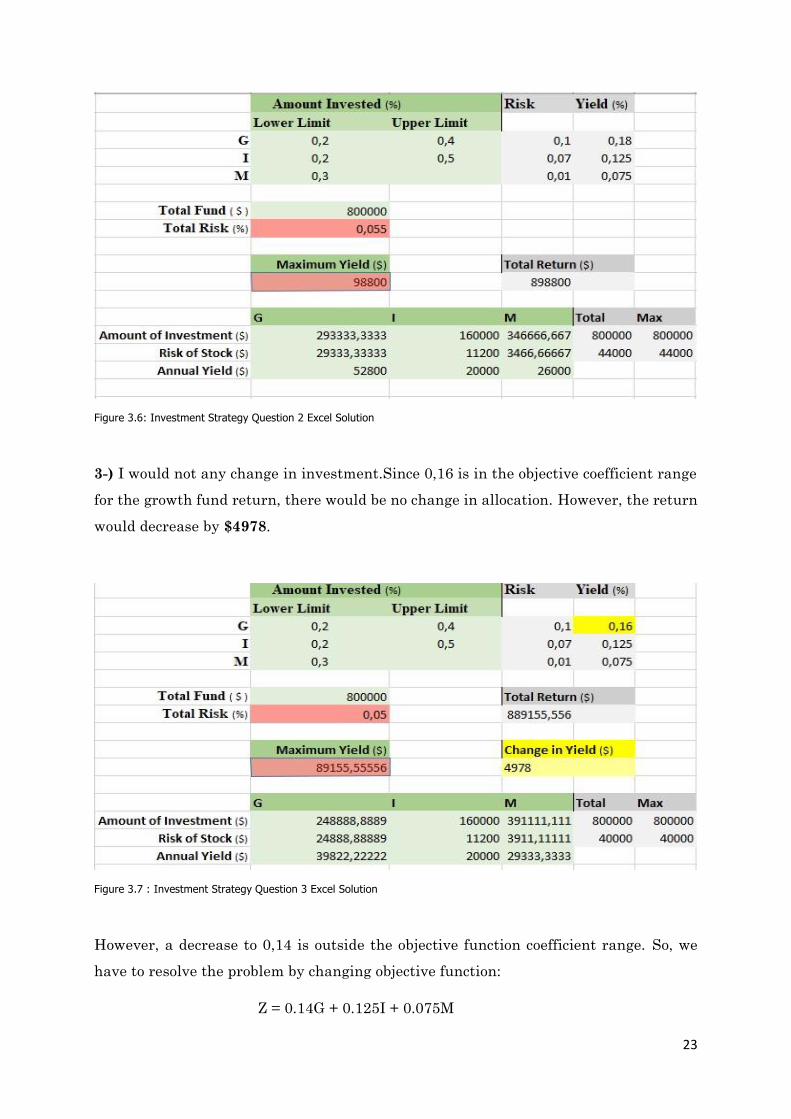
3-) I would not any change in investment.Since 0,16 is in the objective coefficient range
for the growth fund return, there would be no change in allocation. However, the return
would decrease by $4978.
Figure 3.7 : Investment Strategy Question 3 Excel Solution
However, a decrease to 0,14 is outside the objective function coefficient range. So, we
have to resolve the problem by changing objective function:
Z = 0.14G + 0.125I + 0.075M
24
Figure 3.8: Investment Strategy Question 3 Excel Solution
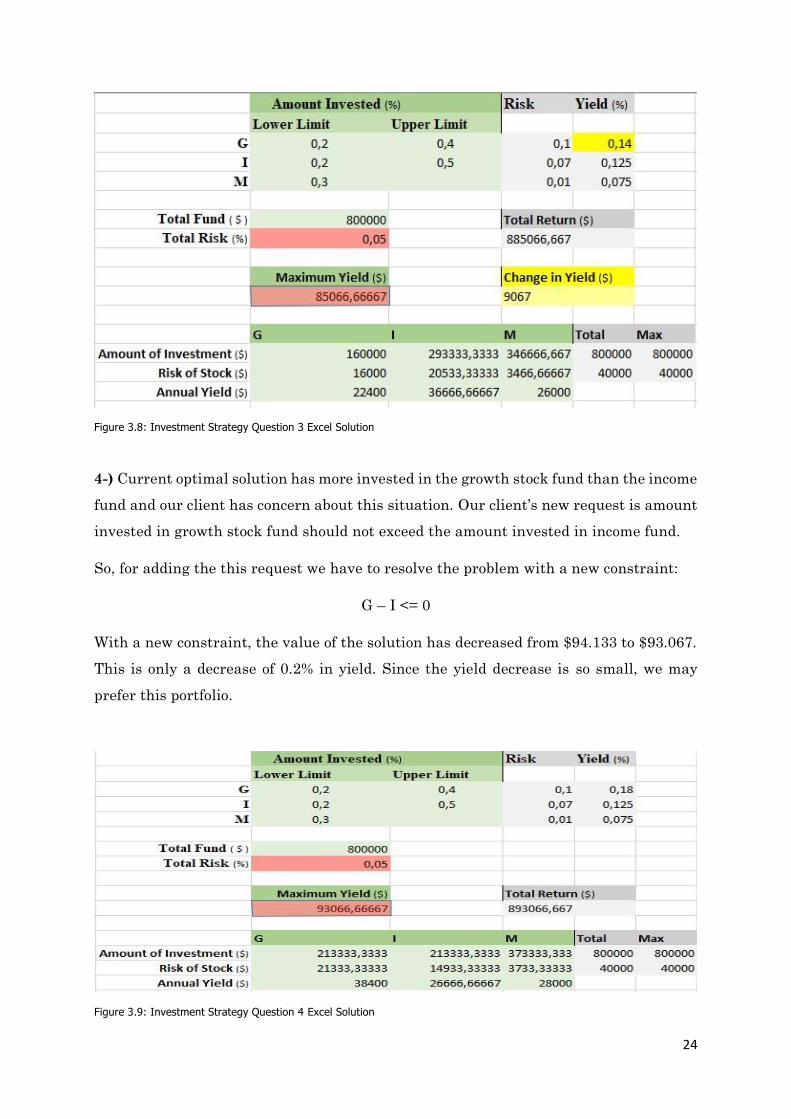
4-) Current optimal solution has more invested in the growth stock fund than the income
fund and our client has concern about this situation. Our client’s new request is amount
invested in growth stock fund should not exceed the amount invested in income fund.
So, for adding the this request we have to resolve the problem with a new constraint:
G – I <= 0
With a new constraint, the value of the solution has decreased from $94.133 to $93.067.
This is only a decrease of 0.2% in yield. Since the yield decrease is so small, we may
prefer this portfolio.
Figure 3.9: Investment Strategy Question 4 Excel Solution
25
5-) I would recommend the model only when the situation of the new client is similar. If
new clients have similar objectives and constraints, this model can be use. However, J.D.
Williams is an advisory firm that works for the individual investors according to their
specific needs. So, i would not recommend the use of this asset allocation model as a
general guide to financial investment.
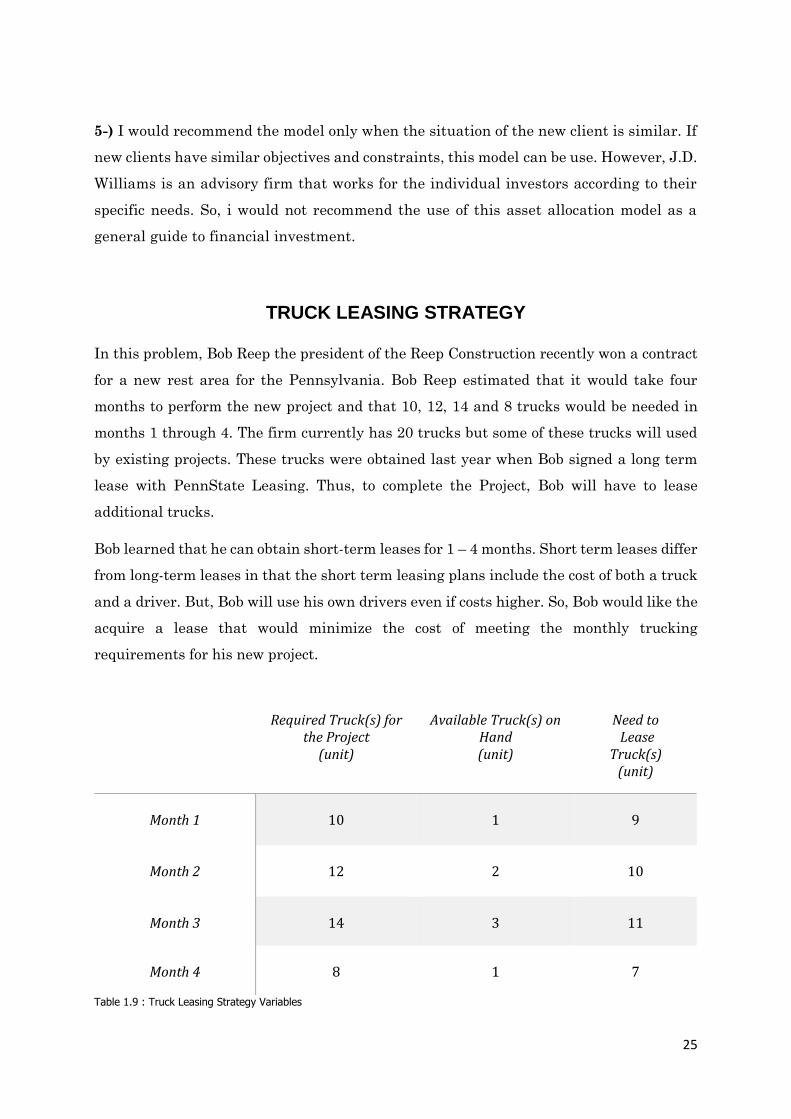
TRUCK LEASING STRATEGY
In this problem, Bob Reep the president of the Reep Construction recently won a contract
for a new rest area for the Pennsylvania. Bob Reep estimated that it would take four
months to perform the new project and that 10, 12, 14 and 8 trucks would be needed in
months 1 through 4. The firm currently has 20 trucks but some of these trucks will used
by existing projects. These trucks were obtained last year when Bob signed a long term
lease with PennState Leasing. Thus, to complete the Project, Bob will have to lease
additional trucks.
Bob learned that he can obtain short-term leases for 1 – 4 months. Short term leases differ
from long-term leases in that the short term leasing plans include the cost of both a truck
and a driver. But, Bob will use his own drivers even if costs higher. So, Bob would like the
acquire a lease that would minimize the cost of meeting the monthly trucking
requirements for his new project.
Required Truck(s) for the Project
(unit)
Available Truck(s) on Hand (unit)
Need to Lease
Truck(s) (unit)
Month 1
10
1
9
Month 2
12
2
10
Month 3
14
3
11
Month 4
8
1
7
Table 1.9 : Truck Leasing Strategy Variables

26
Daily Fuel Cost = $100 / truck
Monthly fuel costs for short term and long term leased trucks
Monthly fuel cost per truck = 20 * $100 = $2.000
1-) Decision Variables
Xij = Number of trucks from a short term lease in month i for period of J month(s)
For example X23 means, number of trucks leased for 3 months on the 2nd month of
the project.
Yi = Number of trucks from a long term lease used in month i
2-) Objective Function Definition
Decision Variables
Cost for Leasing Period
X11, X21, X31, X41
X12, X22, X32
X13, X23
X14
For 1 month $4.000 + $2.000 = $6.000 For 2 month 2 ($3.700 + $2.000) = $11.400 For 3 month 3 ($3.225 + $2.000) = $15.675 For 4 month 4 ($3.040 + $2.000) = $20.160
Min Z = 6.000X11 + 11.400X12 + 15.675X13 + 20.160X14 + 6.000X21 + 11.400X22 + 15.675X23
+ 6.000X31 + 11.400X32 + 6.000X41 + 2.000Y1 + 2.000Y2 + 2000Y3 + 2000Y4
Subject to
1) X11 + X12 + X13 + X14 + Y1 = 10
2) X12 + X13 + X14 + X21 + X22 + X23 + Y2 = 12
3) X13 + X14 + X22 + X23 + X31 + X32 + Y3 = 14

27
4) X14 + X23 + X32 + X41 + Y4 = 8
5) Y1 <= 1
6) Y2 <= 2
7) Y3 <= 3
8) Y4 <= 1
3-) Solutions
1-) The optimal leasing plan as follow:
The number of leased trucks in Xij and Yi ;
X13 X14 X23 X31 Y1 Y2 Y3 Y4
3 6 1 1 1 2 3 1
15.675X13 + 20.160X14 + 15.675X23 + 6.000X31 + 2.000Y1 + 2.000Y2 + 2000Y3 +
2000Y4
Optimal Leasing Cost = $203.660
Figure 4.0 : Truck Leasing Strategy Question 1 Excel Solution

28
2-) The cost associated with the optimal leasing plan as follow:
Our short term leased truck includes also driver costs but Bob Reep want to use our own
drivers. So, in addition to our optimal leasing plan, the driver costs of short term and long
term leased trucks will be add.
Driver Cost = $20 / hour
Monthly Driver Cost = $20 * Shift (hours ) * Number of Used Trucks
Used Truck in Project Shift
(hours)
Driver Cost
($)
Month 1 10 160 32.000
Month 2 12 160 38.400
Month 3 14 160 44.800
Month 4 8 160 25.600
Table 2.0 : Truck Leasing Strategy Question 2 Driver Costs
Total Driver Cost = $140.800
The Cost Associated with the Optimal Leasing Plan = $140.800
Total Cost for the Project = $203.660 + $140.800 = $344.460
3-) The cost for Reep Construction to maintain its current policy of no layoffs:
In short term leasing plan, the PennState company gives the driver along with the trucks.
But, Bob Reep chose to use his own drivers and pay them $20 an hour. So, the cost of
maintain no layoffs policy is;
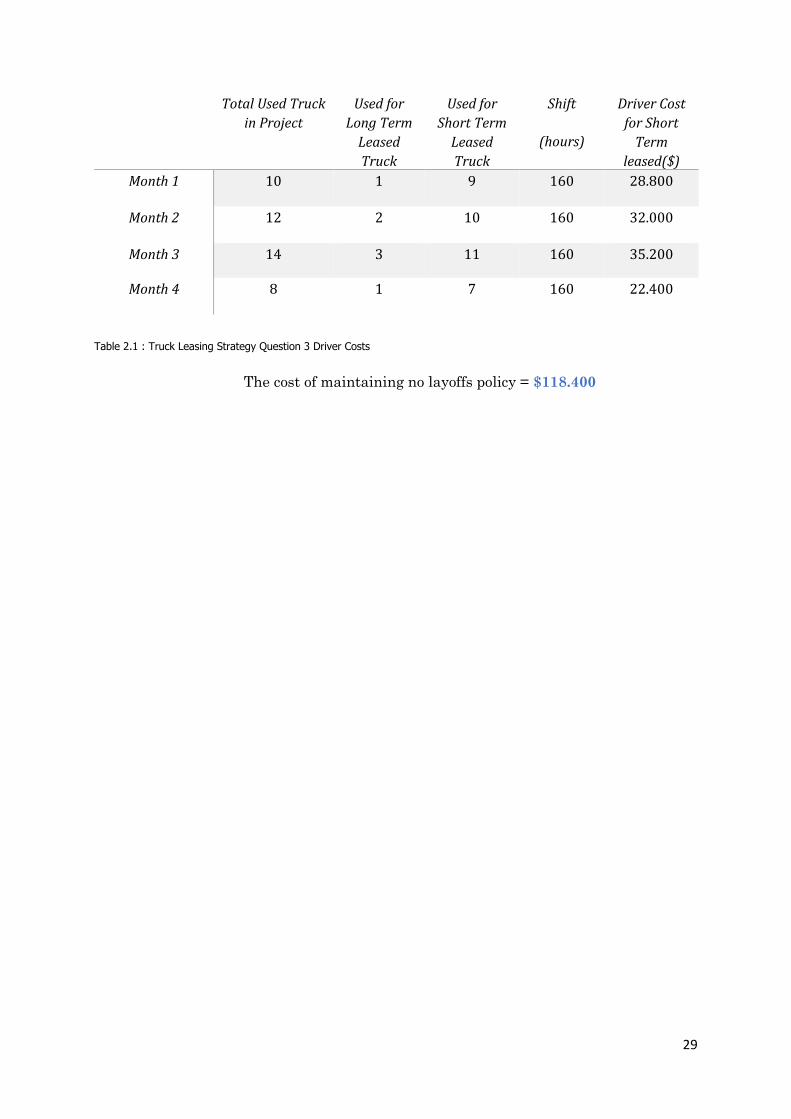
29
Total Used Truck
in Project
Used for
Long Term
Leased
Truck
Used for
Short Term
Leased
Truck
Shift
(hours)
Driver Cost
for Short
Term
leased($)
Month 1 10 1 9 160 28.800
Month 2 12 2 10 160 32.000
Month 3 14 3 11 160 35.200
Month 4 8 1 7 160 22.400
Table 2.1 : Truck Leasing Strategy Question 3 Driver Costs
The cost of maintaining no layoffs policy = $118.400