
Management turnover in subsidiaries of conglomerates versus stand-alone firms
34
Journal of Financial Economics 72 (2004) 63–96 Management turnover in subsidiaries of conglomerates versus stand-alone firms $ Chris McNeil a , Greg Niehaus b, *, Eric Powers b a School of Business, Penn State Erie, 16563, USA b Moore School of Business, University of SC, 29208, USA Received 11 June 2002; accepted 6 March 2003 Abstract We compare turnover of subsidiary managers inside conglomerate firms to turnover of CEOs of comparable stand-alone firms. We find that, compared to turnover of CEOs, subsidiary manager turnover is significantly more sensitive to changes in performance and significantly more likely following poor performance. For subsidiary managers, the relation between turnover and performance is significantly stronger when the subsidiary operates in an industry that is related to the parent’s primary industry. Results suggest that boards of directors are relatively ineffective disciplinarians of CEOs and despite their other apparent failings, conglomerate firms have relatively strict disciplining mechanisms for subsidiary managers. r 2003 Elsevier B.V. All rights reserved. JEL classification: J41; J63; G34 Keywords: Management turnover; Internal labor market; Conglomerates 1. Introduction In 1969, Armen Alchian posited that replacement of an inefficient division head would be ‘‘quicker’’ within a conglomerate firm than if the division were a stand- ARTICLE IN PRESS $ We thank an anonymous reviewer, Jim Granato, Jan Mahrt-Smith, Carlos Molina, Ted Moore, Tod Perry, Sergey Tsyplakov, Ralph Walking, Karen Wruck, and seminar participants at the University of South Carolina, the Ohio State University, the 2002 Financial Management Association Conference, the 2002 Southern Finance Association Conference, and the 2003 National Bureau of Economic Research Conference on Corporate Governance for helpful comments. We appreciate the valuable research assistance of Tamara Rhynehardt and Lynn McNeil. *Corresponding author. E-mail address: [email protected] (G. Niehaus). 0304-405X/$ - see front matter r 2003 Elsevier B.V. All rights reserved. doi:10.1016/S0304-405X(03)00190-9
-
Upload
chris-mcneil -
Category
Documents
-
view
212 -
download
0
Transcript of Management turnover in subsidiaries of conglomerates versus stand-alone firms

Journal of Financial Economics 72 (2004) 63–96
Management turnover in subsidiaries ofconglomerates versus stand-alone firms$
Chris McNeila, Greg Niehausb,*, Eric Powersb
a School of Business, Penn State Erie, 16563, USAbMoore School of Business, University of SC, 29208, USA
Received 11 June 2002; accepted 6 March 2003
Abstract
We compare turnover of subsidiary managers inside conglomerate firms to turnover of CEOs
of comparable stand-alone firms. We find that, compared to turnover of CEOs, subsidiary
manager turnover is significantly more sensitive to changes in performance and significantly
more likely following poor performance. For subsidiary managers, the relation between
turnover and performance is significantly stronger when the subsidiary operates in an industry
that is related to the parent’s primary industry. Results suggest that boards of directors are
relatively ineffective disciplinarians of CEOs and despite their other apparent failings,
conglomerate firms have relatively strict disciplining mechanisms for subsidiary managers.
r 2003 Elsevier B.V. All rights reserved.
JEL classification: J41; J63; G34
Keywords: Management turnover; Internal labor market; Conglomerates
1. Introduction
In 1969, Armen Alchian posited that replacement of an inefficient division headwould be ‘‘quicker’’ within a conglomerate firm than if the division were a stand-
ARTICLE IN PRESS
$We thank an anonymous reviewer, Jim Granato, Jan Mahrt-Smith, Carlos Molina, Ted Moore, Tod
Perry, Sergey Tsyplakov, Ralph Walking, Karen Wruck, and seminar participants at the University of
South Carolina, the Ohio State University, the 2002 Financial Management Association Conference, the
2002 Southern Finance Association Conference, and the 2003 National Bureau of Economic Research
Conference on Corporate Governance for helpful comments. We appreciate the valuable research
assistance of Tamara Rhynehardt and Lynn McNeil.
*Corresponding author.
E-mail address: [email protected] (G. Niehaus).
0304-405X/$ - see front matter r 2003 Elsevier B.V. All rights reserved.
doi:10.1016/S0304-405X(03)00190-9

alone firm, because headquarters executives ‘‘are specialists y who are rewardedmore fully for collecting and evaluating information about people’’ (p. 349). Yet,Alchian ended his discussion of the issue with ‘‘But what the truth is, I do notknow.’’ Despite the large volume of research conducted in the past 30 years, we stillhave limited knowledge of how monitoring and disciplining of subsidiary managerswithin conglomerates differs from that of stand-alone firm CEOs. The only directevidence is by Blackwell et al. (1994), who report in a footnote that the turnover rateof top managers at subsidiary Texas banks is greater than that of CEOs at stand-alone Texas banks, but that the sensitivity of turnover to performance does not differbetween the two groups of managers. This paper presents a simple model that yieldspredictions that are consistent with Alchian’s conjecture and reports empirical testson matched samples of subsidiary managers and stand-alone firm CEOs. Our resultsindicate that turnover of subsidiary managers is significantly more likely followingpoor operating performance than is turnover of CEOs of comparable stand-alonefirms.
To formalize our thinking about management turnover, we borrow a frameworkfrom the labor economics literature in which turnover occurs in response to poorperformance (e.g., Jovanovic, 1979). The basis of the model is as follows. Whenmanagers are hired, neither the manager nor the principal knows the manager’sability with certainty. The principal uses ex post performance to revise expectationsabout the manager’s ability and fires the manager if the principal’s expected benefitsof taking another draw from the pool of managers exceeds the principal’s costs ofreplacement. We assume that the principal incurs private replacement costs that arenot incurred by the firm’s owners and, consequently, that incentives for the principalare not perfectly aligned with those of the firm’s owners.
The model predicts that lower replacement costs, a greater sensitivity of theprincipal’s wealth to firm performance, and better information about theperformance-generating process increase the likelihood of turnover following poorperformance. We then relate these results to subsidiaries and stand-alone firms,where headquarters executives are the principals of subsidiary managers and boardsof directors are the principals of CEOs. We argue that (1) the costs of replacing asubsidiary manager are generally lower than the costs of replacing a CEO, (2)headquarters executives’ compensation, and therefore their wealth, generally is moresensitive to firm performance than that of boards of directors, and (3) headquartersexecutives are likely to have better information about the performance-generatingprocess than do boards of directors. These arguments lead to the prediction that thelikelihood of turnover following poor performance will be greater for top managersof subsidiaries than for CEOs of stand-alone firms.
To test this prediction, we construct a sample of subsidiary managers and pair itwith a sample of CEOs of stand-alone firms matched on the basis of calendar time,size, and industry (SIC code). Matching helps to ensure that we compare businessentities that are similar in terms of their asset structure but differ in terms of theirorganizational structure. Using entity-specific operating performance, our empiricalresults indicate that, after controlling for manager age, ownership structure, boardstructure, industry, stock price performance, and entity size, the likelihood of
ARTICLE IN PRESSC. McNeil et al. / Journal of Financial Economics 72 (2004) 63–9664

turnover following poor performance and the sensitivity of turnover to performanceare significantly greater for top subsidiary managers than for CEOs of stand-alonefirms. For example, when our operating performance measure drops from themedian to the sample’s 25th percentile (and all other variables are at their medians),the predicted probability of turnover during that year and the subsequent two yearsincreases from 0.34 to 0.51 for subsidiary managers versus 0.30 to 0.35 for stand-alone CEOs.
We also examine subsidiary manager turnover in isolation, focusing oncharacteristics of conglomerates that are predicted to influence turnover ofsubsidiary managers. For example, Gertner et al. (1994) present a model in whichthe cost of redeploying assets is lower in related conglomerates. They predict that‘‘business-unit managers inside related conglomerates will be more likely to bereplaced y following poor performance y than business-unit managers insideunrelated conglomerates’’ (p. 1228). Consistent with this prediction, we find that thelikelihood of turnover following poor performance and the sensitivity of turnover toperformance are significantly greater when the subsidiary operates in an industrythat is related to the primary industry of the parent. For example, when ouroperating performance measure drops from the median to the 25th percentile (andother variables equal their sample medians), the predicted probability of turnoverincreases from 0.27 to 0.57 for subsidiaries operating in the same industry as theparent and from 0.27 to 0.39 for subsidiaries operating in unrelated industries.
Our analysis relates to several lines of inquiry in the literature. A large body ofresearch focuses on the effectiveness of the board of directors and the market forcorporate control as mechanisms for disciplining CEOs. For example, Weisbach(1988) considers whether the presence of outside board members influences CEOturnover, while Goyal and Park (2002) analyze whether bestowing CEO andchairman duties on one individual affects CEO turnover. Denis et al. (1997), Frankset al. (2001), and Volpin (2002) examine how ownership structure influences CEOturnover. Mikkelson and Partch (1997) and Denis and Kruse (2000) test whether adecline in takeover activity during the late 1980s affected CEO turnover. Thesestudies provide valuable information about factors affecting CEO turnover, but theydo not show how the disciplining of CEOs compares to that of managers operatingunder alternative disciplining mechanisms.
Several recent papers address turnover of executives operating under alternativedisciplining mechanisms. For example, Blackwell et al. (1994) analyze turnover ofsubsidiary bank managers, Mian (2001) examines turnover of CFOs, and Fee andHadlock (2002) examine turnover of the four executives immediately below theCEO. In each instance, these are executives who are likely to be disciplined by higherlevel executives rather than the board of directors. These studies find that the overallturnover rate of managers below the CEO level is greater than the turnover rate ofCEOs, but, in contrast to one of our main results, they find that the sensitivity ofturnover to performance is not greater for lower level executives.
The difference in results regarding the sensitivity of turnover to performance ismost likely due to the performance measures employed and the types of managersbeing compared. With the exception of Blackwell et al. (1994), the existing literature
ARTICLE IN PRESSC. McNeil et al. / Journal of Financial Economics 72 (2004) 63–96 65
examines managers with different operating responsibilities and employs firm-levelperformance measures that are likely to be differentially informative about CEO andlower level executive quality. In contrast, we compare managers with similaroperating responsibilities and, by using Compustat segment data, we construct asubsidiary-level operating performance measure that arguably is as informativeabout subsidiary manager quality as is firm-level operating performance about CEOquality.
To the extent that we have performance measures that are equally informativeabout subsidiary manager and CEO quality, the significantly greater sensitivity ofturnover to poor performance for subsidiary managers reflects differences in therespective disciplining mechanisms. Our evidence on the disciplining of CEOs versussubsidiary managers, therefore, provides new evidence about the costs and benefitsof organizing business units within a conglomerate structure versus as stand-alonefirms. Existing research suggests that this type of organizational design decisiondepends on which organizational form allocates capital more efficiently (e.g. Gertneret al., 1994; Scharfstein and Stein, 2000; Rajan et al., 2000; Wulf, 2000; Matsusakaand Nanda, 2002), improves the ability of the market to value the firm (e.g. Habibet al., 1997; Krishnaswami and Subramanian, 1999; Gilson et al., 2001), andprovides the greatest incentives for managers to increase value (Schipper and Smith,1986; Holmstrom and Tirole, 1993). In general, these papers suggest that a stand-alone structure is more efficient. Our evidence, however, suggests that aconglomerate structure has a stricter disciplining mechanism, which may, at leastpartly, offset the other potential advantages of a stand-alone structure.
Anderson et al. (2000) and Berry et al. (2000) examine whether CEO turnoverdiffers between conglomerates and single-segment firms. Although at first glancethese papers might seem similar to this study, the issues addressed differ. Bycomparing CEO turnover in focused, stand-alone firms to subsidiary managerturnover in conglomerates, we compare turnover of managers that have similaroperating responsibilities but work within different organizational structures.Anderson et al. and Berry et al. compare turnover of managers in similarorganizational structures, but these managers differ in their operating responsi-bilities.
The paper proceeds as follows. In the next section, we present a simple model toshow why the sensitivity of turnover to performance can differ between subsidiariesand stand-alone firms. In Section 3, we describe the sample and report descriptivestatistics. Section 4 presents the empirical results on turnover in subsidiaries versusstand-alone firms. Next, Section 5 analyzes subsidiary manager turnover and Section6 concludes with a short summary.
2. Management turnover model
The responsibilities of a principal in a principal-agent relationship are multi-dimensional. Whether it is a board of directors disciplining a CEO or headquartersexecutives disciplining a subsidiary manager, the principal must decide how much
ARTICLE IN PRESSC. McNeil et al. / Journal of Financial Economics 72 (2004) 63–9666
information to gather about the agent’s performance, process the information,and then decide whether to take disciplinary action. To better understand whyturnover of top subsidiary managers can differ from that of CEOs of stand-alonefirms, we develop a simple model that is similar to models used in Jovanovic (1979),McKenna (1986), and Murphy (1986). The purpose of the model is to highlightgeneral characteristics that influence the likelihood of management turnover.We then compare subsidiaries and stand-alone firms with respect to thesecharacteristics.
2.1. Factors affecting turnover
At the beginning of the first period, managers are hired, but neither the managernor the principal knows the manager’s true quality, y: Everyone, however,knows that y is drawn from a normal distribution with mean m and standarddeviation sy: For simplicity, we assume that y is in monetary units. The managerworks for the first period and generates an observable performance metric y,which equals yþ e; where e is a random factor that is normally distributed withmean zero and standard deviation se: Since y depends on y; y provides informationabout the manager’s quality. The greater the standard deviation of e; se; the lessinformative y is about the manager’s quality. After observing y, the principaluses Bayes’ Rule to calculate a revised expected value for y: The principal’sexpectation of the manager’s quality after observing first period performance is aweighted average of the prior expected quality, m; and the observed performancevalue, y, where the weights are the inverses of the respective variances, i.e., theprecisions (Box and Tiao, 1973):
EðyjyÞ ¼ðys�2
e þ ms�2y Þ
ðs�2e þ s�2
y Þ: ð1Þ
After updating expectations about managerial quality, the principal has the optionof replacing the existing manager with a new draw from the managerial labor pool ata cost to the firm of C. In addition, the principal incurs a private cost equal to CP ifthe principal replaces the manager. Since CP is borne fully by the principal, while C isshared with other owners, the private cost can lead to a divergence between theturnover decision made by the principal and the turnover decision that would beoptimal for shareholders.
Performance in the second period is generated by the same process as in the firstperiod ðy ¼ yþ eÞ; except that there is a new realization for e and the manager’squality can differ if the first period manager is replaced. We assume that the principalis risk neutral, there is no discounting, and the principal’s wealth is proportional tothe firm’s performance, where the proportionality factor is a: We also assume thatthe firm ceases to exist after the second period, although in our discussion of theresults, we consider the implications of additional periods.
The expected second-period payoff to the principal if the existing manager isreplaced equals aðm� CÞ � CP; and the expected payoff if the existing manager isretained equals aEðyjyÞ: Thus, to maximize expected wealth, the principal replaces
ARTICLE IN PRESSC. McNeil et al. / Journal of Financial Economics 72 (2004) 63–96 67
the existing manager if aEðyjyÞoaðm� CÞ � CP: By substituting Eq. (1), we find thatreplacement occurs when
yom� C þCP
a
� �s�2e þ s�2
y
s�2e
� �� y�: ð2Þ
Eq. (2) states that replacement occurs when performance, y, falls below someminimum required performance level, y�:
Several points are worth noting about the turnover condition. First, y� is less thanthe output that would be expected from a new manager ðmÞ: Intuitively, principals arewilling to keep an existing manager with below average expected performancebecause replacement is costly. Second, the greater the replacement costs, the morelenient the performance criterion, all else equal. Third, as incentives for the principalbecome more closely aligned with the objective of maximizing firm value (as aincreases), personal replacement costs ðCPÞ become less important and theperformance criterion becomes more stringent.
Also note that as the noise in the performance-generating process, se; increases,the minimum required performance, y�; decreases. Intuitively, as se increases,y becomes less informative about the manager’s quality, and so principalsgive managers more leeway. This point highlights the importance of using aperformance metric in the empirical analysis that is equally informative aboutmanager quality when comparing the disciplining mechanisms for different types ofmanagers.
As researchers, we cannot observe each organization’s required performance level,y�: Nevertheless, if we assume that y� varies systematically across organization type(stand-alone versus subsidiary), then the organization type that has a higher averagevalue of y� will exhibit a higher probability of turnover conditional on poorperformance (our Appendix provides expositional details). Moreover, providedperformance is not so low that the probability of turnover is extremely high for bothtypes, the organization type that has a higher average value of y� will exhibit agreater sensitivity of turnover to performance, i.e., the likelihood (not the odds) ofturnover will increase by a greater amount when performance declines. In thefollowing subsections, we argue that the underlying parameters determining theminimum performance level, y�; cause subsidiaries to have higher values of y�; onaverage, than stand-alone firms. Consequently, the probability of turnoverconditional on poor performance and the sensitivity of turnover to performancewill likely be greater for subsidiary managers than for CEOs of stand-alone firms.
2.2. Differences between subsidiaries and stand-alone entities
2.2.1. Replacement costs (C)
The replacement costs incurred by a firm ðCÞ are likely to be higher when the CEOof a stand-alone firm is replaced than when a subsidiary manager is replaced, in part,because the skill set needed to be a CEO differs from that of a subsidiary manager.Wruck and Wruck (2002) argue that top managers of publicly traded companiesneed corporate governance skills that subsidiary managers do not need. The pool of
ARTICLE IN PRESSC. McNeil et al. / Journal of Financial Economics 72 (2004) 63–9668

suitable replacement CEOs, therefore, is likely smaller than the pool of suitablereplacement subsidiary managers. This implies that the cost of finding and attractinga suitable replacement is likely greater for CEOs of stand-alone firms than forsubsidiary managers. Even holding the size of the pool of potential replacementsconstant, replacement costs incurred when headquarters executives are working toidentify a suitable replacement manager are likely to be less than when a board ofdirectors is engaged in the same task. This is because headquarters executives areinvolved in day-to-day operations and are therefore more likely to be familiar withthe internal pool of potential successors.
Severance payments (golden parachutes) provide another reason why replacementcosts are likely to be higher for CEOs of stand-alone firms. One role of severancepayments is to help reduce manager resistance to value-increasing merger ortakeover offers (Jensen, 1988; Harris, 1990; Lafanowicz et al., 2000). Since subsidiarymanagers are less involved in corporate control issues, their severance packages arelikely to be lower than those for CEOs of stand-alone firms. Higher replacementcosts for CEOs of stand-alone firms will lower the minimum required performancelevel and thereby decrease the likelihood of CEO turnover following poorperformance.
2.2.2. Private replacement costs ðCPÞPrincipals can incur costs when they replace a manager, which are not shared
with equity-holders. We posit that these private replacement costs generallyare higher for a board of directors considering replacement of a CEO than forheadquarters executives considering replacement of a subsidiary manager.One reason is that board members are more likely to have personal or businessrelations with a CEO, which will be disrupted if the manager is replaced. Hallock(1997), for example, provides evidence of nepotism in the composition of boards.Also, inside board members are more likely to lose their positions with the firm if theCEO is replaced (Fee and Hadlock, 2002). In contrast, headquarters executivestypically can fire a subsidiary manager without being concerned about losing theirown positions.
Additional private costs arise from the possibility that an attempt to replace amanager will be unsuccessful. For parsimony, we have not modeled the possibility ofunsuccessful replacement attempts, but the implications are straightforward. Incontrast to headquarters executives, who are likely to have complete authority toremove a subsidiary manager, a critical mass of directors is required to remove aCEO. Obtaining critical mass will often be difficult since the CEO, as well as severalindividuals hand-picked by the CEO, will generally be directors. Thus, greater effort(i.e., greater cost) is likely required to remove a CEO. Moreover, there is always thepossibility that a coup d’etat by the board will fail, resulting in retribution. Theseeffects reduce the minimum required level of performance for CEOs relative tosubsidiary managers, providing another reason that the probability of turnoverfollowing poor performance will be greater for subsidiary managers than for stand-alone firm CEOs.
ARTICLE IN PRESSC. McNeil et al. / Journal of Financial Economics 72 (2004) 63–96 69
2.2.3. Sensitivity of the principal’s wealth to performance
Compensation for headquarters executives typically is more closely tied to firmvalue than is compensation for the board. Hall and Liebman (1998), for example,find that the median sensitivity of one year’s worth of incentive pay for a CEO is$5.29 per $1,000 of additional shareholder value. In contrast, Perry (1999) finds thatthe outside board members have a median value for their combined wealthsensitivity of one year’s worth of incentive pay equal to $0.24 per $1,000 ofadditional shareholder value. Harford (2003) provides further evidence on directors’incentives. In addition, the value of human capital for headquarters executives islikely to be more sensitive to the firm’s performance than that of outside boardmembers. Brickley et al. (1999) find that post-retirement opportunities for CEOs arerelated to performance, suggesting that even the human capital of executives close toretirement depends on firm performance. Consequently, a is likely greater forheadquarters executives than for boards of directors, implying that the minimumrequired performance level for top subsidiary managers is likely greater than that forCEOs of stand-alone firms.
2.2.4. Information about the performance generating process
Since headquarters executives are involved in the firm’s daily operations, they arelikely to have more information about random factors influencing performance aswell as greater expertise in interpreting information about performance (Alchian,1969; Williamson, 1981). Also, headquarters executives are likely to have moreinformation than the board of directors for reasons already discussed. That is, boardmembers’ incentives to become informed will be reduced if, ultimately, they will beless willing to replace a poorly performing manager, and if they receive a lower shareof the returns from gathering information than do headquarters executives.
One way to model the better information of headquarters executives is to assumethat the noise in the performance-generating process is composed of twoindependent and normally distributed noise terms, i.e., e ¼ e1 þ e2; and thatheadquarters executives filter out the second noise term, but boards of directorscannot. Under these assumptions, headquarters’ updated expectation of managerquality is given by Eq. (1), except that unfiltered performance ðyÞ is replaced byfiltered performance ð #y ¼ y � e2Þ; and the precision of the unfiltered performanceðs�2
e Þ is replaced by the greater precision of the filtered performance ðs�2e1 Þ: The
greater precision of the filtered performance measure implies that the minimumrequired level of filtered performance for subsidiary managers is greater than theminimum required level of unfiltered performance for stand-alone CEOs.1 That is,the performance criteria will be stricter for subsidiary managers.
If the filtered noise term ðe2Þ has mean zero, then, on average, turnover ofsubsidiary managers will occur at higher levels of unfiltered performance than willturnover of stand-alone managers. The difference between filtered and unfilteredperformance, however, will add noise to the relation between turnover and unfilteredperformance. This effect biases against finding evidence of the hypothesized
ARTICLE IN PRESS
1This is a straightforward extension of Eq. (2). Details are available from the authors on request.
C. McNeil et al. / Journal of Financial Economics 72 (2004) 63–9670

information advantage of headquarters executives when examining the relationbetween management turnover and unfiltered performance.
2.3. Model with multiple signals
The empirical literature shows that the likelihood of CEO turnover increases asaccounting-based operating performance decreases and as stock price performancedecreases. Conceptual arguments also support the use of both types of metrics whenassessing the performance of a CEO of a stand-alone firm. For example, Hermalinand Weisbach (1998) argue that accounting performance measures are likely to bemore informative about existing CEO quality because stock prices reflect futureexpected performance, including the effects of anticipated CEO turnover. Also,Brickley et al. (1999) argue that superior accounting returns can indicate superiorCEO ability because some of the rents generated by a CEO with superior ability areshared with the firm if the CEO’s skills are firm specific and because somecompensation costs, such as options granted, are not reported as an expense. On theother hand, stock returns are more timely, not as easily manipulated as accountingperformance measures, and reflect management actions that impact operatingearnings some time in the future.
Arguments also exist to support both types of metrics when assessing a subsidiarymanager’s performance. An advantage of accounting based operating performanceis that it depends primarily on the performance of the subsidiary that the manager isoverseeing, whereas stock price performance measures depend on the entire firm’sperformance. Consistent with this argument, Keating (1997) reports survey evidencethat division-level accounting metrics are used more often to assess divisionmanagers than firm-level metrics. Still, stock price performance measures can beinformative about subsidiary managers’ performance when there are interdepen-dencies across subsidiaries (Bushman et al., 1995).
Extending the model to include two independent performance signals isstraightforward. Let y1 ¼ yþ e; eBNð0;s2
e Þ and y2 ¼ yþ Z; ZBNð0;s2ZÞ represent
two performance measures. If the error terms ðe; ZÞ are uncorrelated, thecombination of signals for which it is optimal for the principal to replace themanager and take another draw from the pool of managers satisfies the followingexpression:
y1s�2e
ðs�2e þ s�2
Z Þþ y2
s�2Z
ðs�2e þ s�2
Z Þom� C þ
CP
a
� �ðs�2
e þ s�2Z þ s�2
y Þ
ðs�2e þ s�2
Z Þ: ð3Þ
The left-hand side is a weighted average of the two signals where the weights arethe relative precisions, and the right-hand side is analogous to the minimum requiredperformance level ðy�Þ from Eq. (2). Eq. (3) implies that turnover occurs when theweighted average of the performance signals is sufficiently below the expectedperformance of a replacement manager.
Having two informative signals changes the turnover condition in two ways. First,both signals need to be considered with the weight given to each signal determined by
ARTICLE IN PRESSC. McNeil et al. / Journal of Financial Economics 72 (2004) 63–96 71

the signal’s relative precision. Second, as the overall precision of the combinedsignals, ðs�2
e þ s�2Z Þ; increases, the minimum required performance level (the right-
hand side of Eq. (3)) increases. These results can be applied to multiple signalsreceived in a single period (e.g., operating performance and stock price performancein a given year) or to sequential signals received over multiple periods. The latterinterpretation has the additional implication that a manager’s tenure would impactthe turnover condition because, as tenure increases, the number of relevantperformance signals increases and the overall precision of the combined signalsincreases (Kim, 1996).
2.4. Summary
The turnover model presented above and the subsequent discussion provide themain motivation for our empirical analysis. Additional motivation for our analysiscomes directly from Gertner et al. (1994). Although their model is concerned withthe allocation of capital, they state that, since conglomerates can more easilyredistribute assets between related subsidiaries, ‘‘business-unit managers insiderelated conglomerates will be more likely to be replaced y following poorperformance than either (1) top managers of comparable stand-alone firms or (2)business-unit managers inside unrelated conglomerates’’ (p. 1228). The latterprediction, along with the dearth of evidence on subsidiary manager turnover,motivates our separate analysis of subsidiary manager turnover in Section 5.
3. Data
Our analysis requires two types of business entities: (1) subsidiaries of conglom-erates and (2) comparable focused, stand-alone firms. Because of the significanthand-collecting of data, we only examine firms after 1987. This greatly increases thelikelihood of obtaining information from electronic sources such as Lexis–Nexis. Weconstruct the samples to ensure cross-sectional variation in performance within eachgroup, but we attempt to match based on calendar time, size, and industry, tocontrol for many other factors influencing turnover. Examples of other factorsinclude activity in the external market for corporate control (Hadlock and Lumer,1997; Mikkelson and Partch, 1997) and the homogeneity/competitiveness of theindustry (Parrino, 1997; Defond and Park, 1999).
Although we ultimately use both accounting operating performance and stockprice performance in the empirical analysis, we select samples to ensure cross-sectional variation in accounting operating performance. The reason is thataccounting operating performance measures can be constructed for both focused,stand-alone firms and subsidiaries which are likely equally informative about theabilities of the respective managers. In contrast, for subsidiary managers, stock priceperformance also reflects the abilities of headquarters executives and of sistersubsidiary managers.
ARTICLE IN PRESSC. McNeil et al. / Journal of Financial Economics 72 (2004) 63–9672

3.1. Subsidiary/segment selection
Since information about subsidiaries is the most costly to obtain and to ensure anadequate number of turnover events, we begin by identifying segments ofconglomerate firms that have experienced a significant decline in operatingperformance relative to their industry. A firm is classified as a conglomerate firmif less than 90% of its sales are in one segment. We use operating performancerelative to the industry in order to identify performance declines attributable tomanagers rather than to industry-wide downturns. Operating performance ismeasured using the ratio of earnings before interest, taxes, and depreciation tototal assets (EBITD/TA) for a segment relative to the median value of EBITD/TAfor the industry, using two- or three-digit SIC codes to define industry. Using thisperformance metric, we identify 808 segments during the period 1987 to 1998 thathave (1) above median performance in one year and (2) bottom-quartile performancethe following year. Denis and Kruse (2000) use a similar screening process applied atthe firm level.
We then try to identify the manager of these segments using the annual Directory
of Corporate Affiliations, as well as 10Ks and corporate proxy statements.Identifying managers is difficult because the organizational structure of the firmoften does not match reported segment data and because many firms report littleinformation about lower-level managers. For example, many firms combine multipledivisions/subsidiaries into one segment for accounting purposes. If a segment cannotbe matched to a manager that we can track over our turnover period, then thesegment is discarded. This search process results in a sample of 101 segments withidentifiable managers.2 We refer to these observations as poor-performancesubsidiaries and the year of poor performance as the base-year.
To ensure cross-sectional variation in performance in our subsidiary sample,for each of the poor-performance subsidiaries, we select a matched segment (basedon calendar time, size, and industry) that has good performance. Specifically,we identify all segments with operating performance above the industry medianfor both the base-year –1 and the base-year, asset value within 25% of the poor-performance subsidiary’s asset value, and the same two-digit SIC code as thepoor-performance subsidiary. We then select the segment that is closest in size tothe poor-performance subsidiary for which a manager can be identified and trackedover our turnover period. If no segment satisfies the size and industry restrictions ora manager cannot be identified, we search for potential matches with identifiablemanagers having the same one-digit SIC code and asset value within 25% of thepoor-performance subsidiary. If we still lack a match, we select the segment with anidentifiable manager that is closest in size regardless of industry. Combining these
ARTICLE IN PRESS
2The 101 segments are, on average, larger and are part of larger firms than the 707 segments for which
we cannot identify managers. Since we control for size in both our matching process and our regression
analysis, exclusion of smaller subsidiaries is unlikely to explain differences in the turnover/performance
relationship between subsidiary managers and CEOs. Although we cannot test whether our results would
generalize to smaller entities, we have no reason to suggest that they would not.
C. McNeil et al. / Journal of Financial Economics 72 (2004) 63–96 73
good-performance subsidiaries with the poor-performance subsidiaries, we have 202subsidiaries with identifiable managers.
3.2. Stand-alone firm selection
To complete the data set, we select two focused, stand-alone firms that match thepoor-performance subsidiaries with respect to size and industry affiliation during thebase-year. We define a focused, stand-alone firm as a US based firm with at least95% of its sales coming from a single segment. One stand-alone firm has a decline inindustry-adjusted operating performance from above the median to the lowestquartile between the base-year –1 and the base-year. The other stand-alone firm hasindustry-adjusted performance above the median in both the base-year –1 and thebase-year. The same size and industry restrictions used in selecting good-performance subsidiaries are again applied.
This process gives a total sample of 404 entities, including one-half subsidiariesand one-half focused, stand-alone firms. Within each of these categories, one-halfhad relatively poor performance in the base-year and one-half had relatively goodperformance. One subsidiary appears in the sample twice (eight years separate thebase-years of the observations). Otherwise, no stand-alone firm or subsidiary is usedmore than once, however, a few parents have multiple subsidiaries in the sample.Note that the sample omits entities that had modestly poor operating performance inthe base-year. As a consequence, the overall frequency of turnover is likely to exceedthat observed in a more general sample, but we do not expect that this will bias ourresults.3
3.3. Determination of turnover
For each observation, management turnover during a three-year period beginningin the base-year is determined by examining the Directory of Corporate Affiliations,annual reports, 10Ks, proxy statements, and news reports. Warner et al. (1988) notethat the lag between poor performance and turnover can be up to two years. Becauseof this slow reaction, some studies of CEO turnover use pooled or panel data, oftenwith lagged variables, covering a multi-year time frame for each firm. Due to the costof constructing panel data for subsidiaries, we elect to follow the approach of Denisand Kruse (2000) and focus on the base-year’s performance for each firm and trackturnover over a three-year period. Mikkelson and Partch (1997) track turnover overa similar multi-year period.
ARTICLE IN PRESS
3We confirmed this statement using a simulation experiment. In particular, we parameterized the model
from the previous section and used Monte Carlo simulation to generate data on performance, which in
turn yielded data on turnover. We then estimated logit regression models similar to those in the empirical
analysis with all the simulated observations and then again omitting the middle two performance quartiles.
The results of repeated iterations of this experiment indicate that the coefficients on the performance
variables are not changed, on average, when the observations of the middle quartiles are omitted, but that
the statistical significance increases. Thus, our selection process is unlikely to introduce bias in the
coefficients, but it can lead to an increase in power for the statistical tests.
C. McNeil et al. / Journal of Financial Economics 72 (2004) 63–9674
For the empirical analysis, subsidiary managers who obtain internal promotionsor move laterally are not classified as having turned over. In a couple of instances, asubsidiary or stand-alone firm was acquired, and the manager was not employedfollowing the acquisition by either the original parent or the acquirer. We classifythese managers as having turned over.
3.4. Other data
We identify the age of the manager during the base-year using a variety of sources,including proxy statements, internet searches, and in a few instances direct contact.Since prior studies have shown that corporate board composition, insider shareholdings, CEO ownership, and whether the CEO concurrently is the Chairman of theBoard are associated with CEO turnover, we gather these data from proxystatements in the base-year �1 for each subsidiary’s parent and each stand-alonefirm. Compustat data are used to obtain information on asset size and operatingperformance (previously defined). Finally, Center for Research on Security Prices(CRSP) data are used to calculate the return for the common stock of the stand-alone firms and the parents of the subsidiaries over the base-year. CRSP data arealso used to calculate equal-weighted industry returns and market returns.
3.5. Summary statistics
Panel A of Table 1 presents the distribution of base-years. Since the base-year forthe poor-performance subsidiaries is used as a matching criteria for the selection ofthe other three entity categories, the distributions of base-years is the same for eachof the four categories of entities. The base-years are relatively uniformly distributedfrom 1987 to 1998.
In selecting matches, we look for entities (poor-performance stand-alones, good-performance stand-alones, and good-performance subsidiaries) that match eachpoor-performance subsidiary with respect to calendar time, asset size, and industryaffiliation, in that order of priority. Not surprisingly, therefore, we are not entirelysuccessful in matching based on industry, especially for the poor-performance stand-alone firms for which there are fewer entities from which to choose. Only 44 of 101poor-performance stand-alone firms selected have the same one-digit SIC code astheir matching poor-performance subsidiary. In contrast, 85 of the good-performance subsidiaries and 98 of the good-performance stand-alones have thesame one-digit SIC code as their matching poor-performance subsidiary.
The lack of industry matching on a case-by-case basis, however, does notnecessarily imply that the distribution of industries represented in the sample differsmaterially across the types of entities. This is because mismatches can cancel. Forexample, a stand-alone firm from SIC code 28 could be matched to a subsidiary fromSIC code 35 and a stand-alone firm from SIC code 35 could be matched to asubsidiary from SIC code 28. To examine the distribution of industry representationacross the different types of entities, we present in Panel B of Table 1 the frequencydistribution of two-digit SIC codes for each of the four subsamples for those
ARTICLE IN PRESSC. McNeil et al. / Journal of Financial Economics 72 (2004) 63–96 75
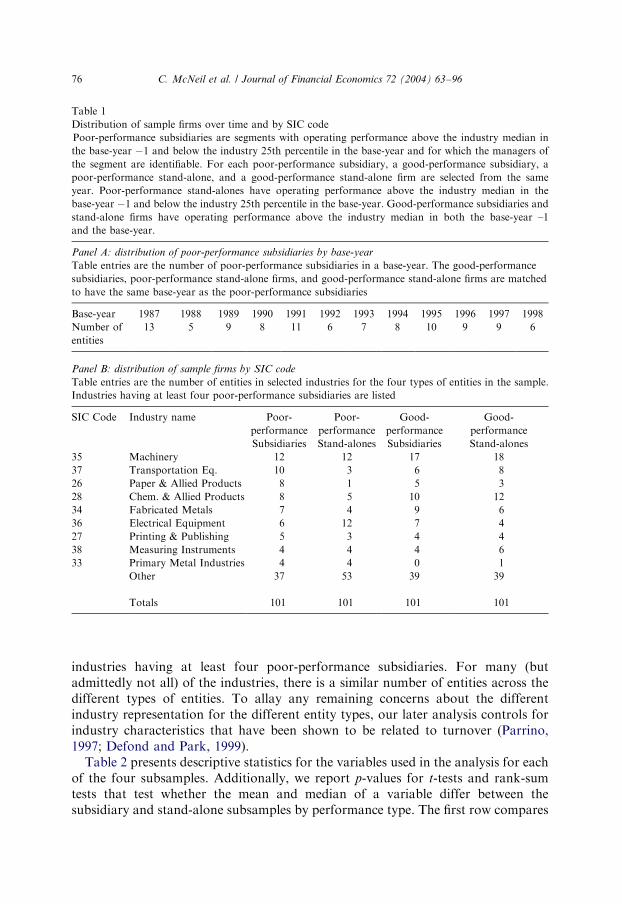
industries having at least four poor-performance subsidiaries. For many (butadmittedly not all) of the industries, there is a similar number of entities across thedifferent types of entities. To allay any remaining concerns about the differentindustry representation for the different entity types, our later analysis controls forindustry characteristics that have been shown to be related to turnover (Parrino,1997; Defond and Park, 1999).
Table 2 presents descriptive statistics for the variables used in the analysis for eachof the four subsamples. Additionally, we report p-values for t-tests and rank-sumtests that test whether the mean and median of a variable differ between thesubsidiary and stand-alone subsamples by performance type. The first row compares
ARTICLE IN PRESS
Table 1
Distribution of sample firms over time and by SIC code
Poor-performance subsidiaries are segments with operating performance above the industry median in
the base-year �1 and below the industry 25th percentile in the base-year and for which the managers of
the segment are identifiable. For each poor-performance subsidiary, a good-performance subsidiary, a
poor-performance stand-alone, and a good-performance stand-alone firm are selected from the same
year. Poor-performance stand-alones have operating performance above the industry median in the
base-year �1 and below the industry 25th percentile in the base-year. Good-performance subsidiaries and
stand-alone firms have operating performance above the industry median in both the base-year –1
and the base-year.
Panel A: distribution of poor-performance subsidiaries by base-year
Table entries are the number of poor-performance subsidiaries in a base-year. The good-performance
subsidiaries, poor-performance stand-alone firms, and good-performance stand-alone firms are matched
to have the same base-year as the poor-performance subsidiaries
Base-year 1987 1988 1989 1990 1991 1992 1993 1994 1995 1996 1997 1998
Number of
entities
13 5 9 8 11 6 7 8 10 9 9 6
Panel B: distribution of sample firms by SIC code
Table entries are the number of entities in selected industries for the four types of entities in the sample.
Industries having at least four poor-performance subsidiaries are listed
SIC Code Industry name Poor-
performance
Poor-
performance
Good-
performance
Good-
performance
Subsidiaries Stand-alones Subsidiaries Stand-alones
35 Machinery 12 12 17 18
37 Transportation Eq. 10 3 6 8
26 Paper & Allied Products 8 1 5 3
28 Chem. & Allied Products 8 5 10 12
34 Fabricated Metals 7 4 9 6
36 Electrical Equipment 6 12 7 4
27 Printing & Publishing 5 3 4 4
38 Measuring Instruments 4 4 4 6
33 Primary Metal Industries 4 4 0 1
Other 37 53 39 39
Totals 101 101 101 101
C. McNeil et al. / Journal of Financial Economics 72 (2004) 63–9676

total assets for the subsidiaries (not the subsidiary parent) to total assets for thestand-alone firms. Consistent with our matching process, the subsidiaries and stand-alone firms are of similar size, on average.
The next three rows of Table 2 present descriptive statistics on industry adjustedoperating performance, measured using earnings before interest, taxes, anddepreciation divided by total assets (EBITD/TA) minus the median industry valueof EBITD/TA. The industry is defined as focused firms that, according to Compustat
segment data, had at least 95% of their sales in that year in one three-digit SIC code.If fewer than five firms are available at the three-digit level, then the industry isredefined to be focused firms at the two-digit level.4 To moderate the impact ofoutliers, industry-adjusted values of EBITD/TA are winsorized at –0.5 and 0.5. Thisadjustment, however, does not materially affect the results in this or later tables.5
Recall that we require all of the entities in the sample to have operating performanceabove the industry median in the year prior to the base-year. This requirement,however, is not sufficiently restrictive to prevent subsidiaries and stand-alone firmsfrom having different average values of base-year �1 industry-adjusted operatingperformance. Specifically, the poor- (good) performance subsidiaries have betterperformance on average than the poor- (good) performance stand-alone firms inbase-year �1. A similar relation exists for base-year industry-adjusted operatingperformance. This persistent difference in the industry-adjusted operating perfor-mance suggests that there could be a systematic difference in the way in whichsubsidiary and stand-alone operating performance are measured. If, for example,conglomerate firms do not allocate ‘‘overhead assets’’ to specific segments, then thereturn on assets for subsidiaries will, on average, be higher in absolute terms thanthat for stand-alones, even if actual performance is the same. Taking differences overtime, however, should reduce the impact of such errors, if they exist. Table 2indicates that there is no statistical difference between subsidiaries and stand-alonesin industry-adjusted changes in operating performance (DEBITD/TAadj). Therefore,our empirical analysis focuses on industry adjusted changes in operatingperformance, although as we discuss later, our results are robust to otherperformance measures.
Base-year stock price performance is measured using CAR IND, defined as thecumulative stock return in excess of an equal-weighted industry return for the base-year. Note that due to missing CRSP data, we are unable to calculate CAR IND for14 observations: two good-performance subsidiaries, three poor-performancesubsidiaries, four good-performance standalones, and five poor-performance
ARTICLE IN PRESS
4We also calculated industry-adjusted performance using the firm’s primary SIC code to define industry
and the results are not changed. Kahle and Walkling (1996) provide an analysis of how industry
classifications can matter in financial research.5Eliminating one observation that has high influence statistics has the same impact as winsorizing. This
observation has a –100% value for EBITD/TA in the base-year (�$12 million in operating earnings on
assets of $12 million), but did not experience turnover. Lexis–Nexis newswire reports indicate that the
segment took a before-tax write-down of $10 million in the base-year.
C. McNeil et al. / Journal of Financial Economics 72 (2004) 63–96 77

ARTICLE IN PRESS
Table 2
Size, performance, ownership, and governance characteristics of subsidiaries and stand-alone firms
Poor-performance subsidiaries and stand-alone firms have operating performance above the industry
median in the base-year –1 and below the industry 25th percentile in the base-year. Good-performance
subsidiaries and stand-alone firms have operating performance above the industry median in both the
base-year –1 and the base-year. Each column has 101 observations. The mean is reported at the top of each
cell and the median at the bottom. P-values reported are for a t-test (top number) and rank-sum test
(bottom number), where poor-performance subsidiaries and stand-alones are compared separately from
good-performance subsidiaries and stand-alones. Assets is the book value of assets in the base-year for the
subsidiary or stand-alone firm in millions of dollars. EBITD/TA equals earnings before interest taxes and
depreciation divided by assets. EBITD/TAadj equals industry adjusted EBITD/TA, i.e., the entity’s
EBITD/TA minus the median industry EBITD/TA. DEBITD/TAadj is the change from the base-year –1 to
the base-year in EBITD/TAadj (industry adjusted EBITD/TA are winsorized at –0.5, 0.5). CAR IND
equals the cumulative stock return in excess of an equal-weighted industry return for the base-year.
Information concerning ownership and board characteristics, reported as of the year prior to the base-year
or the base-year (earliest available), comes from proxy statements and 10Ks. CEO ownership, director &
officer ownership, and outside blockholder ownership reflect ‘‘beneficial ownership’’ and are reported as a
percentage of total shares outstanding. Director and officer ownership excludes the CEO’s ownership.
Outsiders are people who are not current or former employees, are not related to current or former
employees on the board, and do not have material business relations with the firm. Outside blockholders
have at least a 5% ownership stake. Manager age is for the year prior to the base-year.
Poor performers Good performers
Subsidiaries Stand-alones P-value Subsidiaries Stand-alones P-value
Assets (in $millions) $1,048.7 $503.6 0.10 $861.8 $1,033.8 0.62
$154.3 $128.2 0.30 $141.0 $150.0 0.90
EBITD/TAadj in base- 6.2 4.7 0.10 15.9 10.4 0.01
year –1 (%) 4.2 2.7 0.01 11.7 8.3 0.01
EBITD/TAadj in base- �13.4 �15.6 0.17 15.1 9.7 0.01
-year (%) �9.4 �12.1 0.05 10.5 7.2 0.01
DEBITD/TAadj (%) �19.6 �20.3 0.72 �0.7 �0.7 0.96
�15.5 �16.6 0.81 0.0 �0.7 0.50
CAR IND (%) 7.9 14.3 0.51 18.8 24.2 0.45
4.9 �4.2 0.19 9.9 16.1 0.54
CEO ownership (%) 5.9 12.4 0.01 7.3 10.9 0.07
0.8 5.2 0.01 1.1 5.0 0.01
Director & officer 8.8 16.4 0.01 11.8 14.9 0.18
ownership (%) 4.1 9.3 0.01 5.5 8.3 0.02
Number of directors 10.3 7.2 0.01 9.9 8.1 0.01
10.0 7.0 0.01 10.0 7.0 0.01
Outside blockholder 13.6 13.9 0.88 16.4 12.9 0.13
Ownership (%) 11.4 8.0 0.66 10.8 8.9 0.26
Proportion of 68.8 61.2 0.01 73.8 64.8 0.01
Outsiders on board (%) 72.7 66.7 0.01 77.8 66.7 0.01
CEO is chairman (%) 75.2 69.3 0.35 66.3 70.3 0.55
Division manager is a 12.9 — 18.8 —
Board member (%)
Manager age (years) 51.6 52.6 0.35 50.5 54.0 0.01
51.0 51.0 0.50 50.0 55.0 0.01
C. McNeil et al. / Journal of Financial Economics 72 (2004) 63–9678

standalones. CAR IND for poor- (good) performance subsidiaries is not signifi-cantly different than for poor- (good) performance stand-alone firms. Thecorrelation coefficients between DEBITD/TAadj and CAR IND are relatively lowand do not differ materially between subsidiaries and stand-alone firms (0.116 forsubsidiaries and 0.098 for stand-alone firms). The low correlation suggests that thetwo performance measures reflect different information.
Subsidiary parents have significantly lower mean and median values of CEOownership and director and executive ownership than do stand-alone firms. Also,subsidiary parents have significantly more directors than the stand-alone firms. Someof the difference is due to the greater average size of subsidiary parents relative tostand-alone firms (on average, the subsidiary’s assets are about 30% of the parentfirm’s total assets). After controlling for size, however, there are still significantdifferences in stock ownership and directors between subsidiary parents and stand-alone firms.
The ownership of outside blockholders is about the same for subsidiary parentsand stand-alone firms. The proportion of outsiders on the board, however, issignificantly greater, on average, in the subsidiary parents. Across the twoorganizational forms, minimal differences are observed in the proportion offirms where the CEO is also Chairman of the Board. Finally, the age of thepoor-performance subsidiary managers does not, on average, differ from the poor-performance stand-alones, but the age of the good-performance subsidiarymanagers is approximately four years less than that of good-performance stand-alone CEOs.
4. Relation between turnover and performance
4.1. Univariate results
Table 3 presents the turnover rates for the four classes of business entities in oursample. The average annual CEO turnover rate is 12%, which is consistent withannual turnover rates of between 5% and 15% that most prior studies show (e.g.,Coughlan and Schmidt, 1985; Warner et al., 1988; Weisbach, 1988; Denis et al.,1997; Mikkelson and Partch, 1997; Bhagat et al., 1999; Denis and Kruse, 2000).Also, consistent with other studies, the turnover rate is related to performance. Poor-performance entities (both subsidiaries and stand-alone firms) have a significantlyhigher turnover rate than good-performance entities.
The turnover rates in Table 3 provide preliminary evidence consistent withthe hypothesis that turnover of top managers in subsidiaries is more likely followingpoor performance than is turnover of CEOs of stand-alone firms. The 62.4%turnover rate for poor-performance subsidiaries is significantly greater thanthe 45.5% turnover rate for poor-performance stand-alone firms. For good-performance entities, however, the difference between the 18.8% turnover rate forsubsidiaries and the 26.7% turnover rate for stand-alone firms is not statisticallysignificant.
ARTICLE IN PRESSC. McNeil et al. / Journal of Financial Economics 72 (2004) 63–96 79

4.2. Logit regression results
To control for other factors affecting management turnover, we estimatelogit regression models where the dependent variable equals one if there is turnoverand zero otherwise. The explanatory variables of primary interest arethe performance measures, an indicator variable, SUBSID, which equals one ifthe entity is a subsidiary and zero if it is a stand-alone firm, and the performancemeasures interacted with SUBSID. Since prior studies find a strong correla-tion between turnover and manager age (e.g., Weisbach, 1988; Murphyand Zimmerman, 1993; Goyal and Park, 2002), we include a dichotomous variable(AGE>62), indicating whether manager age is greater than 62, as a control.Prior research also finds that turnover is more likely in larger firms (e.g., Denis et al.,1997; Warner et al., 1988), so we include the natural logarithm of assets(LOG ASSETS).
The first column of Table 4 presents results using the change in industry adjustedoperating performance in the base-year ( DEBITD/TAadj) as the sole performancemeasure. The estimated coefficient on the performance variable is negative andstatistically significant, indicating that the likelihood of turnover for stand-alonefirms increases as operating performance in the base-year declines. The coefficient onthe variable that interacts performance with SUBSID also is negative andstatistically significant, indicating a stronger relation between turnover andperformance for subsidiaries than for stand-alone firms. The coefficient on theSUBSID variable is not statistically significant. The estimated coefficients forAGE>62 and LOG ASSETS are positive and statistically significant, consistentwith other studies.
ARTICLE IN PRESS
Table 3
Management turnover rates of subsidiaries and stand-alone firms
Percentage of subsidiary managers (in the case of subsidiaries) and CEOs (in the case of stand-alone firms)
who turn over between the base-year and the base-year +2. Poor-performance subsidiaries and stand-
alone firms have operating performance above the industry median in the base-year –1 and below the
industry 25th percentile in the base-year. Good-performance subsidiaries and stand-alone firms have
operating performance above the industry median in both the base-year –1 and the base-year. There are
101 observations in each cell. The chi-square statistic is for a test of whether the probability of turnover is
the same for the entries in the rows or columns. �� and � indicate significance at the 0.01 and 0.05 level,
respectively.
Performance
Chi-square
statistic for
test of equal
row percentages
Organizational form Poor Good
Subsidiary 62.4% 18.8% 39.7��
Stand-alone 45.5% 26.7% 7.7��
Chi-square statistic for test of equal column percentages 5.8� 1.8
C. McNeil et al. / Journal of Financial Economics 72 (2004) 63–9680
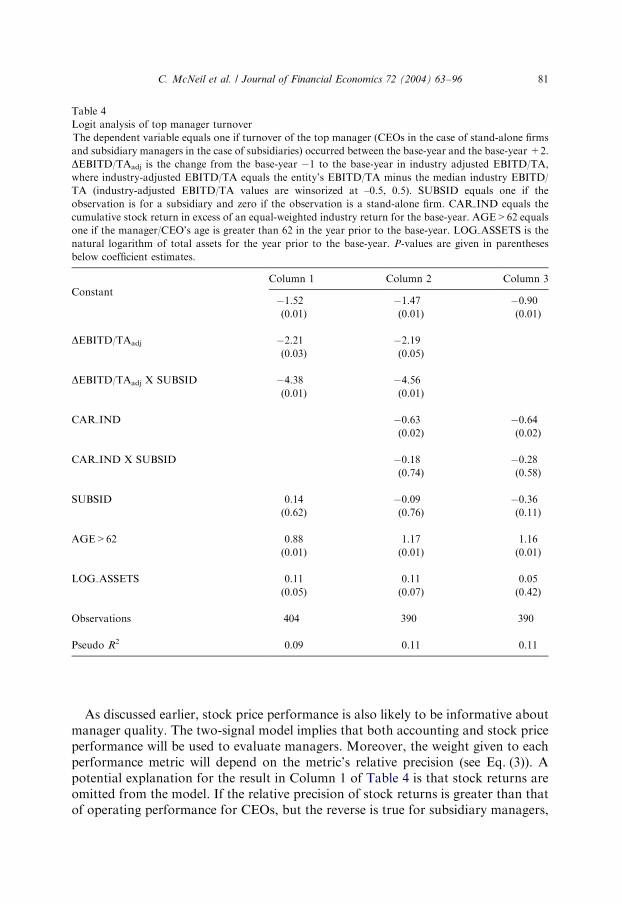
As discussed earlier, stock price performance is also likely to be informative aboutmanager quality. The two-signal model implies that both accounting and stock priceperformance will be used to evaluate managers. Moreover, the weight given to eachperformance metric will depend on the metric’s relative precision (see Eq. (3)). Apotential explanation for the result in Column 1 of Table 4 is that stock returns areomitted from the model. If the relative precision of stock returns is greater than thatof operating performance for CEOs, but the reverse is true for subsidiary managers,
ARTICLE IN PRESS
Table 4
Logit analysis of top manager turnover
The dependent variable equals one if turnover of the top manager (CEOs in the case of stand-alone firms
and subsidiary managers in the case of subsidiaries) occurred between the base-year and the base-year +2.
DEBITD/TAadj is the change from the base-year �1 to the base-year in industry adjusted EBITD/TA,
where industry-adjusted EBITD/TA equals the entity’s EBITD/TA minus the median industry EBITD/
TA (industry-adjusted EBITD/TA values are winsorized at –0.5, 0.5). SUBSID equals one if the
observation is for a subsidiary and zero if the observation is a stand-alone firm. CAR IND equals the
cumulative stock return in excess of an equal-weighted industry return for the base-year. AGE>62 equals
one if the manager/CEO’s age is greater than 62 in the year prior to the base-year. LOG ASSETS is the
natural logarithm of total assets for the year prior to the base-year. P-values are given in parentheses
below coefficient estimates.
Column 1 Column 2 Column 3
Constant�1.52 �1.47 �0.90
(0.01) (0.01) (0.01)
DEBITD/TAadj �2.21 �2.19
(0.03) (0.05)
DEBITD/TAadj X SUBSID �4.38 �4.56
(0.01) (0.01)
CAR IND �0.63 �0.64
(0.02) (0.02)
CAR IND X SUBSID �0.18 �0.28
(0.74) (0.58)
SUBSID 0.14 �0.09 �0.36
(0.62) (0.76) (0.11)
AGE>62 0.88 1.17 1.16
(0.01) (0.01) (0.01)
LOG ASSETS 0.11 0.11 0.05
(0.05) (0.07) (0.42)
Observations 404 390 390
Pseudo R2 0.09 0.11 0.11
C. McNeil et al. / Journal of Financial Economics 72 (2004) 63–96 81
then the relation between turnover and operating performance would be stronger forsubsidiary managers than for CEOs, while the relation between turnover and stockreturns would be stronger for CEOs than for subsidiary managers.6
Column 2 of Table 4 reports the results when we include the industry-adjustedstock performance measure (CAR IND), along with its interaction with SUBSID.The coefficients on the stock return variable and on the operating performancevariable are both negative and statistically significant. Thus, both poor accountingperformance and poor stock returns are associated with an increased probability ofCEO turnover. As with the results in Column 1, the coefficient on the variable thatinteracts the accounting performance measure with SUBSID is negative andstatistically significant, thus indicating that the relation between poor accountingperformance and turnover is stronger for subsidiary managers. The coefficient on thevariable that interacts stock price performance with SUBSID, however, is notsignificantly different from zero, indicating no difference in the strength of therelation between stock returns and turnover for CEOs versus subsidiary managers.These results suggest that differences in the relation of turnover to operatingperformance are not due to the absence of a stock price performance measure in thespecification.
For completeness, we report in column 3 of Table 4 the results if we omit theoperating performance variables from the model. As in the previous results, thecoefficient on the stock price variable is negative and statistically significant, but thecoefficient on the interaction of stock price performance with SUBSID is notstatistically significant. These results further support the conclusion that firm stockprice performance does not influence turnover of subsidiary managers differentlythan turnover of stand-alone CEOs.
To illustrate the economic significance of the estimated model in column 2of Table 4, we compare in Table 5 the predicted probabilities of turnover forsubsidiaries versus stand-alone firms. In addition, we compare the sensitivity ofturnover to performance for subsidiaries versus stand-alone firms. We interpretthe sensitivity of turnover to performance to mean the derivative of the probabilityof turnover with respect to a change in performance. Because of the nonlinear natureof the model, the sensitivity of turnover to performance is not directly providedby the coefficient estimates in Table 4 (see Jaccard, 2001and Powers, 2002). Instead,it is a function of all of the coefficient estimates and the values assumed for theright-hand side variables. The non-linear nature of the model also implies thatthe statistical significance of the predicted probability of turnover and of thederivative with respect to a change in performance depend on the entire variance-covariance matrix of estimates. We therefore report in Table 5 the statisticalsignificance of the predicted probabilities and derivatives using the delta method(Greene, 1997).
ARTICLE IN PRESS
6A simulation experiment supports this statement. In particular, we parameterized the two-signal model
and used Monte Carlo simulation to evaluate the implications of different relative precisions for the
estimated coefficients in logit regressions.
C. McNeil et al. / Journal of Financial Economics 72 (2004) 63–9682
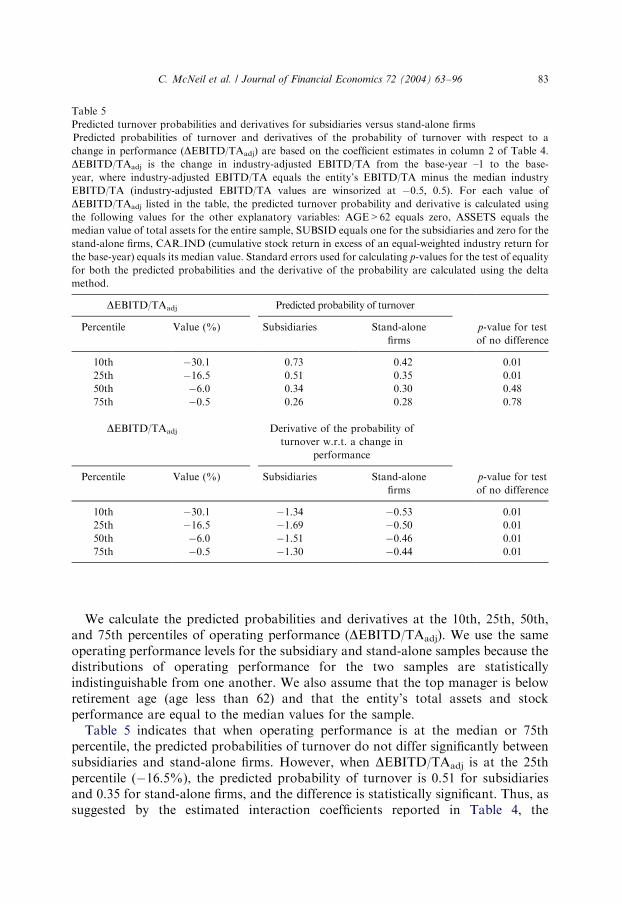
We calculate the predicted probabilities and derivatives at the 10th, 25th, 50th,and 75th percentiles of operating performance (DEBITD/TAadj). We use the sameoperating performance levels for the subsidiary and stand-alone samples because thedistributions of operating performance for the two samples are statisticallyindistinguishable from one another. We also assume that the top manager is belowretirement age (age less than 62) and that the entity’s total assets and stockperformance are equal to the median values for the sample.
Table 5 indicates that when operating performance is at the median or 75thpercentile, the predicted probabilities of turnover do not differ significantly betweensubsidiaries and stand-alone firms. However, when DEBITD/TAadj is at the 25thpercentile (�16.5%), the predicted probability of turnover is 0.51 for subsidiariesand 0.35 for stand-alone firms, and the difference is statistically significant. Thus, assuggested by the estimated interaction coefficients reported in Table 4, the
ARTICLE IN PRESS
Table 5
Predicted turnover probabilities and derivatives for subsidiaries versus stand-alone firms
Predicted probabilities of turnover and derivatives of the probability of turnover with respect to a
change in performance (DEBITD/TAadj) are based on the coefficient estimates in column 2 of Table 4.
DEBITD/TAadj is the change in industry-adjusted EBITD/TA from the base-year –1 to the base-
year, where industry-adjusted EBITD/TA equals the entity’s EBITD/TA minus the median industry
EBITD/TA (industry-adjusted EBITD/TA values are winsorized at �0.5, 0.5). For each value of
DEBITD/TAadj listed in the table, the predicted turnover probability and derivative is calculated using
the following values for the other explanatory variables: AGE>62 equals zero, ASSETS equals the
median value of total assets for the entire sample, SUBSID equals one for the subsidiaries and zero for the
stand-alone firms, CAR IND (cumulative stock return in excess of an equal-weighted industry return for
the base-year) equals its median value. Standard errors used for calculating p-values for the test of equality
for both the predicted probabilities and the derivative of the probability are calculated using the delta
method.
DEBITD/TAadj Predicted probability of turnover
Percentile Value (%) Subsidiaries Stand-alone
firms
p-value for test
of no difference
10th �30.1 0.73 0.42 0.01
25th �16.5 0.51 0.35 0.01
50th �6.0 0.34 0.30 0.48
75th �0.5 0.26 0.28 0.78
DEBITD/TAadj Derivative of the probability of
turnover w.r.t. a change in
performance
Percentile Value (%) Subsidiaries Stand-alone
firms
p-value for test
of no difference
10th �30.1 �1.34 �0.53 0.01
25th �16.5 �1.69 �0.50 0.01
50th �6.0 �1.51 �0.46 0.01
75th �0.5 �1.30 �0.44 0.01
C. McNeil et al. / Journal of Financial Economics 72 (2004) 63–96 83

probability of turnover following poor performance is substantially higher forsubsidiaries.
A comparison of the derivatives of the probability of turnover with respect to achange in performance for CEOs and subsidiary managers gives the difference in thesensitivity of turnover to performance for the two types of managers. Whenevaluated at the 10th, 25th, 50th, and 75th percentile value of operatingperformance, the sensitivity of turnover to performance for subsidiary managers issignificantly greater than the sensitivity of turnover to performance for CEOs. Forexample, at the median level of performance, the derivative is �1.51 for subsidiariesand �0.46 for stand-alones. Using these derivatives to assess the change in turnoverprobabilities following a one-standard deviation drop in operating performance(14.8%), we find that the probability of turnover increases by 0.22 (1.51� 0.148) forsubsidiaries and by 0.07 (0.46� 0.148) for stand-alones.
4.3. Robustness checks
4.3.1. Industry characteristics
Although we attempt to match entities based on industry, we noted earlier thatin many cases matches at the two-digit SIC code were not possible. Thus,one concern is that the differences in the relationship of turnover to operatingperformance for subsidiaries and stand-alones are driven by systematic differencesin the represented industries. Parrino (1997) shows that CEO turnover dependson the homogeneity of the industry. We therefore create the variable INDUS-TRY HOMOG in the same manner as Parrino. It is the average value acrossthe firms in a given industry (two-digit SIC code) of the partial correlation coefficientbetween the individual firm stock returns and the returns on the industry index.We calculate the measure over the 1987 to 1998 period using monthly stock returns.We limit calculations to industries with at least 35 firms with complete returndata across the period. When there are more than 50 firms, we choose 50 atrandom. The industry index is composed of these same firms. Since many industrieslack 35 firms with complete return data across the 12-year period, we calculatethe measure over each four-year subperiod and average the results. Thisgives estimates for 30 industries. For the remaining industries, we estimate acrossthree-year or two-year subperiods, giving us results for a total of 42 two-digitindustries.
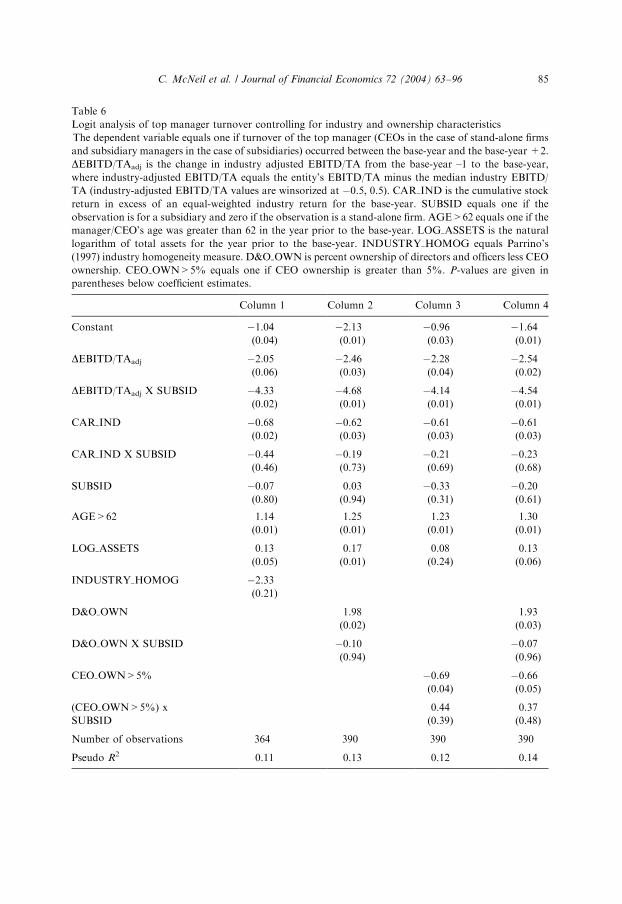
Univariate analysis (not reported) shows that INDUSTRY HOMOG doesnot differ between our stand-alone and subsidiary subsamples. In column 1 ofTable 6, we add INDUSTRY HOMOG to the logit regression model.The coefficient on the homogeneity variable is not statistically significant,and the results with respect to the performance variables and their inter-actions with SUBSID are virtually unchanged compared to the earlier reportedresults. Although not reported, we also include a Herfindahl index measuringindustry concentration as suggested by DeFond and Park (1999) and find similarresults.
ARTICLE IN PRESSC. McNeil et al. / Journal of Financial Economics 72 (2004) 63–9684
ARTICLE IN PRESS
Table 6
Logit analysis of top manager turnover controlling for industry and ownership characteristics
The dependent variable equals one if turnover of the top manager (CEOs in the case of stand-alone firms
and subsidiary managers in the case of subsidiaries) occurred between the base-year and the base-year +2.
DEBITD/TAadj is the change in industry adjusted EBITD/TA from the base-year –1 to the base-year,
where industry-adjusted EBITD/TA equals the entity’s EBITD/TA minus the median industry EBITD/
TA (industry-adjusted EBITD/TA values are winsorized at �0.5, 0.5). CAR IND is the cumulative stock
return in excess of an equal-weighted industry return for the base-year. SUBSID equals one if the
observation is for a subsidiary and zero if the observation is a stand-alone firm. AGE>62 equals one if the
manager/CEO’s age was greater than 62 in the year prior to the base-year. LOG ASSETS is the natural
logarithm of total assets for the year prior to the base-year. INDUSTRY HOMOG equals Parrino’s
(1997) industry homogeneity measure. D&O OWN is percent ownership of directors and officers less CEO
ownership. CEO OWN>5% equals one if CEO ownership is greater than 5%. P-values are given in
parentheses below coefficient estimates.
Column 1 Column 2 Column 3 Column 4
Constant �1.04 �2.13 �0.96 �1.64
(0.04) (0.01) (0.03) (0.01)
DEBITD/TAadj �2.05 �2.46 �2.28 �2.54
(0.06) (0.03) (0.04) (0.02)
DEBITD/TAadj X SUBSID �4.33 �4.68 �4.14 �4.54
(0.02) (0.01) (0.01) (0.01)
CAR IND �0.68 �0.62 �0.61 �0.61
(0.02) (0.03) (0.03) (0.03)
CAR IND X SUBSID �0.44 �0.19 �0.21 �0.23
(0.46) (0.73) (0.69) (0.68)
SUBSID �0.07 0.03 �0.33 �0.20
(0.80) (0.94) (0.31) (0.61)
AGE>62 1.14 1.25 1.23 1.30
(0.01) (0.01) (0.01) (0.01)
LOG ASSETS 0.13 0.17 0.08 0.13
(0.05) (0.01) (0.24) (0.06)
INDUSTRY HOMOG �2.33
(0.21)
D&O OWN 1.98 1.93
(0.02) (0.03)
D&O OWN X SUBSID �0.10 �0.07
(0.94) (0.96)
CEO OWN>5% �0.69 �0.66
(0.04) (0.05)
(CEO OWN>5%) x 0.44 0.37
SUBSID (0.39) (0.48)
Number of observations 364 390 390 390
Pseudo R2 0.11 0.13 0.12 0.14
C. McNeil et al. / Journal of Financial Economics 72 (2004) 63–96 85

4.3.2. Ownership and governance characteristics
Since our model predicts that stock ownership by principals should affectturnover, director and officers ownership and CEO ownership are included asexplanatory variables in the remaining logit regression models displayed in Table 6.Additional motivation for inclusion of these variables is given by Denis et al. (1997)and Parrino (1997), who find that ownership affects the rate of CEO turnover.
Column 2 of Table 6 includes director and officer ownership, exclusive of CEOownership, (D&O OWN) in the model. To allow the effect of D&O OWN onturnover to differ between subsidiaries and stand-alone firms, we also include aninteraction term with SUBSID. The coefficient on D&O OWN is positive andstatistically significant, but the coefficient on the interaction variable (D&O OWN� SUBSID) is not significantly different from zero. These results indicate thathigher levels of D&O OWN are associated with higher turnover rates for both stand-alone firms and for subsidiaries. The inclusion of D&O OWN does not materiallychange the estimated relation between turnover and performance for subsidiaries orstand-alone firms.
Column 3 of Table 6 includes a variable indicating whether the chief executiveofficer’s ownership exceeds 5% (CEO OWN>5%), as well as an interaction variablewith SUBSID.7 Since the CEO is one of the principals responsible for monitoring thesubsidiary manager, our model suggests that greater CEO ownership is likely toincrease the likelihood of subsidiary manager turnover. There are, however, otherpotential effects of high levels of CEO ownership, not incorporated in our model.For example, if high levels of CEO ownership serve to entrench CEOs and thereforereduce their incentives to increase overall firm performance, then the likelihood ofsubsidiary manager turnover would decline as CEO ownership increases. Theentrenchment effect of high levels of CEO ownership will also reduce the likelihoodof CEO turnover.
The coefficient on CEO OWN>5% is negative and statistically significant, butthe coefficient on the interaction variable is not statistically significant. These resultssuggest that levels of CEO ownership greater than 5% are associated with lowerturnover rates for both CEOs and subsidiary managers. Again, controlling for CEOownership does not materially change the relation between turnover andperformance for either subsidiaries or stand-alone firms. Column 4 includes bothownership variables and their interactions with SUBSID. The results are similar tothose previously discussed.
In addition to the ownership variables, we also include controls for othercorporate governance characteristics that other studies find are related to CEOturnover. For example, we include variables to control for the percentage ofdirectors that are insiders (Weisbach, 1988), whether the CEO is also the board chair
ARTICLE IN PRESS
7Allen (1981) and Salanick and Pfeffer (1980) also use a 5% cutoff for CEO ownership. Other cutoff
levels for the dichotomous CEO ownership variable produce similar results. However, when we use a
continuous CEO ownership variable, the coefficient on the CEO ownership variable is not statistically
significant. Results with respect to the sensitivity of turnover to performance are unchanged regardless of
the variable used to measure CEO ownership.
C. McNeil et al. / Journal of Financial Economics 72 (2004) 63–9686

(Goyal and Park, 2002), and whether there is outside blockholder ownership (Denisand Serrano, 1996). The estimated coefficients on these variables (not reported) arenot statistically significant and the magnitude and statistical significance of the othercoefficients do not change materially.
4.3.3. Alternative performance measures
We estimate the logit regression model using a number of different operatingperformance and stock price performance measures, as well as various combinationsof these different performance measures. More specifically, instead of the change inindustry-adjusted operating performance, we use the following measures: (1) base-year industry-adjusted operating performance, (2) base-year operating performance,and (3) change in operating performance from the base-year �1 to the base-year. Ineach case, the results (not reported) indicate that the coefficients on the operatingperformance variable and the interaction term between the operating performanceand SUBSID are negative and statistically significant, as reported earlier. The use ofdifferent stock price performance measures also does not change the basic results. Inparticular, we find similar results (not reported) if we use the cumulative rawmonthly return during the base-year or the cumulative return in excess of the CRSPvalue-weighted index during the base-year.
Our analysis examines turnover over a three-year period from the base-year to thebase-year +2. However, our performance measures are from the base-year. Apotential concern, therefore, is that performance subsequent to the base-year forstand-alones firms is better than that for subsidiaries. However, operatingperformance for subsidiaries in the base-year +1 and in the base-year +2 doesnot differ on average from the operating performance for stand-alone firms. Inaddition, when we add operating performance subsequent to the base-year to thelogit regression model, we continue to find that the coefficients on base-yearoperating performance and base-year operating performance interacted withSUBSID are negative and statistically significant.
4.3.4. Noise in the operating performance measures
A potential concern regarding our operating performance measures forsubsidiaries and stand-alone firms is that, despite our best efforts, they are notequally informative about the quality of the respective managers. If operatingperformance for stand-alone firms has greater absolute noise (less precision), thenthe minimum required performance (y� in expression 2) would be lower for stand-alone CEOs and so would the probability of turnover following poor performance.8
We have no direct method of testing for this, although one way in which thispossibility can manifest itself is in there being greater variance in the operating
ARTICLE IN PRESS
8This point differs from the earlier discussion of the relative precisions of operating performance and
stock price performance. Using the notation of the model, the discussion in this section is about se for
subsidiaries versus se for stand-alone firms. The earlier discussion was about s�2e =ðs�2
e þ s�2Z Þ versus
s�2Z =ðs�2
e þ s�2Z Þ; where se is the noise in the operating performance measure and sZ is the noise in the
stock price performance measure.
C. McNeil et al. / Journal of Financial Economics 72 (2004) 63–96 87

performance measure for stand-alone firms. The data, however, are not consistentwith this supposition. Controlling for size and industry, the variance of EBITD/TAover the five years prior to base-year –1 for stand-alone firms is not statisticallydifferent than that for subsidiaries.
4.3.5. Manager tenure
A multiperiod extension of the model implies that manager tenure will influencethe turnover condition (also, see Allgood and Farrell, 2000). To check whether ourresults regarding the sensitivity of turnover to performance are driven by differencesin the tenure of subsidiary managers versus stand-alone CEOs, we gather data on thetenure of the managers. We identify the tenure of only 77 of the subsidiary managersand 108 of the stand-alone CEOs. These data do not indicate a significant differencein tenure between subsidiary managers and stand-alone CEOs, either overall oramong poor-performers. This suggests that our results are not driven by differencesin the tenure of the subsidiary managers and stand-alone CEOs.
5. Other factors influencing turnover in conglomerates
Since little is known regarding turnover of subsidiary managers, we conclude ouranalysis with separate logit regressions that utilize only the subsidiary portion of oursample. The first specification in Table 7 includes the variables previously discussed,but without the now unnecessary dichotomous variable for subsidiaries and theassociated interaction effects. The coefficient estimates generally are similar to thosereported earlier (see column three in Table 6 for the most comparable results).9
Specifications in columns 2–4 include characteristics that we hypothesize couldaffect the relation between turnover and performance for subsidiary managers.These characteristics are whether the subsidiary manager is a member of the board ofdirectors (16% of managers in our sample have a seat on the board), the degree ofparent diversification, and whether the subsidiary operates in an industry that isrelated to the primary industry of the parent. To examine whether these variablesinfluence the relationship of turnover to performance, we add each of thesecharacteristics (one at a time) to the logit regression model given in column 1 andinteract the included characteristic with the operating performance variable. Weinvestigate the impact of these characteristics one at a time to reduce concerns aboutcollinearity resulting from the operating performance measure being included in theequation separately and also interacted with several other variables. Also, theindustry characteristics are highly correlated. We also interact these characteristicswith the stock price performance measure. Since the coefficients on the interaction
ARTICLE IN PRESS
9Fee and Hadlock (2002) show ‘‘the team nature of dismissals’’ for the top five executives of the firm.
That is, they find that turnover of non-CEO executives increases when the CEO turns over. We, therefore,
include a dichotomous variable indicating whether the parent CEO turned over (results not reported in
tables). While the sign of the coefficient estimate is positive, it is not statistically significant.
C. McNeil et al. / Journal of Financial Economics 72 (2004) 63–9688
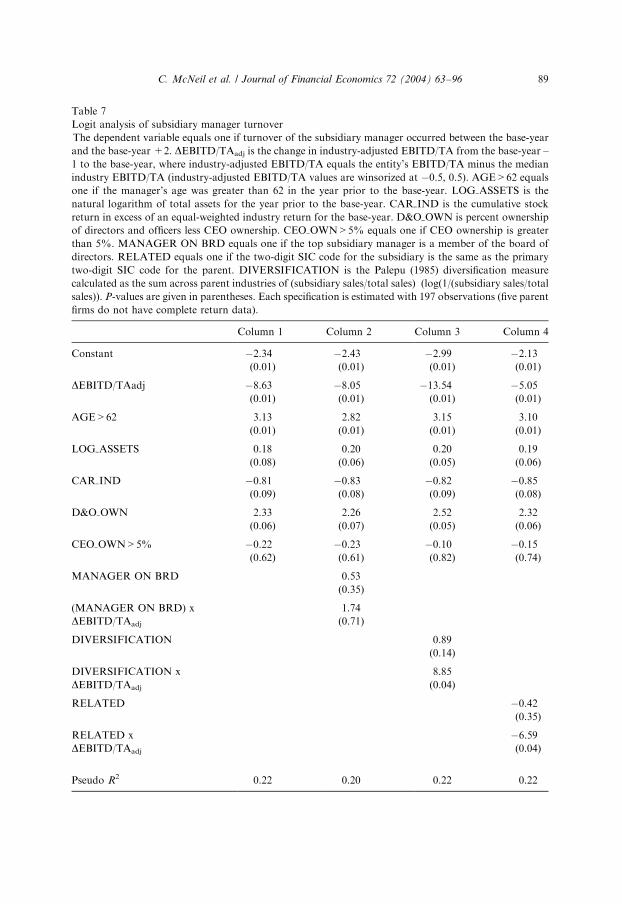
ARTICLE IN PRESS
Table 7
Logit analysis of subsidiary manager turnover
The dependent variable equals one if turnover of the subsidiary manager occurred between the base-year
and the base-year +2. DEBITD/TAadj is the change in industry-adjusted EBITD/TA from the base-year –
1 to the base-year, where industry-adjusted EBITD/TA equals the entity’s EBITD/TA minus the median
industry EBITD/TA (industry-adjusted EBITD/TA values are winsorized at �0.5, 0.5). AGE>62 equals
one if the manager’s age was greater than 62 in the year prior to the base-year. LOG ASSETS is the
natural logarithm of total assets for the year prior to the base-year. CAR IND is the cumulative stock
return in excess of an equal-weighted industry return for the base-year. D&O OWN is percent ownership
of directors and officers less CEO ownership. CEO OWN>5% equals one if CEO ownership is greater
than 5%. MANAGER ON BRD equals one if the top subsidiary manager is a member of the board of
directors. RELATED equals one if the two-digit SIC code for the subsidiary is the same as the primary
two-digit SIC code for the parent. DIVERSIFICATION is the Palepu (1985) diversification measure
calculated as the sum across parent industries of (subsidiary sales/total sales)�(log(1/(subsidiary sales/total
sales)). P-values are given in parentheses. Each specification is estimated with 197 observations (five parent
firms do not have complete return data).
Column 1 Column 2 Column 3 Column 4
Constant �2.34 �2.43 �2.99 �2.13
(0.01) (0.01) (0.01) (0.01)
DEBITD/TAadj �8.63 �8.05 �13.54 �5.05
(0.01) (0.01) (0.01) (0.01)
AGE>62 3.13 2.82 3.15 3.10
(0.01) (0.01) (0.01) (0.01)
LOG ASSETS 0.18 0.20 0.20 0.19
(0.08) (0.06) (0.05) (0.06)
CAR IND �0.81 �0.83 �0.82 �0.85
(0.09) (0.08) (0.09) (0.08)
D&O OWN 2.33 2.26 2.52 2.32
(0.06) (0.07) (0.05) (0.06)
CEO OWN>5% �0.22 �0.23 �0.10 �0.15
(0.62) (0.61) (0.82) (0.74)
MANAGER ON BRD 0.53
(0.35)
(MANAGER ON BRD) x 1.74
DEBITD/TAadj (0.71)
DIVERSIFICATION 0.89
(0.14)
DIVERSIFICATION x 8.85
DEBITD/TAadj (0.04)
RELATED �0.42
(0.35)
RELATED x �6.59
DEBITD/TAadj (0.04)
Pseudo R2 0.22 0.20 0.22 0.22
C. McNeil et al. / Journal of Financial Economics 72 (2004) 63–96 89

terms that include stock performance are never statistically significant, we do notreport these results.
One might expect that a subsidiary manager who has a seat on the board ofdirectors has greater power and is immunized to some extent from turnoverconcerns. However, as seen in column 2, we do not find that being a member of theboard of directors has a significant impact on the relationship of turnover toperformance.
Column 3 of Table 7 reports the impact of parent diversification on the probabilityof turnover, where the variable DIVERSIFICATION is calculated as in Palepu(1985). More specifically, DIVERSIFICATION is the sum across parent industriesof (subsidiary sales/total sales)�(log(1/(subsidiary sales/total sales)). A focused firmwill have a diversification measure of zero. A firm with three divisions of equal sizewould have a diversification measure of approximately 1.1. Our motivation forincluding a diversification measure in our analysis is the finding that the averagediversified firm seems to be worth less than the sum of its parts (e.g., Lang and Stulz,1994; Berger and Ofek, 1995). One potential source of this diversification discount isthat more diversified conglomerates are less likely to replace inefficient subsidiarymanagers. Scharfstein (1998), Rajan et al. (2000), and Gertner et al. (2002) provideother potential explanations involving inefficient internal capital markets. While ourcomparison of subsidiary manager turnover to stand-alone CEO turnover suggeststhat internal labor markets do not contribute to a conglomerate discount, it ispossible that among conglomerates, the relationship of turnover to performanceis weaker when the conglomerate is more diversified. The coefficient on the variablethat interacts performance with DIVERSIFICATION is positive and statisticallysignificant (p-value of 0.04). However, this result is sensitive to the measure used toquantify the degree of diversification. For example, when a Herfindahl index is used,we do not find a statistically significant relation between turnover and the degree ofparent diversification.
Column 4 reports the impact on turnover if the subsidiary operates in a line ofbusiness that is related to the parent’s primary line of business. We classify thesubsidiary as related if it has the same two-digit SIC code as the parent. Severalreasons suggest that relatedness will strengthen the relation between turnover andperformance. First, relatedness is likely to increase headquarters’ familiarityand understanding of the subsidiary’s operations, which will imply greater filteringof noise and a more stringent turnover criteria. Second, due to the existence ofoperating synergies, the performance of related subsidiaries is likely to have greaterimpact on the ultimate success of the parent, and thus increase the sensitivity ofheadquarters executives’ wealth to subsidiary performance. This could lead to lessleeway being granted to managers of poorly performing related subsidiaries. Third,as Gertner et al. (1994) argue, assets of closely related projects can be redeployedmore easily in a conglomerate, effectively reducing the cost of reorganization. Theytherefore predict that ‘‘business-unit managers inside related conglomerates will bemore likely to be replaced yfollowing poor performance than y business-unitmanagers inside unrelated conglomerates’’ (p. 1228). Finally, Parrino (1997) notesthat outside CEO succession following CEO turnover is more likely in homogenous
ARTICLE IN PRESSC. McNeil et al. / Journal of Financial Economics 72 (2004) 63–9690
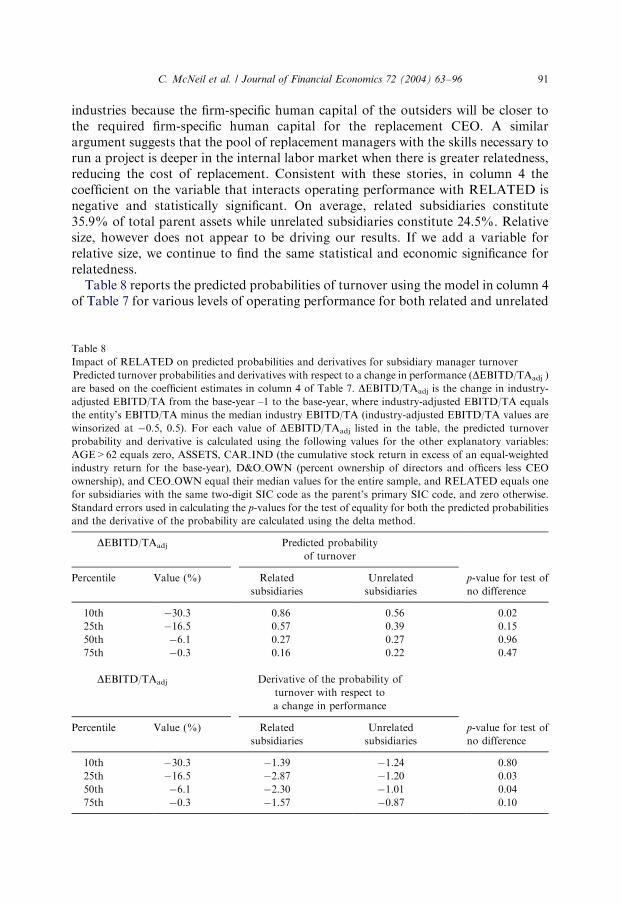
industries because the firm-specific human capital of the outsiders will be closer tothe required firm-specific human capital for the replacement CEO. A similarargument suggests that the pool of replacement managers with the skills necessary torun a project is deeper in the internal labor market when there is greater relatedness,reducing the cost of replacement. Consistent with these stories, in column 4 thecoefficient on the variable that interacts operating performance with RELATED isnegative and statistically significant. On average, related subsidiaries constitute35.9% of total parent assets while unrelated subsidiaries constitute 24.5%. Relativesize, however does not appear to be driving our results. If we add a variable forrelative size, we continue to find the same statistical and economic significance forrelatedness.
Table 8 reports the predicted probabilities of turnover using the model in column 4of Table 7 for various levels of operating performance for both related and unrelated
ARTICLE IN PRESS
Table 8
Impact of RELATED on predicted probabilities and derivatives for subsidiary manager turnover
Predicted turnover probabilities and derivatives with respect to a change in performance (DEBITD/TAadj )
are based on the coefficient estimates in column 4 of Table 7. DEBITD/TAadj is the change in industry-
adjusted EBITD/TA from the base-year –1 to the base-year, where industry-adjusted EBITD/TA equals
the entity’s EBITD/TA minus the median industry EBITD/TA (industry-adjusted EBITD/TA values are
winsorized at �0.5, 0.5). For each value of DEBITD/TAadj listed in the table, the predicted turnover
probability and derivative is calculated using the following values for the other explanatory variables:
AGE>62 equals zero, ASSETS, CAR IND (the cumulative stock return in excess of an equal-weighted
industry return for the base-year), D&O OWN (percent ownership of directors and officers less CEO
ownership), and CEO OWN equal their median values for the entire sample, and RELATED equals one
for subsidiaries with the same two-digit SIC code as the parent’s primary SIC code, and zero otherwise.
Standard errors used in calculating the p-values for the test of equality for both the predicted probabilities
and the derivative of the probability are calculated using the delta method.
DEBITD/TAadj Predicted probability
of turnover
Percentile Value (%) Related
subsidiaries
Unrelated
subsidiaries
p-value for test of
no difference
10th �30.3 0.86 0.56 0.02
25th �16.5 0.57 0.39 0.15
50th �6.1 0.27 0.27 0.96
75th �0.3 0.16 0.22 0.47
DEBITD/TAadj Derivative of the probability of
turnover with respect to
a change in performance
Percentile Value (%) Related
subsidiaries
Unrelated
subsidiaries
p-value for test of
no difference
10th �30.3 �1.39 �1.24 0.80
25th �16.5 �2.87 �1.20 0.03
50th �6.1 �2.30 �1.01 0.04
75th �0.3 �1.57 �0.87 0.10
C. McNeil et al. / Journal of Financial Economics 72 (2004) 63–96 91

subsidiaries. For a subsidiary that has operating performance at the 25th percentile(�16.5%), the predicted probability of turnover is 0.57 if the subsidiary operates in arelated line of business and 0.39 if it does not. Although large in economic terms, thisdifference is not statistically significant at the 10% level. The difference in predictedturnover probabilities is statistically significant if performance is extremely poor,e.g., at the 10th percentile level. Table 8 also reports the derivative of the probabilityof turnover with respect to a change in operating performance for related andunrelated subsidiaries. The derivatives for related and unrelated subsidiaries aresignificantly different when operating performance is between the 25th and 75thpercentile. Using the derivatives at the median value of operating performance, if asubsidiary’s performance drops by one standard deviation (14.9%) from the median,the probability of turnover increases by 0.34 (2.30 � 0.149) for related subsidiariesand by 0.15 (1.01 � 0.149) for unrelated subsidiaries.
Related subsidiaries do not explain the entire difference in the relationship ofturnover to performance between subsidiaries and stand-alone firms. If we interactoperating performance with separate dichotomous variables indicating relatedsubsidiaries and unrelated subsidiaries in the logit regressions comparing subsidiariesto stand-alone firms, the coefficients on both interaction terms are significant at the5% level, indicating that the strength of the relationship between turnover andperformance is greater for both types of subsidiaries than for stand-alone firms.
6. Summary and conclusions
Prior empirical research conclusively demonstrates that CEO turnover becomesmore likely as either operating performance or stock price performance declines.Prior research also identifies many factors, such as board composition, which affectthe turnover performance relation. While these prior studies provide valuableinformation on when the market for corporate control and the board of directorsfunction most effectively as a disciplining mechanism, they provide little insight onwhether the market for corporate control and the board of directors function wellcompared to alternative disciplining mechanisms. A newer line of inquiry analyzesturnover of lower-level executives who are subject to one such alternativemechanism, namely the discipline provided by more senior executives in thecorporate hierarchy. With the exception of Blackwell et al. (1994), however, thesestudies utilize firm-level performance measures that contain limited informationabout the ability of lower-level executives. Thus, insights from this newer literatureregarding the relative efficacy of various disciplining mechanisms are also limited.
Our research overcomes both of the limitations outlined above. The firstinnovation of our research is that we compare turnover of subsidiary managersinside diversified firms to turnover of CEOs of comparable stand-alone firms. Thesecond innovation of our research is that we employ operating performancemeasures that reflect the results of the business entities actually supervised by therespective managers. Any differences in the relation between turnover and operatingperformance, therefore, are likely a function of differences in the respective
ARTICLE IN PRESSC. McNeil et al. / Journal of Financial Economics 72 (2004) 63–9692

disciplining mechanisms and not due to differences in the informativeness of theperformance measures or differences in the underlying business entities.
Our results show that turnover of subsidiary managers is significantly more likelyfollowing poor performance and is significantly more sensitive to changes inperformance than is turnover of CEOs of comparable stand-alone firms. Our modelsuggests several reasons for these results. One possibility is that the explicit cost offinding a replacement and paying severance is lower for subsidiary managers.Although we have limited supporting evidence, our speculation is that these explicitcosts are relatively small and are unlikely the major factor underlying our findings.For example, Lafanowicz et al. (2000) find that the median golden parachute forCEOs of acquired firms is only 0.4% of the pre-acquisition target’s value. We suspectthat weaker incentives and greater private replacement costs for boards of directorscompared to headquarters executives are more important forces. This interpretationis consistent with prior research that shows that CEO turnover is more sensitive toperformance when directors and officers (exclusive of the CEO) own a large block ofshares (Denis et al., 1997), independent outsiders occupy a large percentage of boardseats (Weisbach, 1988), outside blockholder ownership is large (Denis and Serrano,1996), and the CEO is not concurrently the chairman of the board of directors(Goyal and Park, 2002). Thus, the findings suggest that the disciplining mechanismfor CEOs is lenient compared to the disciplining mechanism for subsidiarymanagers.
Our results also provide new insights about conglomerate organizations. Priorresearch suggests that the scope of conglomerates is restricted by inefficiencies intheir internal capital markets (e.g., Gertner et al., 1994), difficulties in valuingdisparate collections of businesses (e.g., Habib et al., 1997), and difficulties inproviding incentives to division managers (e.g., Schipper and Smith, 1986). Ourresults, however, indicate that a conglomerate form of organization provides astricter disciplining mechanism that may at least partly offset other limitations ofconglomerates.
We also examine turnover of subsidiary managers in conglomerates in isolation.Our main finding, which is consistent with a number of stories, including one inGertner et al. (1994), is that for subsidiaries that operate in their parent’s primaryline of business, there is a higher probability of turnover following poor performanceand a greater sensitivity of turnover to performance. Thus, the discipliningmechanism inside a conglomerate seems stricter when the division operates in anindustry related to the parent’s primary industry. This provides a new rationale forwhy conglomerates composed of related businesses are valued more highly onaverage than conglomerates composed of unrelated businesses (Berger and Ofek,1995).
Appendix. A
In this appendix, we provide additional structure to the model to generate theprediction that the probability of turnover increases as the average value of y�
ARTICLE IN PRESSC. McNeil et al. / Journal of Financial Economics 72 (2004) 63–96 93

increases. Assume that the parameters C, CP; and a; vary by entity, which impliesthat there are entity-specific values of y�; but that these values are unobservable.More specifically, assume that y� for both stand-alone firms and subsidiaries have anormal distribution with expected values equal to y�S�A and y�SUB; respectively, wherey�S�Aoy�SUB: For a given value of observed performance, y, the probability of CEOturnover equals 1 � F ðy � y�S�AÞ and the probability of subsidiary manager turnoverequals 12F ðy � y�SUBÞ; where F ðÞ is the cumulative distribution function. Sincey�S�Aoy�SUB; the probability of CEO turnover is less than the probability ofsubsidiary manager turnover. However, for very high (low) values of performance,both probabilities will be small (large), and their difference will be small. The greatestdifference in turnover probabilities occurs when performance is equal to the averageof the minimum required performance levels (y�S�A and y�SUB). Thus, conditional onpoor performance (but not too poor), the probability of turnover should bematerially higher for subsidiary managers than for CEOs.
The sensitivity of turnover to performance is defined as the absolute value of thederivative of the probability of turnover with respect to a change in performance.For stand-alone firms, the derivative equals 2f ðy � y�S�AÞ and for subsidiaries, thederivative equals �f ðy � y�SUBÞ; where f ðÞ is the density function for the values of y�:Given that y�SUB > y�S�A; the absolute value of the derivative for subsidiaries is greaterthan that for stand-alone firms whenever performance ðyÞ is greater than yþ; whereyþ is the value of performance at which the two density function intersect.
References
Alchian, A., 1969. Corporate management and property rights. In: Manne, H. (Ed.), Economic policy and
the regulation of corporate securities. American Enterprise Institute Public Policy Research,
Washington, pp. 337–360.
Allen, M., 1981. Managerial power and tenure in the large corporation. Social Forces 60, 482–494.
Allgood, S., Farrell, K., 2000. The effect of CEO tenure on the relation between firm performance and
turnover. Journal of Financial Research 23, 373–390.
Anderson, R., Bates, T., Bizjak, J., Lemmon, M., 2000. Corporate governance and firm diversification.
Financial Management 29, 5–22.
Berger, P., Ofek, E., 1995. Diversification’s effect on firm value. Journal of Financial Economics 37, 39–65.
Berry, T, Bizjak, J., Lemmon, M., Naveen, L., 2000. CEO turnover and firm diversification. Unpublished
working paper. Texas A&M University.
Bhagat, S., Carey, D., Elson, C., 1999. Director ownership, corporate performance, and management
turnover. The Business Lawyer 54 (3), 885–919.
Blackwell, D., Brickley, J., Weisbach, M., 1994. Accounting information and internal performance
evaluation: evidence from Texas banks. Journal of Accounting and Economics 7, 331–358.
Box, G., Tiao, G., 1973. Bayesian Inference in Statistical Analysis. Addison-Wesley Publishing Company,
Reading, MA.
Brickley, J., Linck, J., Coles, J., 1999. What happens to CEOs after they retire? new evidence on career
concerns, horizon problems, and CEO incentives. Journal of Financial Economics 52, 341–377.
Bushman, R., Indjejikian, R., Smith, A., 1995. Aggregate performance measures in business unit manager
compensation: the role of intrafirm interdependencies. Journal of Accounting Research 35, 101–128.
Coughlan, A., Schmidt, R., 1985. Executive compensation, management turnover, and firm performance.
Journal of Accounting and Economics 7, 43–66.
ARTICLE IN PRESSC. McNeil et al. / Journal of Financial Economics 72 (2004) 63–9694
Defond, M., Park, C., 1999. The effect of competition on CEO turnover. Journal of Accounting and
Economics 27, 35–56.
Denis, D., Kruse, T., 2000. Managerial discipline and corporate restructuring following performance
declines. Journal of Financial Economics 55, 391–424.
Denis, D., Serrano, J., 1996. Active investors and management turnover following unsuccessful control
contests. Journal of Financial Economics 40, 239–266.
Denis, D., Denis, D., Sarin, A., 1997. Ownership structure and top executive turnover. Journal of
Financial Economics 45, 193–221.
Fee, E., Hadlock, C., 2002. Management turnover across the corporate hierarchy. Unpublished working
paper. Michigan State University.
Franks, J., Mayer, C., Renneboog, L., 2001. Who disciplines management in poorly performing
companies? Journal of Financial Intermediation 10, 209–248.
Gertner, R., Scharfstein, D., Stein, J., 1994. Internal versus external capital markets. Quarterly Journal of
Economics 109, 1211–1230.
Gertner, R., Powers, E., Scharfstein, D., 2002. Learning about internal capital markets from corporate
spinoffs. Journal of Finance 57, 2479–2506.
Gilson, S., Healy, P., Noe, C., Palepu, K., 2001. Analyst specialization and conglomerate stock breakups.
Journal of Accounting Research 39 (3), 565–582.
Goyal, V., Park, C., 2002. Board leadership structure and CEO turnover. Journal of Corporate Finance 8,
49–66.
Greene, W., 1997. Econometric Analysis. Prentice-Hall, Upper Saddle River, NJ.
Habib, M., Johnson, D., Naik, N., 1997. Spinoffs and information. Journal of Financial Intermediation 6,
153–176.
Hadlock, C., Lumer, G., 1997. Compensation, turnover, and top management incentives: historical
evidence. Journal of Business 70, 153–187.
Hall, B., Liebman, J., 1998. Are CEOs really paid like bureaucrats? Quarterly Journal of Economics 113,
653–691.
Hallock, K., 1997. Reciprocally interlocking boards of directors and executive compensation. Journal of
Financial and Quantitative Analysis 32, 331–344.
Harford, J., 2003. Takeover bids and target director incentives: the impact of a bid on directors’ wealth
and board seats. Journal of Financial Economics 69, 51–83.
Harris, E., 1990. Antitakeover measures, golden parachutes, and target firm shareholder welfare. Rand
Journal of Economics 21, 614–625.
Hermalin, B., Weisbach, M., 1998. Endogenously chosen boards of directors and their monitoring of
management. American Economic Review 88, 96–118.
Holmstrom, B., Tirole, J., 1993. Market liquidity and performance monitoring. Journal of Political
Economy 101, 678–709.
Jaccard, J., 2001. Interaction Effects in Logistic Regression. Sage University Papers Series on Quantitative
Applications in the Social Sciences, Sage, Thousand Oaks, CA, pp. 07-135.
Jensen, M., 1988. Takeovers and their causes and consequences. Journal of Economic Perspectives 2,
21–48.
Jovanovic, B., 1979. Job matching and the theory of turnover. Journal of Political Economy 87,
972–990.
Kahle, K., Walkling, R., 1996. The impact of industry classifications on financial research. Journal of
Financial and Quantitative Analysis 31, 309–335.
Keating, A., 1997. Performance measures for division manager performance evaluation: an empirical
study. Journal of Accounting and Economics 24, 243–273.
Kim, Y., 1996. Long-term firm performance and chief executive turnover: an empirical study of the
dynamics. Journal of Law Economics & Organizations 12, 480–496.
Krishnaswami, S., Subramanian, V., 1999. Information asymmetry, valuation and the corporate spin-off
decision. Journal of Financial Economics 53, 73–112.
Lafanowicz, C., Robinson, J., Smith, R., 2000. Golden parachutes and managerial incentives in corporate
acquisitions: evidence from the 1980s and 1990s. Journal of Corporate Finance 6, 215–239.
ARTICLE IN PRESSC. McNeil et al. / Journal of Financial Economics 72 (2004) 63–96 95
Lang, L., Stulz, R., 1994. Tobin’s Q, corporate diversification, and firm performance. Journal of Political
Economy 102, 1248–1280.
Matsusaka, J., Nanda, V., 2002. Internal capital markets and corporate refocusing. Journal of Financial
Intermediation 11 (2), 176–211.
McKenna, C., 1986. Equilibrium wage offers and turnover in a simple search market. The Economic
Journal 96, 785–797.
Mian, S., 2001. On the choice of replacement of chief financial officers. Journal of Financial Economics 60,
143–175.
Mikkelson, W., Partch, M., 1997. The decline of takeovers and disciplinary managerial turnover. Journal
of Financial Economics 44, 205–228.
Murphy, K., 1986. Incentives, learning, and compensation: a theoretical and empirical investigation of
managerial labor contracts. Rand Journal of Economics 17, 59–76.
Murphy, K., Zimmerman, J., 1993. Financial performance surrounding CEO turnover. Journal of
Accounting and Economics 16, 273–316.
Palepu, K., 1985. Diversification strategy, profit performance, and the unrelated measure. Strategic
Management Journal 6, 239–255.
Parrino, R., 1997. CEO turnover and outside succession, a cross-sectional analysis. Journal of Financial
Economics 46, 165–197.
Perry, T., 1999. Incentive compensation for outside directors and CEO turnover. Unpublished working
paper. Arizona State University.
Powers, E., 2002. Interpreting logit regressions with interaction terms as seen in the management turnover
literature. Unpublished working paper. University of South Carolina.
Rajan, R., Servaes, H., Zingales, L., 2000. The cost of diversity: the diversification discount and inefficient
investment. Journal of Finance 55, 35–80.
Salanick, G., Pfeffer, J., 1980. Effects of ownership and performance on executive tenure in U.S.
corporations. Academy of Management Journal 23, 653–664.
Scharfstein, D., 1998. Evidence on the dark side of internal capital markets. Unpublished , Working Paper
No. 6352. National Bureau of Economic Research.
Scharfstein, D., Stein, J., 2000. The dark side of internal capital markets: divisional rent seeking and
inefficient investment. Journal of Finance v55 (6), 2537–2564.
Schipper, K., Smith, A., 1986. A comparison of equity carve-outs and seasoned equity offering: share price
effects and corporate restructuring. Journal of Financial Economics 15, 153–186.
Volpin, P., 2002. Governance with poor investor protection: evidence from top executive turnover in Italy.
Journal of Financial Economics 64, 61–90.
Warner, J., Watts, R., Wruck, K., 1988. Stock prices and top management changes. Journal of Financial
Economics 20, 461–492.
Weisbach, M., 1988. Outside directors and CEO turnover. Journal of Financial Economics 20, 431–460.
Williamson, O., 1981. The modern corporation: origins, evolution and attributes. Journal of Economic
Literature 19, 1537–1568.
Wruck, K., Wruck, E., 2002. Restructuring top management: evidence from corporate spinoffs. Journal of
Labor Economics 20, 5176–5218.
Wulf, J., 2000. Influence and inefficiency in the internal capital market: theory and evidence. Unpublished
working paper. University of Pennsylvania.
ARTICLE IN PRESSC. McNeil et al. / Journal of Financial Economics 72 (2004) 63–9696


