Management On Ground
28
Investor Presentation: 1Q21 Performance April 2021
Transcript of Management On Ground
Investor Presentation: 1Q21 Performance
April 2021

• Under fragile business environment, TMB focuses more on balance sheet quality rather than pushing for aggressive growth
figures that could come with risks. This is to preserve and to ensure balance sheet healthiness for our future growth once
economic situation allows.
• Integration remains on plan, on time, on budget, resulting in synergy realization. With EBT completion in July, limitations on
cross-selling will be unlocked and create opportunities for revenue synergy initiatives.
• 1Q21 performance reflected our strategic priorities - balance sheet quality and integration;
▪ NII (-4.8% QoQ, -8.1% YoY) : New loans have been selectively grown and shifted toward lower risk areas, coupled with low
interest rate environment and more conservative adjustment on accounting estimates.
▪ NIM at 3.00%: Balance sheet synergy helped reduce funding cost, despite positive momentum on deposit growth. This also
lessened impact of low rate environment and lower yields on earning assets.
▪ C/I at 47% : Cost synergy initiatives were well-executed and helped contain OPEX amid accelerated integration activities before
the EBT.
▪ Credit cost at 160 bps, NPL ratio at 2.75% : The ECL model has been adjusted to reflect real risk level of customers especially
those under relief program to ensure sufficient and rational ECL level, reflected by higher % of ECL by stage. Overall, asset
quality metrics remained in line with target and our portfolio nature (retail base and secured loans).
Executive summary
2

3
Relief Program Update
1Q21 Performance & Asset Quality
Integration Update

Jun-20 Dec-20 Mar-21
Debt relief profile - % to total loan portfolio
4
Loans under Relief Program to Total Loans
Non-Debt Relief
(Included Debt Relief Exit)
Debt Relief : Phase 1
Note: Loans to customers excluded interbank loans
Debt Relief : Phase 2
(additional requests with sequential
offering)
1,382 1,393
~40%
~15%~2%
~13%
1,380
~14%~13%
~1%
~ 95% Phase 2 – mainly SMEs, followed by Retail-Mortgage
and Retail-HP
~5% Phase 1 – mostly commercial customers
• In Jan-21, BOT announced the extension of relief measures for retail
borrowers, medium enterprise and small SMEs.
• As a result, the % of debt relief as of Mar-21 stayed relatively close to
last quarter and represented approximately 14% of the Merged bank’s
total loan portfolio
• Of total debt relief loans, around 95% were in phase 2 (customers
asking for additional supports) and the rest were the remaining of
phase 1
• Customers in relief program phase 2 (>87%) are under modified terms
and able to service their debts (full interest payment)
THB billion

Jun-20 Dec-20 Mar-21 Jun-20 Dec-20 Mar-21
Jun-20 Dec-20 Mar-21Jun-20 Dec-20 Mar-21Jun-20 Dec-20 Mar-21Jun-20 Dec-20 Mar-21
Jun-20 Dec-20 Mar-21
Debt relief profile - by customer segments and key products
5
Commercial Loans
Retail Loans
Hire Purchase Mortgage Unsecured
Corporate Small Enterprise601
~38%
505
~26%96
~99%
779
~45%~50%
408
~40%
300
~20%
60
Non-Debt Relief (Included Debt Relief Exit)
Loans under Relief Program (Phase 1+2)
~25%
~9%
~16% ~74%
~5% ~15% ~5%
Note: Loans to customers excluded interbank loans / Unsecured : Credit card and personal loans
612
515
97
779
406
301
62
• 19% of commercial loans and 10% of retail loans
remained in relief program
• Amid the new COVID-19 outbreak, TMB will remain
prudent in risk management and monitor delinquency
levels closely
• The latest relief measures of asset warehousing and
the BoT special loans give banks more flexibility to
support commercial customers, especially the
hospitality sectors to withstand the prolong Covid-19
situation. The asset warehousing also allows banks
to better manage asset quality and put less pressure
on provisioning.
603
~19%
THB billion
THB billion
776
~10%
506
~8%
97
~75%
404
~9%
303
~14%
59
~3%

Mar 2020 Apr 2020 May 2020 Jun 2020 Jul 2020 Aug 2020 Sep 2020 Oct 2020 Nov 2020 Dec 2020 Jan 2021 Feb 2021 Mar 2021
Covid-19 readiness: Call center and non-voice capacity expansion to support incoming relief requests
6
Incoming requests from impacted customers
1st wave
(Full lockdown) ~300k call a month during
peak period and dropped by
~70% after peak
2nd wave
(Partial lockdown)
~80k call a month during
peak period, much less
than 1st wave
~40% ~20% ~15% ~14%% Loan under relief
program (phase 1 & 2)
to total loan

Covid-19 readiness : BoT special loan & Asset warehousing to be leveraged to assist impacted customers
7
Asset
ware
ho
usin
gB
oT
sp
ecia
l lo
an
20
21
Qualification Corporate & SME with existing credit line < 500 MB
Purpose Liquidity for business operations and recovery
Tenor 5 years (BoT liquidity support at 0.01% interest)
Loan limit Existing customers: 30% of total existing credit limit
New customers: 20 MB
Interest rate 2% for first 2 years (EIR not exceeding 5% for 5 years)
Qualification Customers were not be NPL prior to Jan 2020
Purpose Strong relief package with prolonged recovery period
Contract period 3 years with option for 2 years expansion
Repurchase
price
Not higher than transfer price + carrying cost and maintenance cost
and other relevant fees - rental fee
Tax & Fee Exempt relevant taxes for both transfer and repurchase
Reduction in registration fee to 0.01%
Potential eligible
exposure
~ 12 bn
~ 10 bn

8
Relief Program Update
1Q21 Performance & Asset Quality
Integration Update

Summary of 1Q21 results
9
As
se
t q
ua
lity
Op
era
tin
g p
erf
orm
an
ce
Loan
Growth
≤Flat
Deposit
Growth
≤Flat
NIM Stable
Non-NII/
Total
assets
0.80%-0.90%
C/I Ratio 47%-49%
% Stage 3 < 3.6%
Credit cost 160-180 bps
Targets
-0.9% YTD
+0.8% YTD
3.00%
0.89%
47%
2.75%
160 bps
Actual 1Q21
(45.6%, exclude
PPA impact)
▪ Balance sheet optimization was well-executed. On the deposit side, we continued to replaced high
cost deposit with CASA and our flagship hybrid products. For loans, we strategically shrink low
yielding loans and high risk segment with a plan to redeploy them in higher yielding assets when
economic situation allows. However, due to COVID-19 situation, new loan will be selectively grown
to ensure portfolio quality, despite soften loan yield and NII.
▪ Although balance sheet synergy allows TMB to maintain high liquidity with lower cost of deposit and
cost of fund, NIM is expected to remain under pressure due to low interest rate environment and our
loan growth direction. Besides, TMB has made an adjustment on accounting estimates to be more
conservative on EIR recognition and to better reflecting competition and payment behavior of
customer for mortgage portfolio. As a result, 1Q21 NIM was at 3.00%.
▪ Non-NII to total assets came in as guidance. Net fee income QoQ growth was due mainly to MF fee,
supported by market sentiment in 1Q21. The Bank also saw a recovery in Trade finance and FX as
business activities continued to resume after a full-lockdown. And as we reduced our investment
position in previous quarters, impact on mark-to-market loss from bond yield fluctuation was limited.
▪ Well-contained recurrent expenses reflected cost saving synergy realization. In the 1H21, there will
be one-time expenses before the EBT date. In this quarter, there was one-time on separation
package, followed by rebranding related-expenses in the next quarter. However, with discipline on
self-fund, C/I ratio would remain within target.
▪ As prudent COVID-19 reserve was built in 2020 (THB24.8 Bn), credit cost in 1Q21 ended at 160
bps with stage 3 ratio of 2.75%, in line with guidance. The Bank remains prudent in setting provision
and follows “Guiding Principle of Post Relief Risk Schemes”, plus overlay set up. Overall, asset
quality has been closely monitor and manageable.
(3.08%, exclude
PPA impact)

Dec-20 Mar-21
Focusing on loan quality to ensure portfolio healthiness amid economic headwinds
10
Total Loan
Corporate
Small Enterprise
Retail-Mortgage
2%
-0.9% YTD
1,380 bn
Retail HP
Other
37%
7%
22%
29%
2%
1%
1,393 bn
• Amid challenging economic environment, TMB continues its balance sheet optimization strategy and keeps quality loan portfolio.
• Loan structure remained unchanged compared YTD and currently 56% of total port was retail loans, which around 91% of retail loans were collateralized, and
44% was commercial loan.
• As of Mar-21, total loans slightly dropped -0.9% YTD
▪ Commercial loans declined -1.5% YTD due to large corporate’s working cap repayment while term loan remained its growth momentum.
▪ Retail loans slightly dropped -0.5% YTD from unsecured loans (-4.6% YTD) and HP port (-0.4% YTD), offsetting with mortgage loan growth (+0.6% YTD).
Breakdown Retail HP 404 bn
Retail-Credit cardRetail-Personal loan
2%
37%
7%
22%
29%
2%
1%
New Car68%
Used Car 18%
CYC14%
CYB0.2%

Dec-20 Mar-21
Deposit strategy and optimization remaining on track
11
Total Deposit
TD+NCD
Hybrid
Saving
Current
1,373 bn
% Retail
deposits
~38%
CASA
76%
~35%
CASA
+0.8% YTD
32%
6%
29%
51%
14%
• Deposit expanded +0.8% YTD mainly from commercial inflow through CASA and flagship product inflow, while TD & Deposit Certificate still declined aligning with
B/S optimization strategy.
▪ Surplus liquidity in the market remained high so we still saw the inflow to our flagship products despite the interest rate reduction; All Free +4.8% YTD and
No-Fixed +6.8% YTD. Moreover, CASA was growing as planned. Together with high yield saving accounts reduction like TD, this helped we manage cost of
deposit more efficiently.
• Even though customers may prefer to keep cash in high yield saving accounts during the volatile market environment, we still pursue our strategy to churn saving
to wealth-related products such as mutual fund especially in high net worth customer segment. The maturity of TD caused the balance running down and created
opportunity to cross-sell.
73%
1,384 bn
6%
51%
11%

168%189% 199%
219%
179%
0%
100 %
200 %
300 %
Dec-19 Mar-20 Jun-20 Sep-20 Dec-20
BOT Minimum Requirement Merged Bank LCR
Optimizing balance sheet with healthy liquidity position
12
• In line with post-merger plan to optimize B/S, the Bank proactively
manages funding cost and enhances return on liquid assets via other
investments.
• Deposit is a major source of funds and the Bank strategically builds retail
deposit base to ensure stable deposit and less reliance on short-term
wholesale funding and the Bank expected the trend to continue with
deposit-led strategy and creation of a strong deposit franchise.
• Merged bank’s LCR was well above the BOT minimum requirement at
100%.
Net Liquid Asset Definition: Cash + Interbank Asset + Investment - Interbank liab.
Continue Optimized B/S through Liquid Asset Management
LCR Well Above Regulatory Requirement
Retail Deposit is a Major Source of Funds
Unit: THB Bn % of Total Funding
Official Merged bank’s LCR as of Mar 20 reported to BOT on May 21
340295 312
100%
101%
100%
90.00%
92.00%
94.00%
96.00%
98.00%
100.00%
0
200
400
600
Dec-19 Dec-20 Mar-21
Net Liquid Asset LDR
100%
65%
23%
3% 3% 5% 2%
63%
25%
2% 3% 4% 2%
Retail Deposit CommercialDeposit
SeniorDebenture
Sub-debenture InterbankBorrowing
Others
Dec-20 Mar-21

Maintaining high liquidity together with improving cost of deposit
Loans -0.9% YTD
Deposit +0.8% YTD
Net Interbank
1,398
1,392
Deposit
Loans
Cost of deposit
1.29%
1.16%
1.51%
Strong Liquidity Position
• Leading deposit franchise in retail banking helps Merged bank in managing cost of deposit in this very low rate environment by
▪ Proactive manage balance sheets by reducing the rate of flagship products and continue to gain deposit volume
▪ Optimize balance sheet by running down high cost of deposit from merger position
▪ Positive contribution from FIDF cuts
13
0.96% Cost of Deposit
-71 bps from Dec-19
Note: Hybrid deposits include No-Fixed, ME and Ultra saving
0.84%
1,398
1,4431,404
1,382
1,406
1,3631,373
1,393
Dec-19 Jan-20 Feb-20 Mar-20 Apr-20 May-20 Jun-20 Jul-20 Aug-20 Sep-20 Oct-20 Nov-20 Dec-20 Jan-21 Feb-21 Mar-21
~210 bn
~110 bn~150 bn
~160 bn~135 bn
~148 bn
0.80%
1,384
1,380

1.29%1.16%
0.96%0.84% 0.80%
0.00%
0.20%
0.40%
0.60%
0.80%
1.00%
1.20%
1.40%
1.60%
1.80%
1Q20 2Q20 3Q20 4Q20 1Q21
Well-managed cost of fund lowering impact on NIM from yield side
14
• Policy rate cuts from 1.25% to 0.5% throughout 2020,
as a result, loan yield compressed to 4.60%
• The reduction QoQ came from repricing of new loans,
the shift in loan mix and partly EIR impact from change
in accounting estimates to be more conservative on
EIR recognition and to better reflecting competition and
payment behavior of customer for mortgage portfolio
• YoY reduction was mainly from multiple rate cuts
• Balance sheet optimization resulted in lower interest
expense for the Merged bank plus proactive balance
sheet management on lower funding cost (No-Fixed,
Ultra Saving and ME Save), therefore, cost of
deposit reduced by 4 bps QoQ and 49 bps YoY
• YoY reduction was partly from lower FIDF from
0.46% to 0.23%
-4 bps QoQ
-49 bps YoY
Loan YieldCost of Deposit
5.25%
4.88% 4.83% 4.78%4.60%
5.41%5.03%
4.86% 4.90%4.72%
0.0 0%
1.0 0%
2.0 0%
3.0 0%
4.0 0%
5.0 0%
3.00%
3.50%
4.00%
4.50%
5.00%
5.50%
6.00%
1Q20 2Q20 3Q20 4Q20 1Q21
Loan yield (excluded PPA impact)
Net Interest Margin (NIM)
-18 bps QoQ
-65 bps YoY3.12%
2.88% 2.92%3.06% 3.00%
1Q20 2Q20 3Q20 4Q20 1Q21
-6 bps QoQ
-12 bps YoY
• Despite reduction in loan yield, NIM stood at 3.00%,
supporting by balance sheet optimization and the
effort in proactive manage down funding cost. This
also lessened impact of low rate environment and
lower yields on earning assets

With the focus on loan quality, NII on pressure
15
• Q1 NII dropped QoQ and YoY, reflected lower yields and lower in loan volume as we continued to focus on quality amidst challenging
environment. The Merged bank selectively grew new loans and shifted towards lower risk areas, coupled with low interest rate environment
and more conservative adjustment on accounting estimates.
14,01413,045 13,227 13,519
12,872
3,000
5,000
7,000
9,000
11,000
13,000
15,000
1Q20 2Q20 3Q20 4Q20 1Q21
THB million
-4.8% QoQ
-8.1% YoY
Net Interest Income

2,815 2,158
2,633 2,970 3,032
1,367
1,365 352
1,327 939
4,182
3,523
2,984
4,297 3,971
-
500
1,00 0
1,50 0
2,00 0
2,50 0
3,00 0
3,50 0
4,00 0
4,50 0
5,00 0
1Q20 2Q20 3Q20 4Q20 1Q21
THB million
MF fee and investment portfolio management supporting overall Non-NII
Breakdown Strategic Fee Products Total Non-Interest Income (Non-NII)
+2% QoQ
+8% YoYNet fee &
service income
Other Non-NII
Total Non-NII
-29% QoQ
-31% YoY
-8% QoQ
-5% YoY
THB million (Prelim data)
• MF fee QoQ and YoY growth was mainly driven by higher high fee
investment volumes, as well as market sentiment at the beginning of
the year. Other key drivers were new IPO lunches during the quarters.
• Non-auto BA fee was slowdown after the tax season in 4Q20 while
Auto BA fee was fairly on track.
• Trade finance and FX gradually increased since 2Q20 as business
activities continued to resume after the full lockdown.
• Non-NII to avg. assets was at 0.89% in line with the guidance.
• The decrease in Non-NII was due mainly to our investment
management. In the previous quarters the Bank strategically sold
and reduced investment position to limit impact from unfavorable
bond market outlook. As a result, gain on sales of investments
was lower QoQ. Nonetheless, the Bank saw limited impact from
mark-to-market loss.
• Net fee and service income rose QoQ, boosted by MF fees.
1,560
1,044 1,0831,514 1,388
654
336560
704 1,088
76
44
53
43
55459
287
280
313
383
118
132131
135
132
1Q20 2Q20 3Q20 4Q20 1Q21
Bancassurance fee
Mutual fund fee
Loan-related fee
TF and FX fee
LG fee
-8% QoQ
-11% YoY
+55% QoQ
+66% YoY
+29% QoQ
-27% YoY
+22% QoQ
-17% YoY
-2% QoQ
+13% YoY

14,014 13,045 13,227 13,519 12,872
4,1823,523 2,984
4,2973,971
18,19516,569 16,212
17,81616,844
0
5,000
10,000
15,000
20,000
1Q20 2Q20 3Q20 4Q20 1Q21
NII Non-NII Total Operating Income
17
Total Operating Expense
THB million
• Recurrent expenses decline strongly on cost-saving initiatives after merger.
OPEX recorded at THB 7.9 bn, down by -2% QoQ and -5% YoY. Total
operating expense included one-time separation package and other
integration expenses which incurred in 1Q21.
▪ As of Mar-21, the Merged bank’s headcount went down to 15,742
personnel (-1.3k QoQ), resulting from one-time separation package,
plus natural attrition.
▪ Branch rationalization continues as plan (reduced by 52 branches QoQ,
203 branches YoY).
Total Operating Income
• An economic slowdown from the pandemic resulted in core revenues
-5% QoQ and -8% YoY, due to lower NII and Non-NII.
Under challenging revenue environment, cost synergy realization going as plan
THB million
-5% QoQ
-8% YoY
-8% QoQ
-5% YoY
-5% QoQ
-8% YoY
8,331 7,776 7,4298,086 7,928
0
2,000
4,000
6,000
8,000
10,000
12,000
14,000
16,000
18,000
20,000
1Q20 2Q20 3Q20 4Q20 1Q21
-2% QoQ
-5% YoY

Approaching the EBT, integration expenses expected to accelerate but to be self-funded by core cost-saving initiatives
18
• With cost discipline, 1Q21 expenses decreased both QoQ and YoY. Tangible cost saving was around ~THB 2 bn vs. strategic plan of synergies realization.
▪ Major accumulated cost saving came from HR cost saving which resulted from initiatives since Y2020. The Merged bank had early retirement (ER) package
effective on 1st July and 2nd round offering in Feb-21, so called separation package. The full cost saving impact will show in second quarter for personnel
expense. Headcount went down to 15,742 personnel, reduced from the beginning of the merger by approximately 3.7K. This shows the discipline in
execution of synergy realization.
▪ Branch rationalization & premise cost saving started to kick in in 4Q20. Merged bank currently has 681 branches (Total branches reduced from merger date
by 214 branches to 681 branches).
▪ While accumulated integration cost was around THB 1.9 bn and this integration cost will be only one-time expense during initial period of post-merger
• After merger, the Merged bank has continued to improve flexibility, scalability and efficiency of people, marketing, branches and IT infrastructures and has aimed
to improve C/I ratio to low-40s according to our 5 year-plan.
HR Cost saving, Marketing cost saving,
Networking & operational cost saving~THB 0.93 bn
Integration
cost
Cost
saving
Separation package, Branch
rationalization expense~THB 0.97 bn
Accumulated net cost saving 1Q21*
~THB 2 bn
Integration cost ~1.9 bn
vs.Total cost saving 3.9 bn
1Q21
* Accumulative from Y2020 for synergy realization

As a result, C/I ratio in line with target, with long-term aspiration to achieve low-40s
19
• With the pressure on income affected from Covid-19, C/I ratio was at 47% with the effort in accelerating cost saving
synergies to self-fund integration expenses. If excluded PPA impact, cost to income ratio was 46%.
• C/I ratio is expected to remain at high 40s in 2021 due to integration activities before the EBT.
Cost-to-Income Ratio
46%47%
46% 45%47%
1Q20 2Q20 3Q20 4Q20 1Q21
+2% QoQ
+1% YoY

Pre-provision profit reflected our prudent business direction
20
Pre-Provision Operating Profit (PPOP)
• As a result of our prudent business direction during fragile economic recovery from Covid-19, 1Q21 PPOP
was THB 8,898 mn, -9% QoQ and -10% YoY
9,862
8,791 8,809
9,805
8,898
0
1,000
2,000
3,000
4,000
5,000
6,000
7,000
8,000
9,000
10,000
1Q20 2Q20 3Q20 4Q20 1Q21
THB million
-9% QoQ
-10% YoY

Principle-based relief schemes and deterioration of asset quality captured by the ECL model
21
Guiding Principle of Post Relief Risk Schemes
Note: For SC 2-4, loan staging could be classified as stage 1 or 2 depending on
customer’s pre-Covid19 status (no up-staging took place), to reflect real risk level
• The Bank has provided relief measures to affected customers, ranging from
scheme 1-7 (SC1-SC7), based on customer’s debt service ability
• The Bank uses BOT approved and externally validated ECL models consistently
throughout 2020, with parameters and behavior assumptions which drive PD and
LGD and immediately pick up on any portfolio deteriorations also via SICR
method.
• On LGD of auto portfolio, we looked back to 2 crisis cycles, the financial crisis
and first car sales crisis, to pick up the worst LGD. On top of that we applied a
Covid-19 factor.
• The model picks up days past due within stages and imposes bucket and
corresponding PD shifts.
• On top of that, we flag customers that selected one of the 7 schemes to reflect
real risk level and assign elevated PDs in accordance with the severity of the
program.
• Therefore, by continuously updating the actual customer scheme and stage from
the real flow, ECL generates provision requirements that reflect the Covid-19
impact, reducing the necessity to maintain management overlay (MO).
• Nevertheless, we set additional MO for the unpaid accrued interest in SC5-6, on
top of using 100% LGD and respective customers’ PD for all schemes.
• In addition, looking forward and taking into account the 2nd Covid-19, MO has
been set aside based on industry/customers’ specific needs.
Interest Principal
SC 1 Full Full 1 Normal
SC 2 Full Partial 1
SC 3 Full Postponed 1
SC 4 Partial Postponed 1
SC 5 2
SC 6 2
SC 7 3 100%
Minimum
Stage
Miminum
PD
Level
Scheme
Additional skip payment > 6-12 months
Additional skip payment > 12 months
Additional skip payment ≤ 6 months
Repayment schedule

Prudent risk management and prudent level of allowances set aside
22
ECL & Credit Cost
• The Bank continued to build up provision, by setting
aside THB 5.5 bn of ECL in 1Q21 or a credit cost of
160 bps at lower end of the Merged bank’s target
• Provision is expected to remain elevated in 2021
due to a pressure on asset quality after debt relief
program expired and a longer-than expected Covid-
19 situation
Expected credit loss (ECL) (THB million)Annualized credit cost (bps)
• Further reinforce COVID-19 reserve, allowance for
ECL increased to THB 54 bn as of 1Q21
• With an increase in NPLs in line with management
guidance, LLR ratio declined to 124% in Mar-21
from 131% in Dec-2021
Allowance for ECL (THB million)% Stage 3 to Allowance for ECL
Allowance for ECL and LLR Ratio Net Profit
THB million
• As a result of risk managment, YoY net profit
reflecting inorganic growth but QoQ performance
largely pressured by high ECL set aside for future
uncertainties
• Net profit in 1Q21 increased QoQ by 125% due
mainly to reduction in ECL, YoY reduction in net
profit reflecting the impact in core revenues
4,760 4,972
6,8638,237
5,480
137 144
199
238
160
0
50
100
150
200
250
-1,000
1,000
3,000
5,000
7,000
9,000
11,000
13,000
15,000
17,000
1Q20 2Q20 3Q20 4Q20 1Q21
46,715 44,374 48,371 51,967 53,800
106%114%
132% 131%124%
-15%
5%
25%
45%
65%
85%
105%
125%
145%
02004006008001,0001,2001,4001,6001,8002,0002,2002,4002,6002,8003,0003,2003,4003,6003,8004,0004,2004,4004,6004,8005,0005,2005,4005,6005,8006,0006,2006,4006,6006,8007,0007,2007,4007,6007,8008,0008,2008,4008,6008,8009,0009,2009,4009,6009,80010,00010,20010,40010,60010,80011,00011,20011,40011,60011,80012,00012,20012,40012,60012,80013,00013,20013,40013,60013,80014,00014,20014,40014,60014,80015,00015,20015,40015,60015,80016,00016,20016,40016,60016,80017,00017,20017,40017,60017,80018,00018,20018,40018,60018,80019,00019,20019,40019,60019,80020,00020,20020,40020,60020,80021,00021,20021,40021,60021,80022,00022,20022,40022,60022,80023,00023,20023,40023,60023,80024,00024,20024,40024,60024,80025,00025,20025,40025,60025,80026,00026,20026,40026,60026,80027,00027,20027,40027,60027,80028,00028,20028,40028,60028,80029,00029,20029,40029,60029,80030,00030,20030,40030,60030,80031,00031,20031,40031,60031,80032,00032,20032,40032,60032,80033,00033,20033,40033,60033,80034,00034,20034,40034,60034,80035,00035,20035,40035,60035,80036,00036,20036,40036,60036,80037,00037,20037,40037,60037,80038,00038,20038,40038,60038,80039,00039,20039,40039,60039,80040,00040,20040,40040,60040,80041,00041,20041,40041,60041,80042,00042,20042,40042,60042,80043,00043,20043,40043,60043,80044,00044,20044,40044,60044,80045,00045,20045,40045,60045,80046,00046,20046,40046,60046,80047,00047,20047,40047,60047,80048,00048,20048,40048,60048,80049,00049,20049,40049,60049,80050,00050,20050,40050,60050,80051,00051,20051,40051,60051,80052,00052,20052,40052,60052,80053,00053,20053,40053,60053,80054,00054,20054,40054,60054,80055,00055,20055,40055,60055,80056,00056,20056,40056,60056,80057,00057,20057,40057,60057,80058,00058,20058,40058,60058,80059,00059,20059,40059,60059,80060,00060,20060,40060,60060,80061,00061,20061,40061,60061,80062,00062,20062,40062,60062,80063,00063,20063,40063,60063,80064,00064,20064,40064,60064,80065,00065,20065,40065,60065,80066,00066,20066,40066,60066,80067,00067,20067,40067,60067,80068,00068,20068,40068,60068,80069,00069,20069,40069,60069,80070,00070,20070,40070,60070,80071,00071,20071,40071,60071,80072,00072,20072,40072,60072,80073,00073,20073,40073,60073,80074,00074,20074,40074,60074,80075,00075,20075,40075,60075,80076,00076,20076,40076,60076,80077,00077,20077,40077,60077,80078,00078,20078,40078,60078,80079,00079,20079,40079,60079,80080,00080,20080,40080,60080,80081,00081,20081,40081,60081,80082,00082,20082,40082,60082,80083,00083,20083,40083,60083,80084,00084,20084,40084,60084,80085,00085,20085,40085,60085,80086,00086,20086,40086,60086,80087,00087,20087,40087,60087,80088,00088,20088,40088,60088,80089,00089,20089,40089,60089,80090,00090,20090,40090,60090,80091,00091,20091,40091,60091,80092,00092,20092,40092,60092,80093,00093,20093,40093,60093,80094,00094,20094,40094,60094,80095,00095,20095,40095,60095,80096,00096,20096,40096,60096,80097,00097,20097,40097,60097,80098,00098,20098,40098,60098,80099,00099,20099,40099,60099,800100,000
1Q20 2Q20 3Q20 4Q20 1Q21
-33% QoQ
+15% YoY
+4% QoQ
+15% YoY4,163
3,095
1,6191,235
2,782
1Q20 2Q20 3Q20 4Q20 1Q21
+125% QoQ
-33% YoY
*
* LLR as of Dec-20 at 131% represented changed in accounting report from gross basis to net basis to be in line with the industry
20.43 17.39 17.43 19.22 21.76
16.89 17.14 19.63 21.62
21.92
9.39 9.85 11.31
11.13 10.12 46.72 44.37
48.37 51.97 53.80
1Q20 2Q20 3Q20 4Q20 1Q21
Provision coverage by stage
23
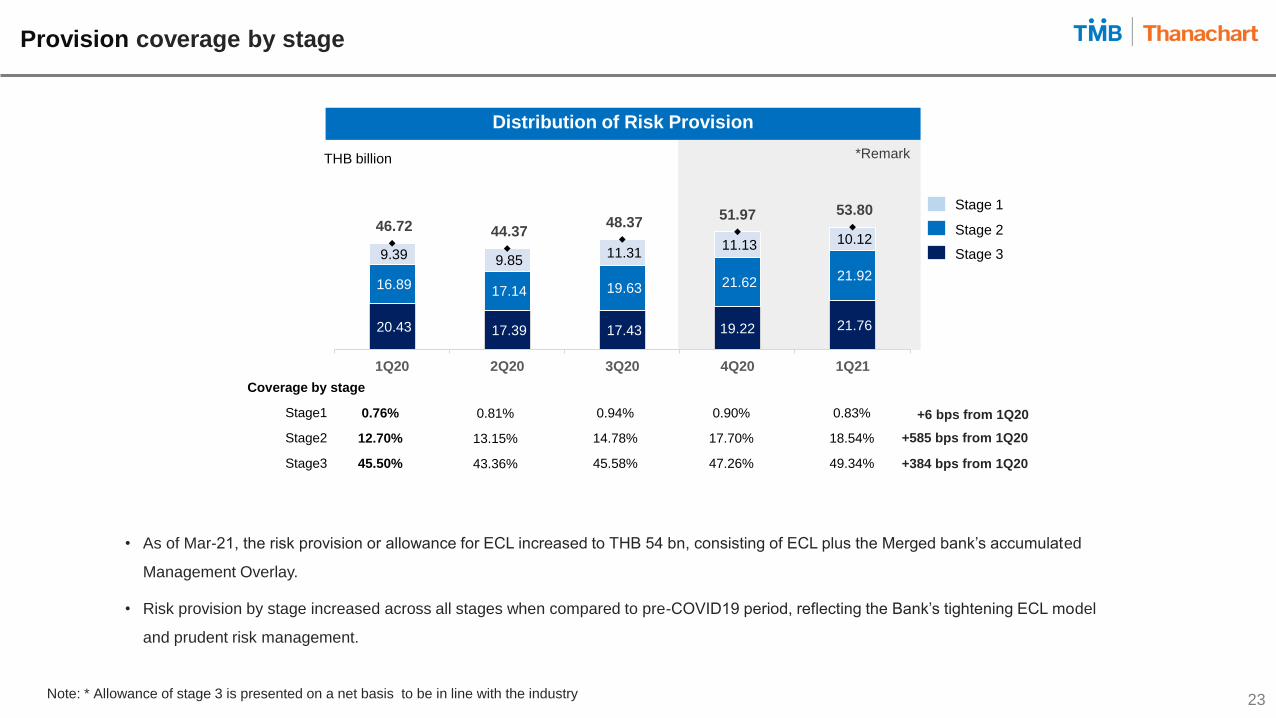
Distribution of Risk Provision
Coverage by stage
Stage1
Stage2
Stage3
THB billion
• As of Mar-21, the risk provision or allowance for ECL increased to THB 54 bn, consisting of ECL plus the Merged bank’s accumulated
Management Overlay.
• Risk provision by stage increased across all stages when compared to pre-COVID19 period, reflecting the Bank’s tightening ECL model
and prudent risk management.
Stage 1
Stage 2
Stage 3
0.76%
12.70%
45.50%
0.81%
13.15%
43.36%
0.94%
14.78%
45.58%
0.90%
17.70%
47.26%
+6 bps from 1Q20
+585 bps from 1Q20
+384 bps from 1Q20
0.83%
18.54%
49.34%
Note: * Allowance of stage 3 is presented on a net basis to be in line with the industry
*Remark

0
200
400
600
800
1,000
1,200
1,400
1,600
Mar-20 Dec-20 Mar-21
14.3%
2.8%2.5% 2.3% 2.5% 2.75%
2010 2020 1Q21
24
Loan Classification (%)
Stage 1 Stage2 Stage 3
1.58 tn
1,421 bn
120 bn 40 bn
89.9% Stage 1
7.6% Stage 2
2.50% Stage 3
Prudent actions strengthening loan portfolio quality ahead of economic headwinds
• Last year, TMB proactively resolved NPLs to clear up headroom for 2021 as we
expected to see an increase in NPLs after the end of 1st phase relief measures.
We also expected slow NPL sales due to an increase in supply in NPL sale market
• As expected, % stage 3 rose slightly to 2.75%, mainly from a flow of SME
customers and also due to a slow resolution activities in 1Q21
• The reduction in % stage 2 loan was also from customer upgrade, not solely from
stage 2 deterioration
NPL Ratio/ Stage 3
TFRS9
• The current level of stage 3 of 2.75%, in line with guidance. Such a
level was relatively low when compared to peers and still has
headroom to absorb stage 3 trend
• With the extension of relief measures as well as the new released
program of asset warehousing and the BoT special loan would help
avoid NPL hiccup in short-term
89.9% Stage 1
7.4% Stage 2
2.75% Stage 3
Pre-Covid 19
1.58 tn1.60 tn
89.0% Stage 1
8.3% Stage 2
2.76% Stage 3
1,417 bn1,427 bn
132 bn44 bn 43 bn116 bn

Reinforce capital position with wider buffer over requirements
25
• We remain strongly capitalized, enabling the Bank to
withstand the uncertainty ahead
• Due to Economic headwind impacted from COVID-19
pandemic, the Bank reinforced solvency ratio with
organic capital generation and balance sheet
optimization, reflecting higher buffer Tier1 and lower in
credit RWA
4Q20
14.4%
CE
T 1
+ 1%
AT1
issued in
Nov-19
CE
T 1
1Q21
14.5%
1Q21
15.5%
TIE
R1
CET1 THB 166 bn THB 172 bn
RWA THB 1,217 bn THB 1,185 bn
Tier 1 minimum
requirement
CAR minimum
requirement11.0%
Solid Capital with ample buffer over requirement
+4.0%
Tier 2
1Q21
19.5%
CA
R
8.5%
TIER1 THB 178 bn THB 184 bn
*Prelim numbers

26
Relief Program Update
1Q21 Performance & Asset Quality
Integration Update

27
Integration roadmap and progress to-date : On plan, on time, on budget
Channel
Branding
& Communication
Product
& System
Employee
10 Co-locations
10 branch closure
38 Co-locations
32 branch closure
Completed staff transfer
communication
Finalized rebranding
plan and approach
Rebranding
readiness for
product and
channelFinalized
communication plan
Completed data preparation
for direct communication
Finalized content for
direct communication
Completed data
cleansing for direct
communication
TFUND
available on
TMB platform
Complete bank-
wide staff transfer
Auto bill
payment
at branch
CYC
referral
Auto bill payment via ATM
Compensation harmonizationStart off staff onboarding
by wave every months
Card-less withdrawal across ATMs
TBANK bill payment on TMB Touch
Q2’21Q1’212020
79 Co-locations
81 branch closure
114 Co-locations
39 branch closure
TBANK bill payments at
TMB’s ATMs
Fees waived for TMB-
TBANK cross-bank ATMs
Voluntary ER
New booking of
SE loans on Touch
Align deposits product
features of Merged bank
Credit card
system upgrade
(wave 1)
Credit card system
upgrade (wave 2) and
process readiness
Mobile banking readiness
for customer migration
C-level setup and single
board government alignment
TMB deposits opening
at all TBANK branches
Mobile banking enhance to
support auto loan features
New corporate
internet banking
(Business ONE)
Data migration and New
enterprise customer (EC)
platform launched
Completed staff consent
for employer transfer
Mock run 1 Mock run 2 Mock run 3 Mock run 4
New brand
approval
and launch
EBT

Disclaimer: The information in this material is in summary form and does not purport to be complete. No representation or warranty, express or implied, is or should be
made concerning, and no reliance should be place on, the accuracy, fairness, or completeness of this information and liability therefore is disclaimed. TMB Bank Public
Company Limited (the “Bank” or “TMB”) does not independently verified, approved or endorsed the information contained herein, or undertakes to update or revise any
information, whether as a result of new information, future events or otherwise.
The material to be presented may contain certain forward-looking statements and information regarding the Company that reflect current views and/or expectations of the
Company with respect to its performance, business and future events. Statements relating to achieving certain goals are forward-looking statements. Forward-looking
statements are based on certain assumptions and expectations of future events. The Company cannot guarantee that these assumptions and expectations are accurate
or will be realized. Past performance does not guarantee or predict future performance. A number of important factors could cause actual results or outcomes to differ
materially from those expressed in any forward-looking statement. Representative examples of these factors include (without limitation) general industry and economic
conditions, interest rate trends, cost of capital and capital availability, currency exchange rates, competition from other companies, shifts in customer demands, customers
and partners, changes in operating expenses including employee wages, benefits and training, governmental and public policy changes and the continued availability of
financing in the amounts and the terms necessary to support future business. Actual future performance, outcomes and results may differ materially from those expressed
in forward-looking statements as a result of a number of risks, uncertainties and assumptions. You are cautioned not to place reliance on these forward-looking
statements, which are based on current view of the management on future events. The Company does not assume any responsibility to publicly amend, modify or revise
any forward-looking statements, on the basis of any subsequent developments, information or events, or otherwise.
This presentation does not constitute an offer, or invitation, or solicitation of an offer, to subscribe for, sell or purchase any securities. Neither this material nor anything
contained herein shall form the basis of any contract or commitment whatsoever. The recipients of this presentation should not make any investment or business decision
or take actions in reliance on the information and statements contained in this presentation and must conduct their own investigation and analysis of the contemplated
transaction and the information and data contained herein.
This presentation is being made available on a confidential basis and intended only for the recipients, and may not be copied, reproduced, retransmitted or distributed by
a recipient to any other persons in any manner. By attending this presentation and/or accepting a copy of this document, you agree to be bound by the foregoing
limitations and conditions.
Investor Relations
www.tmbbank.com/ir