Making Powerpoint Slide
23
Making PowerPoint Slides Avoiding the Pitfalls of Bad Slides
-
Upload
lucille-ballares -
Category
Technology
-
view
2.108 -
download
0
Transcript of Making Powerpoint Slide

Making PowerPoint SlidesAvoiding the Pitfalls of Bad Slides
Tips to be Covered
Outlines Slide Structure Fonts Color Background Graphs Spelling and Grammar Conclusions Questions
2
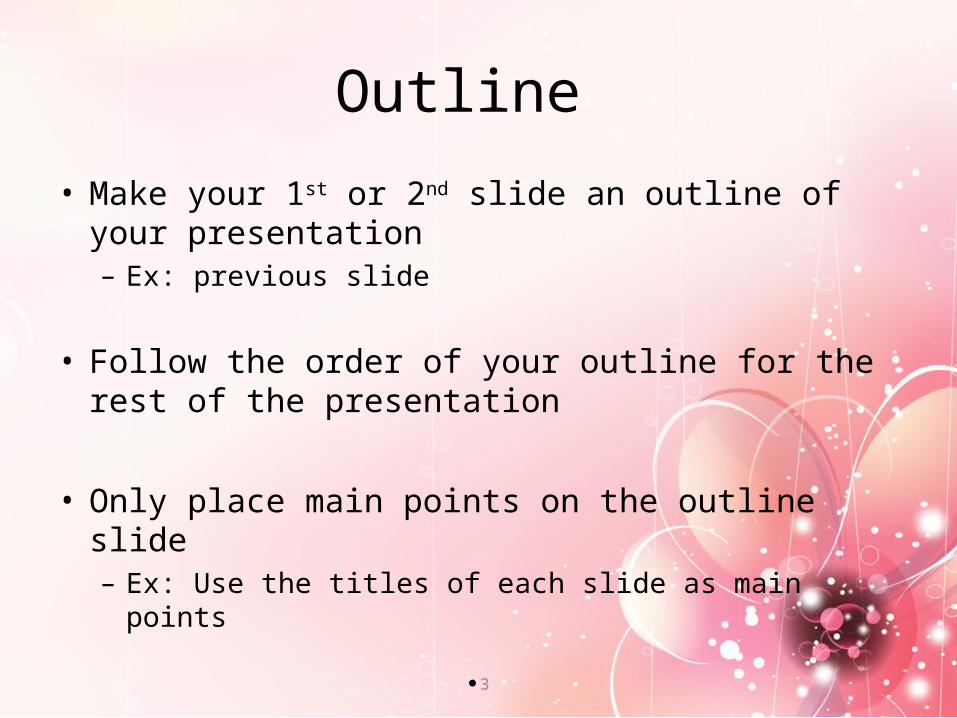
Outline
• Make your 1st or 2nd slide an outline of your presentation– Ex: previous slide
• Follow the order of your outline for the rest of the presentation
• Only place main points on the outline slide– Ex: Use the titles of each slide as main points
3

4
A product assembly team in a gaming machine manufacturer were looking for ways of building the product more efficiently. They broke down the assembly process into a set of Flowcharts, showing how sub-assemblies were made and then built into the final product. Analysis of the reel assembly process revealed two improvements:
1.The kit of parts was already checked by the kit assembly line, who were sometimes careless, as they knew the kit would be rechecked. The assembly line process was improved so the check here could be removed. This saved over two minutes per reel in checking, and up to fifteen minutes when the kit was faulty.
2.Fitting the reel band after the reel had been attached to the base was awkward. Fitting the band before the reel was attached to the base was more comfortable and saved about a minute per reel.
Flowchart Example 4

Slide Structure – Good
Use 1-2 slides per minute of your presentation
5
Write in point form, not complete sentences
Include 4-5 points per slide
Avoid wordiness: use key words and phrases only

Slide Structure - BadSlide Structure - Bad
• This page contains too many words for a presentation slide. It is not written in point form, making it difficult both for your audience to read and for you to present each point. Although there are exactly the same number of points on this slide as the previous slide, it looks much more complicated. In short, your audience will spend too much time trying to read this paragraph instead of listening to you.
6

7
Slide Structure – Good
• Show one point at a time:– Will help audience concentrate on
what you are saying– Will prevent audience from reading
ahead– Will help you keep your presentation
focused

Slide Structure - Bad
• Do not use distracting animation
• Do not go overboard with the animation
• Be consistent with the animation that you use
8

Fonts - Good
• Use at least an 18-point font• Use different size fonts for main
points and secondary points– this font is 24-point, the main point font
is 28-point, and the title font is 36-point
• Use a standard font like Times New Roman or Arial
9

Fonts - Bad• If you use a small font, your audience won’t be able to read what you have written
• CAPITALIZE ONLY WHEN NECESSARY. IT IS DIFFICULT TO READ
• Don’t use a complicated font
10
Color - Good
• Use a color of font that contrasts sharply with the background– Ex: blue font on white background
• Use color to reinforce the logic of your structure– Ex: light blue title and dark blue text
• Use color to emphasize a point– But only use this occasionally
11

Color - Bad
• Using a font color that does not contrast with the background color is hard to read
• Using color for decoration is distracting and annoying.• Using a different color for each point is unnecessary
– Using a different color for secondary points is also unnecessary
• Trying to be creative can also be bad
12

Color - Conversion to B/W
Make sure your graphics are still legible even in black and white.
Necessary for handouts Useful for color-blind viewers
13

Background - Good
• Use backgrounds such as this one that are attractive but simple
• Use backgrounds which are light– Dark is arty, but hard on the eyes– Dark is expensive to reproduce on paper (for handouts)
• Use the same background consistently throughout your presentation
14

Background – Bad
• Avoid backgrounds that are distracting or difficult to read from
• Always be consistent with the background that you use

Graphs - Good
• Use graphs rather than just charts and words.– Data in graphs is easier to comprehend &
retain than is raw data– Trends are easier to visualize in graph form
• Always title your graphs.• Always give credit to the source.
16

Graphs - Bad
17
January February March AprilBlue Balls 20.4 27.4 90 20.4Red Balls 30.6 38.6 34.6 31.6

Graphs - Good
18
Items Sold in First Quarter of 2002
0
10
20
30
40
50
60
70
80
90
100
January February March April
Blue Balls
Red Balls

Graphs - Bad
19
20.4
27.4
90
20.4
30.6
38.6
34.631.6
0
10
20
30
40
50
60
70
80
90
100
January February March April
Blue Balls
Red Balls
Graphs - Bad
• Minor gridlines are unnecessary• Font is too small• Colors are illogical• Title is missing• Shading is distracting
20

Spelling and Grammar
• Proof your slides for:– speling mistakes– the use of of repeated words– grammatical errors you might have
make
• If English is not your first language, please have someone else check your presentation!
21

Conclusion
• Use an effective and strong closing– Your audience is likely to remember
your last words
• Use a conclusion slide to– Summarize the main points of your
presentation– Suggest future avenues of research
22

Questions??
• End your presentation with a simple question slide to:– Invite your audience to ask questions– Provide a visual aid during question
period– Avoid ending a presentation abruptly
23