Major Dietary Patterns and Their Associations with ...
11
Original Article www.ijpm.ir International Journal of Preventive Medicine, Vol 4, No 4, April, 2013 448 Major Dietary Patterns and Their Associations with Overweight and Obesity Among Iranian Children Maryam Bahreynian 1 , Zamzam Paknahad 2,3 , Mohammad Reza Maracy 4 ABSTRACT Background: Increasing prevalence of obesity is a major health concern. Lifestyle behaviors and diet play an important role in developing childhood obesity. The aim of this study was to determine the association between major dietary patterns and overweight/obesity in a group of Iranian school‑aged children. Methods: This cross‑sectional study was conducted in Isfahan, Iran with 637 elementary school‑aged children. A semi‑quantitative food‑frequency questionnaire was used to assess usual dietary intakes. Data on socio‑demographic, physical activity and other lifestyle habits were collected using standard questionnaires. Obesity was determined based on national cut‑offs. Factor analysis was used for identifying major dietary patterns. Results: Three major dietary patterns were extracted; “Healthy,” “Western,” and “Sweet‑Dairy.” After adjusting for confounders, girls in the second quartile of healthy pattern, were more likely to be overweight (odds ratio [OR] =2.23, Confidence intervals [CI] =1.003, 4.96) compared to those in the highest quartile. Likelihood of being overweight was lower for girls in the second quartile of western dietary pattern versus the fourth quartile (OR = 0.46, CI = 0.21, 1.01). Accordingly, lower adherence to sweet and dairy pattern was associated with lower body mass index (BMI) among girls (OR = 0.42, CI = 0.21, 0.85). There was no significant relationship between western and sweet‑dairy pattern with BMI among boys, however, significant association was observed between lowest and highest quartiles of healthy pattern (OR = 0.36, CI = 0.15, 0.84). Conclusions: We found significant associations between the three dietary patterns and obesity among girls. Only healthy pattern was related to weight status of schoolboys. Longitudinal studies will be needed to confirm these associations. Keywords: Children, dietary patterns, factor analysis, obesity, overweight INTRODUCTION Obesity is currently the most common dietary problem, not only in the United States, but also one of the greatest public health issues in developing societies such as Iran. [1,2] The prevalence and 1 School of Nutrition and Food Sciences, Isfahan University of Medical Sciences, Isfahan, Iran 2 Department of Clinical Nutrition, School of Nutrition and Food Sciences, Isfahan University of Medical Sciences, Isfahan, Iran, 3 Food Security Research Center, Isfahan University of Medical Sciences, Isfahan, Iran, 4 Department of Biostatistics and Epidemiology, School of Health, Isfahan University of Medical Sciences, Isfahan, Iran Correspondence to: Dr. Zamzam Paknahad, Department of Clinical Nutrition, School of Nutrition and Food Sciences, Isfahan University of Medical Sciences, Isfahan, Iran. E‑mail: [email protected] Date of Submission: Nov 17, 2012 Date of Acceptance: Jan 24, 2013 How to cite this article: Bahreynian M, Paknahad Z, Maracy MR. Major dietary patterns and their associations with overweight and obesity among iranian children. Int J Prev Med 2013;4:448-58. www.mui.ac.ir
Transcript of Major Dietary Patterns and Their Associations with ...

Original A
rticle
www.ijpm.inwww.ijpm.ir
International Journal of Preventive Medicine, Vol 4, No 4, April, 2013448
Major Dietary Patterns and Their Associations with Overweight and Obesity Among Iranian Children
Maryam Bahreynian1, Zamzam Paknahad2,3, Mohammad Reza Maracy4
ABSTRACT
Background: Increasing prevalence of obesity is a major health concern. Lifestyle behaviors and diet play an important role in developing childhood obesity. The aim of this study was to determine the association between major dietary patterns and overweight/obesity in a group of Iranian school‑aged children.Methods: This cross‑sectional study was conducted in Isfahan, Iran with 637 elementary school‑aged children. A semi‑quantitative food‑frequency questionnaire was used to assess usual dietary intakes. Data on socio‑demographic, physical activity and other lifestyle habits were collected using standard questionnaires. Obesity was determined based on national cut‑offs. Factor analysis was used for identifying major dietary patterns.Results: Three major dietary patterns were extracted; “Healthy,” “Western,” and “Sweet‑Dairy.” After adjusting for confounders, girls in the second quartile of healthy pattern, were more likely to be overweight (odds ratio [OR] =2.23, Confidence intervals [CI] =1.003, 4.96) compared to those in the highest quartile. Likelihood of being overweight was lower for girls in the second quartile of western dietary pattern versus the fourth quartile (OR = 0.46, CI = 0.21, 1.01). Accordingly, lower adherence to sweet and dairy pattern was associated with lower body mass index (BMI) among girls (OR = 0.42, CI = 0.21, 0.85). There was no significant relationship between western and sweet‑dairy pattern with BMI among boys, however, significant association was observed between lowest and highest quartiles of healthy pattern (OR = 0.36, CI = 0.15, 0.84).Conclusions: We found significant associations between the three dietary patterns and obesity among girls. Only healthy pattern was related to weight status of schoolboys. Longitudinal studies will be needed to confirm these associations.Keywords: Children, dietary patterns, factor analysis, obesity, overweight
INTRODUCTIONObesity is currently the most common dietary problem, not
only in the United States, but also one of the greatest public health issues in developing societies such as Iran.[1,2] The prevalence and
1School of Nutrition and Food Sciences, Isfahan University of Medical Sciences, Isfahan, Iran2Department of Clinical Nutrition, School of Nutrition and Food Sciences, Isfahan University of Medical Sciences, Isfahan, Iran, 3Food Security Research Center, Isfahan University of Medical Sciences, Isfahan, Iran, 4Department of Biostatistics and Epidemiology, School of Health, Isfahan University of Medical Sciences, Isfahan, Iran
Correspondence to:Dr. Zamzam Paknahad, Department of Clinical Nutrition, School of Nutrition and Food Sciences, Isfahan University of Medical Sciences, Isfahan, Iran. E‑mail: [email protected]
Date of Submission: Nov 17, 2012
Date of Acceptance: Jan 24, 2013
How to cite this article: Bahreynian M, Paknahad Z, Maracy MR. Major dietary patterns and their associations with overweight and obesity among iranian children. Int J Prev Med 2013;4:448-58.
www.mui.ac.ir
Bahreynian, et al.: Dietary patterns and childhood obesity
449International Journal of Preventive Medicine, Vol 4, No 4, April, 2013
severity of overweight is increasing among children and adolescents.[3,4] Approximately, 20% of Australian children are overweight,[5] this figure is about 15% among U.K children and adolescents.[6] In Iran, 17.7% of children are overweight or obese[7] and according to national reports, an increasing trend was observed in the prevalence of overweight and obesity during 2007‑2009 among Iranian childen.[8]
In the last two decades, the overweight and obesity prevalence has become 2‑4 folds in developing countries.[5] Recent studies have linked the persistence of childhood overweight and obesity into adulthood.[4] Physical and psychological problems are related to childhood obesity, including increased risk of cardiovascular disease, diabetes, hyperlipidemia, hypertension, and metabolic syndrome[9‑12] as well as poor body image, self‑esteem and overall well‑being.[13] Childhood obesity is a multi‑factorial condition results from an interaction between genetics and environment. While a plenty of factors seem to contribute to overweight and other obesity‑related chronic diseases, poor dietary intake is defined as a major contributor.[5,14]
Nutrition transition namely the adoption of a western diet (high amounts of meats, refined grains, snacks and fast food products) may help explain the increase in adiposity among children and adolescents. This phenomenon has started during the past three decades in Iran and its health consequences have emerged since 1990s.[15] Over the past 20 years, dramatic changes have occurred in the meal patterns of children, these may correlate with weight status.[16‑18]
Using dietary pattern approach, which considers a more comprehensive overview of the diet could provide more interpretable findings than studying single nutrients or foods since foods are not consumed separately.[19] Several studies have explored the food patterns throughout the world mainly conducted on adults;[20,21] however, few have focused specifically on Iranian children dietary patterns[22,23] and most of the physiologic outcomes are not studied among children as well as adults.
Few studies[24‑30] have found the relationship between sweets, unhealthy snacks, vegetables, low‑quality dietary patterns and weight among children but due to some culture and ethnic
differences, we cannot generalize them completely to Iranian population. Therefore, the aim of this study was to identify major dietary patterns in relation to overweight and obesity among Iranian school‑aged children.
METHODSThis cross‑sectional study was conducted among
637 (50.8% girls) Isfahani elementary school‑aged children (7‑11 years), selected by a multi‑stage cluster random sampling method. Participants with any history of chronic conditions such as cardiovascular disease, diabetes, liver or kidney disease (n = 10) and diets which affect usual intakes were discarded from the study. Written informed consent was obtained from parents. The study protocol was approved by the research council of Isfahan University of Medical Sciences. (Grant number and ethical committee number, 190122).
A 160‑item semi‑quantitative Food Frequency Questionnaire (FFQ) was used to assess children’s usual dietary intake. The FFQ contained a list of foods with standard serving size commonly consumed in Iran. Parents, mostly mothers, were asked to report the child frequency consumption of each item during the previous year according to the regular consumption such as daily (e.g., bread), weekly (e.g., rice, cheese) or monthly (e.g., fish). All dietary reports were converted to daily consumption (g/day) using household measures for different portion sizes.[31] Food items were then categorized into 41 groups for use in dietary pattern analysis, according to the similarity in their nutrient profile[32] [Table 1]. The nutrient content of each food item was calculated based on the protocol using Nutritionist IV, which was modified for Iranian foods.
Reliability and relative validity of the FFQ were examined in a randomly chosen subgroup of 91 children. The reliability of the FFQ was evaluated by comparing dietary nutrient composition on two occasions. The FFQ showed high reliability for nutrients, for example, the energy‑adjusted correlation coefficients were 0.87 for dietary calcium, 0.70 for potassium, 0.85 for iron, 0.47 for vitamin B
1 and 0.80 for vitamin C. Relative validity
was determined by comparing the estimated intakes from the average of three non‑consecutive dietary records (including two weekdays and one
www.mui.ac.ir
Bahreynian, et al.: Dietary patterns and childhood obesity
International Journal of Preventive Medicine, Vol 4, No 4, April, 2013450
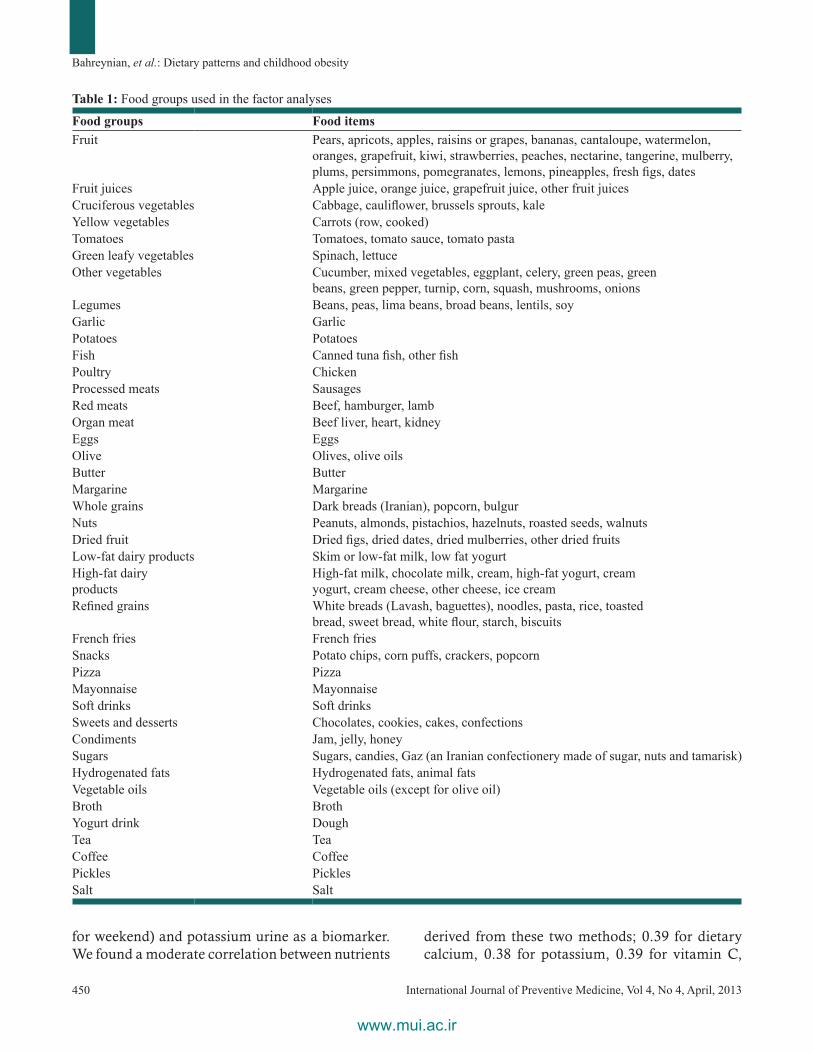
Table 1: Food groups used in the factor analyses
Food groups Food itemsFruit Pears, apricots, apples, raisins or grapes, bananas, cantaloupe, watermelon,
oranges, grapefruit, kiwi, strawberries, peaches, nectarine, tangerine, mulberry, plums, persimmons, pomegranates, lemons, pineapples, fresh figs, dates
Fruit juices Apple juice, orange juice, grapefruit juice, other fruit juicesCruciferous vegetables Cabbage, cauliflower, brussels sprouts, kaleYellow vegetables Carrots (row, cooked)Tomatoes Tomatoes, tomato sauce, tomato pastaGreen leafy vegetables Spinach, lettuceOther vegetables Cucumber, mixed vegetables, eggplant, celery, green peas, green
beans, green pepper, turnip, corn, squash, mushrooms, onionsLegumes Beans, peas, lima beans, broad beans, lentils, soyGarlic GarlicPotatoes PotatoesFish Canned tuna fish, other fishPoultry ChickenProcessed meats SausagesRed meats Beef, hamburger, lambOrgan meat Beef liver, heart, kidneyEggs EggsOlive Olives, olive oilsButter ButterMargarine MargarineWhole grains Dark breads (Iranian), popcorn, bulgurNuts Peanuts, almonds, pistachios, hazelnuts, roasted seeds, walnutsDried fruit Dried figs, dried dates, dried mulberries, other dried fruitsLow-fat dairy products Skim or low-fat milk, low fat yogurtHigh-fat dairy products
High-fat milk, chocolate milk, cream, high-fat yogurt, cream yogurt, cream cheese, other cheese, ice cream
Refined grains White breads (Lavash, baguettes), noodles, pasta, rice, toasted bread, sweet bread, white flour, starch, biscuits
French fries French friesSnacks Potato chips, corn puffs, crackers, popcornPizza PizzaMayonnaise MayonnaiseSoft drinks Soft drinksSweets and desserts Chocolates, cookies, cakes, confectionsCondiments Jam, jelly, honeySugars Sugars, candies, Gaz (an Iranian confectionery made of sugar, nuts and tamarisk)Hydrogenated fats Hydrogenated fats, animal fatsVegetable oils Vegetable oils (except for olive oil)Broth BrothYogurt drink DoughTea TeaCoffee CoffeePickles PicklesSalt Salt
for weekend) and potassium urine as a biomarker. We found a moderate correlation between nutrients
derived from these two methods; 0.39 for dietary calcium, 0.38 for potassium, 0.39 for vitamin C,
www.mui.ac.ir

Bahreynian, et al.: Dietary patterns and childhood obesity
451International Journal of Preventive Medicine, Vol 4, No 4, April, 2013
0.46 for dietary fiber. The correlation coefficient for dietary and urinary potassium was 0.23.
Socio‑demographic characteristics of participants were determined via a questionnaire, including items for parent’s education, job, monthly family income, rent pay and number of children. Content validity[33] of the questionnaire was approved by thirty reviewers before applying in the present study. Assessment of children’s physical activity level was based on Physical Activity Questionnaire‑Children (PAQ‑C). Reliability and content validity of PAQ was evaluated among 82 Isfahani children and adolescents showing acceptable correlation coefficients[34] (Cronbach’s alpha = 0.894).
Anthropometric indicies were measured according to standard protocols. Student’s weight was measured to the nearest 0.1 kg using a digital scale. Height measurement was recorded to the nearest 0.1 cm, without any shoes in a standing position using a portable stadiometer. Body mass index (BMI) was then calculated by the equation (weigh/height2, kg/m2). Definition of overweight/obesity was based on the national cut points derived from the Childhood Adolescence Surveillance and PreventIon of Adult Non‑communicable disease (CASPIAN) study.[2]
Factor analysis with varimax rotation was applied to identify major dietary patterns. Three factors were retained according to the total variance explained, scree plot and the interpretability of the components.[35] Food items with eigenvalues more than 1.7 were considered as main components for each pattern. All individuals received a factor score for each pattern calculated by summing the intakes of food groups weighted by their factor loadings.[35] Students were categorized according to quartiles of dietary pattern scores. One‑way analysis of variance and Chi‑square tests were used to determine significant differences across quartiles for quantitative and categorical variables, respectively. Food items consumed by <5% of participants were excluded (soy milk for all students). Energy‑adjusted dietary variables were used after the definition of major dietary patterns. Associations between dietary patterns and BMI were examined through ordinal logistic regression for boys and girls, separately. The crude odds ratio (ORs) were adjusted for total energy intake. Additional adjustments made for potential
confounders, including age, socio‑economic status (low, moderate, and high), physical activity level (low, moderate, and high), mother’s educational background and job, sleep duration, time spent watching television (TV), child’s birth rank and dietary nutrients. Reference category was defined as the fourth quartile of dietary pattern score. All analysis conducted with Statistical Package for Social Science SPSS 18 (SPSS Inc, Chicago, IL, USA). P < 0.05 was considered as the level of significance.
RESULTSWe identified three major dietary patterns for
the study population. These factors accounted for 21.7% of the variance in food group intakes. The Kaiser‑Mayer‑Olkin (KMO) (measure of sampling adequacy) was more than 0.6, showing a good factor analysis[36] (KMO = 0.736, P < 0.001).
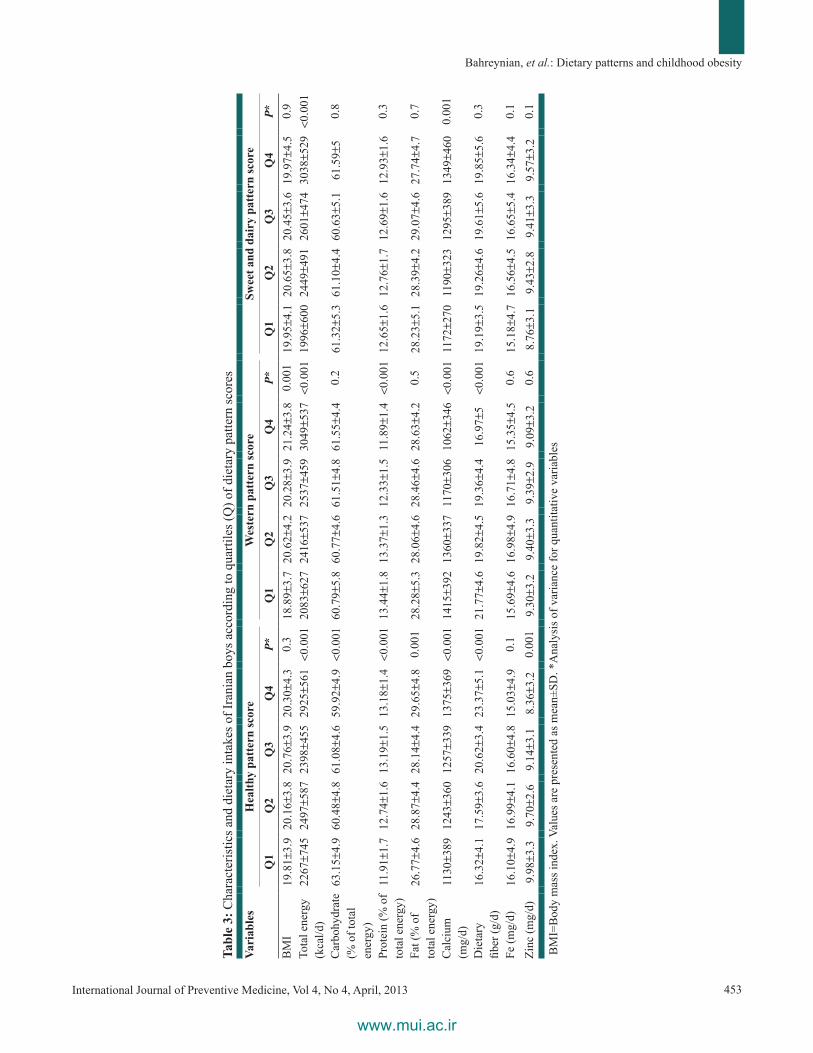
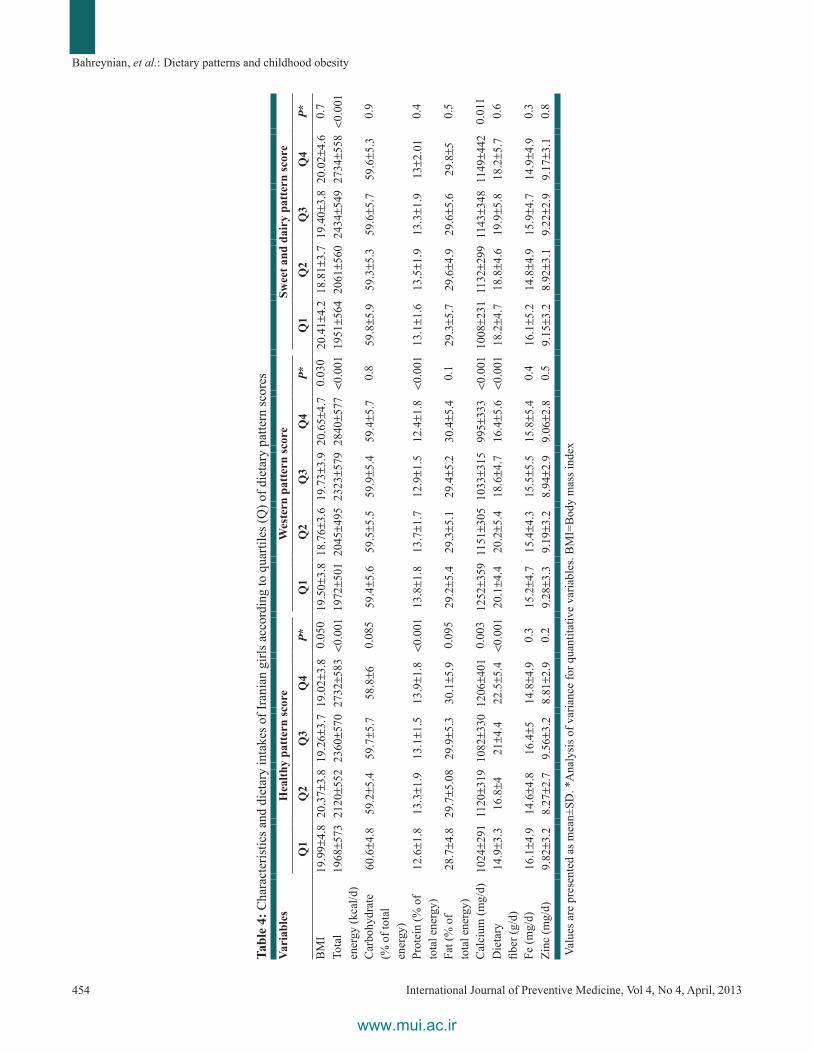
Healthy dietary pattern characterized mostly by fruits, different kinds of vegetables, low‑fat dairy products, fish and poultry, legumes and nuts. Western pattern was highly loaded for processed meat, pizza, snacks, soft drinks, mayonnaise, refined grains and the third pattern labeled as sweet and dairy with high amounts of dairy products, sugars, sweets and desserts. Factor loadings related to each dietary pattern are presented in Table 2. The mean age of students was 9.9 ± 1 year (girls) and 10.04 ± 0.9 year (boys). Main characteristics of the children according to quartiles of dietary pattern scores are shown in Tables 3 and 4 for girls and boys, separately. Using Pearson’s Chi‑square test, mother’s educational background was significantly associated with adherence to the healthy dietary pattern among boys and girls (P < 0.05). Increased length of sleep was related to adoption a healthy pattern for boys (P = 0.012). Greater period of time spent in front of a screen was associated to less healthy pattern among boys (P = 0.006) and girls (P = 0.035). Lower socio‑economic scores were correlated with lower adherence to healthy pattern among children (P = 0.003 for boys, P = 0.091 for girls, marginally significant). Boys who were short sleepers (less than 8 h/24 h) were more likely to adopt sweet‑dairy pattern (P = 0.075).
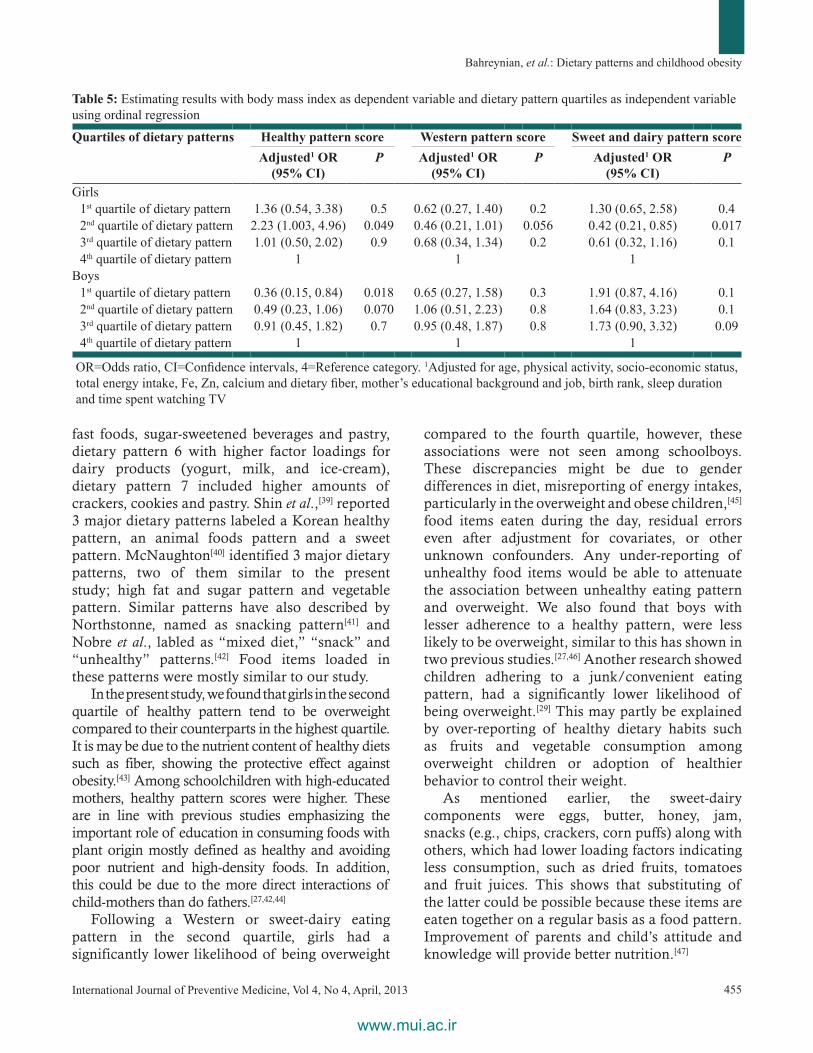
The results of ordinal logistic regression revealed that compared to girls in the highest quartile of healthy pattern, those in the second quartile
www.mui.ac.ir

Bahreynian, et al.: Dietary patterns and childhood obesity
International Journal of Preventive Medicine, Vol 4, No 4, April, 2013452
the second quartile of western dietary pattern had significantly lower BMI than those in the forth quartile (OR = 0.46, CI = 0.21, 1.01).
Accordingly, lower adherence to sweet and dairy pattern was associated with lower BMI among girls (OR = 0.42, CI = 0.21, 0.85). There was no significant relationship between western and sweet‑dairy pattern with BMI among boys, however, significant association was observed between first and fourth quartile of healthy pattern (OR = 0.36, CI = 0.15, 0.84), but the trend was not statistically significant (P for trend = 0.561) [Table 5].
DISCUSSIONWith principal component analysis, three major
dietary patterns were identified for the study participants. Among girls we found significant relationships between adherence to healthy pattern and BMI. Overweight girls were more likely to have a western or sweet‑dairy pattern. No significant association was found regarding western and sweet‑dairy patterns and weight status for schoolboys. Children adhering to a healthy pattern were more likely to have higher‑educated mothers.
Studying characteristics of overall diet results in the examination of the combined nutrients effects on health and better prediction of diet‑disease relationships.[37] To our knowledge, this is the first study to examine the associations of major dietary patterns with weight status in a large group of school‑children. The previous dietary pattern studies in Iran mainly have conducted on adults[20,21] and limited information is available about dietary patterns of children, considering overweight/obesity and lifestyle factors, however, there are few publications of Iranian adolescents group.[23,38]
Comparing dietary patterns between studies is somewhat difficult due to differences in dietary assessment and rotation methods, food groups used in the factor analyses, the number of patterns should be retained for analyses and the statistical techniques.[28]
Despite inconsistencies between the results derived from different studies, there are some similarities regarding dietary patterns identified among children. Moreira et al.,[26] explained 8 dietary factors with similar components to the present study, such as dietary pattern 1 contained plant foods, highly loaded for fruits, vegetables, legumes and olive oils, dietary pattern 4 included
Table 2: Factor-loading matrix with varimax rotation for major dietary patterns
Foods or food groups Healthy pattern
Western pattern
Sweet and dairy pattern
Fruits 0.57Fruit juices 0.35 0.23Cruciferous vegetables 0.57Dark-yellow vegetables
0.58
Tomatoes 0.43 0.21Green, leafy vegetables 0.65Other vegetables 0.66Legumes 0.41Garlic 0.37Potatoes 0.27Fish 0.40Poultry 0.24Olives 0.44Whole grains 0.22Nuts 0.34Dried fruits 0.43 0.23Low-fat dairy 0.20 0.44High-fat dairy 0.31Refined grains 0.43 0.31French fries 0.26Snacks 0.58 0.22Pizza 0.54Mayonnaise and other creamy salad dressings
0.38
Soft drinks 0.45Processed meats 0.59Red meat 0.21 0.29Organ meat 0.24Eggs 0.33Butter 0.43Margarine 0.20Sweets and desserts 0.62 0.21Condiments 0.51Sugars 0.28 0.60Pickles 0.42 0.30Hydrogenated fats 0.20BrothVegetable oils 0.38Yogurt drink 0.26 0.21Coffee 0.20Tea 0.38Salt 0.21
Values <0.20 are not presented in the table for simplicity
were more likely to have higher BMI (OR = 2.23, Confidence intervals [CI] =1.003, 4.96). Girls in
www.mui.ac.ir
Bahreynian, et al.: Dietary patterns and childhood obesity
453International Journal of Preventive Medicine, Vol 4, No 4, April, 2013
Tabl
e 3:
Cha
ract
eris
tics a
nd d
ieta
ry in
take
s of I
rani
an b
oys a
ccor
ding
to q
uarti
les (
Q) o
f die
tary
pat
tern
scor
esVa
riab
les
Hea
lthy
patt
ern
scor
eW
este
rn p
atte
rn sc
ore
Swee
t and
dai
ry p
atte
rn sc
ore
Q1
Q2
Q3
Q4
P*Q
1Q
2Q
3Q
4P*
Q1
Q2
Q3
Q4
P*B
MI
19.8
1±3.
920
.16±
3.8
20.7
6±3.
920
.30±
4.3
0.3
18.8
9±3.
720
.62±
4.2
20.2
8±3.
921
.24±
3.8
0.00
119
.95±
4.1
20.6
5±3.
820
.45±
3.6
19.9
7±4.
50.
9To
tal e
nerg
y (k
cal/d
)22
67±7
4524
97±5
8723
98±4
5529
25±5
61<0
.001
2083±6
2724
16±5
3725
37±4
5930
49±5
37<0
.001
1996±6
0024
49±4
9126
01±4
7430
38±5
29<0
.001
Car
bohy
drat
e (%
of t
otal
en
ergy
)
63.1
5±4.
960
.48±
4.8
61.0
8±4.
659
.92±
4.9
<0.0
0160
.79±
5.8
60.7
7±4.
661
.51±
4.8
61.5
5±4.
40.
261
.32±
5.3
61.1
0±4.
460
.63±
5.1
61.5
9±5
0.8
Prot
ein
(% o
f to
tal e
nerg
y)11
.91±
1.7
12.7
4±1.
613
.19±
1.5
13.1
8±1.
4<0
.001
13.4
4±1.
813
.37±
1.3
12.3
3±1.
511
.89±
1.4
<0.0
0112
.65±
1.6
12.7
6±1.
712
.69±
1.6
12.9
3±1.
60.
3
Fat (
% o
f to
tal e
nerg
y)26
.77±
4.6
28.8
7±4.
428
.14±
4.4
29.6
5±4.
80.
001
28.2
8±5.
328
.06±
4.6
28.4
6±4.
628
.63±
4.2
0.5
28.2
3±5.
128
.39±
4.2
29.0
7±4.
627
.74±
4.7
0.7
Cal
cium
(m
g/d)
1130±3
8912
43±3
6012
57±3
3913
75±3
69<0
.001
1415±3
9213
60±3
3711
70±3
0610
62±3
46<0
.001
1172±2
7011
90±3
2312
95±3
8913
49±4
600.
001
Die
tary
fib
er (g
/d)
16.3
2±4.
117
.59±
3.6
20.6
2±3.
423
.37±
5.1
<0.0
0121
.77±
4.6
19.8
2±4.
519
.36±
4.4
16.9
7±5
<0.0
0119
.19±
3.5
19.2
6±4.
619
.61±
5.6
19.8
5±5.
60.
3
Fe (m
g/d)
16.1
0±4.
916
.99±
4.1
16.6
0±4.
815
.03±
4.9
0.1
15.6
9±4.
616
.98±
4.9
16.7
1±4.
815
.35±
4.5
0.6
15.1
8±4.
716
.56±
4.5
16.6
5±5.
416
.34±
4.4
0.1
Zinc
(mg/
d)9.
98±3
.39.
70±2
.69.
14±3
.18.
36±3
.20.
001
9.30±3
.29.
40±3
.39.
39±2
.99.
09±3
.20.
68.
76±3
.19.
43±2
.89.
41±3
.39.
57±3
.20.
1
BM
I=B
ody
mas
s ind
ex. V
alue
s are
pre
sent
ed a
s mea
n±SD
. *A
naly
sis o
f var
ianc
e fo
r qua
ntita
tive
varia
bles
www.mui.ac.ir
Bahreynian, et al.: Dietary patterns and childhood obesity
International Journal of Preventive Medicine, Vol 4, No 4, April, 2013454
Tabl
e 4:
Cha
ract
eris
tics a
nd d
ieta
ry in
take
s of I
rani
an g
irls a
ccor
ding
to q
uarti
les (
Q) o
f die
tary
pat
tern
scor
esVa
riab
les
Hea
lthy
patt
ern
scor
eW
este
rn p
atte
rn sc
ore
Swee
t and
dai
ry p
atte
rn sc
ore
Q1
Q2
Q3
Q4
P*Q
1Q
2Q
3Q
4P*
Q1
Q2
Q3
Q4
P*B
MI
19.9
9±4.
820
.37±
3.8
19.2
6±3.
719
.02±
3.8
0.05
019
.50±
3.8
18.7
6±3.
619
.73±
3.9
20.6
5±4.
70.
030
20.4
1±4.
218
.81±
3.7
19.4
0±3.
820
.02±
4.6
0.7
Tota
l en
ergy
(kca
l/d)
1968±5
7321
20±5
5223
60±5
7027
32±5
83<0
.001
1972±5
0120
45±4
9523
23±5
7928
40±5
77<0
.001
1951±5
6420
61±5
6024
34±5
4927
34±5
58<0
.001
Car
bohy
drat
e (%
of t
otal
en
ergy
)
60.6±4
.859
.2±5
.459
.7±5
.758
.8±6
0.08
559
.4±5
.659
.5±5
.559
.9±5
.459
.4±5
.70.
859
.8±5
.959
.3±5
.359
.6±5
.759
.6±5
.30.
9
Prot
ein
(% o
f to
tal e
nerg
y)12
.6±1
.813
.3±1
.913
.1±1
.513
.9±1
.8<0
.001
13.8±1
.813
.7±1
.712
.9±1
.512
.4±1
.8<0
.001
13.1±1
.613
.5±1
.913
.3±1
.913±2
.01
0.4
Fat (
% o
f to
tal e
nerg
y)28
.7±4
.829
.7±5
.08
29.9±5
.330
.1±5
.90.
095
29.2±5
.429
.3±5
.129
.4±5
.230
.4±5
.40.
129
.3±5
.729
.6±4
.929
.6±5
.629
.8±5
0.5
Cal
cium
(mg/
d)10
24±2
9111
20±3
1910
82±3
3012
06±4
010.
003
1252±3
5911
51±3
0510
33±3
1599
5±33
3<0
.001
1008±2
3111
32±2
9911
43±3
4811
49±4
420.
011
Die
tary
fib
er (g
/d)
14.9±3
.316
.8±4
21±4
.422
.5±5
.4<0
.001
20.1±4
.420
.2±5
.418
.6±4
.716
.4±5
.6<0
.001
18.2±4
.718
.8±4
.619
.9±5
.818
.2±5
.70.
6
Fe (m
g/d)
16.1±4
.914
.6±4
.816
.4±5
14.8±4
.90.
315
.2±4
.715
.4±4
.315
.5±5
.515
.8±5
.40.
416
.1±5
.214
.8±4
.915
.9±4
.714
.9±4
.90.
3Zi
nc (m
g/d)
9.82±3
.28.
27±2
.79.
56±3
.28.
81±2
.90.
29.
28±3
.39.
19±3
.28.
94±2
.99.
06±2
.80.
59.
15±3
.28.
92±3
.19.
22±2
.99.
17±3
.10.
8
Valu
es a
re p
rese
nted
as m
ean±
SD. *
Ana
lysi
s of v
aria
nce
for q
uant
itativ
e va
riabl
es. B
MI=
Bod
y m
ass i
ndex
www.mui.ac.ir
Bahreynian, et al.: Dietary patterns and childhood obesity
455International Journal of Preventive Medicine, Vol 4, No 4, April, 2013
fast foods, sugar‑sweetened beverages and pastry, dietary pattern 6 with higher factor loadings for dairy products (yogurt, milk, and ice‑cream), dietary pattern 7 included higher amounts of crackers, cookies and pastry. Shin et al.,[39] reported 3 major dietary patterns labeled a Korean healthy pattern, an animal foods pattern and a sweet pattern. McNaughton[40] identified 3 major dietary patterns, two of them similar to the present study; high fat and sugar pattern and vegetable pattern. Similar patterns have also described by Northstonne, named as snacking pattern[41] and Nobre et al., labled as “mixed diet,” “snack” and “unhealthy” patterns.[42] Food items loaded in these patterns were mostly similar to our study.
In the present study, we found that girls in the second quartile of healthy pattern tend to be overweight compared to their counterparts in the highest quartile. It is may be due to the nutrient content of healthy diets such as fiber, showing the protective effect against obesity.[43] Among schoolchildren with high‑educated mothers, healthy pattern scores were higher. These are in line with previous studies emphasizing the important role of education in consuming foods with plant origin mostly defined as healthy and avoiding poor nutrient and high‑density foods. In addition, this could be due to the more direct interactions of child‑mothers than do fathers.[27,42,44]
Following a Western or sweet‑dairy eating pattern in the second quartile, girls had a significantly lower likelihood of being overweight
compared to the fourth quartile, however, these associations were not seen among schoolboys. These discrepancies might be due to gender differences in diet, misreporting of energy intakes, particularly in the overweight and obese children,[45] food items eaten during the day, residual errors even after adjustment for covariates, or other unknown confounders. Any under‑reporting of unhealthy food items would be able to attenuate the association between unhealthy eating pattern and overweight. We also found that boys with lesser adherence to a healthy pattern, were less likely to be overweight, similar to this has shown in two previous studies.[27,46] Another research showed children adhering to a junk/convenient eating pattern, had a significantly lower likelihood of being overweight.[29] This may partly be explained by over‑reporting of healthy dietary habits such as fruits and vegetable consumption among overweight children or adoption of healthier behavior to control their weight.
As mentioned earlier, the sweet‑dairy components were eggs, butter, honey, jam, snacks (e.g., chips, crackers, corn puffs) along with others, which had lower loading factors indicating less consumption, such as dried fruits, tomatoes and fruit juices. This shows that substituting of the latter could be possible because these items are eaten together on a regular basis as a food pattern. Improvement of parents and child’s attitude and knowledge will provide better nutrition.[47]
Table 5: Estimating results with body mass index as dependent variable and dietary pattern quartiles as independent variable using ordinal regression
Quartiles of dietary patterns Healthy pattern score Western pattern score Sweet and dairy pattern scoreAdjusted1 OR
(95% CI)P Adjusted1 OR
(95% CI)P Adjusted1 OR
(95% CI)P
Girls1st quartile of dietary pattern 1.36 (0.54, 3.38) 0.5 0.62 (0.27, 1.40) 0.2 1.30 (0.65, 2.58) 0.42nd quartile of dietary pattern 2.23 (1.003, 4.96) 0.049 0.46 (0.21, 1.01) 0.056 0.42 (0.21, 0.85) 0.0173rd quartile of dietary pattern 1.01 (0.50, 2.02) 0.9 0.68 (0.34, 1.34) 0.2 0.61 (0.32, 1.16) 0.14th quartile of dietary pattern 1 1 1
Boys1st quartile of dietary pattern 0.36 (0.15, 0.84) 0.018 0.65 (0.27, 1.58) 0.3 1.91 (0.87, 4.16) 0.12nd quartile of dietary pattern 0.49 (0.23, 1.06) 0.070 1.06 (0.51, 2.23) 0.8 1.64 (0.83, 3.23) 0.13rd quartile of dietary pattern 0.91 (0.45, 1.82) 0.7 0.95 (0.48, 1.87) 0.8 1.73 (0.90, 3.32) 0.094th quartile of dietary pattern 1 1 1
OR=Odds ratio, CI=Confidence intervals, 4=Reference category. 1Adjusted for age, physical activity, socio-economic status, total energy intake, Fe, Zn, calcium and dietary fiber, mother’s educational background and job, birth rank, sleep duration and time spent watching TV
www.mui.ac.ir
Bahreynian, et al.: Dietary patterns and childhood obesity
International Journal of Preventive Medicine, Vol 4, No 4, April, 2013456
There are some resemblance between our results and those reported from Korean children showing no associations for healthy and sweet patterns with overweight.[39] Several previous reports are in accordance with our findings; four longitudinal studies reported no significant association between milk pattern and BMI.[48] On the contrary, positive association was found between overweight/obesity and food patterns that included high amounts of milk among Portuguese children.[26] Therefore, evidence is inconclusive regarding dietary patterns and weight status of children.[49]
The nutrition transition besides rapid socio‑economic changes in Iran makes the opportunity to adopt a more westernized food patterns especially for children and adolescents who their preferences mostly are based on taste, palatability and the availability of fast foods.[15] Alongside, sedentary lifestyle habits related to adhering western dietary pattern were found among children. Time spent on sedentary activities such as watching TV, for more than the recommendations of the American Academy of Pediatrics[50] (up to 2 h/day) was related to higher scores of western dietary pattern. Previous studies are consistently in line with these relations. Salmon[51] and Story[52] concluded that increased TV viewing was associated with unhealthy eating pattern, including higher consumption of pizza, sodas and snack foods, supporting some other reports.[24,26,27,53]
Longer sleep duration was significantly associated with higher consumption of food from healthy pattern and inversely related to sweet‑dairy pattern among boys, consistent with the results of Portuguese schoolchildren[26] and children from Finland.[54] These findings are of particular interest since sleep deprivation, prevalence of overweight/obesity and increased appetite were correlated in children and adults.[26,55]
It is important to highlight this is the first report exploring the associations between dietary patterns, socio‑demographic characteristics, physical activity, sleeping and weight status, adjusting for confounders. However, the interpretation of these results needs to consider the following limitations. First, data driven by factor analysis depends on subjective or arbitrary decisions, for example, when grouping the food items or labeling of the factors.[56] Second, this method is data‑specific; therefore, generalization of our findings to children living in rural districts,
Iranian children, as a whole, or other populations is limited because of differences in dietary and lifestyle habits.
Third, nutritional intakes of children estimated via a semi‑quantitative FFQ might not represent their true intakes and may depend on recall bias and social desirability,[57] however, it is an appropriate instrument for ranking dietary intakes. Furthermore, misclassification of the children’s dietary intake, resulted from administration of the FFQ to the student’s mothers, might happened especially of foods eaten away from home. Thus according to Drewnouski,[58] these dietary data may consider as the mother’s dietary image rather than the absolute diet of the child. However, cognitive skills required to estimate and recall usual intakes, are a great challenge for elementary school children.[59] Furthermore, the etiology of overweight/obesity is complex, thus some unknown confounders might play a role in the study results. Conclusions about causal relations are not possible because the study was cross‑sectional in nature. Prospective studies are warranted to confirm these associations.
CONCLUSIONThe dietary patterns derived from the current
study based on a considerable number of children could provide practical information for health authorities designing nutritional interventions and overweight/obesity preventive strategies targeting children.
ACKNOWLEDGMENTSThe authors would like to thank the students and
their parents who participated in this study. Cooperation of school principals and teachers is greatly appreciated.
REFERENCES1. Karnik S, Kanekar A. Childhood obesity: A global public
health crisis. Int J Prev Med 2012;3:1-7.2. Kelishadi R, Ardalan G, Gheiratmand R, Majdzadeh R,
Hosseini M, Gouya MM, et al. Thinness, overweight and obesity in a national sample of Iranian children and adolescents: CASPIAN Study. Child Care Health Dev 2008;34:44-54.
3. Kelishadi R. Childhood overweight, obesity and the metabolic syndrome in developing countries. Epidemiol Rev 2007;29:62-76.
www.mui.ac.ir

Bahreynian, et al.: Dietary patterns and childhood obesity
457International Journal of Preventive Medicine, Vol 4, No 4, April, 2013
4. Venn AJ, Thomson RJ, Schmidt MD, Cleland VJ, Curry BA, Gennat HC, et al. Overweight and obesity from childhood to adulthood: A follow-up of participants in the 1985 Australian Schools Health and Fitness Survey. Med J Aust 2007;186:458-60.
5. Blair NJ, Thompson JM, Black PN, Becroft DM, Clark PM, Han DY, et al. Risk factors for obesity in 7-year-old European children: The Auckland birthweight collaborative study. Arch Dis Child 2007;92:866-71.
6. Kerr MA, Rennie KL, McCaffrey TA, Wallace JM, Hannon-Fletcher MP, Livingstone MB. Snacking patterns among adolescents: A comparison of type, frequency and portion size between Britain in 1997 and Northern Ireland in 2005. Br J Nutr 2009;101:122-31.
7. Kelishadi R, Heshmat R, Motlagh ME, Majdzadeh R, Keramatian K, Qorbani M, et al. Methodology and early findings of the third survey of caspian study: A national school‑based surveillance of students’ high risk behaviors. Int J Prev Med 2012;3:394-401.
8. Motlagh ME, Kelishadi R, Ziaoddini H, Mirmoghtadaee P, Poursafa P, Ardalan G, et al. Secular trends in the national prevalence of overweight and obesity during 2007-2009 in 6-year-old Iranian children. J Res Med Sci 2011;16:979-84.
9. Andrade H, Antonio N, Rodrigues D, DaSilva M, Pego M, Providencia LA. High blood pressure in the pediatric age group. Rev Port Cardiol 2010;29:413-32.
10. Weiss R, Caprio S. The metabolic consequences of childhood obesity. Best Pract Res Clin Endocrinol Metab 2005;19:405-19.
11. Dhuper S, Cohen HW, Daniel J, Gumidyala P, Agarwalla V, St Victor R, et al. Utility of the modified ATP III defined metabolic syndrome and severe obesity as predictors of insulin resistance in overweight children and adolescents: A cross-sectional study. Cardiovasc Diabetol 2007;6:4-16.
12. Vivian EM. Type 2 diabetes in children and adolescents: The next epidemic? Curr Med Res Opin 2006;22:297-306.
13. Swencionis C, Rendell SL. The psychology of obesity. Abdom Imaging 2012;37:733-7.
14. Choi HJ, Seo JS. Nutrient intakes and obesity-related factors of obese children and the effect of nutrition education program. Korean J Community Nutr 2003;8:477-84.
15. Ghassemi H, Harrison G, Mohammad K. An accelerated nutrition transition in Iran. Public Health Nutr 2002;5:149-55.
16. Popkin BM. The shift in stages of the nutrition transition in the developing world differs from past experiences! Public Health Nutr 2002;5:205-14.
17. Adair LS, Popkin BM. Are child eating patterns being transformed globally? Obes Res 2005;13:1281-99.
18. Nicklas TA, Morales M, Linares A, Yang SJ, Baranowski T,
De Moor C, et al. Children’s meal patterns have changed over a 21-year period: The Bogalusa Heart Study. J Am Diet Assoc 2004;104:753-61.
19. Tucker KL. Dietary patterns, approaches, and multicultural perspective. Appl Physiol Nutr Metab 2010;35:211-8.
20. Rezazadeh A, Rashidkhani B. The association of general and central obesity with major dietary patterns of adult women living in Tehran, Iran. J Nutr Sci Vitaminol (Tokyo) 2010;56:132-8.
21. Esmaillzadeh A, Azadbakht L. Major dietary patterns in relation to general obesity and central adiposity among Iranian women. J Nutr 2008;138:358-63.
22. Azadbakht L, Esmaillzadeh A. Dietary patterns and attention deficit hyperactivity disorder among Iranian children. Nutrition 2012;28:242-9.
23. Koochakpour G, Hosseini-Esfahani F, Bahadoran Z, Mirmiran P, Azizi F. Food patterns of tehranian adolescents and their relation to anthropometric measures and blood pressure: Tehran lipid and glucose Study. Iran J Endocrinol Metab 2012;14:1-9.
24. Knol LL, Haughton B, Fitzhugh EC. Dietary patterns of young, low-income US children. J Am Diet Assoc 2005;105:1765-73.
25. Magnusson MB, Hulthén L, Kjellgren KI. Obesity, dietary pattern and physical activity among children in a suburb with a high proportion of immigrants. J Hum Nutr Diet 2005;18:187-94.
26. Moreira P, Santos S, Padrão P, Cordeiro T, Bessa M, Valente H, et al . Food patterns according to sociodemographics, physical activity, sleeping and obesity in Portuguese children. Int J Environ Res Public Health 2010;7:1121-38.
27. Craig LC, McNeill G, Macdiarmid JI, Masson LF, Holmes BA. Dietary patterns of school-age children in Scotland: Association with socio-economic indicators, physical activity and obesity. Br J Nutr 2010;103:319-34.
28. Lioret S, Touvier M, Lafay L, Volatier JL, Maire B. Dietary and physical activity patterns in French children are related to overweight and socioeconomic status. J Nutr 2008;138:101-7.
29. Oellingrath IM, Svendsen MV, Brantsaeter AL. Eating patterns and overweight in 9-to 10-year-old children in Telemark County, Norway: A cross-sectional study. Eur J Clin Nutr 2010;64:1272-9.
30. Nicklas TA, Yang SJ, Baranowski T, Zakeri I, Berenson G. Eating patterns and obesity in children. The Bogalusa Heart Study. Am J Prev Med 2003;25:9-16.
31. Ghaffarpour M, Houshiar-Rad A, Kianfar H. The manual for household measures, cooking yields factors and edible portion of foods. Tehran, Iran: Keshavarzi Press; 1999. p. 1-46.
32. Hu FB, Rimm E, Smith-Warner SA, Feskanich D,
www.mui.ac.ir
Bahreynian, et al.: Dietary patterns and childhood obesity
International Journal of Preventive Medicine, Vol 4, No 4, April, 2013458
Stampfer MJ, Ascherio A, et al. Reproducibility and validity of dietary patterns assessed with a food-frequency questionnaire. Am J Clin Nutr 1999;69:243-9.
33. Davari M, Aslani A, Maracy MR, Bakhshizadeh Z. Evaluation of equity in access to pharmaceutical services in selected cities of Isfahan province, Isfahan, Borkhar, Meimeh, Tiran, Karvan, Natanz, Naeen, Khomeini Shahr, Fereidoon Shahr [dissertation]. School of pharm: Isfahan University of Medical Sciences; 2009. p. 36-8.
34. Faghihimani Z, Nourian M, Nikkar AM, Farajzadegan Z, Khavariyan N, Ghatrehsamani S, et al. Validation of the child and adolescent international physical activity questtionnaires in Iranian children and adolescents. ARYA Atheroscler J 2010;5:163-6.
35. Kim JO, Mueller CW. Factor analysis: Statistical methods and practical issues. Thousand Oaks (CA): Sage Publications; 1978.
36. De Vaus DA. Analyzing data. In: Surveys in Social Research. 4th ed. London, UK: UCL Press; 1996. p. 122-232.
37. Slattery ML. Analysis of dietary patterns in epidemiological research. Appl Physiol Nutr Metab 2010;35:207-10.
38. Alizadeh M, Mohtadinia J, Pourghasem-Gargari B, Esmaillzadeh A. Major dietary patterns among female adolescent girls of talaat intelligent guidance school, Tabriz, Iran. Iran Red Crescent Med J 2012;14:436-41.
39. Shin KO, Oh SY, Park HS. Empirically derived major dietary patterns and their associations with overweight in Korean preschool children. Br J Nutr 2007;98:416-21.
40. McNaughton SA, Ball K, Mishra GD, Crawford DA. Dietary patterns of adolescents and risk of obesity and hypertension. J Nutr 2008;138:364-70.
41. Northstone K, Emmett P. Multivariate analysis of diet in children at four and seven years of age and associations with socio-demographic characteristics. Eur J Clin Nutr 2005;59:751-60.
42. Nobre LN, Lamounier JA, Franceschini SC. Preschool children dietary patterns and associated factors. J Pediatr (Rio J) 2012;88:129-36.
43. Brauchla M, Juan W, Story J, Kranz S. Sources of dietary fiber and the association of fiber intake with childhood obesity risk (in 2-18 year olds) and diabetes risk of adolescents 12-18 year olds: NHANES 2003-2006. J Nutr Metab 2012;2012:736258.
44. McHale SM, Crouter AC, McGuire SA, Updegraff KA. Congruence between mothers’ and fathers’ differential treatment of siblings: Links with family relations and children’s well‑being. Child Dev 1995;66:116‑28.
45. Rennie KL, Jebb SA, Wright A, Coward WA. Secular trends in under-reporting in young people. Br J Nutr 2005;93:241-7.
46. Utter J, Scragg R, Ni Mhurchu C, Schaaf D. What
effect do attempts to lose weight have on the observed relationship between nutrition behaviors and body mass index among adolescents? Int J Behav Nutr Phys Act 2007;4:40-9.
47. Kelishadi R. The third national festival on health promotion by prevention and control of childhood obesity: Isfahan free of childhood obesity. Int J Prev Med 2010;1: 202-8.
48. Barić IC, Cvjetić S, Satalić Z. Dietary intakes among Croatian schoolchildren and adolescents. Nutr Health 2001;15:127-38.
49. Togo P, Osler M, Sørensen TI, Heitmann BL. Food intake patterns and body mass index in observational studies. Int J Obes Relat Metab Disord 2001;25:1741-51.
50. American academy of pediatrics. Committee on public education. American academy of pediatrics: Children, adolescents, and television. Pediatrics 2001;107:423-6.
51. Salmon J, Campbell KJ, Crawford DA. Television viewing habits associated with obesity risk factors: A survey of Melbourne schoolchildren. Med J Aust 2006;184:64-7.
52. Story M, Faulkner P. The prime time diet: A content analysis of eating behavior and food messages in television program content and commercials. Am J Public Health 1990;80:738-40.
53. Scully M, Dixon H, White V, Beckmann K. Dietary, physical activity and sedentary behaviour among Australian secondary students in 2005. Health Promot Int 2007;22:236-45.
54. Westerlund L, Ray C, Roos E. Associations between sleeping habits and food consumption patterns among 10-11-year-old children in Finland. Br J Nutr 2009;102:1531-7.
55. Spiegel K, Tasali E, Leproult R, Van Cauter E. Effects of poor and short sleep on glucose metabolism and obesity risk. Nat Rev Endocrinol 2009;5:253-61.
56. Martínez ME, Marshall JR, Sechrest L. Invited commentary: Factor analysis and the search for objectivity. Am J Epidemiol 1998;148:17-9.
57. Klesges LM, Baranowski T, Beech B, Cullen K, Murray DM, Rochon J, et al. Social desirability bias in self-reported dietary, physical activity and weight concerns measures in 8-to 10-year-old African-American girls: Results from the girls health enrichment multisite studies (GEMS). Prev Med 2004;38:S78-87.
58. Drewnowski A. Diet image: A new perspective on the food-frequency questionnaire. Nutr Rev 2001;59:370-2.
59. Livingstone MB, Robson PJ. Measurement of dietary intake in children. Proc Nutr Soc 2000;59:279-93.
Source of Support: Isfahan University of Medical Sciences, Conflict of Interest: None declared.
www.mui.ac.ir