Regional and socioeconomic variations in dietary patterns ...
14
RESEARCH Open Access Regional and socioeconomic variations in dietary patterns in a representative sample of young polish females: a cross-sectional study (GEBaHealth project) Jolanta Czarnocinska 1 , Lidia Wadolowska 2 , Marta Lonnie 2* , Joanna Kowalkowska 2 , Marzena Jezewska-Zychowicz 3 and Ewa Babicz-Zielinska 4 Abstract Background: Associations between dietary patterns (DPs) and socioeconomic correlates among adolescents from emerging economy countries are not fully understood. The study analysed variations in DPs adherence depending on country regions and family socioeconomic status (SES) among Polish females. Methods: Data from a representative sample (n = 1107) of Polish females 13–21-year-old was used. Four DPs were previously identified by principal component analysis. Regions were ranked by Gross Domestic Product. A SES index as an overall measure of family SES was developed. Multiple logistic regression models adjusted for age and body mass index were created. Results: Higher adherence to ‘Fast-food and sweets’ DP was found in the less affluent (North) region when compared to four other regions (Odds ratio (OR): 1.94 to 1.63). Higher adherence to ‘Fruit and vegetables’ DP was found in more affluent regions when compared to poorer regions: East and North-East (OR 1.71 to 1.81 and 1.69 to 2.23, respectively). Higher adherence to ‘Traditional Polish’ DP was found in 4 out of 5 regions (OR 2.02 to 2.53) when compared to the East. Higher family SES was associated with higher adherence to ‘Fruit and vegetables’ DP (OR 2.06) and lower adherence to ‘Traditional Polish’ DP (OR 0.27). Conclusions: The study revealed that region’s affluence is strongly reflected in dietary behaviours of young females from a transitioning country. Recognising geographical distribution of dietary patterns within the country and shifting the resources to economically disadvantaged regions might be more effective than current national public health interventions. Keywords: Country regions, Socioeconomic status, Dietary patterns, Family, Adolescents, Girls, Females © The Author(s). 2020 Open Access This article is licensed under a Creative Commons Attribution 4.0 International License, which permits use, sharing, adaptation, distribution and reproduction in any medium or format, as long as you give appropriate credit to the original author(s) and the source, provide a link to the Creative Commons licence, and indicate if changes were made. The images or other third party material in this article are included in the article's Creative Commons licence, unless indicated otherwise in a credit line to the material. If material is not included in the article's Creative Commons licence and your intended use is not permitted by statutory regulation or exceeds the permitted use, you will need to obtain permission directly from the copyright holder. To view a copy of this licence, visit http://creativecommons.org/licenses/by/4.0/. The Creative Commons Public Domain Dedication waiver (http://creativecommons.org/publicdomain/zero/1.0/) applies to the data made available in this article, unless otherwise stated in a credit line to the data. * Correspondence: [email protected] 2 Department of Human Nutrition, University of Warmia and Mazury in Olsztyn, Pl. Cieszynski 1, 10-718 Olsztyn, Poland Full list of author information is available at the end of the article Czarnocinska et al. Nutrition Journal (2020) 19:26 https://doi.org/10.1186/s12937-020-00546-8
Transcript of Regional and socioeconomic variations in dietary patterns ...
RESEARCH Open Access
Regional and socioeconomic variations indietary patterns in a representative sampleof young polish females: a cross-sectionalstudy (GEBaHealth project)Jolanta Czarnocinska1 , Lidia Wadolowska2 , Marta Lonnie2* , Joanna Kowalkowska2 ,Marzena Jezewska-Zychowicz3 and Ewa Babicz-Zielinska4
Abstract
Background: Associations between dietary patterns (DPs) and socioeconomic correlates among adolescents fromemerging economy countries are not fully understood. The study analysed variations in DPs adherence dependingon country regions and family socioeconomic status (SES) among Polish females.
Methods: Data from a representative sample (n = 1107) of Polish females 13–21-year-old was used. Four DPs werepreviously identified by principal component analysis. Regions were ranked by Gross Domestic Product. A SES indexas an overall measure of family SES was developed. Multiple logistic regression models adjusted for age and bodymass index were created.
Results: Higher adherence to ‘Fast-food and sweets’ DP was found in the less affluent (North) region whencompared to four other regions (Odds ratio (OR): 1.94 to 1.63). Higher adherence to ‘Fruit and vegetables’ DP wasfound in more affluent regions when compared to poorer regions: East and North-East (OR 1.71 to 1.81 and 1.69 to2.23, respectively). Higher adherence to ‘Traditional Polish’ DP was found in 4 out of 5 regions (OR 2.02 to 2.53)when compared to the East. Higher family SES was associated with higher adherence to ‘Fruit and vegetables’ DP(OR 2.06) and lower adherence to ‘Traditional Polish’ DP (OR 0.27).
Conclusions: The study revealed that region’s affluence is strongly reflected in dietary behaviours of young femalesfrom a transitioning country. Recognising geographical distribution of dietary patterns within the country andshifting the resources to economically disadvantaged regions might be more effective than current national publichealth interventions.
Keywords: Country regions, Socioeconomic status, Dietary patterns, Family, Adolescents, Girls, Females
© The Author(s). 2020 Open Access This article is licensed under a Creative Commons Attribution 4.0 International License,which permits use, sharing, adaptation, distribution and reproduction in any medium or format, as long as you giveappropriate credit to the original author(s) and the source, provide a link to the Creative Commons licence, and indicate ifchanges were made. The images or other third party material in this article are included in the article's Creative Commonslicence, unless indicated otherwise in a credit line to the material. If material is not included in the article's Creative Commonslicence and your intended use is not permitted by statutory regulation or exceeds the permitted use, you will need to obtainpermission directly from the copyright holder. To view a copy of this licence, visit http://creativecommons.org/licenses/by/4.0/.The Creative Commons Public Domain Dedication waiver (http://creativecommons.org/publicdomain/zero/1.0/) applies to thedata made available in this article, unless otherwise stated in a credit line to the data.
* Correspondence: [email protected] of Human Nutrition, University of Warmia and Mazury inOlsztyn, Pl. Cieszynski 1, 10-718 Olsztyn, PolandFull list of author information is available at the end of the article
Czarnocinska et al. Nutrition Journal (2020) 19:26 https://doi.org/10.1186/s12937-020-00546-8
IntroductionDietary patterns (DPs) are defined as the quantities, pro-portions, variety, or combination of different foods anddrinks in diets, and the frequency with which they arehabitually consumed [1]. Some DPs identified across theworld can be classified as universal, such as “Western”and “Prudent” patterns, as two polar opposites repre-senting unhealthy and healthy diet [2–5]. Other com-monly occurring DPs worldwide, are often labelled as“Traditional”, being specific to the country in which theinvestigation is being carried [6]. For instance, “Trad-itional Polish” dietary pattern is usually composed of po-tatoes, meats, vegetables, cheese, animal fats and sugar[7]. Over the past 30 years, Poland has experienced im-mense political and cultural changes, transitioning froma socialist to a capitalist economic system. This wasreflected in recently reported results in younger popula-tions, where a gradual westernisation of traditional pat-terns has been observed. The hybrid “Westernised-traditional” [8] or “Westernised-Polish” [9] patterns, inaddition to traditional components, tend to be recentlycomplemented by sweets, carbonated beverages, Frenchfries and snacks.Dietary behaviours can be influenced by various so-
cioeconomic, cultural, demographic and lifestyle fac-tors [9–11]. Socioeconomic status is one of thestrongest determinants of health behaviours in bothsexes and all age groups [12]. In general, higher so-cioeconomic status is associated with healthier eatingchoices, particularly more frequent consumption offruit and vegetables [12–15]. Interestingly, these asso-ciations are stronger in higher income countries,when compared to middle- and lower-income coun-tries [16]. Mayén et al. [13] observed that in lower-middle income countries individuals with higher SESmay present mixed dietary behaviours, e.g. havehigher adherence to a healthier dietary pattern butalso higher energy, cholesterol, and saturated fat in-takes. Similar observation was reported in a sample ofBrazilian adolescent and young adults (aged 10–39)[17]. A higher adherence to the “ultra-processed food”dietary pattern was positively associated with educa-tion and income level [17]. The phenomenon of thesedietary disparities, based on the country income, andsocioeconomic status still seek a clear explanationand require further investigation.To date most studies have focused on analysing socio-
economic associations with dietary behaviours using oneof two approaches: 1) geographical - by analysing globalor local differences in dietary patterns based on thecountry or area income, e.g. low-income vs. high-incomecountries [5] or urban vs. rural areas [13, 18, 19] or 2)by analysing individual-level socioeconomic status (edu-cation, income, place of residence) and its associations
with dietary behaviours in various populations [13, 20,21]. Some studies compared the two approaches [20,21], with results suggesting that individual’s socio-economic status may have a stronger effect on diet thanthe socio-economic characteristics of the living area[21]. We have concluded that it would be interesting toutilise these two approaches and investigate the link withdietary patterns in a representative sample of girls andyoung women. Only a few studies have investigated thewithin-country, geographical diversification in DPs char-acteristics in nationally representative samples [22, 23].Moreover, to our knowledge, no previous studies havepresented results specific to the population of adolescentgirls and young women. We hypothesised that the un-equal distribution of income in Polish families and theaffluence of country regions may be reflected in dietarybehaviours of girls and young women.Poland is classified as an upper-middle income coun-
try, with distinct economic inequalities observed be-tween the regions [14]. The Eastern, Northern andNorth-Western are the most disadvantaged regions withthe lowest average monthly gross wages. At the sametime, these regions have the highest unemployment ratesand the highest monthly percentage of income spent onfood (29%), when compared to the most affluent – Cen-tral – region (22%) (Supplementary table, S1) [24]. Simi-larly to other countries, life expectancy is higher forPolish women than men [25]. However, it has been re-ported that a higher percentage of Polish adolescent girlsand young women experience health problems in com-parison to boys and young men of the same age. For ex-ample, in the age group of 15–29 years old, significantlymore females suffer from chronic diseases than males(31.0% vs. 22.6%, respectively) [26]. The national dataalso revealed that health disparities are observed be-tween the regions, although linear trends with the in-creasing Gross Domestic Product (GDP) cannot beobserved (Supplementary table, S1) [24–26]. Surpris-ingly, the highest self-reported health status and the low-est prevalence of chronic diseases, smoking and alcoholconsumption have been reported in adolescent girls andyoung women (15–29 years old) from the Eastern region(poorest) (Supplementary table, S1) [26]. The regionalmapping of dietary patterns has not been previouslyinvestigated.We believe that the current study can close this
remaining evidence gap. The knowledge gained from theproposed dietary mapping strategy could be used bylocal authorities to plan targeted interventions and dis-tribute funds more efficiently, by allocating the resourcesto the regions and/or families at need. It can also serveas guidance to other transitioning countries on how toidentify nutritional problems and map the areas at high-est risk. This study aimed to analyse differences in DPs
Czarnocinska et al. Nutrition Journal (2020) 19:26 Page 2 of 14
adherence related to country regions and family socio-economic status (SES) among young Polish females.
MethodsEthical approvalThe study was approved by the Bioethics Committee ofthe Faculty of Medical Sciences, University of Warmiaand Mazury in Olsztyn on June 17, 2010, Resolution No.20/2010. Informed consent was obtained from adultstudy participants and from parents/legal guardians ofunderage girls (< 18 years old). Respecting young partici-pants emerging maturity and independence, each personunder 18 years old was involved in the discussions aboutthe research and their verbal assent to participation wasobtained. A written assent was not required due to theresearch posing less than minimal risk.
Study designA cross-sectional study was performed using data from arepresentative sample of Polish females 13–21-year-oldenrolled for the Girls Eating Behaviours and HealthStudy (GEBaHealth) [27, 28]. Data has been collected in2012 by the interviewers of the Public Opinion ResearchCentre (CBOS, Warsaw, Poland) at the request of the re-search team, as a part of the multi-centre scientific pro-ject. To collect data, a computer-assisted personalinterviewing (CAPI) technique, instead of a printed ver-sion of a questionnaire, was applied. For questions withmany optional responses, the interview has been sup-ported with so-called ‘show cards’ containing responsesto choose from. The interviewers were trained in dietarydata collection; first – leaders have been trained by anexperienced researcher, then leaders trained other inter-viewers from their team. Self-declared data regarding so-cioeconomic status, dietary habits, and also weight andheight were collected [27, 28].
ParticipantsThe inclusion criteria were female gender, age (born be-tween 1991 and 1999) and place of residence (Poland).Extensive details of recruitment and sample size estima-tion have been previously reported [27, 28]. Briefly,based on a pilot study we calculated that 1000 partici-pants would be a sufficient number of participants forour study. Expecting a 50% non-response rate and takinginto account potential missing data, a total of 2104 fe-males from the Universal Electronic System of Popula-tion Register (PESEL) were randomly selected to contactthem. The response rate was 52.6%. To ensure the sam-ple is representative for the Polish population three-phase random sampling was used. The sample wasstratified by age, place of residence and region [25].Sample weights were calculated to account for non-response (997 respondents). Finally, 1107 participants
aged 13–21 years take part in the study. Flow chart ofsample collection is presented in the supplementary ma-terial Fig. (S1).
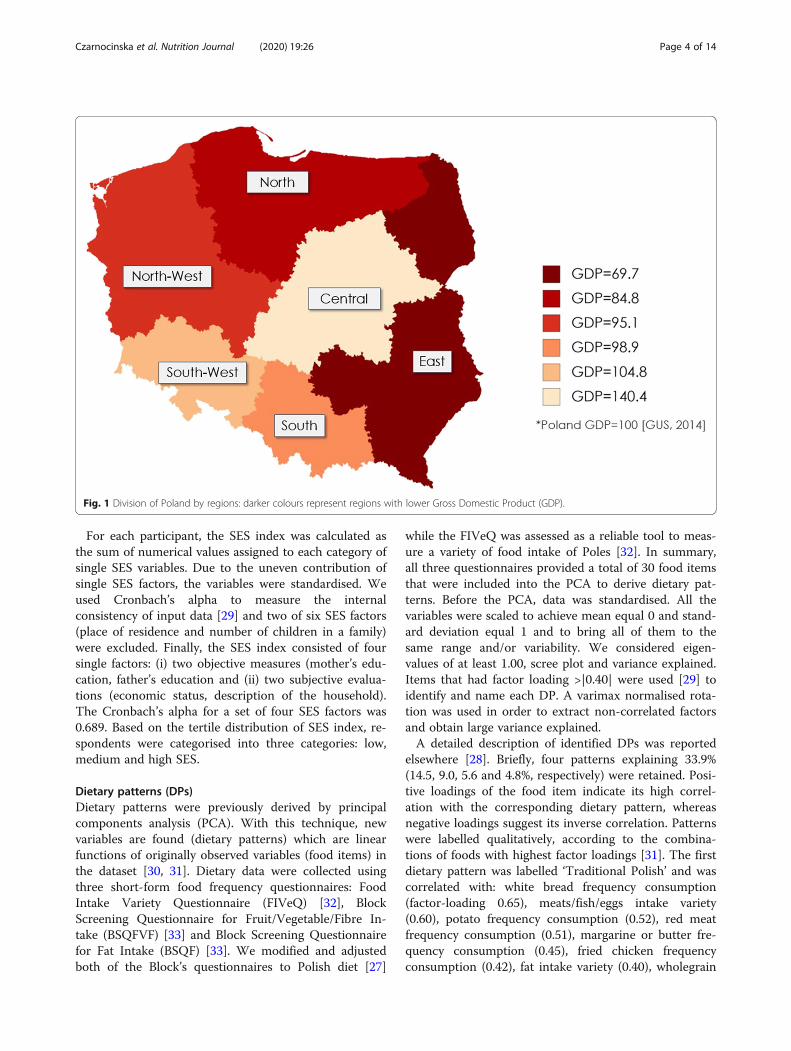
Country regionsIn line with the Polish database of Central Statistical Of-fice, six regions of the Poland territory were considered.Regions were ranked by Gross Domestic Product (GDP)from less to more wealthy (Poland GDP = 100) as fol-lows: East GDP = 69.7, North GDP = 84.8, North-WestGDP = 95.1, South GDP = 98.8, South-West GDP =104.8, Central GDP = 140.4 (Fig. 1) [24]. More data re-lated to the economic characteristics of the regions arepresented in the supplementary material (Table S1).
Family socioeconomic status (SES)To measure a family SES, we developed previously a SESindex as an overall measure [27, 28]. While collectingsocioeconomic data, we considered six single factorsreflecting both objective and subjective SES measures:mother’s education, father’s education, economic status,description of household, place of residence and numberof children (< 18 years old) in a family. All factors hadresponse categories with numerical values (points)assigned as follows:
� mother’s education – three responses to choosefrom: primary/lower secondary (1 point), uppersecondary (2 points), higher (3 points);
� father’s education – three responses to choose from:primary/lower secondary (1 point), upper secondary(2 points), higher (3 points);
� economic status – three responses to choose from:below average (1 point), average (2 points), aboveaverage (3 points);
� description of the household overall situation – fiveresponses (all with detailed explanation) to choosefrom: we live poorly – we do not have enoughmoney for basic needs (1 point), we live modestly –we have to be very careful with our daily budget (2points), we live relatively thriftily – we have enoughmoney for our daily needs, but we need to budgetfor bigger purchases (3 points), we live well – wehave enough money for our needs without particularbudgeting (4 points), we live very well – we canafford some luxury (5 points);
� place of residence – three responses to choose from:village (1 point), town (2 points), city (≥100,000inhabitants; 3 points);
� number of children (< 18 years old) in a family –respondents reported the number of minors in theirfamily, and four categories were established: 6 ormore children (1 point), 4–5 children (2 points), 2–3 children (3 points), 1 child (4 points).
Czarnocinska et al. Nutrition Journal (2020) 19:26 Page 3 of 14
For each participant, the SES index was calculated asthe sum of numerical values assigned to each category ofsingle SES variables. Due to the uneven contribution ofsingle SES factors, the variables were standardised. Weused Cronbach’s alpha to measure the internalconsistency of input data [29] and two of six SES factors(place of residence and number of children in a family)were excluded. Finally, the SES index consisted of foursingle factors: (i) two objective measures (mother’s edu-cation, father’s education and (ii) two subjective evalua-tions (economic status, description of the household).The Cronbach’s alpha for a set of four SES factors was0.689. Based on the tertile distribution of SES index, re-spondents were categorised into three categories: low,medium and high SES.
Dietary patterns (DPs)Dietary patterns were previously derived by principalcomponents analysis (PCA). With this technique, newvariables are found (dietary patterns) which are linearfunctions of originally observed variables (food items) inthe dataset [30, 31]. Dietary data were collected usingthree short-form food frequency questionnaires: FoodIntake Variety Questionnaire (FIVeQ) [32], BlockScreening Questionnaire for Fruit/Vegetable/Fibre In-take (BSQFVF) [33] and Block Screening Questionnairefor Fat Intake (BSQF) [33]. We modified and adjustedboth of the Block’s questionnaires to Polish diet [27]
while the FIVeQ was assessed as a reliable tool to meas-ure a variety of food intake of Poles [32]. In summary,all three questionnaires provided a total of 30 food itemsthat were included into the PCA to derive dietary pat-terns. Before the PCA, data was standardised. All thevariables were scaled to achieve mean equal 0 and stand-ard deviation equal 1 and to bring all of them to thesame range and/or variability. We considered eigen-values of at least 1.00, scree plot and variance explained.Items that had factor loading >|0.40| were used [29] toidentify and name each DP. A varimax normalised rota-tion was used in order to extract non-correlated factorsand obtain large variance explained.A detailed description of identified DPs was reported
elsewhere [28]. Briefly, four patterns explaining 33.9%(14.5, 9.0, 5.6 and 4.8%, respectively) were retained. Posi-tive loadings of the food item indicate its high correl-ation with the corresponding dietary pattern, whereasnegative loadings suggest its inverse correlation. Patternswere labelled qualitatively, according to the combina-tions of foods with highest factor loadings [31]. The firstdietary pattern was labelled ‘Traditional Polish’ and wascorrelated with: white bread frequency consumption(factor-loading 0.65), meats/fish/eggs intake variety(0.60), potato frequency consumption (0.52), red meatfrequency consumption (0.51), margarine or butter fre-quency consumption (0.45), fried chicken frequencyconsumption (0.42), fat intake variety (0.40), wholegrain
Fig. 1 Division of Poland by regions: darker colours represent regions with lower Gross Domestic Product (GDP).
Czarnocinska et al. Nutrition Journal (2020) 19:26 Page 4 of 14
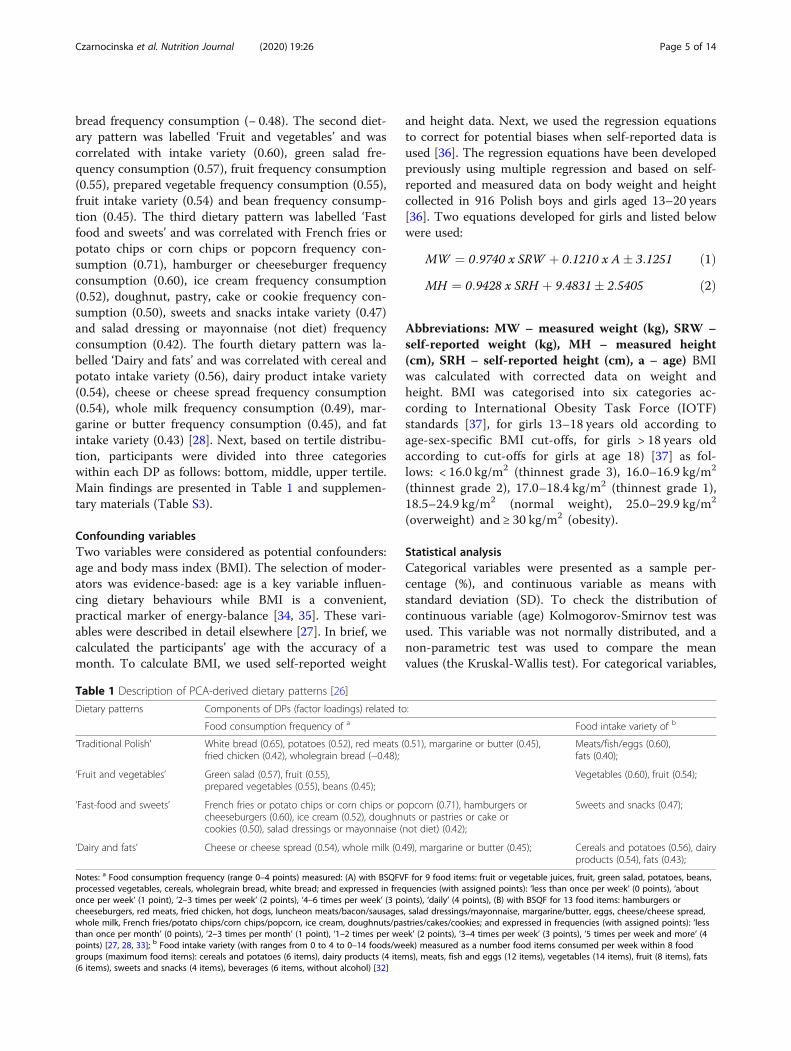
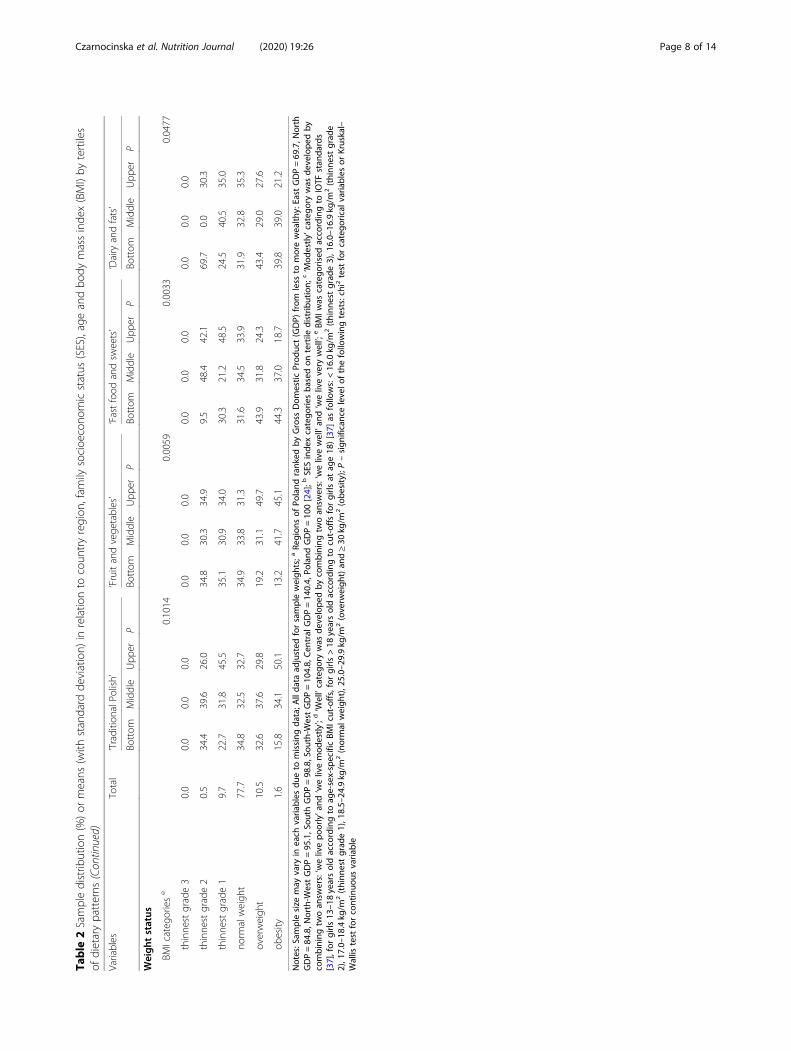
bread frequency consumption (− 0.48). The second diet-ary pattern was labelled ‘Fruit and vegetables’ and wascorrelated with intake variety (0.60), green salad fre-quency consumption (0.57), fruit frequency consumption(0.55), prepared vegetable frequency consumption (0.55),fruit intake variety (0.54) and bean frequency consump-tion (0.45). The third dietary pattern was labelled ‘Fastfood and sweets’ and was correlated with French fries orpotato chips or corn chips or popcorn frequency con-sumption (0.71), hamburger or cheeseburger frequencyconsumption (0.60), ice cream frequency consumption(0.52), doughnut, pastry, cake or cookie frequency con-sumption (0.50), sweets and snacks intake variety (0.47)and salad dressing or mayonnaise (not diet) frequencyconsumption (0.42). The fourth dietary pattern was la-belled ‘Dairy and fats’ and was correlated with cereal andpotato intake variety (0.56), dairy product intake variety(0.54), cheese or cheese spread frequency consumption(0.54), whole milk frequency consumption (0.49), mar-garine or butter frequency consumption (0.45), and fatintake variety (0.43) [28]. Next, based on tertile distribu-tion, participants were divided into three categorieswithin each DP as follows: bottom, middle, upper tertile.Main findings are presented in Table 1 and supplemen-tary materials (Table S3).
Confounding variablesTwo variables were considered as potential confounders:age and body mass index (BMI). The selection of moder-ators was evidence-based: age is a key variable influen-cing dietary behaviours while BMI is a convenient,practical marker of energy-balance [34, 35]. These vari-ables were described in detail elsewhere [27]. In brief, wecalculated the participants’ age with the accuracy of amonth. To calculate BMI, we used self-reported weight
and height data. Next, we used the regression equationsto correct for potential biases when self-reported data isused [36]. The regression equations have been developedpreviously using multiple regression and based on self-reported and measured data on body weight and heightcollected in 916 Polish boys and girls aged 13–20 years[36]. Two equations developed for girls and listed belowwere used:
MW ¼ 0:9740 x SRW þ 0:1210 x A� 3:1251 ð1ÞMH ¼ 0:9428 x SRH þ 9:4831� 2:5405 ð2Þ
Abbreviations: MW – measured weight (kg), SRW –self-reported weight (kg), MH – measured height(cm), SRH – self-reported height (cm), a – age) BMIwas calculated with corrected data on weight andheight. BMI was categorised into six categories ac-cording to International Obesity Task Force (IOTF)standards [37], for girls 13–18 years old according toage-sex-specific BMI cut-offs, for girls > 18 years oldaccording to cut-offs for girls at age 18) [37] as fol-lows: < 16.0 kg/m2 (thinnest grade 3), 16.0–16.9 kg/m2
(thinnest grade 2), 17.0–18.4 kg/m2 (thinnest grade 1),18.5–24.9 kg/m2 (normal weight), 25.0–29.9 kg/m2
(overweight) and ≥ 30 kg/m2 (obesity).
Statistical analysisCategorical variables were presented as a sample per-centage (%), and continuous variable as means withstandard deviation (SD). To check the distribution ofcontinuous variable (age) Kolmogorov-Smirnov test wasused. This variable was not normally distributed, and anon-parametric test was used to compare the meanvalues (the Kruskal-Wallis test). For categorical variables,
Table 1 Description of PCA-derived dietary patterns [26]
Dietary patterns Components of DPs (factor loadings) related to:
Food consumption frequency of a Food intake variety of b
‘Traditional Polish’ White bread (0.65), potatoes (0.52), red meats (0.51), margarine or butter (0.45),fried chicken (0.42), wholegrain bread (−0.48);
Meats/fish/eggs (0.60),fats (0.40);
‘Fruit and vegetables’ Green salad (0.57), fruit (0.55),prepared vegetables (0.55), beans (0.45);
Vegetables (0.60), fruit (0.54);
‘Fast-food and sweets’ French fries or potato chips or corn chips or popcorn (0.71), hamburgers orcheeseburgers (0.60), ice cream (0.52), doughnuts or pastries or cake orcookies (0.50), salad dressings or mayonnaise (not diet) (0.42);
Sweets and snacks (0.47);
‘Dairy and fats’ Cheese or cheese spread (0.54), whole milk (0.49), margarine or butter (0.45); Cereals and potatoes (0.56), dairyproducts (0.54), fats (0.43);
Notes: a Food consumption frequency (range 0–4 points) measured: (A) with BSQFVF for 9 food items: fruit or vegetable juices, fruit, green salad, potatoes, beans,processed vegetables, cereals, wholegrain bread, white bread; and expressed in frequencies (with assigned points): ‘less than once per week’ (0 points), ‘aboutonce per week’ (1 point), ‘2–3 times per week’ (2 points), ‘4–6 times per week’ (3 points), ‘daily’ (4 points), (B) with BSQF for 13 food items: hamburgers orcheeseburgers, red meats, fried chicken, hot dogs, luncheon meats/bacon/sausages, salad dressings/mayonnaise, margarine/butter, eggs, cheese/cheese spread,whole milk, French fries/potato chips/corn chips/popcorn, ice cream, doughnuts/pastries/cakes/cookies; and expressed in frequencies (with assigned points): ‘lessthan once per month’ (0 points), ‘2–3 times per month’ (1 point), ‘1–2 times per week’ (2 points), ‘3–4 times per week’ (3 points), ‘5 times per week and more’ (4points) [27, 28, 33]; b Food intake variety (with ranges from 0 to 4 to 0–14 foods/week) measured as a number food items consumed per week within 8 foodgroups (maximum food items): cereals and potatoes (6 items), dairy products (4 items), meats, fish and eggs (12 items), vegetables (14 items), fruit (8 items), fats(6 items), sweets and snacks (4 items), beverages (6 items, without alcohol) [32]
Czarnocinska et al. Nutrition Journal (2020) 19:26 Page 5 of 14
the differences between groups were verified by chi2 test.All data were adjusted for sample weights to maintainthe representativeness. To verify the associations be-tween DPs and variables under study, logistic regressionanalysis was used. The categorical variables with at leastthree categories were recoded into separate binary vari-ables (dummy coding). Then, the odds ratios (ORs) and95%CIs were calculated. Wald’s statistics were used toassess the significance of ORs. Subjects from the bottomtertiles of each DP were used as a reference group (OR =1.00). Two models were created: crude and adjusted forage (a continuous variable) and age-sex-specific BMI (acategorical variable) as they were independentlyassociated with the dietary patterns (Table 2). For alltests p-value < 0.05 was considered as significant. Statis-tical analyses were carried out using STATISTICA soft-ware (version 10.0 PL; StatSoft Inc., USA, Tulsa; StatSoftPolska, Krakow).
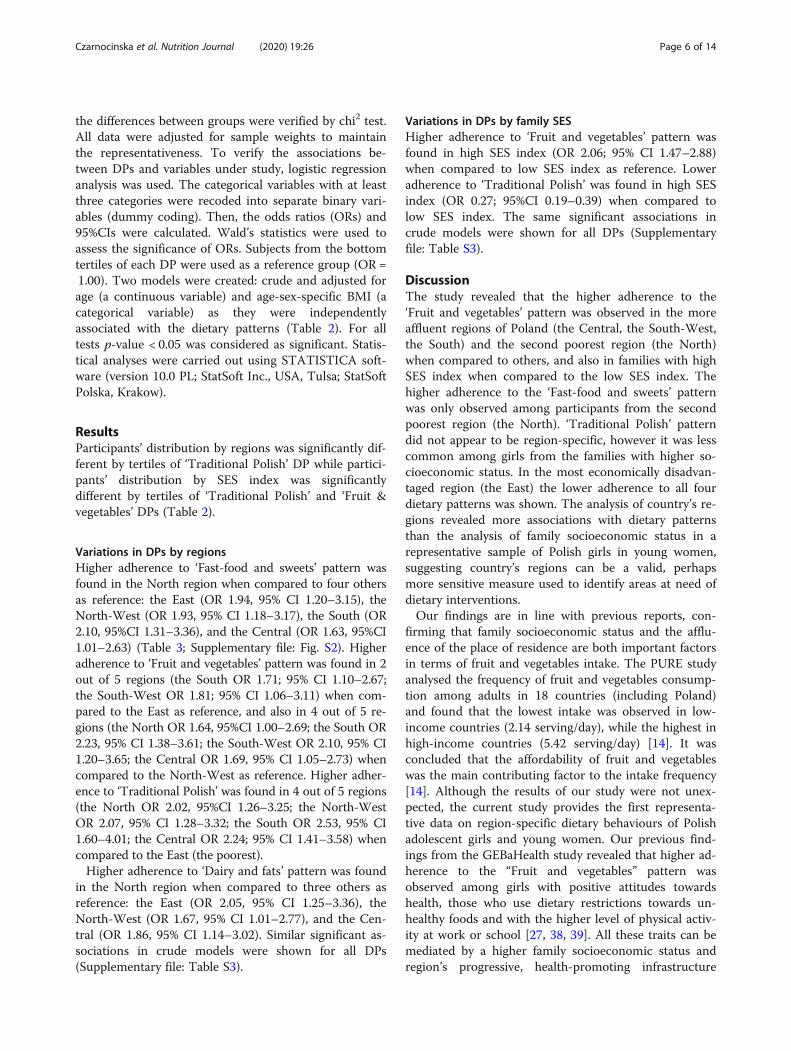
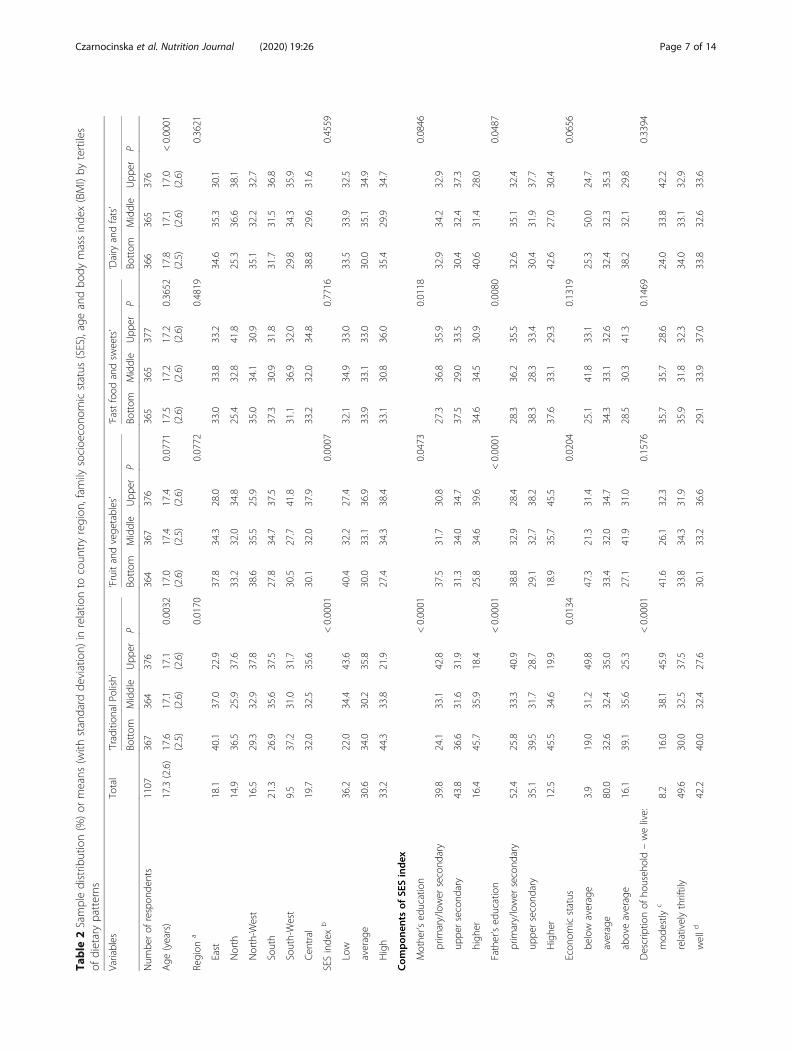
ResultsParticipants’ distribution by regions was significantly dif-ferent by tertiles of ‘Traditional Polish’ DP while partici-pants’ distribution by SES index was significantlydifferent by tertiles of ‘Traditional Polish’ and ‘Fruit &vegetables’ DPs (Table 2).
Variations in DPs by regionsHigher adherence to ‘Fast-food and sweets’ pattern wasfound in the North region when compared to four othersas reference: the East (OR 1.94, 95% CI 1.20–3.15), theNorth-West (OR 1.93, 95% CI 1.18–3.17), the South (OR2.10, 95%CI 1.31–3.36), and the Central (OR 1.63, 95%CI1.01–2.63) (Table 3; Supplementary file: Fig. S2). Higheradherence to ‘Fruit and vegetables’ pattern was found in 2out of 5 regions (the South OR 1.71; 95% CI 1.10–2.67;the South-West OR 1.81; 95% CI 1.06–3.11) when com-pared to the East as reference, and also in 4 out of 5 re-gions (the North OR 1.64, 95%CI 1.00–2.69; the South OR2.23, 95% CI 1.38–3.61; the South-West OR 2.10, 95% CI1.20–3.65; the Central OR 1.69, 95% CI 1.05–2.73) whencompared to the North-West as reference. Higher adher-ence to ‘Traditional Polish’ was found in 4 out of 5 regions(the North OR 2.02, 95%CI 1.26–3.25; the North-WestOR 2.07, 95% CI 1.28–3.32; the South OR 2.53, 95% CI1.60–4.01; the Central OR 2.24; 95% CI 1.41–3.58) whencompared to the East (the poorest).Higher adherence to ‘Dairy and fats’ pattern was found
in the North region when compared to three others asreference: the East (OR 2.05, 95% CI 1.25–3.36), theNorth-West (OR 1.67, 95% CI 1.01–2.77), and the Cen-tral (OR 1.86, 95% CI 1.14–3.02). Similar significant as-sociations in crude models were shown for all DPs(Supplementary file: Table S3).
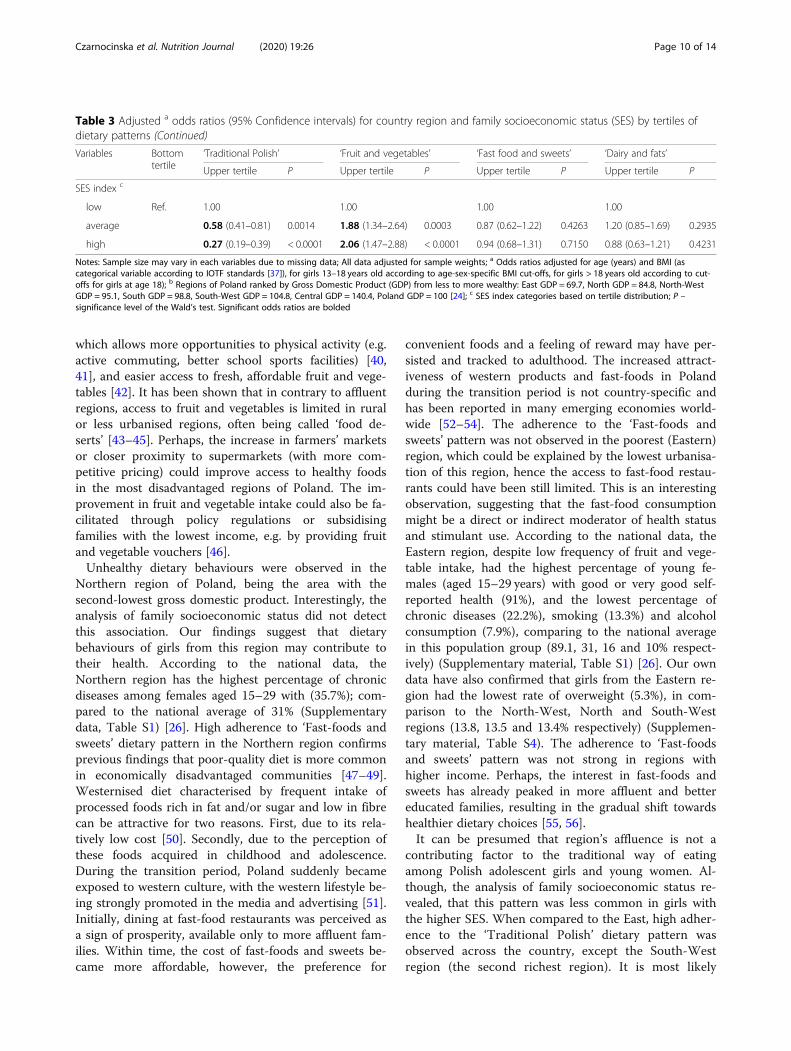
Variations in DPs by family SESHigher adherence to ‘Fruit and vegetables’ pattern wasfound in high SES index (OR 2.06; 95% CI 1.47–2.88)when compared to low SES index as reference. Loweradherence to ‘Traditional Polish’ was found in high SESindex (OR 0.27; 95%CI 0.19–0.39) when compared tolow SES index. The same significant associations incrude models were shown for all DPs (Supplementaryfile: Table S3).
DiscussionThe study revealed that the higher adherence to the‘Fruit and vegetables’ pattern was observed in the moreaffluent regions of Poland (the Central, the South-West,the South) and the second poorest region (the North)when compared to others, and also in families with highSES index when compared to the low SES index. Thehigher adherence to the ‘Fast-food and sweets’ patternwas only observed among participants from the secondpoorest region (the North). ‘Traditional Polish’ patterndid not appear to be region-specific, however it was lesscommon among girls from the families with higher so-cioeconomic status. In the most economically disadvan-taged region (the East) the lower adherence to all fourdietary patterns was shown. The analysis of country’s re-gions revealed more associations with dietary patternsthan the analysis of family socioeconomic status in arepresentative sample of Polish girls in young women,suggesting country’s regions can be a valid, perhapsmore sensitive measure used to identify areas at need ofdietary interventions.Our findings are in line with previous reports, con-
firming that family socioeconomic status and the afflu-ence of the place of residence are both important factorsin terms of fruit and vegetables intake. The PURE studyanalysed the frequency of fruit and vegetables consump-tion among adults in 18 countries (including Poland)and found that the lowest intake was observed in low-income countries (2.14 serving/day), while the highest inhigh-income countries (5.42 serving/day) [14]. It wasconcluded that the affordability of fruit and vegetableswas the main contributing factor to the intake frequency[14]. Although the results of our study were not unex-pected, the current study provides the first representa-tive data on region-specific dietary behaviours of Polishadolescent girls and young women. Our previous find-ings from the GEBaHealth study revealed that higher ad-herence to the “Fruit and vegetables” pattern wasobserved among girls with positive attitudes towardshealth, those who use dietary restrictions towards un-healthy foods and with the higher level of physical activ-ity at work or school [27, 38, 39]. All these traits can bemediated by a higher family socioeconomic status andregion’s progressive, health-promoting infrastructure
Czarnocinska et al. Nutrition Journal (2020) 19:26 Page 6 of 14
Table
2Sampledistrib
ution(%)or
means
(with
standard
deviation)
inrelatio
nto
coun
tryregion
,fam
ilysocioe
cono
micstatus
(SES),ageandbo
dymassinde
x(BMI)by
tertiles
ofdietarypatterns
Variables
Total
‘Traditio
nalP
olish’
‘Fruitandvege
tables’
‘Fastfood
andsw
eets’
‘Dairy
andfats’
Bottom
Middle
Upp
erP
Bottom
Middle
Upp
erP
Bottom
Middle
Upp
erP
Bottom
Middle
Upp
erP
Num
berof
respon
dents
1107
367
364
376
364
367
376
365
365
377
366
365
376
Age
(years)
17.3(2.6)
17.6
(2.5)
17.1
(2.6)
17.1
(2.6)
0.0032
17.0
(2.6)
17.4
(2.5)
17.4
(2.6)
0.0771
17.5
(2.6)
17.2
(2.6)
17.2
(2.6)
0.3652
17.8
(2.5)
17.1
(2.6)
17.0
(2.6)
<0.0001
Region
a0.0170
0.0772
0.4819
0.3621
East
18.1
40.1
37.0
22.9
37.8
34.3
28.0
33.0
33.8
33.2
34.6
35.3
30.1
North
14.9
36.5
25.9
37.6
33.2
32.0
34.8
25.4
32.8
41.8
25.3
36.6
38.1
North-W
est
16.5
29.3
32.9
37.8
38.6
35.5
25.9
35.0
34.1
30.9
35.1
32.2
32.7
South
21.3
26.9
35.6
37.5
27.8
34.7
37.5
37.3
30.9
31.8
31.7
31.5
36.8
South-West
9.5
37.2
31.0
31.7
30.5
27.7
41.8
31.1
36.9
32.0
29.8
34.3
35.9
Cen
tral
19.7
32.0
32.5
35.6
30.1
32.0
37.9
33.2
32.0
34.8
38.8
29.6
31.6
SESinde
xb
<0.0001
0.0007
0.7716
0.4559
Low
36.2
22.0
34.4
43.6
40.4
32.2
27.4
32.1
34.9
33.0
33.5
33.9
32.5
average
30.6
34.0
30.2
35.8
30.0
33.1
36.9
33.9
33.1
33.0
30.0
35.1
34.9
High
33.2
44.3
33.8
21.9
27.4
34.3
38.4
33.1
30.8
36.0
35.4
29.9
34.7
Com
pon
ents
ofSE
Sindex
Mothe
r’sed
ucation
<0.0001
0.0473
0.0118
0.0846
prim
ary/lower
second
ary
39.8
24.1
33.1
42.8
37.5
31.7
30.8
27.3
36.8
35.9
32.9
34.2
32.9
uppe
rsecond
ary
43.8
36.6
31.6
31.9
31.3
34.0
34.7
37.5
29.0
33.5
30.4
32.4
37.3
high
er16.4
45.7
35.9
18.4
25.8
34.6
39.6
34.6
34.5
30.9
40.6
31.4
28.0
Father’sed
ucation
<0.0001
<0.0001
0.0080
0.0487
prim
ary/lower
second
ary
52.4
25.8
33.3
40.9
38.8
32.9
28.4
28.3
36.2
35.5
32.6
35.1
32.4
uppe
rsecond
ary
35.1
39.5
31.7
28.7
29.1
32.7
38.2
38.3
28.3
33.4
30.4
31.9
37.7
Highe
r12.5
45.5
34.6
19.9
18.9
35.7
45.5
37.6
33.1
29.3
42.6
27.0
30.4
Econ
omicstatus
0.0134
0.0204
0.1319
0.0656
below
average
3.9
19.0
31.2
49.8
47.3
21.3
31.4
25.1
41.8
33.1
25.3
50.0
24.7
average
80.0
32.6
32.4
35.0
33.4
32.0
34.7
34.3
33.1
32.6
32.4
32.3
35.3
aboveaverage
16.1
39.1
35.6
25.3
27.1
41.9
31.0
28.5
30.3
41.3
38.2
32.1
29.8
Descriptio
nof
househ
old–welive:
<0.0001
0.1576
0.1469
0.3394
mod
estly
c8.2
16.0
38.1
45.9
41.6
26.1
32.3
35.7
35.7
28.6
24.0
33.8
42.2
relativelythriftily
49.6
30.0
32.5
37.5
33.8
34.3
31.9
35.9
31.8
32.3
34.0
33.1
32.9
welld
42.2
40.0
32.4
27.6
30.1
33.2
36.6
29.1
33.9
37.0
33.8
32.6
33.6
Czarnocinska et al. Nutrition Journal (2020) 19:26 Page 7 of 14
Table
2Sampledistrib
ution(%)or
means
(with
standard
deviation)
inrelatio
nto
coun
tryregion
,fam
ilysocioe
cono
micstatus
(SES),ageandbo
dymassinde
x(BMI)by
tertiles
ofdietarypatterns
(Con
tinued)
Variables
Total
‘Traditio
nalP
olish’
‘Fruitandvege
tables’
‘Fastfood
andsw
eets’
‘Dairy
andfats’
Bottom
Middle
Upp
erP
Bottom
Middle
Upp
erP
Bottom
Middle
Upp
erP
Bottom
Middle
Upp
erP
Weigh
tstatus
BMIcateg
oriese
0.1014
0.0059
0.0033
0.0477
thinne
stgrade3
0.0
0.0
0.0
0.0
0.0
0.0
0.0
0.0
0.0
0.0
0.0
0.0
0.0
thinne
stgrade2
0.5
34.4
39.6
26.0
34.8
30.3
34.9
9.5
48.4
42.1
69.7
0.0
30.3
thinne
stgrade1
9.7
22.7
31.8
45.5
35.1
30.9
34.0
30.3
21.2
48.5
24.5
40.5
35.0
norm
alweigh
t77.7
34.8
32.5
32.7
34.9
33.8
31.3
31.6
34.5
33.9
31.9
32.8
35.3
overweigh
t10.5
32.6
37.6
29.8
19.2
31.1
49.7
43.9
31.8
24.3
43.4
29.0
27.6
obesity
1.6
15.8
34.1
50.1
13.2
41.7
45.1
44.3
37.0
18.7
39.8
39.0
21.2
Notes:Sam
plesize
may
vary
ineach
varia
bles
dueto
missing
data;A
llda
taad
justed
forsampleweigh
ts;a
Region
sof
Poland
rank
edby
Gross
Dom
estic
Prod
uct(GDP)
from
less
tomorewealth
y:East
GDP=69
.7,N
orth
GDP=84
.8,N
orth-W
estGDP=95
.1,Sou
thGDP=98
.8,Sou
th-W
estGDP=10
4.8,
Cen
tral
GDP=14
0.4,
Poland
GDP=10
0[24];b
SESinde
xcatego
riesba
sedon
tertile
distrib
ution;
c‘Mod
estly
’categ
orywas
develope
dby
combining
twoan
swers:‘welivepo
orly’and
‘welivemod
estly
’;d‘W
ell’catego
rywas
develope
dby
combining
twoan
swers:‘welivewell’an
d‘welivevery
well’;
eBM
Iwas
catego
rised
accordingto
IOTF
stan
dards
[37],for
girls
13–1
8yearsoldaccordingto
age-sex-specificBM
Icut-offs,forgirls
>18
yearsoldaccordingto
cut-offsforgirls
atag
e18
)[37]
asfollows:<16
.0kg
/m2(thinn
estgrad
e3),1
6.0–
16.9kg
/m2(thinn
estgrad
e2),1
7.0–
18.4kg
/m2(thinn
estgrad
e1),1
8.5–
24.9kg
/m2(normal
weigh
t),2
5.0–
29.9kg
/m2(overw
eigh
t)an
d≥30
kg/m
2(obe
sity);P–sign
ificancelevelo
fthefollowingtests:chi2test
forcatego
rical
varia
bles
orKruskal–
Wallis
test
forcontinuo
usvaria
ble
Czarnocinska et al. Nutrition Journal (2020) 19:26 Page 8 of 14
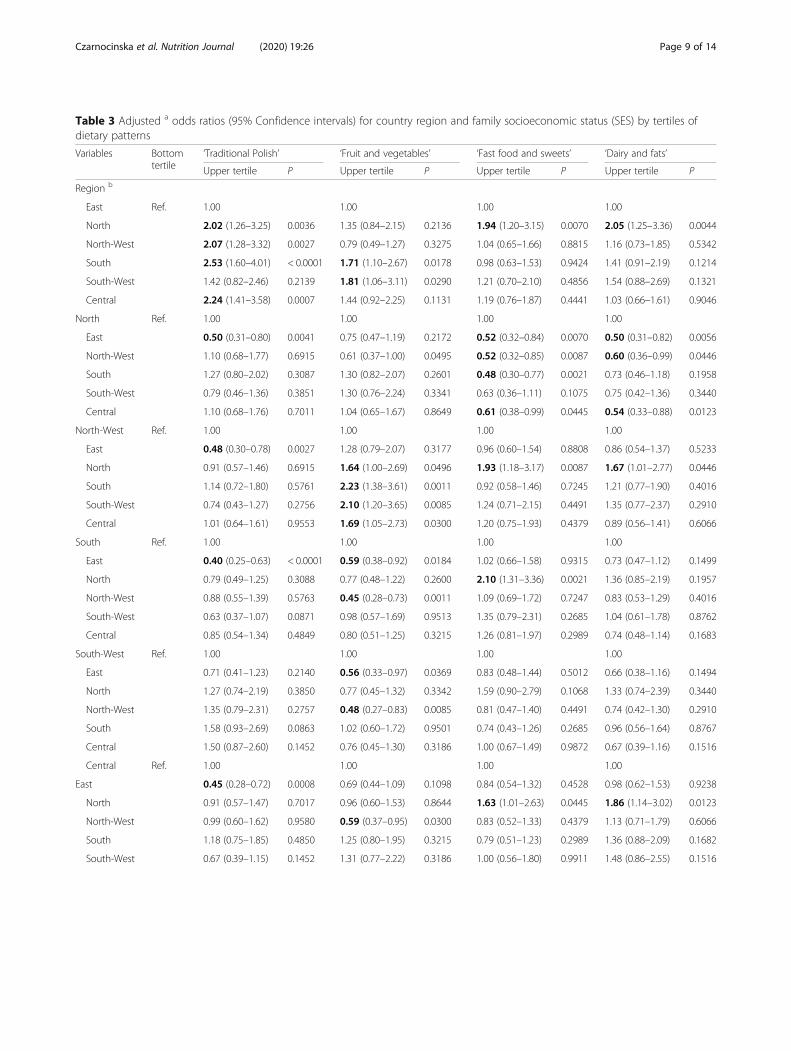
Table 3 Adjusted a odds ratios (95% Confidence intervals) for country region and family socioeconomic status (SES) by tertiles ofdietary patterns
Variables Bottomtertile
‘Traditional Polish’ ‘Fruit and vegetables’ ‘Fast food and sweets’ ‘Dairy and fats’
Upper tertile P Upper tertile P Upper tertile P Upper tertile P
Region b
East Ref. 1.00 1.00 1.00 1.00
North 2.02 (1.26–3.25) 0.0036 1.35 (0.84–2.15) 0.2136 1.94 (1.20–3.15) 0.0070 2.05 (1.25–3.36) 0.0044
North-West 2.07 (1.28–3.32) 0.0027 0.79 (0.49–1.27) 0.3275 1.04 (0.65–1.66) 0.8815 1.16 (0.73–1.85) 0.5342
South 2.53 (1.60–4.01) < 0.0001 1.71 (1.10–2.67) 0.0178 0.98 (0.63–1.53) 0.9424 1.41 (0.91–2.19) 0.1214
South-West 1.42 (0.82–2.46) 0.2139 1.81 (1.06–3.11) 0.0290 1.21 (0.70–2.10) 0.4856 1.54 (0.88–2.69) 0.1321
Central 2.24 (1.41–3.58) 0.0007 1.44 (0.92–2.25) 0.1131 1.19 (0.76–1.87) 0.4441 1.03 (0.66–1.61) 0.9046
North Ref. 1.00 1.00 1.00 1.00
East 0.50 (0.31–0.80) 0.0041 0.75 (0.47–1.19) 0.2172 0.52 (0.32–0.84) 0.0070 0.50 (0.31–0.82) 0.0056
North-West 1.10 (0.68–1.77) 0.6915 0.61 (0.37–1.00) 0.0495 0.52 (0.32–0.85) 0.0087 0.60 (0.36–0.99) 0.0446
South 1.27 (0.80–2.02) 0.3087 1.30 (0.82–2.07) 0.2601 0.48 (0.30–0.77) 0.0021 0.73 (0.46–1.18) 0.1958
South-West 0.79 (0.46–1.36) 0.3851 1.30 (0.76–2.24) 0.3341 0.63 (0.36–1.11) 0.1075 0.75 (0.42–1.36) 0.3440
Central 1.10 (0.68–1.76) 0.7011 1.04 (0.65–1.67) 0.8649 0.61 (0.38–0.99) 0.0445 0.54 (0.33–0.88) 0.0123
North-West Ref. 1.00 1.00 1.00 1.00
East 0.48 (0.30–0.78) 0.0027 1.28 (0.79–2.07) 0.3177 0.96 (0.60–1.54) 0.8808 0.86 (0.54–1.37) 0.5233
North 0.91 (0.57–1.46) 0.6915 1.64 (1.00–2.69) 0.0496 1.93 (1.18–3.17) 0.0087 1.67 (1.01–2.77) 0.0446
South 1.14 (0.72–1.80) 0.5761 2.23 (1.38–3.61) 0.0011 0.92 (0.58–1.46) 0.7245 1.21 (0.77–1.90) 0.4016
South-West 0.74 (0.43–1.27) 0.2756 2.10 (1.20–3.65) 0.0085 1.24 (0.71–2.15) 0.4491 1.35 (0.77–2.37) 0.2910
Central 1.01 (0.64–1.61) 0.9553 1.69 (1.05–2.73) 0.0300 1.20 (0.75–1.93) 0.4379 0.89 (0.56–1.41) 0.6066
South Ref. 1.00 1.00 1.00 1.00
East 0.40 (0.25–0.63) < 0.0001 0.59 (0.38–0.92) 0.0184 1.02 (0.66–1.58) 0.9315 0.73 (0.47–1.12) 0.1499
North 0.79 (0.49–1.25) 0.3088 0.77 (0.48–1.22) 0.2600 2.10 (1.31–3.36) 0.0021 1.36 (0.85–2.19) 0.1957
North-West 0.88 (0.55–1.39) 0.5763 0.45 (0.28–0.73) 0.0011 1.09 (0.69–1.72) 0.7247 0.83 (0.53–1.29) 0.4016
South-West 0.63 (0.37–1.07) 0.0871 0.98 (0.57–1.69) 0.9513 1.35 (0.79–2.31) 0.2685 1.04 (0.61–1.78) 0.8762
Central 0.85 (0.54–1.34) 0.4849 0.80 (0.51–1.25) 0.3215 1.26 (0.81–1.97) 0.2989 0.74 (0.48–1.14) 0.1683
South-West Ref. 1.00 1.00 1.00 1.00
East 0.71 (0.41–1.23) 0.2140 0.56 (0.33–0.97) 0.0369 0.83 (0.48–1.44) 0.5012 0.66 (0.38–1.16) 0.1494
North 1.27 (0.74–2.19) 0.3850 0.77 (0.45–1.32) 0.3342 1.59 (0.90–2.79) 0.1068 1.33 (0.74–2.39) 0.3440
North-West 1.35 (0.79–2.31) 0.2757 0.48 (0.27–0.83) 0.0085 0.81 (0.47–1.40) 0.4491 0.74 (0.42–1.30) 0.2910
South 1.58 (0.93–2.69) 0.0863 1.02 (0.60–1.72) 0.9501 0.74 (0.43–1.26) 0.2685 0.96 (0.56–1.64) 0.8767
Central 1.50 (0.87–2.60) 0.1452 0.76 (0.45–1.30) 0.3186 1.00 (0.67–1.49) 0.9872 0.67 (0.39–1.16) 0.1516
Central Ref. 1.00 1.00 1.00 1.00
East 0.45 (0.28–0.72) 0.0008 0.69 (0.44–1.09) 0.1098 0.84 (0.54–1.32) 0.4528 0.98 (0.62–1.53) 0.9238
North 0.91 (0.57–1.47) 0.7017 0.96 (0.60–1.53) 0.8644 1.63 (1.01–2.63) 0.0445 1.86 (1.14–3.02) 0.0123
North-West 0.99 (0.60–1.62) 0.9580 0.59 (0.37–0.95) 0.0300 0.83 (0.52–1.33) 0.4379 1.13 (0.71–1.79) 0.6066
South 1.18 (0.75–1.85) 0.4850 1.25 (0.80–1.95) 0.3215 0.79 (0.51–1.23) 0.2989 1.36 (0.88–2.09) 0.1682
South-West 0.67 (0.39–1.15) 0.1452 1.31 (0.77–2.22) 0.3186 1.00 (0.56–1.80) 0.9911 1.48 (0.86–2.55) 0.1516
Czarnocinska et al. Nutrition Journal (2020) 19:26 Page 9 of 14
which allows more opportunities to physical activity (e.g.active commuting, better school sports facilities) [40,41], and easier access to fresh, affordable fruit and vege-tables [42]. It has been shown that in contrary to affluentregions, access to fruit and vegetables is limited in ruralor less urbanised regions, often being called ‘food de-serts’ [43–45]. Perhaps, the increase in farmers’ marketsor closer proximity to supermarkets (with more com-petitive pricing) could improve access to healthy foodsin the most disadvantaged regions of Poland. The im-provement in fruit and vegetable intake could also be fa-cilitated through policy regulations or subsidisingfamilies with the lowest income, e.g. by providing fruitand vegetable vouchers [46].Unhealthy dietary behaviours were observed in the
Northern region of Poland, being the area with thesecond-lowest gross domestic product. Interestingly, theanalysis of family socioeconomic status did not detectthis association. Our findings suggest that dietarybehaviours of girls from this region may contribute totheir health. According to the national data, theNorthern region has the highest percentage of chronicdiseases among females aged 15–29 with (35.7%); com-pared to the national average of 31% (Supplementarydata, Table S1) [26]. High adherence to ‘Fast-foods andsweets’ dietary pattern in the Northern region confirmsprevious findings that poor-quality diet is more commonin economically disadvantaged communities [47–49].Westernised diet characterised by frequent intake ofprocessed foods rich in fat and/or sugar and low in fibrecan be attractive for two reasons. First, due to its rela-tively low cost [50]. Secondly, due to the perception ofthese foods acquired in childhood and adolescence.During the transition period, Poland suddenly becameexposed to western culture, with the western lifestyle be-ing strongly promoted in the media and advertising [51].Initially, dining at fast-food restaurants was perceived asa sign of prosperity, available only to more affluent fam-ilies. Within time, the cost of fast-foods and sweets be-came more affordable, however, the preference for
convenient foods and a feeling of reward may have per-sisted and tracked to adulthood. The increased attract-iveness of western products and fast-foods in Polandduring the transition period is not country-specific andhas been reported in many emerging economies world-wide [52–54]. The adherence to the ‘Fast-foods andsweets’ pattern was not observed in the poorest (Eastern)region, which could be explained by the lowest urbanisa-tion of this region, hence the access to fast-food restau-rants could have been still limited. This is an interestingobservation, suggesting that the fast-food consumptionmight be a direct or indirect moderator of health statusand stimulant use. According to the national data, theEastern region, despite low frequency of fruit and vege-table intake, had the highest percentage of young fe-males (aged 15–29 years) with good or very good self-reported health (91%), and the lowest percentage ofchronic diseases (22.2%), smoking (13.3%) and alcoholconsumption (7.9%), comparing to the national averagein this population group (89.1, 31, 16 and 10% respect-ively) (Supplementary material, Table S1) [26]. Our owndata have also confirmed that girls from the Eastern re-gion had the lowest rate of overweight (5.3%), in com-parison to the North-West, North and South-Westregions (13.8, 13.5 and 13.4% respectively) (Supplemen-tary material, Table S4). The adherence to ‘Fast-foodsand sweets’ pattern was not strong in regions withhigher income. Perhaps, the interest in fast-foods andsweets has already peaked in more affluent and bettereducated families, resulting in the gradual shift towardshealthier dietary choices [55, 56].It can be presumed that region’s affluence is not a
contributing factor to the traditional way of eatingamong Polish adolescent girls and young women. Al-though, the analysis of family socioeconomic status re-vealed, that this pattern was less common in girls withthe higher SES. When compared to the East, high adher-ence to the ‘Traditional Polish’ dietary pattern wasobserved across the country, except the South-Westregion (the second richest region). It is most likely
Table 3 Adjusted a odds ratios (95% Confidence intervals) for country region and family socioeconomic status (SES) by tertiles ofdietary patterns (Continued)
Variables Bottomtertile
‘Traditional Polish’ ‘Fruit and vegetables’ ‘Fast food and sweets’ ‘Dairy and fats’
Upper tertile P Upper tertile P Upper tertile P Upper tertile P
SES index c
low Ref. 1.00 1.00 1.00 1.00
average 0.58 (0.41–0.81) 0.0014 1.88 (1.34–2.64) 0.0003 0.87 (0.62–1.22) 0.4263 1.20 (0.85–1.69) 0.2935
high 0.27 (0.19–0.39) < 0.0001 2.06 (1.47–2.88) < 0.0001 0.94 (0.68–1.31) 0.7150 0.88 (0.63–1.21) 0.4231
Notes: Sample size may vary in each variables due to missing data; All data adjusted for sample weights; a Odds ratios adjusted for age (years) and BMI (ascategorical variable according to IOTF standards [37]), for girls 13–18 years old according to age-sex-specific BMI cut-offs, for girls > 18 years old according to cut-offs for girls at age 18); b Regions of Poland ranked by Gross Domestic Product (GDP) from less to more wealthy: East GDP = 69.7, North GDP = 84.8, North-WestGDP = 95.1, South GDP = 98.8, South-West GDP = 104.8, Central GDP = 140.4, Poland GDP = 100 [24]; c SES index categories based on tertile distribution; P –significance level of the Wald’s test. Significant odds ratios are bolded
Czarnocinska et al. Nutrition Journal (2020) 19:26 Page 10 of 14
that the historical background of the East and South-West regions was a key factor since both regionswere strongly influenced in the past by Russian andGerman cultures, respectively. Moreover, consideringthe young age of study participants it is very likely,that the girls and young females were still relying onmeals prepared by the parents, who are still more fa-miliar with cooking traditional Polish cuisine. Inter-estingly, the higher adherence to ‘Dairy and fats’dietary pattern was observed only in the Northern re-gion, which can be explained by the cultural influ-ences of Baltic and Scandinavian countries. Theimportance of country historical and cultural back-ground has been previously reported. Krieger et al.[23] found that language region (German, French orSwiss) was the main determinant of dietary patternsin a representative sample of Swiss adults. Consider-ing that Switzerland is a high-income country the af-fordability of healthy foods was not such a strongdeterminant of dietary behaviours in this sample. Des-pite cultural influences, it can be presumed, that inPoland, the price and accessibility still appear to beone of the crucial factors determining eating choices,and it can be assumed that the cultural backgroundwas only of mild importance. The income and foodprice have been previously recognised as key determi-nants of dietary intake in both rich and poor coun-tries [57]. Hence, increasing the affordability ofhealth-promoting foods should be considered a keystrategy for national intervention programs.
Strengths and limitationsThe main strength of this study is a large, nationally rep-resentative sample of 1107 adolescent girls and youngwomen. Although our findings are specific to the dietarybehaviours of the Polish females, it provides a valuableinsight into the importance of region-specific analysis ofhealth behaviours within the country, and within aspecific population group. It has to be acknowledged,that the frequency of fruit and vegetable intake is only asingle indicator of a healthy lifestyle and it may becomplemented by other behaviours in young females –favourable or unfavourable to health, e.g. dietaryrestraint practices [39, 58]. Our previous studies showedthat girls and young females may engage in explicithealth behaviours [38, 39], driven by psychological fac-tors and are more prone to favour body image overhealth [59–61]. Hence a careful interpretation needs tobe applied. The evidence suggests, that dietary patternsshould be studied with gender and age stratification [62],hence our results should not be generalised to males andother age groups. The cross-sectional design allowedonly for identifying the regional variations in dietary pat-terns, and the associations with health status of girls in
each region remain unclear. However, in our previouswork we have found that the positive attitudes towardshealth were associated with higher adherence to ‘Fruitand vegetable’ pattern, while negative attitudes were as-sociated with higher adherence to ‘Traditional Polish’and ‘Fast foods and sweets’ patterns [38].Next, the subjective evaluations of an economic situ-
ation of the family were used instead of objective meas-ure such as an income. The income can be a particularlysensitive question, potentially difficult to answer andcausing discontent, which in consequence can lead togreater non-response rates than other SES measures[63]. Instead, it was decided to use two subjective evalu-ations, which were simple, tailored to Polish realities andeasy to provide a reliable answers by females aged 13–21 years who may not know their family’s income orcould feel the discomfort associated with the directquestion of income. Lastly, since our study relied onself-reported data, there is a possibility of social desir-ability bias, particularly in terms of reported body weightand food intake. It has been shown, that young peopletend to overestimate the consumption of foods perceivedas healthy (e.g. fruit and vegetables) and underreport theconsumption of unhealthy foods (e.g. fast foods andsweets) [64]. To address the risk of potential dietary mis-reporting, the results were adjusted for external predic-tors such as BMI and age. Since the BMI was calculatedbased on self-reported measures, to correct for potentialbiases associated with self-reported height and weight,regression equations were used (described in themethods section).
ConclusionsThe study highlights that young Polish females livingin more affluent regions or from more affluent fam-ilies more frequently consume fruit and vegetables,being a high-cost food. In contrast, females from eco-nomically deprived regions are more likely to presentunhealthy dietary behaviours with frequent consump-tion of fast-foods and sweets. The results of our studyexposed the regional discrepancies in dietary intakewithin the same country, suggesting that the nationalpublic health interventions focused on educationalone may not bring the expected outcomes [40]. Infact, allocating equal funds for promoting fruit andvegetable intake in affluent regions might be some-what wasteful. Recognising geographical distributionof dietary patterns within the country and shifting theresources to economically disadvantaged regions couldbe a more efficient strategy. More importantly,region-specific interventions that aim to increase fruitand vegetables consumption among adolescent girlsand young females should place a strong focus on in-creasing the affordability and access to healthy foods
Czarnocinska et al. Nutrition Journal (2020) 19:26 Page 11 of 14
in the most economically deprived regions. The studyproposes that the analysis of region’s Gross DomesticProduct can be a simple and inexpensive strategy thatcan be used for a preliminary identification of popula-tions with unhealthy dietary behaviours.
Supplementary informationSupplementary information accompanies this paper at https://doi.org/10.1186/s12937-020-00546-8.
Additional file 1: Figure S1. Flow chart of sample collection. FigureS2. Visual representation of the regional distribution of dietary patterns:odds ratios adjusted for age (years) and BMI (as categorical variableaccording to IOTF standards [37); for girls 13–18 years old according toage-sex-specific BMI cut-offs; for girls > 18 years old according to cut-offsfor girls at age 18). Table S1. Characteristics of Poland by regions, basedon the national statistical office data (GUS). Table S2. Sample distribution(%) in relation to family socioeconomic status (SES) and its single factorsby country regions. Table S3. Factor-loading matrix for the 4 major diet-ary patterns identified by principal component analysis. Table S4. Samplecharacteristics by age and weight status (mean and 95% confidenceinterval or % of the sample). Table S5. Adjusted odds ratios (95% Confi-dence intervals) for single factors of family socioeconomic status by ter-tiles of dietary patterns. Table S6. Crude odd ratios (95% confidenceintervals) for country region and family socioeconomic status (SES), andits single factors, by tertiles of dietary patterns.
AcknowledgmentsThanks are expressed to the participants for their contributions to the study.
Authors’ contributionsJ.C., L.W., M.J-Z. and E.B-Z. were responsible for the conception and design ofthe main study, and the funding acquisition. J.C. was involved in themanaging of the project. J.C., L.W. and J.K. were responsible for theconception and design for this paper. J.K. was responsible for the datacleaning and statistical analysis. J.C., L.W., J.K. and M.L. were responsible fordata interpretation for this paper. J.C., L.W., J.K., M.J-Z. and E.B-Z. wereresponsible for data collection. L.W. and M.L. were responsible for datavisualization. J.C., L.W. and M.L were responsible for writing the original draftof the manuscript. J.C., J.K., M.J-Z. and E.B-Z. were responsible for revising themanuscript critically for important intellectual content. The manuscript hasbeen approved by all co-authors. The author(s) read and approved the finalmanuscript.
FundingThe research was funded by National Science Centre (NCN) in Poland,project no. N N404 068540.
Availability of data and materialsThe authors confirm that the data supporting the findings of this study areavailable within the article and its supplementary materials.
Ethics approval and consent to participateThe study was conducted following the Declaration of Helsinki and goodclinical practice. The study was approved by the Bioethics Committee of theFaculty of Medical Sciences, University of Warmia and Mazury in Olsztyn onJune 17, 2010, Resolution No. 20/2010. Informed consent was obtained fromadult study participants and from parents/legal guardians of underage girls(< 18 years old).
Consent for publicationNot applicable.
Competing interestsNone. The funders played no role in the design, conduct or interpretation ofthis research, or the decision to publish.
Author details1Institute of Human Nutrition and Dietetics, Poznan University of LifeSciences, Wojska Polskiego 28, 60-637 Poznan, Poland. 2Department ofHuman Nutrition, University of Warmia and Mazury in Olsztyn, Pl. Cieszynski1, 10-718 Olsztyn, Poland. 3Department of Organization and ConsumptionEconomics, Warsaw University of Life Sciences, Nowoursynowska 159 C,02-776 Warsaw, Poland. 4Faculty of Physiotherapy and Health Sciences,Gdansk Management College, Pelplinska 7, 80-335 Gdansk, Poland.
Received: 16 September 2019 Accepted: 20 March 2020
References1. United States Department of Agriculture. A series of systematic reviews on
the relationship between dietary patterns and health outcomes, 2014. DOI:https://www.cnpp.usda.gov/nutrition-evidence-library-dietary-patterns-systematic-review-project. Accessed 12 Aug 2019.
2. Slattery ML, Boucher KM, Caan BJ, Potter JD, Ma KN. Eating patterns and riskof colon cancer. Am J Epidemiol. 1998;148:4–16.
3. Hu FB, Rimm EB, Stampfer MJ, Ascherio A, Spiegelman D, Willett WC.Prospective study of major dietarypatterns and risk of coronary heartdisease in men. Am J Clin Nutr. 2000;72:912–21.
4. Tucker KL. Dietary patterns, approaches, and multicultural perspective. ApplPhysiol Nutr Metab. 2010;35:211–8. https://doi.org/10.1139/H10-010.
5. Imamura F, Micha R, Khatibzadeh S, Fahimi S, Shi P, Powles J, Mozaffarian D.Dietary quality among men and women in 187 countries in 1990 and 2010:a systematic assessment. Lancet Global Health. 2015;3:e132–42. https://doi.org/10.1016/S2214-109X(14)70381-X.
6. Gubbels JS, van Assema P, Kremers SP. Physical activity, sedentary behavior,and dietary patterns among children. Curr Nutri Reports. 2013;2:105–12.https://doi.org/10.1007/s13668-013-0042-6.
7. Krusińska B, Hawrysz I, Słowińska MA, Wądołowska L, Biernacki M,Czerwińska A, Gołota JJ. Dietary patterns and breast or lung cancer risk: Apooled analysis of 2 case-control studies in north-eastern Poland. Adv ClinExp Med. 2017;26:1367–75. https://doi.org/10.17219/acem/65433.
8. Osadnik T, Pawlas N, Lonnie M, Osadnik K, Lejawa M, Wadołowska L, BujakK, Fronczek M, Reguła R, Gawlita M, Strzelczyk JK, Góra M, Gierlotka M,Polonski L, Gasior M. Family history of premature coronary artery disease (P-CAD)-a non-modifiable risk factor? Dietary patterns of young healthyoffspring of P-CAD patients: a case-control study (MAGNETIC project).Nutrients. 2018;10. https://doi.org/10.3390/nu10101488.
9. Długosz A. Wzory żywienia, niepożądane skutki zdrowotne, sytuacjaspołeczno-ekonomiczna i styl życia młodzieży z mniej zurbanizowanychregionów Polski [Dietary patterns, adverse health outcomes, socio-economicsituation and lifestyle of adolescents from less urbanized regions of Poland].UWM Press, Olsztyn 2017.
10. Olinto M, Willett W, Gigante D, Victora C. Sociodemographic and lifestylecharacteristics in relation to dietary patterns among young Brazilian adults.Public Health Nutr. 2011;14:150–9. https://doi.org/10.1017/S136898001000162X.
11. Balder HF, Virtanen M, Brants HAM, Krogh V, Dixon LB, Tan F, Mannisto S,Bellocco R, Pietinen P, Wolk A, Berrino F, Van den Brandt PA, Hartman AM,Goldbohm RA. Common and country-specific dietary patterns in fourEuropean cohort studies. J Nutr. 2003;133:4246–51. https://doi.org/10.1093/jn/133.12.4246.
12. James WP, Nelson M, Ralph A, Leather S. Socioeconomic determinants ofhealth. The contribution of nutrition to inequalities in health. BMJ. 1997;314:1545–9. https://doi.org/10.1136/bmj.314.7093.1545.
13. Mayén AL, Marques-Vidal P, Paccaud F, Bovet P, Stringhini S. Socioeconomicdeterminants of dietary patterns in low- and middle-income countries: asystematic review. Am J Clin Nutr. 2014;100:1520–31.
14. Miller V, Yusuf S, Chow CK, Dehghan M, Corsi DJ, Lock K, Popkin B,Rangarajan S, Khatib R, Lear SA, Mony P, Kaur M, Mohan V, Vijayakumar K,Gupta R, Kruger A, Tsolekile L, Mohammadifard N, Rahman O, Rosengren A,Avezum A, Orlandini, et al. Availability, affordability, and consumption offruits and vegetables in 18 countries across income levels: findings from theprospective urban rural epidemiology (PURE) study. Lancet Glob Health.2016;4:e695–703. https://doi.org/10.1016/S2214-109X(16)30186-3.
15. Turrell G, Hewitt B, Patterson C, Oldenburg B, Gould T. Socioeconomicdifferences in food purchasing behaviour and suggested implications for
Czarnocinska et al. Nutrition Journal (2020) 19:26 Page 12 of 14
diet-related health promotion. J Hum Nutr Diet. 2002;15:355–64. https://doi.org/10.1046/j.1365-277X.2002.00384.x.
16. Hinnig PF, Monteiro JS, de Assis M, Levy RB, Peres MA, Perazi FM, et al.Dietary patterns of children and adolescents from high, Medium and LowHuman Development Countries and Associated Socioeconomic Factors: ASystematic Review. Nutrients. 2018;10:436. https://doi.org/10.3390/nu10040436.
17. Andrade GC, Da Costa Louzada ML, Azeredo CM, Ricardo CZ, Martins APB,Levy RB. Out-of-home food consumers in Brazil: what do they eat?Nutrients. 2018;10:218. https://doi.org/10.3390/nu1002021.
18. McCormack LA, Meendering J. Diet and Physical Activity in Rural vs UrbanChildren and Adolescents in the United States: A Narrative Review. J AcadNutr Dietetics. 2016;116:467–80. https://doi.org/10.1016/j.jand.2015.10.024.
19. Morris T, Northstone K. Rurality and dietary patterns: associations in a UKcohort study of 10-year-old children. Public Health Nutr. 2015;18:1436–43.https://doi.org/10.1017/S1368980014001864.
20. Turrell G, Bentley R, Thomas L, Jolley D, Subramanian S, Kavanagh AA.Multilevel study of area socio-economic status and food purchasingbehaviour. Public Health Nutr. 2009;12:2074–83. https://doi.org/10.1017/S1368980009004911.
21. Giskes K, Turrell G, van Lenthe FJ, Brug J, Mackenbach JP. A multilevel studyof socio-economic inequalities in food choice behaviour and dietary intakeamong the Dutch population: the GLOBE study. Public Health Nutr. 2005;9:75–83. https://doi.org/10.1079/PHN2005758.
22. Dekker LH, Rijnks RH, Strijker D, Navis GJ. A spatial analysis of dietarypatterns in a large representative population in the north of theNetherlands – the lifelines cohort study. Int J Behav Nutr Phys Act. 2017;14.https://doi.org/10.1186/s12966-017-0622-8.
23. Krieger JP, Pestoni G, Cabaset S, Brombach C, Sych J, Schader C, Faeh D,Rohrmann S. Dietary patterns and their Sociodemographic and lifestyledeterminants in Switzerland: results from the National Nutrition SurveymenuCH. Nutrients. 2018;11. https://doi.org/10.3390/nu11010062.
24. Central Statistical Office (GUS). Regions of Poland. Warsaw 2014. Availableonline at: www.stat.gov.pl [Accessed on the 12th August 2019].
25. Central Statistical Office (GUS). Expectancy tables of Poland in 2018. Warsaw2019. Available online at: www.stat.gov.pl [Accessed on the 12th August2019].
26. Central Statistical Office (GUS). Health status of population in Poland in2014. Warsaw 2016. Available online at: www.stat.gov.pl [Accessed on the12th August 2019].
27. Czarnocińska J, Jeżewska-Zychowicz M, Babicz-Zielińska E, Kowalkowska J,Wądołowska L. Postawy Względem Żywności, Żywienia i Zdrowia aZachowania Żywieniowe Dziewcząt i Młodych Kobiet w Polsce. [Attitudestowards Food, Nutrition and Health and Dietary Behaviours of Girls andYoung Women in Poland] UWM Press, Olsztyn, Poland: 2013.
28. Wadolowska L, Kowalkowska J, Lonnie M, Czarnocinska J, Jezewska-Zychowicz M, Babicz-Zielinska E. Associations between physical activitypatterns and dietary patterns in a representative sample of Polish girls aged13–21 years: a cross-sectional study (GEBaHealth Project). BMC PublicHealth. 2016;16:698. https://doi.org/10.1186/s12889–016–3367-4.
29. Field A. Discovering statistics using SPSS. 3rd ed. London: Sage Publications;2009.
30. Jolliffe IT, Cadima J. Principal component analysis: a review and recentdevelopments. Philos Trans A Math Phys Eng Sci. 2016;374(2065):20150202.https://doi.org/10.1098/rsta.2015.0202.
31. Newby PK, Tucker KL. Empirically Derived Eating Patterns Using Factor orCluster Analysis: A Review. Nutrition Reviews. 2004;62:177–203. https://doi.org/10.1111/j.1753-4887.2004.tb00040.x.
32. Niedzwiedzka E, Wadolowska L. Accuracy analysis of the food intake varietyquestionnaire (FIVeQ). Reproducibility assessment among older people.Pakistan J Nutr. 2008;7:426–35. https://doi.org/10.3923/pjn.2008.426.435.
33. Thompson FE, Byers T. Dietary assessment resource manual. J Nutr. 1994;124:2245–317.
34. Harris HR, Willett WC, Vaidya RL, Michels KB. An adolescent and earlyadulthood dietary pattern associated with inflammation and the incidenceof breast Cancer. Cancer Res. 2017;77:1179–87. https://doi.org/10.1158/0008-5472.CAN-16-2273.
35. Cunha C, Costa P, De Oliveira L, Queiroz V, Pitangueira J, Oliveira A. Dietarypatterns and cardiometabolic risk factors among adolescents: systematicreview and meta-analysis. Br J Nutr. 2018;119(8):859–79. https://doi.org/10.1017/S0007114518000533.
36. Niedzwiedzka E, Wadolowska L, Słowinska MA, Cichon R, Przybyłowicz K.Self-reported and measured values of body mass and height vs.evaluation of the nutritional status of youth. Pol J Environ Studies. 2006;15:716–22.
37. Cole TJ, Lobstein T. Extended international (IOTF) body mass index cut-offsfor thinness, overweight and obesity. Pediatr Obes. 2012;7:284–94. https://doi.org/10.1111/j.2047-6310.2012.00064.x.
38. Kowalkowska J, Lonnie M, Wadolowska L, Czarnocinska J, Jezewska-Zychowicz M, Babicz-Zielinska E. Health- and taste-related attitudesassociated with dietary patterns in a representative sample of polish girlsand young women: a cross-sectional study (GEBaHealth project). Nutrients.2018;10. https://doi.org/10.3390/nu10020254.
39. Galinski G, Lonnie M, Kowalkowska J, Wadolowska L, Czarnocinska J,Jezewska-Zychowicz M, Babicz-Zielinska E. Self-reported dietary restrictionsand dietary patterns in polish girls: a short research report (GEBaHealthstudy). Nutrients. 2016;8. https://doi.org/10.3390/nu8120796.
40. Rütten A, Abel T, Kannas L, von Lengerke T, Lüschen G, Rodríguez Diaz JA,Ståhl T, Vinck J, van der Zee J, Bernasconi PZ. Health promotion by sportsand physical activity: politics, behavior and infrastructures in a Europeancomparison. Soz Praventivmed. 2001;46:29–40.
41. Yancey AK, Fielding JE, Flores GR, Sallis JF, McCarthy WJ, Breslow L. Creatinga robust public health infrastructure for physical activity promotion. Am JPrev Med. 2007;32:68–78. https://doi.org/10.1016/j.amepre.2006.08.029.
42. Wedick NM, Ma Y, Olendzki BC, Procter-Gray E, Cheng J, Kane KJ, Ockene IS,Pagoto SL, Land TG, Li W. Access to healthy food stores modifies effect of adietary intervention. Am J Prev Med. 2015;48:309–17. https://doi.org/10.1016/j.amepre.2014.08.020.
43. Treuhaft S, Karpyn A. The grocery gap: who has access to healthy food andwhy it matters. Oakland CA and Philadelphia PA: Policy Link and The FoodTrust, 2010. http://thefoodtrust.org/uploads/media_items/grocerygap.original.pdf. Accessed 10 Sept 2019.
44. Ghosh-Dastidar B, Cohen D, Hunter G, Zenk SN, Huang C, Beckman R,Dubowitz T. Distance to store, food prices, and obesity in urban fooddeserts. Am J Prev Med. 2014;47:587–95. https://doi.org/10.1016/j.amepre.2014.07.005.
45. Larson NI, Story MT, Nelson MC. Neighbourhood environments: disparitiesin access to healthy foods in the U.S. Am J Prev Med. 2009;36:74–81.https://doi.org/10.1016/j.amepre.2008.09.025.
46. Lee A, Mhurchu CN, Sacks G, Swinburn B, Snowdon W, Vandevijvere S,Hawkes C, L'abbé M, Rayner M, Sanders D, Barquera S, Friel S, Kelly B,Kumanyika S, Lobstein T, Ma J, Macmullan J, Mohan S, Monteiro C, Neal B,Walker C. Monitoring the price and affordability of foods and diets globally.Obes Rev. 2013;14(suppl 1):82–95. https://doi.org/10.1111/obr.12078.
47. Giskes K, Avendano M, Brug J, Kunst AE. A systematic review of studies onsocioeconomic inequalities in dietary intakes associated with weight gainand overweight/obesity conducted among European adults. Obes Rev.2010;11:413–29. https://doi.org/10.1111/j.1467-789X.2009.00658.x.
48. Cutler GJ, Flood A, Hannan P, Neumark-Sztainer D. Multiplesociodemographic and socioenvironmental characteristics are correlatedwith major patterns of dietary intake in adolescents. J Am Diet Assoc. 2011;111:230–40. https://doi.org/10.1016/j.jada.2010.10.052.
49. Kałucka S, Kaleta D, Makowiec-Dabrowska T. Prevalence of dietary behaviorand determinants of quality of diet among beneficiaries of governmentwelfare assistance in Poland. Int J Environ Res Public Health. 2018;16.https://doi.org/10.3390/ijerph16030501.
50. Steenhuis IH, Waterlander WE, de Mul A. Consumer food choices: the roleof price and pricing strategies. Public Health Nutr. 2011;14:2220–6. https://doi.org/10.1017/S1368980011001637.
51. Sztompka P. Looking back: the year 1989 as a cultural and civilizationalbreak. Communist Post-Communist Studies. 1996;29:115–29. https://doi.org/10.1016/s0967-067x(96)80001-8.
52. Lee J, Tai S. Young consumers' perceptions of multinational firms and theiracculturation channels towards western products in transition economies.Int J Emerg Mark. 2006;1:212–24. https://doi.org/10.1108/17468800610674444.
53. Scott GJ, Suarez V. From Mao to McDonald’s: emerging Markets for Potatoesand Potato Products in China 1961–2007. Am J Potato Res. 2012;89:216–31.https://doi.org/10.1007/s12230-012-9246-3.
54. Popkin BM. Global nutrition dynamics: the world is shifting rapidly toward adiet linked with noncommunicable diseases. Am J Clin Nutr. 2006;84:289–98. https://doi.org/10.1093/ajcn/84.2.289.
Czarnocinska et al. Nutrition Journal (2020) 19:26 Page 13 of 14
55. Zagorsky JL, Smith PK. The association between socioeconomic status andadult fast-food consumption in the U.S. Econ Hum Biol. 2017;27(Pt A):12–25.https://doi.org/10.1016/j.ehb.2017.04.004.
56. Pourrostami K, Qorbani M, Heshmat R, Mohammadi-Nasrabadi F, Sh D,Sheidaei A. Economic Inequality in Healthy and Junk Foods Consumptionand its determinants in Children and Adolescents: the CASPIAN IV Study. IntJ Pediatr. 2019;7:9249–63. https://doi.org/10.22038/ijp.2018.37010.3223.
57. Muhammad A, D'Souza A, Meade B, Micha R, Mozaffarian D. How incomeand food prices influence global dietary intakes by age and sex: evidencefrom 164 countries. BMJ Glob Health. 2017;2(3):e000184. Published 2017 Sep15. doi: https://doi.org/10.1136/bmjgh-2016-00018.
58. Moreira P, de Almeida MD, Sampaio D. Cognitive restraint is associated withhigher intake of vegetables in a sample of university students. Eat Behav.2005;6:229–37. https://doi.org/10.1016/j.eatbeh.2005.01.005.
59. Babicz-Zielińska E, Wądołowska L, Tomaszewski D. Eating disorders:problems of contemporary civilisation – a review. Pol J Food Nutr Sci. 2013;63:133–46. https://doi.org/10.2478/v10222-012-0078-0.
60. Gramaglia C, Gambaro E, Delicato C, Marchetti M, Sarchiapone M, FerranteD, Roncero M, Perpiñá C, Brytek-Matera A, Wojtyna E, Zeppegno P.Orthorexia nervosa, eating patterns and personality traits: a cross-culturalcomparison of Italian, Polish and Spanish university students. BMCPsychiatry. 2019;19:235. https://doi.org/10.1186/s12888-019-2208-2.
61. Plichta M, Jeżewska-Zychowicz M, Gębski J. Orthorexic tendency in polishstudents: exploring association with dietary patterns, body satisfaction andweight. Nutrients. 2019;11. https://doi.org/10.3390/nu11010100.
62. Northstone K. Dietary patterns: the importance of sex differences. Br J Nutr.2012;108:393–4. https://doi.org/10.1017/S0007114511006337.
63. Galobardes B, Shaw M, Lawlor DA, Lynch JW, Davey SG. Indicators ofsocioeconomic position (part 1). J Epidemiol Community Health. 2006;60(1):7–12.
64. Forrestal SG. Energy intake misreporting among children and adolescents: aliterature review. Matern Child Nutr. 2011;7:112–27. https://doi.org/10.1111/j.1740-8709.2010.00270.x.
Publisher’s NoteSpringer Nature remains neutral with regard to jurisdictional claims inpublished maps and institutional affiliations.
Czarnocinska et al. Nutrition Journal (2020) 19:26 Page 14 of 14