Maintenance for Fixed Route Transit Service
58
Addendum #3 1 OPERATION AND MAINTENANCE OF MARIN TRANSIT SERVICE PACKAGES 1 AND 2 SERVICE Issued December 18, 2017 The following is an addendum to Marin Transit’s Request for Proposal for Operation and Maintenance for Fixed Route Transit Service – Packages 1 and 2 Service. This addendum includes additions, clarifications, modifications and answers to questions received by Marin Transit beginning Friday 9, 2017 up to Friday, December 15, 2017 at 3:00 p.m. PST. The RFP, together with Addendum #1, Addendum #2, and this Addendum #3 constitutes the entire understanding between each of the participating proposers and Marin Transit. The changes to the RFP as set forth herein, shall be incorporated into your proposal where required. Please acknowledge receipt of this addendum in your proposal as instructed in the Terms and Conditions – Proposal Requirements Section by specifically listing the RFP title, each Addendum number and date of issuance. As a reminder, the deadline to submit proposals in response to this RFP is Friday, January 12, 2018 at 3:00 p.m. PST. I. MODIFICATIONS AND ADDITIONS TO THE RFP: 5) Change the following text in Section 3 – Scope of Work, Maintenance Responsibilities, Unforeseen Major Repairs from “Unforeseen major repairs not covered under warranty (such as engine or transmission rebuilds) will be paid for by Marin Transit outside of this contract” to “Unforeseen major repairs not covered under warranty (such as battery pack refreshment and replacements, engine or transmission rebuilds) will be paid for by Marin Transit outside of this contract” 6) Change the following text in Attachment I – Draft Operations and Maintenance Contract, Sec. 306 Vehicle Maintenance, Major Engine and Transmission Overhauls from “Major Engine and Transmission Overhauls” to “Battery Pack Refreshment and Replacements, Major Engine and Transmission Overhauls”. 7) Change the following text in Attachment I – Draft Operations and Maintenance Contract, Sec. 306 Vehicle Maintenance, Major Engine and Transmission Overhauls from “When CONTRACTOR determines that a major engine or transmission overhaul is required, CONTRACTOR shall notify the MCTD” to “when CONTRACTOR determines that a battery pack refreshment and replacement, major engine or transmission overhaul is required, CONTRACTOR shall notify the MCTD. 8) Change the following text in Attachment I – Draft Operations and Maintenance Contract, Sec. 306 Vehicle Maintenance, Major Engine and Transmission Overhauls
Transcript of Maintenance for Fixed Route Transit Service

Addendum 3
1
OPERATION AND MAINTENANCE OF MARIN TRANSIT SERVICE
PACKAGES 1 AND 2 SERVICE
Issued December 18 2017
The following is an addendum to Marin Transitrsquos Request for Proposal for Operation and Maintenance for Fixed Route Transit Service ndash Packages 1 and 2 Service This addendum includes additions clarifications modifications and answers to questions received by Marin Transit beginning Friday 9 2017 up to Friday December 15 2017 at 300 pm PST The RFP together with Addendum 1 Addendum 2 and this Addendum 3 constitutes the entire understanding between each of the participating proposers and Marin Transit The changes to the RFP as set forth herein shall be incorporated into your proposal where required Please acknowledge receipt of this addendum in your proposal as instructed in the Terms and Conditions ndash Proposal Requirements Section by specifically listing the RFP title each Addendum number and date of issuance As a reminder the deadline to submit proposals in response to this RFP is Friday January 12 2018 at 300 pm PST
I MODIFICATIONS AND ADDITIONS TO THE RFP
5) Change the following text in Section 3 ndash Scope of Work Maintenance Responsibilities Unforeseen Major Repairs from ldquoUnforeseen major repairs not covered under warranty (such as engine or transmission rebuilds) will be paid for by Marin Transit outside of this contractrdquo to ldquoUnforeseen major repairs not covered under warranty (such as battery pack refreshment and replacements engine or transmission rebuilds) will be paid for by Marin Transit outside of this contractrdquo 6) Change the following text in Attachment I ndash Draft Operations and Maintenance Contract Sec 306 Vehicle Maintenance Major Engine and Transmission Overhauls from ldquoMajor Engine and Transmission Overhaulsrdquo to ldquoBattery Pack Refreshment and Replacements Major Engine and Transmission Overhaulsrdquo 7) Change the following text in Attachment I ndash Draft Operations and Maintenance Contract Sec 306 Vehicle Maintenance Major Engine and Transmission Overhauls from ldquoWhen CONTRACTOR determines that a major engine or transmission overhaul is required CONTRACTOR shall notify the MCTDrdquo to ldquowhen CONTRACTOR determines that a battery pack refreshment and replacement major engine or transmission overhaul is required CONTRACTOR shall notify the MCTD 8) Change the following text in Attachment I ndash Draft Operations and Maintenance Contract Sec 306 Vehicle Maintenance Major Engine and Transmission Overhauls
Addendum 3
2
from ldquoIf CONTRACTOR performs the work the payment to CONTRACTOR will be for replacement engines or transmissions (as the case may be)rdquo to ldquoIf CONTRACTOR performs the work the payment to CONTRACTOR will be for refreshment and replacement battery packs engines or transmissions (as the case may be)rdquo 9) Change the following text in Attachment I ndash Draft Operations and Maintenance Contract Sec 306 Vehicle Maintenance Major Engine and Transmission Overhauls from ldquoMCTD shall not pay for Major Engine and Transmission overhauls on CONTRACTOR owned vehiclesrdquo to ldquoMCTD shall not pay for Battery Pack refreshment and replacements Major Engine and Transmission overhauls on CONTRACTOR owned vehiclesrdquo 10) Change the following text in Attachment I ndash Draft Operations and Maintenance Contract Article 4-Compensation and Commercial Terms Sec 401 Compensation to Contractor Scope of Compensation Exclusion from Rates from ldquoCONTRACTOR shall not be responsible for (a)fuel costs of the Revenue Vehicles used in providing services under this Contract and (b) engine and transmission overhauls provided in Section 306B(h)rdquo to ldquoldquoCONTRACTOR shall not be responsible for (a)fuel costs of the Revenue Vehicles used in providing services under this Contract and (b) battery pack refreshment and replacement engine and transmission overhauls provided in Section 306B(h)
II SUMMARY OF QUESTIONS AND ANSWERS
Q12 Who are the current providers for Package 1 and 2 A12 Marin Airporter currently operates Routes 22 219 228 233 245 251 and 257 MV Transportation currently operates Routes 49 61 66 68 113 115 117 119 122 125 139 145 151 and 154 Packages 1 and 2 currently differ than what is identified in the RFP Q13 What is the current rate (hourly or monthly) for each contractor A13 The current fees and payment schedule for MV Transportation are provided in the current contract A copy of the fees and payment schedule is in the attachment to Addendum 3 The current fees and payment schedule for Marin Airporter are provided in the current contract A copy of the fees and payment schedule is in the attachment to Addendum 3 Q14 Are there any charter services required as part of the monthly service provision A14 Refer to the RFP ndash Attachment E FTA Grant Contract Provisions Charter Section
Addendum 3
3
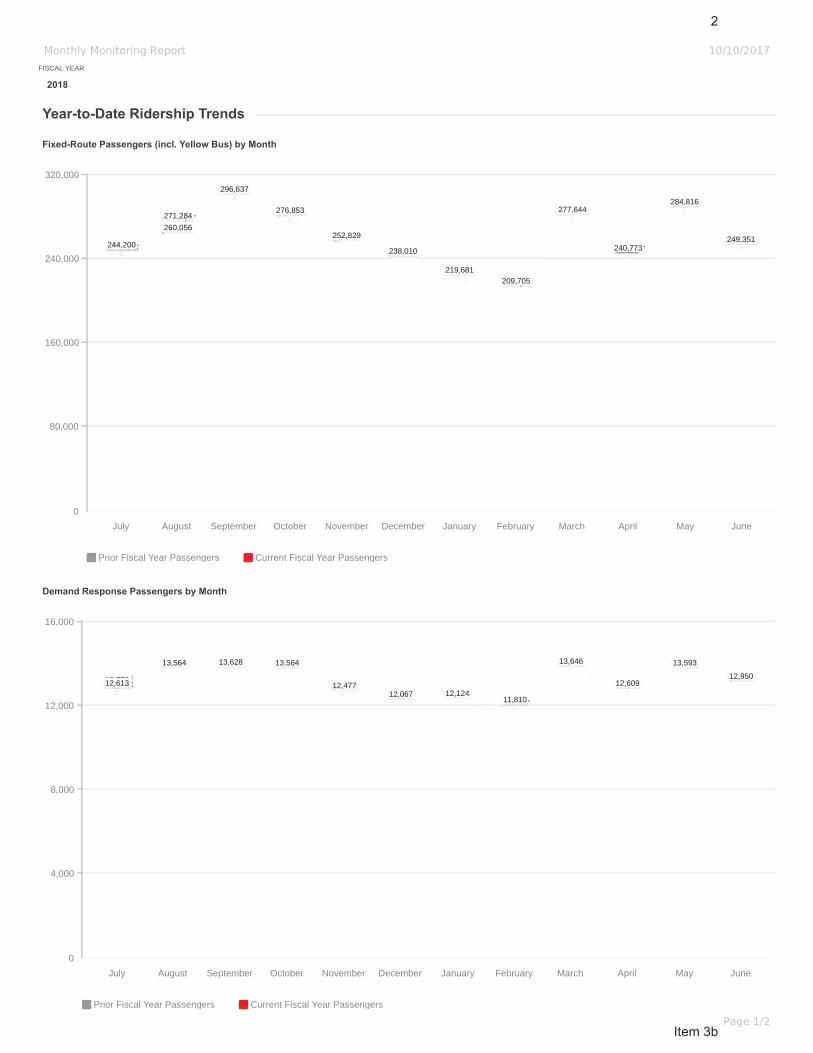
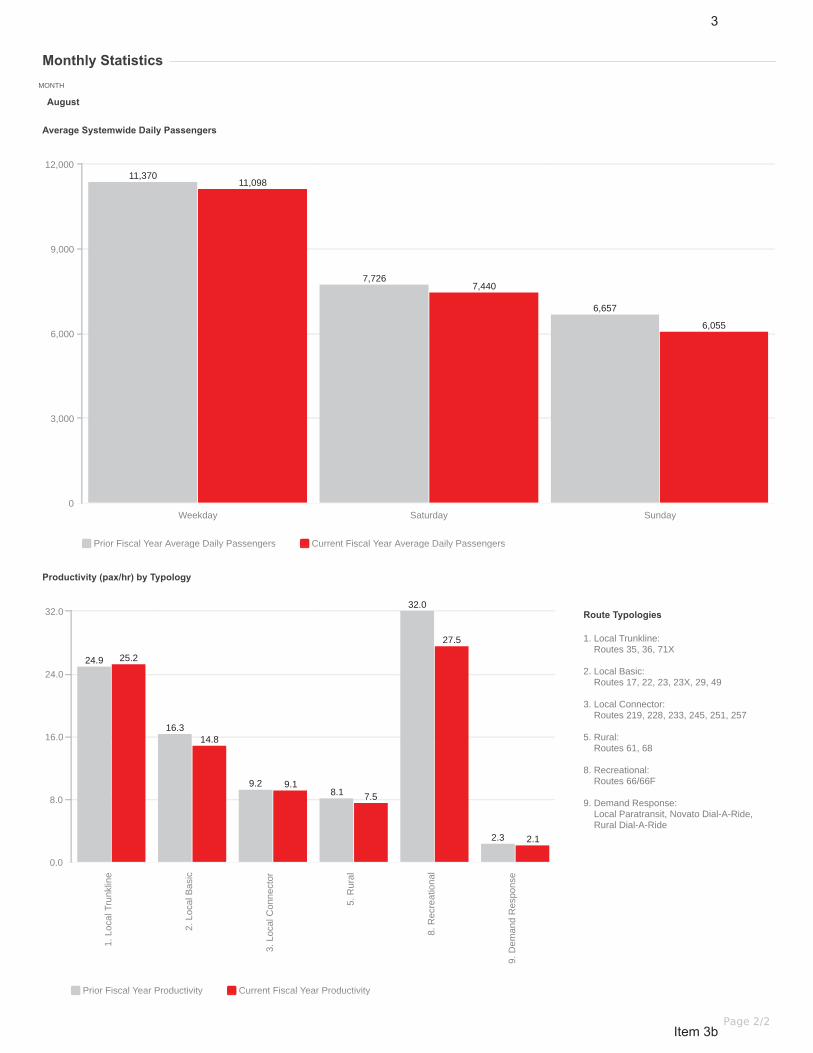
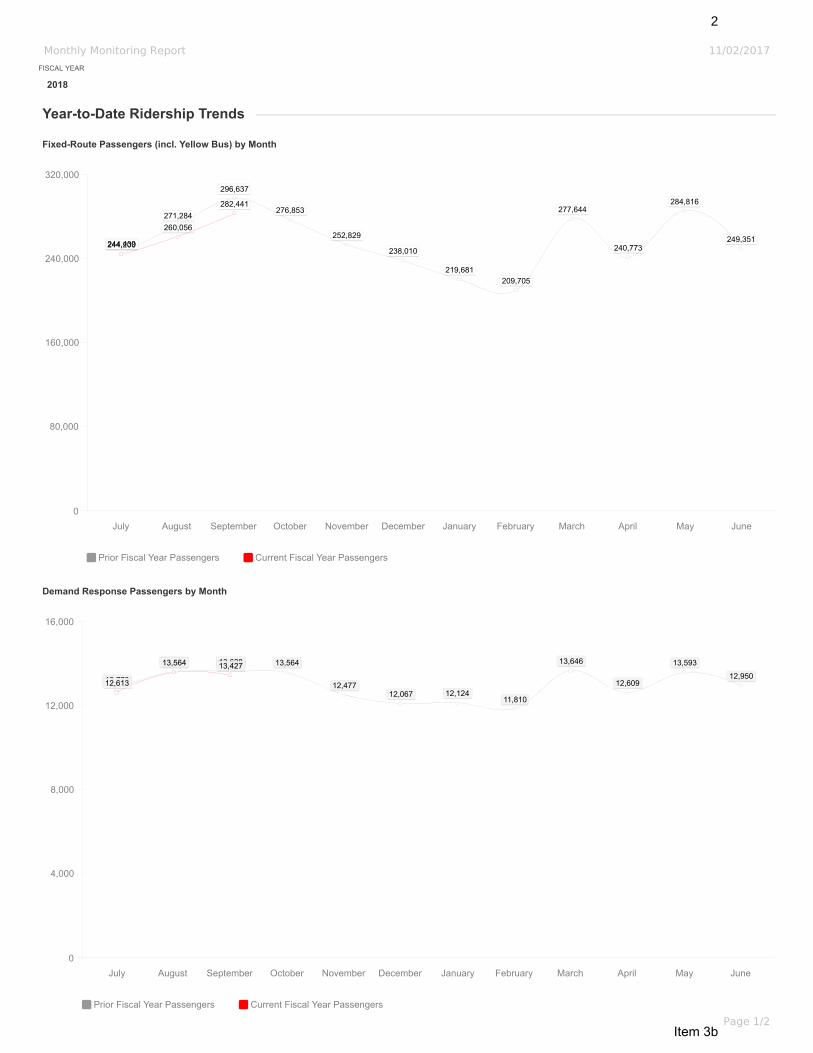
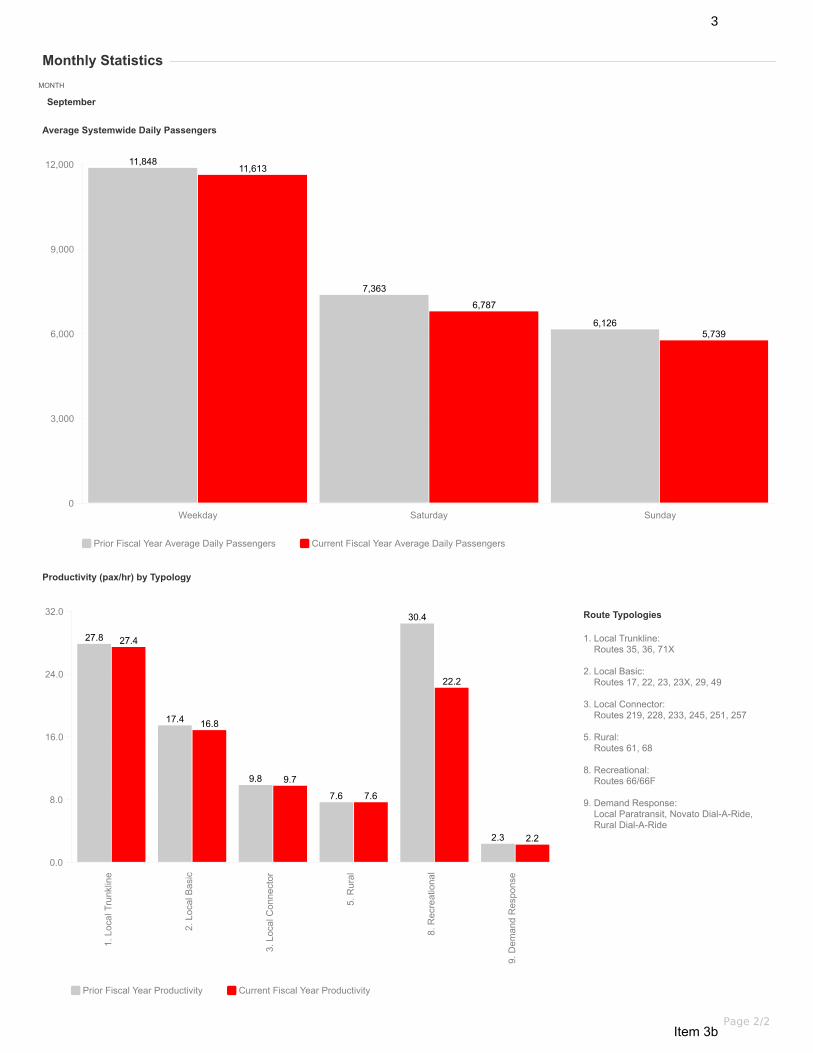
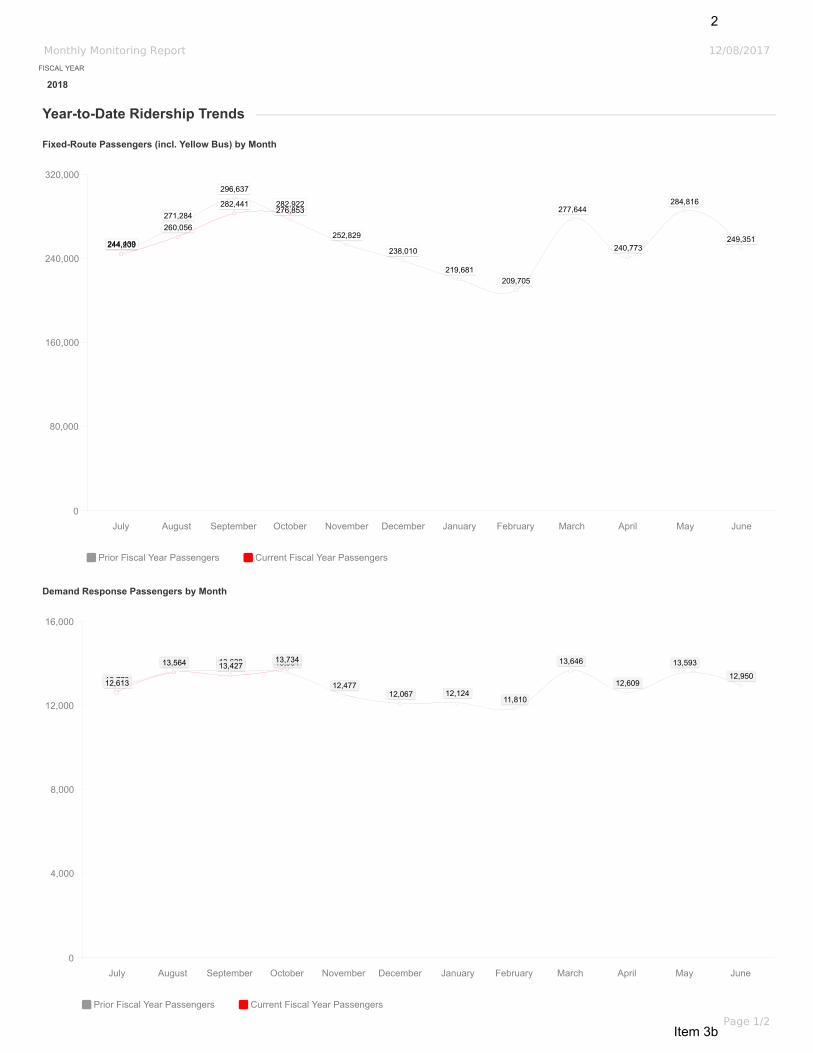
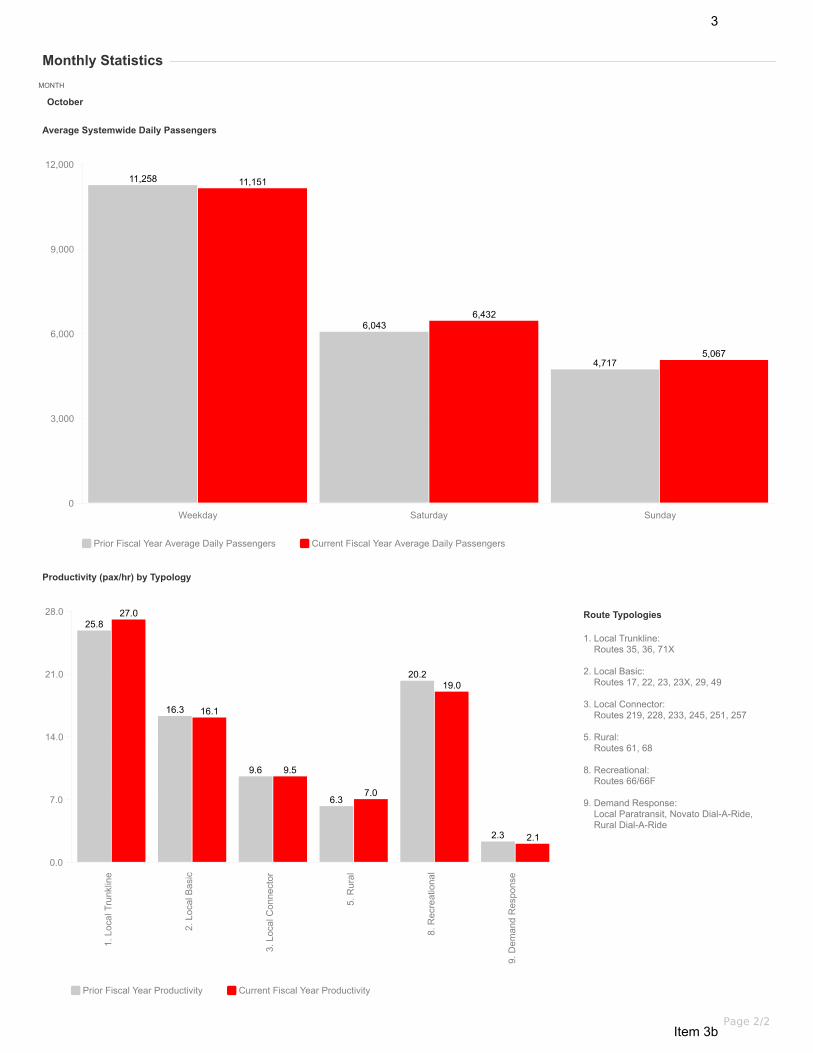
Q15 Is there any bid preference for DBE or certified minority owned small businesses A15 Refer to RFP ndash Attachment E FTA Grant Contract Provisions DBE Participation Goal Q16 Is it possible to get copies of the three most recent monthly ridership reports A16 See the three most recent monthly ridership reports for Package 1 and Package 2 services in the attachment to Addendum 3 Q17 Is it possible to get copies of the three most recent monthly invoices A17 The Package 1 and 2 routes have been configured differently in the RFP than they are currently contracted See the historical performance data provided for Package 1 (Table 2 page 2) and 2 (Table 4 page 4) for insight on how each package of services performed when configured per the RFP Q18 What are the key areas that Marin Transit would like to see operator improvement in the next contract cycle A18 The Transit District is committed to operating a high-quality customer service-oriented service and expects all its contractors will perform to ensure expectations are met Refer to RFP Section 3 Scope of Work for contractor responsibilities Q19 What are the total annual hours of service for all routes A19 Refer to RFP Section 1 ndash General Information Service Description and System Performance Summary for FY201617 in the Attachment to Addendum 3 Q20 Are there any special employeedriver recruitmentretention benefits in place A20 We are aware of driver recruitment benefits offered by MV Transportation as shown in the job posting on their website httpscareersmvtransitcomen-USjobdrivers-2-000-sign-on-bonusJ3S0HL6XT9ZL05GT7MH We do not have any further information on any special employeedriver recruitmentretention benefits in place for contract operators
Addendum 3
4
Q21 Is there any preference for alternative fuel powered vehicles A21 Marin Transit is committed to reducing emission from the use of diesel fuel and strives to purchase hybrid and alternative fuel vehicles Q22 Please confirm RFP submission deadline Dec 22nd at 3pm A22 The RFP submission deadline has been changed to Friday January 12th 2018 at 300 pm PST as per Addendum 2 that was issued on 1282017 Q23 Under Company Financial Capacity Can we submit 3 years of Balance Sheets under separate cover to show our Financial Capacity to carry out the contract A23 Yes Proposers must submit a detailed company portfolio including the companyrsquos financial viability within the past three (3) years credit references ongoing projects and all pending litigations in which the company may be directly or indirectly involved Such documents may include company balance sheets Q24 Would Marin Transit please provide the fixed route alignments (route traces) in a digital spatial (gis) format such as kml andor shp for all routes contemplated in this RFP This would be the same data that was uploaded to Google Maps for the interactive maps on MCTDrsquos web site A24 The Fixed Route shapefiles are provided in KML format on Marin Transitrsquos website wwwmarintransitorgpurchasinghtml Q25 With regard to attachment E page 132 in section 2 Bonding Requirements Bid Guarantee Is a bid bond required If so please provide the dollar amount andor percentage A25 No Please refer to Addendum 1 (issued December 1 2017) where attachment E the FTA Grant Contract Provisions were replaced including removal of the bonding requirements Q26 Can Marin Transit please provide invoices for the past 6 months for Package 1 A26 The Package 1 and 2 routes have been configured differently in the RFP than they are currently contracted See the historical performance data provided for Package 1 (Table 2 page 2) and 2 (Table 4 page 4) for insight on how each package of services performed when configured per the RFP
Addendum 3
5
Q27 What liquidated damages were assessed if any to the current contractor for Package 1 A27 None There were no liquidated damages or performance penalties assessed for the current contractor of Package 1 The District maintains the right to assess performance penalties based on the Contractorrsquos failure to meet the established standards and any additional requirements by the District Q28 On page 13 in section 10 Intelligent Transportation Technology Plan (5 pts) does Marin Transit wish for bidders to re-alphabetize a) through e) or is it easier to keep the aabc d e format A28 Proposers should present their Intelligent Transportation Technology Plan ensuring that each required element is addressed Q29 On page 12 of the RFP section 6 Mobilization Plan (5 pts) section a) Project Schedule the last word is ldquoIncluderdquohellip was there more to this section or is it eluding to section 7 Facility A29 No The word ldquoIncluderdquo is a typographical error and should be eliminated Q30 Please confirm that bidders are required to include letters of intent for the facility(ies) proposed in their submittal A30 Refer to the RFP Section 2 ndash Terms and Conditions Proposal Requirements Facility Section Q31 With regard to section 3 Corporate Capacity Experience Past Performance can you please clarify this requirement Is the District requesting bidders to demonstrate 10 years of experience with similar systems and then to also identify contracts that have been in operation for 5 consecutive years as references A31 Proposers must provide a history of their company for the past 10 years and highlight 5 of those years where service was provided continuously and was similar in scope size and complexity to the service being proposed Q32 Attachment B Equipment Summary Would Marin Transit please provide the vehicle types that are intended to replace the vehicles noted in this attachment A32 Yes See the Local Transit Bus Replacement Schedule from the Draft 2018-2017 Short Range Transit Plan for Package 1 and Package 2 services in the attachment to
Addendum 3
6
Addendum 3 It is anticipated that vehicles will be replaced with vehicles that are similar to what is being operated today but is subject to change at Marin Transitrsquos discretion Q33 Page 13 Item 10 Information Technology Plan Is the contractor responsible for the cost and maintenance of all electric maintenance components in this section ie GFI Radios passenger counters MDTrsquos and other components A33 The Intelligent Transportation Technology equipment consists mostly of onboard equipment (ie GFI fareboxes MDTrsquos cameras etc) and will be provided by Marin Transit as described in Section 1 ndash General Information Onboard Equipment (Intelligent Transportation Technology) of the RFP Contractors are responsible for repairs preventive maintenance and maintaining spare parts associated with this equipment as outlined in the Operations Responsibilities and Maintenance Responsibilities sections of the RFP Marin Transit will provide an initial inventory of spare parts (excluding major vehicle parts such as engines or transmissions etc) but the Contractor will be responsible for ensuring that any spare parts that are swapped out or used are immediately replaced in order to maintain an adequate spare parts inventory Most of the onboard equipment has an initial warranty associated with failure of hardware Q34 Please provide the total annual miles operated for each package A34 See annual miles for each route in the attachment to Addendum 3 Q35 What is the current spare ratio for each service provided A35 Services in Package 1 and Package 2 currently differ than what is operated today Currently Package 1 contains one vehicle that is not owned by Marin Transit Package 1 services have a weekday spare ratio of 17 percent and 61 percent on the weekend Package 2 currently has a weekday spare ratio of 38 percent weekday during non-school days is 50 percent weekend peakpeak at 21 percent weekend peakoff peak of 38 percent and weekend off peakoff peak at 46 percent It is projected that Package 1 will have a weekday spare ratio of 17 percent and a weekend spare ratio of 52 percent Package 2 is projected to have a weekday spare ratio of 21 percent weekday (non-school days) is 58 percent weekend peakpeak of 11 percent weekend peakoff-peak of 35 percent and weekend off peakoff peak at 48 percent Q36 Will Marin Transit be responsible for the cost of battery packs for all of the hybrid vehicles
Addendum 3
7
A36 Yes Marin Transit would consider hybrid vehicle battery pack replacement as an Unforeseen Major Repair an assume the cost to refresh or replace the battery packs per Maintenance Responsibilities Section of the RFP Q37 Page 28 Section 3 Are the DPF filters considered a major component that Marin Transit will be responsible for covering the cost for A37 DPF filters are not considered a major component and Marin Transit will not be responsible for covering the costs for providing or replacing DPF filters Q38 Section 405d Auto Physical Damage ndash Transportation providers to maintain a higher deductible than the $50K for each loss noted in this section would Marin Transit modify this section to remove the deductible limitation A38 No The referenced draft contract language requires that ldquoDeductibles shall not exceed $50000 for each lossrdquo Q39 Section 405i Certified Copies of Policies ndash It typically takes insurance companies around 30 days after policy expiration before a new policy is issued As an alternative would Marin Transit please modify this section to state that the replacement policy or binder shall be furnished 5 days after expiration A39 Marin Transitrsquos primary concern is that there not be a gap in insurance coverage whether for new or replacement policies during the term of an awarded contract and will not modify this language beyond the expiration date of a policy Q40 Section 405j MCTD Purchase of Insurance ndash As an alternative to the current language would Marin Transit modify this section to provide that Marin Transitrsquos recourse for failure to comply with the insurance requirements be cancellation of the contract A40 No Marin Transit reserves to right terminate its contracts for convenience This provision ensures that insurance coverage is always in place Q41 Page 18 Draft Contract Item b Dedication to Project vs Page 11 Item 4 A) Summary of Key Personnel The language in these sections seems to conflict Please confirm it is acceptable to share key personnel with other projects as long as the percentage of time dedicated to this project is clearly identified A41 Personnel can be shared Of the key personnel the General Manager Operations Manager Maintenance Manager are to be full time positions and the Operations Manager and Maintenance Manager are to be located on-site Proposers must indicate if key personnel and non-key personnel (ie mechanics dispatchers road supervisors) will be shared on other projects and the percentage of time that will be
Addendum 3
8
dedicated to Marin Transit contract(s) Refer to Attachment I ndash Draft Operations and Maintenance Contract Article 2 ndash Personnel Requirements Sec 201 General Requirements for Contractor Personnel Dedication to Project Q42 Page 14 Item 13 Employee Training Please confirm whether CPR and First Aid training is a new requirement A42 No Proposers are being asked to present their initial training program for operators ldquoto Include any certifications and licensing to be included along with the initial training (CPR First Aid Class B etc)rdquo as referred to in the RFP Section 2 ndash Terms and Conditions Proposal Requirements Employee Training Q43 Page 28 Unforeseen Major Repairs Would Marin Transit identify a dollar amount such as $2000 for single maintenance items that would classify an item as an unforeseen major repair Marin Transit would be responsible for the cost of There are various parts on the fleet vehicles that exceed the cost of a transmission rebuild for example A43 No Q44 Page 8 Draft Contract b Facilities ii Would Marin Transit please remove this language from the RFP and Draft Contract Proposerrsquos are not able to require a landlord to consent to assignment of a property lease A44 No Proposerrsquos are encouraged to work closely with property managers agents or owners on how best to address this requirement Q45 Page 7 Radio Communications For package 2 services should bidders account for two-way radios vs push to talk devices due to the service area and poor cell phone reception A45 Package 1 and 2 proposers should provide a radio communication system that meets the service requirements outlined in the RFP Proposers are encouraged to obtain signal coverage area maps to include with their proposed systems that minimize or eliminate ldquodead spotsrdquo Q46 Draft Contract sect104E TermRenewal Options Please revise to require mutual agreement for any extension of the Agreement with pricing to be negotiated by the parties in order to allow for price adjustments to reflect changes in Contractorrsquos cost to operate the service A46 The RFP and contract address changes to Contractorrsquos cost to operate service though the two-tiered (variable hourly rate and monthly fixed cost) structure and the
Addendum 3
9
Possible Rate Adjustments contract provision (304f) The optional contract extension terms will not be made subject to renegotiation Q47 Draft Contract sect523 ndashAssignment Please delete ldquoAssignment provision extends to any purchase merger or consolidation change in control etcrdquo from the draft contract as a change in stockholders of a contractor shall not require consent or result in a default or termination of the Agreement A47 No This contract provision does not require consent for a change in a contractorrsquos stockholders but instead a change in contract assignment resulting from a change in stockholders Q48 Draft Contract sect408 ndashTermination ndash Would Marin Transit please consider modifying this requirement to provide a minimum of 60 daysrsquo notice of cancellation in order to provide the contractor with enough time to complete obligations required such as WARN Act lease terminations etc A48 No Marin Transit prefers the 30-day notice period Q49 Draft Contract sect406 ndash Indemnity Would Marin Transit please consider revising indemnification to limit the indemnity to actions or omissions of the Contractor or its employees agents subcontractors etc The Contractor should not be liable for items outside of its control A49 No Marin Transit is not considering a revision to the indemnification clause at this time Q50 General Draft Contract Would Marin Transit please add a force majeure provision to relieve both parties from performance under the Contract for circumstances beyond their reasonable control (acts of God war labor strikes or disputes terrorism etc) The contractor should be excused from performance under the contract for circumstances outside of its control A50 No See response for Q38 Q51 General Draft Contract Would Marin Transit include a provision that provides for price adjustments if Contractorrsquos revenue decreases or Contractorrsquos costs increase as a result of (i) changes to the scope of work service hours requested by the Authority (ii) changes in laws rules regulations etc applicable to the services to be provided by Contractor andor (iii) wage increases necessary for Contractor to be able to recruit and retain qualified employees as a result of an increase in the minimum wage in the County or surrounding jurisdictions If the parties are unable to agree on a rate adjustment then either party may terminate the contract upon 120 daysrsquo written notice to the other party Doing so would
Addendum 3
10
provide protection for the contractor to cover changes requested by the District or matters that were not contemplated at the time of Contractorrsquos proposal A51 No The RFP and contract address potential changes to scope of work changes in lawrulesregulations and requires proposers to consider wages and benefits to recruit and attract qualified employees without requiring contract price renegotiation
Attachments MV Transportation Fees and Payment Schedule (Revised November 20 2017)
Marin Airporter Fees and Payment Schedule (Revised November 20 2017) System Performance Summary for FY201617
August 2017 Monthly Monitoring Report September 2017 Monthly Monitoring Report October 2017 Monthly Monitoring Report Local Transit Bus Replacement Schedule
171801
EXHIBIT ldquoCrdquo
FEES AND PAYMENT SCHEDULE (revised)
Contractor shall bill Marin Transit monthly for service hours provided Additional hours shall only be used with approval from Marin Transit Proper back-up including TransTrack reports showing hours miles and fuel usage must be attached to invoices For Fiscal Year 1718 Contractor shall provide proof of wage increase (eg month over month payroll comparisons)
Service Cost per Service Hour
Contract Service Hours
Contract Maximum Obligation
Total year 1 January 30 2012 to December 31 2012 13881 $737832 Total year 2 January 1 2013 to December 31 2013 16686 $892890 Total year 3 January 1 2014 to December 31 2014 20913 $1297726 Total year 4 January 1 2015 to December 31 2015 27250 $1715566
Fixed Administrative Costs $277094 West Marin StagecoachMuir Woods Shuttle $3682 10750 $395815 Supplemental Service $6601 3750 $247538 Start-Up Costs $47571 First Half Year 5 January 1 2016 to June 30 2016 14500 $968018
Fixed Administrative Costs $975995 West Marin StagecoachMuir Woods Shuttle $4094 21500 $880210 Local Fixed Route $4094 14000 $573160 Supplemental Service $6814 7500 $511050 Fiscal Year 1617 July 1 2016 to June 30 2017 43000 $2940415
Fixed Administrative Costs1 $1137363 West Marin StagecoachMuir Woods Shuttle $4439 21500 $954455 Local Fixed Route $4439 14000 $621505 Supplemental Service $7018 7500 $526350 Fiscal Year 1718 July 1 2017 to June 30 2018 43000 $3239674
1 Includes the addition of one Road Supervisor position and one Level A Mechanic Contractor shall credit Marin Transit $5900 per month for the wage benefit and tax cost of the Level A Mechanic from July 1 2017 until the date of hire of this position
Item 10
404
asmith
Typewritten Text
MV Transportation
171830
EXHIBIT ldquoBrdquo
FEES AND PAYMENT SCHEDULE (revised)
Cost per Revenue Hour Community Shuttle Service
Base Years Option Years FY1314 FY1415 FY1516 FY1617 FY1718
Rate $7078 $6866 $7072 $7284 $7614 Maximum Revenue Hours 40000 40000 40000 60000 60000
In addition to payment of a cost per revenue hour District will directly reimburse Contractor for lease payments associated with storage of heavy duty transit buses beginning June 2016 Contractor must substantiate lease expense by providing District with a copy of the lease agreement In no event will lease payments exceed $1800 per month without written approval of District
Contractor to provide proof of wage increase (eg month over month payroll comparisons)
Item 11
410
asmith
Typewritten Text
Marin Airporter
asmith
Typewritten Text
asmith
Typewritten Text
1
System Performance Summary for FY 201617
This report summarizes the unaudited operational performance of Marin Transit local transit services for FY 201617 and compares these results to the Districtrsquos route level performance goals identified in the Short-Range Transit Plan The report provides a detailed route level assessment of all Marin Transit services operating in FY 201617 On June 12 2016 Marin Transit implemented a major service change with a 19 increase in local fixed-route service levels and a restructuring of routes throughout the County This FY 201617 report includes data from a full year of the new service plan There were a few additional changes to transit services during FY 201617 including the following In July 2016 the District launched a new general public dial-a-ride service between Point Reyes Station and Novato
The service provides curb-to-curb pick-up and drop-off and only operates on the second Monday of each month The closure of Hwy 1 in early 2017 delayed the start of the Muir Woods Shuttle season which typically begins in April
The Shuttle season began on May 13 resulting in 12 fewer days of service A number of recent changes to Marin Transitrsquos contracts and agreements have had an impact on the Districtrsquos financials These include the following The District completed a procurement for paratransit services in 2015 The new contract went into effect on January 1
2016 and provides significantly lower rates for paratransit and dial-a-ride services This report provides data from the first full year of the new contract
Effective February 1 2017 the District increased the subsidy paid to Catch-A-Ride service providers for operating wheelchair accessible vehicles to further incentivize the availability of accessible vehicles for Catch-A-Ride trips
For FY 201617 Marin Transit updated the methodology for calculating revenue hours for demand response services to be more consistent with the National Transit Database definitions These include local paratransit and the Novato Dial-A-Ride This change has reduced the amount of time that is considered as part of revenue hours Overall Marin Transit provided over 32 million unlinked passenger trips in FY 201617 with over 235000 revenue hours of service Compared to FY 201516 these numbers represent a decrease in unlinked passenger trips (-35) and an increase in revenue hours (+82) Growth in service was primarily on local fixed-route services due to the June 2016 changes Some of this growth was partially offset by decreases in hours on local paratransit and Route 122 The system-wide productivity rate was 136 riders per hour about 108 lower than FY 201617 Passenger revenues increased slightly (+06) Due to higher operating costs passenger subsidy increased by 127 to a system-wide average of $678 per passenger Fixed Route Fixed Route operations carried over 29 million unlinked passenger trips in FY 201617 with 178052 revenue hours These totals represent 91 of the Districtrsquos total trips and 76 of revenue hours Compared to FY 201516 unlinked passenger trips on fixed route services decreased by 35 and revenue hours increased by 136 Overall productivity was 164 passengers per hour approximately 150 lower than the 193 mark last fiscal year Compared to FY 201516 almost all fixed-route typologies experienced a decrease in overall ridership These include Local Basic (-120) Local Connector (-127) Supplemental (-32) and Partnership (-25) However some services experienced a modest increase in ridership compared to last year including Local Trunkline (+77) the Muir Woods Shuttle (+44) and Rural (+48)
2
Total passenger revenue decreased slightly (-11) in FY 201617 compared to last year Increases in operating costs resulted in a decrease in overall farebox recovery from 199 last year to 176 in FY 201617 Only the Local Trunkline and Recreational (Muir Woods Shuttle) typologies experienced an overall increase in both passenger revenue and farebox recovery Yellow Bus In FY 201617 yellow bus service for the Ross Valley School District carried over 136000 unlinked passenger trips a decrease of 13 compared to last year and operated 1245 revenue hours These totals represent 4 of the Districtrsquos total ridership and 1 of revenue hours Passenger revenues increased 150 due to higher pass prices This boost in revenues did not keep pace with the rise in operating costs and overall farebox recovery decreased from 571 last year to 548 in FY 201617 Demand Response Demand Response programs carried 124325 unlinked passenger trips in FY 201617 and provided 55191 revenue hours of service These totals represent 4 of the Districtrsquos total trips and 24 of revenue hours Compared to FY 201516 unlinked passenger trips on demand response services decreased by 39 (-5096 trips) and revenue hours decreased by 61 The more significant reduction in revenue hours compared to passengers is likely due to the new method for calculating those hours Overall productivity was 23 passengers per hour slightly higher than last fiscal year Ridership on local paratransit and the Novato Dial-A-Ride decreased in FY 201617 compared to the prior year Rural Dial-A-Ride experienced growth in ridership mainly because these services were only recently introduced These include the Dillon BeachTomales and Point Reyes Station Dial-A-Ride Passenger revenues for demand response services dropped slightly (-15) compared to last year However lower operating costs due to the new contract rate resulted in reductions in subsidies and an increase in farebox recovery Other Services Other Marin Access Mobility Management services include the Volunteer Driver and Catch-A-Ride programs In FY 201617 these programs provided 30547 unlinked passenger trips about 1 of the Districtrsquos total trips Compared to the prior fiscal year ridership decreased by 77 mostly due to the Catch-A-Ride program However passenger revenues increased by 90 primarily on the Catch-A-Ride program This increase may have been due to riders taking longer trips Performance Goals
The 2016-2025 Short-Range Transit Plan identifies fifteen different goals and associated metrics that staff use to evaluate system performance Performance goals at the route level are measured in both productivity (unlinked passengers per hour and per trip) and cost effectiveness (subsidy per unlinked passenger trip) These measures follow the service typologies updated in the most recent Short Range Transit Plan Table 1 below summarizes route level performance goals by typology Marin Transit has not identified productivity or cost-effectiveness goals for the Yellow Bus or Partnership service typologies Table 2 provides a detailed summary of annual FY 201617 performance data by program route and service typology
3
Table 1 Productivity and Subsidy Goals by Service Typology
Service Typology Routes Unlinked Passenger
Trips per Hour (at or above)
Subsidy per Passenger Trip
(at or below)
Local Trunkline 35 36 71X 25 $300
Regular Local 17 22 23 23X 29 49 20 $500
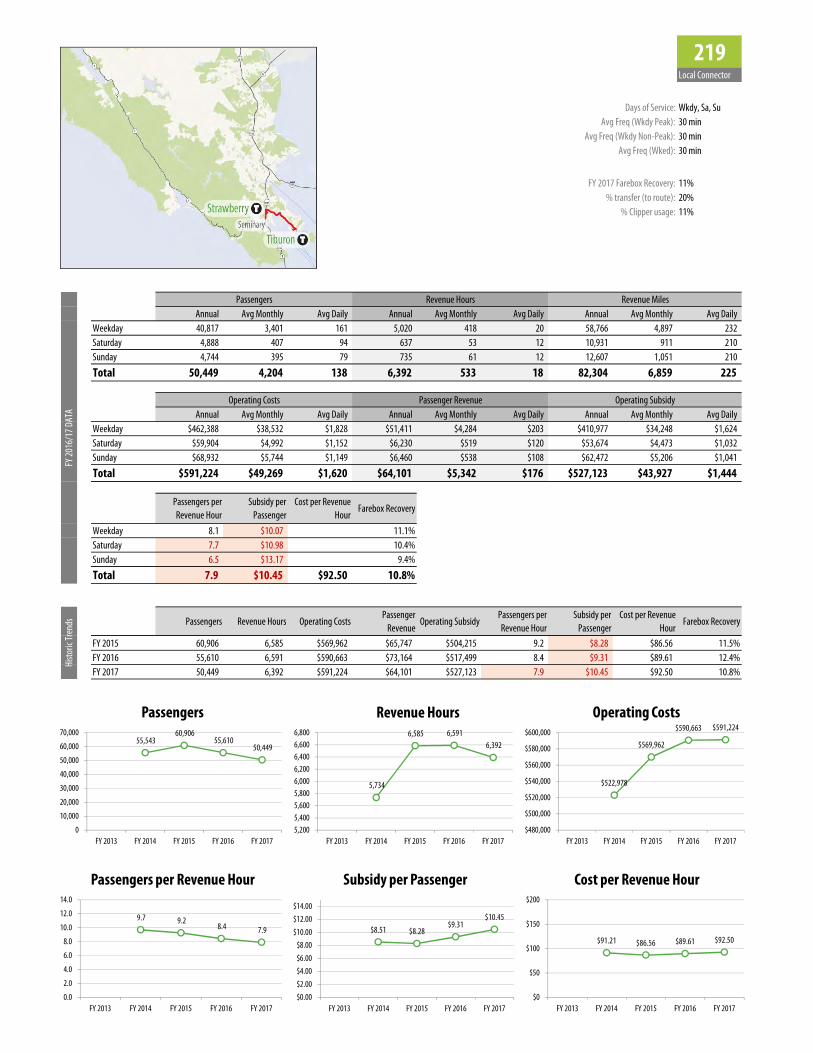
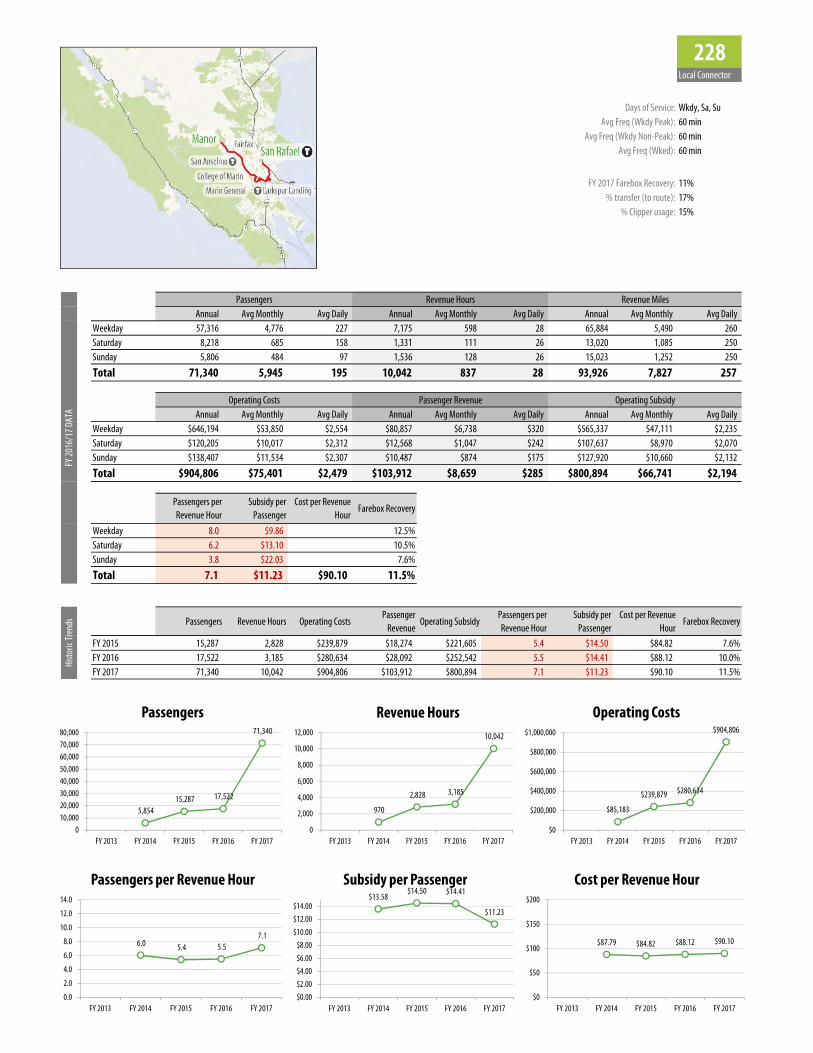
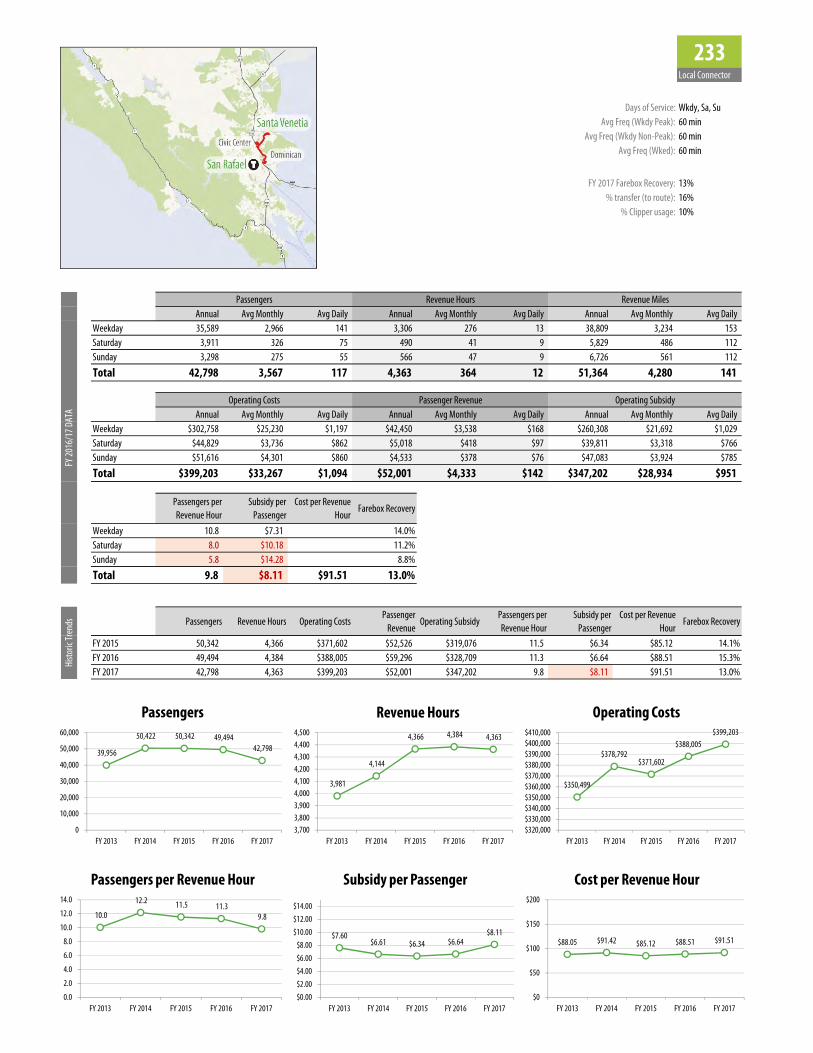
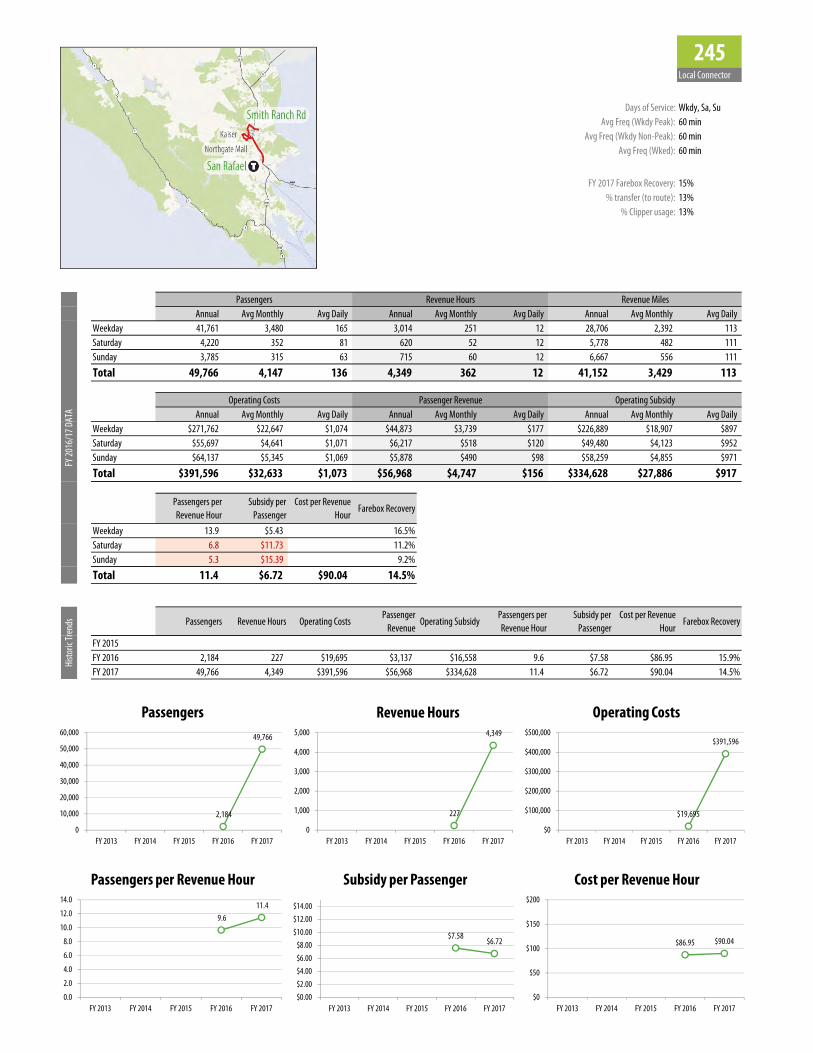
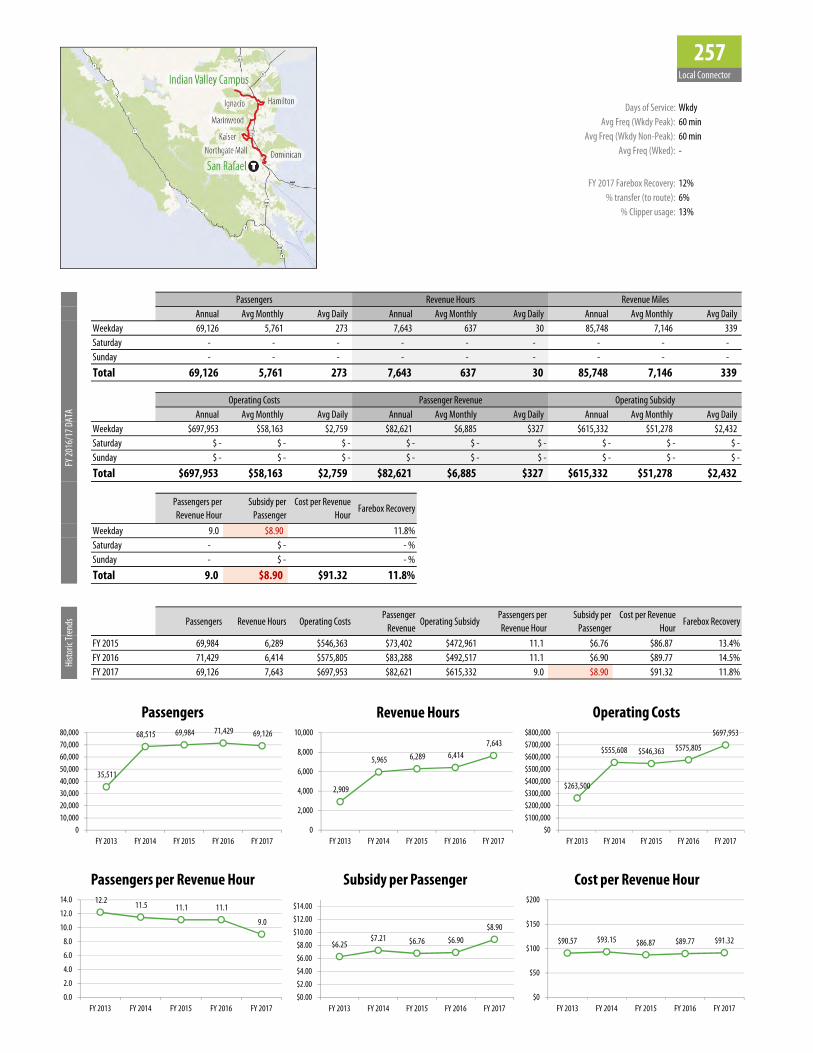
Local Connector 219 228 233 245 251 257 8 $800
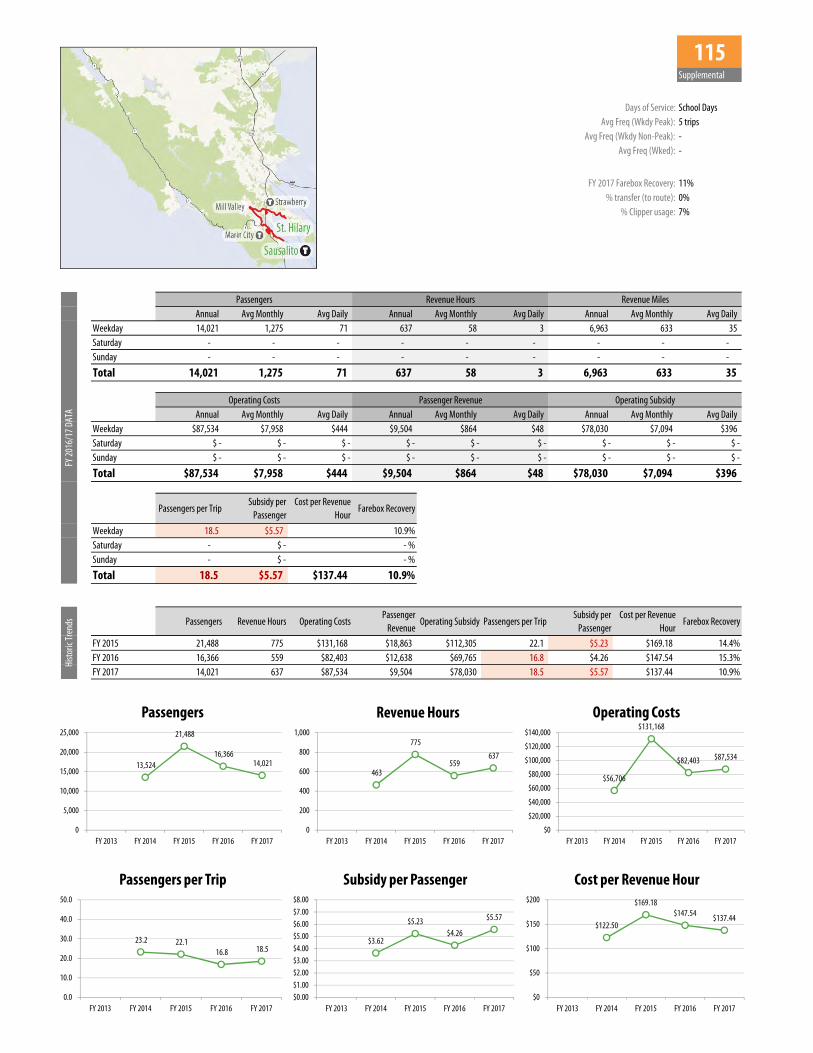
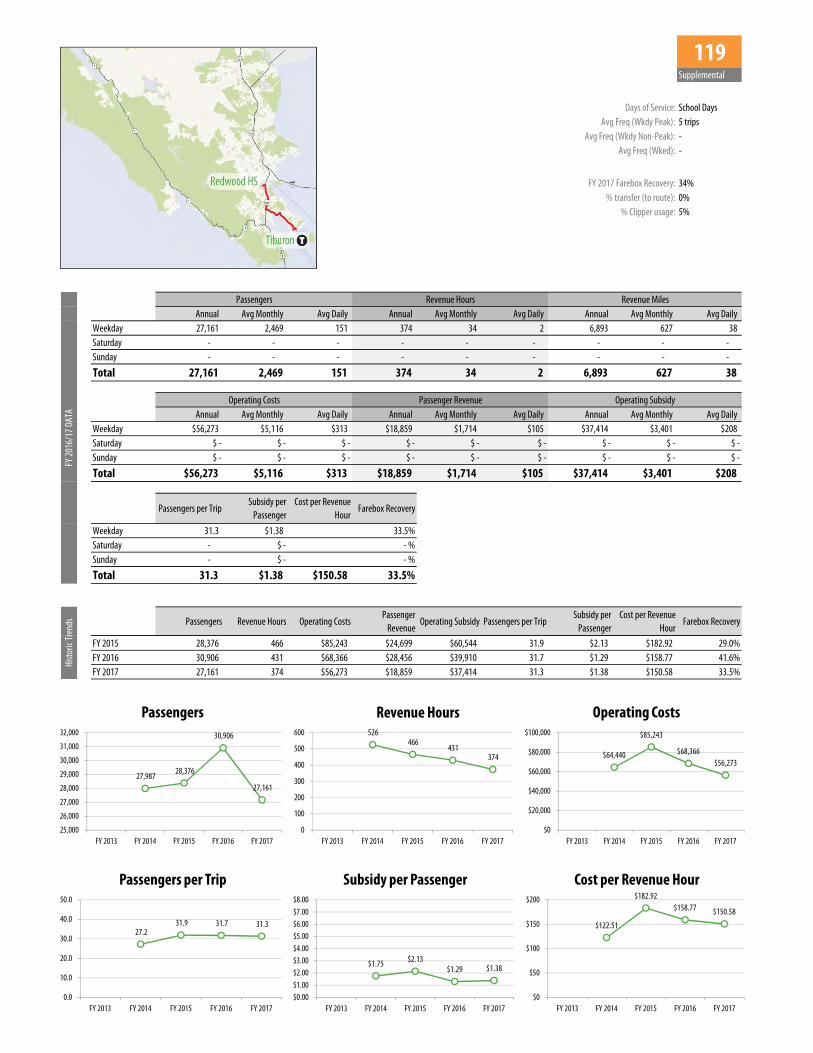
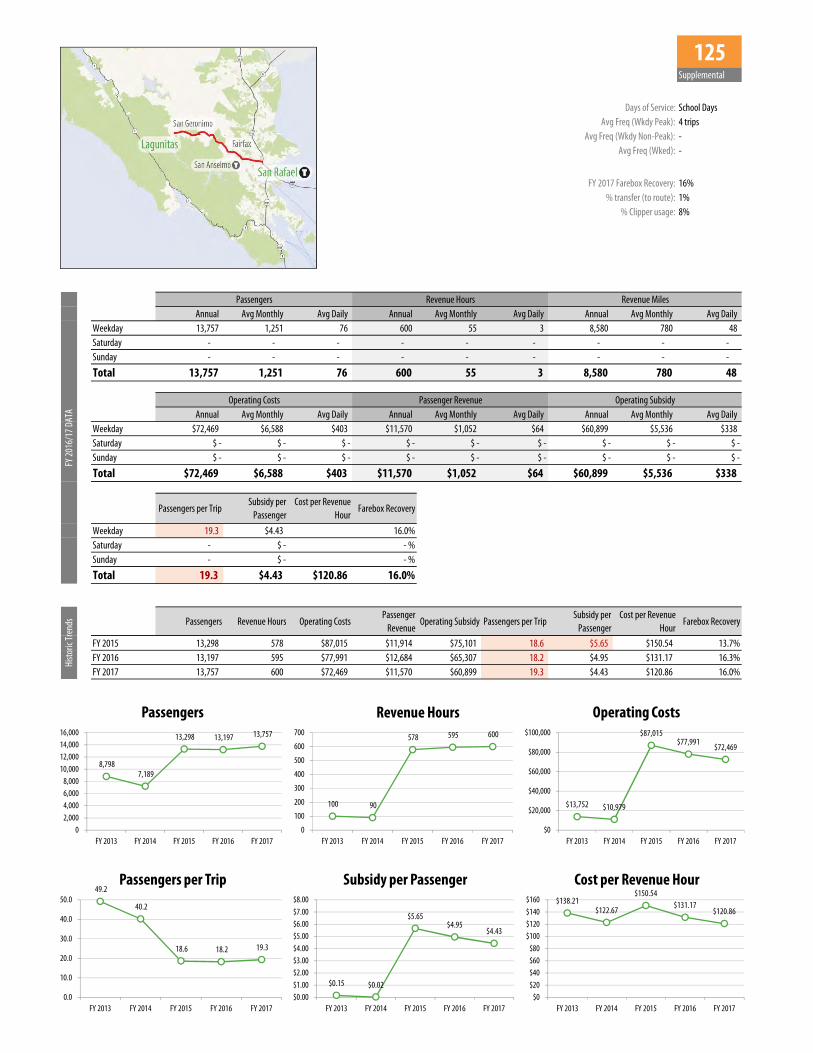
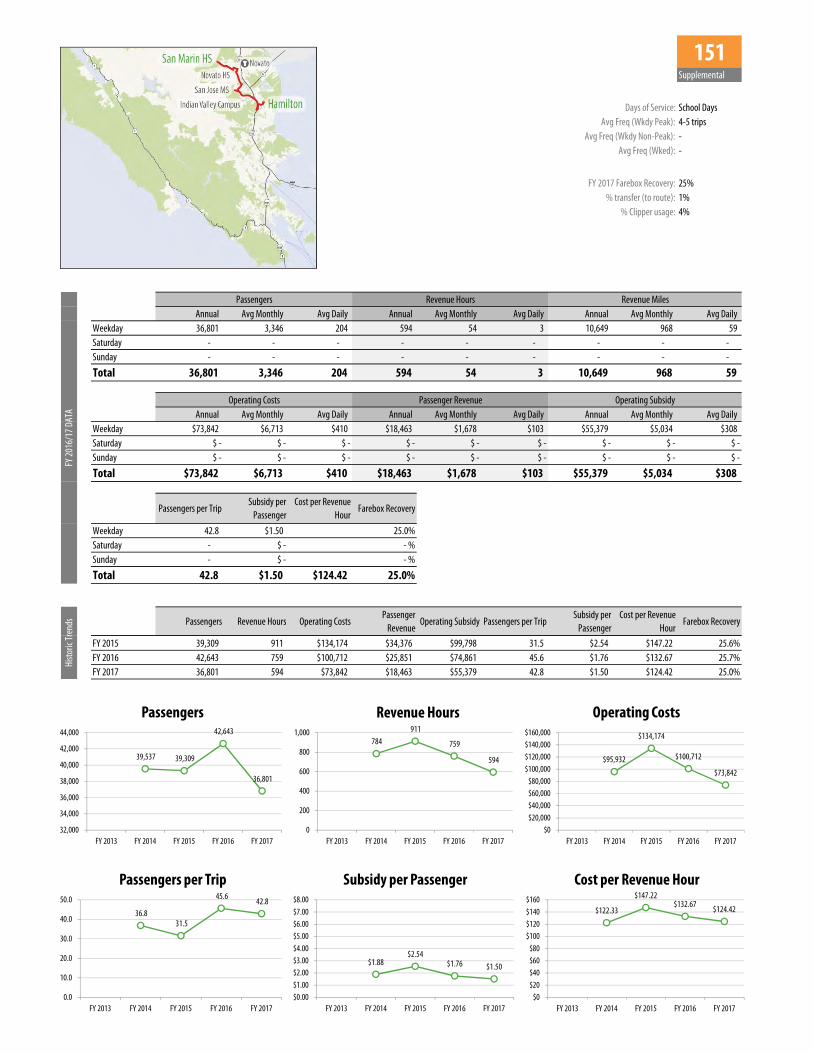
Supplemental 113 115 117 119 125 139 145 151 154 20 per trip $300
Rural 61 68 4 $1200
Recreational 66 (Muir Woods Shuttle) 25 $300
Demand Response Local DAR Novato DAR Dillon BeachTomales DAR Point Reyes DAR
2 $3000
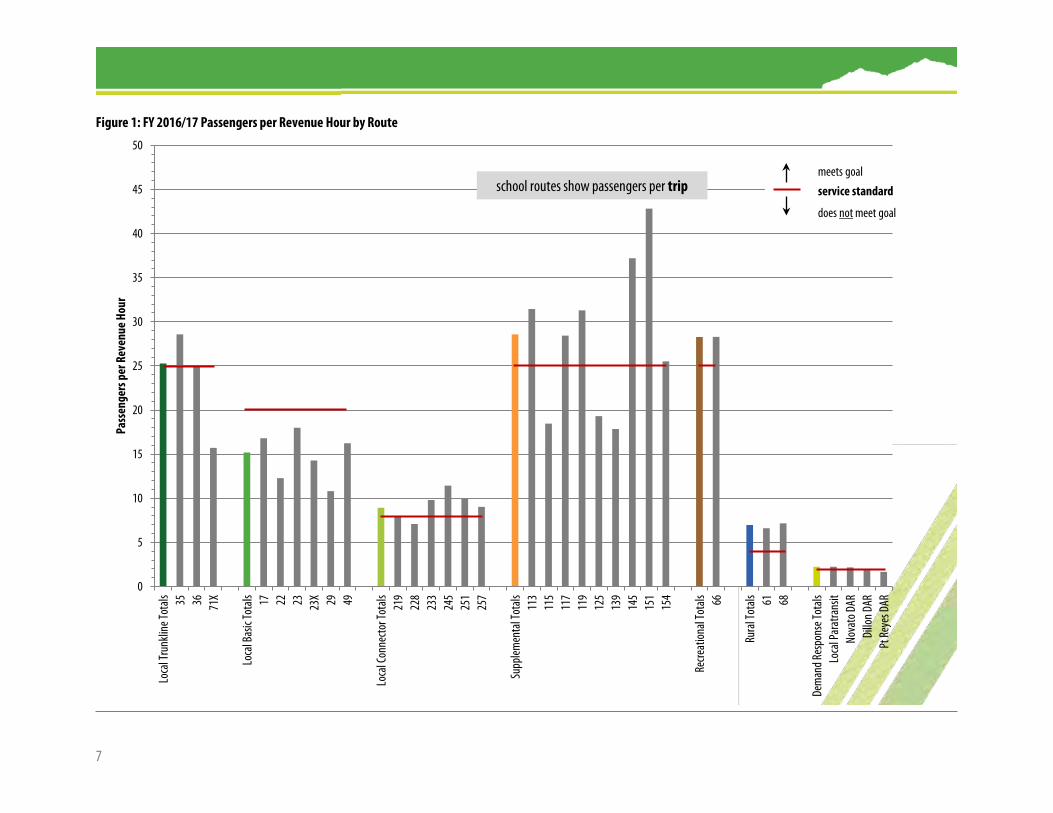
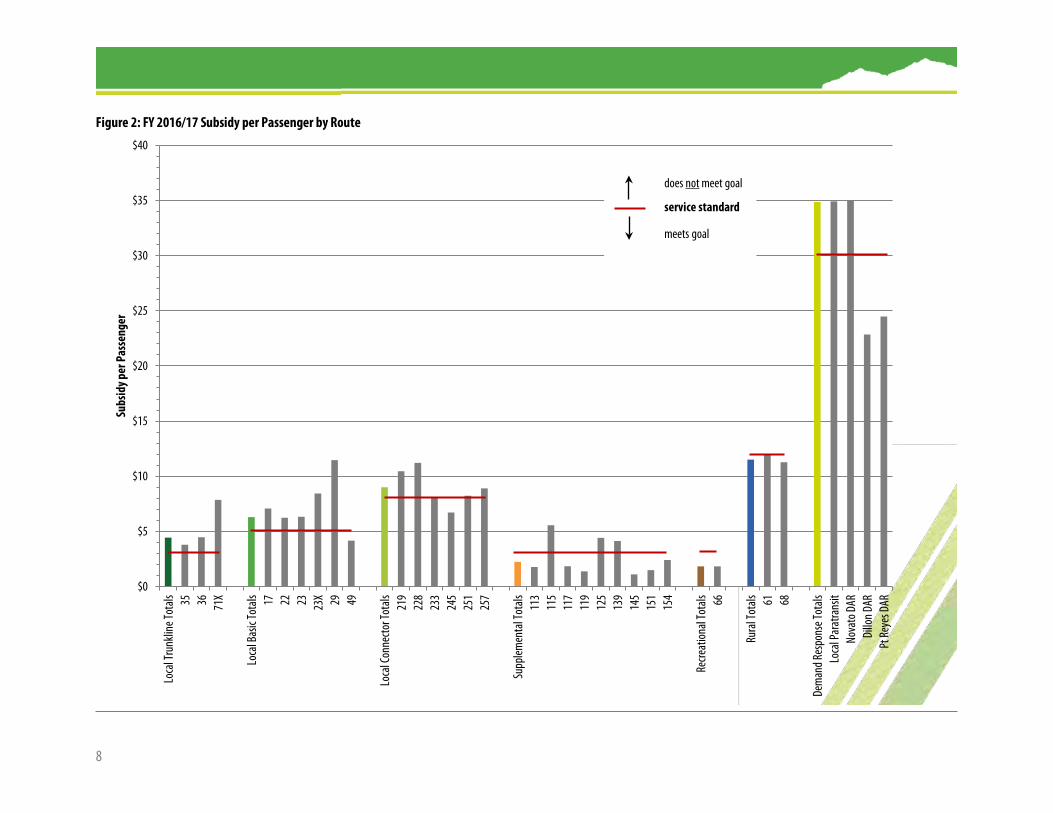
Using the productivity goals identified in Table 1 all the service typology groups except for Local Basic met their unlinked passengers per hour goal overall Twelve individual routes and two demand response services did not meet their productivity targets These include Routes 17 22 23 23X 29 49 71X 115 125 139 219 228 the Dillon BeachTomales Dial-A-Ride and the Point Reyes Dial-A-Ride In the previous fiscal year ten routes did not meet this target Figure 1 provides FY 201617 productivity levels and respective productivity goals by service typology and at the route level Route 35 was the most productive fixed-route service carrying an average of 286 passengers per hour Route 151 (Hamilton ndash San Jose MS ndash Novato HS - San Marin HS) was the best performing supplemental school route with 428 passengers per trip and met its subsidy target at $150 per passenger Route 228 had the highest growth in productivity (+291) due to the addition of weekday service in June 2016 In terms of cost effectiveness the Supplemental School Rural and Recreational services collectively met their goals In total 17 individual routes and two demand response services did not meet their subsidy target (Routes 17 22 23 23X 29 35 36 49 71X 219 228 233 251 257 115 125 139 Local Paratransit and Novato Dial-A-Ride) This is an increase from the 13 routes and three demand response services reported for FY 201516 Figure 2 provides a breakdown of FY 201617 subsidy levels and respective subsidy goals by service typology and at the individual route level Ridership Trends
In FY 201617 there was an overall 35 decline in fixed-route ridership compared to the previous year despite increases to service levels One of the major contributors to this decline was the delayed start of the 2017 Muir Woods Shuttle season that reduced the amount of service provided by 76 The overall decrease in ridership is relatively consistent with trends among bus operators nationwide and in the Bay Area According to the National Transit Database bus ridership declined 66 nationwide during FY 201617 compared to the prior year Within in the Bay Area peer agencies experienced ridership declines between 6 and 12 These include Golden Gate Transit Sonoma County Transit SamTrans and Napa VINE One of the biggest external factors that may have contributed to this trend is weather Rainfall in FY 201617 almost doubled over the prior year Weather can have a significant impact on travel decisions affecting whether a person makes a trip as well as how that person ultimately makes the trip It can also impact operations and cause detours major delays and canceled trips
4
In FY 201617 there was a 34 increase in the number of canceled trips Almost half of these canceled trips occurred in February due to heavy rains that caused flooding and school closures In June 2016 Marin Transit implemented a major service change One of the main goals of the service restructuring was to reduce the need to transfer by providing faster and more direct connections While this approach improves the system for riders it has implications in terms of how ridership is counted and on performance metrics The number of passengers is measured in terms of unlinked passenger trips Each time a person boards a bus is counted as a separate trip regardless of whether that person is transferring from another bus Reducing the amount of transfers needed to complete a riderrsquos journey reduces the number of unlinked trips Replacing trips that require a transfer with direct trips to destinations does not change the number of individual riders using the system which is defined as linked passenger trips In FY 201617 there was a 75 overall decrease in the number of transfers for passengers using cash to pay their original fare Some of this decline reflects the systemwide decrease in ridership The transfer ratio is defined as the number of boarding trips (unlinked passenger trips) divided by the number of originating trips (linked passenger trips) This ratio can be used to evaluate the impact of transfers on ridership independent of other factors In FY 201617 the overall transfer ratio dropped 38 from 136 to 131 When estimating linked passenger trips based on these ratios the number of individual Marin Transit passengers in FY 201617 remained relatively constant compared to last year Demand for Marin Access mobility management programs declined overall 47 from FY 201516 to FY 201617 Changes in ridership varied from program to program The largest decline was on Catch-A-Ride which experienced a 129 decrease in ridership Local paratransit and Novato Dial-A-Ride ridership may have been affected by many of the same external factors as fixed route transit particularly weather It is also possible that paratransit clients have started to shift some or all their trips to services that are not provided by Marin Transit These may include Non-Emergency Medical Transportation services arranged by managed care organizations Private transportation
providers hired under contract to institutions typically served by paratransit (such as adult day care centers) Trips taken on Uber or Lyft and Volunteer transportation services that may be supported by Marin Transit in some way but whose ridership is not
reported in the Districtrsquos performance statistics Furthermore staff attributed much of the previous growth in the Marin Access program to the Catch-A-Ride program This program experienced a 473 increase in ridership between FY 201314 and FY 201415 Towards the end of FY 201415 On the Move one of the largest taxi companies in Marin went out of business To this day service is limited during hours of peak demand and in certain service areas especially Novato Therefore FY 201617 ridership on Catch-A-Ride may reflect two factors These include a slowdown in attracting new customers and a reduction in service availability following On the Moversquos closure Table 2 summarizes the factors that can influence ridership numbers year-over-year and qualitatively evaluates their impact
5
Table 2 Factors Impacting Ridership Comparison
Factor FY 201516 FY 201617 Impact
Calendar
School Days 181 183 --
Weekdays 256 253
Weekends amp Holidays 110 111 --
Muir Woods Shuttle 113 104
Transfer Ratio (ratio of unlinked to linked trips) 136 131
Service Disruptions Canceled service (trips) 200 268
Major detourclosure (days) (1) 18 29
Rainfall (inches) 2928 5653
Gas Prices $298 $291 --
Unemployment Rate 32 32 -- Notes (1) Data on major detours and closure collected starting January 2016 Comparison includes the months of January through June FY 201718 Performance Outlook
In June 2016 Marin Transit implemented a major service change aimed in part to help underperforming routes meet established performance standards Staff has continued to monitor service performance and has made minor adjustments to improve on-time performance and cancel low-ridership trips In early 2018 staff is planning a comprehensive assessment of service performance since the June 2016 service changes This effort will include data from a recently completed onboard survey from April 2017 on passenger origins and destinations and a 100 passenger ridecheck The ridecheck will provide data on stop-level ridership activity for each route The assessment will use this analysis to recommend service changes to improve underperforming routes There are several unknowns that may also affect route performance primarily in terms of operating costs The District relies on its contractors to either lease or own property to store and maintain the vehicles needed to operate service For contractors that do not own suitable property finding and leasing these types of facilities in Marin County is challenging and expensive Recent surveys of current and potential service providers identified securing a facility as the most significant factor in determining their interest in bidding on Marin Transit services ability to provide the service and proposed pricing Marin Transit has been actively working to secure and develop its own operations and maintenance facility A District-owned facility will eliminate the need for potential service providers to lease property and lower operating costs It may also improve efficiency by reducing deadhead or non-revenue time when vehicles are traveling to and from the yard and further lower the Districtrsquos contract rates In late 2017 Marin Transit will release for bid over half of its fixed-route service and there are many uncertainties that may affect the outcome The tight labor market in Marin County and the greater Bay Area has made it difficult for service providers to hire and retain employees Potential contractors are required to secure property in a County with limited real estate opportunities If the District provides its own facility there will be more interest among potential bidders and more competitive rates
6
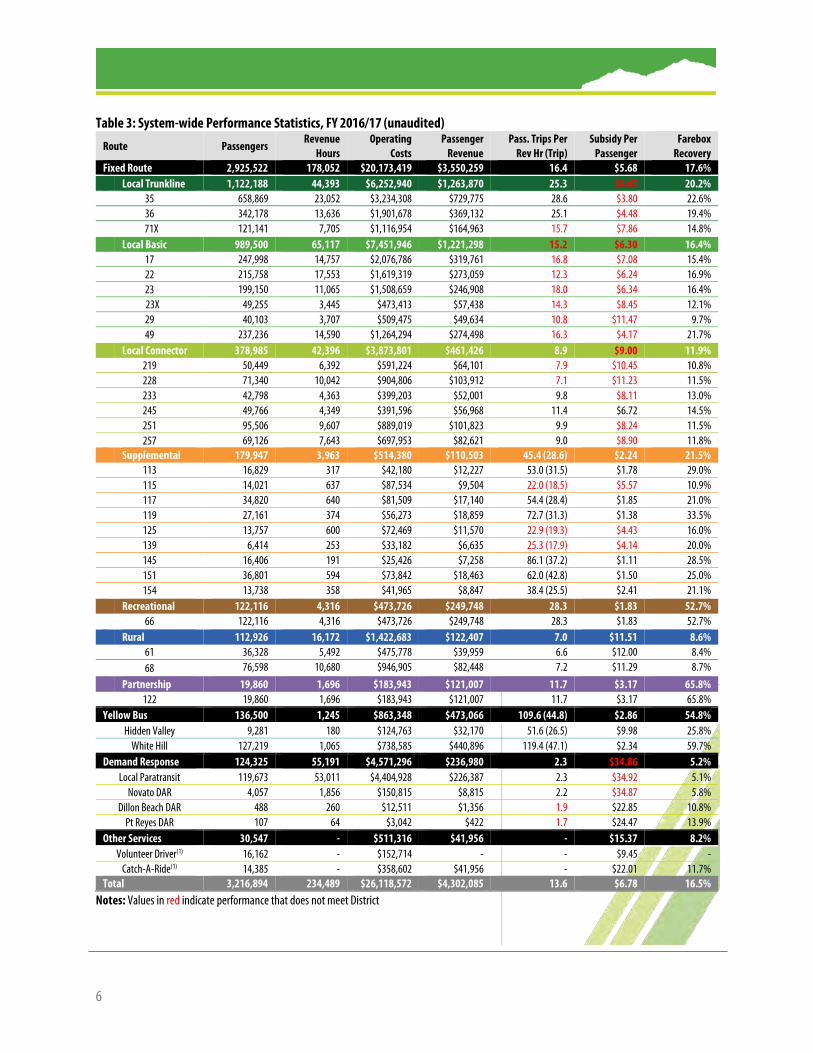
Table 3 System-wide Performance Statistics FY 201617 (unaudited)
Route Passengers Revenue
Hours Operating
Costs Passenger
Revenue Pass Trips Per
Rev Hr (Trip) Subsidy Per
Passenger Farebox
Recovery Fixed Route 2925522 178052 $20173419 $3550259 164 $568 176 Local Trunkline 1122188 44393 $6252940 $1263870 253 $445 202
35 658869 23052 $3234308 $729775 286 $380 226 36 342178 13636 $1901678 $369132 251 $448 194
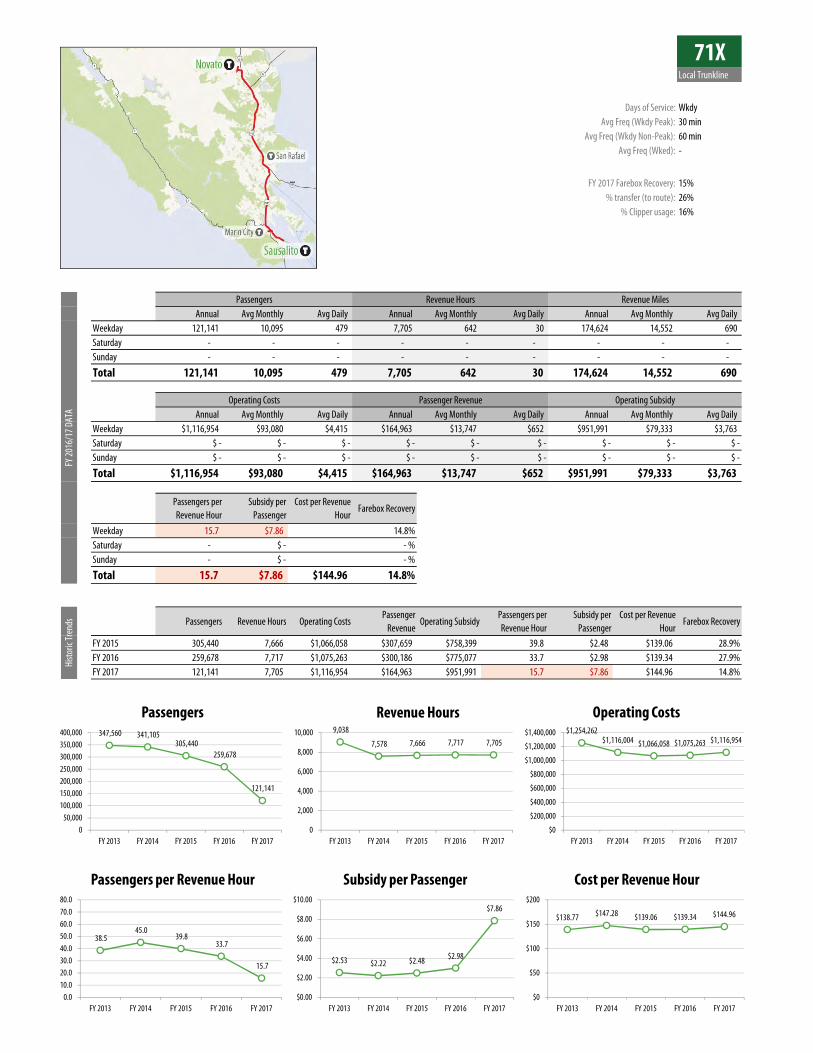
71X 121141 7705 $1116954 $164963 157 $786 148 Local Basic 989500 65117 $7451946 $1221298 152 $630 164
17 247998 14757 $2076786 $319761 168 $708 154 22 215758 17553 $1619319 $273059 123 $624 169 23 199150 11065 $1508659 $246908 180 $634 164
23X 49255 3445 $473413 $57438 143 $845 121 29 40103 3707 $509475 $49634 108 $1147 97 49 237236 14590 $1264294 $274498 163 $417 217
Local Connector 378985 42396 $3873801 $461426 89 $900 119 219 50449 6392 $591224 $64101 79 $1045 108 228 71340 10042 $904806 $103912 71 $1123 115 233 42798 4363 $399203 $52001 98 $811 130 245 49766 4349 $391596 $56968 114 $672 145 251 95506 9607 $889019 $101823 99 $824 115 257 69126 7643 $697953 $82621 90 $890 118
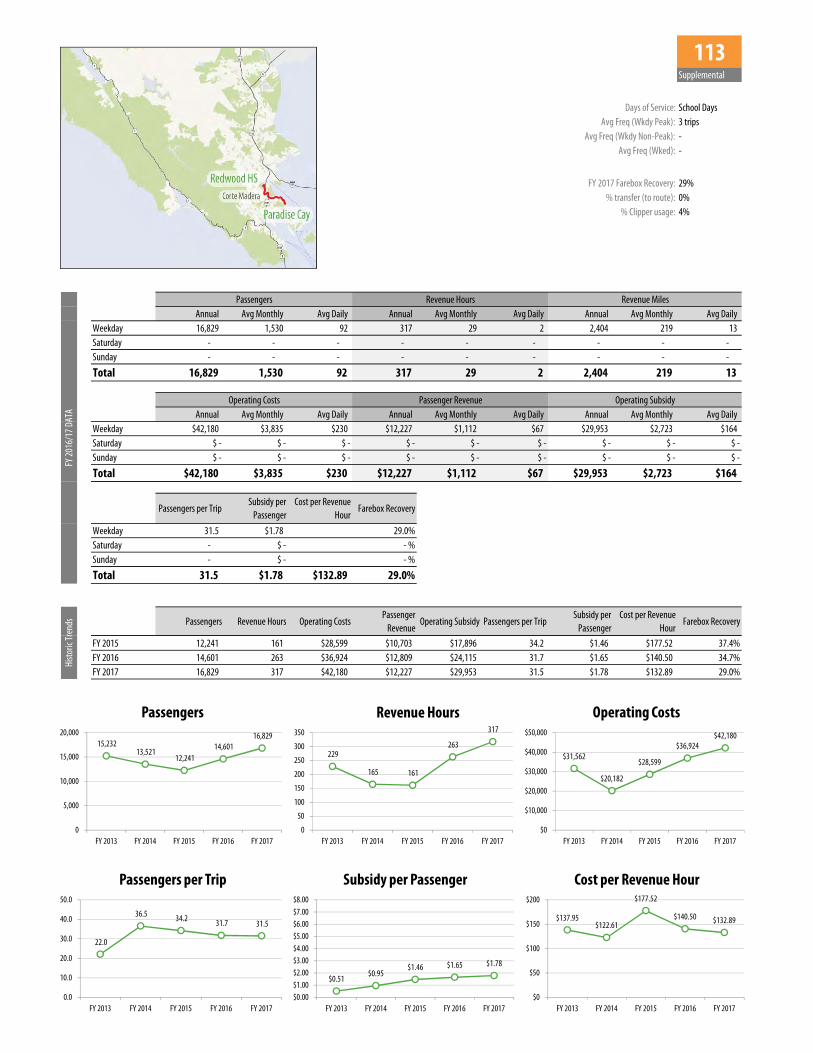
Supplemental 179947 3963 $514380 $110503 454 (286) $224 215 113 16829 317 $42180 $12227 530 (315) $178 290 115 14021 637 $87534 $9504 220 (185) $557 109 117 34820 640 $81509 $17140 544 (284) $185 210 119 27161 374 $56273 $18859 727 (313) $138 335 125 13757 600 $72469 $11570 229 (193) $443 160 139 6414 253 $33182 $6635 253 (179) $414 200 145 16406 191 $25426 $7258 861 (372) $111 285 151 36801 594 $73842 $18463 620 (428) $150 250 154 13738 358 $41965 $8847 384 (255) $241 211
Recreational 122116 4316 $473726 $249748 283 $183 527 66 122116 4316 $473726 $249748 283 $183 527
Rural 112926 16172 $1422683 $122407 70 $1151 86 61 36328 5492 $475778 $39959 66 $1200 84 68 76598 10680 $946905 $82448 72 $1129 87
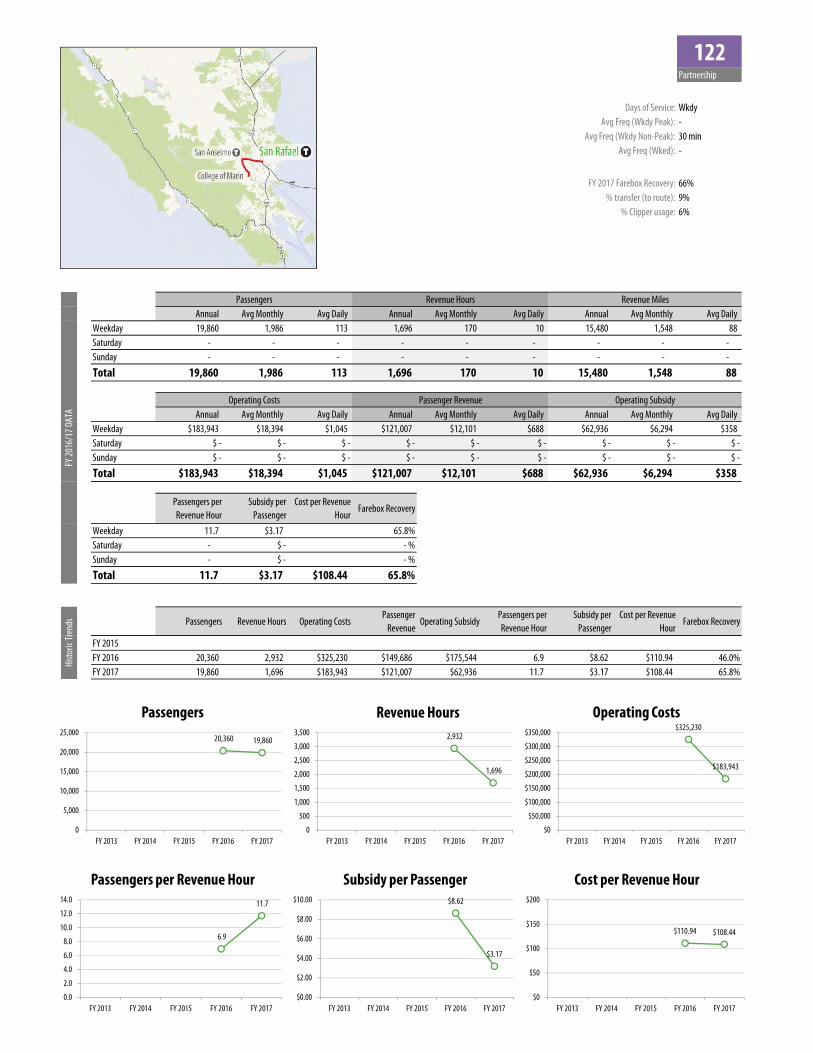
Partnership 19860 1696 $183943 $121007 117 $317 658 122 19860 1696 $183943 $121007 117 $317 658
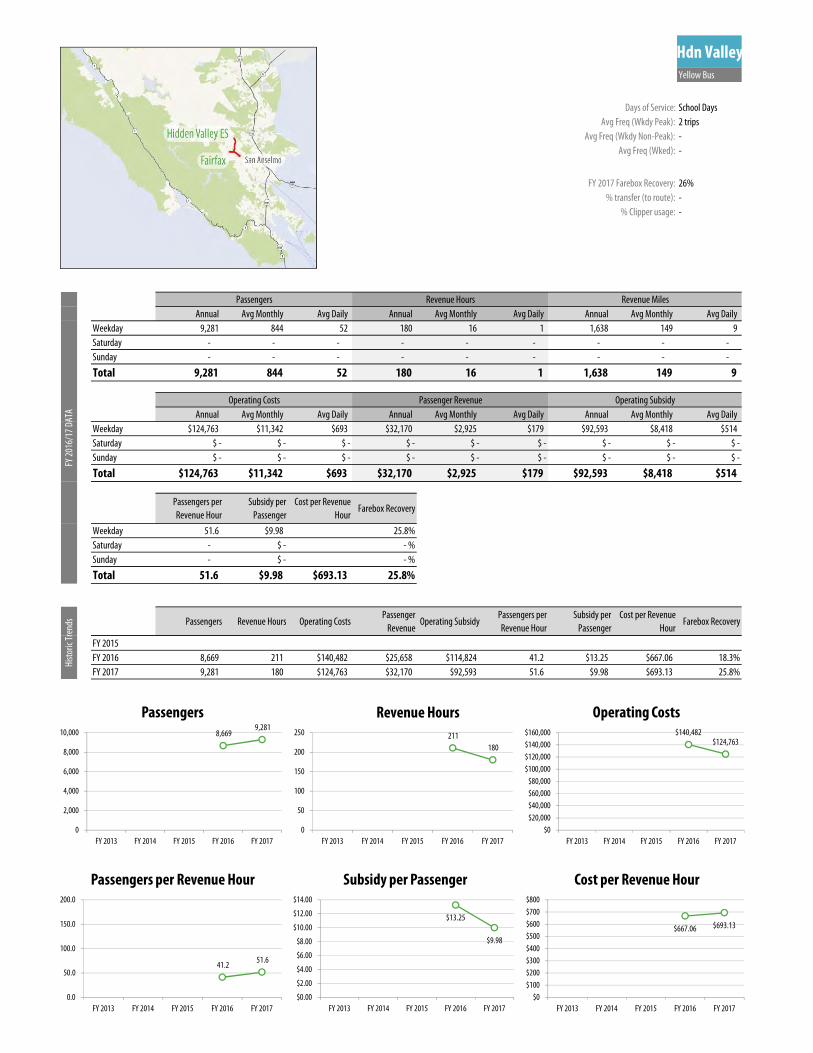
Yellow Bus 136500 1245 $863348 $473066 1096 (448) $286 548 Hidden Valley 9281 180 $124763 $32170 516 (265) $998 258
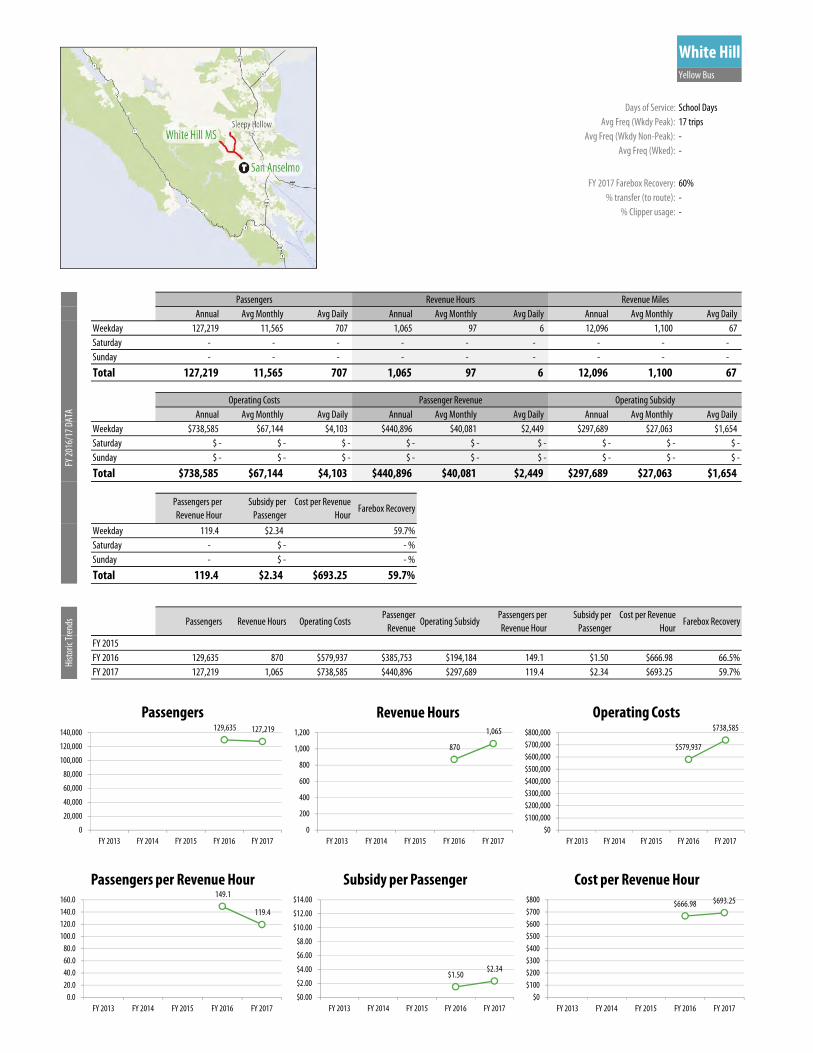
White Hill 127219 1065 $738585 $440896 1194 (471) $234 597 Demand Response 124325 55191 $4571296 $236980 23 $3486 52
Local Paratransit 119673 53011 $4404928 $226387 23 $3492 51 Novato DAR 4057 1856 $150815 $8815 22 $3487 58
Dillon Beach DAR 488 260 $12511 $1356 19 $2285 108 Pt Reyes DAR 107 64 $3042 $422 17 $2447 139
Other Services 30547 - $511316 $41956 - $1537 82 Volunteer Driver(1) 16162 - $152714 - - $945 -
Catch-A-Ride(1) 14385 - $358602 $41956 - $2201 117 Total 3216894 234489 $26118572 $4302085 136 $678 165
Notes Values in red indicate performance that does not meet District
7
Figure 1 FY 201617 Passengers per Revenue Hour by Route
0
5
10
15
20
25
30
35
40
45
50Lo
cal T
runk
line T
otals 35 36 71
X
Loca
l Bas
ic To
tals 17 22 23 23X 29 49
Loca
l Con
necto
r Tot
als 219
228
233
245
251
257
Supp
lemen
tal T
otals 11
311
511
711
912
513
914
515
115
4
Recre
ation
al To
tals 66
Rura
l Tot
als 61 68
Dem
and R
espo
nse T
otals
Loca
l Par
atra
nsit
Nova
to D
ARDi
llon D
ARPt
Reye
s DAR
Pass
enge
rs p
er R
even
ue H
our
meets goalservice standard
does not meet goal
school routes show passengers per trip
8
Figure 2 FY 201617 Subsidy per Passenger by Route
$0
$5
$10
$15
$20
$25
$30
$35
$40
Loca
l Tru
nklin
e Tot
als 35 36 71X
Loca
l Bas
ic To
tals 17 22 23 23X 29 49
Loca
l Con
necto
r Tot
als 219
228
233
245
251
257
Supp
lemen
tal T
otals 11
311
511
711
912
513
914
515
115
4
Recre
ation
al To
tals 66
Rura
l Tot
als 61 68
Dem
and R
espo
nse T
otals
Loca
l Par
atra
nsit
Nova
to D
ARDi
llon D
ARPt
Reye
s DAR
Subs
idy p
er P
asse
nger
does not meet goal
service standard
meets goal
9
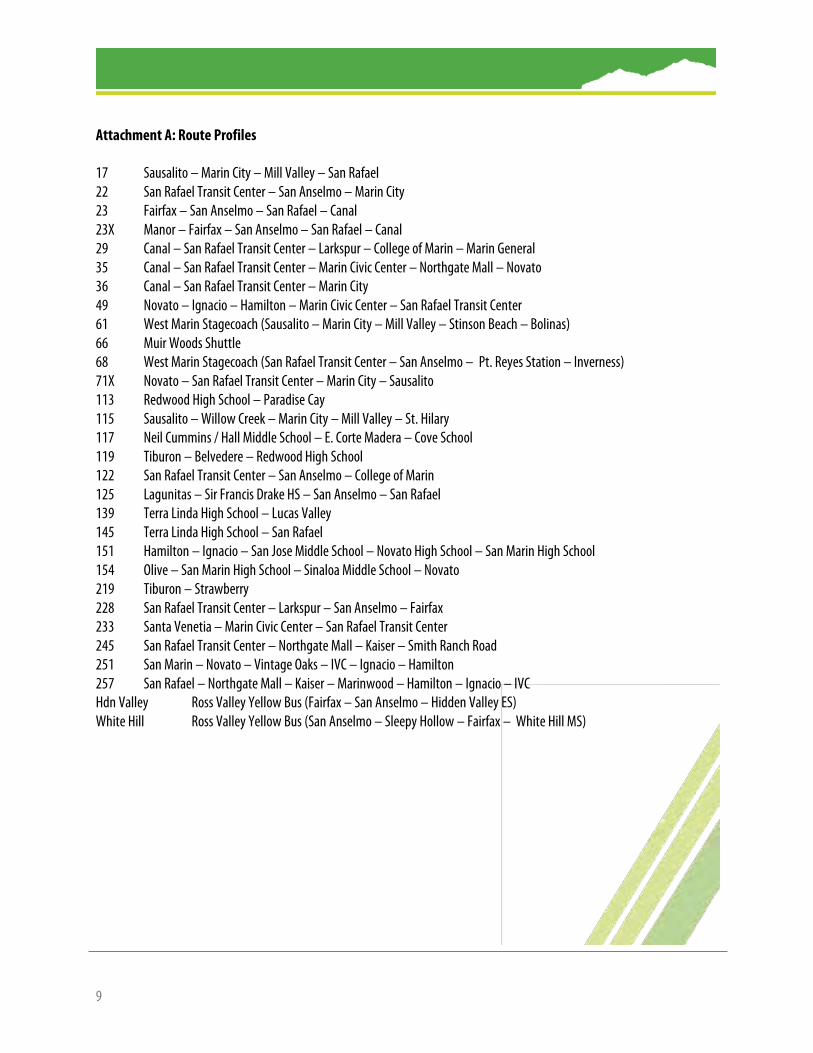
Attachment A Route Profiles 17 Sausalito ndash Marin City ndash Mill Valley ndash San Rafael 22 San Rafael Transit Center ndash San Anselmo ndash Marin City 23 Fairfax ndash San Anselmo ndash San Rafael ndash Canal 23X Manor ndash Fairfax ndash San Anselmo ndash San Rafael ndash Canal 29 Canal ndash San Rafael Transit Center ndash Larkspur ndash College of Marin ndash Marin General 35 Canal ndash San Rafael Transit Center ndash Marin Civic Center ndash Northgate Mall ndash Novato 36 Canal ndash San Rafael Transit Center ndash Marin City 49 Novato ndash Ignacio ndash Hamilton ndash Marin Civic Center ndash San Rafael Transit Center 61 West Marin Stagecoach (Sausalito ndash Marin City ndash Mill Valley ndash Stinson Beach ndash Bolinas) 66 Muir Woods Shuttle 68 West Marin Stagecoach (San Rafael Transit Center ndash San Anselmo ndash Pt Reyes Station ndash Inverness) 71X Novato ndash San Rafael Transit Center ndash Marin City ndash Sausalito 113 Redwood High School ndash Paradise Cay 115 Sausalito ndash Willow Creek ndash Marin City ndash Mill Valley ndash St Hilary 117 Neil Cummins Hall Middle School ndash E Corte Madera ndash Cove School 119 Tiburon ndash Belvedere ndash Redwood High School 122 San Rafael Transit Center ndash San Anselmo ndash College of Marin 125 Lagunitas ndash Sir Francis Drake HS ndash San Anselmo ndash San Rafael 139 Terra Linda High School ndash Lucas Valley 145 Terra Linda High School ndash San Rafael 151 Hamilton ndash Ignacio ndash San Jose Middle School ndash Novato High School ndash San Marin High School 154 Olive ndash San Marin High School ndash Sinaloa Middle School ndash Novato 219 Tiburon ndash Strawberry 228 San Rafael Transit Center ndash Larkspur ndash San Anselmo ndash Fairfax 233 Santa Venetia ndash Marin Civic Center ndash San Rafael Transit Center 245 San Rafael Transit Center ndash Northgate Mall ndash Kaiser ndash Smith Ranch Road 251 San Marin ndash Novato ndash Vintage Oaks ndash IVC ndash Ignacio ndash Hamilton 257 San Rafael ndash Northgate Mall ndash Kaiser ndash Marinwood ndash Hamilton ndash Ignacio ndash IVC Hdn Valley Ross Valley Yellow Bus (Fairfax ndash San Anselmo ndash Hidden Valley ES) White Hill Ross Valley Yellow Bus (San Anselmo ndash Sleepy Hollow ndash Fairfax ndash White Hill MS)
17Local Basic
Days of Service Wkdy Sa SuAvg Freq (Wkdy Peak) 30 min
Avg Freq (Wkdy Non-Peak) 60 minAvg Freq (Wked) 60 min
FY 2017 Farebox Recovery 15 transfer (to route) 25
Clipper usage 16
Annual Avg Monthly Avg Daily Annual Avg Monthly Avg Daily Annual Avg Monthly Avg DailyWeekday 194263 16189 768 11496 958 45 177386 14782 701 Saturday 27564 2297 530 1541 128 30 24621 2052 473 Sunday 26171 2181 436 1720 143 29 27378 2282 456
Total 247998 20667 679 14757 1230 40 229385 19115 628
Annual Avg Monthly Avg Daily Annual Avg Monthly Avg Daily Annual Avg Monthly Avg DailyWeekday $1617108 $134759 $6392 $247041 $20587 $976 $1370067 $114172 $5415Saturday $217536 $18128 $4183 $36894 $3075 $710 $180642 $15054 $3474Sunday $242142 $20179 $4036 $35826 $2986 $597 $206316 $17193 $3439
Total $2076786 $173066 $5690 $319761 $26647 $876 $1757025 $146419 $4814
Passengers per Revenue Hour
Subsidy per Passenger
Cost per Revenue Hour
Farebox Recovery
Weekday 169 $705 $14067 153Saturday 179 $655 $14117 170Sunday 152 $788 $14078 148
Total 168 $708 $14073 154
Passengers Revenue Hours Operating CostsPassenger
RevenueOperating Subsidy
Passengers per Revenue Hour
Subsidy per Passenger
Cost per Revenue Hour
Farebox Recovery
FY 2015 301136 15167 $2108822 $340410 $1768412 199 $587 $13904 161FY 2016 280486 15330 $2041616 $302337 $1739279 183 $620 $13317 148FY 2017 247998 14757 $2076786 $319761 $1757025 168 $708 $14073 154
Histo
ric Tr
ends
FY 20
161
7 DAT
A
Passengers Revenue Hours Revenue Miles
Operating Costs Passenger Revenue Operating Subsidy
277892 322826
301136 280486
247998
0
50000
100000
150000
200000
250000
300000
350000
FY 2013 FY 2014 FY 2015 FY 2016 FY 2017
Passengers
12402 14818 15167 15330 14757
0
5000
10000
15000
20000
FY 2013 FY 2014 FY 2015 FY 2016 FY 2017
Revenue Hours
$1717002
$2179526 $2108822 $2041616 $2076786
$0
$500000
$1000000
$1500000
$2000000
$2500000
FY 2013 FY 2014 FY 2015 FY 2016 FY 2017
Operating Costs
224 218 199 183 168
00
50
100
150
200
250
300
FY 2013 FY 2014 FY 2015 FY 2016 FY 2017
Passengers per Revenue Hour
$504 $558 $587 $620 $708
$000$200$400$600$800
$1000$1200$1400
FY 2013 FY 2014 FY 2015 FY 2016 FY 2017
Subsidy per Passenger
$13845 $14709 $13904 $13317 $14073
$0
$50
$100
$150
$200
FY 2013 FY 2014 FY 2015 FY 2016 FY 2017
Cost per Revenue Hour
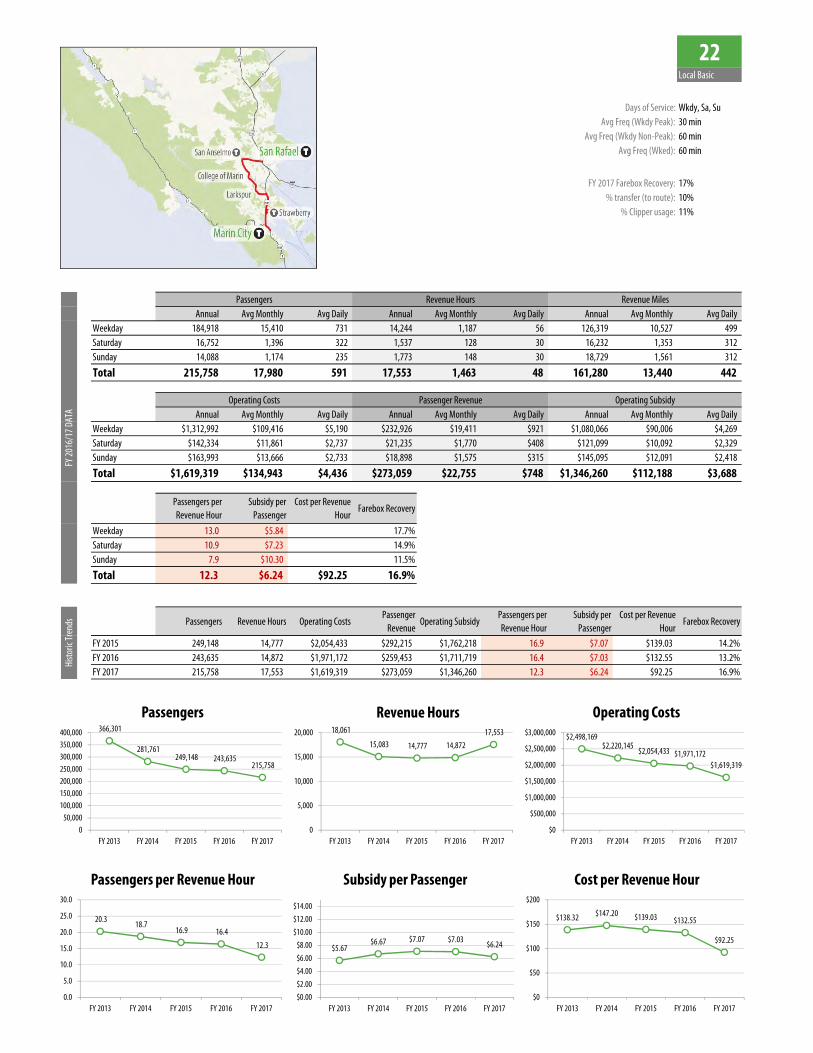
22Local Basic
Days of Service Wkdy Sa SuAvg Freq (Wkdy Peak) 30 min
Avg Freq (Wkdy Non-Peak) 60 minAvg Freq (Wked) 60 min
FY 2017 Farebox Recovery 17 transfer (to route) 10
Clipper usage 11
Annual Avg Monthly Avg Daily Annual Avg Monthly Avg Daily Annual Avg Monthly Avg DailyWeekday 184918 15410 731 14244 1187 56 126319 10527 499 Saturday 16752 1396 322 1537 128 30 16232 1353 312 Sunday 14088 1174 235 1773 148 30 18729 1561 312
Total 215758 17980 591 17553 1463 48 161280 13440 442
Annual Avg Monthly Avg Daily Annual Avg Monthly Avg Daily Annual Avg Monthly Avg DailyWeekday $1312992 $109416 $5190 $232926 $19411 $921 $1080066 $90006 $4269Saturday $142334 $11861 $2737 $21235 $1770 $408 $121099 $10092 $2329Sunday $163993 $13666 $2733 $18898 $1575 $315 $145095 $12091 $2418
Total $1619319 $134943 $4436 $273059 $22755 $748 $1346260 $112188 $3688
Passengers per Revenue Hour
Subsidy per Passenger
Cost per Revenue Hour
Farebox Recovery
Weekday 130 $584 $9218 177Saturday 109 $723 $9263 149Sunday 79 $1030 $9251 115
Total 123 $624 $9225 169
Passengers Revenue Hours Operating CostsPassenger
RevenueOperating Subsidy
Passengers per Revenue Hour
Subsidy per Passenger
Cost per Revenue Hour
Farebox Recovery
FY 2015 249148 14777 $2054433 $292215 $1762218 169 $707 $13903 142FY 2016 243635 14872 $1971172 $259453 $1711719 164 $703 $13255 132FY 2017 215758 17553 $1619319 $273059 $1346260 123 $624 $9225 169
Histo
ric Tr
ends
FY 20
161
7 DAT
A
Passengers Revenue Hours Revenue Miles
Operating Costs Passenger Revenue Operating Subsidy
366301
281761 249148 243635
215758
050000
100000150000200000250000300000350000400000
FY 2013 FY 2014 FY 2015 FY 2016 FY 2017
Passengers18061
15083 14777 14872 17553
0
5000
10000
15000
20000
FY 2013 FY 2014 FY 2015 FY 2016 FY 2017
Revenue Hours$2498169
$2220145 $2054433 $1971172
$1619319
$0
$500000
$1000000
$1500000
$2000000
$2500000
$3000000
FY 2013 FY 2014 FY 2015 FY 2016 FY 2017
Operating Costs
203 187 169 164
123
00
50
100
150
200
250
300
FY 2013 FY 2014 FY 2015 FY 2016 FY 2017
Passengers per Revenue Hour
$567 $667 $707 $703 $624
$000$200$400$600$800
$1000$1200$1400
FY 2013 FY 2014 FY 2015 FY 2016 FY 2017
Subsidy per Passenger
$13832 $14720 $13903 $13255
$9225
$0
$50
$100
$150
$200
FY 2013 FY 2014 FY 2015 FY 2016 FY 2017
Cost per Revenue Hour
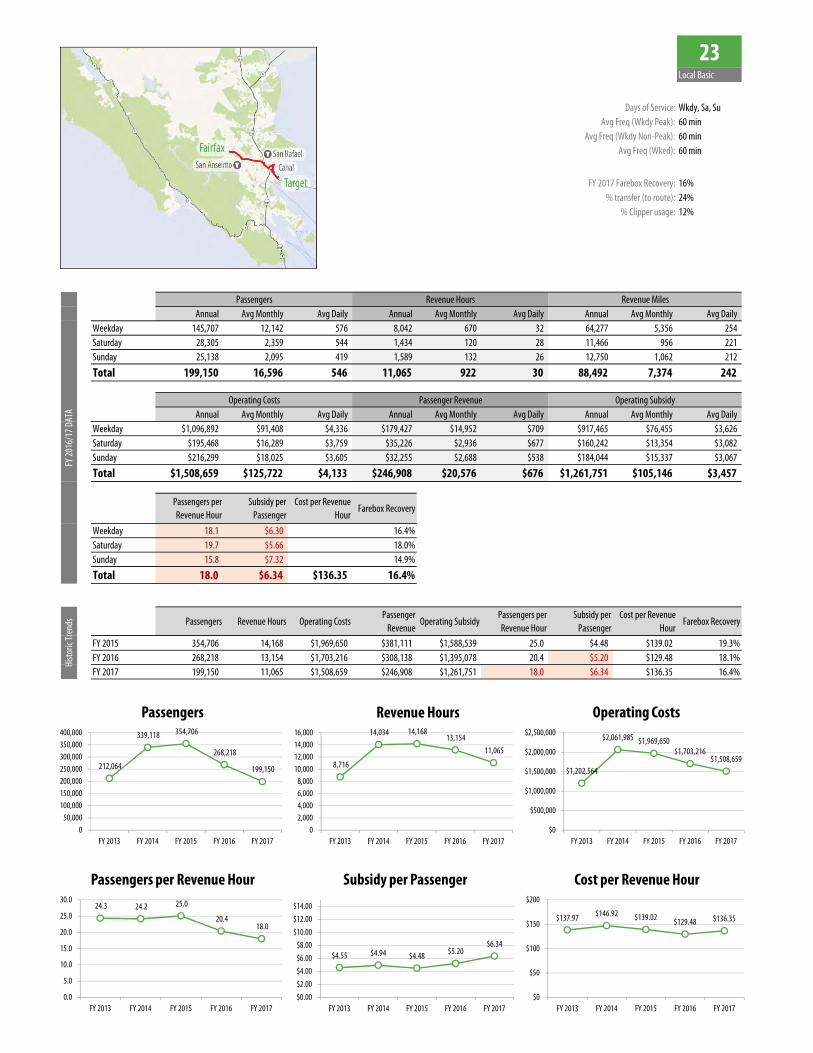
23Local Basic
Days of Service Wkdy Sa SuAvg Freq (Wkdy Peak) 60 min
Avg Freq (Wkdy Non-Peak) 60 minAvg Freq (Wked) 60 min
FY 2017 Farebox Recovery 16 transfer (to route) 24
Clipper usage 12
Annual Avg Monthly Avg Daily Annual Avg Monthly Avg Daily Annual Avg Monthly Avg DailyWeekday 145707 12142 576 8042 670 32 64277 5356 254 Saturday 28305 2359 544 1434 120 28 11466 956 221 Sunday 25138 2095 419 1589 132 26 12750 1062 212
Total 199150 16596 546 11065 922 30 88492 7374 242
Annual Avg Monthly Avg Daily Annual Avg Monthly Avg Daily Annual Avg Monthly Avg DailyWeekday $1096892 $91408 $4336 $179427 $14952 $709 $917465 $76455 $3626Saturday $195468 $16289 $3759 $35226 $2936 $677 $160242 $13354 $3082Sunday $216299 $18025 $3605 $32255 $2688 $538 $184044 $15337 $3067
Total $1508659 $125722 $4133 $246908 $20576 $676 $1261751 $105146 $3457
Passengers per Revenue Hour
Subsidy per Passenger
Cost per Revenue Hour
Farebox Recovery
Weekday 181 $630 $13640 164Saturday 197 $566 $13629 180Sunday 158 $732 $13612 149
Total 180 $634 $13635 164
Passengers Revenue Hours Operating CostsPassenger
RevenueOperating Subsidy
Passengers per Revenue Hour
Subsidy per Passenger
Cost per Revenue Hour
Farebox Recovery
FY 2015 354706 14168 $1969650 $381111 $1588539 250 $448 $13902 193FY 2016 268218 13154 $1703216 $308138 $1395078 204 $520 $12948 181FY 2017 199150 11065 $1508659 $246908 $1261751 180 $634 $13635 164
Histo
ric Tr
ends
FY 20
161
7 DAT
A
Passengers Revenue Hours Revenue Miles
Operating Costs Passenger Revenue Operating Subsidy
212064
339118 354706
268218
199150
050000
100000150000200000250000300000350000400000
FY 2013 FY 2014 FY 2015 FY 2016 FY 2017
Passengers
8716
14034 14168 13154
11065
02000400060008000
10000120001400016000
FY 2013 FY 2014 FY 2015 FY 2016 FY 2017
Revenue Hours
$1202564
$2061985 $1969650 $1703216
$1508659
$0
$500000
$1000000
$1500000
$2000000
$2500000
FY 2013 FY 2014 FY 2015 FY 2016 FY 2017
Operating Costs
243 242 250
204 180
00
50
100
150
200
250
300
FY 2013 FY 2014 FY 2015 FY 2016 FY 2017
Passengers per Revenue Hour
$455 $494 $448 $520 $634
$000$200$400$600$800
$1000$1200$1400
FY 2013 FY 2014 FY 2015 FY 2016 FY 2017
Subsidy per Passenger
$13797 $14692 $13902 $12948 $13635
$0
$50
$100
$150
$200
FY 2013 FY 2014 FY 2015 FY 2016 FY 2017
Cost per Revenue Hour
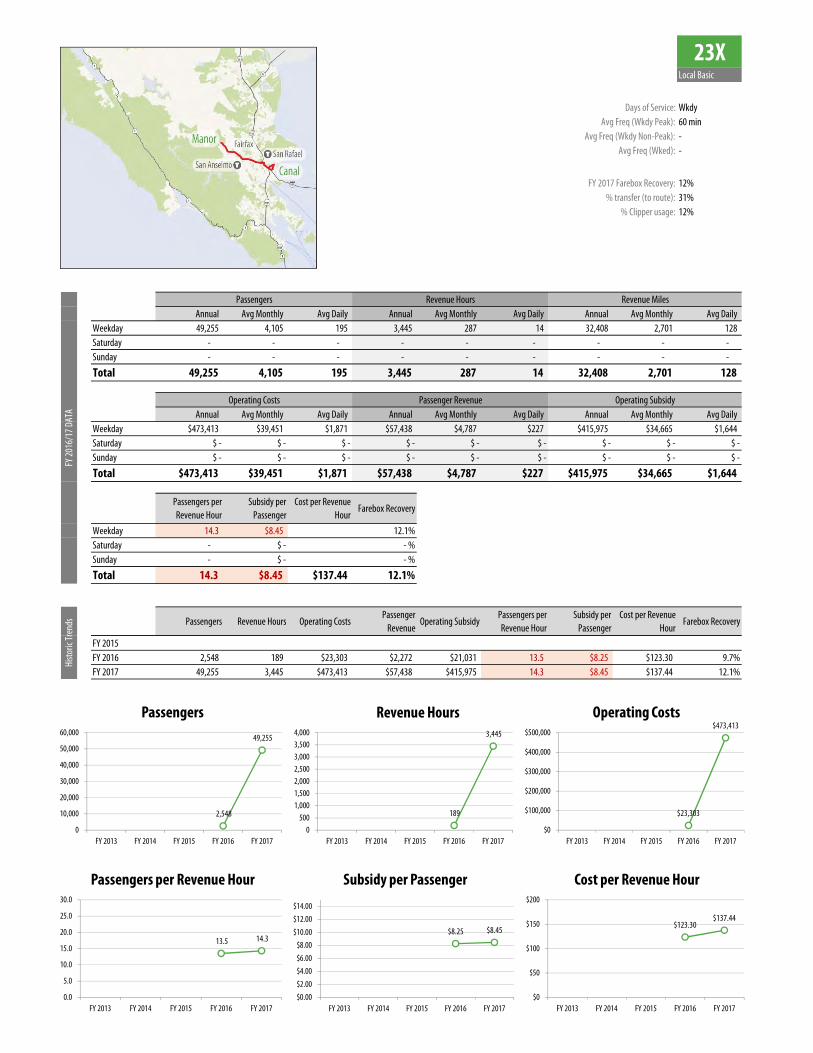
23XLocal Basic
Days of Service WkdyAvg Freq (Wkdy Peak) 60 min
Avg Freq (Wkdy Non-Peak) -Avg Freq (Wked) -
FY 2017 Farebox Recovery 12 transfer (to route) 31
Clipper usage 12
Annual Avg Monthly Avg Daily Annual Avg Monthly Avg Daily Annual Avg Monthly Avg DailyWeekday 49255 4105 195 3445 287 14 32408 2701 128 Saturday - - - - - - - - - Sunday - - - - - - - - -
Total 49255 4105 195 3445 287 14 32408 2701 128
Annual Avg Monthly Avg Daily Annual Avg Monthly Avg Daily Annual Avg Monthly Avg DailyWeekday $473413 $39451 $1871 $57438 $4787 $227 $415975 $34665 $1644Saturday $ - $ - $ - $ - $ - $ - $ - $ - $ -Sunday $ - $ - $ - $ - $ - $ - $ - $ - $ -
Total $473413 $39451 $1871 $57438 $4787 $227 $415975 $34665 $1644
Passengers per Revenue Hour
Subsidy per Passenger
Cost per Revenue Hour
Farebox Recovery
Weekday 143 $845 $13744 121Saturday - $ - $ - - Sunday - $ - $ - -
Total 143 $845 $13744 121
Passengers Revenue Hours Operating CostsPassenger
RevenueOperating Subsidy
Passengers per Revenue Hour
Subsidy per Passenger
Cost per Revenue Hour
Farebox Recovery
FY 2015FY 2016 2548 189 $23303 $2272 $21031 135 $825 $12330 97FY 2017 49255 3445 $473413 $57438 $415975 143 $845 $13744 121
Histo
ric Tr
ends
FY 20
161
7 DAT
A
Passengers Revenue Hours Revenue Miles
Operating Costs Passenger Revenue Operating Subsidy
2548
49255
0
10000
20000
30000
40000
50000
60000
FY 2013 FY 2014 FY 2015 FY 2016 FY 2017
Passengers
189
3445
0500
1000150020002500300035004000
FY 2013 FY 2014 FY 2015 FY 2016 FY 2017
Revenue Hours
$23303
$473413
$0
$100000
$200000
$300000
$400000
$500000
FY 2013 FY 2014 FY 2015 FY 2016 FY 2017
Operating Costs
135 143
00
50
100
150
200
250
300
FY 2013 FY 2014 FY 2015 FY 2016 FY 2017
Passengers per Revenue Hour
$825 $845
$000$200$400$600$800
$1000$1200$1400
FY 2013 FY 2014 FY 2015 FY 2016 FY 2017
Subsidy per Passenger
$12330 $13744
$0
$50
$100
$150
$200
FY 2013 FY 2014 FY 2015 FY 2016 FY 2017
Cost per Revenue Hour
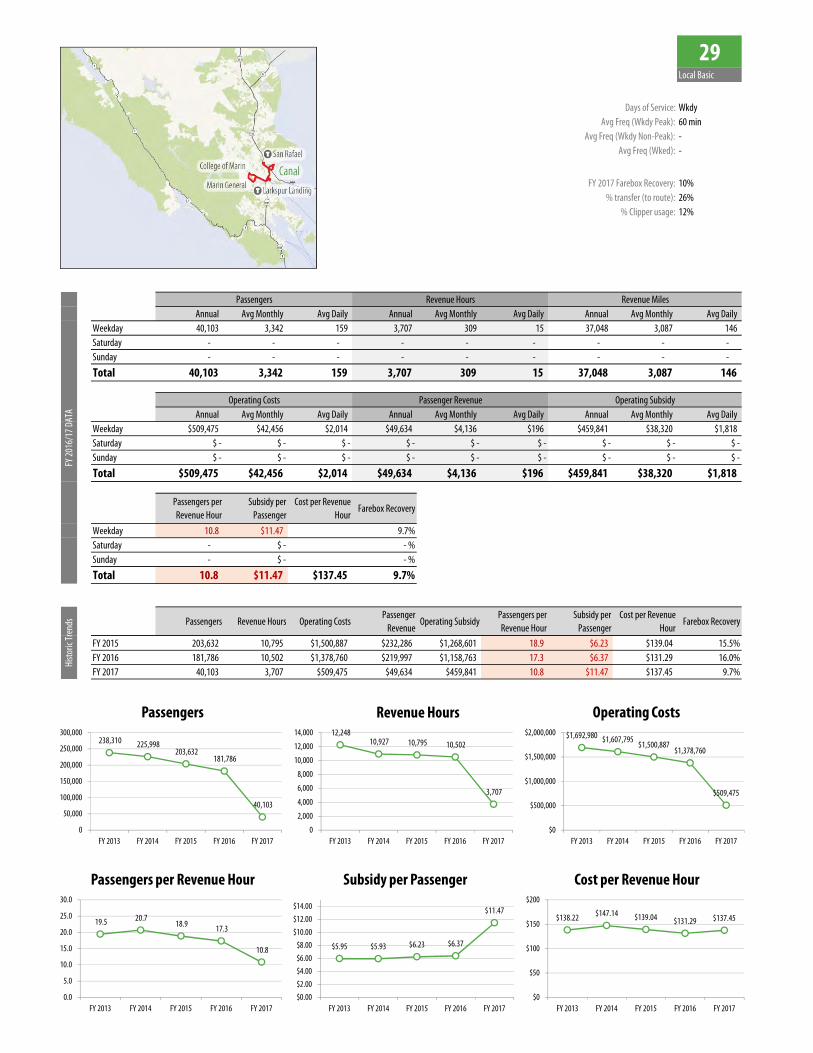
29Local Basic
Days of Service WkdyAvg Freq (Wkdy Peak) 60 min
Avg Freq (Wkdy Non-Peak) -Avg Freq (Wked) -
FY 2017 Farebox Recovery 10 transfer (to route) 26
Clipper usage 12
Annual Avg Monthly Avg Daily Annual Avg Monthly Avg Daily Annual Avg Monthly Avg DailyWeekday 40103 3342 159 3707 309 15 37048 3087 146 Saturday - - - - - - - - - Sunday - - - - - - - - -
Total 40103 3342 159 3707 309 15 37048 3087 146
Annual Avg Monthly Avg Daily Annual Avg Monthly Avg Daily Annual Avg Monthly Avg DailyWeekday $509475 $42456 $2014 $49634 $4136 $196 $459841 $38320 $1818Saturday $ - $ - $ - $ - $ - $ - $ - $ - $ -Sunday $ - $ - $ - $ - $ - $ - $ - $ - $ -
Total $509475 $42456 $2014 $49634 $4136 $196 $459841 $38320 $1818
Passengers per Revenue Hour
Subsidy per Passenger
Cost per Revenue Hour
Farebox Recovery
Weekday 108 $1147 $13745 97Saturday - $ - $ - - Sunday - $ - $ - -
Total 108 $1147 $13745 97
Passengers Revenue Hours Operating CostsPassenger
RevenueOperating Subsidy
Passengers per Revenue Hour
Subsidy per Passenger
Cost per Revenue Hour
Farebox Recovery
FY 2015 203632 10795 $1500887 $232286 $1268601 189 $623 $13904 155FY 2016 181786 10502 $1378760 $219997 $1158763 173 $637 $13129 160FY 2017 40103 3707 $509475 $49634 $459841 108 $1147 $13745 97
Histo
ric Tr
ends
FY 20
161
7 DAT
A
Passengers Revenue Hours Revenue Miles
Operating Costs Passenger Revenue Operating Subsidy
238310 225998 203632
181786
40103
0
50000
100000
150000
200000
250000
300000
FY 2013 FY 2014 FY 2015 FY 2016 FY 2017
Passengers12248
10927 10795 10502
3707
0
2000
4000
6000
8000
10000
12000
14000
FY 2013 FY 2014 FY 2015 FY 2016 FY 2017
Revenue Hours$1692980 $1607795 $1500887
$1378760
$509475
$0
$500000
$1000000
$1500000
$2000000
FY 2013 FY 2014 FY 2015 FY 2016 FY 2017
Operating Costs
195 207 189 173
108
00
50
100
150
200
250
300
FY 2013 FY 2014 FY 2015 FY 2016 FY 2017
Passengers per Revenue Hour
$595 $593 $623 $637
$1147
$000$200$400$600$800
$1000$1200$1400
FY 2013 FY 2014 FY 2015 FY 2016 FY 2017
Subsidy per Passenger
$13822 $14714 $13904 $13129 $13745
$0
$50
$100
$150
$200
FY 2013 FY 2014 FY 2015 FY 2016 FY 2017
Cost per Revenue Hour
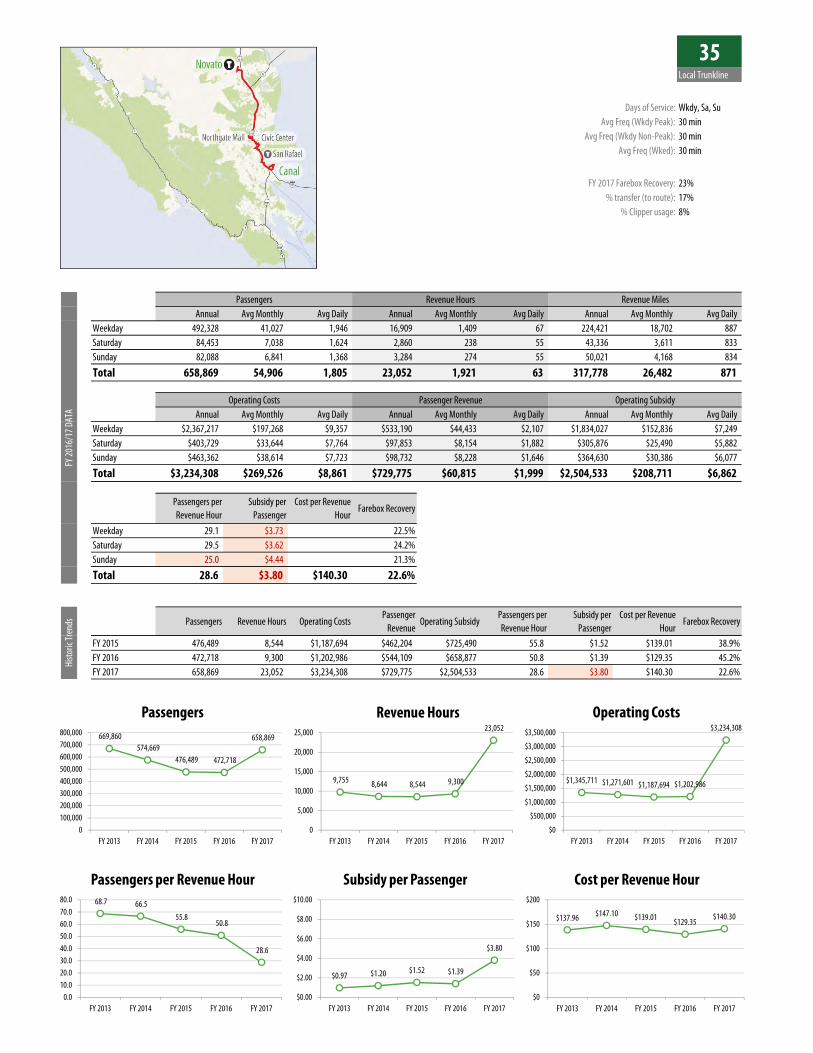
35Local Trunkline
Days of Service Wkdy Sa SuAvg Freq (Wkdy Peak) 30 min
Avg Freq (Wkdy Non-Peak) 30 minAvg Freq (Wked) 30 min
FY 2017 Farebox Recovery 23 transfer (to route) 17
Clipper usage 8
Annual Avg Monthly Avg Daily Annual Avg Monthly Avg Daily Annual Avg Monthly Avg DailyWeekday 492328 41027 1946 16909 1409 67 224421 18702 887 Saturday 84453 7038 1624 2860 238 55 43336 3611 833 Sunday 82088 6841 1368 3284 274 55 50021 4168 834
Total 658869 54906 1805 23052 1921 63 317778 26482 871
Annual Avg Monthly Avg Daily Annual Avg Monthly Avg Daily Annual Avg Monthly Avg DailyWeekday $2367217 $197268 $9357 $533190 $44433 $2107 $1834027 $152836 $7249Saturday $403729 $33644 $7764 $97853 $8154 $1882 $305876 $25490 $5882Sunday $463362 $38614 $7723 $98732 $8228 $1646 $364630 $30386 $6077
Total $3234308 $269526 $8861 $729775 $60815 $1999 $2504533 $208711 $6862
Passengers per Revenue Hour
Subsidy per Passenger
Cost per Revenue Hour
Farebox Recovery
Weekday 291 $373 $14000 225Saturday 295 $362 $14118 242Sunday 250 $444 $14111 213
Total 286 $380 $14030 226
Passengers Revenue Hours Operating CostsPassenger
RevenueOperating Subsidy
Passengers per Revenue Hour
Subsidy per Passenger
Cost per Revenue Hour
Farebox Recovery
FY 2015 476489 8544 $1187694 $462204 $725490 558 $152 $13901 389FY 2016 472718 9300 $1202986 $544109 $658877 508 $139 $12935 452FY 2017 658869 23052 $3234308 $729775 $2504533 286 $380 $14030 226
Histo
ric Tr
ends
FY 20
161
7 DAT
A
Passengers Revenue Hours Revenue Miles
Operating Costs Passenger Revenue Operating Subsidy
669860 574669
476489 472718
658869
0100000200000300000400000500000600000700000800000
FY 2013 FY 2014 FY 2015 FY 2016 FY 2017
Passengers
9755 8644 8544 9300
23052
0
5000
10000
15000
20000
25000
FY 2013 FY 2014 FY 2015 FY 2016 FY 2017
Revenue Hours
$1345711 $1271601 $1187694 $1202986
$3234308
$0
$500000
$1000000
$1500000
$2000000
$2500000
$3000000
$3500000
FY 2013 FY 2014 FY 2015 FY 2016 FY 2017
Operating Costs
687 665 558
508
286
00100200300400500600700800
FY 2013 FY 2014 FY 2015 FY 2016 FY 2017
Passengers per Revenue Hour
$097 $120 $152 $139
$380
$000
$200
$400
$600
$800
$1000
FY 2013 FY 2014 FY 2015 FY 2016 FY 2017
Subsidy per Passenger
$13796 $14710 $13901 $12935 $14030
$0
$50
$100
$150
$200
FY 2013 FY 2014 FY 2015 FY 2016 FY 2017
Cost per Revenue Hour
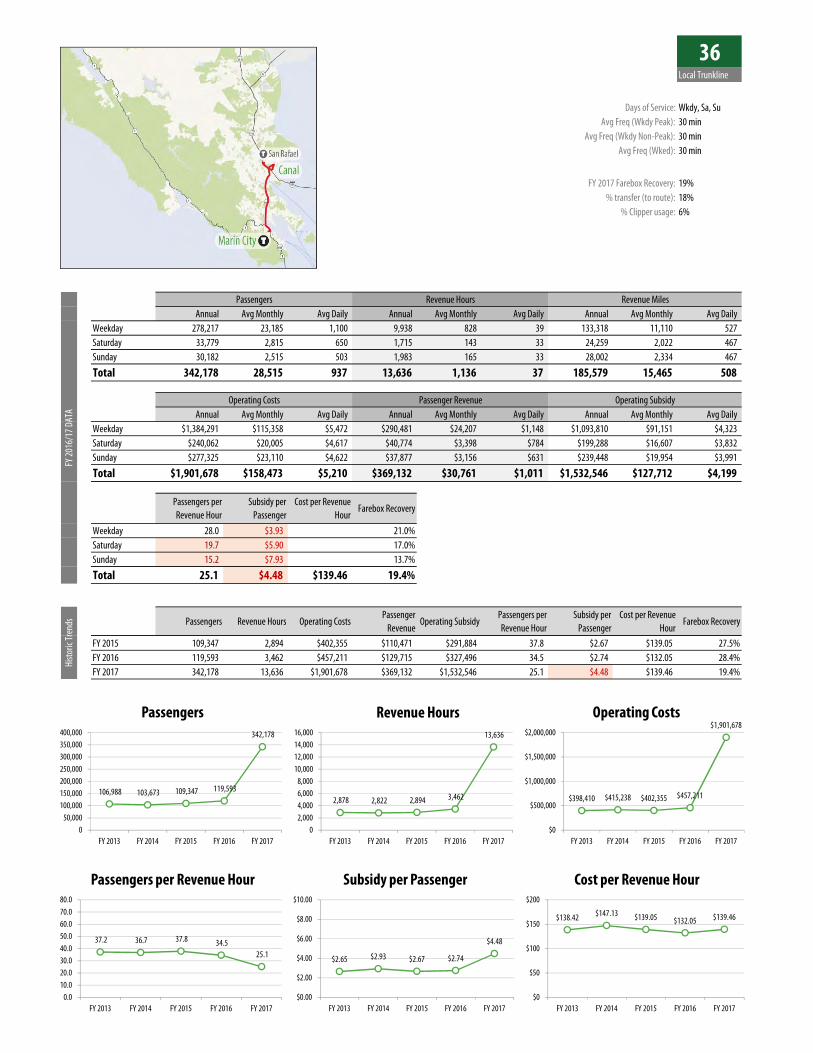
36Local Trunkline
Days of Service Wkdy Sa SuAvg Freq (Wkdy Peak) 30 min
Avg Freq (Wkdy Non-Peak) 30 minAvg Freq (Wked) 30 min
FY 2017 Farebox Recovery 19 transfer (to route) 18
Clipper usage 6
Annual Avg Monthly Avg Daily Annual Avg Monthly Avg Daily Annual Avg Monthly Avg DailyWeekday 278217 23185 1100 9938 828 39 133318 11110 527 Saturday 33779 2815 650 1715 143 33 24259 2022 467 Sunday 30182 2515 503 1983 165 33 28002 2334 467
Total 342178 28515 937 13636 1136 37 185579 15465 508
Annual Avg Monthly Avg Daily Annual Avg Monthly Avg Daily Annual Avg Monthly Avg DailyWeekday $1384291 $115358 $5472 $290481 $24207 $1148 $1093810 $91151 $4323Saturday $240062 $20005 $4617 $40774 $3398 $784 $199288 $16607 $3832Sunday $277325 $23110 $4622 $37877 $3156 $631 $239448 $19954 $3991
Total $1901678 $158473 $5210 $369132 $30761 $1011 $1532546 $127712 $4199
Passengers per Revenue Hour
Subsidy per Passenger
Cost per Revenue Hour
Farebox Recovery
Weekday 280 $393 $13930 210Saturday 197 $590 $13999 170Sunday 152 $793 $13984 137
Total 251 $448 $13946 194
Passengers Revenue Hours Operating CostsPassenger
RevenueOperating Subsidy
Passengers per Revenue Hour
Subsidy per Passenger
Cost per Revenue Hour
Farebox Recovery
FY 2015 109347 2894 $402355 $110471 $291884 378 $267 $13905 275FY 2016 119593 3462 $457211 $129715 $327496 345 $274 $13205 284FY 2017 342178 13636 $1901678 $369132 $1532546 251 $448 $13946 194
Histo
ric Tr
ends
FY 20
161
7 DAT
A
Passengers Revenue Hours Revenue Miles
Operating Costs Passenger Revenue Operating Subsidy
106988 103673 109347 119593
342178
050000
100000150000200000250000300000350000400000
FY 2013 FY 2014 FY 2015 FY 2016 FY 2017
Passengers
2878 2822 2894 3462
13636
02000400060008000
10000120001400016000
FY 2013 FY 2014 FY 2015 FY 2016 FY 2017
Revenue Hours
$398410 $415238 $402355 $457211
$1901678
$0
$500000
$1000000
$1500000
$2000000
FY 2013 FY 2014 FY 2015 FY 2016 FY 2017
Operating Costs
372 367 378 345 251
00100200300400500600700800
FY 2013 FY 2014 FY 2015 FY 2016 FY 2017
Passengers per Revenue Hour
$265 $293 $267 $274
$448
$000
$200
$400
$600
$800
$1000
FY 2013 FY 2014 FY 2015 FY 2016 FY 2017
Subsidy per Passenger
$13842 $14713 $13905 $13205 $13946
$0
$50
$100
$150
$200
FY 2013 FY 2014 FY 2015 FY 2016 FY 2017
Cost per Revenue Hour
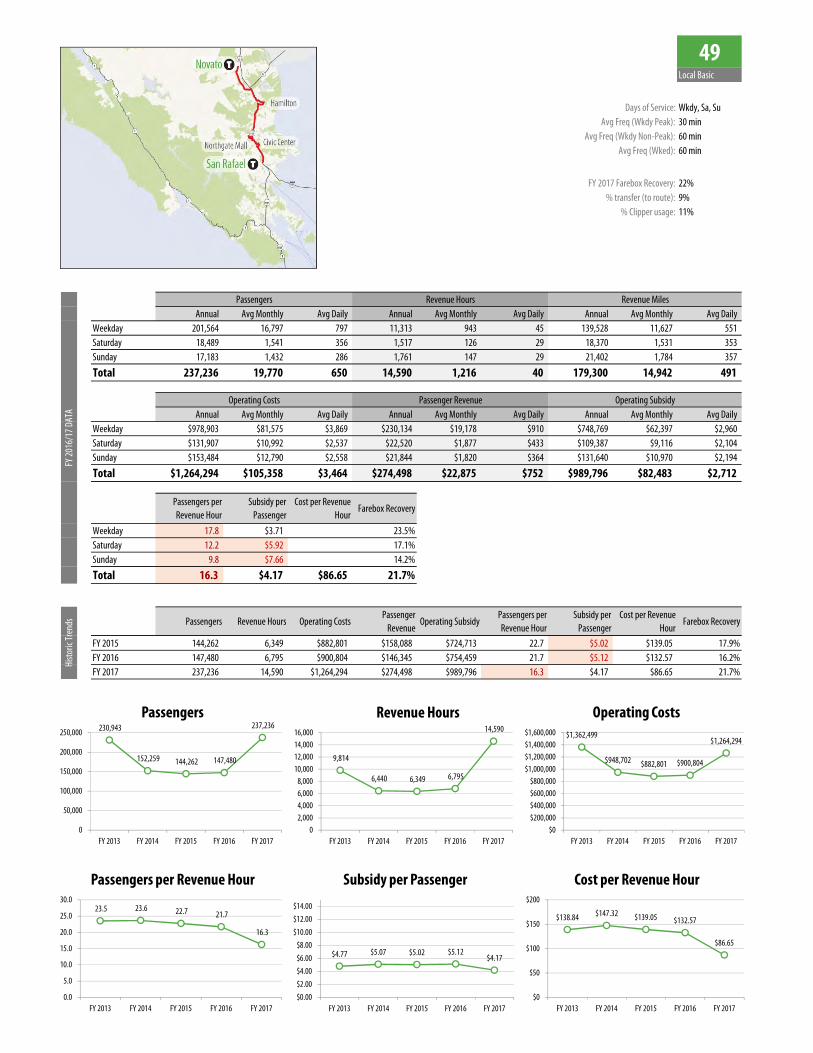
49Local Basic
Days of Service Wkdy Sa SuAvg Freq (Wkdy Peak) 30 min
Avg Freq (Wkdy Non-Peak) 60 minAvg Freq (Wked) 60 min
FY 2017 Farebox Recovery 22 transfer (to route) 9
Clipper usage 11
Annual Avg Monthly Avg Daily Annual Avg Monthly Avg Daily Annual Avg Monthly Avg DailyWeekday 201564 16797 797 11313 943 45 139528 11627 551 Saturday 18489 1541 356 1517 126 29 18370 1531 353 Sunday 17183 1432 286 1761 147 29 21402 1784 357
Total 237236 19770 650 14590 1216 40 179300 14942 491
Annual Avg Monthly Avg Daily Annual Avg Monthly Avg Daily Annual Avg Monthly Avg DailyWeekday $978903 $81575 $3869 $230134 $19178 $910 $748769 $62397 $2960Saturday $131907 $10992 $2537 $22520 $1877 $433 $109387 $9116 $2104Sunday $153484 $12790 $2558 $21844 $1820 $364 $131640 $10970 $2194
Total $1264294 $105358 $3464 $274498 $22875 $752 $989796 $82483 $2712
Passengers per Revenue Hour
Subsidy per Passenger
Cost per Revenue Hour
Farebox Recovery
Weekday 178 $371 $8653 235Saturday 122 $592 $8698 171Sunday 98 $766 $8718 142
Total 163 $417 $8665 217
Passengers Revenue Hours Operating CostsPassenger
RevenueOperating Subsidy
Passengers per Revenue Hour
Subsidy per Passenger
Cost per Revenue Hour
Farebox Recovery
FY 2015 144262 6349 $882801 $158088 $724713 227 $502 $13905 179FY 2016 147480 6795 $900804 $146345 $754459 217 $512 $13257 162FY 2017 237236 14590 $1264294 $274498 $989796 163 $417 $8665 217
Histo
ric Tr
ends
FY 20
161
7 DAT
A
Passengers Revenue Hours Revenue Miles
Operating Costs Passenger Revenue Operating Subsidy
230943
152259 144262 147480
237236
0
50000
100000
150000
200000
250000
FY 2013 FY 2014 FY 2015 FY 2016 FY 2017
Passengers
9814
6440 6349 6795
14590
02000400060008000
10000120001400016000
FY 2013 FY 2014 FY 2015 FY 2016 FY 2017
Revenue Hours$1362499
$948702 $882801 $900804
$1264294
$0$200000$400000$600000$800000
$1000000$1200000$1400000$1600000
FY 2013 FY 2014 FY 2015 FY 2016 FY 2017
Operating Costs
235 236 227 217
163
00
50
100
150
200
250
300
FY 2013 FY 2014 FY 2015 FY 2016 FY 2017
Passengers per Revenue Hour
$477 $507 $502 $512 $417
$000$200$400$600$800
$1000$1200$1400
FY 2013 FY 2014 FY 2015 FY 2016 FY 2017
Subsidy per Passenger
$13884 $14732 $13905 $13257
$8665
$0
$50
$100
$150
$200
FY 2013 FY 2014 FY 2015 FY 2016 FY 2017
Cost per Revenue Hour
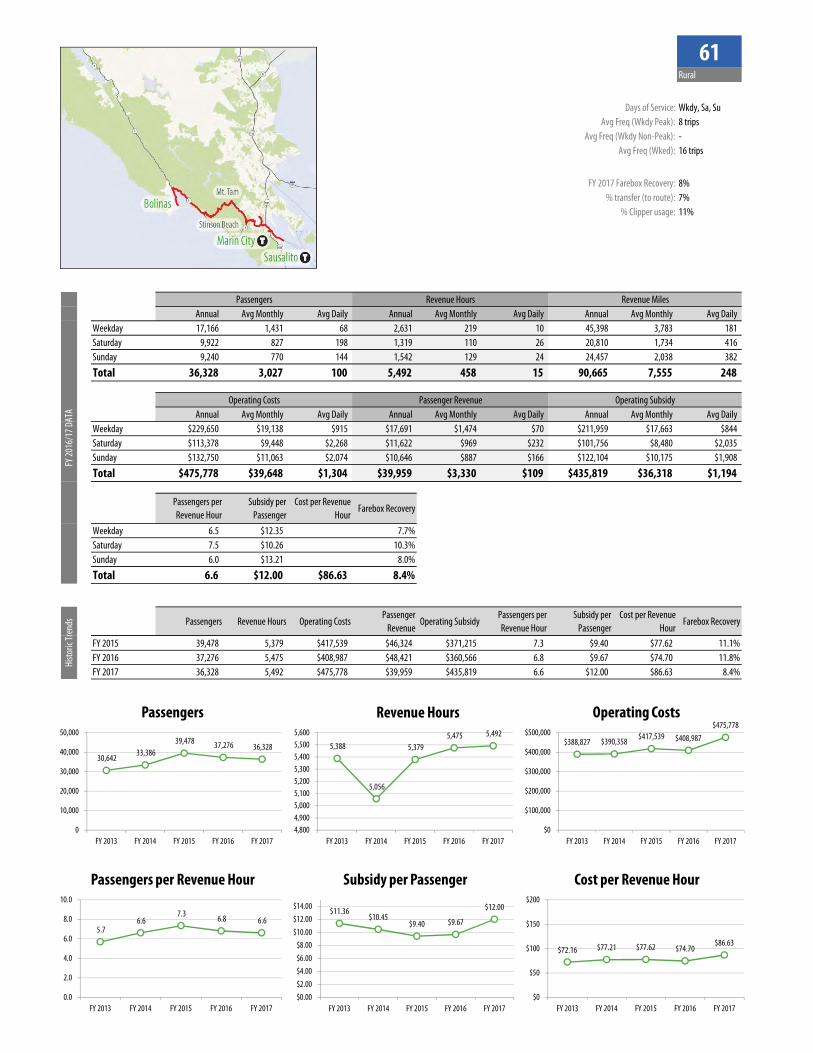
61Rural
Days of Service Wkdy Sa SuAvg Freq (Wkdy Peak) 8 trips
Avg Freq (Wkdy Non-Peak) -Avg Freq (Wked) 16 trips
FY 2017 Farebox Recovery 8 transfer (to route) 7
Clipper usage 11
Annual Avg Monthly Avg Daily Annual Avg Monthly Avg Daily Annual Avg Monthly Avg DailyWeekday 17166 1431 68 2631 219 10 45398 3783 181 Saturday 9922 827 198 1319 110 26 20810 1734 416 Sunday 9240 770 144 1542 129 24 24457 2038 382
Total 36328 3027 100 5492 458 15 90665 7555 248
Annual Avg Monthly Avg Daily Annual Avg Monthly Avg Daily Annual Avg Monthly Avg DailyWeekday $229650 $19138 $915 $17691 $1474 $70 $211959 $17663 $844Saturday $113378 $9448 $2268 $11622 $969 $232 $101756 $8480 $2035Sunday $132750 $11063 $2074 $10646 $887 $166 $122104 $10175 $1908
Total $475778 $39648 $1304 $39959 $3330 $109 $435819 $36318 $1194
Passengers per Revenue Hour
Subsidy per Passenger
Cost per Revenue Hour
Farebox Recovery
Weekday 65 $1235 $8730 77Saturday 75 $1026 $8598 103Sunday 60 $1321 $8607 80
Total 66 $1200 $8663 84
Passengers Revenue Hours Operating CostsPassenger
RevenueOperating Subsidy
Passengers per Revenue Hour
Subsidy per Passenger
Cost per Revenue Hour
Farebox Recovery
FY 2015 39478 5379 $417539 $46324 $371215 73 $940 $7762 111FY 2016 37276 5475 $408987 $48421 $360566 68 $967 $7470 118FY 2017 36328 5492 $475778 $39959 $435819 66 $1200 $8663 84
Histo
ric Tr
ends
FY 20
161
7 DAT
A
Passengers Revenue Hours Revenue Miles
Operating Costs Passenger Revenue Operating Subsidy
30642 33386
39478 37276 36328
0
10000
20000
30000
40000
50000
FY 2013 FY 2014 FY 2015 FY 2016 FY 2017
Passengers
5388
5056
5379 5475 5492
480049005000510052005300540055005600
FY 2013 FY 2014 FY 2015 FY 2016 FY 2017
Revenue Hours
$388827 $390358 $417539 $408987 $475778
$0
$100000
$200000
$300000
$400000
$500000
FY 2013 FY 2014 FY 2015 FY 2016 FY 2017
Operating Costs
57 66
73 68 66
00
20
40
60
80
100
FY 2013 FY 2014 FY 2015 FY 2016 FY 2017
Passengers per Revenue Hour
$1136 $1045
$940 $967
$1200
$000$200$400$600$800
$1000$1200$1400
FY 2013 FY 2014 FY 2015 FY 2016 FY 2017
Subsidy per Passenger
$7216 $7721 $7762 $7470 $8663
$0
$50
$100
$150
$200
FY 2013 FY 2014 FY 2015 FY 2016 FY 2017
Cost per Revenue Hour
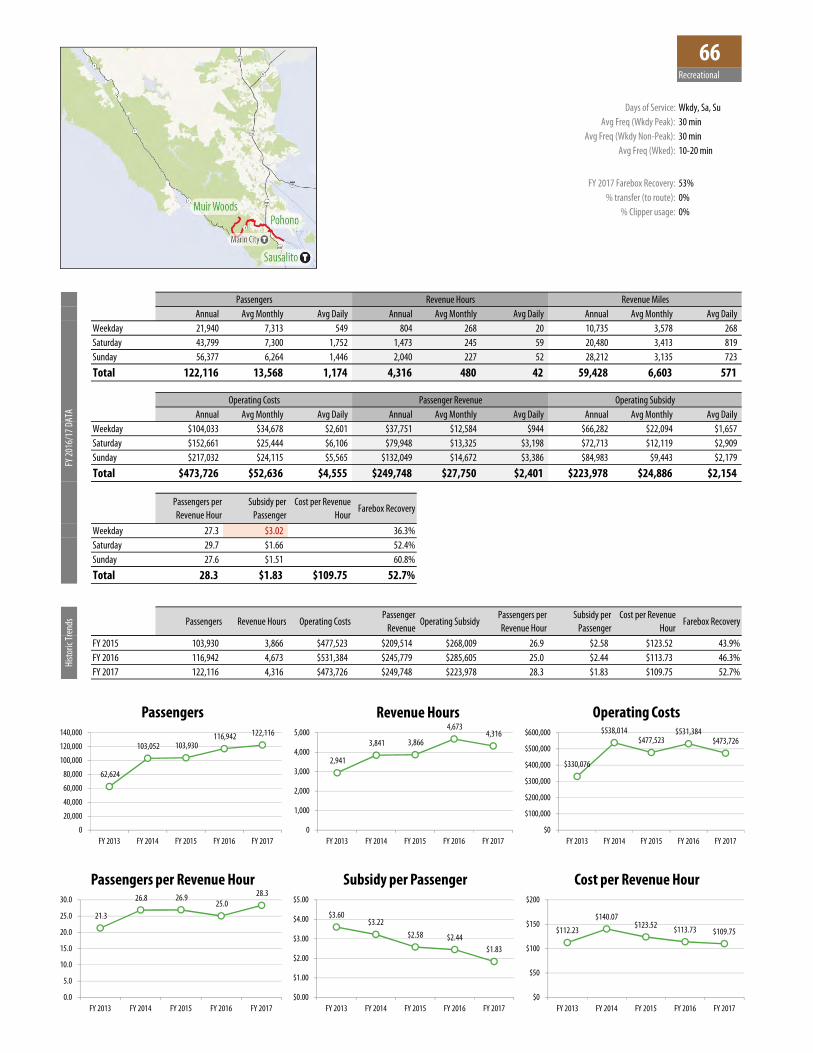
66Recreational
Days of Service Wkdy Sa SuAvg Freq (Wkdy Peak) 30 min
Avg Freq (Wkdy Non-Peak) 30 minAvg Freq (Wked) 10-20 min
FY 2017 Farebox Recovery 53 transfer (to route) 0
Clipper usage 0
Annual Avg Monthly Avg Daily Annual Avg Monthly Avg Daily Annual Avg Monthly Avg DailyWeekday 21940 7313 549 804 268 20 10735 3578 268 Saturday 43799 7300 1752 1473 245 59 20480 3413 819 Sunday 56377 6264 1446 2040 227 52 28212 3135 723
Total 122116 13568 1174 4316 480 42 59428 6603 571
Annual Avg Monthly Avg Daily Annual Avg Monthly Avg Daily Annual Avg Monthly Avg DailyWeekday $104033 $34678 $2601 $37751 $12584 $944 $66282 $22094 $1657Saturday $152661 $25444 $6106 $79948 $13325 $3198 $72713 $12119 $2909Sunday $217032 $24115 $5565 $132049 $14672 $3386 $84983 $9443 $2179
Total $473726 $52636 $4555 $249748 $27750 $2401 $223978 $24886 $2154
Passengers per Revenue Hour
Subsidy per Passenger
Cost per Revenue Hour
Farebox Recovery
Weekday 273 $302 $12944 363Saturday 297 $166 $10367 524Sunday 276 $151 $10638 608
Total 283 $183 $10975 527
Passengers Revenue Hours Operating CostsPassenger
RevenueOperating Subsidy
Passengers per Revenue Hour
Subsidy per Passenger
Cost per Revenue Hour
Farebox Recovery
FY 2015 103930 3866 $477523 $209514 $268009 269 $258 $12352 439FY 2016 116942 4673 $531384 $245779 $285605 250 $244 $11373 463FY 2017 122116 4316 $473726 $249748 $223978 283 $183 $10975 527
Histo
ric Tr
ends
FY 20
161
7 DAT
A
Passengers Revenue Hours Revenue Miles
Operating Costs Passenger Revenue Operating Subsidy
62624
103052 103930 116942 122116
0
20000
40000
60000
80000
100000
120000
140000
FY 2013 FY 2014 FY 2015 FY 2016 FY 2017
Passengers
2941
3841 3866
4673 4316
0
1000
2000
3000
4000
5000
FY 2013 FY 2014 FY 2015 FY 2016 FY 2017
Revenue Hours
$330076
$538014 $477523
$531384 $473726
$0
$100000
$200000
$300000
$400000
$500000
$600000
FY 2013 FY 2014 FY 2015 FY 2016 FY 2017
Operating Costs
213
268 269 250
283
00
50
100
150
200
250
300
FY 2013 FY 2014 FY 2015 FY 2016 FY 2017
Passengers per Revenue Hour
$360 $322
$258 $244 $183
$000
$100
$200
$300
$400
$500
FY 2013 FY 2014 FY 2015 FY 2016 FY 2017
Subsidy per Passenger
$11223
$14007 $12352 $11373 $10975
$0
$50
$100
$150
$200
FY 2013 FY 2014 FY 2015 FY 2016 FY 2017
Cost per Revenue Hour
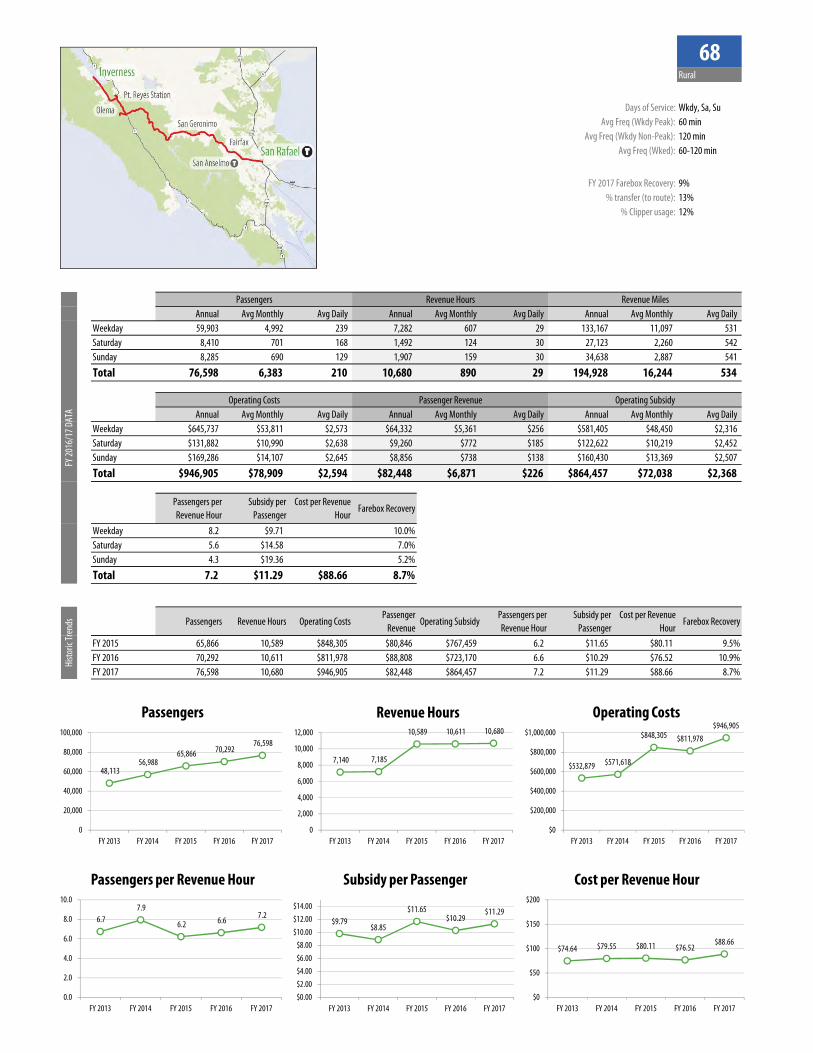
68Rural
Days of Service Wkdy Sa SuAvg Freq (Wkdy Peak) 60 min
Avg Freq (Wkdy Non-Peak) 120 minAvg Freq (Wked) 60-120 min
FY 2017 Farebox Recovery 9 transfer (to route) 13
Clipper usage 12
Annual Avg Monthly Avg Daily Annual Avg Monthly Avg Daily Annual Avg Monthly Avg DailyWeekday 59903 4992 239 7282 607 29 133167 11097 531 Saturday 8410 701 168 1492 124 30 27123 2260 542 Sunday 8285 690 129 1907 159 30 34638 2887 541
Total 76598 6383 210 10680 890 29 194928 16244 534
Annual Avg Monthly Avg Daily Annual Avg Monthly Avg Daily Annual Avg Monthly Avg DailyWeekday $645737 $53811 $2573 $64332 $5361 $256 $581405 $48450 $2316Saturday $131882 $10990 $2638 $9260 $772 $185 $122622 $10219 $2452Sunday $169286 $14107 $2645 $8856 $738 $138 $160430 $13369 $2507
Total $946905 $78909 $2594 $82448 $6871 $226 $864457 $72038 $2368
Passengers per Revenue Hour
Subsidy per Passenger
Cost per Revenue Hour
Farebox Recovery
Weekday 82 $971 $8868 100Saturday 56 $1458 $8841 70Sunday 43 $1936 $8879 52
Total 72 $1129 $8866 87
Passengers Revenue Hours Operating CostsPassenger
RevenueOperating Subsidy
Passengers per Revenue Hour
Subsidy per Passenger
Cost per Revenue Hour
Farebox Recovery
FY 2015 65866 10589 $848305 $80846 $767459 62 $1165 $8011 95FY 2016 70292 10611 $811978 $88808 $723170 66 $1029 $7652 109FY 2017 76598 10680 $946905 $82448 $864457 72 $1129 $8866 87
Histo
ric Tr
ends
FY 20
161
7 DAT
A
Passengers Revenue Hours Revenue Miles
Operating Costs Passenger Revenue Operating Subsidy
48113 56988
65866 70292 76598
0
20000
40000
60000
80000
100000
FY 2013 FY 2014 FY 2015 FY 2016 FY 2017
Passengers
7140 7185
10589 10611 10680
0
2000
4000
6000
8000
10000
12000
FY 2013 FY 2014 FY 2015 FY 2016 FY 2017
Revenue Hours
$532879 $571618
$848305 $811978 $946905
$0
$200000
$400000
$600000
$800000
$1000000
FY 2013 FY 2014 FY 2015 FY 2016 FY 2017
Operating Costs
67 79
62 66 72
00
20
40
60
80
100
FY 2013 FY 2014 FY 2015 FY 2016 FY 2017
Passengers per Revenue Hour
$979 $885
$1165 $1029
$1129
$000$200$400$600$800
$1000$1200$1400
FY 2013 FY 2014 FY 2015 FY 2016 FY 2017
Subsidy per Passenger
$7464 $7955 $8011 $7652 $8866
$0
$50
$100
$150
$200
FY 2013 FY 2014 FY 2015 FY 2016 FY 2017
Cost per Revenue Hour
71XLocal Trunkline
Days of Service WkdyAvg Freq (Wkdy Peak) 30 min
Avg Freq (Wkdy Non-Peak) 60 minAvg Freq (Wked) -
FY 2017 Farebox Recovery 15 transfer (to route) 26
Clipper usage 16
Annual Avg Monthly Avg Daily Annual Avg Monthly Avg Daily Annual Avg Monthly Avg DailyWeekday 121141 10095 479 7705 642 30 174624 14552 690 Saturday - - - - - - - - - Sunday - - - - - - - - -
Total 121141 10095 479 7705 642 30 174624 14552 690
Annual Avg Monthly Avg Daily Annual Avg Monthly Avg Daily Annual Avg Monthly Avg DailyWeekday $1116954 $93080 $4415 $164963 $13747 $652 $951991 $79333 $3763Saturday $ - $ - $ - $ - $ - $ - $ - $ - $ -Sunday $ - $ - $ - $ - $ - $ - $ - $ - $ -
Total $1116954 $93080 $4415 $164963 $13747 $652 $951991 $79333 $3763
Passengers per Revenue Hour
Subsidy per Passenger
Cost per Revenue Hour
Farebox Recovery
Weekday 157 $786 $14496 148Saturday - $ - $ - - Sunday - $ - $ - -
Total 157 $786 $14496 148
Passengers Revenue Hours Operating CostsPassenger
RevenueOperating Subsidy
Passengers per Revenue Hour
Subsidy per Passenger
Cost per Revenue Hour
Farebox Recovery
FY 2015 305440 7666 $1066058 $307659 $758399 398 $248 $13906 289FY 2016 259678 7717 $1075263 $300186 $775077 337 $298 $13934 279FY 2017 121141 7705 $1116954 $164963 $951991 157 $786 $14496 148
Histo
ric Tr
ends
FY 20
161
7 DAT
A
Passengers Revenue Hours Revenue Miles
Operating Costs Passenger Revenue Operating Subsidy
347560 341105 305440
259678
121141
050000
100000150000200000250000300000350000400000
FY 2013 FY 2014 FY 2015 FY 2016 FY 2017
Passengers9038
7578 7666 7717 7705
0
2000
4000
6000
8000
10000
FY 2013 FY 2014 FY 2015 FY 2016 FY 2017
Revenue Hours$1254262
$1116004 $1066058 $1075263 $1116954
$0
$200000
$400000
$600000
$800000
$1000000
$1200000
$1400000
FY 2013 FY 2014 FY 2015 FY 2016 FY 2017
Operating Costs
385 450
398 337
157
00100200300400500600700800
FY 2013 FY 2014 FY 2015 FY 2016 FY 2017
Passengers per Revenue Hour
$253 $222 $248 $298
$786
$000
$200
$400
$600
$800
$1000
FY 2013 FY 2014 FY 2015 FY 2016 FY 2017
Subsidy per Passenger
$13877 $14728 $13906 $13934 $14496
$0
$50
$100
$150
$200
FY 2013 FY 2014 FY 2015 FY 2016 FY 2017
Cost per Revenue Hour
113Supplemental
Days of Service School DaysAvg Freq (Wkdy Peak) 3 trips
Avg Freq (Wkdy Non-Peak) -Avg Freq (Wked) -
FY 2017 Farebox Recovery 29 transfer (to route) 0
Clipper usage 4
Annual Avg Monthly Avg Daily Annual Avg Monthly Avg Daily Annual Avg Monthly Avg DailyWeekday 16829 1530 92 317 29 2 2404 219 13 Saturday - - - - - - - - - Sunday - - - - - - - - -
Total 16829 1530 92 317 29 2 2404 219 13
Annual Avg Monthly Avg Daily Annual Avg Monthly Avg Daily Annual Avg Monthly Avg DailyWeekday $42180 $3835 $230 $12227 $1112 $67 $29953 $2723 $164Saturday $ - $ - $ - $ - $ - $ - $ - $ - $ -Sunday $ - $ - $ - $ - $ - $ - $ - $ - $ -
Total $42180 $3835 $230 $12227 $1112 $67 $29953 $2723 $164
Passengers per TripSubsidy per
PassengerCost per Revenue
HourFarebox Recovery
Weekday 315 $178 $13289 290Saturday - $ - $ - - Sunday - $ - $ - -
Total 315 $178 $13289 290
Passengers Revenue Hours Operating CostsPassenger
RevenueOperating Subsidy Passengers per Trip
Subsidy per Passenger
Cost per Revenue Hour
Farebox Recovery
FY 2015 12241 161 $28599 $10703 $17896 342 $146 $17752 374FY 2016 14601 263 $36924 $12809 $24115 317 $165 $14050 347FY 2017 16829 317 $42180 $12227 $29953 315 $178 $13289 290
Histo
ric Tr
ends
FY 20
161
7 DAT
A
Passengers Revenue Hours Revenue Miles
Operating Costs Passenger Revenue Operating Subsidy
15232 13521
12241 14601
16829
0
5000
10000
15000
20000
FY 2013 FY 2014 FY 2015 FY 2016 FY 2017
Passengers
229
165 161
263
317
0
50
100
150
200
250
300
350
FY 2013 FY 2014 FY 2015 FY 2016 FY 2017
Revenue Hours
$31562
$20182
$28599
$36924 $42180
$0
$10000
$20000
$30000
$40000
$50000
FY 2013 FY 2014 FY 2015 FY 2016 FY 2017
Operating Costs
220
365 342 317 315
00
100
200
300
400
500
FY 2013 FY 2014 FY 2015 FY 2016 FY 2017
Passengers per Trip
$051 $095
$146 $165 $178
$000$100$200$300$400$500$600$700$800
FY 2013 FY 2014 FY 2015 FY 2016 FY 2017
Subsidy per Passenger
$13795 $12261
$17752
$14050 $13289
$0
$50
$100
$150
$200
FY 2013 FY 2014 FY 2015 FY 2016 FY 2017
Cost per Revenue Hour
115Supplemental
Days of Service School DaysAvg Freq (Wkdy Peak) 5 trips
Avg Freq (Wkdy Non-Peak) -Avg Freq (Wked) -
FY 2017 Farebox Recovery 11 transfer (to route) 0
Clipper usage 7
Annual Avg Monthly Avg Daily Annual Avg Monthly Avg Daily Annual Avg Monthly Avg DailyWeekday 14021 1275 71 637 58 3 6963 633 35 Saturday - - - - - - - - - Sunday - - - - - - - - -
Total 14021 1275 71 637 58 3 6963 633 35
Annual Avg Monthly Avg Daily Annual Avg Monthly Avg Daily Annual Avg Monthly Avg DailyWeekday $87534 $7958 $444 $9504 $864 $48 $78030 $7094 $396Saturday $ - $ - $ - $ - $ - $ - $ - $ - $ -Sunday $ - $ - $ - $ - $ - $ - $ - $ - $ -
Total $87534 $7958 $444 $9504 $864 $48 $78030 $7094 $396
Passengers per TripSubsidy per
PassengerCost per Revenue
HourFarebox Recovery
Weekday 185 $557 $13744 109Saturday - $ - $ - - Sunday - $ - $ - -
Total 185 $557 $13744 109
Passengers Revenue Hours Operating CostsPassenger
RevenueOperating Subsidy Passengers per Trip
Subsidy per Passenger
Cost per Revenue Hour
Farebox Recovery
FY 2015 21488 775 $131168 $18863 $112305 221 $523 $16918 144FY 2016 16366 559 $82403 $12638 $69765 168 $426 $14754 153FY 2017 14021 637 $87534 $9504 $78030 185 $557 $13744 109
Histo
ric Tr
ends
FY 20
161
7 DAT
A
Passengers Revenue Hours Revenue Miles
Operating Costs Passenger Revenue Operating Subsidy
13524
21488
16366 14021
0
5000
10000
15000
20000
25000
FY 2013 FY 2014 FY 2015 FY 2016 FY 2017
Passengers
463
775
559 637
0
200
400
600
800
1000
FY 2013 FY 2014 FY 2015 FY 2016 FY 2017
Revenue Hours
$56706
$131168
$82403 $87534
$0
$20000
$40000
$60000
$80000
$100000
$120000
$140000
FY 2013 FY 2014 FY 2015 FY 2016 FY 2017
Operating Costs
232 221 168 185
00
100
200
300
400
500
FY 2013 FY 2014 FY 2015 FY 2016 FY 2017
Passengers per Trip
$362
$523 $426
$557
$000$100$200$300$400$500$600$700$800
FY 2013 FY 2014 FY 2015 FY 2016 FY 2017
Subsidy per Passenger
$12250
$16918 $14754 $13744
$0
$50
$100
$150
$200
FY 2013 FY 2014 FY 2015 FY 2016 FY 2017
Cost per Revenue Hour
117Supplemental
Days of Service School DaysAvg Freq (Wkdy Peak) 6 trips
Avg Freq (Wkdy Non-Peak) -Avg Freq (Wked) -
FY 2017 Farebox Recovery 21 transfer (to route) 0
Clipper usage 2
Annual Avg Monthly Avg Daily Annual Avg Monthly Avg Daily Annual Avg Monthly Avg DailyWeekday 34820 3165 193 640 58 4 4753 432 26 Saturday - - - - - - - - - Sunday - - - - - - - - -
Total 34820 3165 193 640 58 4 4753 432 26
Annual Avg Monthly Avg Daily Annual Avg Monthly Avg Daily Annual Avg Monthly Avg DailyWeekday $81509 $7410 $453 $17140 $1558 $95 $64369 $5852 $358Saturday $ - $ - $ - $ - $ - $ - $ - $ - $ -Sunday $ - $ - $ - $ - $ - $ - $ - $ - $ -
Total $81509 $7410 $453 $17140 $1558 $95 $64369 $5852 $358
Passengers per TripSubsidy per
PassengerCost per Revenue
HourFarebox Recovery
Weekday 284 $185 $12732 210Saturday - $ - $ - - Sunday - $ - $ - -
Total 284 $185 $12732 210
Passengers Revenue Hours Operating CostsPassenger
RevenueOperating Subsidy Passengers per Trip
Subsidy per Passenger
Cost per Revenue Hour
Farebox Recovery
FY 2015 50008 509 $77168 $77528 ($360) 399 ($001) $15158 1005FY 2016 33705 552 $77694 $23478 $54216 269 $161 $14075 302FY 2017 34820 640 $81509 $17140 $64369 284 $185 $12732 210
Histo
ric Tr
ends
FY 20
161
7 DAT
A
Passengers Revenue Hours Revenue Miles
Operating Costs Passenger Revenue Operating Subsidy
35174 34496
50008
33705 34820
0
10000
20000
30000
40000
50000
60000
FY 2013 FY 2014 FY 2015 FY 2016 FY 2017
Passengers
299 341
509 552
640
0
100
200
300
400
500
600
700
FY 2013 FY 2014 FY 2015 FY 2016 FY 2017
Revenue Hours
$41176 $41796
$77168 $77694 $81509
$0
$20000
$40000
$60000
$80000
$100000
FY 2013 FY 2014 FY 2015 FY 2016 FY 2017
Operating Costs
436 406 399
269 284
00
100
200
300
400
500
FY 2013 FY 2014 FY 2015 FY 2016 FY 2017
Passengers per Trip
($012) ($028) ($001)
$161 $185
-$200
-$100
$000
$100
$200
$300
$400
$500
$600
FY 2013 FY 2014 FY 2015 FY 2016 FY 2017
Subsidy per Passenger$13790
$12253
$15158 $14075
$12732
$0$20$40$60$80
$100$120$140$160
FY 2013 FY 2014 FY 2015 FY 2016 FY 2017
Cost per Revenue Hour
119Supplemental
Days of Service School DaysAvg Freq (Wkdy Peak) 5 trips
Avg Freq (Wkdy Non-Peak) -Avg Freq (Wked) -
FY 2017 Farebox Recovery 34 transfer (to route) 0
Clipper usage 5
Annual Avg Monthly Avg Daily Annual Avg Monthly Avg Daily Annual Avg Monthly Avg DailyWeekday 27161 2469 151 374 34 2 6893 627 38 Saturday - - - - - - - - - Sunday - - - - - - - - -
Total 27161 2469 151 374 34 2 6893 627 38
Annual Avg Monthly Avg Daily Annual Avg Monthly Avg Daily Annual Avg Monthly Avg DailyWeekday $56273 $5116 $313 $18859 $1714 $105 $37414 $3401 $208Saturday $ - $ - $ - $ - $ - $ - $ - $ - $ -Sunday $ - $ - $ - $ - $ - $ - $ - $ - $ -
Total $56273 $5116 $313 $18859 $1714 $105 $37414 $3401 $208
Passengers per TripSubsidy per
PassengerCost per Revenue
HourFarebox Recovery
Weekday 313 $138 $15058 335Saturday - $ - $ - - Sunday - $ - $ - -
Total 313 $138 $15058 335
Passengers Revenue Hours Operating CostsPassenger
RevenueOperating Subsidy Passengers per Trip
Subsidy per Passenger
Cost per Revenue Hour
Farebox Recovery
FY 2015 28376 466 $85243 $24699 $60544 319 $213 $18292 290FY 2016 30906 431 $68366 $28456 $39910 317 $129 $15877 416FY 2017 27161 374 $56273 $18859 $37414 313 $138 $15058 335
Histo
ric Tr
ends
FY 20
161
7 DAT
A
Passengers Revenue Hours Revenue Miles
Operating Costs Passenger Revenue Operating Subsidy
27987 28376
30906
27161
25000
26000
27000
28000
29000
30000
31000
32000
FY 2013 FY 2014 FY 2015 FY 2016 FY 2017
Passengers526
466 431
374
0
100
200
300
400
500
600
FY 2013 FY 2014 FY 2015 FY 2016 FY 2017
Revenue Hours
$64440
$85243
$68366 $56273
$0
$20000
$40000
$60000
$80000
$100000
FY 2013 FY 2014 FY 2015 FY 2016 FY 2017
Operating Costs
272 319 317 313
00
100
200
300
400
500
FY 2013 FY 2014 FY 2015 FY 2016 FY 2017
Passengers per Trip
$175 $213 $129 $138
$000$100$200$300$400$500$600$700$800
FY 2013 FY 2014 FY 2015 FY 2016 FY 2017
Subsidy per Passenger
$12251
$18292 $15877 $15058
$0
$50
$100
$150
$200
FY 2013 FY 2014 FY 2015 FY 2016 FY 2017
Cost per Revenue Hour
122Partnership
Days of Service WkdyAvg Freq (Wkdy Peak) -
Avg Freq (Wkdy Non-Peak) 30 minAvg Freq (Wked) -
FY 2017 Farebox Recovery 66 transfer (to route) 9
Clipper usage 6
Annual Avg Monthly Avg Daily Annual Avg Monthly Avg Daily Annual Avg Monthly Avg DailyWeekday 19860 1986 113 1696 170 10 15480 1548 88 Saturday - - - - - - - - - Sunday - - - - - - - - -
Total 19860 1986 113 1696 170 10 15480 1548 88
Annual Avg Monthly Avg Daily Annual Avg Monthly Avg Daily Annual Avg Monthly Avg DailyWeekday $183943 $18394 $1045 $121007 $12101 $688 $62936 $6294 $358Saturday $ - $ - $ - $ - $ - $ - $ - $ - $ -Sunday $ - $ - $ - $ - $ - $ - $ - $ - $ -
Total $183943 $18394 $1045 $121007 $12101 $688 $62936 $6294 $358
Passengers per Revenue Hour
Subsidy per Passenger
Cost per Revenue Hour
Farebox Recovery
Weekday 117 $317 $10844 658Saturday - $ - $ - - Sunday - $ - $ - -
Total 117 $317 $10844 658
Passengers Revenue Hours Operating CostsPassenger
RevenueOperating Subsidy
Passengers per Revenue Hour
Subsidy per Passenger
Cost per Revenue Hour
Farebox Recovery
FY 2015FY 2016 20360 2932 $325230 $149686 $175544 69 $862 $11094 460FY 2017 19860 1696 $183943 $121007 $62936 117 $317 $10844 658
Histo
ric Tr
ends
FY 20
161
7 DAT
A
Passengers Revenue Hours Revenue Miles
Operating Costs Passenger Revenue Operating Subsidy
20360 19860
0
5000
10000
15000
20000
25000
FY 2013 FY 2014 FY 2015 FY 2016 FY 2017
Passengers2932
1696
0
500
1000
1500
2000
2500
3000
3500
FY 2013 FY 2014 FY 2015 FY 2016 FY 2017
Revenue Hours$325230
$183943
$0
$50000
$100000
$150000
$200000
$250000
$300000
$350000
FY 2013 FY 2014 FY 2015 FY 2016 FY 2017
Operating Costs
69
117
00
20
40
60
80
100
120
140
FY 2013 FY 2014 FY 2015 FY 2016 FY 2017
Passengers per Revenue Hour$862
$317
$000
$200
$400
$600
$800
$1000
FY 2013 FY 2014 FY 2015 FY 2016 FY 2017
Subsidy per Passenger
$11094 $10844
$0
$50
$100
$150
$200
FY 2013 FY 2014 FY 2015 FY 2016 FY 2017
Cost per Revenue Hour
125Supplemental
Days of Service School DaysAvg Freq (Wkdy Peak) 4 trips
Avg Freq (Wkdy Non-Peak) -Avg Freq (Wked) -
FY 2017 Farebox Recovery 16 transfer (to route) 1
Clipper usage 8
Annual Avg Monthly Avg Daily Annual Avg Monthly Avg Daily Annual Avg Monthly Avg DailyWeekday 13757 1251 76 600 55 3 8580 780 48 Saturday - - - - - - - - - Sunday - - - - - - - - -
Total 13757 1251 76 600 55 3 8580 780 48
Annual Avg Monthly Avg Daily Annual Avg Monthly Avg Daily Annual Avg Monthly Avg DailyWeekday $72469 $6588 $403 $11570 $1052 $64 $60899 $5536 $338Saturday $ - $ - $ - $ - $ - $ - $ - $ - $ -Sunday $ - $ - $ - $ - $ - $ - $ - $ - $ -
Total $72469 $6588 $403 $11570 $1052 $64 $60899 $5536 $338
Passengers per TripSubsidy per
PassengerCost per Revenue
HourFarebox Recovery
Weekday 193 $443 $12086 160Saturday - $ - $ - - Sunday - $ - $ - -
Total 193 $443 $12086 160
Passengers Revenue Hours Operating CostsPassenger
RevenueOperating Subsidy Passengers per Trip
Subsidy per Passenger
Cost per Revenue Hour
Farebox Recovery
FY 2015 13298 578 $87015 $11914 $75101 186 $565 $15054 137FY 2016 13197 595 $77991 $12684 $65307 182 $495 $13117 163FY 2017 13757 600 $72469 $11570 $60899 193 $443 $12086 160
Histo
ric Tr
ends
FY 20
161
7 DAT
A
Passengers Revenue Hours Revenue Miles
Operating Costs Passenger Revenue Operating Subsidy
8798 7189
13298 13197 13757
02000400060008000
10000120001400016000
FY 2013 FY 2014 FY 2015 FY 2016 FY 2017
Passengers
100 90
578 595 600
0
100
200
300
400
500
600
700
FY 2013 FY 2014 FY 2015 FY 2016 FY 2017
Revenue Hours
$13752 $10979
$87015 $77991
$72469
$0
$20000
$40000
$60000
$80000
$100000
FY 2013 FY 2014 FY 2015 FY 2016 FY 2017
Operating Costs
492
402
186 182 193
00
100
200
300
400
500
FY 2013 FY 2014 FY 2015 FY 2016 FY 2017
Passengers per Trip
$015 $002
$565 $495
$443
$000$100$200$300$400$500$600$700$800
FY 2013 FY 2014 FY 2015 FY 2016 FY 2017
Subsidy per Passenger$13821
$12267
$15054 $13117
$12086
$0$20$40$60$80
$100$120$140$160
FY 2013 FY 2014 FY 2015 FY 2016 FY 2017
Cost per Revenue Hour
139Supplemental
Days of Service School DaysAvg Freq (Wkdy Peak) 2 trips
Avg Freq (Wkdy Non-Peak) -Avg Freq (Wked) -
FY 2017 Farebox Recovery 20 transfer (to route) 0
Clipper usage 24
Annual Avg Monthly Avg Daily Annual Avg Monthly Avg Daily Annual Avg Monthly Avg DailyWeekday 6414 583 36 253 23 1 4127 375 23 Saturday - - - - - - - - - Sunday - - - - - - - - -
Total 6414 583 36 253 23 1 4127 375 23
Annual Avg Monthly Avg Daily Annual Avg Monthly Avg Daily Annual Avg Monthly Avg DailyWeekday $33182 $3017 $184 $6635 $603 $37 $26547 $2413 $147Saturday $ - $ - $ - $ - $ - $ - $ - $ - $ -Sunday $ - $ - $ - $ - $ - $ - $ - $ - $ -
Total $33182 $3017 $184 $6635 $603 $37 $26547 $2413 $147
Passengers per TripSubsidy per
PassengerCost per Revenue
HourFarebox Recovery
Weekday 179 $414 $13110 200Saturday - $ - $ - - Sunday - $ - $ - -
Total 179 $414 $13110 200
Passengers Revenue Hours Operating CostsPassenger
RevenueOperating Subsidy Passengers per Trip
Subsidy per Passenger
Cost per Revenue Hour
Farebox Recovery
FY 2015 5906 225 $36437 $5258 $31179 164 $528 $16173 144FY 2016 6391 315 $43776 $6241 $37535 160 $587 $13880 143FY 2017 6414 253 $33182 $6635 $26547 179 $414 $13110 200
Histo
ric Tr
ends
FY 20
161
7 DAT
A
Passengers Revenue Hours Revenue Miles
Operating Costs Passenger Revenue Operating Subsidy
4232 4026
5906 6391 6414
0
1000
2000
3000
4000
5000
6000
7000
FY 2013 FY 2014 FY 2015 FY 2016 FY 2017
Passengers
226 227 225
315
253
0
50
100
150
200
250
300
350
FY 2013 FY 2014 FY 2015 FY 2016 FY 2017
Revenue Hours
$31306 $27734
$36437
$43776
$33182
$0
$10000
$20000
$30000
$40000
$50000
FY 2013 FY 2014 FY 2015 FY 2016 FY 2017
Operating Costs
120 111 164 160 179
00
100
200
300
400
500
FY 2013 FY 2014 FY 2015 FY 2016 FY 2017
Passengers per Trip
$427
$628 $528
$587
$414
$000$100$200$300$400$500$600$700$800
FY 2013 FY 2014 FY 2015 FY 2016 FY 2017
Subsidy per Passenger
$13834 $12239
$16173 $13880 $13110
$0
$50
$100
$150
$200
FY 2013 FY 2014 FY 2015 FY 2016 FY 2017
Cost per Revenue Hour
145Supplemental
Days of Service School DaysAvg Freq (Wkdy Peak) 2-3 trips
Avg Freq (Wkdy Non-Peak) -Avg Freq (Wked) -
FY 2017 Farebox Recovery 29 transfer (to route) 5
Clipper usage 2
Annual Avg Monthly Avg Daily Annual Avg Monthly Avg Daily Annual Avg Monthly Avg DailyWeekday 16406 1491 90 191 17 1 2175 198 12 Saturday - - - - - - - - - Sunday - - - - - - - - -
Total 16406 1491 90 191 17 1 2175 198 12
Annual Avg Monthly Avg Daily Annual Avg Monthly Avg Daily Annual Avg Monthly Avg DailyWeekday $25426 $2311 $139 $7258 $660 $40 $18168 $1652 $99Saturday $ - $ - $ - $ - $ - $ - $ - $ - $ -Sunday $ - $ - $ - $ - $ - $ - $ - $ - $ -
Total $25426 $2311 $139 $7258 $660 $40 $18168 $1652 $99
Passengers per TripSubsidy per
PassengerCost per Revenue
HourFarebox Recovery
Weekday 372 $111 $13347 285Saturday - $ - $ - - Sunday - $ - $ - -
Total 372 $111 $13347 285
Passengers Revenue Hours Operating CostsPassenger
RevenueOperating Subsidy Passengers per Trip
Subsidy per Passenger
Cost per Revenue Hour
Farebox Recovery
FY 2015 6911 87 $13373 $5858 $7515 337 $109 $15442 438FY 2016 10268 167 $21672 $6341 $15331 396 $149 $12993 293FY 2017 16406 191 $25426 $7258 $18168 372 $111 $13347 285
Histo
ric Tr
ends
FY 20
161
7 DAT
A
Passengers Revenue Hours Revenue Miles
Operating Costs Passenger Revenue Operating Subsidy
6911
10268
16406
0
5000
10000
15000
20000
FY 2013 FY 2014 FY 2015 FY 2016 FY 2017
Passengers
87
167 191
0
50
100
150
200
250
FY 2013 FY 2014 FY 2015 FY 2016 FY 2017
Revenue Hours
$13373
$21672 $25426
$0
$5000
$10000
$15000
$20000
$25000
$30000
FY 2013 FY 2014 FY 2015 FY 2016 FY 2017
Operating Costs
337 396 372
00
100
200
300
400
500
FY 2013 FY 2014 FY 2015 FY 2016 FY 2017
Passengers per Trip
$109 $149 $111
$000$100$200$300$400$500$600$700$800
FY 2013 FY 2014 FY 2015 FY 2016 FY 2017
Subsidy per Passenger
$15442 $12993 $13347
$0
$50
$100
$150
$200
FY 2013 FY 2014 FY 2015 FY 2016 FY 2017
Cost per Revenue Hour
151Supplemental
Days of Service School DaysAvg Freq (Wkdy Peak) 4-5 trips
Avg Freq (Wkdy Non-Peak) -Avg Freq (Wked) -
FY 2017 Farebox Recovery 25 transfer (to route) 1
Clipper usage 4
Annual Avg Monthly Avg Daily Annual Avg Monthly Avg Daily Annual Avg Monthly Avg DailyWeekday 36801 3346 204 594 54 3 10649 968 59 Saturday - - - - - - - - - Sunday - - - - - - - - -
Total 36801 3346 204 594 54 3 10649 968 59
Annual Avg Monthly Avg Daily Annual Avg Monthly Avg Daily Annual Avg Monthly Avg DailyWeekday $73842 $6713 $410 $18463 $1678 $103 $55379 $5034 $308Saturday $ - $ - $ - $ - $ - $ - $ - $ - $ -Sunday $ - $ - $ - $ - $ - $ - $ - $ - $ -
Total $73842 $6713 $410 $18463 $1678 $103 $55379 $5034 $308
Passengers per TripSubsidy per
PassengerCost per Revenue
HourFarebox Recovery
Weekday 428 $150 $12442 250Saturday - $ - $ - - Sunday - $ - $ - -
Total 428 $150 $12442 250
Passengers Revenue Hours Operating CostsPassenger
RevenueOperating Subsidy Passengers per Trip
Subsidy per Passenger
Cost per Revenue Hour
Farebox Recovery
FY 2015 39309 911 $134174 $34376 $99798 315 $254 $14722 256FY 2016 42643 759 $100712 $25851 $74861 456 $176 $13267 257FY 2017 36801 594 $73842 $18463 $55379 428 $150 $12442 250
Histo
ric Tr
ends
FY 20
161
7 DAT
A
Passengers Revenue Hours Revenue Miles
Operating Costs Passenger Revenue Operating Subsidy
39537 39309
42643
36801
32000
34000
36000
38000
40000
42000
44000
FY 2013 FY 2014 FY 2015 FY 2016 FY 2017
Passengers
784 911
759
594
0
200
400
600
800
1000
FY 2013 FY 2014 FY 2015 FY 2016 FY 2017
Revenue Hours
$95932
$134174
$100712
$73842
$0$20000$40000$60000$80000
$100000$120000$140000$160000
FY 2013 FY 2014 FY 2015 FY 2016 FY 2017
Operating Costs
368 315
456 428
00
100
200
300
400
500
FY 2013 FY 2014 FY 2015 FY 2016 FY 2017
Passengers per Trip
$188 $254
$176 $150
$000$100$200$300$400$500$600$700$800
FY 2013 FY 2014 FY 2015 FY 2016 FY 2017
Subsidy per Passenger
$12233
$14722 $13267 $12442
$0$20$40$60$80
$100$120$140$160
FY 2013 FY 2014 FY 2015 FY 2016 FY 2017
Cost per Revenue Hour
154Supplemental
Days of Service School DaysAvg Freq (Wkdy Peak) 3 trips
Avg Freq (Wkdy Non-Peak) -Avg Freq (Wked) -
FY 2017 Farebox Recovery 21 transfer (to route) 0
Clipper usage 5
Annual Avg Monthly Avg Daily Annual Avg Monthly Avg Daily Annual Avg Monthly Avg DailyWeekday 13738 1249 76 358 33 2 4342 395 24 Saturday - - - - - - - - - Sunday - - - - - - - - -
Total 13738 1249 76 358 33 2 4342 395 24
Annual Avg Monthly Avg Daily Annual Avg Monthly Avg Daily Annual Avg Monthly Avg DailyWeekday $41965 $3815 $233 $8847 $804 $49 $33118 $3011 $184Saturday $ - $ - $ - $ - $ - $ - $ - $ - $ -Sunday $ - $ - $ - $ - $ - $ - $ - $ - $ -
Total $41965 $3815 $233 $8847 $804 $49 $33118 $3011 $184
Passengers per TripSubsidy per
PassengerCost per Revenue
HourFarebox Recovery
Weekday 255 $241 $11729 211Saturday - $ - $ - - Sunday - $ - $ - -
Total 255 $241 $11729 211
Passengers Revenue Hours Operating CostsPassenger
RevenueOperating Subsidy Passengers per Trip
Subsidy per Passenger
Cost per Revenue Hour
Farebox Recovery
FY 2015 15376 293 $42604 $13174 $29430 388 $191 $14541 309FY 2016 17858 360 $46133 $14660 $31473 311 $176 $12808 318FY 2017 13738 358 $41965 $8847 $33118 255 $241 $11729 211
Histo
ric Tr
ends
FY 20
161
7 DAT
A
Passengers Revenue Hours Revenue Miles
Operating Costs Passenger Revenue Operating Subsidy
12138
15376 17858
13738
0
5000
10000
15000
20000
FY 2013 FY 2014 FY 2015 FY 2016 FY 2017
Passengers
310 293
360 358
050
100150200250300350400
FY 2013 FY 2014 FY 2015 FY 2016 FY 2017
Revenue Hours
$37913 $42604
$46133 $41965
$0
$10000
$20000
$30000
$40000
$50000
FY 2013 FY 2014 FY 2015 FY 2016 FY 2017
Operating Costs
291
388
311 255
00
100
200
300
400
500
FY 2013 FY 2014 FY 2015 FY 2016 FY 2017
Passengers per Trip
$256 $191 $176
$241
$000$100$200$300$400$500$600$700$800
FY 2013 FY 2014 FY 2015 FY 2016 FY 2017
Subsidy per Passenger
$12246
$14541 $12808
$11729
$0$20$40$60$80
$100$120$140$160
FY 2013 FY 2014 FY 2015 FY 2016 FY 2017
Cost per Revenue Hour
219Local Connector
Days of Service Wkdy Sa SuAvg Freq (Wkdy Peak) 30 min
Avg Freq (Wkdy Non-Peak) 30 minAvg Freq (Wked) 30 min
FY 2017 Farebox Recovery 11 transfer (to route) 20
Clipper usage 11
Annual Avg Monthly Avg Daily Annual Avg Monthly Avg Daily Annual Avg Monthly Avg DailyWeekday 40817 3401 161 5020 418 20 58766 4897 232 Saturday 4888 407 94 637 53 12 10931 911 210 Sunday 4744 395 79 735 61 12 12607 1051 210
Total 50449 4204 138 6392 533 18 82304 6859 225
Annual Avg Monthly Avg Daily Annual Avg Monthly Avg Daily Annual Avg Monthly Avg DailyWeekday $462388 $38532 $1828 $51411 $4284 $203 $410977 $34248 $1624Saturday $59904 $4992 $1152 $6230 $519 $120 $53674 $4473 $1032Sunday $68932 $5744 $1149 $6460 $538 $108 $62472 $5206 $1041
Total $591224 $49269 $1620 $64101 $5342 $176 $527123 $43927 $1444
Passengers per Revenue Hour
Subsidy per Passenger
Cost per Revenue Hour
Farebox Recovery
Weekday 81 $1007 $9212 111Saturday 77 $1098 $9401 104Sunday 65 $1317 $9381 94
Total 79 $1045 $9250 108
Passengers Revenue Hours Operating CostsPassenger
RevenueOperating Subsidy
Passengers per Revenue Hour
Subsidy per Passenger
Cost per Revenue Hour
Farebox Recovery
FY 2015 60906 6585 $569962 $65747 $504215 92 $828 $8656 115FY 2016 55610 6591 $590663 $73164 $517499 84 $931 $8961 124FY 2017 50449 6392 $591224 $64101 $527123 79 $1045 $9250 108
Histo
ric Tr
ends
FY 20
161
7 DAT
A
Passengers Revenue Hours Revenue Miles
Operating Costs Passenger Revenue Operating Subsidy
55543 60906
55610 50449
0
10000
20000
30000
40000
50000
60000
70000
FY 2013 FY 2014 FY 2015 FY 2016 FY 2017
Passengers
5734
6585 6591 6392
520054005600580060006200640066006800
FY 2013 FY 2014 FY 2015 FY 2016 FY 2017
Revenue Hours
$522978
$569962
$590663 $591224
$480000
$500000
$520000
$540000
$560000
$580000
$600000
FY 2013 FY 2014 FY 2015 FY 2016 FY 2017
Operating Costs
97 92 84 79
00
20
40
60
80
100
120
140
FY 2013 FY 2014 FY 2015 FY 2016 FY 2017
Passengers per Revenue Hour
$851 $828 $931
$1045
$000$200$400$600$800
$1000$1200$1400
FY 2013 FY 2014 FY 2015 FY 2016 FY 2017
Subsidy per Passenger
$9121 $8656 $8961 $9250
$0
$50
$100
$150
$200
FY 2013 FY 2014 FY 2015 FY 2016 FY 2017
Cost per Revenue Hour
228Local Connector
Days of Service Wkdy Sa SuAvg Freq (Wkdy Peak) 60 min
Avg Freq (Wkdy Non-Peak) 60 minAvg Freq (Wked) 60 min
FY 2017 Farebox Recovery 11 transfer (to route) 17
Clipper usage 15
Annual Avg Monthly Avg Daily Annual Avg Monthly Avg Daily Annual Avg Monthly Avg DailyWeekday 57316 4776 227 7175 598 28 65884 5490 260 Saturday 8218 685 158 1331 111 26 13020 1085 250 Sunday 5806 484 97 1536 128 26 15023 1252 250
Total 71340 5945 195 10042 837 28 93926 7827 257
Annual Avg Monthly Avg Daily Annual Avg Monthly Avg Daily Annual Avg Monthly Avg DailyWeekday $646194 $53850 $2554 $80857 $6738 $320 $565337 $47111 $2235Saturday $120205 $10017 $2312 $12568 $1047 $242 $107637 $8970 $2070Sunday $138407 $11534 $2307 $10487 $874 $175 $127920 $10660 $2132
Total $904806 $75401 $2479 $103912 $8659 $285 $800894 $66741 $2194
Passengers per Revenue Hour
Subsidy per Passenger
Cost per Revenue Hour
Farebox Recovery
Weekday 80 $986 $9006 125Saturday 62 $1310 $9030 105Sunday 38 $2203 $9011 76
Total 71 $1123 $9010 115
Passengers Revenue Hours Operating CostsPassenger
RevenueOperating Subsidy
Passengers per Revenue Hour
Subsidy per Passenger
Cost per Revenue Hour
Farebox Recovery
FY 2015 15287 2828 $239879 $18274 $221605 54 $1450 $8482 76FY 2016 17522 3185 $280634 $28092 $252542 55 $1441 $8812 100FY 2017 71340 10042 $904806 $103912 $800894 71 $1123 $9010 115
Histo
ric Tr
ends
FY 20
161
7 DAT
A
Passengers Revenue Hours Revenue Miles
Operating Costs Passenger Revenue Operating Subsidy
5854 15287 17522
71340
01000020000300004000050000600007000080000
FY 2013 FY 2014 FY 2015 FY 2016 FY 2017
Passengers
970
2828 3185
10042
0
2000
4000
6000
8000
10000
12000
FY 2013 FY 2014 FY 2015 FY 2016 FY 2017
Revenue Hours
$85183
$239879 $280634
$904806
$0
$200000
$400000
$600000
$800000
$1000000
FY 2013 FY 2014 FY 2015 FY 2016 FY 2017
Operating Costs
60 54 55 71
00
20
40
60
80
100
120
140
FY 2013 FY 2014 FY 2015 FY 2016 FY 2017
Passengers per Revenue Hour$1358
$1450 $1441
$1123
$000$200$400$600$800
$1000$1200$1400
FY 2013 FY 2014 FY 2015 FY 2016 FY 2017
Subsidy per Passenger
$8779 $8482 $8812 $9010
$0
$50
$100
$150
$200
FY 2013 FY 2014 FY 2015 FY 2016 FY 2017
Cost per Revenue Hour
233Local Connector
Days of Service Wkdy Sa SuAvg Freq (Wkdy Peak) 60 min
Avg Freq (Wkdy Non-Peak) 60 minAvg Freq (Wked) 60 min
FY 2017 Farebox Recovery 13 transfer (to route) 16
Clipper usage 10
Annual Avg Monthly Avg Daily Annual Avg Monthly Avg Daily Annual Avg Monthly Avg DailyWeekday 35589 2966 141 3306 276 13 38809 3234 153 Saturday 3911 326 75 490 41 9 5829 486 112 Sunday 3298 275 55 566 47 9 6726 561 112
Total 42798 3567 117 4363 364 12 51364 4280 141
Annual Avg Monthly Avg Daily Annual Avg Monthly Avg Daily Annual Avg Monthly Avg DailyWeekday $302758 $25230 $1197 $42450 $3538 $168 $260308 $21692 $1029Saturday $44829 $3736 $862 $5018 $418 $97 $39811 $3318 $766Sunday $51616 $4301 $860 $4533 $378 $76 $47083 $3924 $785
Total $399203 $33267 $1094 $52001 $4333 $142 $347202 $28934 $951
Passengers per Revenue Hour
Subsidy per Passenger
Cost per Revenue Hour
Farebox Recovery
Weekday 108 $731 $9158 140Saturday 80 $1018 $9141 112Sunday 58 $1428 $9118 88
Total 98 $811 $9151 130
Passengers Revenue Hours Operating CostsPassenger
RevenueOperating Subsidy
Passengers per Revenue Hour
Subsidy per Passenger
Cost per Revenue Hour
Farebox Recovery
FY 2015 50342 4366 $371602 $52526 $319076 115 $634 $8512 141FY 2016 49494 4384 $388005 $59296 $328709 113 $664 $8851 153FY 2017 42798 4363 $399203 $52001 $347202 98 $811 $9151 130
Histo
ric Tr
ends
FY 20
161
7 DAT
A
Passengers Revenue Hours Revenue Miles
Operating Costs Passenger Revenue Operating Subsidy
39956
50422 50342 49494 42798
0
10000
20000
30000
40000
50000
60000
FY 2013 FY 2014 FY 2015 FY 2016 FY 2017
Passengers
3981
4144
4366 4384 4363
370038003900400041004200430044004500
FY 2013 FY 2014 FY 2015 FY 2016 FY 2017
Revenue Hours
$350499
$378792 $371602
$388005 $399203
$320000$330000$340000$350000$360000$370000$380000$390000$400000$410000
FY 2013 FY 2014 FY 2015 FY 2016 FY 2017
Operating Costs
100
122 115 113 98
00
20
40
60
80
100
120
140
FY 2013 FY 2014 FY 2015 FY 2016 FY 2017
Passengers per Revenue Hour
$760 $661 $634 $664
$811
$000$200$400$600$800
$1000$1200$1400
FY 2013 FY 2014 FY 2015 FY 2016 FY 2017
Subsidy per Passenger
$8805 $9142 $8512 $8851 $9151
$0
$50
$100
$150
$200
FY 2013 FY 2014 FY 2015 FY 2016 FY 2017
Cost per Revenue Hour
245Local Connector
Days of Service Wkdy Sa SuAvg Freq (Wkdy Peak) 60 min
Avg Freq (Wkdy Non-Peak) 60 minAvg Freq (Wked) 60 min
FY 2017 Farebox Recovery 15 transfer (to route) 13
Clipper usage 13
Annual Avg Monthly Avg Daily Annual Avg Monthly Avg Daily Annual Avg Monthly Avg DailyWeekday 41761 3480 165 3014 251 12 28706 2392 113 Saturday 4220 352 81 620 52 12 5778 482 111 Sunday 3785 315 63 715 60 12 6667 556 111
Total 49766 4147 136 4349 362 12 41152 3429 113
Annual Avg Monthly Avg Daily Annual Avg Monthly Avg Daily Annual Avg Monthly Avg DailyWeekday $271762 $22647 $1074 $44873 $3739 $177 $226889 $18907 $897Saturday $55697 $4641 $1071 $6217 $518 $120 $49480 $4123 $952Sunday $64137 $5345 $1069 $5878 $490 $98 $58259 $4855 $971
Total $391596 $32633 $1073 $56968 $4747 $156 $334628 $27886 $917
Passengers per Revenue Hour
Subsidy per Passenger
Cost per Revenue Hour
Farebox Recovery
Weekday 139 $543 $9016 165Saturday 68 $1173 $8988 112Sunday 53 $1539 $8970 92
Total 114 $672 $9004 145
Passengers Revenue Hours Operating CostsPassenger
RevenueOperating Subsidy
Passengers per Revenue Hour
Subsidy per Passenger
Cost per Revenue Hour
Farebox Recovery
FY 2015FY 2016 2184 227 $19695 $3137 $16558 96 $758 $8695 159FY 2017 49766 4349 $391596 $56968 $334628 114 $672 $9004 145
Histo
ric Tr
ends
FY 20
161
7 DAT
A
Passengers Revenue Hours Revenue Miles
Operating Costs Passenger Revenue Operating Subsidy
2184
49766
0
10000
20000
30000
40000
50000
60000
FY 2013 FY 2014 FY 2015 FY 2016 FY 2017
Passengers
227
4349
0
1000
2000
3000
4000
5000
FY 2013 FY 2014 FY 2015 FY 2016 FY 2017
Revenue Hours
$19695
$391596
$0
$100000
$200000
$300000
$400000
$500000
FY 2013 FY 2014 FY 2015 FY 2016 FY 2017
Operating Costs
96 114
00
20
40
60
80
100
120
140
FY 2013 FY 2014 FY 2015 FY 2016 FY 2017
Passengers per Revenue Hour
$758 $672
$000$200$400$600$800
$1000$1200$1400
FY 2013 FY 2014 FY 2015 FY 2016 FY 2017
Subsidy per Passenger
$8695 $9004
$0
$50
$100
$150
$200
FY 2013 FY 2014 FY 2015 FY 2016 FY 2017
Cost per Revenue Hour
251Local Connector
Days of Service Wkdy Sa SuAvg Freq (Wkdy Peak) 60 min
Avg Freq (Wkdy Non-Peak) 60 minAvg Freq (Wked) 60 min
FY 2017 Farebox Recovery 11 transfer (to route) 8
Clipper usage 8
Annual Avg Monthly Avg Daily Annual Avg Monthly Avg Daily Annual Avg Monthly Avg DailyWeekday 76675 6390 303 6754 563 27 95654 7971 378 Saturday 9952 829 191 1325 110 25 18630 1553 358 Sunday 8879 740 148 1528 127 25 21497 1791 358
Total 95506 7959 262 9607 801 26 135781 11315 372
Annual Avg Monthly Avg Daily Annual Avg Monthly Avg Daily Annual Avg Monthly Avg DailyWeekday $625542 $52129 $2472 $78006 $6501 $308 $547536 $45628 $2164Saturday $122485 $10207 $2355 $12104 $1009 $233 $110381 $9198 $2123Sunday $140992 $11749 $2350 $11713 $976 $195 $129279 $10773 $2155
Total $889019 $74085 $2436 $101823 $8485 $279 $787196 $65600 $2157
Passengers per Revenue Hour
Subsidy per Passenger
Cost per Revenue Hour
Farebox Recovery
Weekday 114 $714 $9262 125Saturday 75 $1109 $9246 99Sunday 58 $1456 $9225 83
Total 99 $824 $9254 115
Passengers Revenue Hours Operating CostsPassenger
RevenueOperating Subsidy
Passengers per Revenue Hour
Subsidy per Passenger
Cost per Revenue Hour
Farebox Recovery
FY 2015 97647 9172 $800242 $103081 $697161 106 $714 $8725 129FY 2016 98886 9226 $831623 $120959 $710664 107 $719 $9014 145FY 2017 95506 9607 $889019 $101823 $787196 99 $824 $9254 115
Histo
ric Tr
ends
FY 20
161
7 DAT
A
Passengers Revenue Hours Revenue Miles
Operating Costs Passenger Revenue Operating Subsidy
87073
97647 98886
95506
80000
85000
90000
95000
100000
FY 2013 FY 2014 FY 2015 FY 2016 FY 2017
Passengers
8322
9172 9226
9607
7500
8000
8500
9000
9500
10000
FY 2013 FY 2014 FY 2015 FY 2016 FY 2017
Revenue Hours
$772570
$800242
$831623
$889019
$700000
$750000
$800000
$850000
$900000
FY 2013 FY 2014 FY 2015 FY 2016 FY 2017
Operating Costs
105 106 107 99
00
20
40
60
80
100
120
140
FY 2013 FY 2014 FY 2015 FY 2016 FY 2017
Passengers per Revenue Hour
$797 $714 $719
$824
$000$200$400$600$800
$1000$1200$1400
FY 2013 FY 2014 FY 2015 FY 2016 FY 2017
Subsidy per Passenger
$9284 $8725 $9014 $9254
$0
$50
$100
$150
$200
FY 2013 FY 2014 FY 2015 FY 2016 FY 2017
Cost per Revenue Hour
257Local Connector
Days of Service WkdyAvg Freq (Wkdy Peak) 60 min
Avg Freq (Wkdy Non-Peak) 60 minAvg Freq (Wked) -
FY 2017 Farebox Recovery 12 transfer (to route) 6
Clipper usage 13
Annual Avg Monthly Avg Daily Annual Avg Monthly Avg Daily Annual Avg Monthly Avg DailyWeekday 69126 5761 273 7643 637 30 85748 7146 339 Saturday - - - - - - - - - Sunday - - - - - - - - -
Total 69126 5761 273 7643 637 30 85748 7146 339
Annual Avg Monthly Avg Daily Annual Avg Monthly Avg Daily Annual Avg Monthly Avg DailyWeekday $697953 $58163 $2759 $82621 $6885 $327 $615332 $51278 $2432Saturday $ - $ - $ - $ - $ - $ - $ - $ - $ -Sunday $ - $ - $ - $ - $ - $ - $ - $ - $ -
Total $697953 $58163 $2759 $82621 $6885 $327 $615332 $51278 $2432
Passengers per Revenue Hour
Subsidy per Passenger
Cost per Revenue Hour
Farebox Recovery
Weekday 90 $890 $9132 118Saturday - $ - $ - - Sunday - $ - $ - -
Total 90 $890 $9132 118
Passengers Revenue Hours Operating CostsPassenger
RevenueOperating Subsidy
Passengers per Revenue Hour
Subsidy per Passenger
Cost per Revenue Hour
Farebox Recovery
FY 2015 69984 6289 $546363 $73402 $472961 111 $676 $8687 134FY 2016 71429 6414 $575805 $83288 $492517 111 $690 $8977 145FY 2017 69126 7643 $697953 $82621 $615332 90 $890 $9132 118
Histo
ric Tr
ends
FY 20
161
7 DAT
A
Passengers Revenue Hours Revenue Miles
Operating Costs Passenger Revenue Operating Subsidy
35511
68515 69984 71429 69126
01000020000300004000050000600007000080000
FY 2013 FY 2014 FY 2015 FY 2016 FY 2017
Passengers
2909
5965 6289 6414 7643
0
2000
4000
6000
8000
10000
FY 2013 FY 2014 FY 2015 FY 2016 FY 2017
Revenue Hours
$263500
$555608 $546363 $575805
$697953
$0$100000$200000$300000$400000$500000$600000$700000$800000
FY 2013 FY 2014 FY 2015 FY 2016 FY 2017
Operating Costs
122 115 111 111
90
00
20
40
60
80
100
120
140
FY 2013 FY 2014 FY 2015 FY 2016 FY 2017
Passengers per Revenue Hour
$625 $721 $676 $690
$890
$000$200$400$600$800
$1000$1200$1400
FY 2013 FY 2014 FY 2015 FY 2016 FY 2017
Subsidy per Passenger
$9057 $9315 $8687 $8977 $9132
$0
$50
$100
$150
$200
FY 2013 FY 2014 FY 2015 FY 2016 FY 2017
Cost per Revenue Hour
Hdn ValleyYellow Bus
Days of Service School DaysAvg Freq (Wkdy Peak) 2 trips
Avg Freq (Wkdy Non-Peak) -Avg Freq (Wked) -
FY 2017 Farebox Recovery 26 transfer (to route) -
Clipper usage -
Annual Avg Monthly Avg Daily Annual Avg Monthly Avg Daily Annual Avg Monthly Avg DailyWeekday 9281 844 52 180 16 1 1638 149 9 Saturday - - - - - - - - - Sunday - - - - - - - - -
Total 9281 844 52 180 16 1 1638 149 9
Annual Avg Monthly Avg Daily Annual Avg Monthly Avg Daily Annual Avg Monthly Avg DailyWeekday $124763 $11342 $693 $32170 $2925 $179 $92593 $8418 $514Saturday $ - $ - $ - $ - $ - $ - $ - $ - $ -Sunday $ - $ - $ - $ - $ - $ - $ - $ - $ -
Total $124763 $11342 $693 $32170 $2925 $179 $92593 $8418 $514
Passengers per Revenue Hour
Subsidy per Passenger
Cost per Revenue Hour
Farebox Recovery
Weekday 516 $998 $69313 258Saturday - $ - $ - - Sunday - $ - $ - -
Total 516 $998 $69313 258
Passengers Revenue Hours Operating CostsPassenger
RevenueOperating Subsidy
Passengers per Revenue Hour
Subsidy per Passenger
Cost per Revenue Hour
Farebox Recovery
FY 2015FY 2016 8669 211 $140482 $25658 $114824 412 $1325 $66706 183FY 2017 9281 180 $124763 $32170 $92593 516 $998 $69313 258
Histo
ric Tr
ends
FY 20
161
7 DAT
A
Passengers Revenue Hours Revenue Miles
Operating Costs Passenger Revenue Operating Subsidy
8669 9281
0
2000
4000
6000
8000
10000
FY 2013 FY 2014 FY 2015 FY 2016 FY 2017
Passengers211
180
0
50
100
150
200
250
FY 2013 FY 2014 FY 2015 FY 2016 FY 2017
Revenue Hours$140482
$124763
$0$20000$40000$60000$80000
$100000$120000$140000$160000
FY 2013 FY 2014 FY 2015 FY 2016 FY 2017
Operating Costs
412 516
00
500
1000
1500
2000
FY 2013 FY 2014 FY 2015 FY 2016 FY 2017
Passengers per Revenue Hour
$1325
$998
$000
$200
$400
$600
$800
$1000
$1200
$1400
FY 2013 FY 2014 FY 2015 FY 2016 FY 2017
Subsidy per Passenger
$66706 $69313
$0$100$200$300$400$500$600$700$800
FY 2013 FY 2014 FY 2015 FY 2016 FY 2017
Cost per Revenue Hour
White HillYellow Bus
Days of Service School DaysAvg Freq (Wkdy Peak) 17 trips
Avg Freq (Wkdy Non-Peak) -Avg Freq (Wked) -
FY 2017 Farebox Recovery 60 transfer (to route) -
Clipper usage -
Annual Avg Monthly Avg Daily Annual Avg Monthly Avg Daily Annual Avg Monthly Avg DailyWeekday 127219 11565 707 1065 97 6 12096 1100 67 Saturday - - - - - - - - - Sunday - - - - - - - - -
Total 127219 11565 707 1065 97 6 12096 1100 67
Annual Avg Monthly Avg Daily Annual Avg Monthly Avg Daily Annual Avg Monthly Avg DailyWeekday $738585 $67144 $4103 $440896 $40081 $2449 $297689 $27063 $1654Saturday $ - $ - $ - $ - $ - $ - $ - $ - $ -Sunday $ - $ - $ - $ - $ - $ - $ - $ - $ -
Total $738585 $67144 $4103 $440896 $40081 $2449 $297689 $27063 $1654
Passengers per Revenue Hour
Subsidy per Passenger
Cost per Revenue Hour
Farebox Recovery
Weekday 1194 $234 $69325 597Saturday - $ - $ - - Sunday - $ - $ - -
Total 1194 $234 $69325 597
Passengers Revenue Hours Operating CostsPassenger
RevenueOperating Subsidy
Passengers per Revenue Hour
Subsidy per Passenger
Cost per Revenue Hour
Farebox Recovery
FY 2015FY 2016 129635 870 $579937 $385753 $194184 1491 $150 $66698 665FY 2017 127219 1065 $738585 $440896 $297689 1194 $234 $69325 597
Histo
ric Tr
ends
FY 20
161
7 DAT
A
Passengers Revenue Hours Revenue Miles
Operating Costs Passenger Revenue Operating Subsidy
129635 127219
0
20000
40000
60000
80000
100000
120000
140000
FY 2013 FY 2014 FY 2015 FY 2016 FY 2017
Passengers
870
1065
0
200
400
600
800
1000
1200
FY 2013 FY 2014 FY 2015 FY 2016 FY 2017
Revenue Hours
$579937
$738585
$0$100000$200000$300000$400000$500000$600000$700000$800000
FY 2013 FY 2014 FY 2015 FY 2016 FY 2017
Operating Costs
1491
1194
00200400600800
1000120014001600
FY 2013 FY 2014 FY 2015 FY 2016 FY 2017
Passengers per Revenue Hour
$150 $234
$000
$200
$400
$600
$800
$1000
$1200
$1400
FY 2013 FY 2014 FY 2015 FY 2016 FY 2017
Subsidy per Passenger$66698 $69325
$0$100$200$300$400$500$600$700$800
FY 2013 FY 2014 FY 2015 FY 2016 FY 2017
Cost per Revenue Hour
MARIN TRANSIT | 2018ndash2027 SHORT RANGE TRANSIT PLAN Chapter 4 Capital Plan
DRAFT 4-9
Table 4-7 Local Transit Bus Replacement Schedule
Fiscal Year (In-service)
Replacements
Total Cost
Local Share Vehicle Type Seating
Capacity Service(1)
FY 201718 10 $7710000 $1387800 40ft hybrid 39 LB
2 $1662000 $332404 35ft Electric 32 LB
FY 201819
1 $125000 $22500 24ft 20 SH
4 $1600000 $1094880 29ft XHF
(upgrade) 22 SG
FY 201920 10 $8940000 $1609200 60ft 63 LB
FY 202021 8 $1032000 $185760 24ft 20 SH
2 $850000 $153000 35ft XHF 37 MW
FY 202223
7 $5584578 $1005224 35ft hybrid 32 LB
2 $874182 $599281 29ft XHF
(upgrade) 22 SG
FY 202425 3 $1393227 $250781 35ft XHF 37 MW
FY 202526 2 $299093 $53837 24ft 20 SH
5 $2391706 $430507 35ft XHF 37 MW
FY 202627 - - - - - -
Notes (1) Service Types LB ndash Big Bus SH- Shuttle SG- Rural Stagecoach MW- Seasonal Muir Woods and School
Expansion Needs When considering service expansion vehicles are often a constraint on the amount of service that can be added Expansion vehicles are a lower priority in the regional capital plan and typically do not receive federal funds Local state or discretionary grants are required to expand fleets The capital plan does not include any expansion vehicles for the local fixed route program consistent with the current service plan
Marin Transit relies on three retired active vehicles to support operations Retired active vehicles are vehicles that are beyond their FTA-determined useful life that remain in service while their replacements are added the fleet The District intends to replace these as expansion vehicles if funding becomes available
Demand Response Vehicles
Marin Transit has 58 vehicles available for local and regional paratransit service To provide an adequate number of spare vehicles a maximum of about 46 vehicles in service Marin Transit owns 32 vehicles GGBHTD owns 14 and the contractor provides another 13 vehicles to support the operations Eleven of the 13 contractor vehicles will be replaced in early 2018 - five by the District and six by GGBHTD Two of the five replaced by the District will be replaced with smaller accessible vans These will be used for same day
Fixed-Route Passengers (incl Yellow Bus) by Month
July August September October November December January February March April May June
Prior Fiscal Year Passengers Current Fiscal Year PassengersPrior Fiscal Year Passengers Current Fiscal Year Passengers
0
80000
160000
240000
320000
244439
271284484271284
296637296637
2768532276853
252829252829
238010238010
219681219681
2097050505209705
277644277644
240773240773240773240773
284816284816
24935149492493512444392444392442 43999244439244244439439244439244244439999999244200
2600562602600 0000000260056
FISCAL YEAR
2018
Demand Response Passengers by Month
July August September October November December January February March April May June
Prior Fiscal Year Passengers Current Fiscal Year PassengersPrior Fiscal Year Passengers Current Fiscal Year Passengers
0
4000
8000
12000
16000
12 77312773
13631 1362813628 1356413564
1247712477
1206712067 1212412124118100011810
1364613646
1260912609
1359313593
12950129501277312 77312 77312 77312613131612 6133312 6133312613331277312773127731277312613
13 6311363113 631135641363113 613631311363113 6136313113564
Year-to-Date Ridership Trends
Item 3b
2
Average Systemwide Daily Passengers
Weekday Saturday Sunday
Prior Fiscal Year Average Daily Passengers Current Fiscal Year Average Daily PassengersPrior Fiscal Year Average Daily Passengers Current Fiscal Year Average Daily Passengers
0
3000
6000
9000
12000
11370113701109811098
7726772674407440
66576657
60556055
Productivity (paxhr) by Typology
1 Local T
runklin
e
2 Local B
asic
3 Local C
onnecto
r
5 R
ura
l
8 R
ecre
ational
9 D
em
and R
esponse
Prior Fiscal Year Productivity Current Fiscal Year ProductivityPrior Fiscal Year Productivity Current Fiscal Year Productivity
00
80
160
240
320
249249 252252
163163
14814 8148
9292 91918181
757 575
320320
275275
2323 2121
Monthly StatisticsMONTH
August
1 Local Trunkline Routes 35 36 71X
2 Local Basic Routes 17 22 23 23X 29 49
3 Local Connector Routes 219 228 233 245 251 257
5 Rural Routes 61 68
8 Recreational Routes 6666F
9 Demand Response Local Paratransit Novato Dial-A-Ride Rural Dial-A-Ride
Route Typologies
Item 3b
3
Fixed-Route Passengers (incl Yellow Bus) by Month
July August September October November December January February March April May June
Prior Fiscal Year Passengers Current Fiscal Year Passengers
0
80000
160000
240000
320000
244439244439
271284271284
296637296637
276853276853
252829252829
238010238010
219681219681209705209705
277644277644
240773240773
284816284816
249351249351244200244200
260056260056
282441282441
FISCAL YEAR
2018
Demand Response Passengers by Month
July August September October November December January February March April May June
Prior Fiscal Year Passengers Current Fiscal Year Passengers
0
4000
8000
12000
16000
1277312773
1363113631 1362813628 1356413564
12477124771206712067 1212412124
1181011810
1364613646
1260912609
1359313593
12950129501261312613
1356413564 1342713427
Year-to-Date Ridership Trends
Monthly Monitoring Report 11022017
Page 12Item 3b
2
Average Systemwide Daily Passengers
Weekday Saturday Sunday
Prior Fiscal Year Average Daily Passengers Current Fiscal Year Average Daily Passengers
0
3000
6000
9000
12000 11848118481161311613
73637363
67876787
6126612657395739
Productivity (paxhr) by Typology
1 L
ocal
Tru
nklin
e
2 L
ocal
Bas
ic
3 L
ocal
Con
nect
or
5 R
ural
8 R
ecre
atio
nal
9 D
eman
d R
espo
nse
Prior Fiscal Year Productivity Current Fiscal Year Productivity
00
80
160
240
320
278278 274274
174174 168168
9898 9797
7676 7676
304304
222222
2323 2222
Monthly StatisticsMONTH
September
1 Local Trunkline Routes 35 36 71X
2 Local Basic Routes 17 22 23 23X 29 49
3 Local Connector Routes 219 228 233 245 251 257
5 Rural Routes 61 68
8 Recreational Routes 6666F
9 Demand Response Local Paratransit Novato Dial-A-Ride Rural Dial-A-Ride
Route Typologies
Page 22Item 3b
3
Fixed-Route Passengers (incl Yellow Bus) by Month
July August September October November December January February March April May June
Prior Fiscal Year Passengers Current Fiscal Year Passengers
0
80000
160000
240000
320000
244439244439
271284271284
296637296637
276853276853
252829252829
238010238010
219681219681209705209705
277644277644
240773240773
284816284816
249351249351244200244200
260056260056
282441282441 282922282922
FISCAL YEAR
2018
Demand Response Passengers by Month
July August September October November December January February March April May June
Prior Fiscal Year Passengers Current Fiscal Year Passengers
0
4000
8000
12000
16000
1277312773
1363113631 1362813628 1356413564
12477124771206712067 1212412124
1181011810
1364613646
1260912609
1359313593
12950129501261312613
1356413564 13427134271373413734
Year-to-Date Ridership Trends
Monthly Monitoring Report 12082017
Page 12Item 3b
2
Average Systemwide Daily Passengers
Weekday Saturday Sunday
Prior Fiscal Year Average Daily Passengers Current Fiscal Year Average Daily Passengers
0
3000
6000
9000
120001125811258 1115111151
6043604364326432
4717471750675067
Productivity (paxhr) by Typology
1 L
ocal
Tru
nklin
e
2 L
ocal
Bas
ic
3 L
ocal
Con
nect
or
5 R
ural
8 R
ecre
atio
nal
9 D
eman
d R
espo
nse
Prior Fiscal Year Productivity Current Fiscal Year Productivity
00
70
140
210
280258258
270270
163163 161161
9696 9595
6363 7070
202202190190
2323 2121
Monthly StatisticsMONTH
October
1 Local Trunkline Routes 35 36 71X
2 Local Basic Routes 17 22 23 23X 29 49
3 Local Connector Routes 219 228 233 245 251 257
5 Rural Routes 61 68
8 Recreational Routes 6666F
9 Demand Response Local Paratransit Novato Dial-A-Ride Rural Dial-A-Ride
Route Typologies
Page 22Item 3b
3
- RFP - OampM for Fixed Route Service - Addendum 3 12-18-2017
- MV Fee Schedule
- Airporter Fee Schedule
- FY2017Performance
-
- System Performance Summary for FY 201617
-
- Fixed Route
- Yellow Bus
- Demand Response
- Other Services
-
- Performance Goals
- Ridership Trends
- FY 201718 Performance Outlook
-
- Attachment A Route Profiles
-
- Local Transit Bus Replacement Schedule
- August 2017 Monthly Monitoring Report
- September 2017 Monthly Monitoring Report
- October 2017 Monthly Monitoring Report
-
Addendum 3
2
from ldquoIf CONTRACTOR performs the work the payment to CONTRACTOR will be for replacement engines or transmissions (as the case may be)rdquo to ldquoIf CONTRACTOR performs the work the payment to CONTRACTOR will be for refreshment and replacement battery packs engines or transmissions (as the case may be)rdquo 9) Change the following text in Attachment I ndash Draft Operations and Maintenance Contract Sec 306 Vehicle Maintenance Major Engine and Transmission Overhauls from ldquoMCTD shall not pay for Major Engine and Transmission overhauls on CONTRACTOR owned vehiclesrdquo to ldquoMCTD shall not pay for Battery Pack refreshment and replacements Major Engine and Transmission overhauls on CONTRACTOR owned vehiclesrdquo 10) Change the following text in Attachment I ndash Draft Operations and Maintenance Contract Article 4-Compensation and Commercial Terms Sec 401 Compensation to Contractor Scope of Compensation Exclusion from Rates from ldquoCONTRACTOR shall not be responsible for (a)fuel costs of the Revenue Vehicles used in providing services under this Contract and (b) engine and transmission overhauls provided in Section 306B(h)rdquo to ldquoldquoCONTRACTOR shall not be responsible for (a)fuel costs of the Revenue Vehicles used in providing services under this Contract and (b) battery pack refreshment and replacement engine and transmission overhauls provided in Section 306B(h)
II SUMMARY OF QUESTIONS AND ANSWERS
Q12 Who are the current providers for Package 1 and 2 A12 Marin Airporter currently operates Routes 22 219 228 233 245 251 and 257 MV Transportation currently operates Routes 49 61 66 68 113 115 117 119 122 125 139 145 151 and 154 Packages 1 and 2 currently differ than what is identified in the RFP Q13 What is the current rate (hourly or monthly) for each contractor A13 The current fees and payment schedule for MV Transportation are provided in the current contract A copy of the fees and payment schedule is in the attachment to Addendum 3 The current fees and payment schedule for Marin Airporter are provided in the current contract A copy of the fees and payment schedule is in the attachment to Addendum 3 Q14 Are there any charter services required as part of the monthly service provision A14 Refer to the RFP ndash Attachment E FTA Grant Contract Provisions Charter Section
Addendum 3
3
Q15 Is there any bid preference for DBE or certified minority owned small businesses A15 Refer to RFP ndash Attachment E FTA Grant Contract Provisions DBE Participation Goal Q16 Is it possible to get copies of the three most recent monthly ridership reports A16 See the three most recent monthly ridership reports for Package 1 and Package 2 services in the attachment to Addendum 3 Q17 Is it possible to get copies of the three most recent monthly invoices A17 The Package 1 and 2 routes have been configured differently in the RFP than they are currently contracted See the historical performance data provided for Package 1 (Table 2 page 2) and 2 (Table 4 page 4) for insight on how each package of services performed when configured per the RFP Q18 What are the key areas that Marin Transit would like to see operator improvement in the next contract cycle A18 The Transit District is committed to operating a high-quality customer service-oriented service and expects all its contractors will perform to ensure expectations are met Refer to RFP Section 3 Scope of Work for contractor responsibilities Q19 What are the total annual hours of service for all routes A19 Refer to RFP Section 1 ndash General Information Service Description and System Performance Summary for FY201617 in the Attachment to Addendum 3 Q20 Are there any special employeedriver recruitmentretention benefits in place A20 We are aware of driver recruitment benefits offered by MV Transportation as shown in the job posting on their website httpscareersmvtransitcomen-USjobdrivers-2-000-sign-on-bonusJ3S0HL6XT9ZL05GT7MH We do not have any further information on any special employeedriver recruitmentretention benefits in place for contract operators
Addendum 3
4
Q21 Is there any preference for alternative fuel powered vehicles A21 Marin Transit is committed to reducing emission from the use of diesel fuel and strives to purchase hybrid and alternative fuel vehicles Q22 Please confirm RFP submission deadline Dec 22nd at 3pm A22 The RFP submission deadline has been changed to Friday January 12th 2018 at 300 pm PST as per Addendum 2 that was issued on 1282017 Q23 Under Company Financial Capacity Can we submit 3 years of Balance Sheets under separate cover to show our Financial Capacity to carry out the contract A23 Yes Proposers must submit a detailed company portfolio including the companyrsquos financial viability within the past three (3) years credit references ongoing projects and all pending litigations in which the company may be directly or indirectly involved Such documents may include company balance sheets Q24 Would Marin Transit please provide the fixed route alignments (route traces) in a digital spatial (gis) format such as kml andor shp for all routes contemplated in this RFP This would be the same data that was uploaded to Google Maps for the interactive maps on MCTDrsquos web site A24 The Fixed Route shapefiles are provided in KML format on Marin Transitrsquos website wwwmarintransitorgpurchasinghtml Q25 With regard to attachment E page 132 in section 2 Bonding Requirements Bid Guarantee Is a bid bond required If so please provide the dollar amount andor percentage A25 No Please refer to Addendum 1 (issued December 1 2017) where attachment E the FTA Grant Contract Provisions were replaced including removal of the bonding requirements Q26 Can Marin Transit please provide invoices for the past 6 months for Package 1 A26 The Package 1 and 2 routes have been configured differently in the RFP than they are currently contracted See the historical performance data provided for Package 1 (Table 2 page 2) and 2 (Table 4 page 4) for insight on how each package of services performed when configured per the RFP
Addendum 3
5
Q27 What liquidated damages were assessed if any to the current contractor for Package 1 A27 None There were no liquidated damages or performance penalties assessed for the current contractor of Package 1 The District maintains the right to assess performance penalties based on the Contractorrsquos failure to meet the established standards and any additional requirements by the District Q28 On page 13 in section 10 Intelligent Transportation Technology Plan (5 pts) does Marin Transit wish for bidders to re-alphabetize a) through e) or is it easier to keep the aabc d e format A28 Proposers should present their Intelligent Transportation Technology Plan ensuring that each required element is addressed Q29 On page 12 of the RFP section 6 Mobilization Plan (5 pts) section a) Project Schedule the last word is ldquoIncluderdquohellip was there more to this section or is it eluding to section 7 Facility A29 No The word ldquoIncluderdquo is a typographical error and should be eliminated Q30 Please confirm that bidders are required to include letters of intent for the facility(ies) proposed in their submittal A30 Refer to the RFP Section 2 ndash Terms and Conditions Proposal Requirements Facility Section Q31 With regard to section 3 Corporate Capacity Experience Past Performance can you please clarify this requirement Is the District requesting bidders to demonstrate 10 years of experience with similar systems and then to also identify contracts that have been in operation for 5 consecutive years as references A31 Proposers must provide a history of their company for the past 10 years and highlight 5 of those years where service was provided continuously and was similar in scope size and complexity to the service being proposed Q32 Attachment B Equipment Summary Would Marin Transit please provide the vehicle types that are intended to replace the vehicles noted in this attachment A32 Yes See the Local Transit Bus Replacement Schedule from the Draft 2018-2017 Short Range Transit Plan for Package 1 and Package 2 services in the attachment to
Addendum 3
6
Addendum 3 It is anticipated that vehicles will be replaced with vehicles that are similar to what is being operated today but is subject to change at Marin Transitrsquos discretion Q33 Page 13 Item 10 Information Technology Plan Is the contractor responsible for the cost and maintenance of all electric maintenance components in this section ie GFI Radios passenger counters MDTrsquos and other components A33 The Intelligent Transportation Technology equipment consists mostly of onboard equipment (ie GFI fareboxes MDTrsquos cameras etc) and will be provided by Marin Transit as described in Section 1 ndash General Information Onboard Equipment (Intelligent Transportation Technology) of the RFP Contractors are responsible for repairs preventive maintenance and maintaining spare parts associated with this equipment as outlined in the Operations Responsibilities and Maintenance Responsibilities sections of the RFP Marin Transit will provide an initial inventory of spare parts (excluding major vehicle parts such as engines or transmissions etc) but the Contractor will be responsible for ensuring that any spare parts that are swapped out or used are immediately replaced in order to maintain an adequate spare parts inventory Most of the onboard equipment has an initial warranty associated with failure of hardware Q34 Please provide the total annual miles operated for each package A34 See annual miles for each route in the attachment to Addendum 3 Q35 What is the current spare ratio for each service provided A35 Services in Package 1 and Package 2 currently differ than what is operated today Currently Package 1 contains one vehicle that is not owned by Marin Transit Package 1 services have a weekday spare ratio of 17 percent and 61 percent on the weekend Package 2 currently has a weekday spare ratio of 38 percent weekday during non-school days is 50 percent weekend peakpeak at 21 percent weekend peakoff peak of 38 percent and weekend off peakoff peak at 46 percent It is projected that Package 1 will have a weekday spare ratio of 17 percent and a weekend spare ratio of 52 percent Package 2 is projected to have a weekday spare ratio of 21 percent weekday (non-school days) is 58 percent weekend peakpeak of 11 percent weekend peakoff-peak of 35 percent and weekend off peakoff peak at 48 percent Q36 Will Marin Transit be responsible for the cost of battery packs for all of the hybrid vehicles
Addendum 3
7
A36 Yes Marin Transit would consider hybrid vehicle battery pack replacement as an Unforeseen Major Repair an assume the cost to refresh or replace the battery packs per Maintenance Responsibilities Section of the RFP Q37 Page 28 Section 3 Are the DPF filters considered a major component that Marin Transit will be responsible for covering the cost for A37 DPF filters are not considered a major component and Marin Transit will not be responsible for covering the costs for providing or replacing DPF filters Q38 Section 405d Auto Physical Damage ndash Transportation providers to maintain a higher deductible than the $50K for each loss noted in this section would Marin Transit modify this section to remove the deductible limitation A38 No The referenced draft contract language requires that ldquoDeductibles shall not exceed $50000 for each lossrdquo Q39 Section 405i Certified Copies of Policies ndash It typically takes insurance companies around 30 days after policy expiration before a new policy is issued As an alternative would Marin Transit please modify this section to state that the replacement policy or binder shall be furnished 5 days after expiration A39 Marin Transitrsquos primary concern is that there not be a gap in insurance coverage whether for new or replacement policies during the term of an awarded contract and will not modify this language beyond the expiration date of a policy Q40 Section 405j MCTD Purchase of Insurance ndash As an alternative to the current language would Marin Transit modify this section to provide that Marin Transitrsquos recourse for failure to comply with the insurance requirements be cancellation of the contract A40 No Marin Transit reserves to right terminate its contracts for convenience This provision ensures that insurance coverage is always in place Q41 Page 18 Draft Contract Item b Dedication to Project vs Page 11 Item 4 A) Summary of Key Personnel The language in these sections seems to conflict Please confirm it is acceptable to share key personnel with other projects as long as the percentage of time dedicated to this project is clearly identified A41 Personnel can be shared Of the key personnel the General Manager Operations Manager Maintenance Manager are to be full time positions and the Operations Manager and Maintenance Manager are to be located on-site Proposers must indicate if key personnel and non-key personnel (ie mechanics dispatchers road supervisors) will be shared on other projects and the percentage of time that will be
Addendum 3
8
dedicated to Marin Transit contract(s) Refer to Attachment I ndash Draft Operations and Maintenance Contract Article 2 ndash Personnel Requirements Sec 201 General Requirements for Contractor Personnel Dedication to Project Q42 Page 14 Item 13 Employee Training Please confirm whether CPR and First Aid training is a new requirement A42 No Proposers are being asked to present their initial training program for operators ldquoto Include any certifications and licensing to be included along with the initial training (CPR First Aid Class B etc)rdquo as referred to in the RFP Section 2 ndash Terms and Conditions Proposal Requirements Employee Training Q43 Page 28 Unforeseen Major Repairs Would Marin Transit identify a dollar amount such as $2000 for single maintenance items that would classify an item as an unforeseen major repair Marin Transit would be responsible for the cost of There are various parts on the fleet vehicles that exceed the cost of a transmission rebuild for example A43 No Q44 Page 8 Draft Contract b Facilities ii Would Marin Transit please remove this language from the RFP and Draft Contract Proposerrsquos are not able to require a landlord to consent to assignment of a property lease A44 No Proposerrsquos are encouraged to work closely with property managers agents or owners on how best to address this requirement Q45 Page 7 Radio Communications For package 2 services should bidders account for two-way radios vs push to talk devices due to the service area and poor cell phone reception A45 Package 1 and 2 proposers should provide a radio communication system that meets the service requirements outlined in the RFP Proposers are encouraged to obtain signal coverage area maps to include with their proposed systems that minimize or eliminate ldquodead spotsrdquo Q46 Draft Contract sect104E TermRenewal Options Please revise to require mutual agreement for any extension of the Agreement with pricing to be negotiated by the parties in order to allow for price adjustments to reflect changes in Contractorrsquos cost to operate the service A46 The RFP and contract address changes to Contractorrsquos cost to operate service though the two-tiered (variable hourly rate and monthly fixed cost) structure and the
Addendum 3
9
Possible Rate Adjustments contract provision (304f) The optional contract extension terms will not be made subject to renegotiation Q47 Draft Contract sect523 ndashAssignment Please delete ldquoAssignment provision extends to any purchase merger or consolidation change in control etcrdquo from the draft contract as a change in stockholders of a contractor shall not require consent or result in a default or termination of the Agreement A47 No This contract provision does not require consent for a change in a contractorrsquos stockholders but instead a change in contract assignment resulting from a change in stockholders Q48 Draft Contract sect408 ndashTermination ndash Would Marin Transit please consider modifying this requirement to provide a minimum of 60 daysrsquo notice of cancellation in order to provide the contractor with enough time to complete obligations required such as WARN Act lease terminations etc A48 No Marin Transit prefers the 30-day notice period Q49 Draft Contract sect406 ndash Indemnity Would Marin Transit please consider revising indemnification to limit the indemnity to actions or omissions of the Contractor or its employees agents subcontractors etc The Contractor should not be liable for items outside of its control A49 No Marin Transit is not considering a revision to the indemnification clause at this time Q50 General Draft Contract Would Marin Transit please add a force majeure provision to relieve both parties from performance under the Contract for circumstances beyond their reasonable control (acts of God war labor strikes or disputes terrorism etc) The contractor should be excused from performance under the contract for circumstances outside of its control A50 No See response for Q38 Q51 General Draft Contract Would Marin Transit include a provision that provides for price adjustments if Contractorrsquos revenue decreases or Contractorrsquos costs increase as a result of (i) changes to the scope of work service hours requested by the Authority (ii) changes in laws rules regulations etc applicable to the services to be provided by Contractor andor (iii) wage increases necessary for Contractor to be able to recruit and retain qualified employees as a result of an increase in the minimum wage in the County or surrounding jurisdictions If the parties are unable to agree on a rate adjustment then either party may terminate the contract upon 120 daysrsquo written notice to the other party Doing so would
Addendum 3
10
provide protection for the contractor to cover changes requested by the District or matters that were not contemplated at the time of Contractorrsquos proposal A51 No The RFP and contract address potential changes to scope of work changes in lawrulesregulations and requires proposers to consider wages and benefits to recruit and attract qualified employees without requiring contract price renegotiation
Attachments MV Transportation Fees and Payment Schedule (Revised November 20 2017)
Marin Airporter Fees and Payment Schedule (Revised November 20 2017) System Performance Summary for FY201617
August 2017 Monthly Monitoring Report September 2017 Monthly Monitoring Report October 2017 Monthly Monitoring Report Local Transit Bus Replacement Schedule
171801
EXHIBIT ldquoCrdquo
FEES AND PAYMENT SCHEDULE (revised)
Contractor shall bill Marin Transit monthly for service hours provided Additional hours shall only be used with approval from Marin Transit Proper back-up including TransTrack reports showing hours miles and fuel usage must be attached to invoices For Fiscal Year 1718 Contractor shall provide proof of wage increase (eg month over month payroll comparisons)
Service Cost per Service Hour
Contract Service Hours
Contract Maximum Obligation
Total year 1 January 30 2012 to December 31 2012 13881 $737832 Total year 2 January 1 2013 to December 31 2013 16686 $892890 Total year 3 January 1 2014 to December 31 2014 20913 $1297726 Total year 4 January 1 2015 to December 31 2015 27250 $1715566
Fixed Administrative Costs $277094 West Marin StagecoachMuir Woods Shuttle $3682 10750 $395815 Supplemental Service $6601 3750 $247538 Start-Up Costs $47571 First Half Year 5 January 1 2016 to June 30 2016 14500 $968018
Fixed Administrative Costs $975995 West Marin StagecoachMuir Woods Shuttle $4094 21500 $880210 Local Fixed Route $4094 14000 $573160 Supplemental Service $6814 7500 $511050 Fiscal Year 1617 July 1 2016 to June 30 2017 43000 $2940415
Fixed Administrative Costs1 $1137363 West Marin StagecoachMuir Woods Shuttle $4439 21500 $954455 Local Fixed Route $4439 14000 $621505 Supplemental Service $7018 7500 $526350 Fiscal Year 1718 July 1 2017 to June 30 2018 43000 $3239674
1 Includes the addition of one Road Supervisor position and one Level A Mechanic Contractor shall credit Marin Transit $5900 per month for the wage benefit and tax cost of the Level A Mechanic from July 1 2017 until the date of hire of this position
Item 10
404
asmith
Typewritten Text
MV Transportation
171830
EXHIBIT ldquoBrdquo
FEES AND PAYMENT SCHEDULE (revised)
Cost per Revenue Hour Community Shuttle Service
Base Years Option Years FY1314 FY1415 FY1516 FY1617 FY1718
Rate $7078 $6866 $7072 $7284 $7614 Maximum Revenue Hours 40000 40000 40000 60000 60000
In addition to payment of a cost per revenue hour District will directly reimburse Contractor for lease payments associated with storage of heavy duty transit buses beginning June 2016 Contractor must substantiate lease expense by providing District with a copy of the lease agreement In no event will lease payments exceed $1800 per month without written approval of District
Contractor to provide proof of wage increase (eg month over month payroll comparisons)
Item 11
410
asmith
Typewritten Text
Marin Airporter
asmith
Typewritten Text
asmith
Typewritten Text
1
System Performance Summary for FY 201617
This report summarizes the unaudited operational performance of Marin Transit local transit services for FY 201617 and compares these results to the Districtrsquos route level performance goals identified in the Short-Range Transit Plan The report provides a detailed route level assessment of all Marin Transit services operating in FY 201617 On June 12 2016 Marin Transit implemented a major service change with a 19 increase in local fixed-route service levels and a restructuring of routes throughout the County This FY 201617 report includes data from a full year of the new service plan There were a few additional changes to transit services during FY 201617 including the following In July 2016 the District launched a new general public dial-a-ride service between Point Reyes Station and Novato
The service provides curb-to-curb pick-up and drop-off and only operates on the second Monday of each month The closure of Hwy 1 in early 2017 delayed the start of the Muir Woods Shuttle season which typically begins in April
The Shuttle season began on May 13 resulting in 12 fewer days of service A number of recent changes to Marin Transitrsquos contracts and agreements have had an impact on the Districtrsquos financials These include the following The District completed a procurement for paratransit services in 2015 The new contract went into effect on January 1
2016 and provides significantly lower rates for paratransit and dial-a-ride services This report provides data from the first full year of the new contract
Effective February 1 2017 the District increased the subsidy paid to Catch-A-Ride service providers for operating wheelchair accessible vehicles to further incentivize the availability of accessible vehicles for Catch-A-Ride trips
For FY 201617 Marin Transit updated the methodology for calculating revenue hours for demand response services to be more consistent with the National Transit Database definitions These include local paratransit and the Novato Dial-A-Ride This change has reduced the amount of time that is considered as part of revenue hours Overall Marin Transit provided over 32 million unlinked passenger trips in FY 201617 with over 235000 revenue hours of service Compared to FY 201516 these numbers represent a decrease in unlinked passenger trips (-35) and an increase in revenue hours (+82) Growth in service was primarily on local fixed-route services due to the June 2016 changes Some of this growth was partially offset by decreases in hours on local paratransit and Route 122 The system-wide productivity rate was 136 riders per hour about 108 lower than FY 201617 Passenger revenues increased slightly (+06) Due to higher operating costs passenger subsidy increased by 127 to a system-wide average of $678 per passenger Fixed Route Fixed Route operations carried over 29 million unlinked passenger trips in FY 201617 with 178052 revenue hours These totals represent 91 of the Districtrsquos total trips and 76 of revenue hours Compared to FY 201516 unlinked passenger trips on fixed route services decreased by 35 and revenue hours increased by 136 Overall productivity was 164 passengers per hour approximately 150 lower than the 193 mark last fiscal year Compared to FY 201516 almost all fixed-route typologies experienced a decrease in overall ridership These include Local Basic (-120) Local Connector (-127) Supplemental (-32) and Partnership (-25) However some services experienced a modest increase in ridership compared to last year including Local Trunkline (+77) the Muir Woods Shuttle (+44) and Rural (+48)
2
Total passenger revenue decreased slightly (-11) in FY 201617 compared to last year Increases in operating costs resulted in a decrease in overall farebox recovery from 199 last year to 176 in FY 201617 Only the Local Trunkline and Recreational (Muir Woods Shuttle) typologies experienced an overall increase in both passenger revenue and farebox recovery Yellow Bus In FY 201617 yellow bus service for the Ross Valley School District carried over 136000 unlinked passenger trips a decrease of 13 compared to last year and operated 1245 revenue hours These totals represent 4 of the Districtrsquos total ridership and 1 of revenue hours Passenger revenues increased 150 due to higher pass prices This boost in revenues did not keep pace with the rise in operating costs and overall farebox recovery decreased from 571 last year to 548 in FY 201617 Demand Response Demand Response programs carried 124325 unlinked passenger trips in FY 201617 and provided 55191 revenue hours of service These totals represent 4 of the Districtrsquos total trips and 24 of revenue hours Compared to FY 201516 unlinked passenger trips on demand response services decreased by 39 (-5096 trips) and revenue hours decreased by 61 The more significant reduction in revenue hours compared to passengers is likely due to the new method for calculating those hours Overall productivity was 23 passengers per hour slightly higher than last fiscal year Ridership on local paratransit and the Novato Dial-A-Ride decreased in FY 201617 compared to the prior year Rural Dial-A-Ride experienced growth in ridership mainly because these services were only recently introduced These include the Dillon BeachTomales and Point Reyes Station Dial-A-Ride Passenger revenues for demand response services dropped slightly (-15) compared to last year However lower operating costs due to the new contract rate resulted in reductions in subsidies and an increase in farebox recovery Other Services Other Marin Access Mobility Management services include the Volunteer Driver and Catch-A-Ride programs In FY 201617 these programs provided 30547 unlinked passenger trips about 1 of the Districtrsquos total trips Compared to the prior fiscal year ridership decreased by 77 mostly due to the Catch-A-Ride program However passenger revenues increased by 90 primarily on the Catch-A-Ride program This increase may have been due to riders taking longer trips Performance Goals
The 2016-2025 Short-Range Transit Plan identifies fifteen different goals and associated metrics that staff use to evaluate system performance Performance goals at the route level are measured in both productivity (unlinked passengers per hour and per trip) and cost effectiveness (subsidy per unlinked passenger trip) These measures follow the service typologies updated in the most recent Short Range Transit Plan Table 1 below summarizes route level performance goals by typology Marin Transit has not identified productivity or cost-effectiveness goals for the Yellow Bus or Partnership service typologies Table 2 provides a detailed summary of annual FY 201617 performance data by program route and service typology
3
Table 1 Productivity and Subsidy Goals by Service Typology
Service Typology Routes Unlinked Passenger
Trips per Hour (at or above)
Subsidy per Passenger Trip
(at or below)
Local Trunkline 35 36 71X 25 $300
Regular Local 17 22 23 23X 29 49 20 $500
Local Connector 219 228 233 245 251 257 8 $800
Supplemental 113 115 117 119 125 139 145 151 154 20 per trip $300
Rural 61 68 4 $1200
Recreational 66 (Muir Woods Shuttle) 25 $300
Demand Response Local DAR Novato DAR Dillon BeachTomales DAR Point Reyes DAR
2 $3000
Using the productivity goals identified in Table 1 all the service typology groups except for Local Basic met their unlinked passengers per hour goal overall Twelve individual routes and two demand response services did not meet their productivity targets These include Routes 17 22 23 23X 29 49 71X 115 125 139 219 228 the Dillon BeachTomales Dial-A-Ride and the Point Reyes Dial-A-Ride In the previous fiscal year ten routes did not meet this target Figure 1 provides FY 201617 productivity levels and respective productivity goals by service typology and at the route level Route 35 was the most productive fixed-route service carrying an average of 286 passengers per hour Route 151 (Hamilton ndash San Jose MS ndash Novato HS - San Marin HS) was the best performing supplemental school route with 428 passengers per trip and met its subsidy target at $150 per passenger Route 228 had the highest growth in productivity (+291) due to the addition of weekday service in June 2016 In terms of cost effectiveness the Supplemental School Rural and Recreational services collectively met their goals In total 17 individual routes and two demand response services did not meet their subsidy target (Routes 17 22 23 23X 29 35 36 49 71X 219 228 233 251 257 115 125 139 Local Paratransit and Novato Dial-A-Ride) This is an increase from the 13 routes and three demand response services reported for FY 201516 Figure 2 provides a breakdown of FY 201617 subsidy levels and respective subsidy goals by service typology and at the individual route level Ridership Trends
In FY 201617 there was an overall 35 decline in fixed-route ridership compared to the previous year despite increases to service levels One of the major contributors to this decline was the delayed start of the 2017 Muir Woods Shuttle season that reduced the amount of service provided by 76 The overall decrease in ridership is relatively consistent with trends among bus operators nationwide and in the Bay Area According to the National Transit Database bus ridership declined 66 nationwide during FY 201617 compared to the prior year Within in the Bay Area peer agencies experienced ridership declines between 6 and 12 These include Golden Gate Transit Sonoma County Transit SamTrans and Napa VINE One of the biggest external factors that may have contributed to this trend is weather Rainfall in FY 201617 almost doubled over the prior year Weather can have a significant impact on travel decisions affecting whether a person makes a trip as well as how that person ultimately makes the trip It can also impact operations and cause detours major delays and canceled trips
4
In FY 201617 there was a 34 increase in the number of canceled trips Almost half of these canceled trips occurred in February due to heavy rains that caused flooding and school closures In June 2016 Marin Transit implemented a major service change One of the main goals of the service restructuring was to reduce the need to transfer by providing faster and more direct connections While this approach improves the system for riders it has implications in terms of how ridership is counted and on performance metrics The number of passengers is measured in terms of unlinked passenger trips Each time a person boards a bus is counted as a separate trip regardless of whether that person is transferring from another bus Reducing the amount of transfers needed to complete a riderrsquos journey reduces the number of unlinked trips Replacing trips that require a transfer with direct trips to destinations does not change the number of individual riders using the system which is defined as linked passenger trips In FY 201617 there was a 75 overall decrease in the number of transfers for passengers using cash to pay their original fare Some of this decline reflects the systemwide decrease in ridership The transfer ratio is defined as the number of boarding trips (unlinked passenger trips) divided by the number of originating trips (linked passenger trips) This ratio can be used to evaluate the impact of transfers on ridership independent of other factors In FY 201617 the overall transfer ratio dropped 38 from 136 to 131 When estimating linked passenger trips based on these ratios the number of individual Marin Transit passengers in FY 201617 remained relatively constant compared to last year Demand for Marin Access mobility management programs declined overall 47 from FY 201516 to FY 201617 Changes in ridership varied from program to program The largest decline was on Catch-A-Ride which experienced a 129 decrease in ridership Local paratransit and Novato Dial-A-Ride ridership may have been affected by many of the same external factors as fixed route transit particularly weather It is also possible that paratransit clients have started to shift some or all their trips to services that are not provided by Marin Transit These may include Non-Emergency Medical Transportation services arranged by managed care organizations Private transportation
providers hired under contract to institutions typically served by paratransit (such as adult day care centers) Trips taken on Uber or Lyft and Volunteer transportation services that may be supported by Marin Transit in some way but whose ridership is not
reported in the Districtrsquos performance statistics Furthermore staff attributed much of the previous growth in the Marin Access program to the Catch-A-Ride program This program experienced a 473 increase in ridership between FY 201314 and FY 201415 Towards the end of FY 201415 On the Move one of the largest taxi companies in Marin went out of business To this day service is limited during hours of peak demand and in certain service areas especially Novato Therefore FY 201617 ridership on Catch-A-Ride may reflect two factors These include a slowdown in attracting new customers and a reduction in service availability following On the Moversquos closure Table 2 summarizes the factors that can influence ridership numbers year-over-year and qualitatively evaluates their impact
5
Table 2 Factors Impacting Ridership Comparison
Factor FY 201516 FY 201617 Impact
Calendar
School Days 181 183 --
Weekdays 256 253
Weekends amp Holidays 110 111 --
Muir Woods Shuttle 113 104
Transfer Ratio (ratio of unlinked to linked trips) 136 131
Service Disruptions Canceled service (trips) 200 268
Major detourclosure (days) (1) 18 29
Rainfall (inches) 2928 5653
Gas Prices $298 $291 --
Unemployment Rate 32 32 -- Notes (1) Data on major detours and closure collected starting January 2016 Comparison includes the months of January through June FY 201718 Performance Outlook
In June 2016 Marin Transit implemented a major service change aimed in part to help underperforming routes meet established performance standards Staff has continued to monitor service performance and has made minor adjustments to improve on-time performance and cancel low-ridership trips In early 2018 staff is planning a comprehensive assessment of service performance since the June 2016 service changes This effort will include data from a recently completed onboard survey from April 2017 on passenger origins and destinations and a 100 passenger ridecheck The ridecheck will provide data on stop-level ridership activity for each route The assessment will use this analysis to recommend service changes to improve underperforming routes There are several unknowns that may also affect route performance primarily in terms of operating costs The District relies on its contractors to either lease or own property to store and maintain the vehicles needed to operate service For contractors that do not own suitable property finding and leasing these types of facilities in Marin County is challenging and expensive Recent surveys of current and potential service providers identified securing a facility as the most significant factor in determining their interest in bidding on Marin Transit services ability to provide the service and proposed pricing Marin Transit has been actively working to secure and develop its own operations and maintenance facility A District-owned facility will eliminate the need for potential service providers to lease property and lower operating costs It may also improve efficiency by reducing deadhead or non-revenue time when vehicles are traveling to and from the yard and further lower the Districtrsquos contract rates In late 2017 Marin Transit will release for bid over half of its fixed-route service and there are many uncertainties that may affect the outcome The tight labor market in Marin County and the greater Bay Area has made it difficult for service providers to hire and retain employees Potential contractors are required to secure property in a County with limited real estate opportunities If the District provides its own facility there will be more interest among potential bidders and more competitive rates
6
Table 3 System-wide Performance Statistics FY 201617 (unaudited)
Route Passengers Revenue
Hours Operating
Costs Passenger
Revenue Pass Trips Per
Rev Hr (Trip) Subsidy Per
Passenger Farebox
Recovery Fixed Route 2925522 178052 $20173419 $3550259 164 $568 176 Local Trunkline 1122188 44393 $6252940 $1263870 253 $445 202
35 658869 23052 $3234308 $729775 286 $380 226 36 342178 13636 $1901678 $369132 251 $448 194
71X 121141 7705 $1116954 $164963 157 $786 148 Local Basic 989500 65117 $7451946 $1221298 152 $630 164
17 247998 14757 $2076786 $319761 168 $708 154 22 215758 17553 $1619319 $273059 123 $624 169 23 199150 11065 $1508659 $246908 180 $634 164
23X 49255 3445 $473413 $57438 143 $845 121 29 40103 3707 $509475 $49634 108 $1147 97 49 237236 14590 $1264294 $274498 163 $417 217
Local Connector 378985 42396 $3873801 $461426 89 $900 119 219 50449 6392 $591224 $64101 79 $1045 108 228 71340 10042 $904806 $103912 71 $1123 115 233 42798 4363 $399203 $52001 98 $811 130 245 49766 4349 $391596 $56968 114 $672 145 251 95506 9607 $889019 $101823 99 $824 115 257 69126 7643 $697953 $82621 90 $890 118
Supplemental 179947 3963 $514380 $110503 454 (286) $224 215 113 16829 317 $42180 $12227 530 (315) $178 290 115 14021 637 $87534 $9504 220 (185) $557 109 117 34820 640 $81509 $17140 544 (284) $185 210 119 27161 374 $56273 $18859 727 (313) $138 335 125 13757 600 $72469 $11570 229 (193) $443 160 139 6414 253 $33182 $6635 253 (179) $414 200 145 16406 191 $25426 $7258 861 (372) $111 285 151 36801 594 $73842 $18463 620 (428) $150 250 154 13738 358 $41965 $8847 384 (255) $241 211
Recreational 122116 4316 $473726 $249748 283 $183 527 66 122116 4316 $473726 $249748 283 $183 527
Rural 112926 16172 $1422683 $122407 70 $1151 86 61 36328 5492 $475778 $39959 66 $1200 84 68 76598 10680 $946905 $82448 72 $1129 87
Partnership 19860 1696 $183943 $121007 117 $317 658 122 19860 1696 $183943 $121007 117 $317 658
Yellow Bus 136500 1245 $863348 $473066 1096 (448) $286 548 Hidden Valley 9281 180 $124763 $32170 516 (265) $998 258
White Hill 127219 1065 $738585 $440896 1194 (471) $234 597 Demand Response 124325 55191 $4571296 $236980 23 $3486 52
Local Paratransit 119673 53011 $4404928 $226387 23 $3492 51 Novato DAR 4057 1856 $150815 $8815 22 $3487 58
Dillon Beach DAR 488 260 $12511 $1356 19 $2285 108 Pt Reyes DAR 107 64 $3042 $422 17 $2447 139
Other Services 30547 - $511316 $41956 - $1537 82 Volunteer Driver(1) 16162 - $152714 - - $945 -
Catch-A-Ride(1) 14385 - $358602 $41956 - $2201 117 Total 3216894 234489 $26118572 $4302085 136 $678 165
Notes Values in red indicate performance that does not meet District
7
Figure 1 FY 201617 Passengers per Revenue Hour by Route
0
5
10
15
20
25
30
35
40
45
50Lo
cal T
runk
line T
otals 35 36 71
X
Loca
l Bas
ic To
tals 17 22 23 23X 29 49
Loca
l Con
necto
r Tot
als 219
228
233
245
251
257
Supp
lemen
tal T
otals 11
311
511
711
912
513
914
515
115
4
Recre
ation
al To
tals 66
Rura
l Tot
als 61 68
Dem
and R
espo
nse T
otals
Loca
l Par
atra
nsit
Nova
to D
ARDi
llon D
ARPt
Reye
s DAR
Pass
enge
rs p
er R
even
ue H
our
meets goalservice standard
does not meet goal
school routes show passengers per trip
8
Figure 2 FY 201617 Subsidy per Passenger by Route
$0
$5
$10
$15
$20
$25
$30
$35
$40
Loca
l Tru
nklin
e Tot
als 35 36 71X
Loca
l Bas
ic To
tals 17 22 23 23X 29 49
Loca
l Con
necto
r Tot
als 219
228
233
245
251
257
Supp
lemen
tal T
otals 11
311
511
711
912
513
914
515
115
4
Recre
ation
al To
tals 66
Rura
l Tot
als 61 68
Dem
and R
espo
nse T
otals
Loca
l Par
atra
nsit
Nova
to D
ARDi
llon D
ARPt
Reye
s DAR
Subs
idy p
er P
asse
nger
does not meet goal
service standard
meets goal
9
Attachment A Route Profiles 17 Sausalito ndash Marin City ndash Mill Valley ndash San Rafael 22 San Rafael Transit Center ndash San Anselmo ndash Marin City 23 Fairfax ndash San Anselmo ndash San Rafael ndash Canal 23X Manor ndash Fairfax ndash San Anselmo ndash San Rafael ndash Canal 29 Canal ndash San Rafael Transit Center ndash Larkspur ndash College of Marin ndash Marin General 35 Canal ndash San Rafael Transit Center ndash Marin Civic Center ndash Northgate Mall ndash Novato 36 Canal ndash San Rafael Transit Center ndash Marin City 49 Novato ndash Ignacio ndash Hamilton ndash Marin Civic Center ndash San Rafael Transit Center 61 West Marin Stagecoach (Sausalito ndash Marin City ndash Mill Valley ndash Stinson Beach ndash Bolinas) 66 Muir Woods Shuttle 68 West Marin Stagecoach (San Rafael Transit Center ndash San Anselmo ndash Pt Reyes Station ndash Inverness) 71X Novato ndash San Rafael Transit Center ndash Marin City ndash Sausalito 113 Redwood High School ndash Paradise Cay 115 Sausalito ndash Willow Creek ndash Marin City ndash Mill Valley ndash St Hilary 117 Neil Cummins Hall Middle School ndash E Corte Madera ndash Cove School 119 Tiburon ndash Belvedere ndash Redwood High School 122 San Rafael Transit Center ndash San Anselmo ndash College of Marin 125 Lagunitas ndash Sir Francis Drake HS ndash San Anselmo ndash San Rafael 139 Terra Linda High School ndash Lucas Valley 145 Terra Linda High School ndash San Rafael 151 Hamilton ndash Ignacio ndash San Jose Middle School ndash Novato High School ndash San Marin High School 154 Olive ndash San Marin High School ndash Sinaloa Middle School ndash Novato 219 Tiburon ndash Strawberry 228 San Rafael Transit Center ndash Larkspur ndash San Anselmo ndash Fairfax 233 Santa Venetia ndash Marin Civic Center ndash San Rafael Transit Center 245 San Rafael Transit Center ndash Northgate Mall ndash Kaiser ndash Smith Ranch Road 251 San Marin ndash Novato ndash Vintage Oaks ndash IVC ndash Ignacio ndash Hamilton 257 San Rafael ndash Northgate Mall ndash Kaiser ndash Marinwood ndash Hamilton ndash Ignacio ndash IVC Hdn Valley Ross Valley Yellow Bus (Fairfax ndash San Anselmo ndash Hidden Valley ES) White Hill Ross Valley Yellow Bus (San Anselmo ndash Sleepy Hollow ndash Fairfax ndash White Hill MS)
17Local Basic
Days of Service Wkdy Sa SuAvg Freq (Wkdy Peak) 30 min
Avg Freq (Wkdy Non-Peak) 60 minAvg Freq (Wked) 60 min
FY 2017 Farebox Recovery 15 transfer (to route) 25
Clipper usage 16
Annual Avg Monthly Avg Daily Annual Avg Monthly Avg Daily Annual Avg Monthly Avg DailyWeekday 194263 16189 768 11496 958 45 177386 14782 701 Saturday 27564 2297 530 1541 128 30 24621 2052 473 Sunday 26171 2181 436 1720 143 29 27378 2282 456
Total 247998 20667 679 14757 1230 40 229385 19115 628
Annual Avg Monthly Avg Daily Annual Avg Monthly Avg Daily Annual Avg Monthly Avg DailyWeekday $1617108 $134759 $6392 $247041 $20587 $976 $1370067 $114172 $5415Saturday $217536 $18128 $4183 $36894 $3075 $710 $180642 $15054 $3474Sunday $242142 $20179 $4036 $35826 $2986 $597 $206316 $17193 $3439
Total $2076786 $173066 $5690 $319761 $26647 $876 $1757025 $146419 $4814
Passengers per Revenue Hour
Subsidy per Passenger
Cost per Revenue Hour
Farebox Recovery
Weekday 169 $705 $14067 153Saturday 179 $655 $14117 170Sunday 152 $788 $14078 148
Total 168 $708 $14073 154
Passengers Revenue Hours Operating CostsPassenger
RevenueOperating Subsidy
Passengers per Revenue Hour
Subsidy per Passenger
Cost per Revenue Hour
Farebox Recovery
FY 2015 301136 15167 $2108822 $340410 $1768412 199 $587 $13904 161FY 2016 280486 15330 $2041616 $302337 $1739279 183 $620 $13317 148FY 2017 247998 14757 $2076786 $319761 $1757025 168 $708 $14073 154
Histo
ric Tr
ends
FY 20
161
7 DAT
A
Passengers Revenue Hours Revenue Miles
Operating Costs Passenger Revenue Operating Subsidy
277892 322826
301136 280486
247998
0
50000
100000
150000
200000
250000
300000
350000
FY 2013 FY 2014 FY 2015 FY 2016 FY 2017
Passengers
12402 14818 15167 15330 14757
0
5000
10000
15000
20000
FY 2013 FY 2014 FY 2015 FY 2016 FY 2017
Revenue Hours
$1717002
$2179526 $2108822 $2041616 $2076786
$0
$500000
$1000000
$1500000
$2000000
$2500000
FY 2013 FY 2014 FY 2015 FY 2016 FY 2017
Operating Costs
224 218 199 183 168
00
50
100
150
200
250
300
FY 2013 FY 2014 FY 2015 FY 2016 FY 2017
Passengers per Revenue Hour
$504 $558 $587 $620 $708
$000$200$400$600$800
$1000$1200$1400
FY 2013 FY 2014 FY 2015 FY 2016 FY 2017
Subsidy per Passenger
$13845 $14709 $13904 $13317 $14073
$0
$50
$100
$150
$200
FY 2013 FY 2014 FY 2015 FY 2016 FY 2017
Cost per Revenue Hour
22Local Basic
Days of Service Wkdy Sa SuAvg Freq (Wkdy Peak) 30 min
Avg Freq (Wkdy Non-Peak) 60 minAvg Freq (Wked) 60 min
FY 2017 Farebox Recovery 17 transfer (to route) 10
Clipper usage 11
Annual Avg Monthly Avg Daily Annual Avg Monthly Avg Daily Annual Avg Monthly Avg DailyWeekday 184918 15410 731 14244 1187 56 126319 10527 499 Saturday 16752 1396 322 1537 128 30 16232 1353 312 Sunday 14088 1174 235 1773 148 30 18729 1561 312
Total 215758 17980 591 17553 1463 48 161280 13440 442
Annual Avg Monthly Avg Daily Annual Avg Monthly Avg Daily Annual Avg Monthly Avg DailyWeekday $1312992 $109416 $5190 $232926 $19411 $921 $1080066 $90006 $4269Saturday $142334 $11861 $2737 $21235 $1770 $408 $121099 $10092 $2329Sunday $163993 $13666 $2733 $18898 $1575 $315 $145095 $12091 $2418
Total $1619319 $134943 $4436 $273059 $22755 $748 $1346260 $112188 $3688
Passengers per Revenue Hour
Subsidy per Passenger
Cost per Revenue Hour
Farebox Recovery
Weekday 130 $584 $9218 177Saturday 109 $723 $9263 149Sunday 79 $1030 $9251 115
Total 123 $624 $9225 169
Passengers Revenue Hours Operating CostsPassenger
RevenueOperating Subsidy
Passengers per Revenue Hour
Subsidy per Passenger
Cost per Revenue Hour
Farebox Recovery
FY 2015 249148 14777 $2054433 $292215 $1762218 169 $707 $13903 142FY 2016 243635 14872 $1971172 $259453 $1711719 164 $703 $13255 132FY 2017 215758 17553 $1619319 $273059 $1346260 123 $624 $9225 169
Histo
ric Tr
ends
FY 20
161
7 DAT
A
Passengers Revenue Hours Revenue Miles
Operating Costs Passenger Revenue Operating Subsidy
366301
281761 249148 243635
215758
050000
100000150000200000250000300000350000400000
FY 2013 FY 2014 FY 2015 FY 2016 FY 2017
Passengers18061
15083 14777 14872 17553
0
5000
10000
15000
20000
FY 2013 FY 2014 FY 2015 FY 2016 FY 2017
Revenue Hours$2498169
$2220145 $2054433 $1971172
$1619319
$0
$500000
$1000000
$1500000
$2000000
$2500000
$3000000
FY 2013 FY 2014 FY 2015 FY 2016 FY 2017
Operating Costs
203 187 169 164
123
00
50
100
150
200
250
300
FY 2013 FY 2014 FY 2015 FY 2016 FY 2017
Passengers per Revenue Hour
$567 $667 $707 $703 $624
$000$200$400$600$800
$1000$1200$1400
FY 2013 FY 2014 FY 2015 FY 2016 FY 2017
Subsidy per Passenger
$13832 $14720 $13903 $13255
$9225
$0
$50
$100
$150
$200
FY 2013 FY 2014 FY 2015 FY 2016 FY 2017
Cost per Revenue Hour
23Local Basic
Days of Service Wkdy Sa SuAvg Freq (Wkdy Peak) 60 min
Avg Freq (Wkdy Non-Peak) 60 minAvg Freq (Wked) 60 min
FY 2017 Farebox Recovery 16 transfer (to route) 24
Clipper usage 12
Annual Avg Monthly Avg Daily Annual Avg Monthly Avg Daily Annual Avg Monthly Avg DailyWeekday 145707 12142 576 8042 670 32 64277 5356 254 Saturday 28305 2359 544 1434 120 28 11466 956 221 Sunday 25138 2095 419 1589 132 26 12750 1062 212
Total 199150 16596 546 11065 922 30 88492 7374 242
Annual Avg Monthly Avg Daily Annual Avg Monthly Avg Daily Annual Avg Monthly Avg DailyWeekday $1096892 $91408 $4336 $179427 $14952 $709 $917465 $76455 $3626Saturday $195468 $16289 $3759 $35226 $2936 $677 $160242 $13354 $3082Sunday $216299 $18025 $3605 $32255 $2688 $538 $184044 $15337 $3067
Total $1508659 $125722 $4133 $246908 $20576 $676 $1261751 $105146 $3457
Passengers per Revenue Hour
Subsidy per Passenger
Cost per Revenue Hour
Farebox Recovery
Weekday 181 $630 $13640 164Saturday 197 $566 $13629 180Sunday 158 $732 $13612 149
Total 180 $634 $13635 164
Passengers Revenue Hours Operating CostsPassenger
RevenueOperating Subsidy
Passengers per Revenue Hour
Subsidy per Passenger
Cost per Revenue Hour
Farebox Recovery
FY 2015 354706 14168 $1969650 $381111 $1588539 250 $448 $13902 193FY 2016 268218 13154 $1703216 $308138 $1395078 204 $520 $12948 181FY 2017 199150 11065 $1508659 $246908 $1261751 180 $634 $13635 164
Histo
ric Tr
ends
FY 20
161
7 DAT
A
Passengers Revenue Hours Revenue Miles
Operating Costs Passenger Revenue Operating Subsidy
212064
339118 354706
268218
199150
050000
100000150000200000250000300000350000400000
FY 2013 FY 2014 FY 2015 FY 2016 FY 2017
Passengers
8716
14034 14168 13154
11065
02000400060008000
10000120001400016000
FY 2013 FY 2014 FY 2015 FY 2016 FY 2017
Revenue Hours
$1202564
$2061985 $1969650 $1703216
$1508659
$0
$500000
$1000000
$1500000
$2000000
$2500000
FY 2013 FY 2014 FY 2015 FY 2016 FY 2017
Operating Costs
243 242 250
204 180
00
50
100
150
200
250
300
FY 2013 FY 2014 FY 2015 FY 2016 FY 2017
Passengers per Revenue Hour
$455 $494 $448 $520 $634
$000$200$400$600$800
$1000$1200$1400
FY 2013 FY 2014 FY 2015 FY 2016 FY 2017
Subsidy per Passenger
$13797 $14692 $13902 $12948 $13635
$0
$50
$100
$150
$200
FY 2013 FY 2014 FY 2015 FY 2016 FY 2017
Cost per Revenue Hour
23XLocal Basic
Days of Service WkdyAvg Freq (Wkdy Peak) 60 min
Avg Freq (Wkdy Non-Peak) -Avg Freq (Wked) -
FY 2017 Farebox Recovery 12 transfer (to route) 31
Clipper usage 12
Annual Avg Monthly Avg Daily Annual Avg Monthly Avg Daily Annual Avg Monthly Avg DailyWeekday 49255 4105 195 3445 287 14 32408 2701 128 Saturday - - - - - - - - - Sunday - - - - - - - - -
Total 49255 4105 195 3445 287 14 32408 2701 128
Annual Avg Monthly Avg Daily Annual Avg Monthly Avg Daily Annual Avg Monthly Avg DailyWeekday $473413 $39451 $1871 $57438 $4787 $227 $415975 $34665 $1644Saturday $ - $ - $ - $ - $ - $ - $ - $ - $ -Sunday $ - $ - $ - $ - $ - $ - $ - $ - $ -
Total $473413 $39451 $1871 $57438 $4787 $227 $415975 $34665 $1644
Passengers per Revenue Hour
Subsidy per Passenger
Cost per Revenue Hour
Farebox Recovery
Weekday 143 $845 $13744 121Saturday - $ - $ - - Sunday - $ - $ - -
Total 143 $845 $13744 121
Passengers Revenue Hours Operating CostsPassenger
RevenueOperating Subsidy
Passengers per Revenue Hour
Subsidy per Passenger
Cost per Revenue Hour
Farebox Recovery
FY 2015FY 2016 2548 189 $23303 $2272 $21031 135 $825 $12330 97FY 2017 49255 3445 $473413 $57438 $415975 143 $845 $13744 121
Histo
ric Tr
ends
FY 20
161
7 DAT
A
Passengers Revenue Hours Revenue Miles
Operating Costs Passenger Revenue Operating Subsidy
2548
49255
0
10000
20000
30000
40000
50000
60000
FY 2013 FY 2014 FY 2015 FY 2016 FY 2017
Passengers
189
3445
0500
1000150020002500300035004000
FY 2013 FY 2014 FY 2015 FY 2016 FY 2017
Revenue Hours
$23303
$473413
$0
$100000
$200000
$300000
$400000
$500000
FY 2013 FY 2014 FY 2015 FY 2016 FY 2017
Operating Costs
135 143
00
50
100
150
200
250
300
FY 2013 FY 2014 FY 2015 FY 2016 FY 2017
Passengers per Revenue Hour
$825 $845
$000$200$400$600$800
$1000$1200$1400
FY 2013 FY 2014 FY 2015 FY 2016 FY 2017
Subsidy per Passenger
$12330 $13744
$0
$50
$100
$150
$200
FY 2013 FY 2014 FY 2015 FY 2016 FY 2017
Cost per Revenue Hour
29Local Basic
Days of Service WkdyAvg Freq (Wkdy Peak) 60 min
Avg Freq (Wkdy Non-Peak) -Avg Freq (Wked) -
FY 2017 Farebox Recovery 10 transfer (to route) 26
Clipper usage 12
Annual Avg Monthly Avg Daily Annual Avg Monthly Avg Daily Annual Avg Monthly Avg DailyWeekday 40103 3342 159 3707 309 15 37048 3087 146 Saturday - - - - - - - - - Sunday - - - - - - - - -
Total 40103 3342 159 3707 309 15 37048 3087 146
Annual Avg Monthly Avg Daily Annual Avg Monthly Avg Daily Annual Avg Monthly Avg DailyWeekday $509475 $42456 $2014 $49634 $4136 $196 $459841 $38320 $1818Saturday $ - $ - $ - $ - $ - $ - $ - $ - $ -Sunday $ - $ - $ - $ - $ - $ - $ - $ - $ -
Total $509475 $42456 $2014 $49634 $4136 $196 $459841 $38320 $1818
Passengers per Revenue Hour
Subsidy per Passenger
Cost per Revenue Hour
Farebox Recovery
Weekday 108 $1147 $13745 97Saturday - $ - $ - - Sunday - $ - $ - -
Total 108 $1147 $13745 97
Passengers Revenue Hours Operating CostsPassenger
RevenueOperating Subsidy
Passengers per Revenue Hour
Subsidy per Passenger
Cost per Revenue Hour
Farebox Recovery
FY 2015 203632 10795 $1500887 $232286 $1268601 189 $623 $13904 155FY 2016 181786 10502 $1378760 $219997 $1158763 173 $637 $13129 160FY 2017 40103 3707 $509475 $49634 $459841 108 $1147 $13745 97
Histo
ric Tr
ends
FY 20
161
7 DAT
A
Passengers Revenue Hours Revenue Miles
Operating Costs Passenger Revenue Operating Subsidy
238310 225998 203632
181786
40103
0
50000
100000
150000
200000
250000
300000
FY 2013 FY 2014 FY 2015 FY 2016 FY 2017
Passengers12248
10927 10795 10502
3707
0
2000
4000
6000
8000
10000
12000
14000
FY 2013 FY 2014 FY 2015 FY 2016 FY 2017
Revenue Hours$1692980 $1607795 $1500887
$1378760
$509475
$0
$500000
$1000000
$1500000
$2000000
FY 2013 FY 2014 FY 2015 FY 2016 FY 2017
Operating Costs
195 207 189 173
108
00
50
100
150
200
250
300
FY 2013 FY 2014 FY 2015 FY 2016 FY 2017
Passengers per Revenue Hour
$595 $593 $623 $637
$1147
$000$200$400$600$800
$1000$1200$1400
FY 2013 FY 2014 FY 2015 FY 2016 FY 2017
Subsidy per Passenger
$13822 $14714 $13904 $13129 $13745
$0
$50
$100
$150
$200
FY 2013 FY 2014 FY 2015 FY 2016 FY 2017
Cost per Revenue Hour
35Local Trunkline
Days of Service Wkdy Sa SuAvg Freq (Wkdy Peak) 30 min
Avg Freq (Wkdy Non-Peak) 30 minAvg Freq (Wked) 30 min
FY 2017 Farebox Recovery 23 transfer (to route) 17
Clipper usage 8
Annual Avg Monthly Avg Daily Annual Avg Monthly Avg Daily Annual Avg Monthly Avg DailyWeekday 492328 41027 1946 16909 1409 67 224421 18702 887 Saturday 84453 7038 1624 2860 238 55 43336 3611 833 Sunday 82088 6841 1368 3284 274 55 50021 4168 834
Total 658869 54906 1805 23052 1921 63 317778 26482 871
Annual Avg Monthly Avg Daily Annual Avg Monthly Avg Daily Annual Avg Monthly Avg DailyWeekday $2367217 $197268 $9357 $533190 $44433 $2107 $1834027 $152836 $7249Saturday $403729 $33644 $7764 $97853 $8154 $1882 $305876 $25490 $5882Sunday $463362 $38614 $7723 $98732 $8228 $1646 $364630 $30386 $6077
Total $3234308 $269526 $8861 $729775 $60815 $1999 $2504533 $208711 $6862
Passengers per Revenue Hour
Subsidy per Passenger
Cost per Revenue Hour
Farebox Recovery
Weekday 291 $373 $14000 225Saturday 295 $362 $14118 242Sunday 250 $444 $14111 213
Total 286 $380 $14030 226
Passengers Revenue Hours Operating CostsPassenger
RevenueOperating Subsidy
Passengers per Revenue Hour
Subsidy per Passenger
Cost per Revenue Hour
Farebox Recovery
FY 2015 476489 8544 $1187694 $462204 $725490 558 $152 $13901 389FY 2016 472718 9300 $1202986 $544109 $658877 508 $139 $12935 452FY 2017 658869 23052 $3234308 $729775 $2504533 286 $380 $14030 226
Histo
ric Tr
ends
FY 20
161
7 DAT
A
Passengers Revenue Hours Revenue Miles
Operating Costs Passenger Revenue Operating Subsidy
669860 574669
476489 472718
658869
0100000200000300000400000500000600000700000800000
FY 2013 FY 2014 FY 2015 FY 2016 FY 2017
Passengers
9755 8644 8544 9300
23052
0
5000
10000
15000
20000
25000
FY 2013 FY 2014 FY 2015 FY 2016 FY 2017
Revenue Hours
$1345711 $1271601 $1187694 $1202986
$3234308
$0
$500000
$1000000
$1500000
$2000000
$2500000
$3000000
$3500000
FY 2013 FY 2014 FY 2015 FY 2016 FY 2017
Operating Costs
687 665 558
508
286
00100200300400500600700800
FY 2013 FY 2014 FY 2015 FY 2016 FY 2017
Passengers per Revenue Hour
$097 $120 $152 $139
$380
$000
$200
$400
$600
$800
$1000
FY 2013 FY 2014 FY 2015 FY 2016 FY 2017
Subsidy per Passenger
$13796 $14710 $13901 $12935 $14030
$0
$50
$100
$150
$200
FY 2013 FY 2014 FY 2015 FY 2016 FY 2017
Cost per Revenue Hour
36Local Trunkline
Days of Service Wkdy Sa SuAvg Freq (Wkdy Peak) 30 min
Avg Freq (Wkdy Non-Peak) 30 minAvg Freq (Wked) 30 min
FY 2017 Farebox Recovery 19 transfer (to route) 18
Clipper usage 6
Annual Avg Monthly Avg Daily Annual Avg Monthly Avg Daily Annual Avg Monthly Avg DailyWeekday 278217 23185 1100 9938 828 39 133318 11110 527 Saturday 33779 2815 650 1715 143 33 24259 2022 467 Sunday 30182 2515 503 1983 165 33 28002 2334 467
Total 342178 28515 937 13636 1136 37 185579 15465 508
Annual Avg Monthly Avg Daily Annual Avg Monthly Avg Daily Annual Avg Monthly Avg DailyWeekday $1384291 $115358 $5472 $290481 $24207 $1148 $1093810 $91151 $4323Saturday $240062 $20005 $4617 $40774 $3398 $784 $199288 $16607 $3832Sunday $277325 $23110 $4622 $37877 $3156 $631 $239448 $19954 $3991
Total $1901678 $158473 $5210 $369132 $30761 $1011 $1532546 $127712 $4199
Passengers per Revenue Hour
Subsidy per Passenger
Cost per Revenue Hour
Farebox Recovery
Weekday 280 $393 $13930 210Saturday 197 $590 $13999 170Sunday 152 $793 $13984 137
Total 251 $448 $13946 194
Passengers Revenue Hours Operating CostsPassenger
RevenueOperating Subsidy
Passengers per Revenue Hour
Subsidy per Passenger
Cost per Revenue Hour
Farebox Recovery
FY 2015 109347 2894 $402355 $110471 $291884 378 $267 $13905 275FY 2016 119593 3462 $457211 $129715 $327496 345 $274 $13205 284FY 2017 342178 13636 $1901678 $369132 $1532546 251 $448 $13946 194
Histo
ric Tr
ends
FY 20
161
7 DAT
A
Passengers Revenue Hours Revenue Miles
Operating Costs Passenger Revenue Operating Subsidy
106988 103673 109347 119593
342178
050000
100000150000200000250000300000350000400000
FY 2013 FY 2014 FY 2015 FY 2016 FY 2017
Passengers
2878 2822 2894 3462
13636
02000400060008000
10000120001400016000
FY 2013 FY 2014 FY 2015 FY 2016 FY 2017
Revenue Hours
$398410 $415238 $402355 $457211
$1901678
$0
$500000
$1000000
$1500000
$2000000
FY 2013 FY 2014 FY 2015 FY 2016 FY 2017
Operating Costs
372 367 378 345 251
00100200300400500600700800
FY 2013 FY 2014 FY 2015 FY 2016 FY 2017
Passengers per Revenue Hour
$265 $293 $267 $274
$448
$000
$200
$400
$600
$800
$1000
FY 2013 FY 2014 FY 2015 FY 2016 FY 2017
Subsidy per Passenger
$13842 $14713 $13905 $13205 $13946
$0
$50
$100
$150
$200
FY 2013 FY 2014 FY 2015 FY 2016 FY 2017
Cost per Revenue Hour
49Local Basic
Days of Service Wkdy Sa SuAvg Freq (Wkdy Peak) 30 min
Avg Freq (Wkdy Non-Peak) 60 minAvg Freq (Wked) 60 min
FY 2017 Farebox Recovery 22 transfer (to route) 9
Clipper usage 11
Annual Avg Monthly Avg Daily Annual Avg Monthly Avg Daily Annual Avg Monthly Avg DailyWeekday 201564 16797 797 11313 943 45 139528 11627 551 Saturday 18489 1541 356 1517 126 29 18370 1531 353 Sunday 17183 1432 286 1761 147 29 21402 1784 357
Total 237236 19770 650 14590 1216 40 179300 14942 491
Annual Avg Monthly Avg Daily Annual Avg Monthly Avg Daily Annual Avg Monthly Avg DailyWeekday $978903 $81575 $3869 $230134 $19178 $910 $748769 $62397 $2960Saturday $131907 $10992 $2537 $22520 $1877 $433 $109387 $9116 $2104Sunday $153484 $12790 $2558 $21844 $1820 $364 $131640 $10970 $2194
Total $1264294 $105358 $3464 $274498 $22875 $752 $989796 $82483 $2712
Passengers per Revenue Hour
Subsidy per Passenger
Cost per Revenue Hour
Farebox Recovery
Weekday 178 $371 $8653 235Saturday 122 $592 $8698 171Sunday 98 $766 $8718 142
Total 163 $417 $8665 217
Passengers Revenue Hours Operating CostsPassenger
RevenueOperating Subsidy
Passengers per Revenue Hour
Subsidy per Passenger
Cost per Revenue Hour
Farebox Recovery
FY 2015 144262 6349 $882801 $158088 $724713 227 $502 $13905 179FY 2016 147480 6795 $900804 $146345 $754459 217 $512 $13257 162FY 2017 237236 14590 $1264294 $274498 $989796 163 $417 $8665 217
Histo
ric Tr
ends
FY 20
161
7 DAT
A
Passengers Revenue Hours Revenue Miles
Operating Costs Passenger Revenue Operating Subsidy
230943
152259 144262 147480
237236
0
50000
100000
150000
200000
250000
FY 2013 FY 2014 FY 2015 FY 2016 FY 2017
Passengers
9814
6440 6349 6795
14590
02000400060008000
10000120001400016000
FY 2013 FY 2014 FY 2015 FY 2016 FY 2017
Revenue Hours$1362499
$948702 $882801 $900804
$1264294
$0$200000$400000$600000$800000
$1000000$1200000$1400000$1600000
FY 2013 FY 2014 FY 2015 FY 2016 FY 2017
Operating Costs
235 236 227 217
163
00
50
100
150
200
250
300
FY 2013 FY 2014 FY 2015 FY 2016 FY 2017
Passengers per Revenue Hour
$477 $507 $502 $512 $417
$000$200$400$600$800
$1000$1200$1400
FY 2013 FY 2014 FY 2015 FY 2016 FY 2017
Subsidy per Passenger
$13884 $14732 $13905 $13257
$8665
$0
$50
$100
$150
$200
FY 2013 FY 2014 FY 2015 FY 2016 FY 2017
Cost per Revenue Hour
61Rural
Days of Service Wkdy Sa SuAvg Freq (Wkdy Peak) 8 trips
Avg Freq (Wkdy Non-Peak) -Avg Freq (Wked) 16 trips
FY 2017 Farebox Recovery 8 transfer (to route) 7
Clipper usage 11
Annual Avg Monthly Avg Daily Annual Avg Monthly Avg Daily Annual Avg Monthly Avg DailyWeekday 17166 1431 68 2631 219 10 45398 3783 181 Saturday 9922 827 198 1319 110 26 20810 1734 416 Sunday 9240 770 144 1542 129 24 24457 2038 382
Total 36328 3027 100 5492 458 15 90665 7555 248
Annual Avg Monthly Avg Daily Annual Avg Monthly Avg Daily Annual Avg Monthly Avg DailyWeekday $229650 $19138 $915 $17691 $1474 $70 $211959 $17663 $844Saturday $113378 $9448 $2268 $11622 $969 $232 $101756 $8480 $2035Sunday $132750 $11063 $2074 $10646 $887 $166 $122104 $10175 $1908
Total $475778 $39648 $1304 $39959 $3330 $109 $435819 $36318 $1194
Passengers per Revenue Hour
Subsidy per Passenger
Cost per Revenue Hour
Farebox Recovery
Weekday 65 $1235 $8730 77Saturday 75 $1026 $8598 103Sunday 60 $1321 $8607 80
Total 66 $1200 $8663 84
Passengers Revenue Hours Operating CostsPassenger
RevenueOperating Subsidy
Passengers per Revenue Hour
Subsidy per Passenger
Cost per Revenue Hour
Farebox Recovery
FY 2015 39478 5379 $417539 $46324 $371215 73 $940 $7762 111FY 2016 37276 5475 $408987 $48421 $360566 68 $967 $7470 118FY 2017 36328 5492 $475778 $39959 $435819 66 $1200 $8663 84
Histo
ric Tr
ends
FY 20
161
7 DAT
A
Passengers Revenue Hours Revenue Miles
Operating Costs Passenger Revenue Operating Subsidy
30642 33386
39478 37276 36328
0
10000
20000
30000
40000
50000
FY 2013 FY 2014 FY 2015 FY 2016 FY 2017
Passengers
5388
5056
5379 5475 5492
480049005000510052005300540055005600
FY 2013 FY 2014 FY 2015 FY 2016 FY 2017
Revenue Hours
$388827 $390358 $417539 $408987 $475778
$0
$100000
$200000
$300000
$400000
$500000
FY 2013 FY 2014 FY 2015 FY 2016 FY 2017
Operating Costs
57 66
73 68 66
00
20
40
60
80
100
FY 2013 FY 2014 FY 2015 FY 2016 FY 2017
Passengers per Revenue Hour
$1136 $1045
$940 $967
$1200
$000$200$400$600$800
$1000$1200$1400
FY 2013 FY 2014 FY 2015 FY 2016 FY 2017
Subsidy per Passenger
$7216 $7721 $7762 $7470 $8663
$0
$50
$100
$150
$200
FY 2013 FY 2014 FY 2015 FY 2016 FY 2017
Cost per Revenue Hour
66Recreational
Days of Service Wkdy Sa SuAvg Freq (Wkdy Peak) 30 min
Avg Freq (Wkdy Non-Peak) 30 minAvg Freq (Wked) 10-20 min
FY 2017 Farebox Recovery 53 transfer (to route) 0
Clipper usage 0
Annual Avg Monthly Avg Daily Annual Avg Monthly Avg Daily Annual Avg Monthly Avg DailyWeekday 21940 7313 549 804 268 20 10735 3578 268 Saturday 43799 7300 1752 1473 245 59 20480 3413 819 Sunday 56377 6264 1446 2040 227 52 28212 3135 723
Total 122116 13568 1174 4316 480 42 59428 6603 571
Annual Avg Monthly Avg Daily Annual Avg Monthly Avg Daily Annual Avg Monthly Avg DailyWeekday $104033 $34678 $2601 $37751 $12584 $944 $66282 $22094 $1657Saturday $152661 $25444 $6106 $79948 $13325 $3198 $72713 $12119 $2909Sunday $217032 $24115 $5565 $132049 $14672 $3386 $84983 $9443 $2179
Total $473726 $52636 $4555 $249748 $27750 $2401 $223978 $24886 $2154
Passengers per Revenue Hour
Subsidy per Passenger
Cost per Revenue Hour
Farebox Recovery
Weekday 273 $302 $12944 363Saturday 297 $166 $10367 524Sunday 276 $151 $10638 608
Total 283 $183 $10975 527
Passengers Revenue Hours Operating CostsPassenger
RevenueOperating Subsidy
Passengers per Revenue Hour
Subsidy per Passenger
Cost per Revenue Hour
Farebox Recovery
FY 2015 103930 3866 $477523 $209514 $268009 269 $258 $12352 439FY 2016 116942 4673 $531384 $245779 $285605 250 $244 $11373 463FY 2017 122116 4316 $473726 $249748 $223978 283 $183 $10975 527
Histo
ric Tr
ends
FY 20
161
7 DAT
A
Passengers Revenue Hours Revenue Miles
Operating Costs Passenger Revenue Operating Subsidy
62624
103052 103930 116942 122116
0
20000
40000
60000
80000
100000
120000
140000
FY 2013 FY 2014 FY 2015 FY 2016 FY 2017
Passengers
2941
3841 3866
4673 4316
0
1000
2000
3000
4000
5000
FY 2013 FY 2014 FY 2015 FY 2016 FY 2017
Revenue Hours
$330076
$538014 $477523
$531384 $473726
$0
$100000
$200000
$300000
$400000
$500000
$600000
FY 2013 FY 2014 FY 2015 FY 2016 FY 2017
Operating Costs
213
268 269 250
283
00
50
100
150
200
250
300
FY 2013 FY 2014 FY 2015 FY 2016 FY 2017
Passengers per Revenue Hour
$360 $322
$258 $244 $183
$000
$100
$200
$300
$400
$500
FY 2013 FY 2014 FY 2015 FY 2016 FY 2017
Subsidy per Passenger
$11223
$14007 $12352 $11373 $10975
$0
$50
$100
$150
$200
FY 2013 FY 2014 FY 2015 FY 2016 FY 2017
Cost per Revenue Hour
68Rural
Days of Service Wkdy Sa SuAvg Freq (Wkdy Peak) 60 min
Avg Freq (Wkdy Non-Peak) 120 minAvg Freq (Wked) 60-120 min
FY 2017 Farebox Recovery 9 transfer (to route) 13
Clipper usage 12
Annual Avg Monthly Avg Daily Annual Avg Monthly Avg Daily Annual Avg Monthly Avg DailyWeekday 59903 4992 239 7282 607 29 133167 11097 531 Saturday 8410 701 168 1492 124 30 27123 2260 542 Sunday 8285 690 129 1907 159 30 34638 2887 541
Total 76598 6383 210 10680 890 29 194928 16244 534
Annual Avg Monthly Avg Daily Annual Avg Monthly Avg Daily Annual Avg Monthly Avg DailyWeekday $645737 $53811 $2573 $64332 $5361 $256 $581405 $48450 $2316Saturday $131882 $10990 $2638 $9260 $772 $185 $122622 $10219 $2452Sunday $169286 $14107 $2645 $8856 $738 $138 $160430 $13369 $2507
Total $946905 $78909 $2594 $82448 $6871 $226 $864457 $72038 $2368
Passengers per Revenue Hour
Subsidy per Passenger
Cost per Revenue Hour
Farebox Recovery
Weekday 82 $971 $8868 100Saturday 56 $1458 $8841 70Sunday 43 $1936 $8879 52
Total 72 $1129 $8866 87
Passengers Revenue Hours Operating CostsPassenger
RevenueOperating Subsidy
Passengers per Revenue Hour
Subsidy per Passenger
Cost per Revenue Hour
Farebox Recovery
FY 2015 65866 10589 $848305 $80846 $767459 62 $1165 $8011 95FY 2016 70292 10611 $811978 $88808 $723170 66 $1029 $7652 109FY 2017 76598 10680 $946905 $82448 $864457 72 $1129 $8866 87
Histo
ric Tr
ends
FY 20
161
7 DAT
A
Passengers Revenue Hours Revenue Miles
Operating Costs Passenger Revenue Operating Subsidy
48113 56988
65866 70292 76598
0
20000
40000
60000
80000
100000
FY 2013 FY 2014 FY 2015 FY 2016 FY 2017
Passengers
7140 7185
10589 10611 10680
0
2000
4000
6000
8000
10000
12000
FY 2013 FY 2014 FY 2015 FY 2016 FY 2017
Revenue Hours
$532879 $571618
$848305 $811978 $946905
$0
$200000
$400000
$600000
$800000
$1000000
FY 2013 FY 2014 FY 2015 FY 2016 FY 2017
Operating Costs
67 79
62 66 72
00
20
40
60
80
100
FY 2013 FY 2014 FY 2015 FY 2016 FY 2017
Passengers per Revenue Hour
$979 $885
$1165 $1029
$1129
$000$200$400$600$800
$1000$1200$1400
FY 2013 FY 2014 FY 2015 FY 2016 FY 2017
Subsidy per Passenger
$7464 $7955 $8011 $7652 $8866
$0
$50
$100
$150
$200
FY 2013 FY 2014 FY 2015 FY 2016 FY 2017
Cost per Revenue Hour
71XLocal Trunkline
Days of Service WkdyAvg Freq (Wkdy Peak) 30 min
Avg Freq (Wkdy Non-Peak) 60 minAvg Freq (Wked) -
FY 2017 Farebox Recovery 15 transfer (to route) 26
Clipper usage 16
Annual Avg Monthly Avg Daily Annual Avg Monthly Avg Daily Annual Avg Monthly Avg DailyWeekday 121141 10095 479 7705 642 30 174624 14552 690 Saturday - - - - - - - - - Sunday - - - - - - - - -
Total 121141 10095 479 7705 642 30 174624 14552 690
Annual Avg Monthly Avg Daily Annual Avg Monthly Avg Daily Annual Avg Monthly Avg DailyWeekday $1116954 $93080 $4415 $164963 $13747 $652 $951991 $79333 $3763Saturday $ - $ - $ - $ - $ - $ - $ - $ - $ -Sunday $ - $ - $ - $ - $ - $ - $ - $ - $ -
Total $1116954 $93080 $4415 $164963 $13747 $652 $951991 $79333 $3763
Passengers per Revenue Hour
Subsidy per Passenger
Cost per Revenue Hour
Farebox Recovery
Weekday 157 $786 $14496 148Saturday - $ - $ - - Sunday - $ - $ - -
Total 157 $786 $14496 148
Passengers Revenue Hours Operating CostsPassenger
RevenueOperating Subsidy
Passengers per Revenue Hour
Subsidy per Passenger
Cost per Revenue Hour
Farebox Recovery
FY 2015 305440 7666 $1066058 $307659 $758399 398 $248 $13906 289FY 2016 259678 7717 $1075263 $300186 $775077 337 $298 $13934 279FY 2017 121141 7705 $1116954 $164963 $951991 157 $786 $14496 148
Histo
ric Tr
ends
FY 20
161
7 DAT
A
Passengers Revenue Hours Revenue Miles
Operating Costs Passenger Revenue Operating Subsidy
347560 341105 305440
259678
121141
050000
100000150000200000250000300000350000400000
FY 2013 FY 2014 FY 2015 FY 2016 FY 2017
Passengers9038
7578 7666 7717 7705
0
2000
4000
6000
8000
10000
FY 2013 FY 2014 FY 2015 FY 2016 FY 2017
Revenue Hours$1254262
$1116004 $1066058 $1075263 $1116954
$0
$200000
$400000
$600000
$800000
$1000000
$1200000
$1400000
FY 2013 FY 2014 FY 2015 FY 2016 FY 2017
Operating Costs
385 450
398 337
157
00100200300400500600700800
FY 2013 FY 2014 FY 2015 FY 2016 FY 2017
Passengers per Revenue Hour
$253 $222 $248 $298
$786
$000
$200
$400
$600
$800
$1000
FY 2013 FY 2014 FY 2015 FY 2016 FY 2017
Subsidy per Passenger
$13877 $14728 $13906 $13934 $14496
$0
$50
$100
$150
$200
FY 2013 FY 2014 FY 2015 FY 2016 FY 2017
Cost per Revenue Hour
113Supplemental
Days of Service School DaysAvg Freq (Wkdy Peak) 3 trips
Avg Freq (Wkdy Non-Peak) -Avg Freq (Wked) -
FY 2017 Farebox Recovery 29 transfer (to route) 0
Clipper usage 4
Annual Avg Monthly Avg Daily Annual Avg Monthly Avg Daily Annual Avg Monthly Avg DailyWeekday 16829 1530 92 317 29 2 2404 219 13 Saturday - - - - - - - - - Sunday - - - - - - - - -
Total 16829 1530 92 317 29 2 2404 219 13
Annual Avg Monthly Avg Daily Annual Avg Monthly Avg Daily Annual Avg Monthly Avg DailyWeekday $42180 $3835 $230 $12227 $1112 $67 $29953 $2723 $164Saturday $ - $ - $ - $ - $ - $ - $ - $ - $ -Sunday $ - $ - $ - $ - $ - $ - $ - $ - $ -
Total $42180 $3835 $230 $12227 $1112 $67 $29953 $2723 $164
Passengers per TripSubsidy per
PassengerCost per Revenue
HourFarebox Recovery
Weekday 315 $178 $13289 290Saturday - $ - $ - - Sunday - $ - $ - -
Total 315 $178 $13289 290
Passengers Revenue Hours Operating CostsPassenger
RevenueOperating Subsidy Passengers per Trip
Subsidy per Passenger
Cost per Revenue Hour
Farebox Recovery
FY 2015 12241 161 $28599 $10703 $17896 342 $146 $17752 374FY 2016 14601 263 $36924 $12809 $24115 317 $165 $14050 347FY 2017 16829 317 $42180 $12227 $29953 315 $178 $13289 290
Histo
ric Tr
ends
FY 20
161
7 DAT
A
Passengers Revenue Hours Revenue Miles
Operating Costs Passenger Revenue Operating Subsidy
15232 13521
12241 14601
16829
0
5000
10000
15000
20000
FY 2013 FY 2014 FY 2015 FY 2016 FY 2017
Passengers
229
165 161
263
317
0
50
100
150
200
250
300
350
FY 2013 FY 2014 FY 2015 FY 2016 FY 2017
Revenue Hours
$31562
$20182
$28599
$36924 $42180
$0
$10000
$20000
$30000
$40000
$50000
FY 2013 FY 2014 FY 2015 FY 2016 FY 2017
Operating Costs
220
365 342 317 315
00
100
200
300
400
500
FY 2013 FY 2014 FY 2015 FY 2016 FY 2017
Passengers per Trip
$051 $095
$146 $165 $178
$000$100$200$300$400$500$600$700$800
FY 2013 FY 2014 FY 2015 FY 2016 FY 2017
Subsidy per Passenger
$13795 $12261
$17752
$14050 $13289
$0
$50
$100
$150
$200
FY 2013 FY 2014 FY 2015 FY 2016 FY 2017
Cost per Revenue Hour
115Supplemental
Days of Service School DaysAvg Freq (Wkdy Peak) 5 trips
Avg Freq (Wkdy Non-Peak) -Avg Freq (Wked) -
FY 2017 Farebox Recovery 11 transfer (to route) 0
Clipper usage 7
Annual Avg Monthly Avg Daily Annual Avg Monthly Avg Daily Annual Avg Monthly Avg DailyWeekday 14021 1275 71 637 58 3 6963 633 35 Saturday - - - - - - - - - Sunday - - - - - - - - -
Total 14021 1275 71 637 58 3 6963 633 35
Annual Avg Monthly Avg Daily Annual Avg Monthly Avg Daily Annual Avg Monthly Avg DailyWeekday $87534 $7958 $444 $9504 $864 $48 $78030 $7094 $396Saturday $ - $ - $ - $ - $ - $ - $ - $ - $ -Sunday $ - $ - $ - $ - $ - $ - $ - $ - $ -
Total $87534 $7958 $444 $9504 $864 $48 $78030 $7094 $396
Passengers per TripSubsidy per
PassengerCost per Revenue
HourFarebox Recovery
Weekday 185 $557 $13744 109Saturday - $ - $ - - Sunday - $ - $ - -
Total 185 $557 $13744 109
Passengers Revenue Hours Operating CostsPassenger
RevenueOperating Subsidy Passengers per Trip
Subsidy per Passenger
Cost per Revenue Hour
Farebox Recovery
FY 2015 21488 775 $131168 $18863 $112305 221 $523 $16918 144FY 2016 16366 559 $82403 $12638 $69765 168 $426 $14754 153FY 2017 14021 637 $87534 $9504 $78030 185 $557 $13744 109
Histo
ric Tr
ends
FY 20
161
7 DAT
A
Passengers Revenue Hours Revenue Miles
Operating Costs Passenger Revenue Operating Subsidy
13524
21488
16366 14021
0
5000
10000
15000
20000
25000
FY 2013 FY 2014 FY 2015 FY 2016 FY 2017
Passengers
463
775
559 637
0
200
400
600
800
1000
FY 2013 FY 2014 FY 2015 FY 2016 FY 2017
Revenue Hours
$56706
$131168
$82403 $87534
$0
$20000
$40000
$60000
$80000
$100000
$120000
$140000
FY 2013 FY 2014 FY 2015 FY 2016 FY 2017
Operating Costs
232 221 168 185
00
100
200
300
400
500
FY 2013 FY 2014 FY 2015 FY 2016 FY 2017
Passengers per Trip
$362
$523 $426
$557
$000$100$200$300$400$500$600$700$800
FY 2013 FY 2014 FY 2015 FY 2016 FY 2017
Subsidy per Passenger
$12250
$16918 $14754 $13744
$0
$50
$100
$150
$200
FY 2013 FY 2014 FY 2015 FY 2016 FY 2017
Cost per Revenue Hour
117Supplemental
Days of Service School DaysAvg Freq (Wkdy Peak) 6 trips
Avg Freq (Wkdy Non-Peak) -Avg Freq (Wked) -
FY 2017 Farebox Recovery 21 transfer (to route) 0
Clipper usage 2
Annual Avg Monthly Avg Daily Annual Avg Monthly Avg Daily Annual Avg Monthly Avg DailyWeekday 34820 3165 193 640 58 4 4753 432 26 Saturday - - - - - - - - - Sunday - - - - - - - - -
Total 34820 3165 193 640 58 4 4753 432 26
Annual Avg Monthly Avg Daily Annual Avg Monthly Avg Daily Annual Avg Monthly Avg DailyWeekday $81509 $7410 $453 $17140 $1558 $95 $64369 $5852 $358Saturday $ - $ - $ - $ - $ - $ - $ - $ - $ -Sunday $ - $ - $ - $ - $ - $ - $ - $ - $ -
Total $81509 $7410 $453 $17140 $1558 $95 $64369 $5852 $358
Passengers per TripSubsidy per
PassengerCost per Revenue
HourFarebox Recovery
Weekday 284 $185 $12732 210Saturday - $ - $ - - Sunday - $ - $ - -
Total 284 $185 $12732 210
Passengers Revenue Hours Operating CostsPassenger
RevenueOperating Subsidy Passengers per Trip
Subsidy per Passenger
Cost per Revenue Hour
Farebox Recovery
FY 2015 50008 509 $77168 $77528 ($360) 399 ($001) $15158 1005FY 2016 33705 552 $77694 $23478 $54216 269 $161 $14075 302FY 2017 34820 640 $81509 $17140 $64369 284 $185 $12732 210
Histo
ric Tr
ends
FY 20
161
7 DAT
A
Passengers Revenue Hours Revenue Miles
Operating Costs Passenger Revenue Operating Subsidy
35174 34496
50008
33705 34820
0
10000
20000
30000
40000
50000
60000
FY 2013 FY 2014 FY 2015 FY 2016 FY 2017
Passengers
299 341
509 552
640
0
100
200
300
400
500
600
700
FY 2013 FY 2014 FY 2015 FY 2016 FY 2017
Revenue Hours
$41176 $41796
$77168 $77694 $81509
$0
$20000
$40000
$60000
$80000
$100000
FY 2013 FY 2014 FY 2015 FY 2016 FY 2017
Operating Costs
436 406 399
269 284
00
100
200
300
400
500
FY 2013 FY 2014 FY 2015 FY 2016 FY 2017
Passengers per Trip
($012) ($028) ($001)
$161 $185
-$200
-$100
$000
$100
$200
$300
$400
$500
$600
FY 2013 FY 2014 FY 2015 FY 2016 FY 2017
Subsidy per Passenger$13790
$12253
$15158 $14075
$12732
$0$20$40$60$80
$100$120$140$160
FY 2013 FY 2014 FY 2015 FY 2016 FY 2017
Cost per Revenue Hour
119Supplemental
Days of Service School DaysAvg Freq (Wkdy Peak) 5 trips
Avg Freq (Wkdy Non-Peak) -Avg Freq (Wked) -
FY 2017 Farebox Recovery 34 transfer (to route) 0
Clipper usage 5
Annual Avg Monthly Avg Daily Annual Avg Monthly Avg Daily Annual Avg Monthly Avg DailyWeekday 27161 2469 151 374 34 2 6893 627 38 Saturday - - - - - - - - - Sunday - - - - - - - - -
Total 27161 2469 151 374 34 2 6893 627 38
Annual Avg Monthly Avg Daily Annual Avg Monthly Avg Daily Annual Avg Monthly Avg DailyWeekday $56273 $5116 $313 $18859 $1714 $105 $37414 $3401 $208Saturday $ - $ - $ - $ - $ - $ - $ - $ - $ -Sunday $ - $ - $ - $ - $ - $ - $ - $ - $ -
Total $56273 $5116 $313 $18859 $1714 $105 $37414 $3401 $208
Passengers per TripSubsidy per
PassengerCost per Revenue
HourFarebox Recovery
Weekday 313 $138 $15058 335Saturday - $ - $ - - Sunday - $ - $ - -
Total 313 $138 $15058 335
Passengers Revenue Hours Operating CostsPassenger
RevenueOperating Subsidy Passengers per Trip
Subsidy per Passenger
Cost per Revenue Hour
Farebox Recovery
FY 2015 28376 466 $85243 $24699 $60544 319 $213 $18292 290FY 2016 30906 431 $68366 $28456 $39910 317 $129 $15877 416FY 2017 27161 374 $56273 $18859 $37414 313 $138 $15058 335
Histo
ric Tr
ends
FY 20
161
7 DAT
A
Passengers Revenue Hours Revenue Miles
Operating Costs Passenger Revenue Operating Subsidy
27987 28376
30906
27161
25000
26000
27000
28000
29000
30000
31000
32000
FY 2013 FY 2014 FY 2015 FY 2016 FY 2017
Passengers526
466 431
374
0
100
200
300
400
500
600
FY 2013 FY 2014 FY 2015 FY 2016 FY 2017
Revenue Hours
$64440
$85243
$68366 $56273
$0
$20000
$40000
$60000
$80000
$100000
FY 2013 FY 2014 FY 2015 FY 2016 FY 2017
Operating Costs
272 319 317 313
00
100
200
300
400
500
FY 2013 FY 2014 FY 2015 FY 2016 FY 2017
Passengers per Trip
$175 $213 $129 $138
$000$100$200$300$400$500$600$700$800
FY 2013 FY 2014 FY 2015 FY 2016 FY 2017
Subsidy per Passenger
$12251
$18292 $15877 $15058
$0
$50
$100
$150
$200
FY 2013 FY 2014 FY 2015 FY 2016 FY 2017
Cost per Revenue Hour
122Partnership
Days of Service WkdyAvg Freq (Wkdy Peak) -
Avg Freq (Wkdy Non-Peak) 30 minAvg Freq (Wked) -
FY 2017 Farebox Recovery 66 transfer (to route) 9
Clipper usage 6
Annual Avg Monthly Avg Daily Annual Avg Monthly Avg Daily Annual Avg Monthly Avg DailyWeekday 19860 1986 113 1696 170 10 15480 1548 88 Saturday - - - - - - - - - Sunday - - - - - - - - -
Total 19860 1986 113 1696 170 10 15480 1548 88
Annual Avg Monthly Avg Daily Annual Avg Monthly Avg Daily Annual Avg Monthly Avg DailyWeekday $183943 $18394 $1045 $121007 $12101 $688 $62936 $6294 $358Saturday $ - $ - $ - $ - $ - $ - $ - $ - $ -Sunday $ - $ - $ - $ - $ - $ - $ - $ - $ -
Total $183943 $18394 $1045 $121007 $12101 $688 $62936 $6294 $358
Passengers per Revenue Hour
Subsidy per Passenger
Cost per Revenue Hour
Farebox Recovery
Weekday 117 $317 $10844 658Saturday - $ - $ - - Sunday - $ - $ - -
Total 117 $317 $10844 658
Passengers Revenue Hours Operating CostsPassenger
RevenueOperating Subsidy
Passengers per Revenue Hour
Subsidy per Passenger
Cost per Revenue Hour
Farebox Recovery
FY 2015FY 2016 20360 2932 $325230 $149686 $175544 69 $862 $11094 460FY 2017 19860 1696 $183943 $121007 $62936 117 $317 $10844 658
Histo
ric Tr
ends
FY 20
161
7 DAT
A
Passengers Revenue Hours Revenue Miles
Operating Costs Passenger Revenue Operating Subsidy
20360 19860
0
5000
10000
15000
20000
25000
FY 2013 FY 2014 FY 2015 FY 2016 FY 2017
Passengers2932
1696
0
500
1000
1500
2000
2500
3000
3500
FY 2013 FY 2014 FY 2015 FY 2016 FY 2017
Revenue Hours$325230
$183943
$0
$50000
$100000
$150000
$200000
$250000
$300000
$350000
FY 2013 FY 2014 FY 2015 FY 2016 FY 2017
Operating Costs
69
117
00
20
40
60
80
100
120
140
FY 2013 FY 2014 FY 2015 FY 2016 FY 2017
Passengers per Revenue Hour$862
$317
$000
$200
$400
$600
$800
$1000
FY 2013 FY 2014 FY 2015 FY 2016 FY 2017
Subsidy per Passenger
$11094 $10844
$0
$50
$100
$150
$200
FY 2013 FY 2014 FY 2015 FY 2016 FY 2017
Cost per Revenue Hour
125Supplemental
Days of Service School DaysAvg Freq (Wkdy Peak) 4 trips
Avg Freq (Wkdy Non-Peak) -Avg Freq (Wked) -
FY 2017 Farebox Recovery 16 transfer (to route) 1
Clipper usage 8
Annual Avg Monthly Avg Daily Annual Avg Monthly Avg Daily Annual Avg Monthly Avg DailyWeekday 13757 1251 76 600 55 3 8580 780 48 Saturday - - - - - - - - - Sunday - - - - - - - - -
Total 13757 1251 76 600 55 3 8580 780 48
Annual Avg Monthly Avg Daily Annual Avg Monthly Avg Daily Annual Avg Monthly Avg DailyWeekday $72469 $6588 $403 $11570 $1052 $64 $60899 $5536 $338Saturday $ - $ - $ - $ - $ - $ - $ - $ - $ -Sunday $ - $ - $ - $ - $ - $ - $ - $ - $ -
Total $72469 $6588 $403 $11570 $1052 $64 $60899 $5536 $338
Passengers per TripSubsidy per
PassengerCost per Revenue
HourFarebox Recovery
Weekday 193 $443 $12086 160Saturday - $ - $ - - Sunday - $ - $ - -
Total 193 $443 $12086 160
Passengers Revenue Hours Operating CostsPassenger
RevenueOperating Subsidy Passengers per Trip
Subsidy per Passenger
Cost per Revenue Hour
Farebox Recovery
FY 2015 13298 578 $87015 $11914 $75101 186 $565 $15054 137FY 2016 13197 595 $77991 $12684 $65307 182 $495 $13117 163FY 2017 13757 600 $72469 $11570 $60899 193 $443 $12086 160
Histo
ric Tr
ends
FY 20
161
7 DAT
A
Passengers Revenue Hours Revenue Miles
Operating Costs Passenger Revenue Operating Subsidy
8798 7189
13298 13197 13757
02000400060008000
10000120001400016000
FY 2013 FY 2014 FY 2015 FY 2016 FY 2017
Passengers
100 90
578 595 600
0
100
200
300
400
500
600
700
FY 2013 FY 2014 FY 2015 FY 2016 FY 2017
Revenue Hours
$13752 $10979
$87015 $77991
$72469
$0
$20000
$40000
$60000
$80000
$100000
FY 2013 FY 2014 FY 2015 FY 2016 FY 2017
Operating Costs
492
402
186 182 193
00
100
200
300
400
500
FY 2013 FY 2014 FY 2015 FY 2016 FY 2017
Passengers per Trip
$015 $002
$565 $495
$443
$000$100$200$300$400$500$600$700$800
FY 2013 FY 2014 FY 2015 FY 2016 FY 2017
Subsidy per Passenger$13821
$12267
$15054 $13117
$12086
$0$20$40$60$80
$100$120$140$160
FY 2013 FY 2014 FY 2015 FY 2016 FY 2017
Cost per Revenue Hour
139Supplemental
Days of Service School DaysAvg Freq (Wkdy Peak) 2 trips
Avg Freq (Wkdy Non-Peak) -Avg Freq (Wked) -
FY 2017 Farebox Recovery 20 transfer (to route) 0
Clipper usage 24
Annual Avg Monthly Avg Daily Annual Avg Monthly Avg Daily Annual Avg Monthly Avg DailyWeekday 6414 583 36 253 23 1 4127 375 23 Saturday - - - - - - - - - Sunday - - - - - - - - -
Total 6414 583 36 253 23 1 4127 375 23
Annual Avg Monthly Avg Daily Annual Avg Monthly Avg Daily Annual Avg Monthly Avg DailyWeekday $33182 $3017 $184 $6635 $603 $37 $26547 $2413 $147Saturday $ - $ - $ - $ - $ - $ - $ - $ - $ -Sunday $ - $ - $ - $ - $ - $ - $ - $ - $ -
Total $33182 $3017 $184 $6635 $603 $37 $26547 $2413 $147
Passengers per TripSubsidy per
PassengerCost per Revenue
HourFarebox Recovery
Weekday 179 $414 $13110 200Saturday - $ - $ - - Sunday - $ - $ - -
Total 179 $414 $13110 200
Passengers Revenue Hours Operating CostsPassenger
RevenueOperating Subsidy Passengers per Trip
Subsidy per Passenger
Cost per Revenue Hour
Farebox Recovery
FY 2015 5906 225 $36437 $5258 $31179 164 $528 $16173 144FY 2016 6391 315 $43776 $6241 $37535 160 $587 $13880 143FY 2017 6414 253 $33182 $6635 $26547 179 $414 $13110 200
Histo
ric Tr
ends
FY 20
161
7 DAT
A
Passengers Revenue Hours Revenue Miles
Operating Costs Passenger Revenue Operating Subsidy
4232 4026
5906 6391 6414
0
1000
2000
3000
4000
5000
6000
7000
FY 2013 FY 2014 FY 2015 FY 2016 FY 2017
Passengers
226 227 225
315
253
0
50
100
150
200
250
300
350
FY 2013 FY 2014 FY 2015 FY 2016 FY 2017
Revenue Hours
$31306 $27734
$36437
$43776
$33182
$0
$10000
$20000
$30000
$40000
$50000
FY 2013 FY 2014 FY 2015 FY 2016 FY 2017
Operating Costs
120 111 164 160 179
00
100
200
300
400
500
FY 2013 FY 2014 FY 2015 FY 2016 FY 2017
Passengers per Trip
$427
$628 $528
$587
$414
$000$100$200$300$400$500$600$700$800
FY 2013 FY 2014 FY 2015 FY 2016 FY 2017
Subsidy per Passenger
$13834 $12239
$16173 $13880 $13110
$0
$50
$100
$150
$200
FY 2013 FY 2014 FY 2015 FY 2016 FY 2017
Cost per Revenue Hour
145Supplemental
Days of Service School DaysAvg Freq (Wkdy Peak) 2-3 trips
Avg Freq (Wkdy Non-Peak) -Avg Freq (Wked) -
FY 2017 Farebox Recovery 29 transfer (to route) 5
Clipper usage 2
Annual Avg Monthly Avg Daily Annual Avg Monthly Avg Daily Annual Avg Monthly Avg DailyWeekday 16406 1491 90 191 17 1 2175 198 12 Saturday - - - - - - - - - Sunday - - - - - - - - -
Total 16406 1491 90 191 17 1 2175 198 12
Annual Avg Monthly Avg Daily Annual Avg Monthly Avg Daily Annual Avg Monthly Avg DailyWeekday $25426 $2311 $139 $7258 $660 $40 $18168 $1652 $99Saturday $ - $ - $ - $ - $ - $ - $ - $ - $ -Sunday $ - $ - $ - $ - $ - $ - $ - $ - $ -
Total $25426 $2311 $139 $7258 $660 $40 $18168 $1652 $99
Passengers per TripSubsidy per
PassengerCost per Revenue
HourFarebox Recovery
Weekday 372 $111 $13347 285Saturday - $ - $ - - Sunday - $ - $ - -
Total 372 $111 $13347 285
Passengers Revenue Hours Operating CostsPassenger
RevenueOperating Subsidy Passengers per Trip
Subsidy per Passenger
Cost per Revenue Hour
Farebox Recovery
FY 2015 6911 87 $13373 $5858 $7515 337 $109 $15442 438FY 2016 10268 167 $21672 $6341 $15331 396 $149 $12993 293FY 2017 16406 191 $25426 $7258 $18168 372 $111 $13347 285
Histo
ric Tr
ends
FY 20
161
7 DAT
A
Passengers Revenue Hours Revenue Miles
Operating Costs Passenger Revenue Operating Subsidy
6911
10268
16406
0
5000
10000
15000
20000
FY 2013 FY 2014 FY 2015 FY 2016 FY 2017
Passengers
87
167 191
0
50
100
150
200
250
FY 2013 FY 2014 FY 2015 FY 2016 FY 2017
Revenue Hours
$13373
$21672 $25426
$0
$5000
$10000
$15000
$20000
$25000
$30000
FY 2013 FY 2014 FY 2015 FY 2016 FY 2017
Operating Costs
337 396 372
00
100
200
300
400
500
FY 2013 FY 2014 FY 2015 FY 2016 FY 2017
Passengers per Trip
$109 $149 $111
$000$100$200$300$400$500$600$700$800
FY 2013 FY 2014 FY 2015 FY 2016 FY 2017
Subsidy per Passenger
$15442 $12993 $13347
$0
$50
$100
$150
$200
FY 2013 FY 2014 FY 2015 FY 2016 FY 2017
Cost per Revenue Hour
151Supplemental
Days of Service School DaysAvg Freq (Wkdy Peak) 4-5 trips
Avg Freq (Wkdy Non-Peak) -Avg Freq (Wked) -
FY 2017 Farebox Recovery 25 transfer (to route) 1
Clipper usage 4
Annual Avg Monthly Avg Daily Annual Avg Monthly Avg Daily Annual Avg Monthly Avg DailyWeekday 36801 3346 204 594 54 3 10649 968 59 Saturday - - - - - - - - - Sunday - - - - - - - - -
Total 36801 3346 204 594 54 3 10649 968 59
Annual Avg Monthly Avg Daily Annual Avg Monthly Avg Daily Annual Avg Monthly Avg DailyWeekday $73842 $6713 $410 $18463 $1678 $103 $55379 $5034 $308Saturday $ - $ - $ - $ - $ - $ - $ - $ - $ -Sunday $ - $ - $ - $ - $ - $ - $ - $ - $ -
Total $73842 $6713 $410 $18463 $1678 $103 $55379 $5034 $308
Passengers per TripSubsidy per
PassengerCost per Revenue
HourFarebox Recovery
Weekday 428 $150 $12442 250Saturday - $ - $ - - Sunday - $ - $ - -
Total 428 $150 $12442 250
Passengers Revenue Hours Operating CostsPassenger
RevenueOperating Subsidy Passengers per Trip
Subsidy per Passenger
Cost per Revenue Hour
Farebox Recovery
FY 2015 39309 911 $134174 $34376 $99798 315 $254 $14722 256FY 2016 42643 759 $100712 $25851 $74861 456 $176 $13267 257FY 2017 36801 594 $73842 $18463 $55379 428 $150 $12442 250
Histo
ric Tr
ends
FY 20
161
7 DAT
A
Passengers Revenue Hours Revenue Miles
Operating Costs Passenger Revenue Operating Subsidy
39537 39309
42643
36801
32000
34000
36000
38000
40000
42000
44000
FY 2013 FY 2014 FY 2015 FY 2016 FY 2017
Passengers
784 911
759
594
0
200
400
600
800
1000
FY 2013 FY 2014 FY 2015 FY 2016 FY 2017
Revenue Hours
$95932
$134174
$100712
$73842
$0$20000$40000$60000$80000
$100000$120000$140000$160000
FY 2013 FY 2014 FY 2015 FY 2016 FY 2017
Operating Costs
368 315
456 428
00
100
200
300
400
500
FY 2013 FY 2014 FY 2015 FY 2016 FY 2017
Passengers per Trip
$188 $254
$176 $150
$000$100$200$300$400$500$600$700$800
FY 2013 FY 2014 FY 2015 FY 2016 FY 2017
Subsidy per Passenger
$12233
$14722 $13267 $12442
$0$20$40$60$80
$100$120$140$160
FY 2013 FY 2014 FY 2015 FY 2016 FY 2017
Cost per Revenue Hour
154Supplemental
Days of Service School DaysAvg Freq (Wkdy Peak) 3 trips
Avg Freq (Wkdy Non-Peak) -Avg Freq (Wked) -
FY 2017 Farebox Recovery 21 transfer (to route) 0
Clipper usage 5
Annual Avg Monthly Avg Daily Annual Avg Monthly Avg Daily Annual Avg Monthly Avg DailyWeekday 13738 1249 76 358 33 2 4342 395 24 Saturday - - - - - - - - - Sunday - - - - - - - - -
Total 13738 1249 76 358 33 2 4342 395 24
Annual Avg Monthly Avg Daily Annual Avg Monthly Avg Daily Annual Avg Monthly Avg DailyWeekday $41965 $3815 $233 $8847 $804 $49 $33118 $3011 $184Saturday $ - $ - $ - $ - $ - $ - $ - $ - $ -Sunday $ - $ - $ - $ - $ - $ - $ - $ - $ -
Total $41965 $3815 $233 $8847 $804 $49 $33118 $3011 $184
Passengers per TripSubsidy per
PassengerCost per Revenue
HourFarebox Recovery
Weekday 255 $241 $11729 211Saturday - $ - $ - - Sunday - $ - $ - -
Total 255 $241 $11729 211
Passengers Revenue Hours Operating CostsPassenger
RevenueOperating Subsidy Passengers per Trip
Subsidy per Passenger
Cost per Revenue Hour
Farebox Recovery
FY 2015 15376 293 $42604 $13174 $29430 388 $191 $14541 309FY 2016 17858 360 $46133 $14660 $31473 311 $176 $12808 318FY 2017 13738 358 $41965 $8847 $33118 255 $241 $11729 211
Histo
ric Tr
ends
FY 20
161
7 DAT
A
Passengers Revenue Hours Revenue Miles
Operating Costs Passenger Revenue Operating Subsidy
12138
15376 17858
13738
0
5000
10000
15000
20000
FY 2013 FY 2014 FY 2015 FY 2016 FY 2017
Passengers
310 293
360 358
050
100150200250300350400
FY 2013 FY 2014 FY 2015 FY 2016 FY 2017
Revenue Hours
$37913 $42604
$46133 $41965
$0
$10000
$20000
$30000
$40000
$50000
FY 2013 FY 2014 FY 2015 FY 2016 FY 2017
Operating Costs
291
388
311 255
00
100
200
300
400
500
FY 2013 FY 2014 FY 2015 FY 2016 FY 2017
Passengers per Trip
$256 $191 $176
$241
$000$100$200$300$400$500$600$700$800
FY 2013 FY 2014 FY 2015 FY 2016 FY 2017
Subsidy per Passenger
$12246
$14541 $12808
$11729
$0$20$40$60$80
$100$120$140$160
FY 2013 FY 2014 FY 2015 FY 2016 FY 2017
Cost per Revenue Hour
219Local Connector
Days of Service Wkdy Sa SuAvg Freq (Wkdy Peak) 30 min
Avg Freq (Wkdy Non-Peak) 30 minAvg Freq (Wked) 30 min
FY 2017 Farebox Recovery 11 transfer (to route) 20
Clipper usage 11
Annual Avg Monthly Avg Daily Annual Avg Monthly Avg Daily Annual Avg Monthly Avg DailyWeekday 40817 3401 161 5020 418 20 58766 4897 232 Saturday 4888 407 94 637 53 12 10931 911 210 Sunday 4744 395 79 735 61 12 12607 1051 210
Total 50449 4204 138 6392 533 18 82304 6859 225
Annual Avg Monthly Avg Daily Annual Avg Monthly Avg Daily Annual Avg Monthly Avg DailyWeekday $462388 $38532 $1828 $51411 $4284 $203 $410977 $34248 $1624Saturday $59904 $4992 $1152 $6230 $519 $120 $53674 $4473 $1032Sunday $68932 $5744 $1149 $6460 $538 $108 $62472 $5206 $1041
Total $591224 $49269 $1620 $64101 $5342 $176 $527123 $43927 $1444
Passengers per Revenue Hour
Subsidy per Passenger
Cost per Revenue Hour
Farebox Recovery
Weekday 81 $1007 $9212 111Saturday 77 $1098 $9401 104Sunday 65 $1317 $9381 94
Total 79 $1045 $9250 108
Passengers Revenue Hours Operating CostsPassenger
RevenueOperating Subsidy
Passengers per Revenue Hour
Subsidy per Passenger
Cost per Revenue Hour
Farebox Recovery
FY 2015 60906 6585 $569962 $65747 $504215 92 $828 $8656 115FY 2016 55610 6591 $590663 $73164 $517499 84 $931 $8961 124FY 2017 50449 6392 $591224 $64101 $527123 79 $1045 $9250 108
Histo
ric Tr
ends
FY 20
161
7 DAT
A
Passengers Revenue Hours Revenue Miles
Operating Costs Passenger Revenue Operating Subsidy
55543 60906
55610 50449
0
10000
20000
30000
40000
50000
60000
70000
FY 2013 FY 2014 FY 2015 FY 2016 FY 2017
Passengers
5734
6585 6591 6392
520054005600580060006200640066006800
FY 2013 FY 2014 FY 2015 FY 2016 FY 2017
Revenue Hours
$522978
$569962
$590663 $591224
$480000
$500000
$520000
$540000
$560000
$580000
$600000
FY 2013 FY 2014 FY 2015 FY 2016 FY 2017
Operating Costs
97 92 84 79
00
20
40
60
80
100
120
140
FY 2013 FY 2014 FY 2015 FY 2016 FY 2017
Passengers per Revenue Hour
$851 $828 $931
$1045
$000$200$400$600$800
$1000$1200$1400
FY 2013 FY 2014 FY 2015 FY 2016 FY 2017
Subsidy per Passenger
$9121 $8656 $8961 $9250
$0
$50
$100
$150
$200
FY 2013 FY 2014 FY 2015 FY 2016 FY 2017
Cost per Revenue Hour
228Local Connector
Days of Service Wkdy Sa SuAvg Freq (Wkdy Peak) 60 min
Avg Freq (Wkdy Non-Peak) 60 minAvg Freq (Wked) 60 min
FY 2017 Farebox Recovery 11 transfer (to route) 17
Clipper usage 15
Annual Avg Monthly Avg Daily Annual Avg Monthly Avg Daily Annual Avg Monthly Avg DailyWeekday 57316 4776 227 7175 598 28 65884 5490 260 Saturday 8218 685 158 1331 111 26 13020 1085 250 Sunday 5806 484 97 1536 128 26 15023 1252 250
Total 71340 5945 195 10042 837 28 93926 7827 257
Annual Avg Monthly Avg Daily Annual Avg Monthly Avg Daily Annual Avg Monthly Avg DailyWeekday $646194 $53850 $2554 $80857 $6738 $320 $565337 $47111 $2235Saturday $120205 $10017 $2312 $12568 $1047 $242 $107637 $8970 $2070Sunday $138407 $11534 $2307 $10487 $874 $175 $127920 $10660 $2132
Total $904806 $75401 $2479 $103912 $8659 $285 $800894 $66741 $2194
Passengers per Revenue Hour
Subsidy per Passenger
Cost per Revenue Hour
Farebox Recovery
Weekday 80 $986 $9006 125Saturday 62 $1310 $9030 105Sunday 38 $2203 $9011 76
Total 71 $1123 $9010 115
Passengers Revenue Hours Operating CostsPassenger
RevenueOperating Subsidy
Passengers per Revenue Hour
Subsidy per Passenger
Cost per Revenue Hour
Farebox Recovery
FY 2015 15287 2828 $239879 $18274 $221605 54 $1450 $8482 76FY 2016 17522 3185 $280634 $28092 $252542 55 $1441 $8812 100FY 2017 71340 10042 $904806 $103912 $800894 71 $1123 $9010 115
Histo
ric Tr
ends
FY 20
161
7 DAT
A
Passengers Revenue Hours Revenue Miles
Operating Costs Passenger Revenue Operating Subsidy
5854 15287 17522
71340
01000020000300004000050000600007000080000
FY 2013 FY 2014 FY 2015 FY 2016 FY 2017
Passengers
970
2828 3185
10042
0
2000
4000
6000
8000
10000
12000
FY 2013 FY 2014 FY 2015 FY 2016 FY 2017
Revenue Hours
$85183
$239879 $280634
$904806
$0
$200000
$400000
$600000
$800000
$1000000
FY 2013 FY 2014 FY 2015 FY 2016 FY 2017
Operating Costs
60 54 55 71
00
20
40
60
80
100
120
140
FY 2013 FY 2014 FY 2015 FY 2016 FY 2017
Passengers per Revenue Hour$1358
$1450 $1441
$1123
$000$200$400$600$800
$1000$1200$1400
FY 2013 FY 2014 FY 2015 FY 2016 FY 2017
Subsidy per Passenger
$8779 $8482 $8812 $9010
$0
$50
$100
$150
$200
FY 2013 FY 2014 FY 2015 FY 2016 FY 2017
Cost per Revenue Hour
233Local Connector
Days of Service Wkdy Sa SuAvg Freq (Wkdy Peak) 60 min
Avg Freq (Wkdy Non-Peak) 60 minAvg Freq (Wked) 60 min
FY 2017 Farebox Recovery 13 transfer (to route) 16
Clipper usage 10
Annual Avg Monthly Avg Daily Annual Avg Monthly Avg Daily Annual Avg Monthly Avg DailyWeekday 35589 2966 141 3306 276 13 38809 3234 153 Saturday 3911 326 75 490 41 9 5829 486 112 Sunday 3298 275 55 566 47 9 6726 561 112
Total 42798 3567 117 4363 364 12 51364 4280 141
Annual Avg Monthly Avg Daily Annual Avg Monthly Avg Daily Annual Avg Monthly Avg DailyWeekday $302758 $25230 $1197 $42450 $3538 $168 $260308 $21692 $1029Saturday $44829 $3736 $862 $5018 $418 $97 $39811 $3318 $766Sunday $51616 $4301 $860 $4533 $378 $76 $47083 $3924 $785
Total $399203 $33267 $1094 $52001 $4333 $142 $347202 $28934 $951
Passengers per Revenue Hour
Subsidy per Passenger
Cost per Revenue Hour
Farebox Recovery
Weekday 108 $731 $9158 140Saturday 80 $1018 $9141 112Sunday 58 $1428 $9118 88
Total 98 $811 $9151 130
Passengers Revenue Hours Operating CostsPassenger
RevenueOperating Subsidy
Passengers per Revenue Hour
Subsidy per Passenger
Cost per Revenue Hour
Farebox Recovery
FY 2015 50342 4366 $371602 $52526 $319076 115 $634 $8512 141FY 2016 49494 4384 $388005 $59296 $328709 113 $664 $8851 153FY 2017 42798 4363 $399203 $52001 $347202 98 $811 $9151 130
Histo
ric Tr
ends
FY 20
161
7 DAT
A
Passengers Revenue Hours Revenue Miles
Operating Costs Passenger Revenue Operating Subsidy
39956
50422 50342 49494 42798
0
10000
20000
30000
40000
50000
60000
FY 2013 FY 2014 FY 2015 FY 2016 FY 2017
Passengers
3981
4144
4366 4384 4363
370038003900400041004200430044004500
FY 2013 FY 2014 FY 2015 FY 2016 FY 2017
Revenue Hours
$350499
$378792 $371602
$388005 $399203
$320000$330000$340000$350000$360000$370000$380000$390000$400000$410000
FY 2013 FY 2014 FY 2015 FY 2016 FY 2017
Operating Costs
100
122 115 113 98
00
20
40
60
80
100
120
140
FY 2013 FY 2014 FY 2015 FY 2016 FY 2017
Passengers per Revenue Hour
$760 $661 $634 $664
$811
$000$200$400$600$800
$1000$1200$1400
FY 2013 FY 2014 FY 2015 FY 2016 FY 2017
Subsidy per Passenger
$8805 $9142 $8512 $8851 $9151
$0
$50
$100
$150
$200
FY 2013 FY 2014 FY 2015 FY 2016 FY 2017
Cost per Revenue Hour
245Local Connector
Days of Service Wkdy Sa SuAvg Freq (Wkdy Peak) 60 min
Avg Freq (Wkdy Non-Peak) 60 minAvg Freq (Wked) 60 min
FY 2017 Farebox Recovery 15 transfer (to route) 13
Clipper usage 13
Annual Avg Monthly Avg Daily Annual Avg Monthly Avg Daily Annual Avg Monthly Avg DailyWeekday 41761 3480 165 3014 251 12 28706 2392 113 Saturday 4220 352 81 620 52 12 5778 482 111 Sunday 3785 315 63 715 60 12 6667 556 111
Total 49766 4147 136 4349 362 12 41152 3429 113
Annual Avg Monthly Avg Daily Annual Avg Monthly Avg Daily Annual Avg Monthly Avg DailyWeekday $271762 $22647 $1074 $44873 $3739 $177 $226889 $18907 $897Saturday $55697 $4641 $1071 $6217 $518 $120 $49480 $4123 $952Sunday $64137 $5345 $1069 $5878 $490 $98 $58259 $4855 $971
Total $391596 $32633 $1073 $56968 $4747 $156 $334628 $27886 $917
Passengers per Revenue Hour
Subsidy per Passenger
Cost per Revenue Hour
Farebox Recovery
Weekday 139 $543 $9016 165Saturday 68 $1173 $8988 112Sunday 53 $1539 $8970 92
Total 114 $672 $9004 145
Passengers Revenue Hours Operating CostsPassenger
RevenueOperating Subsidy
Passengers per Revenue Hour
Subsidy per Passenger
Cost per Revenue Hour
Farebox Recovery
FY 2015FY 2016 2184 227 $19695 $3137 $16558 96 $758 $8695 159FY 2017 49766 4349 $391596 $56968 $334628 114 $672 $9004 145
Histo
ric Tr
ends
FY 20
161
7 DAT
A
Passengers Revenue Hours Revenue Miles
Operating Costs Passenger Revenue Operating Subsidy
2184
49766
0
10000
20000
30000
40000
50000
60000
FY 2013 FY 2014 FY 2015 FY 2016 FY 2017
Passengers
227
4349
0
1000
2000
3000
4000
5000
FY 2013 FY 2014 FY 2015 FY 2016 FY 2017
Revenue Hours
$19695
$391596
$0
$100000
$200000
$300000
$400000
$500000
FY 2013 FY 2014 FY 2015 FY 2016 FY 2017
Operating Costs
96 114
00
20
40
60
80
100
120
140
FY 2013 FY 2014 FY 2015 FY 2016 FY 2017
Passengers per Revenue Hour
$758 $672
$000$200$400$600$800
$1000$1200$1400
FY 2013 FY 2014 FY 2015 FY 2016 FY 2017
Subsidy per Passenger
$8695 $9004
$0
$50
$100
$150
$200
FY 2013 FY 2014 FY 2015 FY 2016 FY 2017
Cost per Revenue Hour
251Local Connector
Days of Service Wkdy Sa SuAvg Freq (Wkdy Peak) 60 min
Avg Freq (Wkdy Non-Peak) 60 minAvg Freq (Wked) 60 min
FY 2017 Farebox Recovery 11 transfer (to route) 8
Clipper usage 8
Annual Avg Monthly Avg Daily Annual Avg Monthly Avg Daily Annual Avg Monthly Avg DailyWeekday 76675 6390 303 6754 563 27 95654 7971 378 Saturday 9952 829 191 1325 110 25 18630 1553 358 Sunday 8879 740 148 1528 127 25 21497 1791 358
Total 95506 7959 262 9607 801 26 135781 11315 372
Annual Avg Monthly Avg Daily Annual Avg Monthly Avg Daily Annual Avg Monthly Avg DailyWeekday $625542 $52129 $2472 $78006 $6501 $308 $547536 $45628 $2164Saturday $122485 $10207 $2355 $12104 $1009 $233 $110381 $9198 $2123Sunday $140992 $11749 $2350 $11713 $976 $195 $129279 $10773 $2155
Total $889019 $74085 $2436 $101823 $8485 $279 $787196 $65600 $2157
Passengers per Revenue Hour
Subsidy per Passenger
Cost per Revenue Hour
Farebox Recovery
Weekday 114 $714 $9262 125Saturday 75 $1109 $9246 99Sunday 58 $1456 $9225 83
Total 99 $824 $9254 115
Passengers Revenue Hours Operating CostsPassenger
RevenueOperating Subsidy
Passengers per Revenue Hour
Subsidy per Passenger
Cost per Revenue Hour
Farebox Recovery
FY 2015 97647 9172 $800242 $103081 $697161 106 $714 $8725 129FY 2016 98886 9226 $831623 $120959 $710664 107 $719 $9014 145FY 2017 95506 9607 $889019 $101823 $787196 99 $824 $9254 115
Histo
ric Tr
ends
FY 20
161
7 DAT
A
Passengers Revenue Hours Revenue Miles
Operating Costs Passenger Revenue Operating Subsidy
87073
97647 98886
95506
80000
85000
90000
95000
100000
FY 2013 FY 2014 FY 2015 FY 2016 FY 2017
Passengers
8322
9172 9226
9607
7500
8000
8500
9000
9500
10000
FY 2013 FY 2014 FY 2015 FY 2016 FY 2017
Revenue Hours
$772570
$800242
$831623
$889019
$700000
$750000
$800000
$850000
$900000
FY 2013 FY 2014 FY 2015 FY 2016 FY 2017
Operating Costs
105 106 107 99
00
20
40
60
80
100
120
140
FY 2013 FY 2014 FY 2015 FY 2016 FY 2017
Passengers per Revenue Hour
$797 $714 $719
$824
$000$200$400$600$800
$1000$1200$1400
FY 2013 FY 2014 FY 2015 FY 2016 FY 2017
Subsidy per Passenger
$9284 $8725 $9014 $9254
$0
$50
$100
$150
$200
FY 2013 FY 2014 FY 2015 FY 2016 FY 2017
Cost per Revenue Hour
257Local Connector
Days of Service WkdyAvg Freq (Wkdy Peak) 60 min
Avg Freq (Wkdy Non-Peak) 60 minAvg Freq (Wked) -
FY 2017 Farebox Recovery 12 transfer (to route) 6
Clipper usage 13
Annual Avg Monthly Avg Daily Annual Avg Monthly Avg Daily Annual Avg Monthly Avg DailyWeekday 69126 5761 273 7643 637 30 85748 7146 339 Saturday - - - - - - - - - Sunday - - - - - - - - -
Total 69126 5761 273 7643 637 30 85748 7146 339
Annual Avg Monthly Avg Daily Annual Avg Monthly Avg Daily Annual Avg Monthly Avg DailyWeekday $697953 $58163 $2759 $82621 $6885 $327 $615332 $51278 $2432Saturday $ - $ - $ - $ - $ - $ - $ - $ - $ -Sunday $ - $ - $ - $ - $ - $ - $ - $ - $ -
Total $697953 $58163 $2759 $82621 $6885 $327 $615332 $51278 $2432
Passengers per Revenue Hour
Subsidy per Passenger
Cost per Revenue Hour
Farebox Recovery
Weekday 90 $890 $9132 118Saturday - $ - $ - - Sunday - $ - $ - -
Total 90 $890 $9132 118
Passengers Revenue Hours Operating CostsPassenger
RevenueOperating Subsidy
Passengers per Revenue Hour
Subsidy per Passenger
Cost per Revenue Hour
Farebox Recovery
FY 2015 69984 6289 $546363 $73402 $472961 111 $676 $8687 134FY 2016 71429 6414 $575805 $83288 $492517 111 $690 $8977 145FY 2017 69126 7643 $697953 $82621 $615332 90 $890 $9132 118
Histo
ric Tr
ends
FY 20
161
7 DAT
A
Passengers Revenue Hours Revenue Miles
Operating Costs Passenger Revenue Operating Subsidy
35511
68515 69984 71429 69126
01000020000300004000050000600007000080000
FY 2013 FY 2014 FY 2015 FY 2016 FY 2017
Passengers
2909
5965 6289 6414 7643
0
2000
4000
6000
8000
10000
FY 2013 FY 2014 FY 2015 FY 2016 FY 2017
Revenue Hours
$263500
$555608 $546363 $575805
$697953
$0$100000$200000$300000$400000$500000$600000$700000$800000
FY 2013 FY 2014 FY 2015 FY 2016 FY 2017
Operating Costs
122 115 111 111
90
00
20
40
60
80
100
120
140
FY 2013 FY 2014 FY 2015 FY 2016 FY 2017
Passengers per Revenue Hour
$625 $721 $676 $690
$890
$000$200$400$600$800
$1000$1200$1400
FY 2013 FY 2014 FY 2015 FY 2016 FY 2017
Subsidy per Passenger
$9057 $9315 $8687 $8977 $9132
$0
$50
$100
$150
$200
FY 2013 FY 2014 FY 2015 FY 2016 FY 2017
Cost per Revenue Hour
Hdn ValleyYellow Bus
Days of Service School DaysAvg Freq (Wkdy Peak) 2 trips
Avg Freq (Wkdy Non-Peak) -Avg Freq (Wked) -
FY 2017 Farebox Recovery 26 transfer (to route) -
Clipper usage -
Annual Avg Monthly Avg Daily Annual Avg Monthly Avg Daily Annual Avg Monthly Avg DailyWeekday 9281 844 52 180 16 1 1638 149 9 Saturday - - - - - - - - - Sunday - - - - - - - - -
Total 9281 844 52 180 16 1 1638 149 9
Annual Avg Monthly Avg Daily Annual Avg Monthly Avg Daily Annual Avg Monthly Avg DailyWeekday $124763 $11342 $693 $32170 $2925 $179 $92593 $8418 $514Saturday $ - $ - $ - $ - $ - $ - $ - $ - $ -Sunday $ - $ - $ - $ - $ - $ - $ - $ - $ -
Total $124763 $11342 $693 $32170 $2925 $179 $92593 $8418 $514
Passengers per Revenue Hour
Subsidy per Passenger
Cost per Revenue Hour
Farebox Recovery
Weekday 516 $998 $69313 258Saturday - $ - $ - - Sunday - $ - $ - -
Total 516 $998 $69313 258
Passengers Revenue Hours Operating CostsPassenger
RevenueOperating Subsidy
Passengers per Revenue Hour
Subsidy per Passenger
Cost per Revenue Hour
Farebox Recovery
FY 2015FY 2016 8669 211 $140482 $25658 $114824 412 $1325 $66706 183FY 2017 9281 180 $124763 $32170 $92593 516 $998 $69313 258
Histo
ric Tr
ends
FY 20
161
7 DAT
A
Passengers Revenue Hours Revenue Miles
Operating Costs Passenger Revenue Operating Subsidy
8669 9281
0
2000
4000
6000
8000
10000
FY 2013 FY 2014 FY 2015 FY 2016 FY 2017
Passengers211
180
0
50
100
150
200
250
FY 2013 FY 2014 FY 2015 FY 2016 FY 2017
Revenue Hours$140482
$124763
$0$20000$40000$60000$80000
$100000$120000$140000$160000
FY 2013 FY 2014 FY 2015 FY 2016 FY 2017
Operating Costs
412 516
00
500
1000
1500
2000
FY 2013 FY 2014 FY 2015 FY 2016 FY 2017
Passengers per Revenue Hour
$1325
$998
$000
$200
$400
$600
$800
$1000
$1200
$1400
FY 2013 FY 2014 FY 2015 FY 2016 FY 2017
Subsidy per Passenger
$66706 $69313
$0$100$200$300$400$500$600$700$800
FY 2013 FY 2014 FY 2015 FY 2016 FY 2017
Cost per Revenue Hour
White HillYellow Bus
Days of Service School DaysAvg Freq (Wkdy Peak) 17 trips
Avg Freq (Wkdy Non-Peak) -Avg Freq (Wked) -
FY 2017 Farebox Recovery 60 transfer (to route) -
Clipper usage -
Annual Avg Monthly Avg Daily Annual Avg Monthly Avg Daily Annual Avg Monthly Avg DailyWeekday 127219 11565 707 1065 97 6 12096 1100 67 Saturday - - - - - - - - - Sunday - - - - - - - - -
Total 127219 11565 707 1065 97 6 12096 1100 67
Annual Avg Monthly Avg Daily Annual Avg Monthly Avg Daily Annual Avg Monthly Avg DailyWeekday $738585 $67144 $4103 $440896 $40081 $2449 $297689 $27063 $1654Saturday $ - $ - $ - $ - $ - $ - $ - $ - $ -Sunday $ - $ - $ - $ - $ - $ - $ - $ - $ -
Total $738585 $67144 $4103 $440896 $40081 $2449 $297689 $27063 $1654
Passengers per Revenue Hour
Subsidy per Passenger
Cost per Revenue Hour
Farebox Recovery
Weekday 1194 $234 $69325 597Saturday - $ - $ - - Sunday - $ - $ - -
Total 1194 $234 $69325 597
Passengers Revenue Hours Operating CostsPassenger
RevenueOperating Subsidy
Passengers per Revenue Hour
Subsidy per Passenger
Cost per Revenue Hour
Farebox Recovery
FY 2015FY 2016 129635 870 $579937 $385753 $194184 1491 $150 $66698 665FY 2017 127219 1065 $738585 $440896 $297689 1194 $234 $69325 597
Histo
ric Tr
ends
FY 20
161
7 DAT
A
Passengers Revenue Hours Revenue Miles
Operating Costs Passenger Revenue Operating Subsidy
129635 127219
0
20000
40000
60000
80000
100000
120000
140000
FY 2013 FY 2014 FY 2015 FY 2016 FY 2017
Passengers
870
1065
0
200
400
600
800
1000
1200
FY 2013 FY 2014 FY 2015 FY 2016 FY 2017
Revenue Hours
$579937
$738585
$0$100000$200000$300000$400000$500000$600000$700000$800000
FY 2013 FY 2014 FY 2015 FY 2016 FY 2017
Operating Costs
1491
1194
00200400600800
1000120014001600
FY 2013 FY 2014 FY 2015 FY 2016 FY 2017
Passengers per Revenue Hour
$150 $234
$000
$200
$400
$600
$800
$1000
$1200
$1400
FY 2013 FY 2014 FY 2015 FY 2016 FY 2017
Subsidy per Passenger$66698 $69325
$0$100$200$300$400$500$600$700$800
FY 2013 FY 2014 FY 2015 FY 2016 FY 2017
Cost per Revenue Hour
MARIN TRANSIT | 2018ndash2027 SHORT RANGE TRANSIT PLAN Chapter 4 Capital Plan
DRAFT 4-9
Table 4-7 Local Transit Bus Replacement Schedule
Fiscal Year (In-service)
Replacements
Total Cost
Local Share Vehicle Type Seating
Capacity Service(1)
FY 201718 10 $7710000 $1387800 40ft hybrid 39 LB
2 $1662000 $332404 35ft Electric 32 LB
FY 201819
1 $125000 $22500 24ft 20 SH
4 $1600000 $1094880 29ft XHF
(upgrade) 22 SG
FY 201920 10 $8940000 $1609200 60ft 63 LB
FY 202021 8 $1032000 $185760 24ft 20 SH
2 $850000 $153000 35ft XHF 37 MW
FY 202223
7 $5584578 $1005224 35ft hybrid 32 LB
2 $874182 $599281 29ft XHF
(upgrade) 22 SG
FY 202425 3 $1393227 $250781 35ft XHF 37 MW
FY 202526 2 $299093 $53837 24ft 20 SH
5 $2391706 $430507 35ft XHF 37 MW
FY 202627 - - - - - -
Notes (1) Service Types LB ndash Big Bus SH- Shuttle SG- Rural Stagecoach MW- Seasonal Muir Woods and School
Expansion Needs When considering service expansion vehicles are often a constraint on the amount of service that can be added Expansion vehicles are a lower priority in the regional capital plan and typically do not receive federal funds Local state or discretionary grants are required to expand fleets The capital plan does not include any expansion vehicles for the local fixed route program consistent with the current service plan
Marin Transit relies on three retired active vehicles to support operations Retired active vehicles are vehicles that are beyond their FTA-determined useful life that remain in service while their replacements are added the fleet The District intends to replace these as expansion vehicles if funding becomes available
Demand Response Vehicles
Marin Transit has 58 vehicles available for local and regional paratransit service To provide an adequate number of spare vehicles a maximum of about 46 vehicles in service Marin Transit owns 32 vehicles GGBHTD owns 14 and the contractor provides another 13 vehicles to support the operations Eleven of the 13 contractor vehicles will be replaced in early 2018 - five by the District and six by GGBHTD Two of the five replaced by the District will be replaced with smaller accessible vans These will be used for same day
Fixed-Route Passengers (incl Yellow Bus) by Month
July August September October November December January February March April May June
Prior Fiscal Year Passengers Current Fiscal Year PassengersPrior Fiscal Year Passengers Current Fiscal Year Passengers
0
80000
160000
240000
320000
244439
271284484271284
296637296637
2768532276853
252829252829
238010238010
219681219681
2097050505209705
277644277644
240773240773240773240773
284816284816
24935149492493512444392444392442 43999244439244244439439244439244244439999999244200
2600562602600 0000000260056
FISCAL YEAR
2018
Demand Response Passengers by Month
July August September October November December January February March April May June
Prior Fiscal Year Passengers Current Fiscal Year PassengersPrior Fiscal Year Passengers Current Fiscal Year Passengers
0
4000
8000
12000
16000
12 77312773
13631 1362813628 1356413564
1247712477
1206712067 1212412124118100011810
1364613646
1260912609
1359313593
12950129501277312 77312 77312 77312613131612 6133312 6133312613331277312773127731277312613
13 6311363113 631135641363113 613631311363113 6136313113564
Year-to-Date Ridership Trends
Item 3b
2
Average Systemwide Daily Passengers
Weekday Saturday Sunday
Prior Fiscal Year Average Daily Passengers Current Fiscal Year Average Daily PassengersPrior Fiscal Year Average Daily Passengers Current Fiscal Year Average Daily Passengers
0
3000
6000
9000
12000
11370113701109811098
7726772674407440
66576657
60556055
Productivity (paxhr) by Typology
1 Local T
runklin
e
2 Local B
asic
3 Local C
onnecto
r
5 R
ura
l
8 R
ecre
ational
9 D
em
and R
esponse
Prior Fiscal Year Productivity Current Fiscal Year ProductivityPrior Fiscal Year Productivity Current Fiscal Year Productivity
00
80
160
240
320
249249 252252
163163
14814 8148
9292 91918181
757 575
320320
275275
2323 2121
Monthly StatisticsMONTH
August
1 Local Trunkline Routes 35 36 71X
2 Local Basic Routes 17 22 23 23X 29 49
3 Local Connector Routes 219 228 233 245 251 257
5 Rural Routes 61 68
8 Recreational Routes 6666F
9 Demand Response Local Paratransit Novato Dial-A-Ride Rural Dial-A-Ride
Route Typologies
Item 3b
3
Fixed-Route Passengers (incl Yellow Bus) by Month
July August September October November December January February March April May June
Prior Fiscal Year Passengers Current Fiscal Year Passengers
0
80000
160000
240000
320000
244439244439
271284271284
296637296637
276853276853
252829252829
238010238010
219681219681209705209705
277644277644
240773240773
284816284816
249351249351244200244200
260056260056
282441282441
FISCAL YEAR
2018
Demand Response Passengers by Month
July August September October November December January February March April May June
Prior Fiscal Year Passengers Current Fiscal Year Passengers
0
4000
8000
12000
16000
1277312773
1363113631 1362813628 1356413564
12477124771206712067 1212412124
1181011810
1364613646
1260912609
1359313593
12950129501261312613
1356413564 1342713427
Year-to-Date Ridership Trends
Monthly Monitoring Report 11022017
Page 12Item 3b
2
Average Systemwide Daily Passengers
Weekday Saturday Sunday
Prior Fiscal Year Average Daily Passengers Current Fiscal Year Average Daily Passengers
0
3000
6000
9000
12000 11848118481161311613
73637363
67876787
6126612657395739
Productivity (paxhr) by Typology
1 L
ocal
Tru
nklin
e
2 L
ocal
Bas
ic
3 L
ocal
Con
nect
or
5 R
ural
8 R
ecre
atio
nal
9 D
eman
d R
espo
nse
Prior Fiscal Year Productivity Current Fiscal Year Productivity
00
80
160
240
320
278278 274274
174174 168168
9898 9797
7676 7676
304304
222222
2323 2222
Monthly StatisticsMONTH
September
1 Local Trunkline Routes 35 36 71X
2 Local Basic Routes 17 22 23 23X 29 49
3 Local Connector Routes 219 228 233 245 251 257
5 Rural Routes 61 68
8 Recreational Routes 6666F
9 Demand Response Local Paratransit Novato Dial-A-Ride Rural Dial-A-Ride
Route Typologies
Page 22Item 3b
3
Fixed-Route Passengers (incl Yellow Bus) by Month
July August September October November December January February March April May June
Prior Fiscal Year Passengers Current Fiscal Year Passengers
0
80000
160000
240000
320000
244439244439
271284271284
296637296637
276853276853
252829252829
238010238010
219681219681209705209705
277644277644
240773240773
284816284816
249351249351244200244200
260056260056
282441282441 282922282922
FISCAL YEAR
2018
Demand Response Passengers by Month
July August September October November December January February March April May June
Prior Fiscal Year Passengers Current Fiscal Year Passengers
0
4000
8000
12000
16000
1277312773
1363113631 1362813628 1356413564
12477124771206712067 1212412124
1181011810
1364613646
1260912609
1359313593
12950129501261312613
1356413564 13427134271373413734
Year-to-Date Ridership Trends
Monthly Monitoring Report 12082017
Page 12Item 3b
2
Average Systemwide Daily Passengers
Weekday Saturday Sunday
Prior Fiscal Year Average Daily Passengers Current Fiscal Year Average Daily Passengers
0
3000
6000
9000
120001125811258 1115111151
6043604364326432
4717471750675067
Productivity (paxhr) by Typology
1 L
ocal
Tru
nklin
e
2 L
ocal
Bas
ic
3 L
ocal
Con
nect
or
5 R
ural
8 R
ecre
atio
nal
9 D
eman
d R
espo
nse
Prior Fiscal Year Productivity Current Fiscal Year Productivity
00
70
140
210
280258258
270270
163163 161161
9696 9595
6363 7070
202202190190
2323 2121
Monthly StatisticsMONTH
October
1 Local Trunkline Routes 35 36 71X
2 Local Basic Routes 17 22 23 23X 29 49
3 Local Connector Routes 219 228 233 245 251 257
5 Rural Routes 61 68
8 Recreational Routes 6666F
9 Demand Response Local Paratransit Novato Dial-A-Ride Rural Dial-A-Ride
Route Typologies
Page 22Item 3b
3
- RFP - OampM for Fixed Route Service - Addendum 3 12-18-2017
- MV Fee Schedule
- Airporter Fee Schedule
- FY2017Performance
-
- System Performance Summary for FY 201617
-
- Fixed Route
- Yellow Bus
- Demand Response
- Other Services
-
- Performance Goals
- Ridership Trends
- FY 201718 Performance Outlook
-
- Attachment A Route Profiles
-
- Local Transit Bus Replacement Schedule
- August 2017 Monthly Monitoring Report
- September 2017 Monthly Monitoring Report
- October 2017 Monthly Monitoring Report
-

Addendum 3
3
Q15 Is there any bid preference for DBE or certified minority owned small businesses A15 Refer to RFP ndash Attachment E FTA Grant Contract Provisions DBE Participation Goal Q16 Is it possible to get copies of the three most recent monthly ridership reports A16 See the three most recent monthly ridership reports for Package 1 and Package 2 services in the attachment to Addendum 3 Q17 Is it possible to get copies of the three most recent monthly invoices A17 The Package 1 and 2 routes have been configured differently in the RFP than they are currently contracted See the historical performance data provided for Package 1 (Table 2 page 2) and 2 (Table 4 page 4) for insight on how each package of services performed when configured per the RFP Q18 What are the key areas that Marin Transit would like to see operator improvement in the next contract cycle A18 The Transit District is committed to operating a high-quality customer service-oriented service and expects all its contractors will perform to ensure expectations are met Refer to RFP Section 3 Scope of Work for contractor responsibilities Q19 What are the total annual hours of service for all routes A19 Refer to RFP Section 1 ndash General Information Service Description and System Performance Summary for FY201617 in the Attachment to Addendum 3 Q20 Are there any special employeedriver recruitmentretention benefits in place A20 We are aware of driver recruitment benefits offered by MV Transportation as shown in the job posting on their website httpscareersmvtransitcomen-USjobdrivers-2-000-sign-on-bonusJ3S0HL6XT9ZL05GT7MH We do not have any further information on any special employeedriver recruitmentretention benefits in place for contract operators
Addendum 3
4
Q21 Is there any preference for alternative fuel powered vehicles A21 Marin Transit is committed to reducing emission from the use of diesel fuel and strives to purchase hybrid and alternative fuel vehicles Q22 Please confirm RFP submission deadline Dec 22nd at 3pm A22 The RFP submission deadline has been changed to Friday January 12th 2018 at 300 pm PST as per Addendum 2 that was issued on 1282017 Q23 Under Company Financial Capacity Can we submit 3 years of Balance Sheets under separate cover to show our Financial Capacity to carry out the contract A23 Yes Proposers must submit a detailed company portfolio including the companyrsquos financial viability within the past three (3) years credit references ongoing projects and all pending litigations in which the company may be directly or indirectly involved Such documents may include company balance sheets Q24 Would Marin Transit please provide the fixed route alignments (route traces) in a digital spatial (gis) format such as kml andor shp for all routes contemplated in this RFP This would be the same data that was uploaded to Google Maps for the interactive maps on MCTDrsquos web site A24 The Fixed Route shapefiles are provided in KML format on Marin Transitrsquos website wwwmarintransitorgpurchasinghtml Q25 With regard to attachment E page 132 in section 2 Bonding Requirements Bid Guarantee Is a bid bond required If so please provide the dollar amount andor percentage A25 No Please refer to Addendum 1 (issued December 1 2017) where attachment E the FTA Grant Contract Provisions were replaced including removal of the bonding requirements Q26 Can Marin Transit please provide invoices for the past 6 months for Package 1 A26 The Package 1 and 2 routes have been configured differently in the RFP than they are currently contracted See the historical performance data provided for Package 1 (Table 2 page 2) and 2 (Table 4 page 4) for insight on how each package of services performed when configured per the RFP
Addendum 3
5
Q27 What liquidated damages were assessed if any to the current contractor for Package 1 A27 None There were no liquidated damages or performance penalties assessed for the current contractor of Package 1 The District maintains the right to assess performance penalties based on the Contractorrsquos failure to meet the established standards and any additional requirements by the District Q28 On page 13 in section 10 Intelligent Transportation Technology Plan (5 pts) does Marin Transit wish for bidders to re-alphabetize a) through e) or is it easier to keep the aabc d e format A28 Proposers should present their Intelligent Transportation Technology Plan ensuring that each required element is addressed Q29 On page 12 of the RFP section 6 Mobilization Plan (5 pts) section a) Project Schedule the last word is ldquoIncluderdquohellip was there more to this section or is it eluding to section 7 Facility A29 No The word ldquoIncluderdquo is a typographical error and should be eliminated Q30 Please confirm that bidders are required to include letters of intent for the facility(ies) proposed in their submittal A30 Refer to the RFP Section 2 ndash Terms and Conditions Proposal Requirements Facility Section Q31 With regard to section 3 Corporate Capacity Experience Past Performance can you please clarify this requirement Is the District requesting bidders to demonstrate 10 years of experience with similar systems and then to also identify contracts that have been in operation for 5 consecutive years as references A31 Proposers must provide a history of their company for the past 10 years and highlight 5 of those years where service was provided continuously and was similar in scope size and complexity to the service being proposed Q32 Attachment B Equipment Summary Would Marin Transit please provide the vehicle types that are intended to replace the vehicles noted in this attachment A32 Yes See the Local Transit Bus Replacement Schedule from the Draft 2018-2017 Short Range Transit Plan for Package 1 and Package 2 services in the attachment to
Addendum 3
6
Addendum 3 It is anticipated that vehicles will be replaced with vehicles that are similar to what is being operated today but is subject to change at Marin Transitrsquos discretion Q33 Page 13 Item 10 Information Technology Plan Is the contractor responsible for the cost and maintenance of all electric maintenance components in this section ie GFI Radios passenger counters MDTrsquos and other components A33 The Intelligent Transportation Technology equipment consists mostly of onboard equipment (ie GFI fareboxes MDTrsquos cameras etc) and will be provided by Marin Transit as described in Section 1 ndash General Information Onboard Equipment (Intelligent Transportation Technology) of the RFP Contractors are responsible for repairs preventive maintenance and maintaining spare parts associated with this equipment as outlined in the Operations Responsibilities and Maintenance Responsibilities sections of the RFP Marin Transit will provide an initial inventory of spare parts (excluding major vehicle parts such as engines or transmissions etc) but the Contractor will be responsible for ensuring that any spare parts that are swapped out or used are immediately replaced in order to maintain an adequate spare parts inventory Most of the onboard equipment has an initial warranty associated with failure of hardware Q34 Please provide the total annual miles operated for each package A34 See annual miles for each route in the attachment to Addendum 3 Q35 What is the current spare ratio for each service provided A35 Services in Package 1 and Package 2 currently differ than what is operated today Currently Package 1 contains one vehicle that is not owned by Marin Transit Package 1 services have a weekday spare ratio of 17 percent and 61 percent on the weekend Package 2 currently has a weekday spare ratio of 38 percent weekday during non-school days is 50 percent weekend peakpeak at 21 percent weekend peakoff peak of 38 percent and weekend off peakoff peak at 46 percent It is projected that Package 1 will have a weekday spare ratio of 17 percent and a weekend spare ratio of 52 percent Package 2 is projected to have a weekday spare ratio of 21 percent weekday (non-school days) is 58 percent weekend peakpeak of 11 percent weekend peakoff-peak of 35 percent and weekend off peakoff peak at 48 percent Q36 Will Marin Transit be responsible for the cost of battery packs for all of the hybrid vehicles
Addendum 3
7
A36 Yes Marin Transit would consider hybrid vehicle battery pack replacement as an Unforeseen Major Repair an assume the cost to refresh or replace the battery packs per Maintenance Responsibilities Section of the RFP Q37 Page 28 Section 3 Are the DPF filters considered a major component that Marin Transit will be responsible for covering the cost for A37 DPF filters are not considered a major component and Marin Transit will not be responsible for covering the costs for providing or replacing DPF filters Q38 Section 405d Auto Physical Damage ndash Transportation providers to maintain a higher deductible than the $50K for each loss noted in this section would Marin Transit modify this section to remove the deductible limitation A38 No The referenced draft contract language requires that ldquoDeductibles shall not exceed $50000 for each lossrdquo Q39 Section 405i Certified Copies of Policies ndash It typically takes insurance companies around 30 days after policy expiration before a new policy is issued As an alternative would Marin Transit please modify this section to state that the replacement policy or binder shall be furnished 5 days after expiration A39 Marin Transitrsquos primary concern is that there not be a gap in insurance coverage whether for new or replacement policies during the term of an awarded contract and will not modify this language beyond the expiration date of a policy Q40 Section 405j MCTD Purchase of Insurance ndash As an alternative to the current language would Marin Transit modify this section to provide that Marin Transitrsquos recourse for failure to comply with the insurance requirements be cancellation of the contract A40 No Marin Transit reserves to right terminate its contracts for convenience This provision ensures that insurance coverage is always in place Q41 Page 18 Draft Contract Item b Dedication to Project vs Page 11 Item 4 A) Summary of Key Personnel The language in these sections seems to conflict Please confirm it is acceptable to share key personnel with other projects as long as the percentage of time dedicated to this project is clearly identified A41 Personnel can be shared Of the key personnel the General Manager Operations Manager Maintenance Manager are to be full time positions and the Operations Manager and Maintenance Manager are to be located on-site Proposers must indicate if key personnel and non-key personnel (ie mechanics dispatchers road supervisors) will be shared on other projects and the percentage of time that will be
Addendum 3
8
dedicated to Marin Transit contract(s) Refer to Attachment I ndash Draft Operations and Maintenance Contract Article 2 ndash Personnel Requirements Sec 201 General Requirements for Contractor Personnel Dedication to Project Q42 Page 14 Item 13 Employee Training Please confirm whether CPR and First Aid training is a new requirement A42 No Proposers are being asked to present their initial training program for operators ldquoto Include any certifications and licensing to be included along with the initial training (CPR First Aid Class B etc)rdquo as referred to in the RFP Section 2 ndash Terms and Conditions Proposal Requirements Employee Training Q43 Page 28 Unforeseen Major Repairs Would Marin Transit identify a dollar amount such as $2000 for single maintenance items that would classify an item as an unforeseen major repair Marin Transit would be responsible for the cost of There are various parts on the fleet vehicles that exceed the cost of a transmission rebuild for example A43 No Q44 Page 8 Draft Contract b Facilities ii Would Marin Transit please remove this language from the RFP and Draft Contract Proposerrsquos are not able to require a landlord to consent to assignment of a property lease A44 No Proposerrsquos are encouraged to work closely with property managers agents or owners on how best to address this requirement Q45 Page 7 Radio Communications For package 2 services should bidders account for two-way radios vs push to talk devices due to the service area and poor cell phone reception A45 Package 1 and 2 proposers should provide a radio communication system that meets the service requirements outlined in the RFP Proposers are encouraged to obtain signal coverage area maps to include with their proposed systems that minimize or eliminate ldquodead spotsrdquo Q46 Draft Contract sect104E TermRenewal Options Please revise to require mutual agreement for any extension of the Agreement with pricing to be negotiated by the parties in order to allow for price adjustments to reflect changes in Contractorrsquos cost to operate the service A46 The RFP and contract address changes to Contractorrsquos cost to operate service though the two-tiered (variable hourly rate and monthly fixed cost) structure and the
Addendum 3
9
Possible Rate Adjustments contract provision (304f) The optional contract extension terms will not be made subject to renegotiation Q47 Draft Contract sect523 ndashAssignment Please delete ldquoAssignment provision extends to any purchase merger or consolidation change in control etcrdquo from the draft contract as a change in stockholders of a contractor shall not require consent or result in a default or termination of the Agreement A47 No This contract provision does not require consent for a change in a contractorrsquos stockholders but instead a change in contract assignment resulting from a change in stockholders Q48 Draft Contract sect408 ndashTermination ndash Would Marin Transit please consider modifying this requirement to provide a minimum of 60 daysrsquo notice of cancellation in order to provide the contractor with enough time to complete obligations required such as WARN Act lease terminations etc A48 No Marin Transit prefers the 30-day notice period Q49 Draft Contract sect406 ndash Indemnity Would Marin Transit please consider revising indemnification to limit the indemnity to actions or omissions of the Contractor or its employees agents subcontractors etc The Contractor should not be liable for items outside of its control A49 No Marin Transit is not considering a revision to the indemnification clause at this time Q50 General Draft Contract Would Marin Transit please add a force majeure provision to relieve both parties from performance under the Contract for circumstances beyond their reasonable control (acts of God war labor strikes or disputes terrorism etc) The contractor should be excused from performance under the contract for circumstances outside of its control A50 No See response for Q38 Q51 General Draft Contract Would Marin Transit include a provision that provides for price adjustments if Contractorrsquos revenue decreases or Contractorrsquos costs increase as a result of (i) changes to the scope of work service hours requested by the Authority (ii) changes in laws rules regulations etc applicable to the services to be provided by Contractor andor (iii) wage increases necessary for Contractor to be able to recruit and retain qualified employees as a result of an increase in the minimum wage in the County or surrounding jurisdictions If the parties are unable to agree on a rate adjustment then either party may terminate the contract upon 120 daysrsquo written notice to the other party Doing so would
Addendum 3
10
provide protection for the contractor to cover changes requested by the District or matters that were not contemplated at the time of Contractorrsquos proposal A51 No The RFP and contract address potential changes to scope of work changes in lawrulesregulations and requires proposers to consider wages and benefits to recruit and attract qualified employees without requiring contract price renegotiation
Attachments MV Transportation Fees and Payment Schedule (Revised November 20 2017)
Marin Airporter Fees and Payment Schedule (Revised November 20 2017) System Performance Summary for FY201617
August 2017 Monthly Monitoring Report September 2017 Monthly Monitoring Report October 2017 Monthly Monitoring Report Local Transit Bus Replacement Schedule
171801
EXHIBIT ldquoCrdquo
FEES AND PAYMENT SCHEDULE (revised)
Contractor shall bill Marin Transit monthly for service hours provided Additional hours shall only be used with approval from Marin Transit Proper back-up including TransTrack reports showing hours miles and fuel usage must be attached to invoices For Fiscal Year 1718 Contractor shall provide proof of wage increase (eg month over month payroll comparisons)
Service Cost per Service Hour
Contract Service Hours
Contract Maximum Obligation
Total year 1 January 30 2012 to December 31 2012 13881 $737832 Total year 2 January 1 2013 to December 31 2013 16686 $892890 Total year 3 January 1 2014 to December 31 2014 20913 $1297726 Total year 4 January 1 2015 to December 31 2015 27250 $1715566
Fixed Administrative Costs $277094 West Marin StagecoachMuir Woods Shuttle $3682 10750 $395815 Supplemental Service $6601 3750 $247538 Start-Up Costs $47571 First Half Year 5 January 1 2016 to June 30 2016 14500 $968018
Fixed Administrative Costs $975995 West Marin StagecoachMuir Woods Shuttle $4094 21500 $880210 Local Fixed Route $4094 14000 $573160 Supplemental Service $6814 7500 $511050 Fiscal Year 1617 July 1 2016 to June 30 2017 43000 $2940415
Fixed Administrative Costs1 $1137363 West Marin StagecoachMuir Woods Shuttle $4439 21500 $954455 Local Fixed Route $4439 14000 $621505 Supplemental Service $7018 7500 $526350 Fiscal Year 1718 July 1 2017 to June 30 2018 43000 $3239674
1 Includes the addition of one Road Supervisor position and one Level A Mechanic Contractor shall credit Marin Transit $5900 per month for the wage benefit and tax cost of the Level A Mechanic from July 1 2017 until the date of hire of this position
Item 10
404
asmith
Typewritten Text
MV Transportation
171830
EXHIBIT ldquoBrdquo
FEES AND PAYMENT SCHEDULE (revised)
Cost per Revenue Hour Community Shuttle Service
Base Years Option Years FY1314 FY1415 FY1516 FY1617 FY1718
Rate $7078 $6866 $7072 $7284 $7614 Maximum Revenue Hours 40000 40000 40000 60000 60000
In addition to payment of a cost per revenue hour District will directly reimburse Contractor for lease payments associated with storage of heavy duty transit buses beginning June 2016 Contractor must substantiate lease expense by providing District with a copy of the lease agreement In no event will lease payments exceed $1800 per month without written approval of District
Contractor to provide proof of wage increase (eg month over month payroll comparisons)
Item 11
410
asmith
Typewritten Text
Marin Airporter
asmith
Typewritten Text
asmith
Typewritten Text
1
System Performance Summary for FY 201617
This report summarizes the unaudited operational performance of Marin Transit local transit services for FY 201617 and compares these results to the Districtrsquos route level performance goals identified in the Short-Range Transit Plan The report provides a detailed route level assessment of all Marin Transit services operating in FY 201617 On June 12 2016 Marin Transit implemented a major service change with a 19 increase in local fixed-route service levels and a restructuring of routes throughout the County This FY 201617 report includes data from a full year of the new service plan There were a few additional changes to transit services during FY 201617 including the following In July 2016 the District launched a new general public dial-a-ride service between Point Reyes Station and Novato
The service provides curb-to-curb pick-up and drop-off and only operates on the second Monday of each month The closure of Hwy 1 in early 2017 delayed the start of the Muir Woods Shuttle season which typically begins in April
The Shuttle season began on May 13 resulting in 12 fewer days of service A number of recent changes to Marin Transitrsquos contracts and agreements have had an impact on the Districtrsquos financials These include the following The District completed a procurement for paratransit services in 2015 The new contract went into effect on January 1
2016 and provides significantly lower rates for paratransit and dial-a-ride services This report provides data from the first full year of the new contract
Effective February 1 2017 the District increased the subsidy paid to Catch-A-Ride service providers for operating wheelchair accessible vehicles to further incentivize the availability of accessible vehicles for Catch-A-Ride trips
For FY 201617 Marin Transit updated the methodology for calculating revenue hours for demand response services to be more consistent with the National Transit Database definitions These include local paratransit and the Novato Dial-A-Ride This change has reduced the amount of time that is considered as part of revenue hours Overall Marin Transit provided over 32 million unlinked passenger trips in FY 201617 with over 235000 revenue hours of service Compared to FY 201516 these numbers represent a decrease in unlinked passenger trips (-35) and an increase in revenue hours (+82) Growth in service was primarily on local fixed-route services due to the June 2016 changes Some of this growth was partially offset by decreases in hours on local paratransit and Route 122 The system-wide productivity rate was 136 riders per hour about 108 lower than FY 201617 Passenger revenues increased slightly (+06) Due to higher operating costs passenger subsidy increased by 127 to a system-wide average of $678 per passenger Fixed Route Fixed Route operations carried over 29 million unlinked passenger trips in FY 201617 with 178052 revenue hours These totals represent 91 of the Districtrsquos total trips and 76 of revenue hours Compared to FY 201516 unlinked passenger trips on fixed route services decreased by 35 and revenue hours increased by 136 Overall productivity was 164 passengers per hour approximately 150 lower than the 193 mark last fiscal year Compared to FY 201516 almost all fixed-route typologies experienced a decrease in overall ridership These include Local Basic (-120) Local Connector (-127) Supplemental (-32) and Partnership (-25) However some services experienced a modest increase in ridership compared to last year including Local Trunkline (+77) the Muir Woods Shuttle (+44) and Rural (+48)
2
Total passenger revenue decreased slightly (-11) in FY 201617 compared to last year Increases in operating costs resulted in a decrease in overall farebox recovery from 199 last year to 176 in FY 201617 Only the Local Trunkline and Recreational (Muir Woods Shuttle) typologies experienced an overall increase in both passenger revenue and farebox recovery Yellow Bus In FY 201617 yellow bus service for the Ross Valley School District carried over 136000 unlinked passenger trips a decrease of 13 compared to last year and operated 1245 revenue hours These totals represent 4 of the Districtrsquos total ridership and 1 of revenue hours Passenger revenues increased 150 due to higher pass prices This boost in revenues did not keep pace with the rise in operating costs and overall farebox recovery decreased from 571 last year to 548 in FY 201617 Demand Response Demand Response programs carried 124325 unlinked passenger trips in FY 201617 and provided 55191 revenue hours of service These totals represent 4 of the Districtrsquos total trips and 24 of revenue hours Compared to FY 201516 unlinked passenger trips on demand response services decreased by 39 (-5096 trips) and revenue hours decreased by 61 The more significant reduction in revenue hours compared to passengers is likely due to the new method for calculating those hours Overall productivity was 23 passengers per hour slightly higher than last fiscal year Ridership on local paratransit and the Novato Dial-A-Ride decreased in FY 201617 compared to the prior year Rural Dial-A-Ride experienced growth in ridership mainly because these services were only recently introduced These include the Dillon BeachTomales and Point Reyes Station Dial-A-Ride Passenger revenues for demand response services dropped slightly (-15) compared to last year However lower operating costs due to the new contract rate resulted in reductions in subsidies and an increase in farebox recovery Other Services Other Marin Access Mobility Management services include the Volunteer Driver and Catch-A-Ride programs In FY 201617 these programs provided 30547 unlinked passenger trips about 1 of the Districtrsquos total trips Compared to the prior fiscal year ridership decreased by 77 mostly due to the Catch-A-Ride program However passenger revenues increased by 90 primarily on the Catch-A-Ride program This increase may have been due to riders taking longer trips Performance Goals
The 2016-2025 Short-Range Transit Plan identifies fifteen different goals and associated metrics that staff use to evaluate system performance Performance goals at the route level are measured in both productivity (unlinked passengers per hour and per trip) and cost effectiveness (subsidy per unlinked passenger trip) These measures follow the service typologies updated in the most recent Short Range Transit Plan Table 1 below summarizes route level performance goals by typology Marin Transit has not identified productivity or cost-effectiveness goals for the Yellow Bus or Partnership service typologies Table 2 provides a detailed summary of annual FY 201617 performance data by program route and service typology
3
Table 1 Productivity and Subsidy Goals by Service Typology
Service Typology Routes Unlinked Passenger
Trips per Hour (at or above)
Subsidy per Passenger Trip
(at or below)
Local Trunkline 35 36 71X 25 $300
Regular Local 17 22 23 23X 29 49 20 $500
Local Connector 219 228 233 245 251 257 8 $800
Supplemental 113 115 117 119 125 139 145 151 154 20 per trip $300
Rural 61 68 4 $1200
Recreational 66 (Muir Woods Shuttle) 25 $300
Demand Response Local DAR Novato DAR Dillon BeachTomales DAR Point Reyes DAR
2 $3000
Using the productivity goals identified in Table 1 all the service typology groups except for Local Basic met their unlinked passengers per hour goal overall Twelve individual routes and two demand response services did not meet their productivity targets These include Routes 17 22 23 23X 29 49 71X 115 125 139 219 228 the Dillon BeachTomales Dial-A-Ride and the Point Reyes Dial-A-Ride In the previous fiscal year ten routes did not meet this target Figure 1 provides FY 201617 productivity levels and respective productivity goals by service typology and at the route level Route 35 was the most productive fixed-route service carrying an average of 286 passengers per hour Route 151 (Hamilton ndash San Jose MS ndash Novato HS - San Marin HS) was the best performing supplemental school route with 428 passengers per trip and met its subsidy target at $150 per passenger Route 228 had the highest growth in productivity (+291) due to the addition of weekday service in June 2016 In terms of cost effectiveness the Supplemental School Rural and Recreational services collectively met their goals In total 17 individual routes and two demand response services did not meet their subsidy target (Routes 17 22 23 23X 29 35 36 49 71X 219 228 233 251 257 115 125 139 Local Paratransit and Novato Dial-A-Ride) This is an increase from the 13 routes and three demand response services reported for FY 201516 Figure 2 provides a breakdown of FY 201617 subsidy levels and respective subsidy goals by service typology and at the individual route level Ridership Trends
In FY 201617 there was an overall 35 decline in fixed-route ridership compared to the previous year despite increases to service levels One of the major contributors to this decline was the delayed start of the 2017 Muir Woods Shuttle season that reduced the amount of service provided by 76 The overall decrease in ridership is relatively consistent with trends among bus operators nationwide and in the Bay Area According to the National Transit Database bus ridership declined 66 nationwide during FY 201617 compared to the prior year Within in the Bay Area peer agencies experienced ridership declines between 6 and 12 These include Golden Gate Transit Sonoma County Transit SamTrans and Napa VINE One of the biggest external factors that may have contributed to this trend is weather Rainfall in FY 201617 almost doubled over the prior year Weather can have a significant impact on travel decisions affecting whether a person makes a trip as well as how that person ultimately makes the trip It can also impact operations and cause detours major delays and canceled trips
4
In FY 201617 there was a 34 increase in the number of canceled trips Almost half of these canceled trips occurred in February due to heavy rains that caused flooding and school closures In June 2016 Marin Transit implemented a major service change One of the main goals of the service restructuring was to reduce the need to transfer by providing faster and more direct connections While this approach improves the system for riders it has implications in terms of how ridership is counted and on performance metrics The number of passengers is measured in terms of unlinked passenger trips Each time a person boards a bus is counted as a separate trip regardless of whether that person is transferring from another bus Reducing the amount of transfers needed to complete a riderrsquos journey reduces the number of unlinked trips Replacing trips that require a transfer with direct trips to destinations does not change the number of individual riders using the system which is defined as linked passenger trips In FY 201617 there was a 75 overall decrease in the number of transfers for passengers using cash to pay their original fare Some of this decline reflects the systemwide decrease in ridership The transfer ratio is defined as the number of boarding trips (unlinked passenger trips) divided by the number of originating trips (linked passenger trips) This ratio can be used to evaluate the impact of transfers on ridership independent of other factors In FY 201617 the overall transfer ratio dropped 38 from 136 to 131 When estimating linked passenger trips based on these ratios the number of individual Marin Transit passengers in FY 201617 remained relatively constant compared to last year Demand for Marin Access mobility management programs declined overall 47 from FY 201516 to FY 201617 Changes in ridership varied from program to program The largest decline was on Catch-A-Ride which experienced a 129 decrease in ridership Local paratransit and Novato Dial-A-Ride ridership may have been affected by many of the same external factors as fixed route transit particularly weather It is also possible that paratransit clients have started to shift some or all their trips to services that are not provided by Marin Transit These may include Non-Emergency Medical Transportation services arranged by managed care organizations Private transportation
providers hired under contract to institutions typically served by paratransit (such as adult day care centers) Trips taken on Uber or Lyft and Volunteer transportation services that may be supported by Marin Transit in some way but whose ridership is not
reported in the Districtrsquos performance statistics Furthermore staff attributed much of the previous growth in the Marin Access program to the Catch-A-Ride program This program experienced a 473 increase in ridership between FY 201314 and FY 201415 Towards the end of FY 201415 On the Move one of the largest taxi companies in Marin went out of business To this day service is limited during hours of peak demand and in certain service areas especially Novato Therefore FY 201617 ridership on Catch-A-Ride may reflect two factors These include a slowdown in attracting new customers and a reduction in service availability following On the Moversquos closure Table 2 summarizes the factors that can influence ridership numbers year-over-year and qualitatively evaluates their impact
5
Table 2 Factors Impacting Ridership Comparison
Factor FY 201516 FY 201617 Impact
Calendar
School Days 181 183 --
Weekdays 256 253
Weekends amp Holidays 110 111 --
Muir Woods Shuttle 113 104
Transfer Ratio (ratio of unlinked to linked trips) 136 131
Service Disruptions Canceled service (trips) 200 268
Major detourclosure (days) (1) 18 29
Rainfall (inches) 2928 5653
Gas Prices $298 $291 --
Unemployment Rate 32 32 -- Notes (1) Data on major detours and closure collected starting January 2016 Comparison includes the months of January through June FY 201718 Performance Outlook
In June 2016 Marin Transit implemented a major service change aimed in part to help underperforming routes meet established performance standards Staff has continued to monitor service performance and has made minor adjustments to improve on-time performance and cancel low-ridership trips In early 2018 staff is planning a comprehensive assessment of service performance since the June 2016 service changes This effort will include data from a recently completed onboard survey from April 2017 on passenger origins and destinations and a 100 passenger ridecheck The ridecheck will provide data on stop-level ridership activity for each route The assessment will use this analysis to recommend service changes to improve underperforming routes There are several unknowns that may also affect route performance primarily in terms of operating costs The District relies on its contractors to either lease or own property to store and maintain the vehicles needed to operate service For contractors that do not own suitable property finding and leasing these types of facilities in Marin County is challenging and expensive Recent surveys of current and potential service providers identified securing a facility as the most significant factor in determining their interest in bidding on Marin Transit services ability to provide the service and proposed pricing Marin Transit has been actively working to secure and develop its own operations and maintenance facility A District-owned facility will eliminate the need for potential service providers to lease property and lower operating costs It may also improve efficiency by reducing deadhead or non-revenue time when vehicles are traveling to and from the yard and further lower the Districtrsquos contract rates In late 2017 Marin Transit will release for bid over half of its fixed-route service and there are many uncertainties that may affect the outcome The tight labor market in Marin County and the greater Bay Area has made it difficult for service providers to hire and retain employees Potential contractors are required to secure property in a County with limited real estate opportunities If the District provides its own facility there will be more interest among potential bidders and more competitive rates
6
Table 3 System-wide Performance Statistics FY 201617 (unaudited)
Route Passengers Revenue
Hours Operating
Costs Passenger
Revenue Pass Trips Per
Rev Hr (Trip) Subsidy Per
Passenger Farebox
Recovery Fixed Route 2925522 178052 $20173419 $3550259 164 $568 176 Local Trunkline 1122188 44393 $6252940 $1263870 253 $445 202
35 658869 23052 $3234308 $729775 286 $380 226 36 342178 13636 $1901678 $369132 251 $448 194
71X 121141 7705 $1116954 $164963 157 $786 148 Local Basic 989500 65117 $7451946 $1221298 152 $630 164
17 247998 14757 $2076786 $319761 168 $708 154 22 215758 17553 $1619319 $273059 123 $624 169 23 199150 11065 $1508659 $246908 180 $634 164
23X 49255 3445 $473413 $57438 143 $845 121 29 40103 3707 $509475 $49634 108 $1147 97 49 237236 14590 $1264294 $274498 163 $417 217
Local Connector 378985 42396 $3873801 $461426 89 $900 119 219 50449 6392 $591224 $64101 79 $1045 108 228 71340 10042 $904806 $103912 71 $1123 115 233 42798 4363 $399203 $52001 98 $811 130 245 49766 4349 $391596 $56968 114 $672 145 251 95506 9607 $889019 $101823 99 $824 115 257 69126 7643 $697953 $82621 90 $890 118
Supplemental 179947 3963 $514380 $110503 454 (286) $224 215 113 16829 317 $42180 $12227 530 (315) $178 290 115 14021 637 $87534 $9504 220 (185) $557 109 117 34820 640 $81509 $17140 544 (284) $185 210 119 27161 374 $56273 $18859 727 (313) $138 335 125 13757 600 $72469 $11570 229 (193) $443 160 139 6414 253 $33182 $6635 253 (179) $414 200 145 16406 191 $25426 $7258 861 (372) $111 285 151 36801 594 $73842 $18463 620 (428) $150 250 154 13738 358 $41965 $8847 384 (255) $241 211
Recreational 122116 4316 $473726 $249748 283 $183 527 66 122116 4316 $473726 $249748 283 $183 527
Rural 112926 16172 $1422683 $122407 70 $1151 86 61 36328 5492 $475778 $39959 66 $1200 84 68 76598 10680 $946905 $82448 72 $1129 87
Partnership 19860 1696 $183943 $121007 117 $317 658 122 19860 1696 $183943 $121007 117 $317 658
Yellow Bus 136500 1245 $863348 $473066 1096 (448) $286 548 Hidden Valley 9281 180 $124763 $32170 516 (265) $998 258
White Hill 127219 1065 $738585 $440896 1194 (471) $234 597 Demand Response 124325 55191 $4571296 $236980 23 $3486 52
Local Paratransit 119673 53011 $4404928 $226387 23 $3492 51 Novato DAR 4057 1856 $150815 $8815 22 $3487 58
Dillon Beach DAR 488 260 $12511 $1356 19 $2285 108 Pt Reyes DAR 107 64 $3042 $422 17 $2447 139
Other Services 30547 - $511316 $41956 - $1537 82 Volunteer Driver(1) 16162 - $152714 - - $945 -
Catch-A-Ride(1) 14385 - $358602 $41956 - $2201 117 Total 3216894 234489 $26118572 $4302085 136 $678 165
Notes Values in red indicate performance that does not meet District
7
Figure 1 FY 201617 Passengers per Revenue Hour by Route
0
5
10
15
20
25
30
35
40
45
50Lo
cal T
runk
line T
otals 35 36 71
X
Loca
l Bas
ic To
tals 17 22 23 23X 29 49
Loca
l Con
necto
r Tot
als 219
228
233
245
251
257
Supp
lemen
tal T
otals 11
311
511
711
912
513
914
515
115
4
Recre
ation
al To
tals 66
Rura
l Tot
als 61 68
Dem
and R
espo
nse T
otals
Loca
l Par
atra
nsit
Nova
to D
ARDi
llon D
ARPt
Reye
s DAR
Pass
enge
rs p
er R
even
ue H
our
meets goalservice standard
does not meet goal
school routes show passengers per trip
8
Figure 2 FY 201617 Subsidy per Passenger by Route
$0
$5
$10
$15
$20
$25
$30
$35
$40
Loca
l Tru
nklin
e Tot
als 35 36 71X
Loca
l Bas
ic To
tals 17 22 23 23X 29 49
Loca
l Con
necto
r Tot
als 219
228
233
245
251
257
Supp
lemen
tal T
otals 11
311
511
711
912
513
914
515
115
4
Recre
ation
al To
tals 66
Rura
l Tot
als 61 68
Dem
and R
espo
nse T
otals
Loca
l Par
atra
nsit
Nova
to D
ARDi
llon D
ARPt
Reye
s DAR
Subs
idy p
er P
asse
nger
does not meet goal
service standard
meets goal
9
Attachment A Route Profiles 17 Sausalito ndash Marin City ndash Mill Valley ndash San Rafael 22 San Rafael Transit Center ndash San Anselmo ndash Marin City 23 Fairfax ndash San Anselmo ndash San Rafael ndash Canal 23X Manor ndash Fairfax ndash San Anselmo ndash San Rafael ndash Canal 29 Canal ndash San Rafael Transit Center ndash Larkspur ndash College of Marin ndash Marin General 35 Canal ndash San Rafael Transit Center ndash Marin Civic Center ndash Northgate Mall ndash Novato 36 Canal ndash San Rafael Transit Center ndash Marin City 49 Novato ndash Ignacio ndash Hamilton ndash Marin Civic Center ndash San Rafael Transit Center 61 West Marin Stagecoach (Sausalito ndash Marin City ndash Mill Valley ndash Stinson Beach ndash Bolinas) 66 Muir Woods Shuttle 68 West Marin Stagecoach (San Rafael Transit Center ndash San Anselmo ndash Pt Reyes Station ndash Inverness) 71X Novato ndash San Rafael Transit Center ndash Marin City ndash Sausalito 113 Redwood High School ndash Paradise Cay 115 Sausalito ndash Willow Creek ndash Marin City ndash Mill Valley ndash St Hilary 117 Neil Cummins Hall Middle School ndash E Corte Madera ndash Cove School 119 Tiburon ndash Belvedere ndash Redwood High School 122 San Rafael Transit Center ndash San Anselmo ndash College of Marin 125 Lagunitas ndash Sir Francis Drake HS ndash San Anselmo ndash San Rafael 139 Terra Linda High School ndash Lucas Valley 145 Terra Linda High School ndash San Rafael 151 Hamilton ndash Ignacio ndash San Jose Middle School ndash Novato High School ndash San Marin High School 154 Olive ndash San Marin High School ndash Sinaloa Middle School ndash Novato 219 Tiburon ndash Strawberry 228 San Rafael Transit Center ndash Larkspur ndash San Anselmo ndash Fairfax 233 Santa Venetia ndash Marin Civic Center ndash San Rafael Transit Center 245 San Rafael Transit Center ndash Northgate Mall ndash Kaiser ndash Smith Ranch Road 251 San Marin ndash Novato ndash Vintage Oaks ndash IVC ndash Ignacio ndash Hamilton 257 San Rafael ndash Northgate Mall ndash Kaiser ndash Marinwood ndash Hamilton ndash Ignacio ndash IVC Hdn Valley Ross Valley Yellow Bus (Fairfax ndash San Anselmo ndash Hidden Valley ES) White Hill Ross Valley Yellow Bus (San Anselmo ndash Sleepy Hollow ndash Fairfax ndash White Hill MS)
17Local Basic
Days of Service Wkdy Sa SuAvg Freq (Wkdy Peak) 30 min
Avg Freq (Wkdy Non-Peak) 60 minAvg Freq (Wked) 60 min
FY 2017 Farebox Recovery 15 transfer (to route) 25
Clipper usage 16
Annual Avg Monthly Avg Daily Annual Avg Monthly Avg Daily Annual Avg Monthly Avg DailyWeekday 194263 16189 768 11496 958 45 177386 14782 701 Saturday 27564 2297 530 1541 128 30 24621 2052 473 Sunday 26171 2181 436 1720 143 29 27378 2282 456
Total 247998 20667 679 14757 1230 40 229385 19115 628
Annual Avg Monthly Avg Daily Annual Avg Monthly Avg Daily Annual Avg Monthly Avg DailyWeekday $1617108 $134759 $6392 $247041 $20587 $976 $1370067 $114172 $5415Saturday $217536 $18128 $4183 $36894 $3075 $710 $180642 $15054 $3474Sunday $242142 $20179 $4036 $35826 $2986 $597 $206316 $17193 $3439
Total $2076786 $173066 $5690 $319761 $26647 $876 $1757025 $146419 $4814
Passengers per Revenue Hour
Subsidy per Passenger
Cost per Revenue Hour
Farebox Recovery
Weekday 169 $705 $14067 153Saturday 179 $655 $14117 170Sunday 152 $788 $14078 148
Total 168 $708 $14073 154
Passengers Revenue Hours Operating CostsPassenger
RevenueOperating Subsidy
Passengers per Revenue Hour
Subsidy per Passenger
Cost per Revenue Hour
Farebox Recovery
FY 2015 301136 15167 $2108822 $340410 $1768412 199 $587 $13904 161FY 2016 280486 15330 $2041616 $302337 $1739279 183 $620 $13317 148FY 2017 247998 14757 $2076786 $319761 $1757025 168 $708 $14073 154
Histo
ric Tr
ends
FY 20
161
7 DAT
A
Passengers Revenue Hours Revenue Miles
Operating Costs Passenger Revenue Operating Subsidy
277892 322826
301136 280486
247998
0
50000
100000
150000
200000
250000
300000
350000
FY 2013 FY 2014 FY 2015 FY 2016 FY 2017
Passengers
12402 14818 15167 15330 14757
0
5000
10000
15000
20000
FY 2013 FY 2014 FY 2015 FY 2016 FY 2017
Revenue Hours
$1717002
$2179526 $2108822 $2041616 $2076786
$0
$500000
$1000000
$1500000
$2000000
$2500000
FY 2013 FY 2014 FY 2015 FY 2016 FY 2017
Operating Costs
224 218 199 183 168
00
50
100
150
200
250
300
FY 2013 FY 2014 FY 2015 FY 2016 FY 2017
Passengers per Revenue Hour
$504 $558 $587 $620 $708
$000$200$400$600$800
$1000$1200$1400
FY 2013 FY 2014 FY 2015 FY 2016 FY 2017
Subsidy per Passenger
$13845 $14709 $13904 $13317 $14073
$0
$50
$100
$150
$200
FY 2013 FY 2014 FY 2015 FY 2016 FY 2017
Cost per Revenue Hour
22Local Basic
Days of Service Wkdy Sa SuAvg Freq (Wkdy Peak) 30 min
Avg Freq (Wkdy Non-Peak) 60 minAvg Freq (Wked) 60 min
FY 2017 Farebox Recovery 17 transfer (to route) 10
Clipper usage 11
Annual Avg Monthly Avg Daily Annual Avg Monthly Avg Daily Annual Avg Monthly Avg DailyWeekday 184918 15410 731 14244 1187 56 126319 10527 499 Saturday 16752 1396 322 1537 128 30 16232 1353 312 Sunday 14088 1174 235 1773 148 30 18729 1561 312
Total 215758 17980 591 17553 1463 48 161280 13440 442
Annual Avg Monthly Avg Daily Annual Avg Monthly Avg Daily Annual Avg Monthly Avg DailyWeekday $1312992 $109416 $5190 $232926 $19411 $921 $1080066 $90006 $4269Saturday $142334 $11861 $2737 $21235 $1770 $408 $121099 $10092 $2329Sunday $163993 $13666 $2733 $18898 $1575 $315 $145095 $12091 $2418
Total $1619319 $134943 $4436 $273059 $22755 $748 $1346260 $112188 $3688
Passengers per Revenue Hour
Subsidy per Passenger
Cost per Revenue Hour
Farebox Recovery
Weekday 130 $584 $9218 177Saturday 109 $723 $9263 149Sunday 79 $1030 $9251 115
Total 123 $624 $9225 169
Passengers Revenue Hours Operating CostsPassenger
RevenueOperating Subsidy
Passengers per Revenue Hour
Subsidy per Passenger
Cost per Revenue Hour
Farebox Recovery
FY 2015 249148 14777 $2054433 $292215 $1762218 169 $707 $13903 142FY 2016 243635 14872 $1971172 $259453 $1711719 164 $703 $13255 132FY 2017 215758 17553 $1619319 $273059 $1346260 123 $624 $9225 169
Histo
ric Tr
ends
FY 20
161
7 DAT
A
Passengers Revenue Hours Revenue Miles
Operating Costs Passenger Revenue Operating Subsidy
366301
281761 249148 243635
215758
050000
100000150000200000250000300000350000400000
FY 2013 FY 2014 FY 2015 FY 2016 FY 2017
Passengers18061
15083 14777 14872 17553
0
5000
10000
15000
20000
FY 2013 FY 2014 FY 2015 FY 2016 FY 2017
Revenue Hours$2498169
$2220145 $2054433 $1971172
$1619319
$0
$500000
$1000000
$1500000
$2000000
$2500000
$3000000
FY 2013 FY 2014 FY 2015 FY 2016 FY 2017
Operating Costs
203 187 169 164
123
00
50
100
150
200
250
300
FY 2013 FY 2014 FY 2015 FY 2016 FY 2017
Passengers per Revenue Hour
$567 $667 $707 $703 $624
$000$200$400$600$800
$1000$1200$1400
FY 2013 FY 2014 FY 2015 FY 2016 FY 2017
Subsidy per Passenger
$13832 $14720 $13903 $13255
$9225
$0
$50
$100
$150
$200
FY 2013 FY 2014 FY 2015 FY 2016 FY 2017
Cost per Revenue Hour
23Local Basic
Days of Service Wkdy Sa SuAvg Freq (Wkdy Peak) 60 min
Avg Freq (Wkdy Non-Peak) 60 minAvg Freq (Wked) 60 min
FY 2017 Farebox Recovery 16 transfer (to route) 24
Clipper usage 12
Annual Avg Monthly Avg Daily Annual Avg Monthly Avg Daily Annual Avg Monthly Avg DailyWeekday 145707 12142 576 8042 670 32 64277 5356 254 Saturday 28305 2359 544 1434 120 28 11466 956 221 Sunday 25138 2095 419 1589 132 26 12750 1062 212
Total 199150 16596 546 11065 922 30 88492 7374 242
Annual Avg Monthly Avg Daily Annual Avg Monthly Avg Daily Annual Avg Monthly Avg DailyWeekday $1096892 $91408 $4336 $179427 $14952 $709 $917465 $76455 $3626Saturday $195468 $16289 $3759 $35226 $2936 $677 $160242 $13354 $3082Sunday $216299 $18025 $3605 $32255 $2688 $538 $184044 $15337 $3067
Total $1508659 $125722 $4133 $246908 $20576 $676 $1261751 $105146 $3457
Passengers per Revenue Hour
Subsidy per Passenger
Cost per Revenue Hour
Farebox Recovery
Weekday 181 $630 $13640 164Saturday 197 $566 $13629 180Sunday 158 $732 $13612 149
Total 180 $634 $13635 164
Passengers Revenue Hours Operating CostsPassenger
RevenueOperating Subsidy
Passengers per Revenue Hour
Subsidy per Passenger
Cost per Revenue Hour
Farebox Recovery
FY 2015 354706 14168 $1969650 $381111 $1588539 250 $448 $13902 193FY 2016 268218 13154 $1703216 $308138 $1395078 204 $520 $12948 181FY 2017 199150 11065 $1508659 $246908 $1261751 180 $634 $13635 164
Histo
ric Tr
ends
FY 20
161
7 DAT
A
Passengers Revenue Hours Revenue Miles
Operating Costs Passenger Revenue Operating Subsidy
212064
339118 354706
268218
199150
050000
100000150000200000250000300000350000400000
FY 2013 FY 2014 FY 2015 FY 2016 FY 2017
Passengers
8716
14034 14168 13154
11065
02000400060008000
10000120001400016000
FY 2013 FY 2014 FY 2015 FY 2016 FY 2017
Revenue Hours
$1202564
$2061985 $1969650 $1703216
$1508659
$0
$500000
$1000000
$1500000
$2000000
$2500000
FY 2013 FY 2014 FY 2015 FY 2016 FY 2017
Operating Costs
243 242 250
204 180
00
50
100
150
200
250
300
FY 2013 FY 2014 FY 2015 FY 2016 FY 2017
Passengers per Revenue Hour
$455 $494 $448 $520 $634
$000$200$400$600$800
$1000$1200$1400
FY 2013 FY 2014 FY 2015 FY 2016 FY 2017
Subsidy per Passenger
$13797 $14692 $13902 $12948 $13635
$0
$50
$100
$150
$200
FY 2013 FY 2014 FY 2015 FY 2016 FY 2017
Cost per Revenue Hour
23XLocal Basic
Days of Service WkdyAvg Freq (Wkdy Peak) 60 min
Avg Freq (Wkdy Non-Peak) -Avg Freq (Wked) -
FY 2017 Farebox Recovery 12 transfer (to route) 31
Clipper usage 12
Annual Avg Monthly Avg Daily Annual Avg Monthly Avg Daily Annual Avg Monthly Avg DailyWeekday 49255 4105 195 3445 287 14 32408 2701 128 Saturday - - - - - - - - - Sunday - - - - - - - - -
Total 49255 4105 195 3445 287 14 32408 2701 128
Annual Avg Monthly Avg Daily Annual Avg Monthly Avg Daily Annual Avg Monthly Avg DailyWeekday $473413 $39451 $1871 $57438 $4787 $227 $415975 $34665 $1644Saturday $ - $ - $ - $ - $ - $ - $ - $ - $ -Sunday $ - $ - $ - $ - $ - $ - $ - $ - $ -
Total $473413 $39451 $1871 $57438 $4787 $227 $415975 $34665 $1644
Passengers per Revenue Hour
Subsidy per Passenger
Cost per Revenue Hour
Farebox Recovery
Weekday 143 $845 $13744 121Saturday - $ - $ - - Sunday - $ - $ - -
Total 143 $845 $13744 121
Passengers Revenue Hours Operating CostsPassenger
RevenueOperating Subsidy
Passengers per Revenue Hour
Subsidy per Passenger
Cost per Revenue Hour
Farebox Recovery
FY 2015FY 2016 2548 189 $23303 $2272 $21031 135 $825 $12330 97FY 2017 49255 3445 $473413 $57438 $415975 143 $845 $13744 121
Histo
ric Tr
ends
FY 20
161
7 DAT
A
Passengers Revenue Hours Revenue Miles
Operating Costs Passenger Revenue Operating Subsidy
2548
49255
0
10000
20000
30000
40000
50000
60000
FY 2013 FY 2014 FY 2015 FY 2016 FY 2017
Passengers
189
3445
0500
1000150020002500300035004000
FY 2013 FY 2014 FY 2015 FY 2016 FY 2017
Revenue Hours
$23303
$473413
$0
$100000
$200000
$300000
$400000
$500000
FY 2013 FY 2014 FY 2015 FY 2016 FY 2017
Operating Costs
135 143
00
50
100
150
200
250
300
FY 2013 FY 2014 FY 2015 FY 2016 FY 2017
Passengers per Revenue Hour
$825 $845
$000$200$400$600$800
$1000$1200$1400
FY 2013 FY 2014 FY 2015 FY 2016 FY 2017
Subsidy per Passenger
$12330 $13744
$0
$50
$100
$150
$200
FY 2013 FY 2014 FY 2015 FY 2016 FY 2017
Cost per Revenue Hour
29Local Basic
Days of Service WkdyAvg Freq (Wkdy Peak) 60 min
Avg Freq (Wkdy Non-Peak) -Avg Freq (Wked) -
FY 2017 Farebox Recovery 10 transfer (to route) 26
Clipper usage 12
Annual Avg Monthly Avg Daily Annual Avg Monthly Avg Daily Annual Avg Monthly Avg DailyWeekday 40103 3342 159 3707 309 15 37048 3087 146 Saturday - - - - - - - - - Sunday - - - - - - - - -
Total 40103 3342 159 3707 309 15 37048 3087 146
Annual Avg Monthly Avg Daily Annual Avg Monthly Avg Daily Annual Avg Monthly Avg DailyWeekday $509475 $42456 $2014 $49634 $4136 $196 $459841 $38320 $1818Saturday $ - $ - $ - $ - $ - $ - $ - $ - $ -Sunday $ - $ - $ - $ - $ - $ - $ - $ - $ -
Total $509475 $42456 $2014 $49634 $4136 $196 $459841 $38320 $1818
Passengers per Revenue Hour
Subsidy per Passenger
Cost per Revenue Hour
Farebox Recovery
Weekday 108 $1147 $13745 97Saturday - $ - $ - - Sunday - $ - $ - -
Total 108 $1147 $13745 97
Passengers Revenue Hours Operating CostsPassenger
RevenueOperating Subsidy
Passengers per Revenue Hour
Subsidy per Passenger
Cost per Revenue Hour
Farebox Recovery
FY 2015 203632 10795 $1500887 $232286 $1268601 189 $623 $13904 155FY 2016 181786 10502 $1378760 $219997 $1158763 173 $637 $13129 160FY 2017 40103 3707 $509475 $49634 $459841 108 $1147 $13745 97
Histo
ric Tr
ends
FY 20
161
7 DAT
A
Passengers Revenue Hours Revenue Miles
Operating Costs Passenger Revenue Operating Subsidy
238310 225998 203632
181786
40103
0
50000
100000
150000
200000
250000
300000
FY 2013 FY 2014 FY 2015 FY 2016 FY 2017
Passengers12248
10927 10795 10502
3707
0
2000
4000
6000
8000
10000
12000
14000
FY 2013 FY 2014 FY 2015 FY 2016 FY 2017
Revenue Hours$1692980 $1607795 $1500887
$1378760
$509475
$0
$500000
$1000000
$1500000
$2000000
FY 2013 FY 2014 FY 2015 FY 2016 FY 2017
Operating Costs
195 207 189 173
108
00
50
100
150
200
250
300
FY 2013 FY 2014 FY 2015 FY 2016 FY 2017
Passengers per Revenue Hour
$595 $593 $623 $637
$1147
$000$200$400$600$800
$1000$1200$1400
FY 2013 FY 2014 FY 2015 FY 2016 FY 2017
Subsidy per Passenger
$13822 $14714 $13904 $13129 $13745
$0
$50
$100
$150
$200
FY 2013 FY 2014 FY 2015 FY 2016 FY 2017
Cost per Revenue Hour
35Local Trunkline
Days of Service Wkdy Sa SuAvg Freq (Wkdy Peak) 30 min
Avg Freq (Wkdy Non-Peak) 30 minAvg Freq (Wked) 30 min
FY 2017 Farebox Recovery 23 transfer (to route) 17
Clipper usage 8
Annual Avg Monthly Avg Daily Annual Avg Monthly Avg Daily Annual Avg Monthly Avg DailyWeekday 492328 41027 1946 16909 1409 67 224421 18702 887 Saturday 84453 7038 1624 2860 238 55 43336 3611 833 Sunday 82088 6841 1368 3284 274 55 50021 4168 834
Total 658869 54906 1805 23052 1921 63 317778 26482 871
Annual Avg Monthly Avg Daily Annual Avg Monthly Avg Daily Annual Avg Monthly Avg DailyWeekday $2367217 $197268 $9357 $533190 $44433 $2107 $1834027 $152836 $7249Saturday $403729 $33644 $7764 $97853 $8154 $1882 $305876 $25490 $5882Sunday $463362 $38614 $7723 $98732 $8228 $1646 $364630 $30386 $6077
Total $3234308 $269526 $8861 $729775 $60815 $1999 $2504533 $208711 $6862
Passengers per Revenue Hour
Subsidy per Passenger
Cost per Revenue Hour
Farebox Recovery
Weekday 291 $373 $14000 225Saturday 295 $362 $14118 242Sunday 250 $444 $14111 213
Total 286 $380 $14030 226
Passengers Revenue Hours Operating CostsPassenger
RevenueOperating Subsidy
Passengers per Revenue Hour
Subsidy per Passenger
Cost per Revenue Hour
Farebox Recovery
FY 2015 476489 8544 $1187694 $462204 $725490 558 $152 $13901 389FY 2016 472718 9300 $1202986 $544109 $658877 508 $139 $12935 452FY 2017 658869 23052 $3234308 $729775 $2504533 286 $380 $14030 226
Histo
ric Tr
ends
FY 20
161
7 DAT
A
Passengers Revenue Hours Revenue Miles
Operating Costs Passenger Revenue Operating Subsidy
669860 574669
476489 472718
658869
0100000200000300000400000500000600000700000800000
FY 2013 FY 2014 FY 2015 FY 2016 FY 2017
Passengers
9755 8644 8544 9300
23052
0
5000
10000
15000
20000
25000
FY 2013 FY 2014 FY 2015 FY 2016 FY 2017
Revenue Hours
$1345711 $1271601 $1187694 $1202986
$3234308
$0
$500000
$1000000
$1500000
$2000000
$2500000
$3000000
$3500000
FY 2013 FY 2014 FY 2015 FY 2016 FY 2017
Operating Costs
687 665 558
508
286
00100200300400500600700800
FY 2013 FY 2014 FY 2015 FY 2016 FY 2017
Passengers per Revenue Hour
$097 $120 $152 $139
$380
$000
$200
$400
$600
$800
$1000
FY 2013 FY 2014 FY 2015 FY 2016 FY 2017
Subsidy per Passenger
$13796 $14710 $13901 $12935 $14030
$0
$50
$100
$150
$200
FY 2013 FY 2014 FY 2015 FY 2016 FY 2017
Cost per Revenue Hour
36Local Trunkline
Days of Service Wkdy Sa SuAvg Freq (Wkdy Peak) 30 min
Avg Freq (Wkdy Non-Peak) 30 minAvg Freq (Wked) 30 min
FY 2017 Farebox Recovery 19 transfer (to route) 18
Clipper usage 6
Annual Avg Monthly Avg Daily Annual Avg Monthly Avg Daily Annual Avg Monthly Avg DailyWeekday 278217 23185 1100 9938 828 39 133318 11110 527 Saturday 33779 2815 650 1715 143 33 24259 2022 467 Sunday 30182 2515 503 1983 165 33 28002 2334 467
Total 342178 28515 937 13636 1136 37 185579 15465 508
Annual Avg Monthly Avg Daily Annual Avg Monthly Avg Daily Annual Avg Monthly Avg DailyWeekday $1384291 $115358 $5472 $290481 $24207 $1148 $1093810 $91151 $4323Saturday $240062 $20005 $4617 $40774 $3398 $784 $199288 $16607 $3832Sunday $277325 $23110 $4622 $37877 $3156 $631 $239448 $19954 $3991
Total $1901678 $158473 $5210 $369132 $30761 $1011 $1532546 $127712 $4199
Passengers per Revenue Hour
Subsidy per Passenger
Cost per Revenue Hour
Farebox Recovery
Weekday 280 $393 $13930 210Saturday 197 $590 $13999 170Sunday 152 $793 $13984 137
Total 251 $448 $13946 194
Passengers Revenue Hours Operating CostsPassenger
RevenueOperating Subsidy
Passengers per Revenue Hour
Subsidy per Passenger
Cost per Revenue Hour
Farebox Recovery
FY 2015 109347 2894 $402355 $110471 $291884 378 $267 $13905 275FY 2016 119593 3462 $457211 $129715 $327496 345 $274 $13205 284FY 2017 342178 13636 $1901678 $369132 $1532546 251 $448 $13946 194
Histo
ric Tr
ends
FY 20
161
7 DAT
A
Passengers Revenue Hours Revenue Miles
Operating Costs Passenger Revenue Operating Subsidy
106988 103673 109347 119593
342178
050000
100000150000200000250000300000350000400000
FY 2013 FY 2014 FY 2015 FY 2016 FY 2017
Passengers
2878 2822 2894 3462
13636
02000400060008000
10000120001400016000
FY 2013 FY 2014 FY 2015 FY 2016 FY 2017
Revenue Hours
$398410 $415238 $402355 $457211
$1901678
$0
$500000
$1000000
$1500000
$2000000
FY 2013 FY 2014 FY 2015 FY 2016 FY 2017
Operating Costs
372 367 378 345 251
00100200300400500600700800
FY 2013 FY 2014 FY 2015 FY 2016 FY 2017
Passengers per Revenue Hour
$265 $293 $267 $274
$448
$000
$200
$400
$600
$800
$1000
FY 2013 FY 2014 FY 2015 FY 2016 FY 2017
Subsidy per Passenger
$13842 $14713 $13905 $13205 $13946
$0
$50
$100
$150
$200
FY 2013 FY 2014 FY 2015 FY 2016 FY 2017
Cost per Revenue Hour
49Local Basic
Days of Service Wkdy Sa SuAvg Freq (Wkdy Peak) 30 min
Avg Freq (Wkdy Non-Peak) 60 minAvg Freq (Wked) 60 min
FY 2017 Farebox Recovery 22 transfer (to route) 9
Clipper usage 11
Annual Avg Monthly Avg Daily Annual Avg Monthly Avg Daily Annual Avg Monthly Avg DailyWeekday 201564 16797 797 11313 943 45 139528 11627 551 Saturday 18489 1541 356 1517 126 29 18370 1531 353 Sunday 17183 1432 286 1761 147 29 21402 1784 357
Total 237236 19770 650 14590 1216 40 179300 14942 491
Annual Avg Monthly Avg Daily Annual Avg Monthly Avg Daily Annual Avg Monthly Avg DailyWeekday $978903 $81575 $3869 $230134 $19178 $910 $748769 $62397 $2960Saturday $131907 $10992 $2537 $22520 $1877 $433 $109387 $9116 $2104Sunday $153484 $12790 $2558 $21844 $1820 $364 $131640 $10970 $2194
Total $1264294 $105358 $3464 $274498 $22875 $752 $989796 $82483 $2712
Passengers per Revenue Hour
Subsidy per Passenger
Cost per Revenue Hour
Farebox Recovery
Weekday 178 $371 $8653 235Saturday 122 $592 $8698 171Sunday 98 $766 $8718 142
Total 163 $417 $8665 217
Passengers Revenue Hours Operating CostsPassenger
RevenueOperating Subsidy
Passengers per Revenue Hour
Subsidy per Passenger
Cost per Revenue Hour
Farebox Recovery
FY 2015 144262 6349 $882801 $158088 $724713 227 $502 $13905 179FY 2016 147480 6795 $900804 $146345 $754459 217 $512 $13257 162FY 2017 237236 14590 $1264294 $274498 $989796 163 $417 $8665 217
Histo
ric Tr
ends
FY 20
161
7 DAT
A
Passengers Revenue Hours Revenue Miles
Operating Costs Passenger Revenue Operating Subsidy
230943
152259 144262 147480
237236
0
50000
100000
150000
200000
250000
FY 2013 FY 2014 FY 2015 FY 2016 FY 2017
Passengers
9814
6440 6349 6795
14590
02000400060008000
10000120001400016000
FY 2013 FY 2014 FY 2015 FY 2016 FY 2017
Revenue Hours$1362499
$948702 $882801 $900804
$1264294
$0$200000$400000$600000$800000
$1000000$1200000$1400000$1600000
FY 2013 FY 2014 FY 2015 FY 2016 FY 2017
Operating Costs
235 236 227 217
163
00
50
100
150
200
250
300
FY 2013 FY 2014 FY 2015 FY 2016 FY 2017
Passengers per Revenue Hour
$477 $507 $502 $512 $417
$000$200$400$600$800
$1000$1200$1400
FY 2013 FY 2014 FY 2015 FY 2016 FY 2017
Subsidy per Passenger
$13884 $14732 $13905 $13257
$8665
$0
$50
$100
$150
$200
FY 2013 FY 2014 FY 2015 FY 2016 FY 2017
Cost per Revenue Hour
61Rural
Days of Service Wkdy Sa SuAvg Freq (Wkdy Peak) 8 trips
Avg Freq (Wkdy Non-Peak) -Avg Freq (Wked) 16 trips
FY 2017 Farebox Recovery 8 transfer (to route) 7
Clipper usage 11
Annual Avg Monthly Avg Daily Annual Avg Monthly Avg Daily Annual Avg Monthly Avg DailyWeekday 17166 1431 68 2631 219 10 45398 3783 181 Saturday 9922 827 198 1319 110 26 20810 1734 416 Sunday 9240 770 144 1542 129 24 24457 2038 382
Total 36328 3027 100 5492 458 15 90665 7555 248
Annual Avg Monthly Avg Daily Annual Avg Monthly Avg Daily Annual Avg Monthly Avg DailyWeekday $229650 $19138 $915 $17691 $1474 $70 $211959 $17663 $844Saturday $113378 $9448 $2268 $11622 $969 $232 $101756 $8480 $2035Sunday $132750 $11063 $2074 $10646 $887 $166 $122104 $10175 $1908
Total $475778 $39648 $1304 $39959 $3330 $109 $435819 $36318 $1194
Passengers per Revenue Hour
Subsidy per Passenger
Cost per Revenue Hour
Farebox Recovery
Weekday 65 $1235 $8730 77Saturday 75 $1026 $8598 103Sunday 60 $1321 $8607 80
Total 66 $1200 $8663 84
Passengers Revenue Hours Operating CostsPassenger
RevenueOperating Subsidy
Passengers per Revenue Hour
Subsidy per Passenger
Cost per Revenue Hour
Farebox Recovery
FY 2015 39478 5379 $417539 $46324 $371215 73 $940 $7762 111FY 2016 37276 5475 $408987 $48421 $360566 68 $967 $7470 118FY 2017 36328 5492 $475778 $39959 $435819 66 $1200 $8663 84
Histo
ric Tr
ends
FY 20
161
7 DAT
A
Passengers Revenue Hours Revenue Miles
Operating Costs Passenger Revenue Operating Subsidy
30642 33386
39478 37276 36328
0
10000
20000
30000
40000
50000
FY 2013 FY 2014 FY 2015 FY 2016 FY 2017
Passengers
5388
5056
5379 5475 5492
480049005000510052005300540055005600
FY 2013 FY 2014 FY 2015 FY 2016 FY 2017
Revenue Hours
$388827 $390358 $417539 $408987 $475778
$0
$100000
$200000
$300000
$400000
$500000
FY 2013 FY 2014 FY 2015 FY 2016 FY 2017
Operating Costs
57 66
73 68 66
00
20
40
60
80
100
FY 2013 FY 2014 FY 2015 FY 2016 FY 2017
Passengers per Revenue Hour
$1136 $1045
$940 $967
$1200
$000$200$400$600$800
$1000$1200$1400
FY 2013 FY 2014 FY 2015 FY 2016 FY 2017
Subsidy per Passenger
$7216 $7721 $7762 $7470 $8663
$0
$50
$100
$150
$200
FY 2013 FY 2014 FY 2015 FY 2016 FY 2017
Cost per Revenue Hour
66Recreational
Days of Service Wkdy Sa SuAvg Freq (Wkdy Peak) 30 min
Avg Freq (Wkdy Non-Peak) 30 minAvg Freq (Wked) 10-20 min
FY 2017 Farebox Recovery 53 transfer (to route) 0
Clipper usage 0
Annual Avg Monthly Avg Daily Annual Avg Monthly Avg Daily Annual Avg Monthly Avg DailyWeekday 21940 7313 549 804 268 20 10735 3578 268 Saturday 43799 7300 1752 1473 245 59 20480 3413 819 Sunday 56377 6264 1446 2040 227 52 28212 3135 723
Total 122116 13568 1174 4316 480 42 59428 6603 571
Annual Avg Monthly Avg Daily Annual Avg Monthly Avg Daily Annual Avg Monthly Avg DailyWeekday $104033 $34678 $2601 $37751 $12584 $944 $66282 $22094 $1657Saturday $152661 $25444 $6106 $79948 $13325 $3198 $72713 $12119 $2909Sunday $217032 $24115 $5565 $132049 $14672 $3386 $84983 $9443 $2179
Total $473726 $52636 $4555 $249748 $27750 $2401 $223978 $24886 $2154
Passengers per Revenue Hour
Subsidy per Passenger
Cost per Revenue Hour
Farebox Recovery
Weekday 273 $302 $12944 363Saturday 297 $166 $10367 524Sunday 276 $151 $10638 608
Total 283 $183 $10975 527
Passengers Revenue Hours Operating CostsPassenger
RevenueOperating Subsidy
Passengers per Revenue Hour
Subsidy per Passenger
Cost per Revenue Hour
Farebox Recovery
FY 2015 103930 3866 $477523 $209514 $268009 269 $258 $12352 439FY 2016 116942 4673 $531384 $245779 $285605 250 $244 $11373 463FY 2017 122116 4316 $473726 $249748 $223978 283 $183 $10975 527
Histo
ric Tr
ends
FY 20
161
7 DAT
A
Passengers Revenue Hours Revenue Miles
Operating Costs Passenger Revenue Operating Subsidy
62624
103052 103930 116942 122116
0
20000
40000
60000
80000
100000
120000
140000
FY 2013 FY 2014 FY 2015 FY 2016 FY 2017
Passengers
2941
3841 3866
4673 4316
0
1000
2000
3000
4000
5000
FY 2013 FY 2014 FY 2015 FY 2016 FY 2017
Revenue Hours
$330076
$538014 $477523
$531384 $473726
$0
$100000
$200000
$300000
$400000
$500000
$600000
FY 2013 FY 2014 FY 2015 FY 2016 FY 2017
Operating Costs
213
268 269 250
283
00
50
100
150
200
250
300
FY 2013 FY 2014 FY 2015 FY 2016 FY 2017
Passengers per Revenue Hour
$360 $322
$258 $244 $183
$000
$100
$200
$300
$400
$500
FY 2013 FY 2014 FY 2015 FY 2016 FY 2017
Subsidy per Passenger
$11223
$14007 $12352 $11373 $10975
$0
$50
$100
$150
$200
FY 2013 FY 2014 FY 2015 FY 2016 FY 2017
Cost per Revenue Hour
68Rural
Days of Service Wkdy Sa SuAvg Freq (Wkdy Peak) 60 min
Avg Freq (Wkdy Non-Peak) 120 minAvg Freq (Wked) 60-120 min
FY 2017 Farebox Recovery 9 transfer (to route) 13
Clipper usage 12
Annual Avg Monthly Avg Daily Annual Avg Monthly Avg Daily Annual Avg Monthly Avg DailyWeekday 59903 4992 239 7282 607 29 133167 11097 531 Saturday 8410 701 168 1492 124 30 27123 2260 542 Sunday 8285 690 129 1907 159 30 34638 2887 541
Total 76598 6383 210 10680 890 29 194928 16244 534
Annual Avg Monthly Avg Daily Annual Avg Monthly Avg Daily Annual Avg Monthly Avg DailyWeekday $645737 $53811 $2573 $64332 $5361 $256 $581405 $48450 $2316Saturday $131882 $10990 $2638 $9260 $772 $185 $122622 $10219 $2452Sunday $169286 $14107 $2645 $8856 $738 $138 $160430 $13369 $2507
Total $946905 $78909 $2594 $82448 $6871 $226 $864457 $72038 $2368
Passengers per Revenue Hour
Subsidy per Passenger
Cost per Revenue Hour
Farebox Recovery
Weekday 82 $971 $8868 100Saturday 56 $1458 $8841 70Sunday 43 $1936 $8879 52
Total 72 $1129 $8866 87
Passengers Revenue Hours Operating CostsPassenger
RevenueOperating Subsidy
Passengers per Revenue Hour
Subsidy per Passenger
Cost per Revenue Hour
Farebox Recovery
FY 2015 65866 10589 $848305 $80846 $767459 62 $1165 $8011 95FY 2016 70292 10611 $811978 $88808 $723170 66 $1029 $7652 109FY 2017 76598 10680 $946905 $82448 $864457 72 $1129 $8866 87
Histo
ric Tr
ends
FY 20
161
7 DAT
A
Passengers Revenue Hours Revenue Miles
Operating Costs Passenger Revenue Operating Subsidy
48113 56988
65866 70292 76598
0
20000
40000
60000
80000
100000
FY 2013 FY 2014 FY 2015 FY 2016 FY 2017
Passengers
7140 7185
10589 10611 10680
0
2000
4000
6000
8000
10000
12000
FY 2013 FY 2014 FY 2015 FY 2016 FY 2017
Revenue Hours
$532879 $571618
$848305 $811978 $946905
$0
$200000
$400000
$600000
$800000
$1000000
FY 2013 FY 2014 FY 2015 FY 2016 FY 2017
Operating Costs
67 79
62 66 72
00
20
40
60
80
100
FY 2013 FY 2014 FY 2015 FY 2016 FY 2017
Passengers per Revenue Hour
$979 $885
$1165 $1029
$1129
$000$200$400$600$800
$1000$1200$1400
FY 2013 FY 2014 FY 2015 FY 2016 FY 2017
Subsidy per Passenger
$7464 $7955 $8011 $7652 $8866
$0
$50
$100
$150
$200
FY 2013 FY 2014 FY 2015 FY 2016 FY 2017
Cost per Revenue Hour
71XLocal Trunkline
Days of Service WkdyAvg Freq (Wkdy Peak) 30 min
Avg Freq (Wkdy Non-Peak) 60 minAvg Freq (Wked) -
FY 2017 Farebox Recovery 15 transfer (to route) 26
Clipper usage 16
Annual Avg Monthly Avg Daily Annual Avg Monthly Avg Daily Annual Avg Monthly Avg DailyWeekday 121141 10095 479 7705 642 30 174624 14552 690 Saturday - - - - - - - - - Sunday - - - - - - - - -
Total 121141 10095 479 7705 642 30 174624 14552 690
Annual Avg Monthly Avg Daily Annual Avg Monthly Avg Daily Annual Avg Monthly Avg DailyWeekday $1116954 $93080 $4415 $164963 $13747 $652 $951991 $79333 $3763Saturday $ - $ - $ - $ - $ - $ - $ - $ - $ -Sunday $ - $ - $ - $ - $ - $ - $ - $ - $ -
Total $1116954 $93080 $4415 $164963 $13747 $652 $951991 $79333 $3763
Passengers per Revenue Hour
Subsidy per Passenger
Cost per Revenue Hour
Farebox Recovery
Weekday 157 $786 $14496 148Saturday - $ - $ - - Sunday - $ - $ - -
Total 157 $786 $14496 148
Passengers Revenue Hours Operating CostsPassenger
RevenueOperating Subsidy
Passengers per Revenue Hour
Subsidy per Passenger
Cost per Revenue Hour
Farebox Recovery
FY 2015 305440 7666 $1066058 $307659 $758399 398 $248 $13906 289FY 2016 259678 7717 $1075263 $300186 $775077 337 $298 $13934 279FY 2017 121141 7705 $1116954 $164963 $951991 157 $786 $14496 148
Histo
ric Tr
ends
FY 20
161
7 DAT
A
Passengers Revenue Hours Revenue Miles
Operating Costs Passenger Revenue Operating Subsidy
347560 341105 305440
259678
121141
050000
100000150000200000250000300000350000400000
FY 2013 FY 2014 FY 2015 FY 2016 FY 2017
Passengers9038
7578 7666 7717 7705
0
2000
4000
6000
8000
10000
FY 2013 FY 2014 FY 2015 FY 2016 FY 2017
Revenue Hours$1254262
$1116004 $1066058 $1075263 $1116954
$0
$200000
$400000
$600000
$800000
$1000000
$1200000
$1400000
FY 2013 FY 2014 FY 2015 FY 2016 FY 2017
Operating Costs
385 450
398 337
157
00100200300400500600700800
FY 2013 FY 2014 FY 2015 FY 2016 FY 2017
Passengers per Revenue Hour
$253 $222 $248 $298
$786
$000
$200
$400
$600
$800
$1000
FY 2013 FY 2014 FY 2015 FY 2016 FY 2017
Subsidy per Passenger
$13877 $14728 $13906 $13934 $14496
$0
$50
$100
$150
$200
FY 2013 FY 2014 FY 2015 FY 2016 FY 2017
Cost per Revenue Hour
113Supplemental
Days of Service School DaysAvg Freq (Wkdy Peak) 3 trips
Avg Freq (Wkdy Non-Peak) -Avg Freq (Wked) -
FY 2017 Farebox Recovery 29 transfer (to route) 0
Clipper usage 4
Annual Avg Monthly Avg Daily Annual Avg Monthly Avg Daily Annual Avg Monthly Avg DailyWeekday 16829 1530 92 317 29 2 2404 219 13 Saturday - - - - - - - - - Sunday - - - - - - - - -
Total 16829 1530 92 317 29 2 2404 219 13
Annual Avg Monthly Avg Daily Annual Avg Monthly Avg Daily Annual Avg Monthly Avg DailyWeekday $42180 $3835 $230 $12227 $1112 $67 $29953 $2723 $164Saturday $ - $ - $ - $ - $ - $ - $ - $ - $ -Sunday $ - $ - $ - $ - $ - $ - $ - $ - $ -
Total $42180 $3835 $230 $12227 $1112 $67 $29953 $2723 $164
Passengers per TripSubsidy per
PassengerCost per Revenue
HourFarebox Recovery
Weekday 315 $178 $13289 290Saturday - $ - $ - - Sunday - $ - $ - -
Total 315 $178 $13289 290
Passengers Revenue Hours Operating CostsPassenger
RevenueOperating Subsidy Passengers per Trip
Subsidy per Passenger
Cost per Revenue Hour
Farebox Recovery
FY 2015 12241 161 $28599 $10703 $17896 342 $146 $17752 374FY 2016 14601 263 $36924 $12809 $24115 317 $165 $14050 347FY 2017 16829 317 $42180 $12227 $29953 315 $178 $13289 290
Histo
ric Tr
ends
FY 20
161
7 DAT
A
Passengers Revenue Hours Revenue Miles
Operating Costs Passenger Revenue Operating Subsidy
15232 13521
12241 14601
16829
0
5000
10000
15000
20000
FY 2013 FY 2014 FY 2015 FY 2016 FY 2017
Passengers
229
165 161
263
317
0
50
100
150
200
250
300
350
FY 2013 FY 2014 FY 2015 FY 2016 FY 2017
Revenue Hours
$31562
$20182
$28599
$36924 $42180
$0
$10000
$20000
$30000
$40000
$50000
FY 2013 FY 2014 FY 2015 FY 2016 FY 2017
Operating Costs
220
365 342 317 315
00
100
200
300
400
500
FY 2013 FY 2014 FY 2015 FY 2016 FY 2017
Passengers per Trip
$051 $095
$146 $165 $178
$000$100$200$300$400$500$600$700$800
FY 2013 FY 2014 FY 2015 FY 2016 FY 2017
Subsidy per Passenger
$13795 $12261
$17752
$14050 $13289
$0
$50
$100
$150
$200
FY 2013 FY 2014 FY 2015 FY 2016 FY 2017
Cost per Revenue Hour
115Supplemental
Days of Service School DaysAvg Freq (Wkdy Peak) 5 trips
Avg Freq (Wkdy Non-Peak) -Avg Freq (Wked) -
FY 2017 Farebox Recovery 11 transfer (to route) 0
Clipper usage 7
Annual Avg Monthly Avg Daily Annual Avg Monthly Avg Daily Annual Avg Monthly Avg DailyWeekday 14021 1275 71 637 58 3 6963 633 35 Saturday - - - - - - - - - Sunday - - - - - - - - -
Total 14021 1275 71 637 58 3 6963 633 35
Annual Avg Monthly Avg Daily Annual Avg Monthly Avg Daily Annual Avg Monthly Avg DailyWeekday $87534 $7958 $444 $9504 $864 $48 $78030 $7094 $396Saturday $ - $ - $ - $ - $ - $ - $ - $ - $ -Sunday $ - $ - $ - $ - $ - $ - $ - $ - $ -
Total $87534 $7958 $444 $9504 $864 $48 $78030 $7094 $396
Passengers per TripSubsidy per
PassengerCost per Revenue
HourFarebox Recovery
Weekday 185 $557 $13744 109Saturday - $ - $ - - Sunday - $ - $ - -
Total 185 $557 $13744 109
Passengers Revenue Hours Operating CostsPassenger
RevenueOperating Subsidy Passengers per Trip
Subsidy per Passenger
Cost per Revenue Hour
Farebox Recovery
FY 2015 21488 775 $131168 $18863 $112305 221 $523 $16918 144FY 2016 16366 559 $82403 $12638 $69765 168 $426 $14754 153FY 2017 14021 637 $87534 $9504 $78030 185 $557 $13744 109
Histo
ric Tr
ends
FY 20
161
7 DAT
A
Passengers Revenue Hours Revenue Miles
Operating Costs Passenger Revenue Operating Subsidy
13524
21488
16366 14021
0
5000
10000
15000
20000
25000
FY 2013 FY 2014 FY 2015 FY 2016 FY 2017
Passengers
463
775
559 637
0
200
400
600
800
1000
FY 2013 FY 2014 FY 2015 FY 2016 FY 2017
Revenue Hours
$56706
$131168
$82403 $87534
$0
$20000
$40000
$60000
$80000
$100000
$120000
$140000
FY 2013 FY 2014 FY 2015 FY 2016 FY 2017
Operating Costs
232 221 168 185
00
100
200
300
400
500
FY 2013 FY 2014 FY 2015 FY 2016 FY 2017
Passengers per Trip
$362
$523 $426
$557
$000$100$200$300$400$500$600$700$800
FY 2013 FY 2014 FY 2015 FY 2016 FY 2017
Subsidy per Passenger
$12250
$16918 $14754 $13744
$0
$50
$100
$150
$200
FY 2013 FY 2014 FY 2015 FY 2016 FY 2017
Cost per Revenue Hour
117Supplemental
Days of Service School DaysAvg Freq (Wkdy Peak) 6 trips
Avg Freq (Wkdy Non-Peak) -Avg Freq (Wked) -
FY 2017 Farebox Recovery 21 transfer (to route) 0
Clipper usage 2
Annual Avg Monthly Avg Daily Annual Avg Monthly Avg Daily Annual Avg Monthly Avg DailyWeekday 34820 3165 193 640 58 4 4753 432 26 Saturday - - - - - - - - - Sunday - - - - - - - - -
Total 34820 3165 193 640 58 4 4753 432 26
Annual Avg Monthly Avg Daily Annual Avg Monthly Avg Daily Annual Avg Monthly Avg DailyWeekday $81509 $7410 $453 $17140 $1558 $95 $64369 $5852 $358Saturday $ - $ - $ - $ - $ - $ - $ - $ - $ -Sunday $ - $ - $ - $ - $ - $ - $ - $ - $ -
Total $81509 $7410 $453 $17140 $1558 $95 $64369 $5852 $358
Passengers per TripSubsidy per
PassengerCost per Revenue
HourFarebox Recovery
Weekday 284 $185 $12732 210Saturday - $ - $ - - Sunday - $ - $ - -
Total 284 $185 $12732 210
Passengers Revenue Hours Operating CostsPassenger
RevenueOperating Subsidy Passengers per Trip
Subsidy per Passenger
Cost per Revenue Hour
Farebox Recovery
FY 2015 50008 509 $77168 $77528 ($360) 399 ($001) $15158 1005FY 2016 33705 552 $77694 $23478 $54216 269 $161 $14075 302FY 2017 34820 640 $81509 $17140 $64369 284 $185 $12732 210
Histo
ric Tr
ends
FY 20
161
7 DAT
A
Passengers Revenue Hours Revenue Miles
Operating Costs Passenger Revenue Operating Subsidy
35174 34496
50008
33705 34820
0
10000
20000
30000
40000
50000
60000
FY 2013 FY 2014 FY 2015 FY 2016 FY 2017
Passengers
299 341
509 552
640
0
100
200
300
400
500
600
700
FY 2013 FY 2014 FY 2015 FY 2016 FY 2017
Revenue Hours
$41176 $41796
$77168 $77694 $81509
$0
$20000
$40000
$60000
$80000
$100000
FY 2013 FY 2014 FY 2015 FY 2016 FY 2017
Operating Costs
436 406 399
269 284
00
100
200
300
400
500
FY 2013 FY 2014 FY 2015 FY 2016 FY 2017
Passengers per Trip
($012) ($028) ($001)
$161 $185
-$200
-$100
$000
$100
$200
$300
$400
$500
$600
FY 2013 FY 2014 FY 2015 FY 2016 FY 2017
Subsidy per Passenger$13790
$12253
$15158 $14075
$12732
$0$20$40$60$80
$100$120$140$160
FY 2013 FY 2014 FY 2015 FY 2016 FY 2017
Cost per Revenue Hour
119Supplemental
Days of Service School DaysAvg Freq (Wkdy Peak) 5 trips
Avg Freq (Wkdy Non-Peak) -Avg Freq (Wked) -
FY 2017 Farebox Recovery 34 transfer (to route) 0
Clipper usage 5
Annual Avg Monthly Avg Daily Annual Avg Monthly Avg Daily Annual Avg Monthly Avg DailyWeekday 27161 2469 151 374 34 2 6893 627 38 Saturday - - - - - - - - - Sunday - - - - - - - - -
Total 27161 2469 151 374 34 2 6893 627 38
Annual Avg Monthly Avg Daily Annual Avg Monthly Avg Daily Annual Avg Monthly Avg DailyWeekday $56273 $5116 $313 $18859 $1714 $105 $37414 $3401 $208Saturday $ - $ - $ - $ - $ - $ - $ - $ - $ -Sunday $ - $ - $ - $ - $ - $ - $ - $ - $ -
Total $56273 $5116 $313 $18859 $1714 $105 $37414 $3401 $208
Passengers per TripSubsidy per
PassengerCost per Revenue
HourFarebox Recovery
Weekday 313 $138 $15058 335Saturday - $ - $ - - Sunday - $ - $ - -
Total 313 $138 $15058 335
Passengers Revenue Hours Operating CostsPassenger
RevenueOperating Subsidy Passengers per Trip
Subsidy per Passenger
Cost per Revenue Hour
Farebox Recovery
FY 2015 28376 466 $85243 $24699 $60544 319 $213 $18292 290FY 2016 30906 431 $68366 $28456 $39910 317 $129 $15877 416FY 2017 27161 374 $56273 $18859 $37414 313 $138 $15058 335
Histo
ric Tr
ends
FY 20
161
7 DAT
A
Passengers Revenue Hours Revenue Miles
Operating Costs Passenger Revenue Operating Subsidy
27987 28376
30906
27161
25000
26000
27000
28000
29000
30000
31000
32000
FY 2013 FY 2014 FY 2015 FY 2016 FY 2017
Passengers526
466 431
374
0
100
200
300
400
500
600
FY 2013 FY 2014 FY 2015 FY 2016 FY 2017
Revenue Hours
$64440
$85243
$68366 $56273
$0
$20000
$40000
$60000
$80000
$100000
FY 2013 FY 2014 FY 2015 FY 2016 FY 2017
Operating Costs
272 319 317 313
00
100
200
300
400
500
FY 2013 FY 2014 FY 2015 FY 2016 FY 2017
Passengers per Trip
$175 $213 $129 $138
$000$100$200$300$400$500$600$700$800
FY 2013 FY 2014 FY 2015 FY 2016 FY 2017
Subsidy per Passenger
$12251
$18292 $15877 $15058
$0
$50
$100
$150
$200
FY 2013 FY 2014 FY 2015 FY 2016 FY 2017
Cost per Revenue Hour
122Partnership
Days of Service WkdyAvg Freq (Wkdy Peak) -
Avg Freq (Wkdy Non-Peak) 30 minAvg Freq (Wked) -
FY 2017 Farebox Recovery 66 transfer (to route) 9
Clipper usage 6
Annual Avg Monthly Avg Daily Annual Avg Monthly Avg Daily Annual Avg Monthly Avg DailyWeekday 19860 1986 113 1696 170 10 15480 1548 88 Saturday - - - - - - - - - Sunday - - - - - - - - -
Total 19860 1986 113 1696 170 10 15480 1548 88
Annual Avg Monthly Avg Daily Annual Avg Monthly Avg Daily Annual Avg Monthly Avg DailyWeekday $183943 $18394 $1045 $121007 $12101 $688 $62936 $6294 $358Saturday $ - $ - $ - $ - $ - $ - $ - $ - $ -Sunday $ - $ - $ - $ - $ - $ - $ - $ - $ -
Total $183943 $18394 $1045 $121007 $12101 $688 $62936 $6294 $358
Passengers per Revenue Hour
Subsidy per Passenger
Cost per Revenue Hour
Farebox Recovery
Weekday 117 $317 $10844 658Saturday - $ - $ - - Sunday - $ - $ - -
Total 117 $317 $10844 658
Passengers Revenue Hours Operating CostsPassenger
RevenueOperating Subsidy
Passengers per Revenue Hour
Subsidy per Passenger
Cost per Revenue Hour
Farebox Recovery
FY 2015FY 2016 20360 2932 $325230 $149686 $175544 69 $862 $11094 460FY 2017 19860 1696 $183943 $121007 $62936 117 $317 $10844 658
Histo
ric Tr
ends
FY 20
161
7 DAT
A
Passengers Revenue Hours Revenue Miles
Operating Costs Passenger Revenue Operating Subsidy
20360 19860
0
5000
10000
15000
20000
25000
FY 2013 FY 2014 FY 2015 FY 2016 FY 2017
Passengers2932
1696
0
500
1000
1500
2000
2500
3000
3500
FY 2013 FY 2014 FY 2015 FY 2016 FY 2017
Revenue Hours$325230
$183943
$0
$50000
$100000
$150000
$200000
$250000
$300000
$350000
FY 2013 FY 2014 FY 2015 FY 2016 FY 2017
Operating Costs
69
117
00
20
40
60
80
100
120
140
FY 2013 FY 2014 FY 2015 FY 2016 FY 2017
Passengers per Revenue Hour$862
$317
$000
$200
$400
$600
$800
$1000
FY 2013 FY 2014 FY 2015 FY 2016 FY 2017
Subsidy per Passenger
$11094 $10844
$0
$50
$100
$150
$200
FY 2013 FY 2014 FY 2015 FY 2016 FY 2017
Cost per Revenue Hour
125Supplemental
Days of Service School DaysAvg Freq (Wkdy Peak) 4 trips
Avg Freq (Wkdy Non-Peak) -Avg Freq (Wked) -
FY 2017 Farebox Recovery 16 transfer (to route) 1
Clipper usage 8
Annual Avg Monthly Avg Daily Annual Avg Monthly Avg Daily Annual Avg Monthly Avg DailyWeekday 13757 1251 76 600 55 3 8580 780 48 Saturday - - - - - - - - - Sunday - - - - - - - - -
Total 13757 1251 76 600 55 3 8580 780 48
Annual Avg Monthly Avg Daily Annual Avg Monthly Avg Daily Annual Avg Monthly Avg DailyWeekday $72469 $6588 $403 $11570 $1052 $64 $60899 $5536 $338Saturday $ - $ - $ - $ - $ - $ - $ - $ - $ -Sunday $ - $ - $ - $ - $ - $ - $ - $ - $ -
Total $72469 $6588 $403 $11570 $1052 $64 $60899 $5536 $338
Passengers per TripSubsidy per
PassengerCost per Revenue
HourFarebox Recovery
Weekday 193 $443 $12086 160Saturday - $ - $ - - Sunday - $ - $ - -
Total 193 $443 $12086 160
Passengers Revenue Hours Operating CostsPassenger
RevenueOperating Subsidy Passengers per Trip
Subsidy per Passenger
Cost per Revenue Hour
Farebox Recovery
FY 2015 13298 578 $87015 $11914 $75101 186 $565 $15054 137FY 2016 13197 595 $77991 $12684 $65307 182 $495 $13117 163FY 2017 13757 600 $72469 $11570 $60899 193 $443 $12086 160
Histo
ric Tr
ends
FY 20
161
7 DAT
A
Passengers Revenue Hours Revenue Miles
Operating Costs Passenger Revenue Operating Subsidy
8798 7189
13298 13197 13757
02000400060008000
10000120001400016000
FY 2013 FY 2014 FY 2015 FY 2016 FY 2017
Passengers
100 90
578 595 600
0
100
200
300
400
500
600
700
FY 2013 FY 2014 FY 2015 FY 2016 FY 2017
Revenue Hours
$13752 $10979
$87015 $77991
$72469
$0
$20000
$40000
$60000
$80000
$100000
FY 2013 FY 2014 FY 2015 FY 2016 FY 2017
Operating Costs
492
402
186 182 193
00
100
200
300
400
500
FY 2013 FY 2014 FY 2015 FY 2016 FY 2017
Passengers per Trip
$015 $002
$565 $495
$443
$000$100$200$300$400$500$600$700$800
FY 2013 FY 2014 FY 2015 FY 2016 FY 2017
Subsidy per Passenger$13821
$12267
$15054 $13117
$12086
$0$20$40$60$80
$100$120$140$160
FY 2013 FY 2014 FY 2015 FY 2016 FY 2017
Cost per Revenue Hour
139Supplemental
Days of Service School DaysAvg Freq (Wkdy Peak) 2 trips
Avg Freq (Wkdy Non-Peak) -Avg Freq (Wked) -
FY 2017 Farebox Recovery 20 transfer (to route) 0
Clipper usage 24
Annual Avg Monthly Avg Daily Annual Avg Monthly Avg Daily Annual Avg Monthly Avg DailyWeekday 6414 583 36 253 23 1 4127 375 23 Saturday - - - - - - - - - Sunday - - - - - - - - -
Total 6414 583 36 253 23 1 4127 375 23
Annual Avg Monthly Avg Daily Annual Avg Monthly Avg Daily Annual Avg Monthly Avg DailyWeekday $33182 $3017 $184 $6635 $603 $37 $26547 $2413 $147Saturday $ - $ - $ - $ - $ - $ - $ - $ - $ -Sunday $ - $ - $ - $ - $ - $ - $ - $ - $ -
Total $33182 $3017 $184 $6635 $603 $37 $26547 $2413 $147
Passengers per TripSubsidy per
PassengerCost per Revenue
HourFarebox Recovery
Weekday 179 $414 $13110 200Saturday - $ - $ - - Sunday - $ - $ - -
Total 179 $414 $13110 200
Passengers Revenue Hours Operating CostsPassenger
RevenueOperating Subsidy Passengers per Trip
Subsidy per Passenger
Cost per Revenue Hour
Farebox Recovery
FY 2015 5906 225 $36437 $5258 $31179 164 $528 $16173 144FY 2016 6391 315 $43776 $6241 $37535 160 $587 $13880 143FY 2017 6414 253 $33182 $6635 $26547 179 $414 $13110 200
Histo
ric Tr
ends
FY 20
161
7 DAT
A
Passengers Revenue Hours Revenue Miles
Operating Costs Passenger Revenue Operating Subsidy
4232 4026
5906 6391 6414
0
1000
2000
3000
4000
5000
6000
7000
FY 2013 FY 2014 FY 2015 FY 2016 FY 2017
Passengers
226 227 225
315
253
0
50
100
150
200
250
300
350
FY 2013 FY 2014 FY 2015 FY 2016 FY 2017
Revenue Hours
$31306 $27734
$36437
$43776
$33182
$0
$10000
$20000
$30000
$40000
$50000
FY 2013 FY 2014 FY 2015 FY 2016 FY 2017
Operating Costs
120 111 164 160 179
00
100
200
300
400
500
FY 2013 FY 2014 FY 2015 FY 2016 FY 2017
Passengers per Trip
$427
$628 $528
$587
$414
$000$100$200$300$400$500$600$700$800
FY 2013 FY 2014 FY 2015 FY 2016 FY 2017
Subsidy per Passenger
$13834 $12239
$16173 $13880 $13110
$0
$50
$100
$150
$200
FY 2013 FY 2014 FY 2015 FY 2016 FY 2017
Cost per Revenue Hour
145Supplemental
Days of Service School DaysAvg Freq (Wkdy Peak) 2-3 trips
Avg Freq (Wkdy Non-Peak) -Avg Freq (Wked) -
FY 2017 Farebox Recovery 29 transfer (to route) 5
Clipper usage 2
Annual Avg Monthly Avg Daily Annual Avg Monthly Avg Daily Annual Avg Monthly Avg DailyWeekday 16406 1491 90 191 17 1 2175 198 12 Saturday - - - - - - - - - Sunday - - - - - - - - -
Total 16406 1491 90 191 17 1 2175 198 12
Annual Avg Monthly Avg Daily Annual Avg Monthly Avg Daily Annual Avg Monthly Avg DailyWeekday $25426 $2311 $139 $7258 $660 $40 $18168 $1652 $99Saturday $ - $ - $ - $ - $ - $ - $ - $ - $ -Sunday $ - $ - $ - $ - $ - $ - $ - $ - $ -
Total $25426 $2311 $139 $7258 $660 $40 $18168 $1652 $99
Passengers per TripSubsidy per
PassengerCost per Revenue
HourFarebox Recovery
Weekday 372 $111 $13347 285Saturday - $ - $ - - Sunday - $ - $ - -
Total 372 $111 $13347 285
Passengers Revenue Hours Operating CostsPassenger
RevenueOperating Subsidy Passengers per Trip
Subsidy per Passenger
Cost per Revenue Hour
Farebox Recovery
FY 2015 6911 87 $13373 $5858 $7515 337 $109 $15442 438FY 2016 10268 167 $21672 $6341 $15331 396 $149 $12993 293FY 2017 16406 191 $25426 $7258 $18168 372 $111 $13347 285
Histo
ric Tr
ends
FY 20
161
7 DAT
A
Passengers Revenue Hours Revenue Miles
Operating Costs Passenger Revenue Operating Subsidy
6911
10268
16406
0
5000
10000
15000
20000
FY 2013 FY 2014 FY 2015 FY 2016 FY 2017
Passengers
87
167 191
0
50
100
150
200
250
FY 2013 FY 2014 FY 2015 FY 2016 FY 2017
Revenue Hours
$13373
$21672 $25426
$0
$5000
$10000
$15000
$20000
$25000
$30000
FY 2013 FY 2014 FY 2015 FY 2016 FY 2017
Operating Costs
337 396 372
00
100
200
300
400
500
FY 2013 FY 2014 FY 2015 FY 2016 FY 2017
Passengers per Trip
$109 $149 $111
$000$100$200$300$400$500$600$700$800
FY 2013 FY 2014 FY 2015 FY 2016 FY 2017
Subsidy per Passenger
$15442 $12993 $13347
$0
$50
$100
$150
$200
FY 2013 FY 2014 FY 2015 FY 2016 FY 2017
Cost per Revenue Hour
151Supplemental
Days of Service School DaysAvg Freq (Wkdy Peak) 4-5 trips
Avg Freq (Wkdy Non-Peak) -Avg Freq (Wked) -
FY 2017 Farebox Recovery 25 transfer (to route) 1
Clipper usage 4
Annual Avg Monthly Avg Daily Annual Avg Monthly Avg Daily Annual Avg Monthly Avg DailyWeekday 36801 3346 204 594 54 3 10649 968 59 Saturday - - - - - - - - - Sunday - - - - - - - - -
Total 36801 3346 204 594 54 3 10649 968 59
Annual Avg Monthly Avg Daily Annual Avg Monthly Avg Daily Annual Avg Monthly Avg DailyWeekday $73842 $6713 $410 $18463 $1678 $103 $55379 $5034 $308Saturday $ - $ - $ - $ - $ - $ - $ - $ - $ -Sunday $ - $ - $ - $ - $ - $ - $ - $ - $ -
Total $73842 $6713 $410 $18463 $1678 $103 $55379 $5034 $308
Passengers per TripSubsidy per
PassengerCost per Revenue
HourFarebox Recovery
Weekday 428 $150 $12442 250Saturday - $ - $ - - Sunday - $ - $ - -
Total 428 $150 $12442 250
Passengers Revenue Hours Operating CostsPassenger
RevenueOperating Subsidy Passengers per Trip
Subsidy per Passenger
Cost per Revenue Hour
Farebox Recovery
FY 2015 39309 911 $134174 $34376 $99798 315 $254 $14722 256FY 2016 42643 759 $100712 $25851 $74861 456 $176 $13267 257FY 2017 36801 594 $73842 $18463 $55379 428 $150 $12442 250
Histo
ric Tr
ends
FY 20
161
7 DAT
A
Passengers Revenue Hours Revenue Miles
Operating Costs Passenger Revenue Operating Subsidy
39537 39309
42643
36801
32000
34000
36000
38000
40000
42000
44000
FY 2013 FY 2014 FY 2015 FY 2016 FY 2017
Passengers
784 911
759
594
0
200
400
600
800
1000
FY 2013 FY 2014 FY 2015 FY 2016 FY 2017
Revenue Hours
$95932
$134174
$100712
$73842
$0$20000$40000$60000$80000
$100000$120000$140000$160000
FY 2013 FY 2014 FY 2015 FY 2016 FY 2017
Operating Costs
368 315
456 428
00
100
200
300
400
500
FY 2013 FY 2014 FY 2015 FY 2016 FY 2017
Passengers per Trip
$188 $254
$176 $150
$000$100$200$300$400$500$600$700$800
FY 2013 FY 2014 FY 2015 FY 2016 FY 2017
Subsidy per Passenger
$12233
$14722 $13267 $12442
$0$20$40$60$80
$100$120$140$160
FY 2013 FY 2014 FY 2015 FY 2016 FY 2017
Cost per Revenue Hour
154Supplemental
Days of Service School DaysAvg Freq (Wkdy Peak) 3 trips
Avg Freq (Wkdy Non-Peak) -Avg Freq (Wked) -
FY 2017 Farebox Recovery 21 transfer (to route) 0
Clipper usage 5
Annual Avg Monthly Avg Daily Annual Avg Monthly Avg Daily Annual Avg Monthly Avg DailyWeekday 13738 1249 76 358 33 2 4342 395 24 Saturday - - - - - - - - - Sunday - - - - - - - - -
Total 13738 1249 76 358 33 2 4342 395 24
Annual Avg Monthly Avg Daily Annual Avg Monthly Avg Daily Annual Avg Monthly Avg DailyWeekday $41965 $3815 $233 $8847 $804 $49 $33118 $3011 $184Saturday $ - $ - $ - $ - $ - $ - $ - $ - $ -Sunday $ - $ - $ - $ - $ - $ - $ - $ - $ -
Total $41965 $3815 $233 $8847 $804 $49 $33118 $3011 $184
Passengers per TripSubsidy per
PassengerCost per Revenue
HourFarebox Recovery
Weekday 255 $241 $11729 211Saturday - $ - $ - - Sunday - $ - $ - -
Total 255 $241 $11729 211
Passengers Revenue Hours Operating CostsPassenger
RevenueOperating Subsidy Passengers per Trip
Subsidy per Passenger
Cost per Revenue Hour
Farebox Recovery
FY 2015 15376 293 $42604 $13174 $29430 388 $191 $14541 309FY 2016 17858 360 $46133 $14660 $31473 311 $176 $12808 318FY 2017 13738 358 $41965 $8847 $33118 255 $241 $11729 211
Histo
ric Tr
ends
FY 20
161
7 DAT
A
Passengers Revenue Hours Revenue Miles
Operating Costs Passenger Revenue Operating Subsidy
12138
15376 17858
13738
0
5000
10000
15000
20000
FY 2013 FY 2014 FY 2015 FY 2016 FY 2017
Passengers
310 293
360 358
050
100150200250300350400
FY 2013 FY 2014 FY 2015 FY 2016 FY 2017
Revenue Hours
$37913 $42604
$46133 $41965
$0
$10000
$20000
$30000
$40000
$50000
FY 2013 FY 2014 FY 2015 FY 2016 FY 2017
Operating Costs
291
388
311 255
00
100
200
300
400
500
FY 2013 FY 2014 FY 2015 FY 2016 FY 2017
Passengers per Trip
$256 $191 $176
$241
$000$100$200$300$400$500$600$700$800
FY 2013 FY 2014 FY 2015 FY 2016 FY 2017
Subsidy per Passenger
$12246
$14541 $12808
$11729
$0$20$40$60$80
$100$120$140$160
FY 2013 FY 2014 FY 2015 FY 2016 FY 2017
Cost per Revenue Hour
219Local Connector
Days of Service Wkdy Sa SuAvg Freq (Wkdy Peak) 30 min
Avg Freq (Wkdy Non-Peak) 30 minAvg Freq (Wked) 30 min
FY 2017 Farebox Recovery 11 transfer (to route) 20
Clipper usage 11
Annual Avg Monthly Avg Daily Annual Avg Monthly Avg Daily Annual Avg Monthly Avg DailyWeekday 40817 3401 161 5020 418 20 58766 4897 232 Saturday 4888 407 94 637 53 12 10931 911 210 Sunday 4744 395 79 735 61 12 12607 1051 210
Total 50449 4204 138 6392 533 18 82304 6859 225
Annual Avg Monthly Avg Daily Annual Avg Monthly Avg Daily Annual Avg Monthly Avg DailyWeekday $462388 $38532 $1828 $51411 $4284 $203 $410977 $34248 $1624Saturday $59904 $4992 $1152 $6230 $519 $120 $53674 $4473 $1032Sunday $68932 $5744 $1149 $6460 $538 $108 $62472 $5206 $1041
Total $591224 $49269 $1620 $64101 $5342 $176 $527123 $43927 $1444
Passengers per Revenue Hour
Subsidy per Passenger
Cost per Revenue Hour
Farebox Recovery
Weekday 81 $1007 $9212 111Saturday 77 $1098 $9401 104Sunday 65 $1317 $9381 94
Total 79 $1045 $9250 108
Passengers Revenue Hours Operating CostsPassenger
RevenueOperating Subsidy
Passengers per Revenue Hour
Subsidy per Passenger
Cost per Revenue Hour
Farebox Recovery
FY 2015 60906 6585 $569962 $65747 $504215 92 $828 $8656 115FY 2016 55610 6591 $590663 $73164 $517499 84 $931 $8961 124FY 2017 50449 6392 $591224 $64101 $527123 79 $1045 $9250 108
Histo
ric Tr
ends
FY 20
161
7 DAT
A
Passengers Revenue Hours Revenue Miles
Operating Costs Passenger Revenue Operating Subsidy
55543 60906
55610 50449
0
10000
20000
30000
40000
50000
60000
70000
FY 2013 FY 2014 FY 2015 FY 2016 FY 2017
Passengers
5734
6585 6591 6392
520054005600580060006200640066006800
FY 2013 FY 2014 FY 2015 FY 2016 FY 2017
Revenue Hours
$522978
$569962
$590663 $591224
$480000
$500000
$520000
$540000
$560000
$580000
$600000
FY 2013 FY 2014 FY 2015 FY 2016 FY 2017
Operating Costs
97 92 84 79
00
20
40
60
80
100
120
140
FY 2013 FY 2014 FY 2015 FY 2016 FY 2017
Passengers per Revenue Hour
$851 $828 $931
$1045
$000$200$400$600$800
$1000$1200$1400
FY 2013 FY 2014 FY 2015 FY 2016 FY 2017
Subsidy per Passenger
$9121 $8656 $8961 $9250
$0
$50
$100
$150
$200
FY 2013 FY 2014 FY 2015 FY 2016 FY 2017
Cost per Revenue Hour
228Local Connector
Days of Service Wkdy Sa SuAvg Freq (Wkdy Peak) 60 min
Avg Freq (Wkdy Non-Peak) 60 minAvg Freq (Wked) 60 min
FY 2017 Farebox Recovery 11 transfer (to route) 17
Clipper usage 15
Annual Avg Monthly Avg Daily Annual Avg Monthly Avg Daily Annual Avg Monthly Avg DailyWeekday 57316 4776 227 7175 598 28 65884 5490 260 Saturday 8218 685 158 1331 111 26 13020 1085 250 Sunday 5806 484 97 1536 128 26 15023 1252 250
Total 71340 5945 195 10042 837 28 93926 7827 257
Annual Avg Monthly Avg Daily Annual Avg Monthly Avg Daily Annual Avg Monthly Avg DailyWeekday $646194 $53850 $2554 $80857 $6738 $320 $565337 $47111 $2235Saturday $120205 $10017 $2312 $12568 $1047 $242 $107637 $8970 $2070Sunday $138407 $11534 $2307 $10487 $874 $175 $127920 $10660 $2132
Total $904806 $75401 $2479 $103912 $8659 $285 $800894 $66741 $2194
Passengers per Revenue Hour
Subsidy per Passenger
Cost per Revenue Hour
Farebox Recovery
Weekday 80 $986 $9006 125Saturday 62 $1310 $9030 105Sunday 38 $2203 $9011 76
Total 71 $1123 $9010 115
Passengers Revenue Hours Operating CostsPassenger
RevenueOperating Subsidy
Passengers per Revenue Hour
Subsidy per Passenger
Cost per Revenue Hour
Farebox Recovery
FY 2015 15287 2828 $239879 $18274 $221605 54 $1450 $8482 76FY 2016 17522 3185 $280634 $28092 $252542 55 $1441 $8812 100FY 2017 71340 10042 $904806 $103912 $800894 71 $1123 $9010 115
Histo
ric Tr
ends
FY 20
161
7 DAT
A
Passengers Revenue Hours Revenue Miles
Operating Costs Passenger Revenue Operating Subsidy
5854 15287 17522
71340
01000020000300004000050000600007000080000
FY 2013 FY 2014 FY 2015 FY 2016 FY 2017
Passengers
970
2828 3185
10042
0
2000
4000
6000
8000
10000
12000
FY 2013 FY 2014 FY 2015 FY 2016 FY 2017
Revenue Hours
$85183
$239879 $280634
$904806
$0
$200000
$400000
$600000
$800000
$1000000
FY 2013 FY 2014 FY 2015 FY 2016 FY 2017
Operating Costs
60 54 55 71
00
20
40
60
80
100
120
140
FY 2013 FY 2014 FY 2015 FY 2016 FY 2017
Passengers per Revenue Hour$1358
$1450 $1441
$1123
$000$200$400$600$800
$1000$1200$1400
FY 2013 FY 2014 FY 2015 FY 2016 FY 2017
Subsidy per Passenger
$8779 $8482 $8812 $9010
$0
$50
$100
$150
$200
FY 2013 FY 2014 FY 2015 FY 2016 FY 2017
Cost per Revenue Hour
233Local Connector
Days of Service Wkdy Sa SuAvg Freq (Wkdy Peak) 60 min
Avg Freq (Wkdy Non-Peak) 60 minAvg Freq (Wked) 60 min
FY 2017 Farebox Recovery 13 transfer (to route) 16
Clipper usage 10
Annual Avg Monthly Avg Daily Annual Avg Monthly Avg Daily Annual Avg Monthly Avg DailyWeekday 35589 2966 141 3306 276 13 38809 3234 153 Saturday 3911 326 75 490 41 9 5829 486 112 Sunday 3298 275 55 566 47 9 6726 561 112
Total 42798 3567 117 4363 364 12 51364 4280 141
Annual Avg Monthly Avg Daily Annual Avg Monthly Avg Daily Annual Avg Monthly Avg DailyWeekday $302758 $25230 $1197 $42450 $3538 $168 $260308 $21692 $1029Saturday $44829 $3736 $862 $5018 $418 $97 $39811 $3318 $766Sunday $51616 $4301 $860 $4533 $378 $76 $47083 $3924 $785
Total $399203 $33267 $1094 $52001 $4333 $142 $347202 $28934 $951
Passengers per Revenue Hour
Subsidy per Passenger
Cost per Revenue Hour
Farebox Recovery
Weekday 108 $731 $9158 140Saturday 80 $1018 $9141 112Sunday 58 $1428 $9118 88
Total 98 $811 $9151 130
Passengers Revenue Hours Operating CostsPassenger
RevenueOperating Subsidy
Passengers per Revenue Hour
Subsidy per Passenger
Cost per Revenue Hour
Farebox Recovery
FY 2015 50342 4366 $371602 $52526 $319076 115 $634 $8512 141FY 2016 49494 4384 $388005 $59296 $328709 113 $664 $8851 153FY 2017 42798 4363 $399203 $52001 $347202 98 $811 $9151 130
Histo
ric Tr
ends
FY 20
161
7 DAT
A
Passengers Revenue Hours Revenue Miles
Operating Costs Passenger Revenue Operating Subsidy
39956
50422 50342 49494 42798
0
10000
20000
30000
40000
50000
60000
FY 2013 FY 2014 FY 2015 FY 2016 FY 2017
Passengers
3981
4144
4366 4384 4363
370038003900400041004200430044004500
FY 2013 FY 2014 FY 2015 FY 2016 FY 2017
Revenue Hours
$350499
$378792 $371602
$388005 $399203
$320000$330000$340000$350000$360000$370000$380000$390000$400000$410000
FY 2013 FY 2014 FY 2015 FY 2016 FY 2017
Operating Costs
100
122 115 113 98
00
20
40
60
80
100
120
140
FY 2013 FY 2014 FY 2015 FY 2016 FY 2017
Passengers per Revenue Hour
$760 $661 $634 $664
$811
$000$200$400$600$800
$1000$1200$1400
FY 2013 FY 2014 FY 2015 FY 2016 FY 2017
Subsidy per Passenger
$8805 $9142 $8512 $8851 $9151
$0
$50
$100
$150
$200
FY 2013 FY 2014 FY 2015 FY 2016 FY 2017
Cost per Revenue Hour
245Local Connector
Days of Service Wkdy Sa SuAvg Freq (Wkdy Peak) 60 min
Avg Freq (Wkdy Non-Peak) 60 minAvg Freq (Wked) 60 min
FY 2017 Farebox Recovery 15 transfer (to route) 13
Clipper usage 13
Annual Avg Monthly Avg Daily Annual Avg Monthly Avg Daily Annual Avg Monthly Avg DailyWeekday 41761 3480 165 3014 251 12 28706 2392 113 Saturday 4220 352 81 620 52 12 5778 482 111 Sunday 3785 315 63 715 60 12 6667 556 111
Total 49766 4147 136 4349 362 12 41152 3429 113
Annual Avg Monthly Avg Daily Annual Avg Monthly Avg Daily Annual Avg Monthly Avg DailyWeekday $271762 $22647 $1074 $44873 $3739 $177 $226889 $18907 $897Saturday $55697 $4641 $1071 $6217 $518 $120 $49480 $4123 $952Sunday $64137 $5345 $1069 $5878 $490 $98 $58259 $4855 $971
Total $391596 $32633 $1073 $56968 $4747 $156 $334628 $27886 $917
Passengers per Revenue Hour
Subsidy per Passenger
Cost per Revenue Hour
Farebox Recovery
Weekday 139 $543 $9016 165Saturday 68 $1173 $8988 112Sunday 53 $1539 $8970 92
Total 114 $672 $9004 145
Passengers Revenue Hours Operating CostsPassenger
RevenueOperating Subsidy
Passengers per Revenue Hour
Subsidy per Passenger
Cost per Revenue Hour
Farebox Recovery
FY 2015FY 2016 2184 227 $19695 $3137 $16558 96 $758 $8695 159FY 2017 49766 4349 $391596 $56968 $334628 114 $672 $9004 145
Histo
ric Tr
ends
FY 20
161
7 DAT
A
Passengers Revenue Hours Revenue Miles
Operating Costs Passenger Revenue Operating Subsidy
2184
49766
0
10000
20000
30000
40000
50000
60000
FY 2013 FY 2014 FY 2015 FY 2016 FY 2017
Passengers
227
4349
0
1000
2000
3000
4000
5000
FY 2013 FY 2014 FY 2015 FY 2016 FY 2017
Revenue Hours
$19695
$391596
$0
$100000
$200000
$300000
$400000
$500000
FY 2013 FY 2014 FY 2015 FY 2016 FY 2017
Operating Costs
96 114
00
20
40
60
80
100
120
140
FY 2013 FY 2014 FY 2015 FY 2016 FY 2017
Passengers per Revenue Hour
$758 $672
$000$200$400$600$800
$1000$1200$1400
FY 2013 FY 2014 FY 2015 FY 2016 FY 2017
Subsidy per Passenger
$8695 $9004
$0
$50
$100
$150
$200
FY 2013 FY 2014 FY 2015 FY 2016 FY 2017
Cost per Revenue Hour
251Local Connector
Days of Service Wkdy Sa SuAvg Freq (Wkdy Peak) 60 min
Avg Freq (Wkdy Non-Peak) 60 minAvg Freq (Wked) 60 min
FY 2017 Farebox Recovery 11 transfer (to route) 8
Clipper usage 8
Annual Avg Monthly Avg Daily Annual Avg Monthly Avg Daily Annual Avg Monthly Avg DailyWeekday 76675 6390 303 6754 563 27 95654 7971 378 Saturday 9952 829 191 1325 110 25 18630 1553 358 Sunday 8879 740 148 1528 127 25 21497 1791 358
Total 95506 7959 262 9607 801 26 135781 11315 372
Annual Avg Monthly Avg Daily Annual Avg Monthly Avg Daily Annual Avg Monthly Avg DailyWeekday $625542 $52129 $2472 $78006 $6501 $308 $547536 $45628 $2164Saturday $122485 $10207 $2355 $12104 $1009 $233 $110381 $9198 $2123Sunday $140992 $11749 $2350 $11713 $976 $195 $129279 $10773 $2155
Total $889019 $74085 $2436 $101823 $8485 $279 $787196 $65600 $2157
Passengers per Revenue Hour
Subsidy per Passenger
Cost per Revenue Hour
Farebox Recovery
Weekday 114 $714 $9262 125Saturday 75 $1109 $9246 99Sunday 58 $1456 $9225 83
Total 99 $824 $9254 115
Passengers Revenue Hours Operating CostsPassenger
RevenueOperating Subsidy
Passengers per Revenue Hour
Subsidy per Passenger
Cost per Revenue Hour
Farebox Recovery
FY 2015 97647 9172 $800242 $103081 $697161 106 $714 $8725 129FY 2016 98886 9226 $831623 $120959 $710664 107 $719 $9014 145FY 2017 95506 9607 $889019 $101823 $787196 99 $824 $9254 115
Histo
ric Tr
ends
FY 20
161
7 DAT
A
Passengers Revenue Hours Revenue Miles
Operating Costs Passenger Revenue Operating Subsidy
87073
97647 98886
95506
80000
85000
90000
95000
100000
FY 2013 FY 2014 FY 2015 FY 2016 FY 2017
Passengers
8322
9172 9226
9607
7500
8000
8500
9000
9500
10000
FY 2013 FY 2014 FY 2015 FY 2016 FY 2017
Revenue Hours
$772570
$800242
$831623
$889019
$700000
$750000
$800000
$850000
$900000
FY 2013 FY 2014 FY 2015 FY 2016 FY 2017
Operating Costs
105 106 107 99
00
20
40
60
80
100
120
140
FY 2013 FY 2014 FY 2015 FY 2016 FY 2017
Passengers per Revenue Hour
$797 $714 $719
$824
$000$200$400$600$800
$1000$1200$1400
FY 2013 FY 2014 FY 2015 FY 2016 FY 2017
Subsidy per Passenger
$9284 $8725 $9014 $9254
$0
$50
$100
$150
$200
FY 2013 FY 2014 FY 2015 FY 2016 FY 2017
Cost per Revenue Hour
257Local Connector
Days of Service WkdyAvg Freq (Wkdy Peak) 60 min
Avg Freq (Wkdy Non-Peak) 60 minAvg Freq (Wked) -
FY 2017 Farebox Recovery 12 transfer (to route) 6
Clipper usage 13
Annual Avg Monthly Avg Daily Annual Avg Monthly Avg Daily Annual Avg Monthly Avg DailyWeekday 69126 5761 273 7643 637 30 85748 7146 339 Saturday - - - - - - - - - Sunday - - - - - - - - -
Total 69126 5761 273 7643 637 30 85748 7146 339
Annual Avg Monthly Avg Daily Annual Avg Monthly Avg Daily Annual Avg Monthly Avg DailyWeekday $697953 $58163 $2759 $82621 $6885 $327 $615332 $51278 $2432Saturday $ - $ - $ - $ - $ - $ - $ - $ - $ -Sunday $ - $ - $ - $ - $ - $ - $ - $ - $ -
Total $697953 $58163 $2759 $82621 $6885 $327 $615332 $51278 $2432
Passengers per Revenue Hour
Subsidy per Passenger
Cost per Revenue Hour
Farebox Recovery
Weekday 90 $890 $9132 118Saturday - $ - $ - - Sunday - $ - $ - -
Total 90 $890 $9132 118
Passengers Revenue Hours Operating CostsPassenger
RevenueOperating Subsidy
Passengers per Revenue Hour
Subsidy per Passenger
Cost per Revenue Hour
Farebox Recovery
FY 2015 69984 6289 $546363 $73402 $472961 111 $676 $8687 134FY 2016 71429 6414 $575805 $83288 $492517 111 $690 $8977 145FY 2017 69126 7643 $697953 $82621 $615332 90 $890 $9132 118
Histo
ric Tr
ends
FY 20
161
7 DAT
A
Passengers Revenue Hours Revenue Miles
Operating Costs Passenger Revenue Operating Subsidy
35511
68515 69984 71429 69126
01000020000300004000050000600007000080000
FY 2013 FY 2014 FY 2015 FY 2016 FY 2017
Passengers
2909
5965 6289 6414 7643
0
2000
4000
6000
8000
10000
FY 2013 FY 2014 FY 2015 FY 2016 FY 2017
Revenue Hours
$263500
$555608 $546363 $575805
$697953
$0$100000$200000$300000$400000$500000$600000$700000$800000
FY 2013 FY 2014 FY 2015 FY 2016 FY 2017
Operating Costs
122 115 111 111
90
00
20
40
60
80
100
120
140
FY 2013 FY 2014 FY 2015 FY 2016 FY 2017
Passengers per Revenue Hour
$625 $721 $676 $690
$890
$000$200$400$600$800
$1000$1200$1400
FY 2013 FY 2014 FY 2015 FY 2016 FY 2017
Subsidy per Passenger
$9057 $9315 $8687 $8977 $9132
$0
$50
$100
$150
$200
FY 2013 FY 2014 FY 2015 FY 2016 FY 2017
Cost per Revenue Hour
Hdn ValleyYellow Bus
Days of Service School DaysAvg Freq (Wkdy Peak) 2 trips
Avg Freq (Wkdy Non-Peak) -Avg Freq (Wked) -
FY 2017 Farebox Recovery 26 transfer (to route) -
Clipper usage -
Annual Avg Monthly Avg Daily Annual Avg Monthly Avg Daily Annual Avg Monthly Avg DailyWeekday 9281 844 52 180 16 1 1638 149 9 Saturday - - - - - - - - - Sunday - - - - - - - - -
Total 9281 844 52 180 16 1 1638 149 9
Annual Avg Monthly Avg Daily Annual Avg Monthly Avg Daily Annual Avg Monthly Avg DailyWeekday $124763 $11342 $693 $32170 $2925 $179 $92593 $8418 $514Saturday $ - $ - $ - $ - $ - $ - $ - $ - $ -Sunday $ - $ - $ - $ - $ - $ - $ - $ - $ -
Total $124763 $11342 $693 $32170 $2925 $179 $92593 $8418 $514
Passengers per Revenue Hour
Subsidy per Passenger
Cost per Revenue Hour
Farebox Recovery
Weekday 516 $998 $69313 258Saturday - $ - $ - - Sunday - $ - $ - -
Total 516 $998 $69313 258
Passengers Revenue Hours Operating CostsPassenger
RevenueOperating Subsidy
Passengers per Revenue Hour
Subsidy per Passenger
Cost per Revenue Hour
Farebox Recovery
FY 2015FY 2016 8669 211 $140482 $25658 $114824 412 $1325 $66706 183FY 2017 9281 180 $124763 $32170 $92593 516 $998 $69313 258
Histo
ric Tr
ends
FY 20
161
7 DAT
A
Passengers Revenue Hours Revenue Miles
Operating Costs Passenger Revenue Operating Subsidy
8669 9281
0
2000
4000
6000
8000
10000
FY 2013 FY 2014 FY 2015 FY 2016 FY 2017
Passengers211
180
0
50
100
150
200
250
FY 2013 FY 2014 FY 2015 FY 2016 FY 2017
Revenue Hours$140482
$124763
$0$20000$40000$60000$80000
$100000$120000$140000$160000
FY 2013 FY 2014 FY 2015 FY 2016 FY 2017
Operating Costs
412 516
00
500
1000
1500
2000
FY 2013 FY 2014 FY 2015 FY 2016 FY 2017
Passengers per Revenue Hour
$1325
$998
$000
$200
$400
$600
$800
$1000
$1200
$1400
FY 2013 FY 2014 FY 2015 FY 2016 FY 2017
Subsidy per Passenger
$66706 $69313
$0$100$200$300$400$500$600$700$800
FY 2013 FY 2014 FY 2015 FY 2016 FY 2017
Cost per Revenue Hour
White HillYellow Bus
Days of Service School DaysAvg Freq (Wkdy Peak) 17 trips
Avg Freq (Wkdy Non-Peak) -Avg Freq (Wked) -
FY 2017 Farebox Recovery 60 transfer (to route) -
Clipper usage -
Annual Avg Monthly Avg Daily Annual Avg Monthly Avg Daily Annual Avg Monthly Avg DailyWeekday 127219 11565 707 1065 97 6 12096 1100 67 Saturday - - - - - - - - - Sunday - - - - - - - - -
Total 127219 11565 707 1065 97 6 12096 1100 67
Annual Avg Monthly Avg Daily Annual Avg Monthly Avg Daily Annual Avg Monthly Avg DailyWeekday $738585 $67144 $4103 $440896 $40081 $2449 $297689 $27063 $1654Saturday $ - $ - $ - $ - $ - $ - $ - $ - $ -Sunday $ - $ - $ - $ - $ - $ - $ - $ - $ -
Total $738585 $67144 $4103 $440896 $40081 $2449 $297689 $27063 $1654
Passengers per Revenue Hour
Subsidy per Passenger
Cost per Revenue Hour
Farebox Recovery
Weekday 1194 $234 $69325 597Saturday - $ - $ - - Sunday - $ - $ - -
Total 1194 $234 $69325 597
Passengers Revenue Hours Operating CostsPassenger
RevenueOperating Subsidy
Passengers per Revenue Hour
Subsidy per Passenger
Cost per Revenue Hour
Farebox Recovery
FY 2015FY 2016 129635 870 $579937 $385753 $194184 1491 $150 $66698 665FY 2017 127219 1065 $738585 $440896 $297689 1194 $234 $69325 597
Histo
ric Tr
ends
FY 20
161
7 DAT
A
Passengers Revenue Hours Revenue Miles
Operating Costs Passenger Revenue Operating Subsidy
129635 127219
0
20000
40000
60000
80000
100000
120000
140000
FY 2013 FY 2014 FY 2015 FY 2016 FY 2017
Passengers
870
1065
0
200
400
600
800
1000
1200
FY 2013 FY 2014 FY 2015 FY 2016 FY 2017
Revenue Hours
$579937
$738585
$0$100000$200000$300000$400000$500000$600000$700000$800000
FY 2013 FY 2014 FY 2015 FY 2016 FY 2017
Operating Costs
1491
1194
00200400600800
1000120014001600
FY 2013 FY 2014 FY 2015 FY 2016 FY 2017
Passengers per Revenue Hour
$150 $234
$000
$200
$400
$600
$800
$1000
$1200
$1400
FY 2013 FY 2014 FY 2015 FY 2016 FY 2017
Subsidy per Passenger$66698 $69325
$0$100$200$300$400$500$600$700$800
FY 2013 FY 2014 FY 2015 FY 2016 FY 2017
Cost per Revenue Hour
MARIN TRANSIT | 2018ndash2027 SHORT RANGE TRANSIT PLAN Chapter 4 Capital Plan
DRAFT 4-9
Table 4-7 Local Transit Bus Replacement Schedule
Fiscal Year (In-service)
Replacements
Total Cost
Local Share Vehicle Type Seating
Capacity Service(1)
FY 201718 10 $7710000 $1387800 40ft hybrid 39 LB
2 $1662000 $332404 35ft Electric 32 LB
FY 201819
1 $125000 $22500 24ft 20 SH
4 $1600000 $1094880 29ft XHF
(upgrade) 22 SG
FY 201920 10 $8940000 $1609200 60ft 63 LB
FY 202021 8 $1032000 $185760 24ft 20 SH
2 $850000 $153000 35ft XHF 37 MW
FY 202223
7 $5584578 $1005224 35ft hybrid 32 LB
2 $874182 $599281 29ft XHF
(upgrade) 22 SG
FY 202425 3 $1393227 $250781 35ft XHF 37 MW
FY 202526 2 $299093 $53837 24ft 20 SH
5 $2391706 $430507 35ft XHF 37 MW
FY 202627 - - - - - -
Notes (1) Service Types LB ndash Big Bus SH- Shuttle SG- Rural Stagecoach MW- Seasonal Muir Woods and School
Expansion Needs When considering service expansion vehicles are often a constraint on the amount of service that can be added Expansion vehicles are a lower priority in the regional capital plan and typically do not receive federal funds Local state or discretionary grants are required to expand fleets The capital plan does not include any expansion vehicles for the local fixed route program consistent with the current service plan
Marin Transit relies on three retired active vehicles to support operations Retired active vehicles are vehicles that are beyond their FTA-determined useful life that remain in service while their replacements are added the fleet The District intends to replace these as expansion vehicles if funding becomes available
Demand Response Vehicles
Marin Transit has 58 vehicles available for local and regional paratransit service To provide an adequate number of spare vehicles a maximum of about 46 vehicles in service Marin Transit owns 32 vehicles GGBHTD owns 14 and the contractor provides another 13 vehicles to support the operations Eleven of the 13 contractor vehicles will be replaced in early 2018 - five by the District and six by GGBHTD Two of the five replaced by the District will be replaced with smaller accessible vans These will be used for same day
Fixed-Route Passengers (incl Yellow Bus) by Month
July August September October November December January February March April May June
Prior Fiscal Year Passengers Current Fiscal Year PassengersPrior Fiscal Year Passengers Current Fiscal Year Passengers
0
80000
160000
240000
320000
244439
271284484271284
296637296637
2768532276853
252829252829
238010238010
219681219681
2097050505209705
277644277644
240773240773240773240773
284816284816
24935149492493512444392444392442 43999244439244244439439244439244244439999999244200
2600562602600 0000000260056
FISCAL YEAR
2018
Demand Response Passengers by Month
July August September October November December January February March April May June
Prior Fiscal Year Passengers Current Fiscal Year PassengersPrior Fiscal Year Passengers Current Fiscal Year Passengers
0
4000
8000
12000
16000
12 77312773
13631 1362813628 1356413564
1247712477
1206712067 1212412124118100011810
1364613646
1260912609
1359313593
12950129501277312 77312 77312 77312613131612 6133312 6133312613331277312773127731277312613
13 6311363113 631135641363113 613631311363113 6136313113564
Year-to-Date Ridership Trends
Item 3b
2
Average Systemwide Daily Passengers
Weekday Saturday Sunday
Prior Fiscal Year Average Daily Passengers Current Fiscal Year Average Daily PassengersPrior Fiscal Year Average Daily Passengers Current Fiscal Year Average Daily Passengers
0
3000
6000
9000
12000
11370113701109811098
7726772674407440
66576657
60556055
Productivity (paxhr) by Typology
1 Local T
runklin
e
2 Local B
asic
3 Local C
onnecto
r
5 R
ura
l
8 R
ecre
ational
9 D
em
and R
esponse
Prior Fiscal Year Productivity Current Fiscal Year ProductivityPrior Fiscal Year Productivity Current Fiscal Year Productivity
00
80
160
240
320
249249 252252
163163
14814 8148
9292 91918181
757 575
320320
275275
2323 2121
Monthly StatisticsMONTH
August
1 Local Trunkline Routes 35 36 71X
2 Local Basic Routes 17 22 23 23X 29 49
3 Local Connector Routes 219 228 233 245 251 257
5 Rural Routes 61 68
8 Recreational Routes 6666F
9 Demand Response Local Paratransit Novato Dial-A-Ride Rural Dial-A-Ride
Route Typologies
Item 3b
3
Fixed-Route Passengers (incl Yellow Bus) by Month
July August September October November December January February March April May June
Prior Fiscal Year Passengers Current Fiscal Year Passengers
0
80000
160000
240000
320000
244439244439
271284271284
296637296637
276853276853
252829252829
238010238010
219681219681209705209705
277644277644
240773240773
284816284816
249351249351244200244200
260056260056
282441282441
FISCAL YEAR
2018
Demand Response Passengers by Month
July August September October November December January February March April May June
Prior Fiscal Year Passengers Current Fiscal Year Passengers
0
4000
8000
12000
16000
1277312773
1363113631 1362813628 1356413564
12477124771206712067 1212412124
1181011810
1364613646
1260912609
1359313593
12950129501261312613
1356413564 1342713427
Year-to-Date Ridership Trends
Monthly Monitoring Report 11022017
Page 12Item 3b
2
Average Systemwide Daily Passengers
Weekday Saturday Sunday
Prior Fiscal Year Average Daily Passengers Current Fiscal Year Average Daily Passengers
0
3000
6000
9000
12000 11848118481161311613
73637363
67876787
6126612657395739
Productivity (paxhr) by Typology
1 L
ocal
Tru
nklin
e
2 L
ocal
Bas
ic
3 L
ocal
Con
nect
or
5 R
ural
8 R
ecre
atio
nal
9 D
eman
d R
espo
nse
Prior Fiscal Year Productivity Current Fiscal Year Productivity
00
80
160
240
320
278278 274274
174174 168168
9898 9797
7676 7676
304304
222222
2323 2222
Monthly StatisticsMONTH
September
1 Local Trunkline Routes 35 36 71X
2 Local Basic Routes 17 22 23 23X 29 49
3 Local Connector Routes 219 228 233 245 251 257
5 Rural Routes 61 68
8 Recreational Routes 6666F
9 Demand Response Local Paratransit Novato Dial-A-Ride Rural Dial-A-Ride
Route Typologies
Page 22Item 3b
3
Fixed-Route Passengers (incl Yellow Bus) by Month
July August September October November December January February March April May June
Prior Fiscal Year Passengers Current Fiscal Year Passengers
0
80000
160000
240000
320000
244439244439
271284271284
296637296637
276853276853
252829252829
238010238010
219681219681209705209705
277644277644
240773240773
284816284816
249351249351244200244200
260056260056
282441282441 282922282922
FISCAL YEAR
2018
Demand Response Passengers by Month
July August September October November December January February March April May June
Prior Fiscal Year Passengers Current Fiscal Year Passengers
0
4000
8000
12000
16000
1277312773
1363113631 1362813628 1356413564
12477124771206712067 1212412124
1181011810
1364613646
1260912609
1359313593
12950129501261312613
1356413564 13427134271373413734
Year-to-Date Ridership Trends
Monthly Monitoring Report 12082017
Page 12Item 3b
2
Average Systemwide Daily Passengers
Weekday Saturday Sunday
Prior Fiscal Year Average Daily Passengers Current Fiscal Year Average Daily Passengers
0
3000
6000
9000
120001125811258 1115111151
6043604364326432
4717471750675067
Productivity (paxhr) by Typology
1 L
ocal
Tru
nklin
e
2 L
ocal
Bas
ic
3 L
ocal
Con
nect
or
5 R
ural
8 R
ecre
atio
nal
9 D
eman
d R
espo
nse
Prior Fiscal Year Productivity Current Fiscal Year Productivity
00
70
140
210
280258258
270270
163163 161161
9696 9595
6363 7070
202202190190
2323 2121
Monthly StatisticsMONTH
October
1 Local Trunkline Routes 35 36 71X
2 Local Basic Routes 17 22 23 23X 29 49
3 Local Connector Routes 219 228 233 245 251 257
5 Rural Routes 61 68
8 Recreational Routes 6666F
9 Demand Response Local Paratransit Novato Dial-A-Ride Rural Dial-A-Ride
Route Typologies
Page 22Item 3b
3
- RFP - OampM for Fixed Route Service - Addendum 3 12-18-2017
- MV Fee Schedule
- Airporter Fee Schedule
- FY2017Performance
-
- System Performance Summary for FY 201617
-
- Fixed Route
- Yellow Bus
- Demand Response
- Other Services
-
- Performance Goals
- Ridership Trends
- FY 201718 Performance Outlook
-
- Attachment A Route Profiles
-
- Local Transit Bus Replacement Schedule
- August 2017 Monthly Monitoring Report
- September 2017 Monthly Monitoring Report
- October 2017 Monthly Monitoring Report
-

Addendum 3
4
Q21 Is there any preference for alternative fuel powered vehicles A21 Marin Transit is committed to reducing emission from the use of diesel fuel and strives to purchase hybrid and alternative fuel vehicles Q22 Please confirm RFP submission deadline Dec 22nd at 3pm A22 The RFP submission deadline has been changed to Friday January 12th 2018 at 300 pm PST as per Addendum 2 that was issued on 1282017 Q23 Under Company Financial Capacity Can we submit 3 years of Balance Sheets under separate cover to show our Financial Capacity to carry out the contract A23 Yes Proposers must submit a detailed company portfolio including the companyrsquos financial viability within the past three (3) years credit references ongoing projects and all pending litigations in which the company may be directly or indirectly involved Such documents may include company balance sheets Q24 Would Marin Transit please provide the fixed route alignments (route traces) in a digital spatial (gis) format such as kml andor shp for all routes contemplated in this RFP This would be the same data that was uploaded to Google Maps for the interactive maps on MCTDrsquos web site A24 The Fixed Route shapefiles are provided in KML format on Marin Transitrsquos website wwwmarintransitorgpurchasinghtml Q25 With regard to attachment E page 132 in section 2 Bonding Requirements Bid Guarantee Is a bid bond required If so please provide the dollar amount andor percentage A25 No Please refer to Addendum 1 (issued December 1 2017) where attachment E the FTA Grant Contract Provisions were replaced including removal of the bonding requirements Q26 Can Marin Transit please provide invoices for the past 6 months for Package 1 A26 The Package 1 and 2 routes have been configured differently in the RFP than they are currently contracted See the historical performance data provided for Package 1 (Table 2 page 2) and 2 (Table 4 page 4) for insight on how each package of services performed when configured per the RFP
Addendum 3
5
Q27 What liquidated damages were assessed if any to the current contractor for Package 1 A27 None There were no liquidated damages or performance penalties assessed for the current contractor of Package 1 The District maintains the right to assess performance penalties based on the Contractorrsquos failure to meet the established standards and any additional requirements by the District Q28 On page 13 in section 10 Intelligent Transportation Technology Plan (5 pts) does Marin Transit wish for bidders to re-alphabetize a) through e) or is it easier to keep the aabc d e format A28 Proposers should present their Intelligent Transportation Technology Plan ensuring that each required element is addressed Q29 On page 12 of the RFP section 6 Mobilization Plan (5 pts) section a) Project Schedule the last word is ldquoIncluderdquohellip was there more to this section or is it eluding to section 7 Facility A29 No The word ldquoIncluderdquo is a typographical error and should be eliminated Q30 Please confirm that bidders are required to include letters of intent for the facility(ies) proposed in their submittal A30 Refer to the RFP Section 2 ndash Terms and Conditions Proposal Requirements Facility Section Q31 With regard to section 3 Corporate Capacity Experience Past Performance can you please clarify this requirement Is the District requesting bidders to demonstrate 10 years of experience with similar systems and then to also identify contracts that have been in operation for 5 consecutive years as references A31 Proposers must provide a history of their company for the past 10 years and highlight 5 of those years where service was provided continuously and was similar in scope size and complexity to the service being proposed Q32 Attachment B Equipment Summary Would Marin Transit please provide the vehicle types that are intended to replace the vehicles noted in this attachment A32 Yes See the Local Transit Bus Replacement Schedule from the Draft 2018-2017 Short Range Transit Plan for Package 1 and Package 2 services in the attachment to
Addendum 3
6
Addendum 3 It is anticipated that vehicles will be replaced with vehicles that are similar to what is being operated today but is subject to change at Marin Transitrsquos discretion Q33 Page 13 Item 10 Information Technology Plan Is the contractor responsible for the cost and maintenance of all electric maintenance components in this section ie GFI Radios passenger counters MDTrsquos and other components A33 The Intelligent Transportation Technology equipment consists mostly of onboard equipment (ie GFI fareboxes MDTrsquos cameras etc) and will be provided by Marin Transit as described in Section 1 ndash General Information Onboard Equipment (Intelligent Transportation Technology) of the RFP Contractors are responsible for repairs preventive maintenance and maintaining spare parts associated with this equipment as outlined in the Operations Responsibilities and Maintenance Responsibilities sections of the RFP Marin Transit will provide an initial inventory of spare parts (excluding major vehicle parts such as engines or transmissions etc) but the Contractor will be responsible for ensuring that any spare parts that are swapped out or used are immediately replaced in order to maintain an adequate spare parts inventory Most of the onboard equipment has an initial warranty associated with failure of hardware Q34 Please provide the total annual miles operated for each package A34 See annual miles for each route in the attachment to Addendum 3 Q35 What is the current spare ratio for each service provided A35 Services in Package 1 and Package 2 currently differ than what is operated today Currently Package 1 contains one vehicle that is not owned by Marin Transit Package 1 services have a weekday spare ratio of 17 percent and 61 percent on the weekend Package 2 currently has a weekday spare ratio of 38 percent weekday during non-school days is 50 percent weekend peakpeak at 21 percent weekend peakoff peak of 38 percent and weekend off peakoff peak at 46 percent It is projected that Package 1 will have a weekday spare ratio of 17 percent and a weekend spare ratio of 52 percent Package 2 is projected to have a weekday spare ratio of 21 percent weekday (non-school days) is 58 percent weekend peakpeak of 11 percent weekend peakoff-peak of 35 percent and weekend off peakoff peak at 48 percent Q36 Will Marin Transit be responsible for the cost of battery packs for all of the hybrid vehicles
Addendum 3
7
A36 Yes Marin Transit would consider hybrid vehicle battery pack replacement as an Unforeseen Major Repair an assume the cost to refresh or replace the battery packs per Maintenance Responsibilities Section of the RFP Q37 Page 28 Section 3 Are the DPF filters considered a major component that Marin Transit will be responsible for covering the cost for A37 DPF filters are not considered a major component and Marin Transit will not be responsible for covering the costs for providing or replacing DPF filters Q38 Section 405d Auto Physical Damage ndash Transportation providers to maintain a higher deductible than the $50K for each loss noted in this section would Marin Transit modify this section to remove the deductible limitation A38 No The referenced draft contract language requires that ldquoDeductibles shall not exceed $50000 for each lossrdquo Q39 Section 405i Certified Copies of Policies ndash It typically takes insurance companies around 30 days after policy expiration before a new policy is issued As an alternative would Marin Transit please modify this section to state that the replacement policy or binder shall be furnished 5 days after expiration A39 Marin Transitrsquos primary concern is that there not be a gap in insurance coverage whether for new or replacement policies during the term of an awarded contract and will not modify this language beyond the expiration date of a policy Q40 Section 405j MCTD Purchase of Insurance ndash As an alternative to the current language would Marin Transit modify this section to provide that Marin Transitrsquos recourse for failure to comply with the insurance requirements be cancellation of the contract A40 No Marin Transit reserves to right terminate its contracts for convenience This provision ensures that insurance coverage is always in place Q41 Page 18 Draft Contract Item b Dedication to Project vs Page 11 Item 4 A) Summary of Key Personnel The language in these sections seems to conflict Please confirm it is acceptable to share key personnel with other projects as long as the percentage of time dedicated to this project is clearly identified A41 Personnel can be shared Of the key personnel the General Manager Operations Manager Maintenance Manager are to be full time positions and the Operations Manager and Maintenance Manager are to be located on-site Proposers must indicate if key personnel and non-key personnel (ie mechanics dispatchers road supervisors) will be shared on other projects and the percentage of time that will be
Addendum 3
8
dedicated to Marin Transit contract(s) Refer to Attachment I ndash Draft Operations and Maintenance Contract Article 2 ndash Personnel Requirements Sec 201 General Requirements for Contractor Personnel Dedication to Project Q42 Page 14 Item 13 Employee Training Please confirm whether CPR and First Aid training is a new requirement A42 No Proposers are being asked to present their initial training program for operators ldquoto Include any certifications and licensing to be included along with the initial training (CPR First Aid Class B etc)rdquo as referred to in the RFP Section 2 ndash Terms and Conditions Proposal Requirements Employee Training Q43 Page 28 Unforeseen Major Repairs Would Marin Transit identify a dollar amount such as $2000 for single maintenance items that would classify an item as an unforeseen major repair Marin Transit would be responsible for the cost of There are various parts on the fleet vehicles that exceed the cost of a transmission rebuild for example A43 No Q44 Page 8 Draft Contract b Facilities ii Would Marin Transit please remove this language from the RFP and Draft Contract Proposerrsquos are not able to require a landlord to consent to assignment of a property lease A44 No Proposerrsquos are encouraged to work closely with property managers agents or owners on how best to address this requirement Q45 Page 7 Radio Communications For package 2 services should bidders account for two-way radios vs push to talk devices due to the service area and poor cell phone reception A45 Package 1 and 2 proposers should provide a radio communication system that meets the service requirements outlined in the RFP Proposers are encouraged to obtain signal coverage area maps to include with their proposed systems that minimize or eliminate ldquodead spotsrdquo Q46 Draft Contract sect104E TermRenewal Options Please revise to require mutual agreement for any extension of the Agreement with pricing to be negotiated by the parties in order to allow for price adjustments to reflect changes in Contractorrsquos cost to operate the service A46 The RFP and contract address changes to Contractorrsquos cost to operate service though the two-tiered (variable hourly rate and monthly fixed cost) structure and the
Addendum 3
9
Possible Rate Adjustments contract provision (304f) The optional contract extension terms will not be made subject to renegotiation Q47 Draft Contract sect523 ndashAssignment Please delete ldquoAssignment provision extends to any purchase merger or consolidation change in control etcrdquo from the draft contract as a change in stockholders of a contractor shall not require consent or result in a default or termination of the Agreement A47 No This contract provision does not require consent for a change in a contractorrsquos stockholders but instead a change in contract assignment resulting from a change in stockholders Q48 Draft Contract sect408 ndashTermination ndash Would Marin Transit please consider modifying this requirement to provide a minimum of 60 daysrsquo notice of cancellation in order to provide the contractor with enough time to complete obligations required such as WARN Act lease terminations etc A48 No Marin Transit prefers the 30-day notice period Q49 Draft Contract sect406 ndash Indemnity Would Marin Transit please consider revising indemnification to limit the indemnity to actions or omissions of the Contractor or its employees agents subcontractors etc The Contractor should not be liable for items outside of its control A49 No Marin Transit is not considering a revision to the indemnification clause at this time Q50 General Draft Contract Would Marin Transit please add a force majeure provision to relieve both parties from performance under the Contract for circumstances beyond their reasonable control (acts of God war labor strikes or disputes terrorism etc) The contractor should be excused from performance under the contract for circumstances outside of its control A50 No See response for Q38 Q51 General Draft Contract Would Marin Transit include a provision that provides for price adjustments if Contractorrsquos revenue decreases or Contractorrsquos costs increase as a result of (i) changes to the scope of work service hours requested by the Authority (ii) changes in laws rules regulations etc applicable to the services to be provided by Contractor andor (iii) wage increases necessary for Contractor to be able to recruit and retain qualified employees as a result of an increase in the minimum wage in the County or surrounding jurisdictions If the parties are unable to agree on a rate adjustment then either party may terminate the contract upon 120 daysrsquo written notice to the other party Doing so would
Addendum 3
10
provide protection for the contractor to cover changes requested by the District or matters that were not contemplated at the time of Contractorrsquos proposal A51 No The RFP and contract address potential changes to scope of work changes in lawrulesregulations and requires proposers to consider wages and benefits to recruit and attract qualified employees without requiring contract price renegotiation
Attachments MV Transportation Fees and Payment Schedule (Revised November 20 2017)
Marin Airporter Fees and Payment Schedule (Revised November 20 2017) System Performance Summary for FY201617
August 2017 Monthly Monitoring Report September 2017 Monthly Monitoring Report October 2017 Monthly Monitoring Report Local Transit Bus Replacement Schedule
171801
EXHIBIT ldquoCrdquo
FEES AND PAYMENT SCHEDULE (revised)
Contractor shall bill Marin Transit monthly for service hours provided Additional hours shall only be used with approval from Marin Transit Proper back-up including TransTrack reports showing hours miles and fuel usage must be attached to invoices For Fiscal Year 1718 Contractor shall provide proof of wage increase (eg month over month payroll comparisons)
Service Cost per Service Hour
Contract Service Hours
Contract Maximum Obligation
Total year 1 January 30 2012 to December 31 2012 13881 $737832 Total year 2 January 1 2013 to December 31 2013 16686 $892890 Total year 3 January 1 2014 to December 31 2014 20913 $1297726 Total year 4 January 1 2015 to December 31 2015 27250 $1715566
Fixed Administrative Costs $277094 West Marin StagecoachMuir Woods Shuttle $3682 10750 $395815 Supplemental Service $6601 3750 $247538 Start-Up Costs $47571 First Half Year 5 January 1 2016 to June 30 2016 14500 $968018
Fixed Administrative Costs $975995 West Marin StagecoachMuir Woods Shuttle $4094 21500 $880210 Local Fixed Route $4094 14000 $573160 Supplemental Service $6814 7500 $511050 Fiscal Year 1617 July 1 2016 to June 30 2017 43000 $2940415
Fixed Administrative Costs1 $1137363 West Marin StagecoachMuir Woods Shuttle $4439 21500 $954455 Local Fixed Route $4439 14000 $621505 Supplemental Service $7018 7500 $526350 Fiscal Year 1718 July 1 2017 to June 30 2018 43000 $3239674
1 Includes the addition of one Road Supervisor position and one Level A Mechanic Contractor shall credit Marin Transit $5900 per month for the wage benefit and tax cost of the Level A Mechanic from July 1 2017 until the date of hire of this position
Item 10
404
asmith
Typewritten Text
MV Transportation
171830
EXHIBIT ldquoBrdquo
FEES AND PAYMENT SCHEDULE (revised)
Cost per Revenue Hour Community Shuttle Service
Base Years Option Years FY1314 FY1415 FY1516 FY1617 FY1718
Rate $7078 $6866 $7072 $7284 $7614 Maximum Revenue Hours 40000 40000 40000 60000 60000
In addition to payment of a cost per revenue hour District will directly reimburse Contractor for lease payments associated with storage of heavy duty transit buses beginning June 2016 Contractor must substantiate lease expense by providing District with a copy of the lease agreement In no event will lease payments exceed $1800 per month without written approval of District
Contractor to provide proof of wage increase (eg month over month payroll comparisons)
Item 11
410
asmith
Typewritten Text
Marin Airporter
asmith
Typewritten Text
asmith
Typewritten Text
1
System Performance Summary for FY 201617
This report summarizes the unaudited operational performance of Marin Transit local transit services for FY 201617 and compares these results to the Districtrsquos route level performance goals identified in the Short-Range Transit Plan The report provides a detailed route level assessment of all Marin Transit services operating in FY 201617 On June 12 2016 Marin Transit implemented a major service change with a 19 increase in local fixed-route service levels and a restructuring of routes throughout the County This FY 201617 report includes data from a full year of the new service plan There were a few additional changes to transit services during FY 201617 including the following In July 2016 the District launched a new general public dial-a-ride service between Point Reyes Station and Novato
The service provides curb-to-curb pick-up and drop-off and only operates on the second Monday of each month The closure of Hwy 1 in early 2017 delayed the start of the Muir Woods Shuttle season which typically begins in April
The Shuttle season began on May 13 resulting in 12 fewer days of service A number of recent changes to Marin Transitrsquos contracts and agreements have had an impact on the Districtrsquos financials These include the following The District completed a procurement for paratransit services in 2015 The new contract went into effect on January 1
2016 and provides significantly lower rates for paratransit and dial-a-ride services This report provides data from the first full year of the new contract
Effective February 1 2017 the District increased the subsidy paid to Catch-A-Ride service providers for operating wheelchair accessible vehicles to further incentivize the availability of accessible vehicles for Catch-A-Ride trips
For FY 201617 Marin Transit updated the methodology for calculating revenue hours for demand response services to be more consistent with the National Transit Database definitions These include local paratransit and the Novato Dial-A-Ride This change has reduced the amount of time that is considered as part of revenue hours Overall Marin Transit provided over 32 million unlinked passenger trips in FY 201617 with over 235000 revenue hours of service Compared to FY 201516 these numbers represent a decrease in unlinked passenger trips (-35) and an increase in revenue hours (+82) Growth in service was primarily on local fixed-route services due to the June 2016 changes Some of this growth was partially offset by decreases in hours on local paratransit and Route 122 The system-wide productivity rate was 136 riders per hour about 108 lower than FY 201617 Passenger revenues increased slightly (+06) Due to higher operating costs passenger subsidy increased by 127 to a system-wide average of $678 per passenger Fixed Route Fixed Route operations carried over 29 million unlinked passenger trips in FY 201617 with 178052 revenue hours These totals represent 91 of the Districtrsquos total trips and 76 of revenue hours Compared to FY 201516 unlinked passenger trips on fixed route services decreased by 35 and revenue hours increased by 136 Overall productivity was 164 passengers per hour approximately 150 lower than the 193 mark last fiscal year Compared to FY 201516 almost all fixed-route typologies experienced a decrease in overall ridership These include Local Basic (-120) Local Connector (-127) Supplemental (-32) and Partnership (-25) However some services experienced a modest increase in ridership compared to last year including Local Trunkline (+77) the Muir Woods Shuttle (+44) and Rural (+48)
2
Total passenger revenue decreased slightly (-11) in FY 201617 compared to last year Increases in operating costs resulted in a decrease in overall farebox recovery from 199 last year to 176 in FY 201617 Only the Local Trunkline and Recreational (Muir Woods Shuttle) typologies experienced an overall increase in both passenger revenue and farebox recovery Yellow Bus In FY 201617 yellow bus service for the Ross Valley School District carried over 136000 unlinked passenger trips a decrease of 13 compared to last year and operated 1245 revenue hours These totals represent 4 of the Districtrsquos total ridership and 1 of revenue hours Passenger revenues increased 150 due to higher pass prices This boost in revenues did not keep pace with the rise in operating costs and overall farebox recovery decreased from 571 last year to 548 in FY 201617 Demand Response Demand Response programs carried 124325 unlinked passenger trips in FY 201617 and provided 55191 revenue hours of service These totals represent 4 of the Districtrsquos total trips and 24 of revenue hours Compared to FY 201516 unlinked passenger trips on demand response services decreased by 39 (-5096 trips) and revenue hours decreased by 61 The more significant reduction in revenue hours compared to passengers is likely due to the new method for calculating those hours Overall productivity was 23 passengers per hour slightly higher than last fiscal year Ridership on local paratransit and the Novato Dial-A-Ride decreased in FY 201617 compared to the prior year Rural Dial-A-Ride experienced growth in ridership mainly because these services were only recently introduced These include the Dillon BeachTomales and Point Reyes Station Dial-A-Ride Passenger revenues for demand response services dropped slightly (-15) compared to last year However lower operating costs due to the new contract rate resulted in reductions in subsidies and an increase in farebox recovery Other Services Other Marin Access Mobility Management services include the Volunteer Driver and Catch-A-Ride programs In FY 201617 these programs provided 30547 unlinked passenger trips about 1 of the Districtrsquos total trips Compared to the prior fiscal year ridership decreased by 77 mostly due to the Catch-A-Ride program However passenger revenues increased by 90 primarily on the Catch-A-Ride program This increase may have been due to riders taking longer trips Performance Goals
The 2016-2025 Short-Range Transit Plan identifies fifteen different goals and associated metrics that staff use to evaluate system performance Performance goals at the route level are measured in both productivity (unlinked passengers per hour and per trip) and cost effectiveness (subsidy per unlinked passenger trip) These measures follow the service typologies updated in the most recent Short Range Transit Plan Table 1 below summarizes route level performance goals by typology Marin Transit has not identified productivity or cost-effectiveness goals for the Yellow Bus or Partnership service typologies Table 2 provides a detailed summary of annual FY 201617 performance data by program route and service typology
3
Table 1 Productivity and Subsidy Goals by Service Typology
Service Typology Routes Unlinked Passenger
Trips per Hour (at or above)
Subsidy per Passenger Trip
(at or below)
Local Trunkline 35 36 71X 25 $300
Regular Local 17 22 23 23X 29 49 20 $500
Local Connector 219 228 233 245 251 257 8 $800
Supplemental 113 115 117 119 125 139 145 151 154 20 per trip $300
Rural 61 68 4 $1200
Recreational 66 (Muir Woods Shuttle) 25 $300
Demand Response Local DAR Novato DAR Dillon BeachTomales DAR Point Reyes DAR
2 $3000
Using the productivity goals identified in Table 1 all the service typology groups except for Local Basic met their unlinked passengers per hour goal overall Twelve individual routes and two demand response services did not meet their productivity targets These include Routes 17 22 23 23X 29 49 71X 115 125 139 219 228 the Dillon BeachTomales Dial-A-Ride and the Point Reyes Dial-A-Ride In the previous fiscal year ten routes did not meet this target Figure 1 provides FY 201617 productivity levels and respective productivity goals by service typology and at the route level Route 35 was the most productive fixed-route service carrying an average of 286 passengers per hour Route 151 (Hamilton ndash San Jose MS ndash Novato HS - San Marin HS) was the best performing supplemental school route with 428 passengers per trip and met its subsidy target at $150 per passenger Route 228 had the highest growth in productivity (+291) due to the addition of weekday service in June 2016 In terms of cost effectiveness the Supplemental School Rural and Recreational services collectively met their goals In total 17 individual routes and two demand response services did not meet their subsidy target (Routes 17 22 23 23X 29 35 36 49 71X 219 228 233 251 257 115 125 139 Local Paratransit and Novato Dial-A-Ride) This is an increase from the 13 routes and three demand response services reported for FY 201516 Figure 2 provides a breakdown of FY 201617 subsidy levels and respective subsidy goals by service typology and at the individual route level Ridership Trends
In FY 201617 there was an overall 35 decline in fixed-route ridership compared to the previous year despite increases to service levels One of the major contributors to this decline was the delayed start of the 2017 Muir Woods Shuttle season that reduced the amount of service provided by 76 The overall decrease in ridership is relatively consistent with trends among bus operators nationwide and in the Bay Area According to the National Transit Database bus ridership declined 66 nationwide during FY 201617 compared to the prior year Within in the Bay Area peer agencies experienced ridership declines between 6 and 12 These include Golden Gate Transit Sonoma County Transit SamTrans and Napa VINE One of the biggest external factors that may have contributed to this trend is weather Rainfall in FY 201617 almost doubled over the prior year Weather can have a significant impact on travel decisions affecting whether a person makes a trip as well as how that person ultimately makes the trip It can also impact operations and cause detours major delays and canceled trips
4
In FY 201617 there was a 34 increase in the number of canceled trips Almost half of these canceled trips occurred in February due to heavy rains that caused flooding and school closures In June 2016 Marin Transit implemented a major service change One of the main goals of the service restructuring was to reduce the need to transfer by providing faster and more direct connections While this approach improves the system for riders it has implications in terms of how ridership is counted and on performance metrics The number of passengers is measured in terms of unlinked passenger trips Each time a person boards a bus is counted as a separate trip regardless of whether that person is transferring from another bus Reducing the amount of transfers needed to complete a riderrsquos journey reduces the number of unlinked trips Replacing trips that require a transfer with direct trips to destinations does not change the number of individual riders using the system which is defined as linked passenger trips In FY 201617 there was a 75 overall decrease in the number of transfers for passengers using cash to pay their original fare Some of this decline reflects the systemwide decrease in ridership The transfer ratio is defined as the number of boarding trips (unlinked passenger trips) divided by the number of originating trips (linked passenger trips) This ratio can be used to evaluate the impact of transfers on ridership independent of other factors In FY 201617 the overall transfer ratio dropped 38 from 136 to 131 When estimating linked passenger trips based on these ratios the number of individual Marin Transit passengers in FY 201617 remained relatively constant compared to last year Demand for Marin Access mobility management programs declined overall 47 from FY 201516 to FY 201617 Changes in ridership varied from program to program The largest decline was on Catch-A-Ride which experienced a 129 decrease in ridership Local paratransit and Novato Dial-A-Ride ridership may have been affected by many of the same external factors as fixed route transit particularly weather It is also possible that paratransit clients have started to shift some or all their trips to services that are not provided by Marin Transit These may include Non-Emergency Medical Transportation services arranged by managed care organizations Private transportation
providers hired under contract to institutions typically served by paratransit (such as adult day care centers) Trips taken on Uber or Lyft and Volunteer transportation services that may be supported by Marin Transit in some way but whose ridership is not
reported in the Districtrsquos performance statistics Furthermore staff attributed much of the previous growth in the Marin Access program to the Catch-A-Ride program This program experienced a 473 increase in ridership between FY 201314 and FY 201415 Towards the end of FY 201415 On the Move one of the largest taxi companies in Marin went out of business To this day service is limited during hours of peak demand and in certain service areas especially Novato Therefore FY 201617 ridership on Catch-A-Ride may reflect two factors These include a slowdown in attracting new customers and a reduction in service availability following On the Moversquos closure Table 2 summarizes the factors that can influence ridership numbers year-over-year and qualitatively evaluates their impact
5
Table 2 Factors Impacting Ridership Comparison
Factor FY 201516 FY 201617 Impact
Calendar
School Days 181 183 --
Weekdays 256 253
Weekends amp Holidays 110 111 --
Muir Woods Shuttle 113 104
Transfer Ratio (ratio of unlinked to linked trips) 136 131
Service Disruptions Canceled service (trips) 200 268
Major detourclosure (days) (1) 18 29
Rainfall (inches) 2928 5653
Gas Prices $298 $291 --
Unemployment Rate 32 32 -- Notes (1) Data on major detours and closure collected starting January 2016 Comparison includes the months of January through June FY 201718 Performance Outlook
In June 2016 Marin Transit implemented a major service change aimed in part to help underperforming routes meet established performance standards Staff has continued to monitor service performance and has made minor adjustments to improve on-time performance and cancel low-ridership trips In early 2018 staff is planning a comprehensive assessment of service performance since the June 2016 service changes This effort will include data from a recently completed onboard survey from April 2017 on passenger origins and destinations and a 100 passenger ridecheck The ridecheck will provide data on stop-level ridership activity for each route The assessment will use this analysis to recommend service changes to improve underperforming routes There are several unknowns that may also affect route performance primarily in terms of operating costs The District relies on its contractors to either lease or own property to store and maintain the vehicles needed to operate service For contractors that do not own suitable property finding and leasing these types of facilities in Marin County is challenging and expensive Recent surveys of current and potential service providers identified securing a facility as the most significant factor in determining their interest in bidding on Marin Transit services ability to provide the service and proposed pricing Marin Transit has been actively working to secure and develop its own operations and maintenance facility A District-owned facility will eliminate the need for potential service providers to lease property and lower operating costs It may also improve efficiency by reducing deadhead or non-revenue time when vehicles are traveling to and from the yard and further lower the Districtrsquos contract rates In late 2017 Marin Transit will release for bid over half of its fixed-route service and there are many uncertainties that may affect the outcome The tight labor market in Marin County and the greater Bay Area has made it difficult for service providers to hire and retain employees Potential contractors are required to secure property in a County with limited real estate opportunities If the District provides its own facility there will be more interest among potential bidders and more competitive rates
6
Table 3 System-wide Performance Statistics FY 201617 (unaudited)
Route Passengers Revenue
Hours Operating
Costs Passenger
Revenue Pass Trips Per
Rev Hr (Trip) Subsidy Per
Passenger Farebox
Recovery Fixed Route 2925522 178052 $20173419 $3550259 164 $568 176 Local Trunkline 1122188 44393 $6252940 $1263870 253 $445 202
35 658869 23052 $3234308 $729775 286 $380 226 36 342178 13636 $1901678 $369132 251 $448 194
71X 121141 7705 $1116954 $164963 157 $786 148 Local Basic 989500 65117 $7451946 $1221298 152 $630 164
17 247998 14757 $2076786 $319761 168 $708 154 22 215758 17553 $1619319 $273059 123 $624 169 23 199150 11065 $1508659 $246908 180 $634 164
23X 49255 3445 $473413 $57438 143 $845 121 29 40103 3707 $509475 $49634 108 $1147 97 49 237236 14590 $1264294 $274498 163 $417 217
Local Connector 378985 42396 $3873801 $461426 89 $900 119 219 50449 6392 $591224 $64101 79 $1045 108 228 71340 10042 $904806 $103912 71 $1123 115 233 42798 4363 $399203 $52001 98 $811 130 245 49766 4349 $391596 $56968 114 $672 145 251 95506 9607 $889019 $101823 99 $824 115 257 69126 7643 $697953 $82621 90 $890 118
Supplemental 179947 3963 $514380 $110503 454 (286) $224 215 113 16829 317 $42180 $12227 530 (315) $178 290 115 14021 637 $87534 $9504 220 (185) $557 109 117 34820 640 $81509 $17140 544 (284) $185 210 119 27161 374 $56273 $18859 727 (313) $138 335 125 13757 600 $72469 $11570 229 (193) $443 160 139 6414 253 $33182 $6635 253 (179) $414 200 145 16406 191 $25426 $7258 861 (372) $111 285 151 36801 594 $73842 $18463 620 (428) $150 250 154 13738 358 $41965 $8847 384 (255) $241 211
Recreational 122116 4316 $473726 $249748 283 $183 527 66 122116 4316 $473726 $249748 283 $183 527
Rural 112926 16172 $1422683 $122407 70 $1151 86 61 36328 5492 $475778 $39959 66 $1200 84 68 76598 10680 $946905 $82448 72 $1129 87
Partnership 19860 1696 $183943 $121007 117 $317 658 122 19860 1696 $183943 $121007 117 $317 658
Yellow Bus 136500 1245 $863348 $473066 1096 (448) $286 548 Hidden Valley 9281 180 $124763 $32170 516 (265) $998 258
White Hill 127219 1065 $738585 $440896 1194 (471) $234 597 Demand Response 124325 55191 $4571296 $236980 23 $3486 52
Local Paratransit 119673 53011 $4404928 $226387 23 $3492 51 Novato DAR 4057 1856 $150815 $8815 22 $3487 58
Dillon Beach DAR 488 260 $12511 $1356 19 $2285 108 Pt Reyes DAR 107 64 $3042 $422 17 $2447 139
Other Services 30547 - $511316 $41956 - $1537 82 Volunteer Driver(1) 16162 - $152714 - - $945 -
Catch-A-Ride(1) 14385 - $358602 $41956 - $2201 117 Total 3216894 234489 $26118572 $4302085 136 $678 165
Notes Values in red indicate performance that does not meet District
7
Figure 1 FY 201617 Passengers per Revenue Hour by Route
0
5
10
15
20
25
30
35
40
45
50Lo
cal T
runk
line T
otals 35 36 71
X
Loca
l Bas
ic To
tals 17 22 23 23X 29 49
Loca
l Con
necto
r Tot
als 219
228
233
245
251
257
Supp
lemen
tal T
otals 11
311
511
711
912
513
914
515
115
4
Recre
ation
al To
tals 66
Rura
l Tot
als 61 68
Dem
and R
espo
nse T
otals
Loca
l Par
atra
nsit
Nova
to D
ARDi
llon D
ARPt
Reye
s DAR
Pass
enge
rs p
er R
even
ue H
our
meets goalservice standard
does not meet goal
school routes show passengers per trip
8
Figure 2 FY 201617 Subsidy per Passenger by Route
$0
$5
$10
$15
$20
$25
$30
$35
$40
Loca
l Tru
nklin
e Tot
als 35 36 71X
Loca
l Bas
ic To
tals 17 22 23 23X 29 49
Loca
l Con
necto
r Tot
als 219
228
233
245
251
257
Supp
lemen
tal T
otals 11
311
511
711
912
513
914
515
115
4
Recre
ation
al To
tals 66
Rura
l Tot
als 61 68
Dem
and R
espo
nse T
otals
Loca
l Par
atra
nsit
Nova
to D
ARDi
llon D
ARPt
Reye
s DAR
Subs
idy p
er P
asse
nger
does not meet goal
service standard
meets goal
9
Attachment A Route Profiles 17 Sausalito ndash Marin City ndash Mill Valley ndash San Rafael 22 San Rafael Transit Center ndash San Anselmo ndash Marin City 23 Fairfax ndash San Anselmo ndash San Rafael ndash Canal 23X Manor ndash Fairfax ndash San Anselmo ndash San Rafael ndash Canal 29 Canal ndash San Rafael Transit Center ndash Larkspur ndash College of Marin ndash Marin General 35 Canal ndash San Rafael Transit Center ndash Marin Civic Center ndash Northgate Mall ndash Novato 36 Canal ndash San Rafael Transit Center ndash Marin City 49 Novato ndash Ignacio ndash Hamilton ndash Marin Civic Center ndash San Rafael Transit Center 61 West Marin Stagecoach (Sausalito ndash Marin City ndash Mill Valley ndash Stinson Beach ndash Bolinas) 66 Muir Woods Shuttle 68 West Marin Stagecoach (San Rafael Transit Center ndash San Anselmo ndash Pt Reyes Station ndash Inverness) 71X Novato ndash San Rafael Transit Center ndash Marin City ndash Sausalito 113 Redwood High School ndash Paradise Cay 115 Sausalito ndash Willow Creek ndash Marin City ndash Mill Valley ndash St Hilary 117 Neil Cummins Hall Middle School ndash E Corte Madera ndash Cove School 119 Tiburon ndash Belvedere ndash Redwood High School 122 San Rafael Transit Center ndash San Anselmo ndash College of Marin 125 Lagunitas ndash Sir Francis Drake HS ndash San Anselmo ndash San Rafael 139 Terra Linda High School ndash Lucas Valley 145 Terra Linda High School ndash San Rafael 151 Hamilton ndash Ignacio ndash San Jose Middle School ndash Novato High School ndash San Marin High School 154 Olive ndash San Marin High School ndash Sinaloa Middle School ndash Novato 219 Tiburon ndash Strawberry 228 San Rafael Transit Center ndash Larkspur ndash San Anselmo ndash Fairfax 233 Santa Venetia ndash Marin Civic Center ndash San Rafael Transit Center 245 San Rafael Transit Center ndash Northgate Mall ndash Kaiser ndash Smith Ranch Road 251 San Marin ndash Novato ndash Vintage Oaks ndash IVC ndash Ignacio ndash Hamilton 257 San Rafael ndash Northgate Mall ndash Kaiser ndash Marinwood ndash Hamilton ndash Ignacio ndash IVC Hdn Valley Ross Valley Yellow Bus (Fairfax ndash San Anselmo ndash Hidden Valley ES) White Hill Ross Valley Yellow Bus (San Anselmo ndash Sleepy Hollow ndash Fairfax ndash White Hill MS)
17Local Basic
Days of Service Wkdy Sa SuAvg Freq (Wkdy Peak) 30 min
Avg Freq (Wkdy Non-Peak) 60 minAvg Freq (Wked) 60 min
FY 2017 Farebox Recovery 15 transfer (to route) 25
Clipper usage 16
Annual Avg Monthly Avg Daily Annual Avg Monthly Avg Daily Annual Avg Monthly Avg DailyWeekday 194263 16189 768 11496 958 45 177386 14782 701 Saturday 27564 2297 530 1541 128 30 24621 2052 473 Sunday 26171 2181 436 1720 143 29 27378 2282 456
Total 247998 20667 679 14757 1230 40 229385 19115 628
Annual Avg Monthly Avg Daily Annual Avg Monthly Avg Daily Annual Avg Monthly Avg DailyWeekday $1617108 $134759 $6392 $247041 $20587 $976 $1370067 $114172 $5415Saturday $217536 $18128 $4183 $36894 $3075 $710 $180642 $15054 $3474Sunday $242142 $20179 $4036 $35826 $2986 $597 $206316 $17193 $3439
Total $2076786 $173066 $5690 $319761 $26647 $876 $1757025 $146419 $4814
Passengers per Revenue Hour
Subsidy per Passenger
Cost per Revenue Hour
Farebox Recovery
Weekday 169 $705 $14067 153Saturday 179 $655 $14117 170Sunday 152 $788 $14078 148
Total 168 $708 $14073 154
Passengers Revenue Hours Operating CostsPassenger
RevenueOperating Subsidy
Passengers per Revenue Hour
Subsidy per Passenger
Cost per Revenue Hour
Farebox Recovery
FY 2015 301136 15167 $2108822 $340410 $1768412 199 $587 $13904 161FY 2016 280486 15330 $2041616 $302337 $1739279 183 $620 $13317 148FY 2017 247998 14757 $2076786 $319761 $1757025 168 $708 $14073 154
Histo
ric Tr
ends
FY 20
161
7 DAT
A
Passengers Revenue Hours Revenue Miles
Operating Costs Passenger Revenue Operating Subsidy
277892 322826
301136 280486
247998
0
50000
100000
150000
200000
250000
300000
350000
FY 2013 FY 2014 FY 2015 FY 2016 FY 2017
Passengers
12402 14818 15167 15330 14757
0
5000
10000
15000
20000
FY 2013 FY 2014 FY 2015 FY 2016 FY 2017
Revenue Hours
$1717002
$2179526 $2108822 $2041616 $2076786
$0
$500000
$1000000
$1500000
$2000000
$2500000
FY 2013 FY 2014 FY 2015 FY 2016 FY 2017
Operating Costs
224 218 199 183 168
00
50
100
150
200
250
300
FY 2013 FY 2014 FY 2015 FY 2016 FY 2017
Passengers per Revenue Hour
$504 $558 $587 $620 $708
$000$200$400$600$800
$1000$1200$1400
FY 2013 FY 2014 FY 2015 FY 2016 FY 2017
Subsidy per Passenger
$13845 $14709 $13904 $13317 $14073
$0
$50
$100
$150
$200
FY 2013 FY 2014 FY 2015 FY 2016 FY 2017
Cost per Revenue Hour
22Local Basic
Days of Service Wkdy Sa SuAvg Freq (Wkdy Peak) 30 min
Avg Freq (Wkdy Non-Peak) 60 minAvg Freq (Wked) 60 min
FY 2017 Farebox Recovery 17 transfer (to route) 10
Clipper usage 11
Annual Avg Monthly Avg Daily Annual Avg Monthly Avg Daily Annual Avg Monthly Avg DailyWeekday 184918 15410 731 14244 1187 56 126319 10527 499 Saturday 16752 1396 322 1537 128 30 16232 1353 312 Sunday 14088 1174 235 1773 148 30 18729 1561 312
Total 215758 17980 591 17553 1463 48 161280 13440 442
Annual Avg Monthly Avg Daily Annual Avg Monthly Avg Daily Annual Avg Monthly Avg DailyWeekday $1312992 $109416 $5190 $232926 $19411 $921 $1080066 $90006 $4269Saturday $142334 $11861 $2737 $21235 $1770 $408 $121099 $10092 $2329Sunday $163993 $13666 $2733 $18898 $1575 $315 $145095 $12091 $2418
Total $1619319 $134943 $4436 $273059 $22755 $748 $1346260 $112188 $3688
Passengers per Revenue Hour
Subsidy per Passenger
Cost per Revenue Hour
Farebox Recovery
Weekday 130 $584 $9218 177Saturday 109 $723 $9263 149Sunday 79 $1030 $9251 115
Total 123 $624 $9225 169
Passengers Revenue Hours Operating CostsPassenger
RevenueOperating Subsidy
Passengers per Revenue Hour
Subsidy per Passenger
Cost per Revenue Hour
Farebox Recovery
FY 2015 249148 14777 $2054433 $292215 $1762218 169 $707 $13903 142FY 2016 243635 14872 $1971172 $259453 $1711719 164 $703 $13255 132FY 2017 215758 17553 $1619319 $273059 $1346260 123 $624 $9225 169
Histo
ric Tr
ends
FY 20
161
7 DAT
A
Passengers Revenue Hours Revenue Miles
Operating Costs Passenger Revenue Operating Subsidy
366301
281761 249148 243635
215758
050000
100000150000200000250000300000350000400000
FY 2013 FY 2014 FY 2015 FY 2016 FY 2017
Passengers18061
15083 14777 14872 17553
0
5000
10000
15000
20000
FY 2013 FY 2014 FY 2015 FY 2016 FY 2017
Revenue Hours$2498169
$2220145 $2054433 $1971172
$1619319
$0
$500000
$1000000
$1500000
$2000000
$2500000
$3000000
FY 2013 FY 2014 FY 2015 FY 2016 FY 2017
Operating Costs
203 187 169 164
123
00
50
100
150
200
250
300
FY 2013 FY 2014 FY 2015 FY 2016 FY 2017
Passengers per Revenue Hour
$567 $667 $707 $703 $624
$000$200$400$600$800
$1000$1200$1400
FY 2013 FY 2014 FY 2015 FY 2016 FY 2017
Subsidy per Passenger
$13832 $14720 $13903 $13255
$9225
$0
$50
$100
$150
$200
FY 2013 FY 2014 FY 2015 FY 2016 FY 2017
Cost per Revenue Hour
23Local Basic
Days of Service Wkdy Sa SuAvg Freq (Wkdy Peak) 60 min
Avg Freq (Wkdy Non-Peak) 60 minAvg Freq (Wked) 60 min
FY 2017 Farebox Recovery 16 transfer (to route) 24
Clipper usage 12
Annual Avg Monthly Avg Daily Annual Avg Monthly Avg Daily Annual Avg Monthly Avg DailyWeekday 145707 12142 576 8042 670 32 64277 5356 254 Saturday 28305 2359 544 1434 120 28 11466 956 221 Sunday 25138 2095 419 1589 132 26 12750 1062 212
Total 199150 16596 546 11065 922 30 88492 7374 242
Annual Avg Monthly Avg Daily Annual Avg Monthly Avg Daily Annual Avg Monthly Avg DailyWeekday $1096892 $91408 $4336 $179427 $14952 $709 $917465 $76455 $3626Saturday $195468 $16289 $3759 $35226 $2936 $677 $160242 $13354 $3082Sunday $216299 $18025 $3605 $32255 $2688 $538 $184044 $15337 $3067
Total $1508659 $125722 $4133 $246908 $20576 $676 $1261751 $105146 $3457
Passengers per Revenue Hour
Subsidy per Passenger
Cost per Revenue Hour
Farebox Recovery
Weekday 181 $630 $13640 164Saturday 197 $566 $13629 180Sunday 158 $732 $13612 149
Total 180 $634 $13635 164
Passengers Revenue Hours Operating CostsPassenger
RevenueOperating Subsidy
Passengers per Revenue Hour
Subsidy per Passenger
Cost per Revenue Hour
Farebox Recovery
FY 2015 354706 14168 $1969650 $381111 $1588539 250 $448 $13902 193FY 2016 268218 13154 $1703216 $308138 $1395078 204 $520 $12948 181FY 2017 199150 11065 $1508659 $246908 $1261751 180 $634 $13635 164
Histo
ric Tr
ends
FY 20
161
7 DAT
A
Passengers Revenue Hours Revenue Miles
Operating Costs Passenger Revenue Operating Subsidy
212064
339118 354706
268218
199150
050000
100000150000200000250000300000350000400000
FY 2013 FY 2014 FY 2015 FY 2016 FY 2017
Passengers
8716
14034 14168 13154
11065
02000400060008000
10000120001400016000
FY 2013 FY 2014 FY 2015 FY 2016 FY 2017
Revenue Hours
$1202564
$2061985 $1969650 $1703216
$1508659
$0
$500000
$1000000
$1500000
$2000000
$2500000
FY 2013 FY 2014 FY 2015 FY 2016 FY 2017
Operating Costs
243 242 250
204 180
00
50
100
150
200
250
300
FY 2013 FY 2014 FY 2015 FY 2016 FY 2017
Passengers per Revenue Hour
$455 $494 $448 $520 $634
$000$200$400$600$800
$1000$1200$1400
FY 2013 FY 2014 FY 2015 FY 2016 FY 2017
Subsidy per Passenger
$13797 $14692 $13902 $12948 $13635
$0
$50
$100
$150
$200
FY 2013 FY 2014 FY 2015 FY 2016 FY 2017
Cost per Revenue Hour
23XLocal Basic
Days of Service WkdyAvg Freq (Wkdy Peak) 60 min
Avg Freq (Wkdy Non-Peak) -Avg Freq (Wked) -
FY 2017 Farebox Recovery 12 transfer (to route) 31
Clipper usage 12
Annual Avg Monthly Avg Daily Annual Avg Monthly Avg Daily Annual Avg Monthly Avg DailyWeekday 49255 4105 195 3445 287 14 32408 2701 128 Saturday - - - - - - - - - Sunday - - - - - - - - -
Total 49255 4105 195 3445 287 14 32408 2701 128
Annual Avg Monthly Avg Daily Annual Avg Monthly Avg Daily Annual Avg Monthly Avg DailyWeekday $473413 $39451 $1871 $57438 $4787 $227 $415975 $34665 $1644Saturday $ - $ - $ - $ - $ - $ - $ - $ - $ -Sunday $ - $ - $ - $ - $ - $ - $ - $ - $ -
Total $473413 $39451 $1871 $57438 $4787 $227 $415975 $34665 $1644
Passengers per Revenue Hour
Subsidy per Passenger
Cost per Revenue Hour
Farebox Recovery
Weekday 143 $845 $13744 121Saturday - $ - $ - - Sunday - $ - $ - -
Total 143 $845 $13744 121
Passengers Revenue Hours Operating CostsPassenger
RevenueOperating Subsidy
Passengers per Revenue Hour
Subsidy per Passenger
Cost per Revenue Hour
Farebox Recovery
FY 2015FY 2016 2548 189 $23303 $2272 $21031 135 $825 $12330 97FY 2017 49255 3445 $473413 $57438 $415975 143 $845 $13744 121
Histo
ric Tr
ends
FY 20
161
7 DAT
A
Passengers Revenue Hours Revenue Miles
Operating Costs Passenger Revenue Operating Subsidy
2548
49255
0
10000
20000
30000
40000
50000
60000
FY 2013 FY 2014 FY 2015 FY 2016 FY 2017
Passengers
189
3445
0500
1000150020002500300035004000
FY 2013 FY 2014 FY 2015 FY 2016 FY 2017
Revenue Hours
$23303
$473413
$0
$100000
$200000
$300000
$400000
$500000
FY 2013 FY 2014 FY 2015 FY 2016 FY 2017
Operating Costs
135 143
00
50
100
150
200
250
300
FY 2013 FY 2014 FY 2015 FY 2016 FY 2017
Passengers per Revenue Hour
$825 $845
$000$200$400$600$800
$1000$1200$1400
FY 2013 FY 2014 FY 2015 FY 2016 FY 2017
Subsidy per Passenger
$12330 $13744
$0
$50
$100
$150
$200
FY 2013 FY 2014 FY 2015 FY 2016 FY 2017
Cost per Revenue Hour
29Local Basic
Days of Service WkdyAvg Freq (Wkdy Peak) 60 min
Avg Freq (Wkdy Non-Peak) -Avg Freq (Wked) -
FY 2017 Farebox Recovery 10 transfer (to route) 26
Clipper usage 12
Annual Avg Monthly Avg Daily Annual Avg Monthly Avg Daily Annual Avg Monthly Avg DailyWeekday 40103 3342 159 3707 309 15 37048 3087 146 Saturday - - - - - - - - - Sunday - - - - - - - - -
Total 40103 3342 159 3707 309 15 37048 3087 146
Annual Avg Monthly Avg Daily Annual Avg Monthly Avg Daily Annual Avg Monthly Avg DailyWeekday $509475 $42456 $2014 $49634 $4136 $196 $459841 $38320 $1818Saturday $ - $ - $ - $ - $ - $ - $ - $ - $ -Sunday $ - $ - $ - $ - $ - $ - $ - $ - $ -
Total $509475 $42456 $2014 $49634 $4136 $196 $459841 $38320 $1818
Passengers per Revenue Hour
Subsidy per Passenger
Cost per Revenue Hour
Farebox Recovery
Weekday 108 $1147 $13745 97Saturday - $ - $ - - Sunday - $ - $ - -
Total 108 $1147 $13745 97
Passengers Revenue Hours Operating CostsPassenger
RevenueOperating Subsidy
Passengers per Revenue Hour
Subsidy per Passenger
Cost per Revenue Hour
Farebox Recovery
FY 2015 203632 10795 $1500887 $232286 $1268601 189 $623 $13904 155FY 2016 181786 10502 $1378760 $219997 $1158763 173 $637 $13129 160FY 2017 40103 3707 $509475 $49634 $459841 108 $1147 $13745 97
Histo
ric Tr
ends
FY 20
161
7 DAT
A
Passengers Revenue Hours Revenue Miles
Operating Costs Passenger Revenue Operating Subsidy
238310 225998 203632
181786
40103
0
50000
100000
150000
200000
250000
300000
FY 2013 FY 2014 FY 2015 FY 2016 FY 2017
Passengers12248
10927 10795 10502
3707
0
2000
4000
6000
8000
10000
12000
14000
FY 2013 FY 2014 FY 2015 FY 2016 FY 2017
Revenue Hours$1692980 $1607795 $1500887
$1378760
$509475
$0
$500000
$1000000
$1500000
$2000000
FY 2013 FY 2014 FY 2015 FY 2016 FY 2017
Operating Costs
195 207 189 173
108
00
50
100
150
200
250
300
FY 2013 FY 2014 FY 2015 FY 2016 FY 2017
Passengers per Revenue Hour
$595 $593 $623 $637
$1147
$000$200$400$600$800
$1000$1200$1400
FY 2013 FY 2014 FY 2015 FY 2016 FY 2017
Subsidy per Passenger
$13822 $14714 $13904 $13129 $13745
$0
$50
$100
$150
$200
FY 2013 FY 2014 FY 2015 FY 2016 FY 2017
Cost per Revenue Hour
35Local Trunkline
Days of Service Wkdy Sa SuAvg Freq (Wkdy Peak) 30 min
Avg Freq (Wkdy Non-Peak) 30 minAvg Freq (Wked) 30 min
FY 2017 Farebox Recovery 23 transfer (to route) 17
Clipper usage 8
Annual Avg Monthly Avg Daily Annual Avg Monthly Avg Daily Annual Avg Monthly Avg DailyWeekday 492328 41027 1946 16909 1409 67 224421 18702 887 Saturday 84453 7038 1624 2860 238 55 43336 3611 833 Sunday 82088 6841 1368 3284 274 55 50021 4168 834
Total 658869 54906 1805 23052 1921 63 317778 26482 871
Annual Avg Monthly Avg Daily Annual Avg Monthly Avg Daily Annual Avg Monthly Avg DailyWeekday $2367217 $197268 $9357 $533190 $44433 $2107 $1834027 $152836 $7249Saturday $403729 $33644 $7764 $97853 $8154 $1882 $305876 $25490 $5882Sunday $463362 $38614 $7723 $98732 $8228 $1646 $364630 $30386 $6077
Total $3234308 $269526 $8861 $729775 $60815 $1999 $2504533 $208711 $6862
Passengers per Revenue Hour
Subsidy per Passenger
Cost per Revenue Hour
Farebox Recovery
Weekday 291 $373 $14000 225Saturday 295 $362 $14118 242Sunday 250 $444 $14111 213
Total 286 $380 $14030 226
Passengers Revenue Hours Operating CostsPassenger
RevenueOperating Subsidy
Passengers per Revenue Hour
Subsidy per Passenger
Cost per Revenue Hour
Farebox Recovery
FY 2015 476489 8544 $1187694 $462204 $725490 558 $152 $13901 389FY 2016 472718 9300 $1202986 $544109 $658877 508 $139 $12935 452FY 2017 658869 23052 $3234308 $729775 $2504533 286 $380 $14030 226
Histo
ric Tr
ends
FY 20
161
7 DAT
A
Passengers Revenue Hours Revenue Miles
Operating Costs Passenger Revenue Operating Subsidy
669860 574669
476489 472718
658869
0100000200000300000400000500000600000700000800000
FY 2013 FY 2014 FY 2015 FY 2016 FY 2017
Passengers
9755 8644 8544 9300
23052
0
5000
10000
15000
20000
25000
FY 2013 FY 2014 FY 2015 FY 2016 FY 2017
Revenue Hours
$1345711 $1271601 $1187694 $1202986
$3234308
$0
$500000
$1000000
$1500000
$2000000
$2500000
$3000000
$3500000
FY 2013 FY 2014 FY 2015 FY 2016 FY 2017
Operating Costs
687 665 558
508
286
00100200300400500600700800
FY 2013 FY 2014 FY 2015 FY 2016 FY 2017
Passengers per Revenue Hour
$097 $120 $152 $139
$380
$000
$200
$400
$600
$800
$1000
FY 2013 FY 2014 FY 2015 FY 2016 FY 2017
Subsidy per Passenger
$13796 $14710 $13901 $12935 $14030
$0
$50
$100
$150
$200
FY 2013 FY 2014 FY 2015 FY 2016 FY 2017
Cost per Revenue Hour
36Local Trunkline
Days of Service Wkdy Sa SuAvg Freq (Wkdy Peak) 30 min
Avg Freq (Wkdy Non-Peak) 30 minAvg Freq (Wked) 30 min
FY 2017 Farebox Recovery 19 transfer (to route) 18
Clipper usage 6
Annual Avg Monthly Avg Daily Annual Avg Monthly Avg Daily Annual Avg Monthly Avg DailyWeekday 278217 23185 1100 9938 828 39 133318 11110 527 Saturday 33779 2815 650 1715 143 33 24259 2022 467 Sunday 30182 2515 503 1983 165 33 28002 2334 467
Total 342178 28515 937 13636 1136 37 185579 15465 508
Annual Avg Monthly Avg Daily Annual Avg Monthly Avg Daily Annual Avg Monthly Avg DailyWeekday $1384291 $115358 $5472 $290481 $24207 $1148 $1093810 $91151 $4323Saturday $240062 $20005 $4617 $40774 $3398 $784 $199288 $16607 $3832Sunday $277325 $23110 $4622 $37877 $3156 $631 $239448 $19954 $3991
Total $1901678 $158473 $5210 $369132 $30761 $1011 $1532546 $127712 $4199
Passengers per Revenue Hour
Subsidy per Passenger
Cost per Revenue Hour
Farebox Recovery
Weekday 280 $393 $13930 210Saturday 197 $590 $13999 170Sunday 152 $793 $13984 137
Total 251 $448 $13946 194
Passengers Revenue Hours Operating CostsPassenger
RevenueOperating Subsidy
Passengers per Revenue Hour
Subsidy per Passenger
Cost per Revenue Hour
Farebox Recovery
FY 2015 109347 2894 $402355 $110471 $291884 378 $267 $13905 275FY 2016 119593 3462 $457211 $129715 $327496 345 $274 $13205 284FY 2017 342178 13636 $1901678 $369132 $1532546 251 $448 $13946 194
Histo
ric Tr
ends
FY 20
161
7 DAT
A
Passengers Revenue Hours Revenue Miles
Operating Costs Passenger Revenue Operating Subsidy
106988 103673 109347 119593
342178
050000
100000150000200000250000300000350000400000
FY 2013 FY 2014 FY 2015 FY 2016 FY 2017
Passengers
2878 2822 2894 3462
13636
02000400060008000
10000120001400016000
FY 2013 FY 2014 FY 2015 FY 2016 FY 2017
Revenue Hours
$398410 $415238 $402355 $457211
$1901678
$0
$500000
$1000000
$1500000
$2000000
FY 2013 FY 2014 FY 2015 FY 2016 FY 2017
Operating Costs
372 367 378 345 251
00100200300400500600700800
FY 2013 FY 2014 FY 2015 FY 2016 FY 2017
Passengers per Revenue Hour
$265 $293 $267 $274
$448
$000
$200
$400
$600
$800
$1000
FY 2013 FY 2014 FY 2015 FY 2016 FY 2017
Subsidy per Passenger
$13842 $14713 $13905 $13205 $13946
$0
$50
$100
$150
$200
FY 2013 FY 2014 FY 2015 FY 2016 FY 2017
Cost per Revenue Hour
49Local Basic
Days of Service Wkdy Sa SuAvg Freq (Wkdy Peak) 30 min
Avg Freq (Wkdy Non-Peak) 60 minAvg Freq (Wked) 60 min
FY 2017 Farebox Recovery 22 transfer (to route) 9
Clipper usage 11
Annual Avg Monthly Avg Daily Annual Avg Monthly Avg Daily Annual Avg Monthly Avg DailyWeekday 201564 16797 797 11313 943 45 139528 11627 551 Saturday 18489 1541 356 1517 126 29 18370 1531 353 Sunday 17183 1432 286 1761 147 29 21402 1784 357
Total 237236 19770 650 14590 1216 40 179300 14942 491
Annual Avg Monthly Avg Daily Annual Avg Monthly Avg Daily Annual Avg Monthly Avg DailyWeekday $978903 $81575 $3869 $230134 $19178 $910 $748769 $62397 $2960Saturday $131907 $10992 $2537 $22520 $1877 $433 $109387 $9116 $2104Sunday $153484 $12790 $2558 $21844 $1820 $364 $131640 $10970 $2194
Total $1264294 $105358 $3464 $274498 $22875 $752 $989796 $82483 $2712
Passengers per Revenue Hour
Subsidy per Passenger
Cost per Revenue Hour
Farebox Recovery
Weekday 178 $371 $8653 235Saturday 122 $592 $8698 171Sunday 98 $766 $8718 142
Total 163 $417 $8665 217
Passengers Revenue Hours Operating CostsPassenger
RevenueOperating Subsidy
Passengers per Revenue Hour
Subsidy per Passenger
Cost per Revenue Hour
Farebox Recovery
FY 2015 144262 6349 $882801 $158088 $724713 227 $502 $13905 179FY 2016 147480 6795 $900804 $146345 $754459 217 $512 $13257 162FY 2017 237236 14590 $1264294 $274498 $989796 163 $417 $8665 217
Histo
ric Tr
ends
FY 20
161
7 DAT
A
Passengers Revenue Hours Revenue Miles
Operating Costs Passenger Revenue Operating Subsidy
230943
152259 144262 147480
237236
0
50000
100000
150000
200000
250000
FY 2013 FY 2014 FY 2015 FY 2016 FY 2017
Passengers
9814
6440 6349 6795
14590
02000400060008000
10000120001400016000
FY 2013 FY 2014 FY 2015 FY 2016 FY 2017
Revenue Hours$1362499
$948702 $882801 $900804
$1264294
$0$200000$400000$600000$800000
$1000000$1200000$1400000$1600000
FY 2013 FY 2014 FY 2015 FY 2016 FY 2017
Operating Costs
235 236 227 217
163
00
50
100
150
200
250
300
FY 2013 FY 2014 FY 2015 FY 2016 FY 2017
Passengers per Revenue Hour
$477 $507 $502 $512 $417
$000$200$400$600$800
$1000$1200$1400
FY 2013 FY 2014 FY 2015 FY 2016 FY 2017
Subsidy per Passenger
$13884 $14732 $13905 $13257
$8665
$0
$50
$100
$150
$200
FY 2013 FY 2014 FY 2015 FY 2016 FY 2017
Cost per Revenue Hour
61Rural
Days of Service Wkdy Sa SuAvg Freq (Wkdy Peak) 8 trips
Avg Freq (Wkdy Non-Peak) -Avg Freq (Wked) 16 trips
FY 2017 Farebox Recovery 8 transfer (to route) 7
Clipper usage 11
Annual Avg Monthly Avg Daily Annual Avg Monthly Avg Daily Annual Avg Monthly Avg DailyWeekday 17166 1431 68 2631 219 10 45398 3783 181 Saturday 9922 827 198 1319 110 26 20810 1734 416 Sunday 9240 770 144 1542 129 24 24457 2038 382
Total 36328 3027 100 5492 458 15 90665 7555 248
Annual Avg Monthly Avg Daily Annual Avg Monthly Avg Daily Annual Avg Monthly Avg DailyWeekday $229650 $19138 $915 $17691 $1474 $70 $211959 $17663 $844Saturday $113378 $9448 $2268 $11622 $969 $232 $101756 $8480 $2035Sunday $132750 $11063 $2074 $10646 $887 $166 $122104 $10175 $1908
Total $475778 $39648 $1304 $39959 $3330 $109 $435819 $36318 $1194
Passengers per Revenue Hour
Subsidy per Passenger
Cost per Revenue Hour
Farebox Recovery
Weekday 65 $1235 $8730 77Saturday 75 $1026 $8598 103Sunday 60 $1321 $8607 80
Total 66 $1200 $8663 84
Passengers Revenue Hours Operating CostsPassenger
RevenueOperating Subsidy
Passengers per Revenue Hour
Subsidy per Passenger
Cost per Revenue Hour
Farebox Recovery
FY 2015 39478 5379 $417539 $46324 $371215 73 $940 $7762 111FY 2016 37276 5475 $408987 $48421 $360566 68 $967 $7470 118FY 2017 36328 5492 $475778 $39959 $435819 66 $1200 $8663 84
Histo
ric Tr
ends
FY 20
161
7 DAT
A
Passengers Revenue Hours Revenue Miles
Operating Costs Passenger Revenue Operating Subsidy
30642 33386
39478 37276 36328
0
10000
20000
30000
40000
50000
FY 2013 FY 2014 FY 2015 FY 2016 FY 2017
Passengers
5388
5056
5379 5475 5492
480049005000510052005300540055005600
FY 2013 FY 2014 FY 2015 FY 2016 FY 2017
Revenue Hours
$388827 $390358 $417539 $408987 $475778
$0
$100000
$200000
$300000
$400000
$500000
FY 2013 FY 2014 FY 2015 FY 2016 FY 2017
Operating Costs
57 66
73 68 66
00
20
40
60
80
100
FY 2013 FY 2014 FY 2015 FY 2016 FY 2017
Passengers per Revenue Hour
$1136 $1045
$940 $967
$1200
$000$200$400$600$800
$1000$1200$1400
FY 2013 FY 2014 FY 2015 FY 2016 FY 2017
Subsidy per Passenger
$7216 $7721 $7762 $7470 $8663
$0
$50
$100
$150
$200
FY 2013 FY 2014 FY 2015 FY 2016 FY 2017
Cost per Revenue Hour
66Recreational
Days of Service Wkdy Sa SuAvg Freq (Wkdy Peak) 30 min
Avg Freq (Wkdy Non-Peak) 30 minAvg Freq (Wked) 10-20 min
FY 2017 Farebox Recovery 53 transfer (to route) 0
Clipper usage 0
Annual Avg Monthly Avg Daily Annual Avg Monthly Avg Daily Annual Avg Monthly Avg DailyWeekday 21940 7313 549 804 268 20 10735 3578 268 Saturday 43799 7300 1752 1473 245 59 20480 3413 819 Sunday 56377 6264 1446 2040 227 52 28212 3135 723
Total 122116 13568 1174 4316 480 42 59428 6603 571
Annual Avg Monthly Avg Daily Annual Avg Monthly Avg Daily Annual Avg Monthly Avg DailyWeekday $104033 $34678 $2601 $37751 $12584 $944 $66282 $22094 $1657Saturday $152661 $25444 $6106 $79948 $13325 $3198 $72713 $12119 $2909Sunday $217032 $24115 $5565 $132049 $14672 $3386 $84983 $9443 $2179
Total $473726 $52636 $4555 $249748 $27750 $2401 $223978 $24886 $2154
Passengers per Revenue Hour
Subsidy per Passenger
Cost per Revenue Hour
Farebox Recovery
Weekday 273 $302 $12944 363Saturday 297 $166 $10367 524Sunday 276 $151 $10638 608
Total 283 $183 $10975 527
Passengers Revenue Hours Operating CostsPassenger
RevenueOperating Subsidy
Passengers per Revenue Hour
Subsidy per Passenger
Cost per Revenue Hour
Farebox Recovery
FY 2015 103930 3866 $477523 $209514 $268009 269 $258 $12352 439FY 2016 116942 4673 $531384 $245779 $285605 250 $244 $11373 463FY 2017 122116 4316 $473726 $249748 $223978 283 $183 $10975 527
Histo
ric Tr
ends
FY 20
161
7 DAT
A
Passengers Revenue Hours Revenue Miles
Operating Costs Passenger Revenue Operating Subsidy
62624
103052 103930 116942 122116
0
20000
40000
60000
80000
100000
120000
140000
FY 2013 FY 2014 FY 2015 FY 2016 FY 2017
Passengers
2941
3841 3866
4673 4316
0
1000
2000
3000
4000
5000
FY 2013 FY 2014 FY 2015 FY 2016 FY 2017
Revenue Hours
$330076
$538014 $477523
$531384 $473726
$0
$100000
$200000
$300000
$400000
$500000
$600000
FY 2013 FY 2014 FY 2015 FY 2016 FY 2017
Operating Costs
213
268 269 250
283
00
50
100
150
200
250
300
FY 2013 FY 2014 FY 2015 FY 2016 FY 2017
Passengers per Revenue Hour
$360 $322
$258 $244 $183
$000
$100
$200
$300
$400
$500
FY 2013 FY 2014 FY 2015 FY 2016 FY 2017
Subsidy per Passenger
$11223
$14007 $12352 $11373 $10975
$0
$50
$100
$150
$200
FY 2013 FY 2014 FY 2015 FY 2016 FY 2017
Cost per Revenue Hour
68Rural
Days of Service Wkdy Sa SuAvg Freq (Wkdy Peak) 60 min
Avg Freq (Wkdy Non-Peak) 120 minAvg Freq (Wked) 60-120 min
FY 2017 Farebox Recovery 9 transfer (to route) 13
Clipper usage 12
Annual Avg Monthly Avg Daily Annual Avg Monthly Avg Daily Annual Avg Monthly Avg DailyWeekday 59903 4992 239 7282 607 29 133167 11097 531 Saturday 8410 701 168 1492 124 30 27123 2260 542 Sunday 8285 690 129 1907 159 30 34638 2887 541
Total 76598 6383 210 10680 890 29 194928 16244 534
Annual Avg Monthly Avg Daily Annual Avg Monthly Avg Daily Annual Avg Monthly Avg DailyWeekday $645737 $53811 $2573 $64332 $5361 $256 $581405 $48450 $2316Saturday $131882 $10990 $2638 $9260 $772 $185 $122622 $10219 $2452Sunday $169286 $14107 $2645 $8856 $738 $138 $160430 $13369 $2507
Total $946905 $78909 $2594 $82448 $6871 $226 $864457 $72038 $2368
Passengers per Revenue Hour
Subsidy per Passenger
Cost per Revenue Hour
Farebox Recovery
Weekday 82 $971 $8868 100Saturday 56 $1458 $8841 70Sunday 43 $1936 $8879 52
Total 72 $1129 $8866 87
Passengers Revenue Hours Operating CostsPassenger
RevenueOperating Subsidy
Passengers per Revenue Hour
Subsidy per Passenger
Cost per Revenue Hour
Farebox Recovery
FY 2015 65866 10589 $848305 $80846 $767459 62 $1165 $8011 95FY 2016 70292 10611 $811978 $88808 $723170 66 $1029 $7652 109FY 2017 76598 10680 $946905 $82448 $864457 72 $1129 $8866 87
Histo
ric Tr
ends
FY 20
161
7 DAT
A
Passengers Revenue Hours Revenue Miles
Operating Costs Passenger Revenue Operating Subsidy
48113 56988
65866 70292 76598
0
20000
40000
60000
80000
100000
FY 2013 FY 2014 FY 2015 FY 2016 FY 2017
Passengers
7140 7185
10589 10611 10680
0
2000
4000
6000
8000
10000
12000
FY 2013 FY 2014 FY 2015 FY 2016 FY 2017
Revenue Hours
$532879 $571618
$848305 $811978 $946905
$0
$200000
$400000
$600000
$800000
$1000000
FY 2013 FY 2014 FY 2015 FY 2016 FY 2017
Operating Costs
67 79
62 66 72
00
20
40
60
80
100
FY 2013 FY 2014 FY 2015 FY 2016 FY 2017
Passengers per Revenue Hour
$979 $885
$1165 $1029
$1129
$000$200$400$600$800
$1000$1200$1400
FY 2013 FY 2014 FY 2015 FY 2016 FY 2017
Subsidy per Passenger
$7464 $7955 $8011 $7652 $8866
$0
$50
$100
$150
$200
FY 2013 FY 2014 FY 2015 FY 2016 FY 2017
Cost per Revenue Hour
71XLocal Trunkline
Days of Service WkdyAvg Freq (Wkdy Peak) 30 min
Avg Freq (Wkdy Non-Peak) 60 minAvg Freq (Wked) -
FY 2017 Farebox Recovery 15 transfer (to route) 26
Clipper usage 16
Annual Avg Monthly Avg Daily Annual Avg Monthly Avg Daily Annual Avg Monthly Avg DailyWeekday 121141 10095 479 7705 642 30 174624 14552 690 Saturday - - - - - - - - - Sunday - - - - - - - - -
Total 121141 10095 479 7705 642 30 174624 14552 690
Annual Avg Monthly Avg Daily Annual Avg Monthly Avg Daily Annual Avg Monthly Avg DailyWeekday $1116954 $93080 $4415 $164963 $13747 $652 $951991 $79333 $3763Saturday $ - $ - $ - $ - $ - $ - $ - $ - $ -Sunday $ - $ - $ - $ - $ - $ - $ - $ - $ -
Total $1116954 $93080 $4415 $164963 $13747 $652 $951991 $79333 $3763
Passengers per Revenue Hour
Subsidy per Passenger
Cost per Revenue Hour
Farebox Recovery
Weekday 157 $786 $14496 148Saturday - $ - $ - - Sunday - $ - $ - -
Total 157 $786 $14496 148
Passengers Revenue Hours Operating CostsPassenger
RevenueOperating Subsidy
Passengers per Revenue Hour
Subsidy per Passenger
Cost per Revenue Hour
Farebox Recovery
FY 2015 305440 7666 $1066058 $307659 $758399 398 $248 $13906 289FY 2016 259678 7717 $1075263 $300186 $775077 337 $298 $13934 279FY 2017 121141 7705 $1116954 $164963 $951991 157 $786 $14496 148
Histo
ric Tr
ends
FY 20
161
7 DAT
A
Passengers Revenue Hours Revenue Miles
Operating Costs Passenger Revenue Operating Subsidy
347560 341105 305440
259678
121141
050000
100000150000200000250000300000350000400000
FY 2013 FY 2014 FY 2015 FY 2016 FY 2017
Passengers9038
7578 7666 7717 7705
0
2000
4000
6000
8000
10000
FY 2013 FY 2014 FY 2015 FY 2016 FY 2017
Revenue Hours$1254262
$1116004 $1066058 $1075263 $1116954
$0
$200000
$400000
$600000
$800000
$1000000
$1200000
$1400000
FY 2013 FY 2014 FY 2015 FY 2016 FY 2017
Operating Costs
385 450
398 337
157
00100200300400500600700800
FY 2013 FY 2014 FY 2015 FY 2016 FY 2017
Passengers per Revenue Hour
$253 $222 $248 $298
$786
$000
$200
$400
$600
$800
$1000
FY 2013 FY 2014 FY 2015 FY 2016 FY 2017
Subsidy per Passenger
$13877 $14728 $13906 $13934 $14496
$0
$50
$100
$150
$200
FY 2013 FY 2014 FY 2015 FY 2016 FY 2017
Cost per Revenue Hour
113Supplemental
Days of Service School DaysAvg Freq (Wkdy Peak) 3 trips
Avg Freq (Wkdy Non-Peak) -Avg Freq (Wked) -
FY 2017 Farebox Recovery 29 transfer (to route) 0
Clipper usage 4
Annual Avg Monthly Avg Daily Annual Avg Monthly Avg Daily Annual Avg Monthly Avg DailyWeekday 16829 1530 92 317 29 2 2404 219 13 Saturday - - - - - - - - - Sunday - - - - - - - - -
Total 16829 1530 92 317 29 2 2404 219 13
Annual Avg Monthly Avg Daily Annual Avg Monthly Avg Daily Annual Avg Monthly Avg DailyWeekday $42180 $3835 $230 $12227 $1112 $67 $29953 $2723 $164Saturday $ - $ - $ - $ - $ - $ - $ - $ - $ -Sunday $ - $ - $ - $ - $ - $ - $ - $ - $ -
Total $42180 $3835 $230 $12227 $1112 $67 $29953 $2723 $164
Passengers per TripSubsidy per
PassengerCost per Revenue
HourFarebox Recovery
Weekday 315 $178 $13289 290Saturday - $ - $ - - Sunday - $ - $ - -
Total 315 $178 $13289 290
Passengers Revenue Hours Operating CostsPassenger
RevenueOperating Subsidy Passengers per Trip
Subsidy per Passenger
Cost per Revenue Hour
Farebox Recovery
FY 2015 12241 161 $28599 $10703 $17896 342 $146 $17752 374FY 2016 14601 263 $36924 $12809 $24115 317 $165 $14050 347FY 2017 16829 317 $42180 $12227 $29953 315 $178 $13289 290
Histo
ric Tr
ends
FY 20
161
7 DAT
A
Passengers Revenue Hours Revenue Miles
Operating Costs Passenger Revenue Operating Subsidy
15232 13521
12241 14601
16829
0
5000
10000
15000
20000
FY 2013 FY 2014 FY 2015 FY 2016 FY 2017
Passengers
229
165 161
263
317
0
50
100
150
200
250
300
350
FY 2013 FY 2014 FY 2015 FY 2016 FY 2017
Revenue Hours
$31562
$20182
$28599
$36924 $42180
$0
$10000
$20000
$30000
$40000
$50000
FY 2013 FY 2014 FY 2015 FY 2016 FY 2017
Operating Costs
220
365 342 317 315
00
100
200
300
400
500
FY 2013 FY 2014 FY 2015 FY 2016 FY 2017
Passengers per Trip
$051 $095
$146 $165 $178
$000$100$200$300$400$500$600$700$800
FY 2013 FY 2014 FY 2015 FY 2016 FY 2017
Subsidy per Passenger
$13795 $12261
$17752
$14050 $13289
$0
$50
$100
$150
$200
FY 2013 FY 2014 FY 2015 FY 2016 FY 2017
Cost per Revenue Hour
115Supplemental
Days of Service School DaysAvg Freq (Wkdy Peak) 5 trips
Avg Freq (Wkdy Non-Peak) -Avg Freq (Wked) -
FY 2017 Farebox Recovery 11 transfer (to route) 0
Clipper usage 7
Annual Avg Monthly Avg Daily Annual Avg Monthly Avg Daily Annual Avg Monthly Avg DailyWeekday 14021 1275 71 637 58 3 6963 633 35 Saturday - - - - - - - - - Sunday - - - - - - - - -
Total 14021 1275 71 637 58 3 6963 633 35
Annual Avg Monthly Avg Daily Annual Avg Monthly Avg Daily Annual Avg Monthly Avg DailyWeekday $87534 $7958 $444 $9504 $864 $48 $78030 $7094 $396Saturday $ - $ - $ - $ - $ - $ - $ - $ - $ -Sunday $ - $ - $ - $ - $ - $ - $ - $ - $ -
Total $87534 $7958 $444 $9504 $864 $48 $78030 $7094 $396
Passengers per TripSubsidy per
PassengerCost per Revenue
HourFarebox Recovery
Weekday 185 $557 $13744 109Saturday - $ - $ - - Sunday - $ - $ - -
Total 185 $557 $13744 109
Passengers Revenue Hours Operating CostsPassenger
RevenueOperating Subsidy Passengers per Trip
Subsidy per Passenger
Cost per Revenue Hour
Farebox Recovery
FY 2015 21488 775 $131168 $18863 $112305 221 $523 $16918 144FY 2016 16366 559 $82403 $12638 $69765 168 $426 $14754 153FY 2017 14021 637 $87534 $9504 $78030 185 $557 $13744 109
Histo
ric Tr
ends
FY 20
161
7 DAT
A
Passengers Revenue Hours Revenue Miles
Operating Costs Passenger Revenue Operating Subsidy
13524
21488
16366 14021
0
5000
10000
15000
20000
25000
FY 2013 FY 2014 FY 2015 FY 2016 FY 2017
Passengers
463
775
559 637
0
200
400
600
800
1000
FY 2013 FY 2014 FY 2015 FY 2016 FY 2017
Revenue Hours
$56706
$131168
$82403 $87534
$0
$20000
$40000
$60000
$80000
$100000
$120000
$140000
FY 2013 FY 2014 FY 2015 FY 2016 FY 2017
Operating Costs
232 221 168 185
00
100
200
300
400
500
FY 2013 FY 2014 FY 2015 FY 2016 FY 2017
Passengers per Trip
$362
$523 $426
$557
$000$100$200$300$400$500$600$700$800
FY 2013 FY 2014 FY 2015 FY 2016 FY 2017
Subsidy per Passenger
$12250
$16918 $14754 $13744
$0
$50
$100
$150
$200
FY 2013 FY 2014 FY 2015 FY 2016 FY 2017
Cost per Revenue Hour
117Supplemental
Days of Service School DaysAvg Freq (Wkdy Peak) 6 trips
Avg Freq (Wkdy Non-Peak) -Avg Freq (Wked) -
FY 2017 Farebox Recovery 21 transfer (to route) 0
Clipper usage 2
Annual Avg Monthly Avg Daily Annual Avg Monthly Avg Daily Annual Avg Monthly Avg DailyWeekday 34820 3165 193 640 58 4 4753 432 26 Saturday - - - - - - - - - Sunday - - - - - - - - -
Total 34820 3165 193 640 58 4 4753 432 26
Annual Avg Monthly Avg Daily Annual Avg Monthly Avg Daily Annual Avg Monthly Avg DailyWeekday $81509 $7410 $453 $17140 $1558 $95 $64369 $5852 $358Saturday $ - $ - $ - $ - $ - $ - $ - $ - $ -Sunday $ - $ - $ - $ - $ - $ - $ - $ - $ -
Total $81509 $7410 $453 $17140 $1558 $95 $64369 $5852 $358
Passengers per TripSubsidy per
PassengerCost per Revenue
HourFarebox Recovery
Weekday 284 $185 $12732 210Saturday - $ - $ - - Sunday - $ - $ - -
Total 284 $185 $12732 210
Passengers Revenue Hours Operating CostsPassenger
RevenueOperating Subsidy Passengers per Trip
Subsidy per Passenger
Cost per Revenue Hour
Farebox Recovery
FY 2015 50008 509 $77168 $77528 ($360) 399 ($001) $15158 1005FY 2016 33705 552 $77694 $23478 $54216 269 $161 $14075 302FY 2017 34820 640 $81509 $17140 $64369 284 $185 $12732 210
Histo
ric Tr
ends
FY 20
161
7 DAT
A
Passengers Revenue Hours Revenue Miles
Operating Costs Passenger Revenue Operating Subsidy
35174 34496
50008
33705 34820
0
10000
20000
30000
40000
50000
60000
FY 2013 FY 2014 FY 2015 FY 2016 FY 2017
Passengers
299 341
509 552
640
0
100
200
300
400
500
600
700
FY 2013 FY 2014 FY 2015 FY 2016 FY 2017
Revenue Hours
$41176 $41796
$77168 $77694 $81509
$0
$20000
$40000
$60000
$80000
$100000
FY 2013 FY 2014 FY 2015 FY 2016 FY 2017
Operating Costs
436 406 399
269 284
00
100
200
300
400
500
FY 2013 FY 2014 FY 2015 FY 2016 FY 2017
Passengers per Trip
($012) ($028) ($001)
$161 $185
-$200
-$100
$000
$100
$200
$300
$400
$500
$600
FY 2013 FY 2014 FY 2015 FY 2016 FY 2017
Subsidy per Passenger$13790
$12253
$15158 $14075
$12732
$0$20$40$60$80
$100$120$140$160
FY 2013 FY 2014 FY 2015 FY 2016 FY 2017
Cost per Revenue Hour
119Supplemental
Days of Service School DaysAvg Freq (Wkdy Peak) 5 trips
Avg Freq (Wkdy Non-Peak) -Avg Freq (Wked) -
FY 2017 Farebox Recovery 34 transfer (to route) 0
Clipper usage 5
Annual Avg Monthly Avg Daily Annual Avg Monthly Avg Daily Annual Avg Monthly Avg DailyWeekday 27161 2469 151 374 34 2 6893 627 38 Saturday - - - - - - - - - Sunday - - - - - - - - -
Total 27161 2469 151 374 34 2 6893 627 38
Annual Avg Monthly Avg Daily Annual Avg Monthly Avg Daily Annual Avg Monthly Avg DailyWeekday $56273 $5116 $313 $18859 $1714 $105 $37414 $3401 $208Saturday $ - $ - $ - $ - $ - $ - $ - $ - $ -Sunday $ - $ - $ - $ - $ - $ - $ - $ - $ -
Total $56273 $5116 $313 $18859 $1714 $105 $37414 $3401 $208
Passengers per TripSubsidy per
PassengerCost per Revenue
HourFarebox Recovery
Weekday 313 $138 $15058 335Saturday - $ - $ - - Sunday - $ - $ - -
Total 313 $138 $15058 335
Passengers Revenue Hours Operating CostsPassenger
RevenueOperating Subsidy Passengers per Trip
Subsidy per Passenger
Cost per Revenue Hour
Farebox Recovery
FY 2015 28376 466 $85243 $24699 $60544 319 $213 $18292 290FY 2016 30906 431 $68366 $28456 $39910 317 $129 $15877 416FY 2017 27161 374 $56273 $18859 $37414 313 $138 $15058 335
Histo
ric Tr
ends
FY 20
161
7 DAT
A
Passengers Revenue Hours Revenue Miles
Operating Costs Passenger Revenue Operating Subsidy
27987 28376
30906
27161
25000
26000
27000
28000
29000
30000
31000
32000
FY 2013 FY 2014 FY 2015 FY 2016 FY 2017
Passengers526
466 431
374
0
100
200
300
400
500
600
FY 2013 FY 2014 FY 2015 FY 2016 FY 2017
Revenue Hours
$64440
$85243
$68366 $56273
$0
$20000
$40000
$60000
$80000
$100000
FY 2013 FY 2014 FY 2015 FY 2016 FY 2017
Operating Costs
272 319 317 313
00
100
200
300
400
500
FY 2013 FY 2014 FY 2015 FY 2016 FY 2017
Passengers per Trip
$175 $213 $129 $138
$000$100$200$300$400$500$600$700$800
FY 2013 FY 2014 FY 2015 FY 2016 FY 2017
Subsidy per Passenger
$12251
$18292 $15877 $15058
$0
$50
$100
$150
$200
FY 2013 FY 2014 FY 2015 FY 2016 FY 2017
Cost per Revenue Hour
122Partnership
Days of Service WkdyAvg Freq (Wkdy Peak) -
Avg Freq (Wkdy Non-Peak) 30 minAvg Freq (Wked) -
FY 2017 Farebox Recovery 66 transfer (to route) 9
Clipper usage 6
Annual Avg Monthly Avg Daily Annual Avg Monthly Avg Daily Annual Avg Monthly Avg DailyWeekday 19860 1986 113 1696 170 10 15480 1548 88 Saturday - - - - - - - - - Sunday - - - - - - - - -
Total 19860 1986 113 1696 170 10 15480 1548 88
Annual Avg Monthly Avg Daily Annual Avg Monthly Avg Daily Annual Avg Monthly Avg DailyWeekday $183943 $18394 $1045 $121007 $12101 $688 $62936 $6294 $358Saturday $ - $ - $ - $ - $ - $ - $ - $ - $ -Sunday $ - $ - $ - $ - $ - $ - $ - $ - $ -
Total $183943 $18394 $1045 $121007 $12101 $688 $62936 $6294 $358
Passengers per Revenue Hour
Subsidy per Passenger
Cost per Revenue Hour
Farebox Recovery
Weekday 117 $317 $10844 658Saturday - $ - $ - - Sunday - $ - $ - -
Total 117 $317 $10844 658
Passengers Revenue Hours Operating CostsPassenger
RevenueOperating Subsidy
Passengers per Revenue Hour
Subsidy per Passenger
Cost per Revenue Hour
Farebox Recovery
FY 2015FY 2016 20360 2932 $325230 $149686 $175544 69 $862 $11094 460FY 2017 19860 1696 $183943 $121007 $62936 117 $317 $10844 658
Histo
ric Tr
ends
FY 20
161
7 DAT
A
Passengers Revenue Hours Revenue Miles
Operating Costs Passenger Revenue Operating Subsidy
20360 19860
0
5000
10000
15000
20000
25000
FY 2013 FY 2014 FY 2015 FY 2016 FY 2017
Passengers2932
1696
0
500
1000
1500
2000
2500
3000
3500
FY 2013 FY 2014 FY 2015 FY 2016 FY 2017
Revenue Hours$325230
$183943
$0
$50000
$100000
$150000
$200000
$250000
$300000
$350000
FY 2013 FY 2014 FY 2015 FY 2016 FY 2017
Operating Costs
69
117
00
20
40
60
80
100
120
140
FY 2013 FY 2014 FY 2015 FY 2016 FY 2017
Passengers per Revenue Hour$862
$317
$000
$200
$400
$600
$800
$1000
FY 2013 FY 2014 FY 2015 FY 2016 FY 2017
Subsidy per Passenger
$11094 $10844
$0
$50
$100
$150
$200
FY 2013 FY 2014 FY 2015 FY 2016 FY 2017
Cost per Revenue Hour
125Supplemental
Days of Service School DaysAvg Freq (Wkdy Peak) 4 trips
Avg Freq (Wkdy Non-Peak) -Avg Freq (Wked) -
FY 2017 Farebox Recovery 16 transfer (to route) 1
Clipper usage 8
Annual Avg Monthly Avg Daily Annual Avg Monthly Avg Daily Annual Avg Monthly Avg DailyWeekday 13757 1251 76 600 55 3 8580 780 48 Saturday - - - - - - - - - Sunday - - - - - - - - -
Total 13757 1251 76 600 55 3 8580 780 48
Annual Avg Monthly Avg Daily Annual Avg Monthly Avg Daily Annual Avg Monthly Avg DailyWeekday $72469 $6588 $403 $11570 $1052 $64 $60899 $5536 $338Saturday $ - $ - $ - $ - $ - $ - $ - $ - $ -Sunday $ - $ - $ - $ - $ - $ - $ - $ - $ -
Total $72469 $6588 $403 $11570 $1052 $64 $60899 $5536 $338
Passengers per TripSubsidy per
PassengerCost per Revenue
HourFarebox Recovery
Weekday 193 $443 $12086 160Saturday - $ - $ - - Sunday - $ - $ - -
Total 193 $443 $12086 160
Passengers Revenue Hours Operating CostsPassenger
RevenueOperating Subsidy Passengers per Trip
Subsidy per Passenger
Cost per Revenue Hour
Farebox Recovery
FY 2015 13298 578 $87015 $11914 $75101 186 $565 $15054 137FY 2016 13197 595 $77991 $12684 $65307 182 $495 $13117 163FY 2017 13757 600 $72469 $11570 $60899 193 $443 $12086 160
Histo
ric Tr
ends
FY 20
161
7 DAT
A
Passengers Revenue Hours Revenue Miles
Operating Costs Passenger Revenue Operating Subsidy
8798 7189
13298 13197 13757
02000400060008000
10000120001400016000
FY 2013 FY 2014 FY 2015 FY 2016 FY 2017
Passengers
100 90
578 595 600
0
100
200
300
400
500
600
700
FY 2013 FY 2014 FY 2015 FY 2016 FY 2017
Revenue Hours
$13752 $10979
$87015 $77991
$72469
$0
$20000
$40000
$60000
$80000
$100000
FY 2013 FY 2014 FY 2015 FY 2016 FY 2017
Operating Costs
492
402
186 182 193
00
100
200
300
400
500
FY 2013 FY 2014 FY 2015 FY 2016 FY 2017
Passengers per Trip
$015 $002
$565 $495
$443
$000$100$200$300$400$500$600$700$800
FY 2013 FY 2014 FY 2015 FY 2016 FY 2017
Subsidy per Passenger$13821
$12267
$15054 $13117
$12086
$0$20$40$60$80
$100$120$140$160
FY 2013 FY 2014 FY 2015 FY 2016 FY 2017
Cost per Revenue Hour
139Supplemental
Days of Service School DaysAvg Freq (Wkdy Peak) 2 trips
Avg Freq (Wkdy Non-Peak) -Avg Freq (Wked) -
FY 2017 Farebox Recovery 20 transfer (to route) 0
Clipper usage 24
Annual Avg Monthly Avg Daily Annual Avg Monthly Avg Daily Annual Avg Monthly Avg DailyWeekday 6414 583 36 253 23 1 4127 375 23 Saturday - - - - - - - - - Sunday - - - - - - - - -
Total 6414 583 36 253 23 1 4127 375 23
Annual Avg Monthly Avg Daily Annual Avg Monthly Avg Daily Annual Avg Monthly Avg DailyWeekday $33182 $3017 $184 $6635 $603 $37 $26547 $2413 $147Saturday $ - $ - $ - $ - $ - $ - $ - $ - $ -Sunday $ - $ - $ - $ - $ - $ - $ - $ - $ -
Total $33182 $3017 $184 $6635 $603 $37 $26547 $2413 $147
Passengers per TripSubsidy per
PassengerCost per Revenue
HourFarebox Recovery
Weekday 179 $414 $13110 200Saturday - $ - $ - - Sunday - $ - $ - -
Total 179 $414 $13110 200
Passengers Revenue Hours Operating CostsPassenger
RevenueOperating Subsidy Passengers per Trip
Subsidy per Passenger
Cost per Revenue Hour
Farebox Recovery
FY 2015 5906 225 $36437 $5258 $31179 164 $528 $16173 144FY 2016 6391 315 $43776 $6241 $37535 160 $587 $13880 143FY 2017 6414 253 $33182 $6635 $26547 179 $414 $13110 200
Histo
ric Tr
ends
FY 20
161
7 DAT
A
Passengers Revenue Hours Revenue Miles
Operating Costs Passenger Revenue Operating Subsidy
4232 4026
5906 6391 6414
0
1000
2000
3000
4000
5000
6000
7000
FY 2013 FY 2014 FY 2015 FY 2016 FY 2017
Passengers
226 227 225
315
253
0
50
100
150
200
250
300
350
FY 2013 FY 2014 FY 2015 FY 2016 FY 2017
Revenue Hours
$31306 $27734
$36437
$43776
$33182
$0
$10000
$20000
$30000
$40000
$50000
FY 2013 FY 2014 FY 2015 FY 2016 FY 2017
Operating Costs
120 111 164 160 179
00
100
200
300
400
500
FY 2013 FY 2014 FY 2015 FY 2016 FY 2017
Passengers per Trip
$427
$628 $528
$587
$414
$000$100$200$300$400$500$600$700$800
FY 2013 FY 2014 FY 2015 FY 2016 FY 2017
Subsidy per Passenger
$13834 $12239
$16173 $13880 $13110
$0
$50
$100
$150
$200
FY 2013 FY 2014 FY 2015 FY 2016 FY 2017
Cost per Revenue Hour
145Supplemental
Days of Service School DaysAvg Freq (Wkdy Peak) 2-3 trips
Avg Freq (Wkdy Non-Peak) -Avg Freq (Wked) -
FY 2017 Farebox Recovery 29 transfer (to route) 5
Clipper usage 2
Annual Avg Monthly Avg Daily Annual Avg Monthly Avg Daily Annual Avg Monthly Avg DailyWeekday 16406 1491 90 191 17 1 2175 198 12 Saturday - - - - - - - - - Sunday - - - - - - - - -
Total 16406 1491 90 191 17 1 2175 198 12
Annual Avg Monthly Avg Daily Annual Avg Monthly Avg Daily Annual Avg Monthly Avg DailyWeekday $25426 $2311 $139 $7258 $660 $40 $18168 $1652 $99Saturday $ - $ - $ - $ - $ - $ - $ - $ - $ -Sunday $ - $ - $ - $ - $ - $ - $ - $ - $ -
Total $25426 $2311 $139 $7258 $660 $40 $18168 $1652 $99
Passengers per TripSubsidy per
PassengerCost per Revenue
HourFarebox Recovery
Weekday 372 $111 $13347 285Saturday - $ - $ - - Sunday - $ - $ - -
Total 372 $111 $13347 285
Passengers Revenue Hours Operating CostsPassenger
RevenueOperating Subsidy Passengers per Trip
Subsidy per Passenger
Cost per Revenue Hour
Farebox Recovery
FY 2015 6911 87 $13373 $5858 $7515 337 $109 $15442 438FY 2016 10268 167 $21672 $6341 $15331 396 $149 $12993 293FY 2017 16406 191 $25426 $7258 $18168 372 $111 $13347 285
Histo
ric Tr
ends
FY 20
161
7 DAT
A
Passengers Revenue Hours Revenue Miles
Operating Costs Passenger Revenue Operating Subsidy
6911
10268
16406
0
5000
10000
15000
20000
FY 2013 FY 2014 FY 2015 FY 2016 FY 2017
Passengers
87
167 191
0
50
100
150
200
250
FY 2013 FY 2014 FY 2015 FY 2016 FY 2017
Revenue Hours
$13373
$21672 $25426
$0
$5000
$10000
$15000
$20000
$25000
$30000
FY 2013 FY 2014 FY 2015 FY 2016 FY 2017
Operating Costs
337 396 372
00
100
200
300
400
500
FY 2013 FY 2014 FY 2015 FY 2016 FY 2017
Passengers per Trip
$109 $149 $111
$000$100$200$300$400$500$600$700$800
FY 2013 FY 2014 FY 2015 FY 2016 FY 2017
Subsidy per Passenger
$15442 $12993 $13347
$0
$50
$100
$150
$200
FY 2013 FY 2014 FY 2015 FY 2016 FY 2017
Cost per Revenue Hour
151Supplemental
Days of Service School DaysAvg Freq (Wkdy Peak) 4-5 trips
Avg Freq (Wkdy Non-Peak) -Avg Freq (Wked) -
FY 2017 Farebox Recovery 25 transfer (to route) 1
Clipper usage 4
Annual Avg Monthly Avg Daily Annual Avg Monthly Avg Daily Annual Avg Monthly Avg DailyWeekday 36801 3346 204 594 54 3 10649 968 59 Saturday - - - - - - - - - Sunday - - - - - - - - -
Total 36801 3346 204 594 54 3 10649 968 59
Annual Avg Monthly Avg Daily Annual Avg Monthly Avg Daily Annual Avg Monthly Avg DailyWeekday $73842 $6713 $410 $18463 $1678 $103 $55379 $5034 $308Saturday $ - $ - $ - $ - $ - $ - $ - $ - $ -Sunday $ - $ - $ - $ - $ - $ - $ - $ - $ -
Total $73842 $6713 $410 $18463 $1678 $103 $55379 $5034 $308
Passengers per TripSubsidy per
PassengerCost per Revenue
HourFarebox Recovery
Weekday 428 $150 $12442 250Saturday - $ - $ - - Sunday - $ - $ - -
Total 428 $150 $12442 250
Passengers Revenue Hours Operating CostsPassenger
RevenueOperating Subsidy Passengers per Trip
Subsidy per Passenger
Cost per Revenue Hour
Farebox Recovery
FY 2015 39309 911 $134174 $34376 $99798 315 $254 $14722 256FY 2016 42643 759 $100712 $25851 $74861 456 $176 $13267 257FY 2017 36801 594 $73842 $18463 $55379 428 $150 $12442 250
Histo
ric Tr
ends
FY 20
161
7 DAT
A
Passengers Revenue Hours Revenue Miles
Operating Costs Passenger Revenue Operating Subsidy
39537 39309
42643
36801
32000
34000
36000
38000
40000
42000
44000
FY 2013 FY 2014 FY 2015 FY 2016 FY 2017
Passengers
784 911
759
594
0
200
400
600
800
1000
FY 2013 FY 2014 FY 2015 FY 2016 FY 2017
Revenue Hours
$95932
$134174
$100712
$73842
$0$20000$40000$60000$80000
$100000$120000$140000$160000
FY 2013 FY 2014 FY 2015 FY 2016 FY 2017
Operating Costs
368 315
456 428
00
100
200
300
400
500
FY 2013 FY 2014 FY 2015 FY 2016 FY 2017
Passengers per Trip
$188 $254
$176 $150
$000$100$200$300$400$500$600$700$800
FY 2013 FY 2014 FY 2015 FY 2016 FY 2017
Subsidy per Passenger
$12233
$14722 $13267 $12442
$0$20$40$60$80
$100$120$140$160
FY 2013 FY 2014 FY 2015 FY 2016 FY 2017
Cost per Revenue Hour
154Supplemental
Days of Service School DaysAvg Freq (Wkdy Peak) 3 trips
Avg Freq (Wkdy Non-Peak) -Avg Freq (Wked) -
FY 2017 Farebox Recovery 21 transfer (to route) 0
Clipper usage 5
Annual Avg Monthly Avg Daily Annual Avg Monthly Avg Daily Annual Avg Monthly Avg DailyWeekday 13738 1249 76 358 33 2 4342 395 24 Saturday - - - - - - - - - Sunday - - - - - - - - -
Total 13738 1249 76 358 33 2 4342 395 24
Annual Avg Monthly Avg Daily Annual Avg Monthly Avg Daily Annual Avg Monthly Avg DailyWeekday $41965 $3815 $233 $8847 $804 $49 $33118 $3011 $184Saturday $ - $ - $ - $ - $ - $ - $ - $ - $ -Sunday $ - $ - $ - $ - $ - $ - $ - $ - $ -
Total $41965 $3815 $233 $8847 $804 $49 $33118 $3011 $184
Passengers per TripSubsidy per
PassengerCost per Revenue
HourFarebox Recovery
Weekday 255 $241 $11729 211Saturday - $ - $ - - Sunday - $ - $ - -
Total 255 $241 $11729 211
Passengers Revenue Hours Operating CostsPassenger
RevenueOperating Subsidy Passengers per Trip
Subsidy per Passenger
Cost per Revenue Hour
Farebox Recovery
FY 2015 15376 293 $42604 $13174 $29430 388 $191 $14541 309FY 2016 17858 360 $46133 $14660 $31473 311 $176 $12808 318FY 2017 13738 358 $41965 $8847 $33118 255 $241 $11729 211
Histo
ric Tr
ends
FY 20
161
7 DAT
A
Passengers Revenue Hours Revenue Miles
Operating Costs Passenger Revenue Operating Subsidy
12138
15376 17858
13738
0
5000
10000
15000
20000
FY 2013 FY 2014 FY 2015 FY 2016 FY 2017
Passengers
310 293
360 358
050
100150200250300350400
FY 2013 FY 2014 FY 2015 FY 2016 FY 2017
Revenue Hours
$37913 $42604
$46133 $41965
$0
$10000
$20000
$30000
$40000
$50000
FY 2013 FY 2014 FY 2015 FY 2016 FY 2017
Operating Costs
291
388
311 255
00
100
200
300
400
500
FY 2013 FY 2014 FY 2015 FY 2016 FY 2017
Passengers per Trip
$256 $191 $176
$241
$000$100$200$300$400$500$600$700$800
FY 2013 FY 2014 FY 2015 FY 2016 FY 2017
Subsidy per Passenger
$12246
$14541 $12808
$11729
$0$20$40$60$80
$100$120$140$160
FY 2013 FY 2014 FY 2015 FY 2016 FY 2017
Cost per Revenue Hour
219Local Connector
Days of Service Wkdy Sa SuAvg Freq (Wkdy Peak) 30 min
Avg Freq (Wkdy Non-Peak) 30 minAvg Freq (Wked) 30 min
FY 2017 Farebox Recovery 11 transfer (to route) 20
Clipper usage 11
Annual Avg Monthly Avg Daily Annual Avg Monthly Avg Daily Annual Avg Monthly Avg DailyWeekday 40817 3401 161 5020 418 20 58766 4897 232 Saturday 4888 407 94 637 53 12 10931 911 210 Sunday 4744 395 79 735 61 12 12607 1051 210
Total 50449 4204 138 6392 533 18 82304 6859 225
Annual Avg Monthly Avg Daily Annual Avg Monthly Avg Daily Annual Avg Monthly Avg DailyWeekday $462388 $38532 $1828 $51411 $4284 $203 $410977 $34248 $1624Saturday $59904 $4992 $1152 $6230 $519 $120 $53674 $4473 $1032Sunday $68932 $5744 $1149 $6460 $538 $108 $62472 $5206 $1041
Total $591224 $49269 $1620 $64101 $5342 $176 $527123 $43927 $1444
Passengers per Revenue Hour
Subsidy per Passenger
Cost per Revenue Hour
Farebox Recovery
Weekday 81 $1007 $9212 111Saturday 77 $1098 $9401 104Sunday 65 $1317 $9381 94
Total 79 $1045 $9250 108
Passengers Revenue Hours Operating CostsPassenger
RevenueOperating Subsidy
Passengers per Revenue Hour
Subsidy per Passenger
Cost per Revenue Hour
Farebox Recovery
FY 2015 60906 6585 $569962 $65747 $504215 92 $828 $8656 115FY 2016 55610 6591 $590663 $73164 $517499 84 $931 $8961 124FY 2017 50449 6392 $591224 $64101 $527123 79 $1045 $9250 108
Histo
ric Tr
ends
FY 20
161
7 DAT
A
Passengers Revenue Hours Revenue Miles
Operating Costs Passenger Revenue Operating Subsidy
55543 60906
55610 50449
0
10000
20000
30000
40000
50000
60000
70000
FY 2013 FY 2014 FY 2015 FY 2016 FY 2017
Passengers
5734
6585 6591 6392
520054005600580060006200640066006800
FY 2013 FY 2014 FY 2015 FY 2016 FY 2017
Revenue Hours
$522978
$569962
$590663 $591224
$480000
$500000
$520000
$540000
$560000
$580000
$600000
FY 2013 FY 2014 FY 2015 FY 2016 FY 2017
Operating Costs
97 92 84 79
00
20
40
60
80
100
120
140
FY 2013 FY 2014 FY 2015 FY 2016 FY 2017
Passengers per Revenue Hour
$851 $828 $931
$1045
$000$200$400$600$800
$1000$1200$1400
FY 2013 FY 2014 FY 2015 FY 2016 FY 2017
Subsidy per Passenger
$9121 $8656 $8961 $9250
$0
$50
$100
$150
$200
FY 2013 FY 2014 FY 2015 FY 2016 FY 2017
Cost per Revenue Hour
228Local Connector
Days of Service Wkdy Sa SuAvg Freq (Wkdy Peak) 60 min
Avg Freq (Wkdy Non-Peak) 60 minAvg Freq (Wked) 60 min
FY 2017 Farebox Recovery 11 transfer (to route) 17
Clipper usage 15
Annual Avg Monthly Avg Daily Annual Avg Monthly Avg Daily Annual Avg Monthly Avg DailyWeekday 57316 4776 227 7175 598 28 65884 5490 260 Saturday 8218 685 158 1331 111 26 13020 1085 250 Sunday 5806 484 97 1536 128 26 15023 1252 250
Total 71340 5945 195 10042 837 28 93926 7827 257
Annual Avg Monthly Avg Daily Annual Avg Monthly Avg Daily Annual Avg Monthly Avg DailyWeekday $646194 $53850 $2554 $80857 $6738 $320 $565337 $47111 $2235Saturday $120205 $10017 $2312 $12568 $1047 $242 $107637 $8970 $2070Sunday $138407 $11534 $2307 $10487 $874 $175 $127920 $10660 $2132
Total $904806 $75401 $2479 $103912 $8659 $285 $800894 $66741 $2194
Passengers per Revenue Hour
Subsidy per Passenger
Cost per Revenue Hour
Farebox Recovery
Weekday 80 $986 $9006 125Saturday 62 $1310 $9030 105Sunday 38 $2203 $9011 76
Total 71 $1123 $9010 115
Passengers Revenue Hours Operating CostsPassenger
RevenueOperating Subsidy
Passengers per Revenue Hour
Subsidy per Passenger
Cost per Revenue Hour
Farebox Recovery
FY 2015 15287 2828 $239879 $18274 $221605 54 $1450 $8482 76FY 2016 17522 3185 $280634 $28092 $252542 55 $1441 $8812 100FY 2017 71340 10042 $904806 $103912 $800894 71 $1123 $9010 115
Histo
ric Tr
ends
FY 20
161
7 DAT
A
Passengers Revenue Hours Revenue Miles
Operating Costs Passenger Revenue Operating Subsidy
5854 15287 17522
71340
01000020000300004000050000600007000080000
FY 2013 FY 2014 FY 2015 FY 2016 FY 2017
Passengers
970
2828 3185
10042
0
2000
4000
6000
8000
10000
12000
FY 2013 FY 2014 FY 2015 FY 2016 FY 2017
Revenue Hours
$85183
$239879 $280634
$904806
$0
$200000
$400000
$600000
$800000
$1000000
FY 2013 FY 2014 FY 2015 FY 2016 FY 2017
Operating Costs
60 54 55 71
00
20
40
60
80
100
120
140
FY 2013 FY 2014 FY 2015 FY 2016 FY 2017
Passengers per Revenue Hour$1358
$1450 $1441
$1123
$000$200$400$600$800
$1000$1200$1400
FY 2013 FY 2014 FY 2015 FY 2016 FY 2017
Subsidy per Passenger
$8779 $8482 $8812 $9010
$0
$50
$100
$150
$200
FY 2013 FY 2014 FY 2015 FY 2016 FY 2017
Cost per Revenue Hour
233Local Connector
Days of Service Wkdy Sa SuAvg Freq (Wkdy Peak) 60 min
Avg Freq (Wkdy Non-Peak) 60 minAvg Freq (Wked) 60 min
FY 2017 Farebox Recovery 13 transfer (to route) 16
Clipper usage 10
Annual Avg Monthly Avg Daily Annual Avg Monthly Avg Daily Annual Avg Monthly Avg DailyWeekday 35589 2966 141 3306 276 13 38809 3234 153 Saturday 3911 326 75 490 41 9 5829 486 112 Sunday 3298 275 55 566 47 9 6726 561 112
Total 42798 3567 117 4363 364 12 51364 4280 141
Annual Avg Monthly Avg Daily Annual Avg Monthly Avg Daily Annual Avg Monthly Avg DailyWeekday $302758 $25230 $1197 $42450 $3538 $168 $260308 $21692 $1029Saturday $44829 $3736 $862 $5018 $418 $97 $39811 $3318 $766Sunday $51616 $4301 $860 $4533 $378 $76 $47083 $3924 $785
Total $399203 $33267 $1094 $52001 $4333 $142 $347202 $28934 $951
Passengers per Revenue Hour
Subsidy per Passenger
Cost per Revenue Hour
Farebox Recovery
Weekday 108 $731 $9158 140Saturday 80 $1018 $9141 112Sunday 58 $1428 $9118 88
Total 98 $811 $9151 130
Passengers Revenue Hours Operating CostsPassenger
RevenueOperating Subsidy
Passengers per Revenue Hour
Subsidy per Passenger
Cost per Revenue Hour
Farebox Recovery
FY 2015 50342 4366 $371602 $52526 $319076 115 $634 $8512 141FY 2016 49494 4384 $388005 $59296 $328709 113 $664 $8851 153FY 2017 42798 4363 $399203 $52001 $347202 98 $811 $9151 130
Histo
ric Tr
ends
FY 20
161
7 DAT
A
Passengers Revenue Hours Revenue Miles
Operating Costs Passenger Revenue Operating Subsidy
39956
50422 50342 49494 42798
0
10000
20000
30000
40000
50000
60000
FY 2013 FY 2014 FY 2015 FY 2016 FY 2017
Passengers
3981
4144
4366 4384 4363
370038003900400041004200430044004500
FY 2013 FY 2014 FY 2015 FY 2016 FY 2017
Revenue Hours
$350499
$378792 $371602
$388005 $399203
$320000$330000$340000$350000$360000$370000$380000$390000$400000$410000
FY 2013 FY 2014 FY 2015 FY 2016 FY 2017
Operating Costs
100
122 115 113 98
00
20
40
60
80
100
120
140
FY 2013 FY 2014 FY 2015 FY 2016 FY 2017
Passengers per Revenue Hour
$760 $661 $634 $664
$811
$000$200$400$600$800
$1000$1200$1400
FY 2013 FY 2014 FY 2015 FY 2016 FY 2017
Subsidy per Passenger
$8805 $9142 $8512 $8851 $9151
$0
$50
$100
$150
$200
FY 2013 FY 2014 FY 2015 FY 2016 FY 2017
Cost per Revenue Hour
245Local Connector
Days of Service Wkdy Sa SuAvg Freq (Wkdy Peak) 60 min
Avg Freq (Wkdy Non-Peak) 60 minAvg Freq (Wked) 60 min
FY 2017 Farebox Recovery 15 transfer (to route) 13
Clipper usage 13
Annual Avg Monthly Avg Daily Annual Avg Monthly Avg Daily Annual Avg Monthly Avg DailyWeekday 41761 3480 165 3014 251 12 28706 2392 113 Saturday 4220 352 81 620 52 12 5778 482 111 Sunday 3785 315 63 715 60 12 6667 556 111
Total 49766 4147 136 4349 362 12 41152 3429 113
Annual Avg Monthly Avg Daily Annual Avg Monthly Avg Daily Annual Avg Monthly Avg DailyWeekday $271762 $22647 $1074 $44873 $3739 $177 $226889 $18907 $897Saturday $55697 $4641 $1071 $6217 $518 $120 $49480 $4123 $952Sunday $64137 $5345 $1069 $5878 $490 $98 $58259 $4855 $971
Total $391596 $32633 $1073 $56968 $4747 $156 $334628 $27886 $917
Passengers per Revenue Hour
Subsidy per Passenger
Cost per Revenue Hour
Farebox Recovery
Weekday 139 $543 $9016 165Saturday 68 $1173 $8988 112Sunday 53 $1539 $8970 92
Total 114 $672 $9004 145
Passengers Revenue Hours Operating CostsPassenger
RevenueOperating Subsidy
Passengers per Revenue Hour
Subsidy per Passenger
Cost per Revenue Hour
Farebox Recovery
FY 2015FY 2016 2184 227 $19695 $3137 $16558 96 $758 $8695 159FY 2017 49766 4349 $391596 $56968 $334628 114 $672 $9004 145
Histo
ric Tr
ends
FY 20
161
7 DAT
A
Passengers Revenue Hours Revenue Miles
Operating Costs Passenger Revenue Operating Subsidy
2184
49766
0
10000
20000
30000
40000
50000
60000
FY 2013 FY 2014 FY 2015 FY 2016 FY 2017
Passengers
227
4349
0
1000
2000
3000
4000
5000
FY 2013 FY 2014 FY 2015 FY 2016 FY 2017
Revenue Hours
$19695
$391596
$0
$100000
$200000
$300000
$400000
$500000
FY 2013 FY 2014 FY 2015 FY 2016 FY 2017
Operating Costs
96 114
00
20
40
60
80
100
120
140
FY 2013 FY 2014 FY 2015 FY 2016 FY 2017
Passengers per Revenue Hour
$758 $672
$000$200$400$600$800
$1000$1200$1400
FY 2013 FY 2014 FY 2015 FY 2016 FY 2017
Subsidy per Passenger
$8695 $9004
$0
$50
$100
$150
$200
FY 2013 FY 2014 FY 2015 FY 2016 FY 2017
Cost per Revenue Hour
251Local Connector
Days of Service Wkdy Sa SuAvg Freq (Wkdy Peak) 60 min
Avg Freq (Wkdy Non-Peak) 60 minAvg Freq (Wked) 60 min
FY 2017 Farebox Recovery 11 transfer (to route) 8
Clipper usage 8
Annual Avg Monthly Avg Daily Annual Avg Monthly Avg Daily Annual Avg Monthly Avg DailyWeekday 76675 6390 303 6754 563 27 95654 7971 378 Saturday 9952 829 191 1325 110 25 18630 1553 358 Sunday 8879 740 148 1528 127 25 21497 1791 358
Total 95506 7959 262 9607 801 26 135781 11315 372
Annual Avg Monthly Avg Daily Annual Avg Monthly Avg Daily Annual Avg Monthly Avg DailyWeekday $625542 $52129 $2472 $78006 $6501 $308 $547536 $45628 $2164Saturday $122485 $10207 $2355 $12104 $1009 $233 $110381 $9198 $2123Sunday $140992 $11749 $2350 $11713 $976 $195 $129279 $10773 $2155
Total $889019 $74085 $2436 $101823 $8485 $279 $787196 $65600 $2157
Passengers per Revenue Hour
Subsidy per Passenger
Cost per Revenue Hour
Farebox Recovery
Weekday 114 $714 $9262 125Saturday 75 $1109 $9246 99Sunday 58 $1456 $9225 83
Total 99 $824 $9254 115
Passengers Revenue Hours Operating CostsPassenger
RevenueOperating Subsidy
Passengers per Revenue Hour
Subsidy per Passenger
Cost per Revenue Hour
Farebox Recovery
FY 2015 97647 9172 $800242 $103081 $697161 106 $714 $8725 129FY 2016 98886 9226 $831623 $120959 $710664 107 $719 $9014 145FY 2017 95506 9607 $889019 $101823 $787196 99 $824 $9254 115
Histo
ric Tr
ends
FY 20
161
7 DAT
A
Passengers Revenue Hours Revenue Miles
Operating Costs Passenger Revenue Operating Subsidy
87073
97647 98886
95506
80000
85000
90000
95000
100000
FY 2013 FY 2014 FY 2015 FY 2016 FY 2017
Passengers
8322
9172 9226
9607
7500
8000
8500
9000
9500
10000
FY 2013 FY 2014 FY 2015 FY 2016 FY 2017
Revenue Hours
$772570
$800242
$831623
$889019
$700000
$750000
$800000
$850000
$900000
FY 2013 FY 2014 FY 2015 FY 2016 FY 2017
Operating Costs
105 106 107 99
00
20
40
60
80
100
120
140
FY 2013 FY 2014 FY 2015 FY 2016 FY 2017
Passengers per Revenue Hour
$797 $714 $719
$824
$000$200$400$600$800
$1000$1200$1400
FY 2013 FY 2014 FY 2015 FY 2016 FY 2017
Subsidy per Passenger
$9284 $8725 $9014 $9254
$0
$50
$100
$150
$200
FY 2013 FY 2014 FY 2015 FY 2016 FY 2017
Cost per Revenue Hour
257Local Connector
Days of Service WkdyAvg Freq (Wkdy Peak) 60 min
Avg Freq (Wkdy Non-Peak) 60 minAvg Freq (Wked) -
FY 2017 Farebox Recovery 12 transfer (to route) 6
Clipper usage 13
Annual Avg Monthly Avg Daily Annual Avg Monthly Avg Daily Annual Avg Monthly Avg DailyWeekday 69126 5761 273 7643 637 30 85748 7146 339 Saturday - - - - - - - - - Sunday - - - - - - - - -
Total 69126 5761 273 7643 637 30 85748 7146 339
Annual Avg Monthly Avg Daily Annual Avg Monthly Avg Daily Annual Avg Monthly Avg DailyWeekday $697953 $58163 $2759 $82621 $6885 $327 $615332 $51278 $2432Saturday $ - $ - $ - $ - $ - $ - $ - $ - $ -Sunday $ - $ - $ - $ - $ - $ - $ - $ - $ -
Total $697953 $58163 $2759 $82621 $6885 $327 $615332 $51278 $2432
Passengers per Revenue Hour
Subsidy per Passenger
Cost per Revenue Hour
Farebox Recovery
Weekday 90 $890 $9132 118Saturday - $ - $ - - Sunday - $ - $ - -
Total 90 $890 $9132 118
Passengers Revenue Hours Operating CostsPassenger
RevenueOperating Subsidy
Passengers per Revenue Hour
Subsidy per Passenger
Cost per Revenue Hour
Farebox Recovery
FY 2015 69984 6289 $546363 $73402 $472961 111 $676 $8687 134FY 2016 71429 6414 $575805 $83288 $492517 111 $690 $8977 145FY 2017 69126 7643 $697953 $82621 $615332 90 $890 $9132 118
Histo
ric Tr
ends
FY 20
161
7 DAT
A
Passengers Revenue Hours Revenue Miles
Operating Costs Passenger Revenue Operating Subsidy
35511
68515 69984 71429 69126
01000020000300004000050000600007000080000
FY 2013 FY 2014 FY 2015 FY 2016 FY 2017
Passengers
2909
5965 6289 6414 7643
0
2000
4000
6000
8000
10000
FY 2013 FY 2014 FY 2015 FY 2016 FY 2017
Revenue Hours
$263500
$555608 $546363 $575805
$697953
$0$100000$200000$300000$400000$500000$600000$700000$800000
FY 2013 FY 2014 FY 2015 FY 2016 FY 2017
Operating Costs
122 115 111 111
90
00
20
40
60
80
100
120
140
FY 2013 FY 2014 FY 2015 FY 2016 FY 2017
Passengers per Revenue Hour
$625 $721 $676 $690
$890
$000$200$400$600$800
$1000$1200$1400
FY 2013 FY 2014 FY 2015 FY 2016 FY 2017
Subsidy per Passenger
$9057 $9315 $8687 $8977 $9132
$0
$50
$100
$150
$200
FY 2013 FY 2014 FY 2015 FY 2016 FY 2017
Cost per Revenue Hour
Hdn ValleyYellow Bus
Days of Service School DaysAvg Freq (Wkdy Peak) 2 trips
Avg Freq (Wkdy Non-Peak) -Avg Freq (Wked) -
FY 2017 Farebox Recovery 26 transfer (to route) -
Clipper usage -
Annual Avg Monthly Avg Daily Annual Avg Monthly Avg Daily Annual Avg Monthly Avg DailyWeekday 9281 844 52 180 16 1 1638 149 9 Saturday - - - - - - - - - Sunday - - - - - - - - -
Total 9281 844 52 180 16 1 1638 149 9
Annual Avg Monthly Avg Daily Annual Avg Monthly Avg Daily Annual Avg Monthly Avg DailyWeekday $124763 $11342 $693 $32170 $2925 $179 $92593 $8418 $514Saturday $ - $ - $ - $ - $ - $ - $ - $ - $ -Sunday $ - $ - $ - $ - $ - $ - $ - $ - $ -
Total $124763 $11342 $693 $32170 $2925 $179 $92593 $8418 $514
Passengers per Revenue Hour
Subsidy per Passenger
Cost per Revenue Hour
Farebox Recovery
Weekday 516 $998 $69313 258Saturday - $ - $ - - Sunday - $ - $ - -
Total 516 $998 $69313 258
Passengers Revenue Hours Operating CostsPassenger
RevenueOperating Subsidy
Passengers per Revenue Hour
Subsidy per Passenger
Cost per Revenue Hour
Farebox Recovery
FY 2015FY 2016 8669 211 $140482 $25658 $114824 412 $1325 $66706 183FY 2017 9281 180 $124763 $32170 $92593 516 $998 $69313 258
Histo
ric Tr
ends
FY 20
161
7 DAT
A
Passengers Revenue Hours Revenue Miles
Operating Costs Passenger Revenue Operating Subsidy
8669 9281
0
2000
4000
6000
8000
10000
FY 2013 FY 2014 FY 2015 FY 2016 FY 2017
Passengers211
180
0
50
100
150
200
250
FY 2013 FY 2014 FY 2015 FY 2016 FY 2017
Revenue Hours$140482
$124763
$0$20000$40000$60000$80000
$100000$120000$140000$160000
FY 2013 FY 2014 FY 2015 FY 2016 FY 2017
Operating Costs
412 516
00
500
1000
1500
2000
FY 2013 FY 2014 FY 2015 FY 2016 FY 2017
Passengers per Revenue Hour
$1325
$998
$000
$200
$400
$600
$800
$1000
$1200
$1400
FY 2013 FY 2014 FY 2015 FY 2016 FY 2017
Subsidy per Passenger
$66706 $69313
$0$100$200$300$400$500$600$700$800
FY 2013 FY 2014 FY 2015 FY 2016 FY 2017
Cost per Revenue Hour
White HillYellow Bus
Days of Service School DaysAvg Freq (Wkdy Peak) 17 trips
Avg Freq (Wkdy Non-Peak) -Avg Freq (Wked) -
FY 2017 Farebox Recovery 60 transfer (to route) -
Clipper usage -
Annual Avg Monthly Avg Daily Annual Avg Monthly Avg Daily Annual Avg Monthly Avg DailyWeekday 127219 11565 707 1065 97 6 12096 1100 67 Saturday - - - - - - - - - Sunday - - - - - - - - -
Total 127219 11565 707 1065 97 6 12096 1100 67
Annual Avg Monthly Avg Daily Annual Avg Monthly Avg Daily Annual Avg Monthly Avg DailyWeekday $738585 $67144 $4103 $440896 $40081 $2449 $297689 $27063 $1654Saturday $ - $ - $ - $ - $ - $ - $ - $ - $ -Sunday $ - $ - $ - $ - $ - $ - $ - $ - $ -
Total $738585 $67144 $4103 $440896 $40081 $2449 $297689 $27063 $1654
Passengers per Revenue Hour
Subsidy per Passenger
Cost per Revenue Hour
Farebox Recovery
Weekday 1194 $234 $69325 597Saturday - $ - $ - - Sunday - $ - $ - -
Total 1194 $234 $69325 597
Passengers Revenue Hours Operating CostsPassenger
RevenueOperating Subsidy
Passengers per Revenue Hour
Subsidy per Passenger
Cost per Revenue Hour
Farebox Recovery
FY 2015FY 2016 129635 870 $579937 $385753 $194184 1491 $150 $66698 665FY 2017 127219 1065 $738585 $440896 $297689 1194 $234 $69325 597
Histo
ric Tr
ends
FY 20
161
7 DAT
A
Passengers Revenue Hours Revenue Miles
Operating Costs Passenger Revenue Operating Subsidy
129635 127219
0
20000
40000
60000
80000
100000
120000
140000
FY 2013 FY 2014 FY 2015 FY 2016 FY 2017
Passengers
870
1065
0
200
400
600
800
1000
1200
FY 2013 FY 2014 FY 2015 FY 2016 FY 2017
Revenue Hours
$579937
$738585
$0$100000$200000$300000$400000$500000$600000$700000$800000
FY 2013 FY 2014 FY 2015 FY 2016 FY 2017
Operating Costs
1491
1194
00200400600800
1000120014001600
FY 2013 FY 2014 FY 2015 FY 2016 FY 2017
Passengers per Revenue Hour
$150 $234
$000
$200
$400
$600
$800
$1000
$1200
$1400
FY 2013 FY 2014 FY 2015 FY 2016 FY 2017
Subsidy per Passenger$66698 $69325
$0$100$200$300$400$500$600$700$800
FY 2013 FY 2014 FY 2015 FY 2016 FY 2017
Cost per Revenue Hour
MARIN TRANSIT | 2018ndash2027 SHORT RANGE TRANSIT PLAN Chapter 4 Capital Plan
DRAFT 4-9
Table 4-7 Local Transit Bus Replacement Schedule
Fiscal Year (In-service)
Replacements
Total Cost
Local Share Vehicle Type Seating
Capacity Service(1)
FY 201718 10 $7710000 $1387800 40ft hybrid 39 LB
2 $1662000 $332404 35ft Electric 32 LB
FY 201819
1 $125000 $22500 24ft 20 SH
4 $1600000 $1094880 29ft XHF
(upgrade) 22 SG
FY 201920 10 $8940000 $1609200 60ft 63 LB
FY 202021 8 $1032000 $185760 24ft 20 SH
2 $850000 $153000 35ft XHF 37 MW
FY 202223
7 $5584578 $1005224 35ft hybrid 32 LB
2 $874182 $599281 29ft XHF
(upgrade) 22 SG
FY 202425 3 $1393227 $250781 35ft XHF 37 MW
FY 202526 2 $299093 $53837 24ft 20 SH
5 $2391706 $430507 35ft XHF 37 MW
FY 202627 - - - - - -
Notes (1) Service Types LB ndash Big Bus SH- Shuttle SG- Rural Stagecoach MW- Seasonal Muir Woods and School
Expansion Needs When considering service expansion vehicles are often a constraint on the amount of service that can be added Expansion vehicles are a lower priority in the regional capital plan and typically do not receive federal funds Local state or discretionary grants are required to expand fleets The capital plan does not include any expansion vehicles for the local fixed route program consistent with the current service plan
Marin Transit relies on three retired active vehicles to support operations Retired active vehicles are vehicles that are beyond their FTA-determined useful life that remain in service while their replacements are added the fleet The District intends to replace these as expansion vehicles if funding becomes available
Demand Response Vehicles
Marin Transit has 58 vehicles available for local and regional paratransit service To provide an adequate number of spare vehicles a maximum of about 46 vehicles in service Marin Transit owns 32 vehicles GGBHTD owns 14 and the contractor provides another 13 vehicles to support the operations Eleven of the 13 contractor vehicles will be replaced in early 2018 - five by the District and six by GGBHTD Two of the five replaced by the District will be replaced with smaller accessible vans These will be used for same day
Fixed-Route Passengers (incl Yellow Bus) by Month
July August September October November December January February March April May June
Prior Fiscal Year Passengers Current Fiscal Year PassengersPrior Fiscal Year Passengers Current Fiscal Year Passengers
0
80000
160000
240000
320000
244439
271284484271284
296637296637
2768532276853
252829252829
238010238010
219681219681
2097050505209705
277644277644
240773240773240773240773
284816284816
24935149492493512444392444392442 43999244439244244439439244439244244439999999244200
2600562602600 0000000260056
FISCAL YEAR
2018
Demand Response Passengers by Month
July August September October November December January February March April May June
Prior Fiscal Year Passengers Current Fiscal Year PassengersPrior Fiscal Year Passengers Current Fiscal Year Passengers
0
4000
8000
12000
16000
12 77312773
13631 1362813628 1356413564
1247712477
1206712067 1212412124118100011810
1364613646
1260912609
1359313593
12950129501277312 77312 77312 77312613131612 6133312 6133312613331277312773127731277312613
13 6311363113 631135641363113 613631311363113 6136313113564
Year-to-Date Ridership Trends
Item 3b
2
Average Systemwide Daily Passengers
Weekday Saturday Sunday
Prior Fiscal Year Average Daily Passengers Current Fiscal Year Average Daily PassengersPrior Fiscal Year Average Daily Passengers Current Fiscal Year Average Daily Passengers
0
3000
6000
9000
12000
11370113701109811098
7726772674407440
66576657
60556055
Productivity (paxhr) by Typology
1 Local T
runklin
e
2 Local B
asic
3 Local C
onnecto
r
5 R
ura
l
8 R
ecre
ational
9 D
em
and R
esponse
Prior Fiscal Year Productivity Current Fiscal Year ProductivityPrior Fiscal Year Productivity Current Fiscal Year Productivity
00
80
160
240
320
249249 252252
163163
14814 8148
9292 91918181
757 575
320320
275275
2323 2121
Monthly StatisticsMONTH
August
1 Local Trunkline Routes 35 36 71X
2 Local Basic Routes 17 22 23 23X 29 49
3 Local Connector Routes 219 228 233 245 251 257
5 Rural Routes 61 68
8 Recreational Routes 6666F
9 Demand Response Local Paratransit Novato Dial-A-Ride Rural Dial-A-Ride
Route Typologies
Item 3b
3
Fixed-Route Passengers (incl Yellow Bus) by Month
July August September October November December January February March April May June
Prior Fiscal Year Passengers Current Fiscal Year Passengers
0
80000
160000
240000
320000
244439244439
271284271284
296637296637
276853276853
252829252829
238010238010
219681219681209705209705
277644277644
240773240773
284816284816
249351249351244200244200
260056260056
282441282441
FISCAL YEAR
2018
Demand Response Passengers by Month
July August September October November December January February March April May June
Prior Fiscal Year Passengers Current Fiscal Year Passengers
0
4000
8000
12000
16000
1277312773
1363113631 1362813628 1356413564
12477124771206712067 1212412124
1181011810
1364613646
1260912609
1359313593
12950129501261312613
1356413564 1342713427
Year-to-Date Ridership Trends
Monthly Monitoring Report 11022017
Page 12Item 3b
2
Average Systemwide Daily Passengers
Weekday Saturday Sunday
Prior Fiscal Year Average Daily Passengers Current Fiscal Year Average Daily Passengers
0
3000
6000
9000
12000 11848118481161311613
73637363
67876787
6126612657395739
Productivity (paxhr) by Typology
1 L
ocal
Tru
nklin
e
2 L
ocal
Bas
ic
3 L
ocal
Con
nect
or
5 R
ural
8 R
ecre
atio
nal
9 D
eman
d R
espo
nse
Prior Fiscal Year Productivity Current Fiscal Year Productivity
00
80
160
240
320
278278 274274
174174 168168
9898 9797
7676 7676
304304
222222
2323 2222
Monthly StatisticsMONTH
September
1 Local Trunkline Routes 35 36 71X
2 Local Basic Routes 17 22 23 23X 29 49
3 Local Connector Routes 219 228 233 245 251 257
5 Rural Routes 61 68
8 Recreational Routes 6666F
9 Demand Response Local Paratransit Novato Dial-A-Ride Rural Dial-A-Ride
Route Typologies
Page 22Item 3b
3
Fixed-Route Passengers (incl Yellow Bus) by Month
July August September October November December January February March April May June
Prior Fiscal Year Passengers Current Fiscal Year Passengers
0
80000
160000
240000
320000
244439244439
271284271284
296637296637
276853276853
252829252829
238010238010
219681219681209705209705
277644277644
240773240773
284816284816
249351249351244200244200
260056260056
282441282441 282922282922
FISCAL YEAR
2018
Demand Response Passengers by Month
July August September October November December January February March April May June
Prior Fiscal Year Passengers Current Fiscal Year Passengers
0
4000
8000
12000
16000
1277312773
1363113631 1362813628 1356413564
12477124771206712067 1212412124
1181011810
1364613646
1260912609
1359313593
12950129501261312613
1356413564 13427134271373413734
Year-to-Date Ridership Trends
Monthly Monitoring Report 12082017
Page 12Item 3b
2
Average Systemwide Daily Passengers
Weekday Saturday Sunday
Prior Fiscal Year Average Daily Passengers Current Fiscal Year Average Daily Passengers
0
3000
6000
9000
120001125811258 1115111151
6043604364326432
4717471750675067
Productivity (paxhr) by Typology
1 L
ocal
Tru
nklin
e
2 L
ocal
Bas
ic
3 L
ocal
Con
nect
or
5 R
ural
8 R
ecre
atio
nal
9 D
eman
d R
espo
nse
Prior Fiscal Year Productivity Current Fiscal Year Productivity
00
70
140
210
280258258
270270
163163 161161
9696 9595
6363 7070
202202190190
2323 2121
Monthly StatisticsMONTH
October
1 Local Trunkline Routes 35 36 71X
2 Local Basic Routes 17 22 23 23X 29 49
3 Local Connector Routes 219 228 233 245 251 257
5 Rural Routes 61 68
8 Recreational Routes 6666F
9 Demand Response Local Paratransit Novato Dial-A-Ride Rural Dial-A-Ride
Route Typologies
Page 22Item 3b
3
- RFP - OampM for Fixed Route Service - Addendum 3 12-18-2017
- MV Fee Schedule
- Airporter Fee Schedule
- FY2017Performance
-
- System Performance Summary for FY 201617
-
- Fixed Route
- Yellow Bus
- Demand Response
- Other Services
-
- Performance Goals
- Ridership Trends
- FY 201718 Performance Outlook
-
- Attachment A Route Profiles
-
- Local Transit Bus Replacement Schedule
- August 2017 Monthly Monitoring Report
- September 2017 Monthly Monitoring Report
- October 2017 Monthly Monitoring Report
-
Addendum 3
5
Q27 What liquidated damages were assessed if any to the current contractor for Package 1 A27 None There were no liquidated damages or performance penalties assessed for the current contractor of Package 1 The District maintains the right to assess performance penalties based on the Contractorrsquos failure to meet the established standards and any additional requirements by the District Q28 On page 13 in section 10 Intelligent Transportation Technology Plan (5 pts) does Marin Transit wish for bidders to re-alphabetize a) through e) or is it easier to keep the aabc d e format A28 Proposers should present their Intelligent Transportation Technology Plan ensuring that each required element is addressed Q29 On page 12 of the RFP section 6 Mobilization Plan (5 pts) section a) Project Schedule the last word is ldquoIncluderdquohellip was there more to this section or is it eluding to section 7 Facility A29 No The word ldquoIncluderdquo is a typographical error and should be eliminated Q30 Please confirm that bidders are required to include letters of intent for the facility(ies) proposed in their submittal A30 Refer to the RFP Section 2 ndash Terms and Conditions Proposal Requirements Facility Section Q31 With regard to section 3 Corporate Capacity Experience Past Performance can you please clarify this requirement Is the District requesting bidders to demonstrate 10 years of experience with similar systems and then to also identify contracts that have been in operation for 5 consecutive years as references A31 Proposers must provide a history of their company for the past 10 years and highlight 5 of those years where service was provided continuously and was similar in scope size and complexity to the service being proposed Q32 Attachment B Equipment Summary Would Marin Transit please provide the vehicle types that are intended to replace the vehicles noted in this attachment A32 Yes See the Local Transit Bus Replacement Schedule from the Draft 2018-2017 Short Range Transit Plan for Package 1 and Package 2 services in the attachment to
Addendum 3
6
Addendum 3 It is anticipated that vehicles will be replaced with vehicles that are similar to what is being operated today but is subject to change at Marin Transitrsquos discretion Q33 Page 13 Item 10 Information Technology Plan Is the contractor responsible for the cost and maintenance of all electric maintenance components in this section ie GFI Radios passenger counters MDTrsquos and other components A33 The Intelligent Transportation Technology equipment consists mostly of onboard equipment (ie GFI fareboxes MDTrsquos cameras etc) and will be provided by Marin Transit as described in Section 1 ndash General Information Onboard Equipment (Intelligent Transportation Technology) of the RFP Contractors are responsible for repairs preventive maintenance and maintaining spare parts associated with this equipment as outlined in the Operations Responsibilities and Maintenance Responsibilities sections of the RFP Marin Transit will provide an initial inventory of spare parts (excluding major vehicle parts such as engines or transmissions etc) but the Contractor will be responsible for ensuring that any spare parts that are swapped out or used are immediately replaced in order to maintain an adequate spare parts inventory Most of the onboard equipment has an initial warranty associated with failure of hardware Q34 Please provide the total annual miles operated for each package A34 See annual miles for each route in the attachment to Addendum 3 Q35 What is the current spare ratio for each service provided A35 Services in Package 1 and Package 2 currently differ than what is operated today Currently Package 1 contains one vehicle that is not owned by Marin Transit Package 1 services have a weekday spare ratio of 17 percent and 61 percent on the weekend Package 2 currently has a weekday spare ratio of 38 percent weekday during non-school days is 50 percent weekend peakpeak at 21 percent weekend peakoff peak of 38 percent and weekend off peakoff peak at 46 percent It is projected that Package 1 will have a weekday spare ratio of 17 percent and a weekend spare ratio of 52 percent Package 2 is projected to have a weekday spare ratio of 21 percent weekday (non-school days) is 58 percent weekend peakpeak of 11 percent weekend peakoff-peak of 35 percent and weekend off peakoff peak at 48 percent Q36 Will Marin Transit be responsible for the cost of battery packs for all of the hybrid vehicles
Addendum 3
7
A36 Yes Marin Transit would consider hybrid vehicle battery pack replacement as an Unforeseen Major Repair an assume the cost to refresh or replace the battery packs per Maintenance Responsibilities Section of the RFP Q37 Page 28 Section 3 Are the DPF filters considered a major component that Marin Transit will be responsible for covering the cost for A37 DPF filters are not considered a major component and Marin Transit will not be responsible for covering the costs for providing or replacing DPF filters Q38 Section 405d Auto Physical Damage ndash Transportation providers to maintain a higher deductible than the $50K for each loss noted in this section would Marin Transit modify this section to remove the deductible limitation A38 No The referenced draft contract language requires that ldquoDeductibles shall not exceed $50000 for each lossrdquo Q39 Section 405i Certified Copies of Policies ndash It typically takes insurance companies around 30 days after policy expiration before a new policy is issued As an alternative would Marin Transit please modify this section to state that the replacement policy or binder shall be furnished 5 days after expiration A39 Marin Transitrsquos primary concern is that there not be a gap in insurance coverage whether for new or replacement policies during the term of an awarded contract and will not modify this language beyond the expiration date of a policy Q40 Section 405j MCTD Purchase of Insurance ndash As an alternative to the current language would Marin Transit modify this section to provide that Marin Transitrsquos recourse for failure to comply with the insurance requirements be cancellation of the contract A40 No Marin Transit reserves to right terminate its contracts for convenience This provision ensures that insurance coverage is always in place Q41 Page 18 Draft Contract Item b Dedication to Project vs Page 11 Item 4 A) Summary of Key Personnel The language in these sections seems to conflict Please confirm it is acceptable to share key personnel with other projects as long as the percentage of time dedicated to this project is clearly identified A41 Personnel can be shared Of the key personnel the General Manager Operations Manager Maintenance Manager are to be full time positions and the Operations Manager and Maintenance Manager are to be located on-site Proposers must indicate if key personnel and non-key personnel (ie mechanics dispatchers road supervisors) will be shared on other projects and the percentage of time that will be
Addendum 3
8
dedicated to Marin Transit contract(s) Refer to Attachment I ndash Draft Operations and Maintenance Contract Article 2 ndash Personnel Requirements Sec 201 General Requirements for Contractor Personnel Dedication to Project Q42 Page 14 Item 13 Employee Training Please confirm whether CPR and First Aid training is a new requirement A42 No Proposers are being asked to present their initial training program for operators ldquoto Include any certifications and licensing to be included along with the initial training (CPR First Aid Class B etc)rdquo as referred to in the RFP Section 2 ndash Terms and Conditions Proposal Requirements Employee Training Q43 Page 28 Unforeseen Major Repairs Would Marin Transit identify a dollar amount such as $2000 for single maintenance items that would classify an item as an unforeseen major repair Marin Transit would be responsible for the cost of There are various parts on the fleet vehicles that exceed the cost of a transmission rebuild for example A43 No Q44 Page 8 Draft Contract b Facilities ii Would Marin Transit please remove this language from the RFP and Draft Contract Proposerrsquos are not able to require a landlord to consent to assignment of a property lease A44 No Proposerrsquos are encouraged to work closely with property managers agents or owners on how best to address this requirement Q45 Page 7 Radio Communications For package 2 services should bidders account for two-way radios vs push to talk devices due to the service area and poor cell phone reception A45 Package 1 and 2 proposers should provide a radio communication system that meets the service requirements outlined in the RFP Proposers are encouraged to obtain signal coverage area maps to include with their proposed systems that minimize or eliminate ldquodead spotsrdquo Q46 Draft Contract sect104E TermRenewal Options Please revise to require mutual agreement for any extension of the Agreement with pricing to be negotiated by the parties in order to allow for price adjustments to reflect changes in Contractorrsquos cost to operate the service A46 The RFP and contract address changes to Contractorrsquos cost to operate service though the two-tiered (variable hourly rate and monthly fixed cost) structure and the
Addendum 3
9
Possible Rate Adjustments contract provision (304f) The optional contract extension terms will not be made subject to renegotiation Q47 Draft Contract sect523 ndashAssignment Please delete ldquoAssignment provision extends to any purchase merger or consolidation change in control etcrdquo from the draft contract as a change in stockholders of a contractor shall not require consent or result in a default or termination of the Agreement A47 No This contract provision does not require consent for a change in a contractorrsquos stockholders but instead a change in contract assignment resulting from a change in stockholders Q48 Draft Contract sect408 ndashTermination ndash Would Marin Transit please consider modifying this requirement to provide a minimum of 60 daysrsquo notice of cancellation in order to provide the contractor with enough time to complete obligations required such as WARN Act lease terminations etc A48 No Marin Transit prefers the 30-day notice period Q49 Draft Contract sect406 ndash Indemnity Would Marin Transit please consider revising indemnification to limit the indemnity to actions or omissions of the Contractor or its employees agents subcontractors etc The Contractor should not be liable for items outside of its control A49 No Marin Transit is not considering a revision to the indemnification clause at this time Q50 General Draft Contract Would Marin Transit please add a force majeure provision to relieve both parties from performance under the Contract for circumstances beyond their reasonable control (acts of God war labor strikes or disputes terrorism etc) The contractor should be excused from performance under the contract for circumstances outside of its control A50 No See response for Q38 Q51 General Draft Contract Would Marin Transit include a provision that provides for price adjustments if Contractorrsquos revenue decreases or Contractorrsquos costs increase as a result of (i) changes to the scope of work service hours requested by the Authority (ii) changes in laws rules regulations etc applicable to the services to be provided by Contractor andor (iii) wage increases necessary for Contractor to be able to recruit and retain qualified employees as a result of an increase in the minimum wage in the County or surrounding jurisdictions If the parties are unable to agree on a rate adjustment then either party may terminate the contract upon 120 daysrsquo written notice to the other party Doing so would
Addendum 3
10
provide protection for the contractor to cover changes requested by the District or matters that were not contemplated at the time of Contractorrsquos proposal A51 No The RFP and contract address potential changes to scope of work changes in lawrulesregulations and requires proposers to consider wages and benefits to recruit and attract qualified employees without requiring contract price renegotiation
Attachments MV Transportation Fees and Payment Schedule (Revised November 20 2017)
Marin Airporter Fees and Payment Schedule (Revised November 20 2017) System Performance Summary for FY201617
August 2017 Monthly Monitoring Report September 2017 Monthly Monitoring Report October 2017 Monthly Monitoring Report Local Transit Bus Replacement Schedule
171801
EXHIBIT ldquoCrdquo
FEES AND PAYMENT SCHEDULE (revised)
Contractor shall bill Marin Transit monthly for service hours provided Additional hours shall only be used with approval from Marin Transit Proper back-up including TransTrack reports showing hours miles and fuel usage must be attached to invoices For Fiscal Year 1718 Contractor shall provide proof of wage increase (eg month over month payroll comparisons)
Service Cost per Service Hour
Contract Service Hours
Contract Maximum Obligation
Total year 1 January 30 2012 to December 31 2012 13881 $737832 Total year 2 January 1 2013 to December 31 2013 16686 $892890 Total year 3 January 1 2014 to December 31 2014 20913 $1297726 Total year 4 January 1 2015 to December 31 2015 27250 $1715566
Fixed Administrative Costs $277094 West Marin StagecoachMuir Woods Shuttle $3682 10750 $395815 Supplemental Service $6601 3750 $247538 Start-Up Costs $47571 First Half Year 5 January 1 2016 to June 30 2016 14500 $968018
Fixed Administrative Costs $975995 West Marin StagecoachMuir Woods Shuttle $4094 21500 $880210 Local Fixed Route $4094 14000 $573160 Supplemental Service $6814 7500 $511050 Fiscal Year 1617 July 1 2016 to June 30 2017 43000 $2940415
Fixed Administrative Costs1 $1137363 West Marin StagecoachMuir Woods Shuttle $4439 21500 $954455 Local Fixed Route $4439 14000 $621505 Supplemental Service $7018 7500 $526350 Fiscal Year 1718 July 1 2017 to June 30 2018 43000 $3239674
1 Includes the addition of one Road Supervisor position and one Level A Mechanic Contractor shall credit Marin Transit $5900 per month for the wage benefit and tax cost of the Level A Mechanic from July 1 2017 until the date of hire of this position
Item 10
404
asmith
Typewritten Text
MV Transportation
171830
EXHIBIT ldquoBrdquo
FEES AND PAYMENT SCHEDULE (revised)
Cost per Revenue Hour Community Shuttle Service
Base Years Option Years FY1314 FY1415 FY1516 FY1617 FY1718
Rate $7078 $6866 $7072 $7284 $7614 Maximum Revenue Hours 40000 40000 40000 60000 60000
In addition to payment of a cost per revenue hour District will directly reimburse Contractor for lease payments associated with storage of heavy duty transit buses beginning June 2016 Contractor must substantiate lease expense by providing District with a copy of the lease agreement In no event will lease payments exceed $1800 per month without written approval of District
Contractor to provide proof of wage increase (eg month over month payroll comparisons)
Item 11
410
asmith
Typewritten Text
Marin Airporter
asmith
Typewritten Text
asmith
Typewritten Text
1
System Performance Summary for FY 201617
This report summarizes the unaudited operational performance of Marin Transit local transit services for FY 201617 and compares these results to the Districtrsquos route level performance goals identified in the Short-Range Transit Plan The report provides a detailed route level assessment of all Marin Transit services operating in FY 201617 On June 12 2016 Marin Transit implemented a major service change with a 19 increase in local fixed-route service levels and a restructuring of routes throughout the County This FY 201617 report includes data from a full year of the new service plan There were a few additional changes to transit services during FY 201617 including the following In July 2016 the District launched a new general public dial-a-ride service between Point Reyes Station and Novato
The service provides curb-to-curb pick-up and drop-off and only operates on the second Monday of each month The closure of Hwy 1 in early 2017 delayed the start of the Muir Woods Shuttle season which typically begins in April
The Shuttle season began on May 13 resulting in 12 fewer days of service A number of recent changes to Marin Transitrsquos contracts and agreements have had an impact on the Districtrsquos financials These include the following The District completed a procurement for paratransit services in 2015 The new contract went into effect on January 1
2016 and provides significantly lower rates for paratransit and dial-a-ride services This report provides data from the first full year of the new contract
Effective February 1 2017 the District increased the subsidy paid to Catch-A-Ride service providers for operating wheelchair accessible vehicles to further incentivize the availability of accessible vehicles for Catch-A-Ride trips
For FY 201617 Marin Transit updated the methodology for calculating revenue hours for demand response services to be more consistent with the National Transit Database definitions These include local paratransit and the Novato Dial-A-Ride This change has reduced the amount of time that is considered as part of revenue hours Overall Marin Transit provided over 32 million unlinked passenger trips in FY 201617 with over 235000 revenue hours of service Compared to FY 201516 these numbers represent a decrease in unlinked passenger trips (-35) and an increase in revenue hours (+82) Growth in service was primarily on local fixed-route services due to the June 2016 changes Some of this growth was partially offset by decreases in hours on local paratransit and Route 122 The system-wide productivity rate was 136 riders per hour about 108 lower than FY 201617 Passenger revenues increased slightly (+06) Due to higher operating costs passenger subsidy increased by 127 to a system-wide average of $678 per passenger Fixed Route Fixed Route operations carried over 29 million unlinked passenger trips in FY 201617 with 178052 revenue hours These totals represent 91 of the Districtrsquos total trips and 76 of revenue hours Compared to FY 201516 unlinked passenger trips on fixed route services decreased by 35 and revenue hours increased by 136 Overall productivity was 164 passengers per hour approximately 150 lower than the 193 mark last fiscal year Compared to FY 201516 almost all fixed-route typologies experienced a decrease in overall ridership These include Local Basic (-120) Local Connector (-127) Supplemental (-32) and Partnership (-25) However some services experienced a modest increase in ridership compared to last year including Local Trunkline (+77) the Muir Woods Shuttle (+44) and Rural (+48)
2
Total passenger revenue decreased slightly (-11) in FY 201617 compared to last year Increases in operating costs resulted in a decrease in overall farebox recovery from 199 last year to 176 in FY 201617 Only the Local Trunkline and Recreational (Muir Woods Shuttle) typologies experienced an overall increase in both passenger revenue and farebox recovery Yellow Bus In FY 201617 yellow bus service for the Ross Valley School District carried over 136000 unlinked passenger trips a decrease of 13 compared to last year and operated 1245 revenue hours These totals represent 4 of the Districtrsquos total ridership and 1 of revenue hours Passenger revenues increased 150 due to higher pass prices This boost in revenues did not keep pace with the rise in operating costs and overall farebox recovery decreased from 571 last year to 548 in FY 201617 Demand Response Demand Response programs carried 124325 unlinked passenger trips in FY 201617 and provided 55191 revenue hours of service These totals represent 4 of the Districtrsquos total trips and 24 of revenue hours Compared to FY 201516 unlinked passenger trips on demand response services decreased by 39 (-5096 trips) and revenue hours decreased by 61 The more significant reduction in revenue hours compared to passengers is likely due to the new method for calculating those hours Overall productivity was 23 passengers per hour slightly higher than last fiscal year Ridership on local paratransit and the Novato Dial-A-Ride decreased in FY 201617 compared to the prior year Rural Dial-A-Ride experienced growth in ridership mainly because these services were only recently introduced These include the Dillon BeachTomales and Point Reyes Station Dial-A-Ride Passenger revenues for demand response services dropped slightly (-15) compared to last year However lower operating costs due to the new contract rate resulted in reductions in subsidies and an increase in farebox recovery Other Services Other Marin Access Mobility Management services include the Volunteer Driver and Catch-A-Ride programs In FY 201617 these programs provided 30547 unlinked passenger trips about 1 of the Districtrsquos total trips Compared to the prior fiscal year ridership decreased by 77 mostly due to the Catch-A-Ride program However passenger revenues increased by 90 primarily on the Catch-A-Ride program This increase may have been due to riders taking longer trips Performance Goals
The 2016-2025 Short-Range Transit Plan identifies fifteen different goals and associated metrics that staff use to evaluate system performance Performance goals at the route level are measured in both productivity (unlinked passengers per hour and per trip) and cost effectiveness (subsidy per unlinked passenger trip) These measures follow the service typologies updated in the most recent Short Range Transit Plan Table 1 below summarizes route level performance goals by typology Marin Transit has not identified productivity or cost-effectiveness goals for the Yellow Bus or Partnership service typologies Table 2 provides a detailed summary of annual FY 201617 performance data by program route and service typology
3
Table 1 Productivity and Subsidy Goals by Service Typology
Service Typology Routes Unlinked Passenger
Trips per Hour (at or above)
Subsidy per Passenger Trip
(at or below)
Local Trunkline 35 36 71X 25 $300
Regular Local 17 22 23 23X 29 49 20 $500
Local Connector 219 228 233 245 251 257 8 $800
Supplemental 113 115 117 119 125 139 145 151 154 20 per trip $300
Rural 61 68 4 $1200
Recreational 66 (Muir Woods Shuttle) 25 $300
Demand Response Local DAR Novato DAR Dillon BeachTomales DAR Point Reyes DAR
2 $3000
Using the productivity goals identified in Table 1 all the service typology groups except for Local Basic met their unlinked passengers per hour goal overall Twelve individual routes and two demand response services did not meet their productivity targets These include Routes 17 22 23 23X 29 49 71X 115 125 139 219 228 the Dillon BeachTomales Dial-A-Ride and the Point Reyes Dial-A-Ride In the previous fiscal year ten routes did not meet this target Figure 1 provides FY 201617 productivity levels and respective productivity goals by service typology and at the route level Route 35 was the most productive fixed-route service carrying an average of 286 passengers per hour Route 151 (Hamilton ndash San Jose MS ndash Novato HS - San Marin HS) was the best performing supplemental school route with 428 passengers per trip and met its subsidy target at $150 per passenger Route 228 had the highest growth in productivity (+291) due to the addition of weekday service in June 2016 In terms of cost effectiveness the Supplemental School Rural and Recreational services collectively met their goals In total 17 individual routes and two demand response services did not meet their subsidy target (Routes 17 22 23 23X 29 35 36 49 71X 219 228 233 251 257 115 125 139 Local Paratransit and Novato Dial-A-Ride) This is an increase from the 13 routes and three demand response services reported for FY 201516 Figure 2 provides a breakdown of FY 201617 subsidy levels and respective subsidy goals by service typology and at the individual route level Ridership Trends
In FY 201617 there was an overall 35 decline in fixed-route ridership compared to the previous year despite increases to service levels One of the major contributors to this decline was the delayed start of the 2017 Muir Woods Shuttle season that reduced the amount of service provided by 76 The overall decrease in ridership is relatively consistent with trends among bus operators nationwide and in the Bay Area According to the National Transit Database bus ridership declined 66 nationwide during FY 201617 compared to the prior year Within in the Bay Area peer agencies experienced ridership declines between 6 and 12 These include Golden Gate Transit Sonoma County Transit SamTrans and Napa VINE One of the biggest external factors that may have contributed to this trend is weather Rainfall in FY 201617 almost doubled over the prior year Weather can have a significant impact on travel decisions affecting whether a person makes a trip as well as how that person ultimately makes the trip It can also impact operations and cause detours major delays and canceled trips
4
In FY 201617 there was a 34 increase in the number of canceled trips Almost half of these canceled trips occurred in February due to heavy rains that caused flooding and school closures In June 2016 Marin Transit implemented a major service change One of the main goals of the service restructuring was to reduce the need to transfer by providing faster and more direct connections While this approach improves the system for riders it has implications in terms of how ridership is counted and on performance metrics The number of passengers is measured in terms of unlinked passenger trips Each time a person boards a bus is counted as a separate trip regardless of whether that person is transferring from another bus Reducing the amount of transfers needed to complete a riderrsquos journey reduces the number of unlinked trips Replacing trips that require a transfer with direct trips to destinations does not change the number of individual riders using the system which is defined as linked passenger trips In FY 201617 there was a 75 overall decrease in the number of transfers for passengers using cash to pay their original fare Some of this decline reflects the systemwide decrease in ridership The transfer ratio is defined as the number of boarding trips (unlinked passenger trips) divided by the number of originating trips (linked passenger trips) This ratio can be used to evaluate the impact of transfers on ridership independent of other factors In FY 201617 the overall transfer ratio dropped 38 from 136 to 131 When estimating linked passenger trips based on these ratios the number of individual Marin Transit passengers in FY 201617 remained relatively constant compared to last year Demand for Marin Access mobility management programs declined overall 47 from FY 201516 to FY 201617 Changes in ridership varied from program to program The largest decline was on Catch-A-Ride which experienced a 129 decrease in ridership Local paratransit and Novato Dial-A-Ride ridership may have been affected by many of the same external factors as fixed route transit particularly weather It is also possible that paratransit clients have started to shift some or all their trips to services that are not provided by Marin Transit These may include Non-Emergency Medical Transportation services arranged by managed care organizations Private transportation
providers hired under contract to institutions typically served by paratransit (such as adult day care centers) Trips taken on Uber or Lyft and Volunteer transportation services that may be supported by Marin Transit in some way but whose ridership is not
reported in the Districtrsquos performance statistics Furthermore staff attributed much of the previous growth in the Marin Access program to the Catch-A-Ride program This program experienced a 473 increase in ridership between FY 201314 and FY 201415 Towards the end of FY 201415 On the Move one of the largest taxi companies in Marin went out of business To this day service is limited during hours of peak demand and in certain service areas especially Novato Therefore FY 201617 ridership on Catch-A-Ride may reflect two factors These include a slowdown in attracting new customers and a reduction in service availability following On the Moversquos closure Table 2 summarizes the factors that can influence ridership numbers year-over-year and qualitatively evaluates their impact
5
Table 2 Factors Impacting Ridership Comparison
Factor FY 201516 FY 201617 Impact
Calendar
School Days 181 183 --
Weekdays 256 253
Weekends amp Holidays 110 111 --
Muir Woods Shuttle 113 104
Transfer Ratio (ratio of unlinked to linked trips) 136 131
Service Disruptions Canceled service (trips) 200 268
Major detourclosure (days) (1) 18 29
Rainfall (inches) 2928 5653
Gas Prices $298 $291 --
Unemployment Rate 32 32 -- Notes (1) Data on major detours and closure collected starting January 2016 Comparison includes the months of January through June FY 201718 Performance Outlook
In June 2016 Marin Transit implemented a major service change aimed in part to help underperforming routes meet established performance standards Staff has continued to monitor service performance and has made minor adjustments to improve on-time performance and cancel low-ridership trips In early 2018 staff is planning a comprehensive assessment of service performance since the June 2016 service changes This effort will include data from a recently completed onboard survey from April 2017 on passenger origins and destinations and a 100 passenger ridecheck The ridecheck will provide data on stop-level ridership activity for each route The assessment will use this analysis to recommend service changes to improve underperforming routes There are several unknowns that may also affect route performance primarily in terms of operating costs The District relies on its contractors to either lease or own property to store and maintain the vehicles needed to operate service For contractors that do not own suitable property finding and leasing these types of facilities in Marin County is challenging and expensive Recent surveys of current and potential service providers identified securing a facility as the most significant factor in determining their interest in bidding on Marin Transit services ability to provide the service and proposed pricing Marin Transit has been actively working to secure and develop its own operations and maintenance facility A District-owned facility will eliminate the need for potential service providers to lease property and lower operating costs It may also improve efficiency by reducing deadhead or non-revenue time when vehicles are traveling to and from the yard and further lower the Districtrsquos contract rates In late 2017 Marin Transit will release for bid over half of its fixed-route service and there are many uncertainties that may affect the outcome The tight labor market in Marin County and the greater Bay Area has made it difficult for service providers to hire and retain employees Potential contractors are required to secure property in a County with limited real estate opportunities If the District provides its own facility there will be more interest among potential bidders and more competitive rates
6
Table 3 System-wide Performance Statistics FY 201617 (unaudited)
Route Passengers Revenue
Hours Operating
Costs Passenger
Revenue Pass Trips Per
Rev Hr (Trip) Subsidy Per
Passenger Farebox
Recovery Fixed Route 2925522 178052 $20173419 $3550259 164 $568 176 Local Trunkline 1122188 44393 $6252940 $1263870 253 $445 202
35 658869 23052 $3234308 $729775 286 $380 226 36 342178 13636 $1901678 $369132 251 $448 194
71X 121141 7705 $1116954 $164963 157 $786 148 Local Basic 989500 65117 $7451946 $1221298 152 $630 164
17 247998 14757 $2076786 $319761 168 $708 154 22 215758 17553 $1619319 $273059 123 $624 169 23 199150 11065 $1508659 $246908 180 $634 164
23X 49255 3445 $473413 $57438 143 $845 121 29 40103 3707 $509475 $49634 108 $1147 97 49 237236 14590 $1264294 $274498 163 $417 217
Local Connector 378985 42396 $3873801 $461426 89 $900 119 219 50449 6392 $591224 $64101 79 $1045 108 228 71340 10042 $904806 $103912 71 $1123 115 233 42798 4363 $399203 $52001 98 $811 130 245 49766 4349 $391596 $56968 114 $672 145 251 95506 9607 $889019 $101823 99 $824 115 257 69126 7643 $697953 $82621 90 $890 118
Supplemental 179947 3963 $514380 $110503 454 (286) $224 215 113 16829 317 $42180 $12227 530 (315) $178 290 115 14021 637 $87534 $9504 220 (185) $557 109 117 34820 640 $81509 $17140 544 (284) $185 210 119 27161 374 $56273 $18859 727 (313) $138 335 125 13757 600 $72469 $11570 229 (193) $443 160 139 6414 253 $33182 $6635 253 (179) $414 200 145 16406 191 $25426 $7258 861 (372) $111 285 151 36801 594 $73842 $18463 620 (428) $150 250 154 13738 358 $41965 $8847 384 (255) $241 211
Recreational 122116 4316 $473726 $249748 283 $183 527 66 122116 4316 $473726 $249748 283 $183 527
Rural 112926 16172 $1422683 $122407 70 $1151 86 61 36328 5492 $475778 $39959 66 $1200 84 68 76598 10680 $946905 $82448 72 $1129 87
Partnership 19860 1696 $183943 $121007 117 $317 658 122 19860 1696 $183943 $121007 117 $317 658
Yellow Bus 136500 1245 $863348 $473066 1096 (448) $286 548 Hidden Valley 9281 180 $124763 $32170 516 (265) $998 258
White Hill 127219 1065 $738585 $440896 1194 (471) $234 597 Demand Response 124325 55191 $4571296 $236980 23 $3486 52
Local Paratransit 119673 53011 $4404928 $226387 23 $3492 51 Novato DAR 4057 1856 $150815 $8815 22 $3487 58
Dillon Beach DAR 488 260 $12511 $1356 19 $2285 108 Pt Reyes DAR 107 64 $3042 $422 17 $2447 139
Other Services 30547 - $511316 $41956 - $1537 82 Volunteer Driver(1) 16162 - $152714 - - $945 -
Catch-A-Ride(1) 14385 - $358602 $41956 - $2201 117 Total 3216894 234489 $26118572 $4302085 136 $678 165
Notes Values in red indicate performance that does not meet District
7
Figure 1 FY 201617 Passengers per Revenue Hour by Route
0
5
10
15
20
25
30
35
40
45
50Lo
cal T
runk
line T
otals 35 36 71
X
Loca
l Bas
ic To
tals 17 22 23 23X 29 49
Loca
l Con
necto
r Tot
als 219
228
233
245
251
257
Supp
lemen
tal T
otals 11
311
511
711
912
513
914
515
115
4
Recre
ation
al To
tals 66
Rura
l Tot
als 61 68
Dem
and R
espo
nse T
otals
Loca
l Par
atra
nsit
Nova
to D
ARDi
llon D
ARPt
Reye
s DAR
Pass
enge
rs p
er R
even
ue H
our
meets goalservice standard
does not meet goal
school routes show passengers per trip
8
Figure 2 FY 201617 Subsidy per Passenger by Route
$0
$5
$10
$15
$20
$25
$30
$35
$40
Loca
l Tru
nklin
e Tot
als 35 36 71X
Loca
l Bas
ic To
tals 17 22 23 23X 29 49
Loca
l Con
necto
r Tot
als 219
228
233
245
251
257
Supp
lemen
tal T
otals 11
311
511
711
912
513
914
515
115
4
Recre
ation
al To
tals 66
Rura
l Tot
als 61 68
Dem
and R
espo
nse T
otals
Loca
l Par
atra
nsit
Nova
to D
ARDi
llon D
ARPt
Reye
s DAR
Subs
idy p
er P
asse
nger
does not meet goal
service standard
meets goal
9
Attachment A Route Profiles 17 Sausalito ndash Marin City ndash Mill Valley ndash San Rafael 22 San Rafael Transit Center ndash San Anselmo ndash Marin City 23 Fairfax ndash San Anselmo ndash San Rafael ndash Canal 23X Manor ndash Fairfax ndash San Anselmo ndash San Rafael ndash Canal 29 Canal ndash San Rafael Transit Center ndash Larkspur ndash College of Marin ndash Marin General 35 Canal ndash San Rafael Transit Center ndash Marin Civic Center ndash Northgate Mall ndash Novato 36 Canal ndash San Rafael Transit Center ndash Marin City 49 Novato ndash Ignacio ndash Hamilton ndash Marin Civic Center ndash San Rafael Transit Center 61 West Marin Stagecoach (Sausalito ndash Marin City ndash Mill Valley ndash Stinson Beach ndash Bolinas) 66 Muir Woods Shuttle 68 West Marin Stagecoach (San Rafael Transit Center ndash San Anselmo ndash Pt Reyes Station ndash Inverness) 71X Novato ndash San Rafael Transit Center ndash Marin City ndash Sausalito 113 Redwood High School ndash Paradise Cay 115 Sausalito ndash Willow Creek ndash Marin City ndash Mill Valley ndash St Hilary 117 Neil Cummins Hall Middle School ndash E Corte Madera ndash Cove School 119 Tiburon ndash Belvedere ndash Redwood High School 122 San Rafael Transit Center ndash San Anselmo ndash College of Marin 125 Lagunitas ndash Sir Francis Drake HS ndash San Anselmo ndash San Rafael 139 Terra Linda High School ndash Lucas Valley 145 Terra Linda High School ndash San Rafael 151 Hamilton ndash Ignacio ndash San Jose Middle School ndash Novato High School ndash San Marin High School 154 Olive ndash San Marin High School ndash Sinaloa Middle School ndash Novato 219 Tiburon ndash Strawberry 228 San Rafael Transit Center ndash Larkspur ndash San Anselmo ndash Fairfax 233 Santa Venetia ndash Marin Civic Center ndash San Rafael Transit Center 245 San Rafael Transit Center ndash Northgate Mall ndash Kaiser ndash Smith Ranch Road 251 San Marin ndash Novato ndash Vintage Oaks ndash IVC ndash Ignacio ndash Hamilton 257 San Rafael ndash Northgate Mall ndash Kaiser ndash Marinwood ndash Hamilton ndash Ignacio ndash IVC Hdn Valley Ross Valley Yellow Bus (Fairfax ndash San Anselmo ndash Hidden Valley ES) White Hill Ross Valley Yellow Bus (San Anselmo ndash Sleepy Hollow ndash Fairfax ndash White Hill MS)
17Local Basic
Days of Service Wkdy Sa SuAvg Freq (Wkdy Peak) 30 min
Avg Freq (Wkdy Non-Peak) 60 minAvg Freq (Wked) 60 min
FY 2017 Farebox Recovery 15 transfer (to route) 25
Clipper usage 16
Annual Avg Monthly Avg Daily Annual Avg Monthly Avg Daily Annual Avg Monthly Avg DailyWeekday 194263 16189 768 11496 958 45 177386 14782 701 Saturday 27564 2297 530 1541 128 30 24621 2052 473 Sunday 26171 2181 436 1720 143 29 27378 2282 456
Total 247998 20667 679 14757 1230 40 229385 19115 628
Annual Avg Monthly Avg Daily Annual Avg Monthly Avg Daily Annual Avg Monthly Avg DailyWeekday $1617108 $134759 $6392 $247041 $20587 $976 $1370067 $114172 $5415Saturday $217536 $18128 $4183 $36894 $3075 $710 $180642 $15054 $3474Sunday $242142 $20179 $4036 $35826 $2986 $597 $206316 $17193 $3439
Total $2076786 $173066 $5690 $319761 $26647 $876 $1757025 $146419 $4814
Passengers per Revenue Hour
Subsidy per Passenger
Cost per Revenue Hour
Farebox Recovery
Weekday 169 $705 $14067 153Saturday 179 $655 $14117 170Sunday 152 $788 $14078 148
Total 168 $708 $14073 154
Passengers Revenue Hours Operating CostsPassenger
RevenueOperating Subsidy
Passengers per Revenue Hour
Subsidy per Passenger
Cost per Revenue Hour
Farebox Recovery
FY 2015 301136 15167 $2108822 $340410 $1768412 199 $587 $13904 161FY 2016 280486 15330 $2041616 $302337 $1739279 183 $620 $13317 148FY 2017 247998 14757 $2076786 $319761 $1757025 168 $708 $14073 154
Histo
ric Tr
ends
FY 20
161
7 DAT
A
Passengers Revenue Hours Revenue Miles
Operating Costs Passenger Revenue Operating Subsidy
277892 322826
301136 280486
247998
0
50000
100000
150000
200000
250000
300000
350000
FY 2013 FY 2014 FY 2015 FY 2016 FY 2017
Passengers
12402 14818 15167 15330 14757
0
5000
10000
15000
20000
FY 2013 FY 2014 FY 2015 FY 2016 FY 2017
Revenue Hours
$1717002
$2179526 $2108822 $2041616 $2076786
$0
$500000
$1000000
$1500000
$2000000
$2500000
FY 2013 FY 2014 FY 2015 FY 2016 FY 2017
Operating Costs
224 218 199 183 168
00
50
100
150
200
250
300
FY 2013 FY 2014 FY 2015 FY 2016 FY 2017
Passengers per Revenue Hour
$504 $558 $587 $620 $708
$000$200$400$600$800
$1000$1200$1400
FY 2013 FY 2014 FY 2015 FY 2016 FY 2017
Subsidy per Passenger
$13845 $14709 $13904 $13317 $14073
$0
$50
$100
$150
$200
FY 2013 FY 2014 FY 2015 FY 2016 FY 2017
Cost per Revenue Hour
22Local Basic
Days of Service Wkdy Sa SuAvg Freq (Wkdy Peak) 30 min
Avg Freq (Wkdy Non-Peak) 60 minAvg Freq (Wked) 60 min
FY 2017 Farebox Recovery 17 transfer (to route) 10
Clipper usage 11
Annual Avg Monthly Avg Daily Annual Avg Monthly Avg Daily Annual Avg Monthly Avg DailyWeekday 184918 15410 731 14244 1187 56 126319 10527 499 Saturday 16752 1396 322 1537 128 30 16232 1353 312 Sunday 14088 1174 235 1773 148 30 18729 1561 312
Total 215758 17980 591 17553 1463 48 161280 13440 442
Annual Avg Monthly Avg Daily Annual Avg Monthly Avg Daily Annual Avg Monthly Avg DailyWeekday $1312992 $109416 $5190 $232926 $19411 $921 $1080066 $90006 $4269Saturday $142334 $11861 $2737 $21235 $1770 $408 $121099 $10092 $2329Sunday $163993 $13666 $2733 $18898 $1575 $315 $145095 $12091 $2418
Total $1619319 $134943 $4436 $273059 $22755 $748 $1346260 $112188 $3688
Passengers per Revenue Hour
Subsidy per Passenger
Cost per Revenue Hour
Farebox Recovery
Weekday 130 $584 $9218 177Saturday 109 $723 $9263 149Sunday 79 $1030 $9251 115
Total 123 $624 $9225 169
Passengers Revenue Hours Operating CostsPassenger
RevenueOperating Subsidy
Passengers per Revenue Hour
Subsidy per Passenger
Cost per Revenue Hour
Farebox Recovery
FY 2015 249148 14777 $2054433 $292215 $1762218 169 $707 $13903 142FY 2016 243635 14872 $1971172 $259453 $1711719 164 $703 $13255 132FY 2017 215758 17553 $1619319 $273059 $1346260 123 $624 $9225 169
Histo
ric Tr
ends
FY 20
161
7 DAT
A
Passengers Revenue Hours Revenue Miles
Operating Costs Passenger Revenue Operating Subsidy
366301
281761 249148 243635
215758
050000
100000150000200000250000300000350000400000
FY 2013 FY 2014 FY 2015 FY 2016 FY 2017
Passengers18061
15083 14777 14872 17553
0
5000
10000
15000
20000
FY 2013 FY 2014 FY 2015 FY 2016 FY 2017
Revenue Hours$2498169
$2220145 $2054433 $1971172
$1619319
$0
$500000
$1000000
$1500000
$2000000
$2500000
$3000000
FY 2013 FY 2014 FY 2015 FY 2016 FY 2017
Operating Costs
203 187 169 164
123
00
50
100
150
200
250
300
FY 2013 FY 2014 FY 2015 FY 2016 FY 2017
Passengers per Revenue Hour
$567 $667 $707 $703 $624
$000$200$400$600$800
$1000$1200$1400
FY 2013 FY 2014 FY 2015 FY 2016 FY 2017
Subsidy per Passenger
$13832 $14720 $13903 $13255
$9225
$0
$50
$100
$150
$200
FY 2013 FY 2014 FY 2015 FY 2016 FY 2017
Cost per Revenue Hour
23Local Basic
Days of Service Wkdy Sa SuAvg Freq (Wkdy Peak) 60 min
Avg Freq (Wkdy Non-Peak) 60 minAvg Freq (Wked) 60 min
FY 2017 Farebox Recovery 16 transfer (to route) 24
Clipper usage 12
Annual Avg Monthly Avg Daily Annual Avg Monthly Avg Daily Annual Avg Monthly Avg DailyWeekday 145707 12142 576 8042 670 32 64277 5356 254 Saturday 28305 2359 544 1434 120 28 11466 956 221 Sunday 25138 2095 419 1589 132 26 12750 1062 212
Total 199150 16596 546 11065 922 30 88492 7374 242
Annual Avg Monthly Avg Daily Annual Avg Monthly Avg Daily Annual Avg Monthly Avg DailyWeekday $1096892 $91408 $4336 $179427 $14952 $709 $917465 $76455 $3626Saturday $195468 $16289 $3759 $35226 $2936 $677 $160242 $13354 $3082Sunday $216299 $18025 $3605 $32255 $2688 $538 $184044 $15337 $3067
Total $1508659 $125722 $4133 $246908 $20576 $676 $1261751 $105146 $3457
Passengers per Revenue Hour
Subsidy per Passenger
Cost per Revenue Hour
Farebox Recovery
Weekday 181 $630 $13640 164Saturday 197 $566 $13629 180Sunday 158 $732 $13612 149
Total 180 $634 $13635 164
Passengers Revenue Hours Operating CostsPassenger
RevenueOperating Subsidy
Passengers per Revenue Hour
Subsidy per Passenger
Cost per Revenue Hour
Farebox Recovery
FY 2015 354706 14168 $1969650 $381111 $1588539 250 $448 $13902 193FY 2016 268218 13154 $1703216 $308138 $1395078 204 $520 $12948 181FY 2017 199150 11065 $1508659 $246908 $1261751 180 $634 $13635 164
Histo
ric Tr
ends
FY 20
161
7 DAT
A
Passengers Revenue Hours Revenue Miles
Operating Costs Passenger Revenue Operating Subsidy
212064
339118 354706
268218
199150
050000
100000150000200000250000300000350000400000
FY 2013 FY 2014 FY 2015 FY 2016 FY 2017
Passengers
8716
14034 14168 13154
11065
02000400060008000
10000120001400016000
FY 2013 FY 2014 FY 2015 FY 2016 FY 2017
Revenue Hours
$1202564
$2061985 $1969650 $1703216
$1508659
$0
$500000
$1000000
$1500000
$2000000
$2500000
FY 2013 FY 2014 FY 2015 FY 2016 FY 2017
Operating Costs
243 242 250
204 180
00
50
100
150
200
250
300
FY 2013 FY 2014 FY 2015 FY 2016 FY 2017
Passengers per Revenue Hour
$455 $494 $448 $520 $634
$000$200$400$600$800
$1000$1200$1400
FY 2013 FY 2014 FY 2015 FY 2016 FY 2017
Subsidy per Passenger
$13797 $14692 $13902 $12948 $13635
$0
$50
$100
$150
$200
FY 2013 FY 2014 FY 2015 FY 2016 FY 2017
Cost per Revenue Hour
23XLocal Basic
Days of Service WkdyAvg Freq (Wkdy Peak) 60 min
Avg Freq (Wkdy Non-Peak) -Avg Freq (Wked) -
FY 2017 Farebox Recovery 12 transfer (to route) 31
Clipper usage 12
Annual Avg Monthly Avg Daily Annual Avg Monthly Avg Daily Annual Avg Monthly Avg DailyWeekday 49255 4105 195 3445 287 14 32408 2701 128 Saturday - - - - - - - - - Sunday - - - - - - - - -
Total 49255 4105 195 3445 287 14 32408 2701 128
Annual Avg Monthly Avg Daily Annual Avg Monthly Avg Daily Annual Avg Monthly Avg DailyWeekday $473413 $39451 $1871 $57438 $4787 $227 $415975 $34665 $1644Saturday $ - $ - $ - $ - $ - $ - $ - $ - $ -Sunday $ - $ - $ - $ - $ - $ - $ - $ - $ -
Total $473413 $39451 $1871 $57438 $4787 $227 $415975 $34665 $1644
Passengers per Revenue Hour
Subsidy per Passenger
Cost per Revenue Hour
Farebox Recovery
Weekday 143 $845 $13744 121Saturday - $ - $ - - Sunday - $ - $ - -
Total 143 $845 $13744 121
Passengers Revenue Hours Operating CostsPassenger
RevenueOperating Subsidy
Passengers per Revenue Hour
Subsidy per Passenger
Cost per Revenue Hour
Farebox Recovery
FY 2015FY 2016 2548 189 $23303 $2272 $21031 135 $825 $12330 97FY 2017 49255 3445 $473413 $57438 $415975 143 $845 $13744 121
Histo
ric Tr
ends
FY 20
161
7 DAT
A
Passengers Revenue Hours Revenue Miles
Operating Costs Passenger Revenue Operating Subsidy
2548
49255
0
10000
20000
30000
40000
50000
60000
FY 2013 FY 2014 FY 2015 FY 2016 FY 2017
Passengers
189
3445
0500
1000150020002500300035004000
FY 2013 FY 2014 FY 2015 FY 2016 FY 2017
Revenue Hours
$23303
$473413
$0
$100000
$200000
$300000
$400000
$500000
FY 2013 FY 2014 FY 2015 FY 2016 FY 2017
Operating Costs
135 143
00
50
100
150
200
250
300
FY 2013 FY 2014 FY 2015 FY 2016 FY 2017
Passengers per Revenue Hour
$825 $845
$000$200$400$600$800
$1000$1200$1400
FY 2013 FY 2014 FY 2015 FY 2016 FY 2017
Subsidy per Passenger
$12330 $13744
$0
$50
$100
$150
$200
FY 2013 FY 2014 FY 2015 FY 2016 FY 2017
Cost per Revenue Hour
29Local Basic
Days of Service WkdyAvg Freq (Wkdy Peak) 60 min
Avg Freq (Wkdy Non-Peak) -Avg Freq (Wked) -
FY 2017 Farebox Recovery 10 transfer (to route) 26
Clipper usage 12
Annual Avg Monthly Avg Daily Annual Avg Monthly Avg Daily Annual Avg Monthly Avg DailyWeekday 40103 3342 159 3707 309 15 37048 3087 146 Saturday - - - - - - - - - Sunday - - - - - - - - -
Total 40103 3342 159 3707 309 15 37048 3087 146
Annual Avg Monthly Avg Daily Annual Avg Monthly Avg Daily Annual Avg Monthly Avg DailyWeekday $509475 $42456 $2014 $49634 $4136 $196 $459841 $38320 $1818Saturday $ - $ - $ - $ - $ - $ - $ - $ - $ -Sunday $ - $ - $ - $ - $ - $ - $ - $ - $ -
Total $509475 $42456 $2014 $49634 $4136 $196 $459841 $38320 $1818
Passengers per Revenue Hour
Subsidy per Passenger
Cost per Revenue Hour
Farebox Recovery
Weekday 108 $1147 $13745 97Saturday - $ - $ - - Sunday - $ - $ - -
Total 108 $1147 $13745 97
Passengers Revenue Hours Operating CostsPassenger
RevenueOperating Subsidy
Passengers per Revenue Hour
Subsidy per Passenger
Cost per Revenue Hour
Farebox Recovery
FY 2015 203632 10795 $1500887 $232286 $1268601 189 $623 $13904 155FY 2016 181786 10502 $1378760 $219997 $1158763 173 $637 $13129 160FY 2017 40103 3707 $509475 $49634 $459841 108 $1147 $13745 97
Histo
ric Tr
ends
FY 20
161
7 DAT
A
Passengers Revenue Hours Revenue Miles
Operating Costs Passenger Revenue Operating Subsidy
238310 225998 203632
181786
40103
0
50000
100000
150000
200000
250000
300000
FY 2013 FY 2014 FY 2015 FY 2016 FY 2017
Passengers12248
10927 10795 10502
3707
0
2000
4000
6000
8000
10000
12000
14000
FY 2013 FY 2014 FY 2015 FY 2016 FY 2017
Revenue Hours$1692980 $1607795 $1500887
$1378760
$509475
$0
$500000
$1000000
$1500000
$2000000
FY 2013 FY 2014 FY 2015 FY 2016 FY 2017
Operating Costs
195 207 189 173
108
00
50
100
150
200
250
300
FY 2013 FY 2014 FY 2015 FY 2016 FY 2017
Passengers per Revenue Hour
$595 $593 $623 $637
$1147
$000$200$400$600$800
$1000$1200$1400
FY 2013 FY 2014 FY 2015 FY 2016 FY 2017
Subsidy per Passenger
$13822 $14714 $13904 $13129 $13745
$0
$50
$100
$150
$200
FY 2013 FY 2014 FY 2015 FY 2016 FY 2017
Cost per Revenue Hour
35Local Trunkline
Days of Service Wkdy Sa SuAvg Freq (Wkdy Peak) 30 min
Avg Freq (Wkdy Non-Peak) 30 minAvg Freq (Wked) 30 min
FY 2017 Farebox Recovery 23 transfer (to route) 17
Clipper usage 8
Annual Avg Monthly Avg Daily Annual Avg Monthly Avg Daily Annual Avg Monthly Avg DailyWeekday 492328 41027 1946 16909 1409 67 224421 18702 887 Saturday 84453 7038 1624 2860 238 55 43336 3611 833 Sunday 82088 6841 1368 3284 274 55 50021 4168 834
Total 658869 54906 1805 23052 1921 63 317778 26482 871
Annual Avg Monthly Avg Daily Annual Avg Monthly Avg Daily Annual Avg Monthly Avg DailyWeekday $2367217 $197268 $9357 $533190 $44433 $2107 $1834027 $152836 $7249Saturday $403729 $33644 $7764 $97853 $8154 $1882 $305876 $25490 $5882Sunday $463362 $38614 $7723 $98732 $8228 $1646 $364630 $30386 $6077
Total $3234308 $269526 $8861 $729775 $60815 $1999 $2504533 $208711 $6862
Passengers per Revenue Hour
Subsidy per Passenger
Cost per Revenue Hour
Farebox Recovery
Weekday 291 $373 $14000 225Saturday 295 $362 $14118 242Sunday 250 $444 $14111 213
Total 286 $380 $14030 226
Passengers Revenue Hours Operating CostsPassenger
RevenueOperating Subsidy
Passengers per Revenue Hour
Subsidy per Passenger
Cost per Revenue Hour
Farebox Recovery
FY 2015 476489 8544 $1187694 $462204 $725490 558 $152 $13901 389FY 2016 472718 9300 $1202986 $544109 $658877 508 $139 $12935 452FY 2017 658869 23052 $3234308 $729775 $2504533 286 $380 $14030 226
Histo
ric Tr
ends
FY 20
161
7 DAT
A
Passengers Revenue Hours Revenue Miles
Operating Costs Passenger Revenue Operating Subsidy
669860 574669
476489 472718
658869
0100000200000300000400000500000600000700000800000
FY 2013 FY 2014 FY 2015 FY 2016 FY 2017
Passengers
9755 8644 8544 9300
23052
0
5000
10000
15000
20000
25000
FY 2013 FY 2014 FY 2015 FY 2016 FY 2017
Revenue Hours
$1345711 $1271601 $1187694 $1202986
$3234308
$0
$500000
$1000000
$1500000
$2000000
$2500000
$3000000
$3500000
FY 2013 FY 2014 FY 2015 FY 2016 FY 2017
Operating Costs
687 665 558
508
286
00100200300400500600700800
FY 2013 FY 2014 FY 2015 FY 2016 FY 2017
Passengers per Revenue Hour
$097 $120 $152 $139
$380
$000
$200
$400
$600
$800
$1000
FY 2013 FY 2014 FY 2015 FY 2016 FY 2017
Subsidy per Passenger
$13796 $14710 $13901 $12935 $14030
$0
$50
$100
$150
$200
FY 2013 FY 2014 FY 2015 FY 2016 FY 2017
Cost per Revenue Hour
36Local Trunkline
Days of Service Wkdy Sa SuAvg Freq (Wkdy Peak) 30 min
Avg Freq (Wkdy Non-Peak) 30 minAvg Freq (Wked) 30 min
FY 2017 Farebox Recovery 19 transfer (to route) 18
Clipper usage 6
Annual Avg Monthly Avg Daily Annual Avg Monthly Avg Daily Annual Avg Monthly Avg DailyWeekday 278217 23185 1100 9938 828 39 133318 11110 527 Saturday 33779 2815 650 1715 143 33 24259 2022 467 Sunday 30182 2515 503 1983 165 33 28002 2334 467
Total 342178 28515 937 13636 1136 37 185579 15465 508
Annual Avg Monthly Avg Daily Annual Avg Monthly Avg Daily Annual Avg Monthly Avg DailyWeekday $1384291 $115358 $5472 $290481 $24207 $1148 $1093810 $91151 $4323Saturday $240062 $20005 $4617 $40774 $3398 $784 $199288 $16607 $3832Sunday $277325 $23110 $4622 $37877 $3156 $631 $239448 $19954 $3991
Total $1901678 $158473 $5210 $369132 $30761 $1011 $1532546 $127712 $4199
Passengers per Revenue Hour
Subsidy per Passenger
Cost per Revenue Hour
Farebox Recovery
Weekday 280 $393 $13930 210Saturday 197 $590 $13999 170Sunday 152 $793 $13984 137
Total 251 $448 $13946 194
Passengers Revenue Hours Operating CostsPassenger
RevenueOperating Subsidy
Passengers per Revenue Hour
Subsidy per Passenger
Cost per Revenue Hour
Farebox Recovery
FY 2015 109347 2894 $402355 $110471 $291884 378 $267 $13905 275FY 2016 119593 3462 $457211 $129715 $327496 345 $274 $13205 284FY 2017 342178 13636 $1901678 $369132 $1532546 251 $448 $13946 194
Histo
ric Tr
ends
FY 20
161
7 DAT
A
Passengers Revenue Hours Revenue Miles
Operating Costs Passenger Revenue Operating Subsidy
106988 103673 109347 119593
342178
050000
100000150000200000250000300000350000400000
FY 2013 FY 2014 FY 2015 FY 2016 FY 2017
Passengers
2878 2822 2894 3462
13636
02000400060008000
10000120001400016000
FY 2013 FY 2014 FY 2015 FY 2016 FY 2017
Revenue Hours
$398410 $415238 $402355 $457211
$1901678
$0
$500000
$1000000
$1500000
$2000000
FY 2013 FY 2014 FY 2015 FY 2016 FY 2017
Operating Costs
372 367 378 345 251
00100200300400500600700800
FY 2013 FY 2014 FY 2015 FY 2016 FY 2017
Passengers per Revenue Hour
$265 $293 $267 $274
$448
$000
$200
$400
$600
$800
$1000
FY 2013 FY 2014 FY 2015 FY 2016 FY 2017
Subsidy per Passenger
$13842 $14713 $13905 $13205 $13946
$0
$50
$100
$150
$200
FY 2013 FY 2014 FY 2015 FY 2016 FY 2017
Cost per Revenue Hour
49Local Basic
Days of Service Wkdy Sa SuAvg Freq (Wkdy Peak) 30 min
Avg Freq (Wkdy Non-Peak) 60 minAvg Freq (Wked) 60 min
FY 2017 Farebox Recovery 22 transfer (to route) 9
Clipper usage 11
Annual Avg Monthly Avg Daily Annual Avg Monthly Avg Daily Annual Avg Monthly Avg DailyWeekday 201564 16797 797 11313 943 45 139528 11627 551 Saturday 18489 1541 356 1517 126 29 18370 1531 353 Sunday 17183 1432 286 1761 147 29 21402 1784 357
Total 237236 19770 650 14590 1216 40 179300 14942 491
Annual Avg Monthly Avg Daily Annual Avg Monthly Avg Daily Annual Avg Monthly Avg DailyWeekday $978903 $81575 $3869 $230134 $19178 $910 $748769 $62397 $2960Saturday $131907 $10992 $2537 $22520 $1877 $433 $109387 $9116 $2104Sunday $153484 $12790 $2558 $21844 $1820 $364 $131640 $10970 $2194
Total $1264294 $105358 $3464 $274498 $22875 $752 $989796 $82483 $2712
Passengers per Revenue Hour
Subsidy per Passenger
Cost per Revenue Hour
Farebox Recovery
Weekday 178 $371 $8653 235Saturday 122 $592 $8698 171Sunday 98 $766 $8718 142
Total 163 $417 $8665 217
Passengers Revenue Hours Operating CostsPassenger
RevenueOperating Subsidy
Passengers per Revenue Hour
Subsidy per Passenger
Cost per Revenue Hour
Farebox Recovery
FY 2015 144262 6349 $882801 $158088 $724713 227 $502 $13905 179FY 2016 147480 6795 $900804 $146345 $754459 217 $512 $13257 162FY 2017 237236 14590 $1264294 $274498 $989796 163 $417 $8665 217
Histo
ric Tr
ends
FY 20
161
7 DAT
A
Passengers Revenue Hours Revenue Miles
Operating Costs Passenger Revenue Operating Subsidy
230943
152259 144262 147480
237236
0
50000
100000
150000
200000
250000
FY 2013 FY 2014 FY 2015 FY 2016 FY 2017
Passengers
9814
6440 6349 6795
14590
02000400060008000
10000120001400016000
FY 2013 FY 2014 FY 2015 FY 2016 FY 2017
Revenue Hours$1362499
$948702 $882801 $900804
$1264294
$0$200000$400000$600000$800000
$1000000$1200000$1400000$1600000
FY 2013 FY 2014 FY 2015 FY 2016 FY 2017
Operating Costs
235 236 227 217
163
00
50
100
150
200
250
300
FY 2013 FY 2014 FY 2015 FY 2016 FY 2017
Passengers per Revenue Hour
$477 $507 $502 $512 $417
$000$200$400$600$800
$1000$1200$1400
FY 2013 FY 2014 FY 2015 FY 2016 FY 2017
Subsidy per Passenger
$13884 $14732 $13905 $13257
$8665
$0
$50
$100
$150
$200
FY 2013 FY 2014 FY 2015 FY 2016 FY 2017
Cost per Revenue Hour
61Rural
Days of Service Wkdy Sa SuAvg Freq (Wkdy Peak) 8 trips
Avg Freq (Wkdy Non-Peak) -Avg Freq (Wked) 16 trips
FY 2017 Farebox Recovery 8 transfer (to route) 7
Clipper usage 11
Annual Avg Monthly Avg Daily Annual Avg Monthly Avg Daily Annual Avg Monthly Avg DailyWeekday 17166 1431 68 2631 219 10 45398 3783 181 Saturday 9922 827 198 1319 110 26 20810 1734 416 Sunday 9240 770 144 1542 129 24 24457 2038 382
Total 36328 3027 100 5492 458 15 90665 7555 248
Annual Avg Monthly Avg Daily Annual Avg Monthly Avg Daily Annual Avg Monthly Avg DailyWeekday $229650 $19138 $915 $17691 $1474 $70 $211959 $17663 $844Saturday $113378 $9448 $2268 $11622 $969 $232 $101756 $8480 $2035Sunday $132750 $11063 $2074 $10646 $887 $166 $122104 $10175 $1908
Total $475778 $39648 $1304 $39959 $3330 $109 $435819 $36318 $1194
Passengers per Revenue Hour
Subsidy per Passenger
Cost per Revenue Hour
Farebox Recovery
Weekday 65 $1235 $8730 77Saturday 75 $1026 $8598 103Sunday 60 $1321 $8607 80
Total 66 $1200 $8663 84
Passengers Revenue Hours Operating CostsPassenger
RevenueOperating Subsidy
Passengers per Revenue Hour
Subsidy per Passenger
Cost per Revenue Hour
Farebox Recovery
FY 2015 39478 5379 $417539 $46324 $371215 73 $940 $7762 111FY 2016 37276 5475 $408987 $48421 $360566 68 $967 $7470 118FY 2017 36328 5492 $475778 $39959 $435819 66 $1200 $8663 84
Histo
ric Tr
ends
FY 20
161
7 DAT
A
Passengers Revenue Hours Revenue Miles
Operating Costs Passenger Revenue Operating Subsidy
30642 33386
39478 37276 36328
0
10000
20000
30000
40000
50000
FY 2013 FY 2014 FY 2015 FY 2016 FY 2017
Passengers
5388
5056
5379 5475 5492
480049005000510052005300540055005600
FY 2013 FY 2014 FY 2015 FY 2016 FY 2017
Revenue Hours
$388827 $390358 $417539 $408987 $475778
$0
$100000
$200000
$300000
$400000
$500000
FY 2013 FY 2014 FY 2015 FY 2016 FY 2017
Operating Costs
57 66
73 68 66
00
20
40
60
80
100
FY 2013 FY 2014 FY 2015 FY 2016 FY 2017
Passengers per Revenue Hour
$1136 $1045
$940 $967
$1200
$000$200$400$600$800
$1000$1200$1400
FY 2013 FY 2014 FY 2015 FY 2016 FY 2017
Subsidy per Passenger
$7216 $7721 $7762 $7470 $8663
$0
$50
$100
$150
$200
FY 2013 FY 2014 FY 2015 FY 2016 FY 2017
Cost per Revenue Hour
66Recreational
Days of Service Wkdy Sa SuAvg Freq (Wkdy Peak) 30 min
Avg Freq (Wkdy Non-Peak) 30 minAvg Freq (Wked) 10-20 min
FY 2017 Farebox Recovery 53 transfer (to route) 0
Clipper usage 0
Annual Avg Monthly Avg Daily Annual Avg Monthly Avg Daily Annual Avg Monthly Avg DailyWeekday 21940 7313 549 804 268 20 10735 3578 268 Saturday 43799 7300 1752 1473 245 59 20480 3413 819 Sunday 56377 6264 1446 2040 227 52 28212 3135 723
Total 122116 13568 1174 4316 480 42 59428 6603 571
Annual Avg Monthly Avg Daily Annual Avg Monthly Avg Daily Annual Avg Monthly Avg DailyWeekday $104033 $34678 $2601 $37751 $12584 $944 $66282 $22094 $1657Saturday $152661 $25444 $6106 $79948 $13325 $3198 $72713 $12119 $2909Sunday $217032 $24115 $5565 $132049 $14672 $3386 $84983 $9443 $2179
Total $473726 $52636 $4555 $249748 $27750 $2401 $223978 $24886 $2154
Passengers per Revenue Hour
Subsidy per Passenger
Cost per Revenue Hour
Farebox Recovery
Weekday 273 $302 $12944 363Saturday 297 $166 $10367 524Sunday 276 $151 $10638 608
Total 283 $183 $10975 527
Passengers Revenue Hours Operating CostsPassenger
RevenueOperating Subsidy
Passengers per Revenue Hour
Subsidy per Passenger
Cost per Revenue Hour
Farebox Recovery
FY 2015 103930 3866 $477523 $209514 $268009 269 $258 $12352 439FY 2016 116942 4673 $531384 $245779 $285605 250 $244 $11373 463FY 2017 122116 4316 $473726 $249748 $223978 283 $183 $10975 527
Histo
ric Tr
ends
FY 20
161
7 DAT
A
Passengers Revenue Hours Revenue Miles
Operating Costs Passenger Revenue Operating Subsidy
62624
103052 103930 116942 122116
0
20000
40000
60000
80000
100000
120000
140000
FY 2013 FY 2014 FY 2015 FY 2016 FY 2017
Passengers
2941
3841 3866
4673 4316
0
1000
2000
3000
4000
5000
FY 2013 FY 2014 FY 2015 FY 2016 FY 2017
Revenue Hours
$330076
$538014 $477523
$531384 $473726
$0
$100000
$200000
$300000
$400000
$500000
$600000
FY 2013 FY 2014 FY 2015 FY 2016 FY 2017
Operating Costs
213
268 269 250
283
00
50
100
150
200
250
300
FY 2013 FY 2014 FY 2015 FY 2016 FY 2017
Passengers per Revenue Hour
$360 $322
$258 $244 $183
$000
$100
$200
$300
$400
$500
FY 2013 FY 2014 FY 2015 FY 2016 FY 2017
Subsidy per Passenger
$11223
$14007 $12352 $11373 $10975
$0
$50
$100
$150
$200
FY 2013 FY 2014 FY 2015 FY 2016 FY 2017
Cost per Revenue Hour
68Rural
Days of Service Wkdy Sa SuAvg Freq (Wkdy Peak) 60 min
Avg Freq (Wkdy Non-Peak) 120 minAvg Freq (Wked) 60-120 min
FY 2017 Farebox Recovery 9 transfer (to route) 13
Clipper usage 12
Annual Avg Monthly Avg Daily Annual Avg Monthly Avg Daily Annual Avg Monthly Avg DailyWeekday 59903 4992 239 7282 607 29 133167 11097 531 Saturday 8410 701 168 1492 124 30 27123 2260 542 Sunday 8285 690 129 1907 159 30 34638 2887 541
Total 76598 6383 210 10680 890 29 194928 16244 534
Annual Avg Monthly Avg Daily Annual Avg Monthly Avg Daily Annual Avg Monthly Avg DailyWeekday $645737 $53811 $2573 $64332 $5361 $256 $581405 $48450 $2316Saturday $131882 $10990 $2638 $9260 $772 $185 $122622 $10219 $2452Sunday $169286 $14107 $2645 $8856 $738 $138 $160430 $13369 $2507
Total $946905 $78909 $2594 $82448 $6871 $226 $864457 $72038 $2368
Passengers per Revenue Hour
Subsidy per Passenger
Cost per Revenue Hour
Farebox Recovery
Weekday 82 $971 $8868 100Saturday 56 $1458 $8841 70Sunday 43 $1936 $8879 52
Total 72 $1129 $8866 87
Passengers Revenue Hours Operating CostsPassenger
RevenueOperating Subsidy
Passengers per Revenue Hour
Subsidy per Passenger
Cost per Revenue Hour
Farebox Recovery
FY 2015 65866 10589 $848305 $80846 $767459 62 $1165 $8011 95FY 2016 70292 10611 $811978 $88808 $723170 66 $1029 $7652 109FY 2017 76598 10680 $946905 $82448 $864457 72 $1129 $8866 87
Histo
ric Tr
ends
FY 20
161
7 DAT
A
Passengers Revenue Hours Revenue Miles
Operating Costs Passenger Revenue Operating Subsidy
48113 56988
65866 70292 76598
0
20000
40000
60000
80000
100000
FY 2013 FY 2014 FY 2015 FY 2016 FY 2017
Passengers
7140 7185
10589 10611 10680
0
2000
4000
6000
8000
10000
12000
FY 2013 FY 2014 FY 2015 FY 2016 FY 2017
Revenue Hours
$532879 $571618
$848305 $811978 $946905
$0
$200000
$400000
$600000
$800000
$1000000
FY 2013 FY 2014 FY 2015 FY 2016 FY 2017
Operating Costs
67 79
62 66 72
00
20
40
60
80
100
FY 2013 FY 2014 FY 2015 FY 2016 FY 2017
Passengers per Revenue Hour
$979 $885
$1165 $1029
$1129
$000$200$400$600$800
$1000$1200$1400
FY 2013 FY 2014 FY 2015 FY 2016 FY 2017
Subsidy per Passenger
$7464 $7955 $8011 $7652 $8866
$0
$50
$100
$150
$200
FY 2013 FY 2014 FY 2015 FY 2016 FY 2017
Cost per Revenue Hour
71XLocal Trunkline
Days of Service WkdyAvg Freq (Wkdy Peak) 30 min
Avg Freq (Wkdy Non-Peak) 60 minAvg Freq (Wked) -
FY 2017 Farebox Recovery 15 transfer (to route) 26
Clipper usage 16
Annual Avg Monthly Avg Daily Annual Avg Monthly Avg Daily Annual Avg Monthly Avg DailyWeekday 121141 10095 479 7705 642 30 174624 14552 690 Saturday - - - - - - - - - Sunday - - - - - - - - -
Total 121141 10095 479 7705 642 30 174624 14552 690
Annual Avg Monthly Avg Daily Annual Avg Monthly Avg Daily Annual Avg Monthly Avg DailyWeekday $1116954 $93080 $4415 $164963 $13747 $652 $951991 $79333 $3763Saturday $ - $ - $ - $ - $ - $ - $ - $ - $ -Sunday $ - $ - $ - $ - $ - $ - $ - $ - $ -
Total $1116954 $93080 $4415 $164963 $13747 $652 $951991 $79333 $3763
Passengers per Revenue Hour
Subsidy per Passenger
Cost per Revenue Hour
Farebox Recovery
Weekday 157 $786 $14496 148Saturday - $ - $ - - Sunday - $ - $ - -
Total 157 $786 $14496 148
Passengers Revenue Hours Operating CostsPassenger
RevenueOperating Subsidy
Passengers per Revenue Hour
Subsidy per Passenger
Cost per Revenue Hour
Farebox Recovery
FY 2015 305440 7666 $1066058 $307659 $758399 398 $248 $13906 289FY 2016 259678 7717 $1075263 $300186 $775077 337 $298 $13934 279FY 2017 121141 7705 $1116954 $164963 $951991 157 $786 $14496 148
Histo
ric Tr
ends
FY 20
161
7 DAT
A
Passengers Revenue Hours Revenue Miles
Operating Costs Passenger Revenue Operating Subsidy
347560 341105 305440
259678
121141
050000
100000150000200000250000300000350000400000
FY 2013 FY 2014 FY 2015 FY 2016 FY 2017
Passengers9038
7578 7666 7717 7705
0
2000
4000
6000
8000
10000
FY 2013 FY 2014 FY 2015 FY 2016 FY 2017
Revenue Hours$1254262
$1116004 $1066058 $1075263 $1116954
$0
$200000
$400000
$600000
$800000
$1000000
$1200000
$1400000
FY 2013 FY 2014 FY 2015 FY 2016 FY 2017
Operating Costs
385 450
398 337
157
00100200300400500600700800
FY 2013 FY 2014 FY 2015 FY 2016 FY 2017
Passengers per Revenue Hour
$253 $222 $248 $298
$786
$000
$200
$400
$600
$800
$1000
FY 2013 FY 2014 FY 2015 FY 2016 FY 2017
Subsidy per Passenger
$13877 $14728 $13906 $13934 $14496
$0
$50
$100
$150
$200
FY 2013 FY 2014 FY 2015 FY 2016 FY 2017
Cost per Revenue Hour
113Supplemental
Days of Service School DaysAvg Freq (Wkdy Peak) 3 trips
Avg Freq (Wkdy Non-Peak) -Avg Freq (Wked) -
FY 2017 Farebox Recovery 29 transfer (to route) 0
Clipper usage 4
Annual Avg Monthly Avg Daily Annual Avg Monthly Avg Daily Annual Avg Monthly Avg DailyWeekday 16829 1530 92 317 29 2 2404 219 13 Saturday - - - - - - - - - Sunday - - - - - - - - -
Total 16829 1530 92 317 29 2 2404 219 13
Annual Avg Monthly Avg Daily Annual Avg Monthly Avg Daily Annual Avg Monthly Avg DailyWeekday $42180 $3835 $230 $12227 $1112 $67 $29953 $2723 $164Saturday $ - $ - $ - $ - $ - $ - $ - $ - $ -Sunday $ - $ - $ - $ - $ - $ - $ - $ - $ -
Total $42180 $3835 $230 $12227 $1112 $67 $29953 $2723 $164
Passengers per TripSubsidy per
PassengerCost per Revenue
HourFarebox Recovery
Weekday 315 $178 $13289 290Saturday - $ - $ - - Sunday - $ - $ - -
Total 315 $178 $13289 290
Passengers Revenue Hours Operating CostsPassenger
RevenueOperating Subsidy Passengers per Trip
Subsidy per Passenger
Cost per Revenue Hour
Farebox Recovery
FY 2015 12241 161 $28599 $10703 $17896 342 $146 $17752 374FY 2016 14601 263 $36924 $12809 $24115 317 $165 $14050 347FY 2017 16829 317 $42180 $12227 $29953 315 $178 $13289 290
Histo
ric Tr
ends
FY 20
161
7 DAT
A
Passengers Revenue Hours Revenue Miles
Operating Costs Passenger Revenue Operating Subsidy
15232 13521
12241 14601
16829
0
5000
10000
15000
20000
FY 2013 FY 2014 FY 2015 FY 2016 FY 2017
Passengers
229
165 161
263
317
0
50
100
150
200
250
300
350
FY 2013 FY 2014 FY 2015 FY 2016 FY 2017
Revenue Hours
$31562
$20182
$28599
$36924 $42180
$0
$10000
$20000
$30000
$40000
$50000
FY 2013 FY 2014 FY 2015 FY 2016 FY 2017
Operating Costs
220
365 342 317 315
00
100
200
300
400
500
FY 2013 FY 2014 FY 2015 FY 2016 FY 2017
Passengers per Trip
$051 $095
$146 $165 $178
$000$100$200$300$400$500$600$700$800
FY 2013 FY 2014 FY 2015 FY 2016 FY 2017
Subsidy per Passenger
$13795 $12261
$17752
$14050 $13289
$0
$50
$100
$150
$200
FY 2013 FY 2014 FY 2015 FY 2016 FY 2017
Cost per Revenue Hour
115Supplemental
Days of Service School DaysAvg Freq (Wkdy Peak) 5 trips
Avg Freq (Wkdy Non-Peak) -Avg Freq (Wked) -
FY 2017 Farebox Recovery 11 transfer (to route) 0
Clipper usage 7
Annual Avg Monthly Avg Daily Annual Avg Monthly Avg Daily Annual Avg Monthly Avg DailyWeekday 14021 1275 71 637 58 3 6963 633 35 Saturday - - - - - - - - - Sunday - - - - - - - - -
Total 14021 1275 71 637 58 3 6963 633 35
Annual Avg Monthly Avg Daily Annual Avg Monthly Avg Daily Annual Avg Monthly Avg DailyWeekday $87534 $7958 $444 $9504 $864 $48 $78030 $7094 $396Saturday $ - $ - $ - $ - $ - $ - $ - $ - $ -Sunday $ - $ - $ - $ - $ - $ - $ - $ - $ -
Total $87534 $7958 $444 $9504 $864 $48 $78030 $7094 $396
Passengers per TripSubsidy per
PassengerCost per Revenue
HourFarebox Recovery
Weekday 185 $557 $13744 109Saturday - $ - $ - - Sunday - $ - $ - -
Total 185 $557 $13744 109
Passengers Revenue Hours Operating CostsPassenger
RevenueOperating Subsidy Passengers per Trip
Subsidy per Passenger
Cost per Revenue Hour
Farebox Recovery
FY 2015 21488 775 $131168 $18863 $112305 221 $523 $16918 144FY 2016 16366 559 $82403 $12638 $69765 168 $426 $14754 153FY 2017 14021 637 $87534 $9504 $78030 185 $557 $13744 109
Histo
ric Tr
ends
FY 20
161
7 DAT
A
Passengers Revenue Hours Revenue Miles
Operating Costs Passenger Revenue Operating Subsidy
13524
21488
16366 14021
0
5000
10000
15000
20000
25000
FY 2013 FY 2014 FY 2015 FY 2016 FY 2017
Passengers
463
775
559 637
0
200
400
600
800
1000
FY 2013 FY 2014 FY 2015 FY 2016 FY 2017
Revenue Hours
$56706
$131168
$82403 $87534
$0
$20000
$40000
$60000
$80000
$100000
$120000
$140000
FY 2013 FY 2014 FY 2015 FY 2016 FY 2017
Operating Costs
232 221 168 185
00
100
200
300
400
500
FY 2013 FY 2014 FY 2015 FY 2016 FY 2017
Passengers per Trip
$362
$523 $426
$557
$000$100$200$300$400$500$600$700$800
FY 2013 FY 2014 FY 2015 FY 2016 FY 2017
Subsidy per Passenger
$12250
$16918 $14754 $13744
$0
$50
$100
$150
$200
FY 2013 FY 2014 FY 2015 FY 2016 FY 2017
Cost per Revenue Hour
117Supplemental
Days of Service School DaysAvg Freq (Wkdy Peak) 6 trips
Avg Freq (Wkdy Non-Peak) -Avg Freq (Wked) -
FY 2017 Farebox Recovery 21 transfer (to route) 0
Clipper usage 2
Annual Avg Monthly Avg Daily Annual Avg Monthly Avg Daily Annual Avg Monthly Avg DailyWeekday 34820 3165 193 640 58 4 4753 432 26 Saturday - - - - - - - - - Sunday - - - - - - - - -
Total 34820 3165 193 640 58 4 4753 432 26
Annual Avg Monthly Avg Daily Annual Avg Monthly Avg Daily Annual Avg Monthly Avg DailyWeekday $81509 $7410 $453 $17140 $1558 $95 $64369 $5852 $358Saturday $ - $ - $ - $ - $ - $ - $ - $ - $ -Sunday $ - $ - $ - $ - $ - $ - $ - $ - $ -
Total $81509 $7410 $453 $17140 $1558 $95 $64369 $5852 $358
Passengers per TripSubsidy per
PassengerCost per Revenue
HourFarebox Recovery
Weekday 284 $185 $12732 210Saturday - $ - $ - - Sunday - $ - $ - -
Total 284 $185 $12732 210
Passengers Revenue Hours Operating CostsPassenger
RevenueOperating Subsidy Passengers per Trip
Subsidy per Passenger
Cost per Revenue Hour
Farebox Recovery
FY 2015 50008 509 $77168 $77528 ($360) 399 ($001) $15158 1005FY 2016 33705 552 $77694 $23478 $54216 269 $161 $14075 302FY 2017 34820 640 $81509 $17140 $64369 284 $185 $12732 210
Histo
ric Tr
ends
FY 20
161
7 DAT
A
Passengers Revenue Hours Revenue Miles
Operating Costs Passenger Revenue Operating Subsidy
35174 34496
50008
33705 34820
0
10000
20000
30000
40000
50000
60000
FY 2013 FY 2014 FY 2015 FY 2016 FY 2017
Passengers
299 341
509 552
640
0
100
200
300
400
500
600
700
FY 2013 FY 2014 FY 2015 FY 2016 FY 2017
Revenue Hours
$41176 $41796
$77168 $77694 $81509
$0
$20000
$40000
$60000
$80000
$100000
FY 2013 FY 2014 FY 2015 FY 2016 FY 2017
Operating Costs
436 406 399
269 284
00
100
200
300
400
500
FY 2013 FY 2014 FY 2015 FY 2016 FY 2017
Passengers per Trip
($012) ($028) ($001)
$161 $185
-$200
-$100
$000
$100
$200
$300
$400
$500
$600
FY 2013 FY 2014 FY 2015 FY 2016 FY 2017
Subsidy per Passenger$13790
$12253
$15158 $14075
$12732
$0$20$40$60$80
$100$120$140$160
FY 2013 FY 2014 FY 2015 FY 2016 FY 2017
Cost per Revenue Hour
119Supplemental
Days of Service School DaysAvg Freq (Wkdy Peak) 5 trips
Avg Freq (Wkdy Non-Peak) -Avg Freq (Wked) -
FY 2017 Farebox Recovery 34 transfer (to route) 0
Clipper usage 5
Annual Avg Monthly Avg Daily Annual Avg Monthly Avg Daily Annual Avg Monthly Avg DailyWeekday 27161 2469 151 374 34 2 6893 627 38 Saturday - - - - - - - - - Sunday - - - - - - - - -
Total 27161 2469 151 374 34 2 6893 627 38
Annual Avg Monthly Avg Daily Annual Avg Monthly Avg Daily Annual Avg Monthly Avg DailyWeekday $56273 $5116 $313 $18859 $1714 $105 $37414 $3401 $208Saturday $ - $ - $ - $ - $ - $ - $ - $ - $ -Sunday $ - $ - $ - $ - $ - $ - $ - $ - $ -
Total $56273 $5116 $313 $18859 $1714 $105 $37414 $3401 $208
Passengers per TripSubsidy per
PassengerCost per Revenue
HourFarebox Recovery
Weekday 313 $138 $15058 335Saturday - $ - $ - - Sunday - $ - $ - -
Total 313 $138 $15058 335
Passengers Revenue Hours Operating CostsPassenger
RevenueOperating Subsidy Passengers per Trip
Subsidy per Passenger
Cost per Revenue Hour
Farebox Recovery
FY 2015 28376 466 $85243 $24699 $60544 319 $213 $18292 290FY 2016 30906 431 $68366 $28456 $39910 317 $129 $15877 416FY 2017 27161 374 $56273 $18859 $37414 313 $138 $15058 335
Histo
ric Tr
ends
FY 20
161
7 DAT
A
Passengers Revenue Hours Revenue Miles
Operating Costs Passenger Revenue Operating Subsidy
27987 28376
30906
27161
25000
26000
27000
28000
29000
30000
31000
32000
FY 2013 FY 2014 FY 2015 FY 2016 FY 2017
Passengers526
466 431
374
0
100
200
300
400
500
600
FY 2013 FY 2014 FY 2015 FY 2016 FY 2017
Revenue Hours
$64440
$85243
$68366 $56273
$0
$20000
$40000
$60000
$80000
$100000
FY 2013 FY 2014 FY 2015 FY 2016 FY 2017
Operating Costs
272 319 317 313
00
100
200
300
400
500
FY 2013 FY 2014 FY 2015 FY 2016 FY 2017
Passengers per Trip
$175 $213 $129 $138
$000$100$200$300$400$500$600$700$800
FY 2013 FY 2014 FY 2015 FY 2016 FY 2017
Subsidy per Passenger
$12251
$18292 $15877 $15058
$0
$50
$100
$150
$200
FY 2013 FY 2014 FY 2015 FY 2016 FY 2017
Cost per Revenue Hour
122Partnership
Days of Service WkdyAvg Freq (Wkdy Peak) -
Avg Freq (Wkdy Non-Peak) 30 minAvg Freq (Wked) -
FY 2017 Farebox Recovery 66 transfer (to route) 9
Clipper usage 6
Annual Avg Monthly Avg Daily Annual Avg Monthly Avg Daily Annual Avg Monthly Avg DailyWeekday 19860 1986 113 1696 170 10 15480 1548 88 Saturday - - - - - - - - - Sunday - - - - - - - - -
Total 19860 1986 113 1696 170 10 15480 1548 88
Annual Avg Monthly Avg Daily Annual Avg Monthly Avg Daily Annual Avg Monthly Avg DailyWeekday $183943 $18394 $1045 $121007 $12101 $688 $62936 $6294 $358Saturday $ - $ - $ - $ - $ - $ - $ - $ - $ -Sunday $ - $ - $ - $ - $ - $ - $ - $ - $ -
Total $183943 $18394 $1045 $121007 $12101 $688 $62936 $6294 $358
Passengers per Revenue Hour
Subsidy per Passenger
Cost per Revenue Hour
Farebox Recovery
Weekday 117 $317 $10844 658Saturday - $ - $ - - Sunday - $ - $ - -
Total 117 $317 $10844 658
Passengers Revenue Hours Operating CostsPassenger
RevenueOperating Subsidy
Passengers per Revenue Hour
Subsidy per Passenger
Cost per Revenue Hour
Farebox Recovery
FY 2015FY 2016 20360 2932 $325230 $149686 $175544 69 $862 $11094 460FY 2017 19860 1696 $183943 $121007 $62936 117 $317 $10844 658
Histo
ric Tr
ends
FY 20
161
7 DAT
A
Passengers Revenue Hours Revenue Miles
Operating Costs Passenger Revenue Operating Subsidy
20360 19860
0
5000
10000
15000
20000
25000
FY 2013 FY 2014 FY 2015 FY 2016 FY 2017
Passengers2932
1696
0
500
1000
1500
2000
2500
3000
3500
FY 2013 FY 2014 FY 2015 FY 2016 FY 2017
Revenue Hours$325230
$183943
$0
$50000
$100000
$150000
$200000
$250000
$300000
$350000
FY 2013 FY 2014 FY 2015 FY 2016 FY 2017
Operating Costs
69
117
00
20
40
60
80
100
120
140
FY 2013 FY 2014 FY 2015 FY 2016 FY 2017
Passengers per Revenue Hour$862
$317
$000
$200
$400
$600
$800
$1000
FY 2013 FY 2014 FY 2015 FY 2016 FY 2017
Subsidy per Passenger
$11094 $10844
$0
$50
$100
$150
$200
FY 2013 FY 2014 FY 2015 FY 2016 FY 2017
Cost per Revenue Hour
125Supplemental
Days of Service School DaysAvg Freq (Wkdy Peak) 4 trips
Avg Freq (Wkdy Non-Peak) -Avg Freq (Wked) -
FY 2017 Farebox Recovery 16 transfer (to route) 1
Clipper usage 8
Annual Avg Monthly Avg Daily Annual Avg Monthly Avg Daily Annual Avg Monthly Avg DailyWeekday 13757 1251 76 600 55 3 8580 780 48 Saturday - - - - - - - - - Sunday - - - - - - - - -
Total 13757 1251 76 600 55 3 8580 780 48
Annual Avg Monthly Avg Daily Annual Avg Monthly Avg Daily Annual Avg Monthly Avg DailyWeekday $72469 $6588 $403 $11570 $1052 $64 $60899 $5536 $338Saturday $ - $ - $ - $ - $ - $ - $ - $ - $ -Sunday $ - $ - $ - $ - $ - $ - $ - $ - $ -
Total $72469 $6588 $403 $11570 $1052 $64 $60899 $5536 $338
Passengers per TripSubsidy per
PassengerCost per Revenue
HourFarebox Recovery
Weekday 193 $443 $12086 160Saturday - $ - $ - - Sunday - $ - $ - -
Total 193 $443 $12086 160
Passengers Revenue Hours Operating CostsPassenger
RevenueOperating Subsidy Passengers per Trip
Subsidy per Passenger
Cost per Revenue Hour
Farebox Recovery
FY 2015 13298 578 $87015 $11914 $75101 186 $565 $15054 137FY 2016 13197 595 $77991 $12684 $65307 182 $495 $13117 163FY 2017 13757 600 $72469 $11570 $60899 193 $443 $12086 160
Histo
ric Tr
ends
FY 20
161
7 DAT
A
Passengers Revenue Hours Revenue Miles
Operating Costs Passenger Revenue Operating Subsidy
8798 7189
13298 13197 13757
02000400060008000
10000120001400016000
FY 2013 FY 2014 FY 2015 FY 2016 FY 2017
Passengers
100 90
578 595 600
0
100
200
300
400
500
600
700
FY 2013 FY 2014 FY 2015 FY 2016 FY 2017
Revenue Hours
$13752 $10979
$87015 $77991
$72469
$0
$20000
$40000
$60000
$80000
$100000
FY 2013 FY 2014 FY 2015 FY 2016 FY 2017
Operating Costs
492
402
186 182 193
00
100
200
300
400
500
FY 2013 FY 2014 FY 2015 FY 2016 FY 2017
Passengers per Trip
$015 $002
$565 $495
$443
$000$100$200$300$400$500$600$700$800
FY 2013 FY 2014 FY 2015 FY 2016 FY 2017
Subsidy per Passenger$13821
$12267
$15054 $13117
$12086
$0$20$40$60$80
$100$120$140$160
FY 2013 FY 2014 FY 2015 FY 2016 FY 2017
Cost per Revenue Hour
139Supplemental
Days of Service School DaysAvg Freq (Wkdy Peak) 2 trips
Avg Freq (Wkdy Non-Peak) -Avg Freq (Wked) -
FY 2017 Farebox Recovery 20 transfer (to route) 0
Clipper usage 24
Annual Avg Monthly Avg Daily Annual Avg Monthly Avg Daily Annual Avg Monthly Avg DailyWeekday 6414 583 36 253 23 1 4127 375 23 Saturday - - - - - - - - - Sunday - - - - - - - - -
Total 6414 583 36 253 23 1 4127 375 23
Annual Avg Monthly Avg Daily Annual Avg Monthly Avg Daily Annual Avg Monthly Avg DailyWeekday $33182 $3017 $184 $6635 $603 $37 $26547 $2413 $147Saturday $ - $ - $ - $ - $ - $ - $ - $ - $ -Sunday $ - $ - $ - $ - $ - $ - $ - $ - $ -
Total $33182 $3017 $184 $6635 $603 $37 $26547 $2413 $147
Passengers per TripSubsidy per
PassengerCost per Revenue
HourFarebox Recovery
Weekday 179 $414 $13110 200Saturday - $ - $ - - Sunday - $ - $ - -
Total 179 $414 $13110 200
Passengers Revenue Hours Operating CostsPassenger
RevenueOperating Subsidy Passengers per Trip
Subsidy per Passenger
Cost per Revenue Hour
Farebox Recovery
FY 2015 5906 225 $36437 $5258 $31179 164 $528 $16173 144FY 2016 6391 315 $43776 $6241 $37535 160 $587 $13880 143FY 2017 6414 253 $33182 $6635 $26547 179 $414 $13110 200
Histo
ric Tr
ends
FY 20
161
7 DAT
A
Passengers Revenue Hours Revenue Miles
Operating Costs Passenger Revenue Operating Subsidy
4232 4026
5906 6391 6414
0
1000
2000
3000
4000
5000
6000
7000
FY 2013 FY 2014 FY 2015 FY 2016 FY 2017
Passengers
226 227 225
315
253
0
50
100
150
200
250
300
350
FY 2013 FY 2014 FY 2015 FY 2016 FY 2017
Revenue Hours
$31306 $27734
$36437
$43776
$33182
$0
$10000
$20000
$30000
$40000
$50000
FY 2013 FY 2014 FY 2015 FY 2016 FY 2017
Operating Costs
120 111 164 160 179
00
100
200
300
400
500
FY 2013 FY 2014 FY 2015 FY 2016 FY 2017
Passengers per Trip
$427
$628 $528
$587
$414
$000$100$200$300$400$500$600$700$800
FY 2013 FY 2014 FY 2015 FY 2016 FY 2017
Subsidy per Passenger
$13834 $12239
$16173 $13880 $13110
$0
$50
$100
$150
$200
FY 2013 FY 2014 FY 2015 FY 2016 FY 2017
Cost per Revenue Hour
145Supplemental
Days of Service School DaysAvg Freq (Wkdy Peak) 2-3 trips
Avg Freq (Wkdy Non-Peak) -Avg Freq (Wked) -
FY 2017 Farebox Recovery 29 transfer (to route) 5
Clipper usage 2
Annual Avg Monthly Avg Daily Annual Avg Monthly Avg Daily Annual Avg Monthly Avg DailyWeekday 16406 1491 90 191 17 1 2175 198 12 Saturday - - - - - - - - - Sunday - - - - - - - - -
Total 16406 1491 90 191 17 1 2175 198 12
Annual Avg Monthly Avg Daily Annual Avg Monthly Avg Daily Annual Avg Monthly Avg DailyWeekday $25426 $2311 $139 $7258 $660 $40 $18168 $1652 $99Saturday $ - $ - $ - $ - $ - $ - $ - $ - $ -Sunday $ - $ - $ - $ - $ - $ - $ - $ - $ -
Total $25426 $2311 $139 $7258 $660 $40 $18168 $1652 $99
Passengers per TripSubsidy per
PassengerCost per Revenue
HourFarebox Recovery
Weekday 372 $111 $13347 285Saturday - $ - $ - - Sunday - $ - $ - -
Total 372 $111 $13347 285
Passengers Revenue Hours Operating CostsPassenger
RevenueOperating Subsidy Passengers per Trip
Subsidy per Passenger
Cost per Revenue Hour
Farebox Recovery
FY 2015 6911 87 $13373 $5858 $7515 337 $109 $15442 438FY 2016 10268 167 $21672 $6341 $15331 396 $149 $12993 293FY 2017 16406 191 $25426 $7258 $18168 372 $111 $13347 285
Histo
ric Tr
ends
FY 20
161
7 DAT
A
Passengers Revenue Hours Revenue Miles
Operating Costs Passenger Revenue Operating Subsidy
6911
10268
16406
0
5000
10000
15000
20000
FY 2013 FY 2014 FY 2015 FY 2016 FY 2017
Passengers
87
167 191
0
50
100
150
200
250
FY 2013 FY 2014 FY 2015 FY 2016 FY 2017
Revenue Hours
$13373
$21672 $25426
$0
$5000
$10000
$15000
$20000
$25000
$30000
FY 2013 FY 2014 FY 2015 FY 2016 FY 2017
Operating Costs
337 396 372
00
100
200
300
400
500
FY 2013 FY 2014 FY 2015 FY 2016 FY 2017
Passengers per Trip
$109 $149 $111
$000$100$200$300$400$500$600$700$800
FY 2013 FY 2014 FY 2015 FY 2016 FY 2017
Subsidy per Passenger
$15442 $12993 $13347
$0
$50
$100
$150
$200
FY 2013 FY 2014 FY 2015 FY 2016 FY 2017
Cost per Revenue Hour
151Supplemental
Days of Service School DaysAvg Freq (Wkdy Peak) 4-5 trips
Avg Freq (Wkdy Non-Peak) -Avg Freq (Wked) -
FY 2017 Farebox Recovery 25 transfer (to route) 1
Clipper usage 4
Annual Avg Monthly Avg Daily Annual Avg Monthly Avg Daily Annual Avg Monthly Avg DailyWeekday 36801 3346 204 594 54 3 10649 968 59 Saturday - - - - - - - - - Sunday - - - - - - - - -
Total 36801 3346 204 594 54 3 10649 968 59
Annual Avg Monthly Avg Daily Annual Avg Monthly Avg Daily Annual Avg Monthly Avg DailyWeekday $73842 $6713 $410 $18463 $1678 $103 $55379 $5034 $308Saturday $ - $ - $ - $ - $ - $ - $ - $ - $ -Sunday $ - $ - $ - $ - $ - $ - $ - $ - $ -
Total $73842 $6713 $410 $18463 $1678 $103 $55379 $5034 $308
Passengers per TripSubsidy per
PassengerCost per Revenue
HourFarebox Recovery
Weekday 428 $150 $12442 250Saturday - $ - $ - - Sunday - $ - $ - -
Total 428 $150 $12442 250
Passengers Revenue Hours Operating CostsPassenger
RevenueOperating Subsidy Passengers per Trip
Subsidy per Passenger
Cost per Revenue Hour
Farebox Recovery
FY 2015 39309 911 $134174 $34376 $99798 315 $254 $14722 256FY 2016 42643 759 $100712 $25851 $74861 456 $176 $13267 257FY 2017 36801 594 $73842 $18463 $55379 428 $150 $12442 250
Histo
ric Tr
ends
FY 20
161
7 DAT
A
Passengers Revenue Hours Revenue Miles
Operating Costs Passenger Revenue Operating Subsidy
39537 39309
42643
36801
32000
34000
36000
38000
40000
42000
44000
FY 2013 FY 2014 FY 2015 FY 2016 FY 2017
Passengers
784 911
759
594
0
200
400
600
800
1000
FY 2013 FY 2014 FY 2015 FY 2016 FY 2017
Revenue Hours
$95932
$134174
$100712
$73842
$0$20000$40000$60000$80000
$100000$120000$140000$160000
FY 2013 FY 2014 FY 2015 FY 2016 FY 2017
Operating Costs
368 315
456 428
00
100
200
300
400
500
FY 2013 FY 2014 FY 2015 FY 2016 FY 2017
Passengers per Trip
$188 $254
$176 $150
$000$100$200$300$400$500$600$700$800
FY 2013 FY 2014 FY 2015 FY 2016 FY 2017
Subsidy per Passenger
$12233
$14722 $13267 $12442
$0$20$40$60$80
$100$120$140$160
FY 2013 FY 2014 FY 2015 FY 2016 FY 2017
Cost per Revenue Hour
154Supplemental
Days of Service School DaysAvg Freq (Wkdy Peak) 3 trips
Avg Freq (Wkdy Non-Peak) -Avg Freq (Wked) -
FY 2017 Farebox Recovery 21 transfer (to route) 0
Clipper usage 5
Annual Avg Monthly Avg Daily Annual Avg Monthly Avg Daily Annual Avg Monthly Avg DailyWeekday 13738 1249 76 358 33 2 4342 395 24 Saturday - - - - - - - - - Sunday - - - - - - - - -
Total 13738 1249 76 358 33 2 4342 395 24
Annual Avg Monthly Avg Daily Annual Avg Monthly Avg Daily Annual Avg Monthly Avg DailyWeekday $41965 $3815 $233 $8847 $804 $49 $33118 $3011 $184Saturday $ - $ - $ - $ - $ - $ - $ - $ - $ -Sunday $ - $ - $ - $ - $ - $ - $ - $ - $ -
Total $41965 $3815 $233 $8847 $804 $49 $33118 $3011 $184
Passengers per TripSubsidy per
PassengerCost per Revenue
HourFarebox Recovery
Weekday 255 $241 $11729 211Saturday - $ - $ - - Sunday - $ - $ - -
Total 255 $241 $11729 211
Passengers Revenue Hours Operating CostsPassenger
RevenueOperating Subsidy Passengers per Trip
Subsidy per Passenger
Cost per Revenue Hour
Farebox Recovery
FY 2015 15376 293 $42604 $13174 $29430 388 $191 $14541 309FY 2016 17858 360 $46133 $14660 $31473 311 $176 $12808 318FY 2017 13738 358 $41965 $8847 $33118 255 $241 $11729 211
Histo
ric Tr
ends
FY 20
161
7 DAT
A
Passengers Revenue Hours Revenue Miles
Operating Costs Passenger Revenue Operating Subsidy
12138
15376 17858
13738
0
5000
10000
15000
20000
FY 2013 FY 2014 FY 2015 FY 2016 FY 2017
Passengers
310 293
360 358
050
100150200250300350400
FY 2013 FY 2014 FY 2015 FY 2016 FY 2017
Revenue Hours
$37913 $42604
$46133 $41965
$0
$10000
$20000
$30000
$40000
$50000
FY 2013 FY 2014 FY 2015 FY 2016 FY 2017
Operating Costs
291
388
311 255
00
100
200
300
400
500
FY 2013 FY 2014 FY 2015 FY 2016 FY 2017
Passengers per Trip
$256 $191 $176
$241
$000$100$200$300$400$500$600$700$800
FY 2013 FY 2014 FY 2015 FY 2016 FY 2017
Subsidy per Passenger
$12246
$14541 $12808
$11729
$0$20$40$60$80
$100$120$140$160
FY 2013 FY 2014 FY 2015 FY 2016 FY 2017
Cost per Revenue Hour
219Local Connector
Days of Service Wkdy Sa SuAvg Freq (Wkdy Peak) 30 min
Avg Freq (Wkdy Non-Peak) 30 minAvg Freq (Wked) 30 min
FY 2017 Farebox Recovery 11 transfer (to route) 20
Clipper usage 11
Annual Avg Monthly Avg Daily Annual Avg Monthly Avg Daily Annual Avg Monthly Avg DailyWeekday 40817 3401 161 5020 418 20 58766 4897 232 Saturday 4888 407 94 637 53 12 10931 911 210 Sunday 4744 395 79 735 61 12 12607 1051 210
Total 50449 4204 138 6392 533 18 82304 6859 225
Annual Avg Monthly Avg Daily Annual Avg Monthly Avg Daily Annual Avg Monthly Avg DailyWeekday $462388 $38532 $1828 $51411 $4284 $203 $410977 $34248 $1624Saturday $59904 $4992 $1152 $6230 $519 $120 $53674 $4473 $1032Sunday $68932 $5744 $1149 $6460 $538 $108 $62472 $5206 $1041
Total $591224 $49269 $1620 $64101 $5342 $176 $527123 $43927 $1444
Passengers per Revenue Hour
Subsidy per Passenger
Cost per Revenue Hour
Farebox Recovery
Weekday 81 $1007 $9212 111Saturday 77 $1098 $9401 104Sunday 65 $1317 $9381 94
Total 79 $1045 $9250 108
Passengers Revenue Hours Operating CostsPassenger
RevenueOperating Subsidy
Passengers per Revenue Hour
Subsidy per Passenger
Cost per Revenue Hour
Farebox Recovery
FY 2015 60906 6585 $569962 $65747 $504215 92 $828 $8656 115FY 2016 55610 6591 $590663 $73164 $517499 84 $931 $8961 124FY 2017 50449 6392 $591224 $64101 $527123 79 $1045 $9250 108
Histo
ric Tr
ends
FY 20
161
7 DAT
A
Passengers Revenue Hours Revenue Miles
Operating Costs Passenger Revenue Operating Subsidy
55543 60906
55610 50449
0
10000
20000
30000
40000
50000
60000
70000
FY 2013 FY 2014 FY 2015 FY 2016 FY 2017
Passengers
5734
6585 6591 6392
520054005600580060006200640066006800
FY 2013 FY 2014 FY 2015 FY 2016 FY 2017
Revenue Hours
$522978
$569962
$590663 $591224
$480000
$500000
$520000
$540000
$560000
$580000
$600000
FY 2013 FY 2014 FY 2015 FY 2016 FY 2017
Operating Costs
97 92 84 79
00
20
40
60
80
100
120
140
FY 2013 FY 2014 FY 2015 FY 2016 FY 2017
Passengers per Revenue Hour
$851 $828 $931
$1045
$000$200$400$600$800
$1000$1200$1400
FY 2013 FY 2014 FY 2015 FY 2016 FY 2017
Subsidy per Passenger
$9121 $8656 $8961 $9250
$0
$50
$100
$150
$200
FY 2013 FY 2014 FY 2015 FY 2016 FY 2017
Cost per Revenue Hour
228Local Connector
Days of Service Wkdy Sa SuAvg Freq (Wkdy Peak) 60 min
Avg Freq (Wkdy Non-Peak) 60 minAvg Freq (Wked) 60 min
FY 2017 Farebox Recovery 11 transfer (to route) 17
Clipper usage 15
Annual Avg Monthly Avg Daily Annual Avg Monthly Avg Daily Annual Avg Monthly Avg DailyWeekday 57316 4776 227 7175 598 28 65884 5490 260 Saturday 8218 685 158 1331 111 26 13020 1085 250 Sunday 5806 484 97 1536 128 26 15023 1252 250
Total 71340 5945 195 10042 837 28 93926 7827 257
Annual Avg Monthly Avg Daily Annual Avg Monthly Avg Daily Annual Avg Monthly Avg DailyWeekday $646194 $53850 $2554 $80857 $6738 $320 $565337 $47111 $2235Saturday $120205 $10017 $2312 $12568 $1047 $242 $107637 $8970 $2070Sunday $138407 $11534 $2307 $10487 $874 $175 $127920 $10660 $2132
Total $904806 $75401 $2479 $103912 $8659 $285 $800894 $66741 $2194
Passengers per Revenue Hour
Subsidy per Passenger
Cost per Revenue Hour
Farebox Recovery
Weekday 80 $986 $9006 125Saturday 62 $1310 $9030 105Sunday 38 $2203 $9011 76
Total 71 $1123 $9010 115
Passengers Revenue Hours Operating CostsPassenger
RevenueOperating Subsidy
Passengers per Revenue Hour
Subsidy per Passenger
Cost per Revenue Hour
Farebox Recovery
FY 2015 15287 2828 $239879 $18274 $221605 54 $1450 $8482 76FY 2016 17522 3185 $280634 $28092 $252542 55 $1441 $8812 100FY 2017 71340 10042 $904806 $103912 $800894 71 $1123 $9010 115
Histo
ric Tr
ends
FY 20
161
7 DAT
A
Passengers Revenue Hours Revenue Miles
Operating Costs Passenger Revenue Operating Subsidy
5854 15287 17522
71340
01000020000300004000050000600007000080000
FY 2013 FY 2014 FY 2015 FY 2016 FY 2017
Passengers
970
2828 3185
10042
0
2000
4000
6000
8000
10000
12000
FY 2013 FY 2014 FY 2015 FY 2016 FY 2017
Revenue Hours
$85183
$239879 $280634
$904806
$0
$200000
$400000
$600000
$800000
$1000000
FY 2013 FY 2014 FY 2015 FY 2016 FY 2017
Operating Costs
60 54 55 71
00
20
40
60
80
100
120
140
FY 2013 FY 2014 FY 2015 FY 2016 FY 2017
Passengers per Revenue Hour$1358
$1450 $1441
$1123
$000$200$400$600$800
$1000$1200$1400
FY 2013 FY 2014 FY 2015 FY 2016 FY 2017
Subsidy per Passenger
$8779 $8482 $8812 $9010
$0
$50
$100
$150
$200
FY 2013 FY 2014 FY 2015 FY 2016 FY 2017
Cost per Revenue Hour
233Local Connector
Days of Service Wkdy Sa SuAvg Freq (Wkdy Peak) 60 min
Avg Freq (Wkdy Non-Peak) 60 minAvg Freq (Wked) 60 min
FY 2017 Farebox Recovery 13 transfer (to route) 16
Clipper usage 10
Annual Avg Monthly Avg Daily Annual Avg Monthly Avg Daily Annual Avg Monthly Avg DailyWeekday 35589 2966 141 3306 276 13 38809 3234 153 Saturday 3911 326 75 490 41 9 5829 486 112 Sunday 3298 275 55 566 47 9 6726 561 112
Total 42798 3567 117 4363 364 12 51364 4280 141
Annual Avg Monthly Avg Daily Annual Avg Monthly Avg Daily Annual Avg Monthly Avg DailyWeekday $302758 $25230 $1197 $42450 $3538 $168 $260308 $21692 $1029Saturday $44829 $3736 $862 $5018 $418 $97 $39811 $3318 $766Sunday $51616 $4301 $860 $4533 $378 $76 $47083 $3924 $785
Total $399203 $33267 $1094 $52001 $4333 $142 $347202 $28934 $951
Passengers per Revenue Hour
Subsidy per Passenger
Cost per Revenue Hour
Farebox Recovery
Weekday 108 $731 $9158 140Saturday 80 $1018 $9141 112Sunday 58 $1428 $9118 88
Total 98 $811 $9151 130
Passengers Revenue Hours Operating CostsPassenger
RevenueOperating Subsidy
Passengers per Revenue Hour
Subsidy per Passenger
Cost per Revenue Hour
Farebox Recovery
FY 2015 50342 4366 $371602 $52526 $319076 115 $634 $8512 141FY 2016 49494 4384 $388005 $59296 $328709 113 $664 $8851 153FY 2017 42798 4363 $399203 $52001 $347202 98 $811 $9151 130
Histo
ric Tr
ends
FY 20
161
7 DAT
A
Passengers Revenue Hours Revenue Miles
Operating Costs Passenger Revenue Operating Subsidy
39956
50422 50342 49494 42798
0
10000
20000
30000
40000
50000
60000
FY 2013 FY 2014 FY 2015 FY 2016 FY 2017
Passengers
3981
4144
4366 4384 4363
370038003900400041004200430044004500
FY 2013 FY 2014 FY 2015 FY 2016 FY 2017
Revenue Hours
$350499
$378792 $371602
$388005 $399203
$320000$330000$340000$350000$360000$370000$380000$390000$400000$410000
FY 2013 FY 2014 FY 2015 FY 2016 FY 2017
Operating Costs
100
122 115 113 98
00
20
40
60
80
100
120
140
FY 2013 FY 2014 FY 2015 FY 2016 FY 2017
Passengers per Revenue Hour
$760 $661 $634 $664
$811
$000$200$400$600$800
$1000$1200$1400
FY 2013 FY 2014 FY 2015 FY 2016 FY 2017
Subsidy per Passenger
$8805 $9142 $8512 $8851 $9151
$0
$50
$100
$150
$200
FY 2013 FY 2014 FY 2015 FY 2016 FY 2017
Cost per Revenue Hour
245Local Connector
Days of Service Wkdy Sa SuAvg Freq (Wkdy Peak) 60 min
Avg Freq (Wkdy Non-Peak) 60 minAvg Freq (Wked) 60 min
FY 2017 Farebox Recovery 15 transfer (to route) 13
Clipper usage 13
Annual Avg Monthly Avg Daily Annual Avg Monthly Avg Daily Annual Avg Monthly Avg DailyWeekday 41761 3480 165 3014 251 12 28706 2392 113 Saturday 4220 352 81 620 52 12 5778 482 111 Sunday 3785 315 63 715 60 12 6667 556 111
Total 49766 4147 136 4349 362 12 41152 3429 113
Annual Avg Monthly Avg Daily Annual Avg Monthly Avg Daily Annual Avg Monthly Avg DailyWeekday $271762 $22647 $1074 $44873 $3739 $177 $226889 $18907 $897Saturday $55697 $4641 $1071 $6217 $518 $120 $49480 $4123 $952Sunday $64137 $5345 $1069 $5878 $490 $98 $58259 $4855 $971
Total $391596 $32633 $1073 $56968 $4747 $156 $334628 $27886 $917
Passengers per Revenue Hour
Subsidy per Passenger
Cost per Revenue Hour
Farebox Recovery
Weekday 139 $543 $9016 165Saturday 68 $1173 $8988 112Sunday 53 $1539 $8970 92
Total 114 $672 $9004 145
Passengers Revenue Hours Operating CostsPassenger
RevenueOperating Subsidy
Passengers per Revenue Hour
Subsidy per Passenger
Cost per Revenue Hour
Farebox Recovery
FY 2015FY 2016 2184 227 $19695 $3137 $16558 96 $758 $8695 159FY 2017 49766 4349 $391596 $56968 $334628 114 $672 $9004 145
Histo
ric Tr
ends
FY 20
161
7 DAT
A
Passengers Revenue Hours Revenue Miles
Operating Costs Passenger Revenue Operating Subsidy
2184
49766
0
10000
20000
30000
40000
50000
60000
FY 2013 FY 2014 FY 2015 FY 2016 FY 2017
Passengers
227
4349
0
1000
2000
3000
4000
5000
FY 2013 FY 2014 FY 2015 FY 2016 FY 2017
Revenue Hours
$19695
$391596
$0
$100000
$200000
$300000
$400000
$500000
FY 2013 FY 2014 FY 2015 FY 2016 FY 2017
Operating Costs
96 114
00
20
40
60
80
100
120
140
FY 2013 FY 2014 FY 2015 FY 2016 FY 2017
Passengers per Revenue Hour
$758 $672
$000$200$400$600$800
$1000$1200$1400
FY 2013 FY 2014 FY 2015 FY 2016 FY 2017
Subsidy per Passenger
$8695 $9004
$0
$50
$100
$150
$200
FY 2013 FY 2014 FY 2015 FY 2016 FY 2017
Cost per Revenue Hour
251Local Connector
Days of Service Wkdy Sa SuAvg Freq (Wkdy Peak) 60 min
Avg Freq (Wkdy Non-Peak) 60 minAvg Freq (Wked) 60 min
FY 2017 Farebox Recovery 11 transfer (to route) 8
Clipper usage 8
Annual Avg Monthly Avg Daily Annual Avg Monthly Avg Daily Annual Avg Monthly Avg DailyWeekday 76675 6390 303 6754 563 27 95654 7971 378 Saturday 9952 829 191 1325 110 25 18630 1553 358 Sunday 8879 740 148 1528 127 25 21497 1791 358
Total 95506 7959 262 9607 801 26 135781 11315 372
Annual Avg Monthly Avg Daily Annual Avg Monthly Avg Daily Annual Avg Monthly Avg DailyWeekday $625542 $52129 $2472 $78006 $6501 $308 $547536 $45628 $2164Saturday $122485 $10207 $2355 $12104 $1009 $233 $110381 $9198 $2123Sunday $140992 $11749 $2350 $11713 $976 $195 $129279 $10773 $2155
Total $889019 $74085 $2436 $101823 $8485 $279 $787196 $65600 $2157
Passengers per Revenue Hour
Subsidy per Passenger
Cost per Revenue Hour
Farebox Recovery
Weekday 114 $714 $9262 125Saturday 75 $1109 $9246 99Sunday 58 $1456 $9225 83
Total 99 $824 $9254 115
Passengers Revenue Hours Operating CostsPassenger
RevenueOperating Subsidy
Passengers per Revenue Hour
Subsidy per Passenger
Cost per Revenue Hour
Farebox Recovery
FY 2015 97647 9172 $800242 $103081 $697161 106 $714 $8725 129FY 2016 98886 9226 $831623 $120959 $710664 107 $719 $9014 145FY 2017 95506 9607 $889019 $101823 $787196 99 $824 $9254 115
Histo
ric Tr
ends
FY 20
161
7 DAT
A
Passengers Revenue Hours Revenue Miles
Operating Costs Passenger Revenue Operating Subsidy
87073
97647 98886
95506
80000
85000
90000
95000
100000
FY 2013 FY 2014 FY 2015 FY 2016 FY 2017
Passengers
8322
9172 9226
9607
7500
8000
8500
9000
9500
10000
FY 2013 FY 2014 FY 2015 FY 2016 FY 2017
Revenue Hours
$772570
$800242
$831623
$889019
$700000
$750000
$800000
$850000
$900000
FY 2013 FY 2014 FY 2015 FY 2016 FY 2017
Operating Costs
105 106 107 99
00
20
40
60
80
100
120
140
FY 2013 FY 2014 FY 2015 FY 2016 FY 2017
Passengers per Revenue Hour
$797 $714 $719
$824
$000$200$400$600$800
$1000$1200$1400
FY 2013 FY 2014 FY 2015 FY 2016 FY 2017
Subsidy per Passenger
$9284 $8725 $9014 $9254
$0
$50
$100
$150
$200
FY 2013 FY 2014 FY 2015 FY 2016 FY 2017
Cost per Revenue Hour
257Local Connector
Days of Service WkdyAvg Freq (Wkdy Peak) 60 min
Avg Freq (Wkdy Non-Peak) 60 minAvg Freq (Wked) -
FY 2017 Farebox Recovery 12 transfer (to route) 6
Clipper usage 13
Annual Avg Monthly Avg Daily Annual Avg Monthly Avg Daily Annual Avg Monthly Avg DailyWeekday 69126 5761 273 7643 637 30 85748 7146 339 Saturday - - - - - - - - - Sunday - - - - - - - - -
Total 69126 5761 273 7643 637 30 85748 7146 339
Annual Avg Monthly Avg Daily Annual Avg Monthly Avg Daily Annual Avg Monthly Avg DailyWeekday $697953 $58163 $2759 $82621 $6885 $327 $615332 $51278 $2432Saturday $ - $ - $ - $ - $ - $ - $ - $ - $ -Sunday $ - $ - $ - $ - $ - $ - $ - $ - $ -
Total $697953 $58163 $2759 $82621 $6885 $327 $615332 $51278 $2432
Passengers per Revenue Hour
Subsidy per Passenger
Cost per Revenue Hour
Farebox Recovery
Weekday 90 $890 $9132 118Saturday - $ - $ - - Sunday - $ - $ - -
Total 90 $890 $9132 118
Passengers Revenue Hours Operating CostsPassenger
RevenueOperating Subsidy
Passengers per Revenue Hour
Subsidy per Passenger
Cost per Revenue Hour
Farebox Recovery
FY 2015 69984 6289 $546363 $73402 $472961 111 $676 $8687 134FY 2016 71429 6414 $575805 $83288 $492517 111 $690 $8977 145FY 2017 69126 7643 $697953 $82621 $615332 90 $890 $9132 118
Histo
ric Tr
ends
FY 20
161
7 DAT
A
Passengers Revenue Hours Revenue Miles
Operating Costs Passenger Revenue Operating Subsidy
35511
68515 69984 71429 69126
01000020000300004000050000600007000080000
FY 2013 FY 2014 FY 2015 FY 2016 FY 2017
Passengers
2909
5965 6289 6414 7643
0
2000
4000
6000
8000
10000
FY 2013 FY 2014 FY 2015 FY 2016 FY 2017
Revenue Hours
$263500
$555608 $546363 $575805
$697953
$0$100000$200000$300000$400000$500000$600000$700000$800000
FY 2013 FY 2014 FY 2015 FY 2016 FY 2017
Operating Costs
122 115 111 111
90
00
20
40
60
80
100
120
140
FY 2013 FY 2014 FY 2015 FY 2016 FY 2017
Passengers per Revenue Hour
$625 $721 $676 $690
$890
$000$200$400$600$800
$1000$1200$1400
FY 2013 FY 2014 FY 2015 FY 2016 FY 2017
Subsidy per Passenger
$9057 $9315 $8687 $8977 $9132
$0
$50
$100
$150
$200
FY 2013 FY 2014 FY 2015 FY 2016 FY 2017
Cost per Revenue Hour
Hdn ValleyYellow Bus
Days of Service School DaysAvg Freq (Wkdy Peak) 2 trips
Avg Freq (Wkdy Non-Peak) -Avg Freq (Wked) -
FY 2017 Farebox Recovery 26 transfer (to route) -
Clipper usage -
Annual Avg Monthly Avg Daily Annual Avg Monthly Avg Daily Annual Avg Monthly Avg DailyWeekday 9281 844 52 180 16 1 1638 149 9 Saturday - - - - - - - - - Sunday - - - - - - - - -
Total 9281 844 52 180 16 1 1638 149 9
Annual Avg Monthly Avg Daily Annual Avg Monthly Avg Daily Annual Avg Monthly Avg DailyWeekday $124763 $11342 $693 $32170 $2925 $179 $92593 $8418 $514Saturday $ - $ - $ - $ - $ - $ - $ - $ - $ -Sunday $ - $ - $ - $ - $ - $ - $ - $ - $ -
Total $124763 $11342 $693 $32170 $2925 $179 $92593 $8418 $514
Passengers per Revenue Hour
Subsidy per Passenger
Cost per Revenue Hour
Farebox Recovery
Weekday 516 $998 $69313 258Saturday - $ - $ - - Sunday - $ - $ - -
Total 516 $998 $69313 258
Passengers Revenue Hours Operating CostsPassenger
RevenueOperating Subsidy
Passengers per Revenue Hour
Subsidy per Passenger
Cost per Revenue Hour
Farebox Recovery
FY 2015FY 2016 8669 211 $140482 $25658 $114824 412 $1325 $66706 183FY 2017 9281 180 $124763 $32170 $92593 516 $998 $69313 258
Histo
ric Tr
ends
FY 20
161
7 DAT
A
Passengers Revenue Hours Revenue Miles
Operating Costs Passenger Revenue Operating Subsidy
8669 9281
0
2000
4000
6000
8000
10000
FY 2013 FY 2014 FY 2015 FY 2016 FY 2017
Passengers211
180
0
50
100
150
200
250
FY 2013 FY 2014 FY 2015 FY 2016 FY 2017
Revenue Hours$140482
$124763
$0$20000$40000$60000$80000
$100000$120000$140000$160000
FY 2013 FY 2014 FY 2015 FY 2016 FY 2017
Operating Costs
412 516
00
500
1000
1500
2000
FY 2013 FY 2014 FY 2015 FY 2016 FY 2017
Passengers per Revenue Hour
$1325
$998
$000
$200
$400
$600
$800
$1000
$1200
$1400
FY 2013 FY 2014 FY 2015 FY 2016 FY 2017
Subsidy per Passenger
$66706 $69313
$0$100$200$300$400$500$600$700$800
FY 2013 FY 2014 FY 2015 FY 2016 FY 2017
Cost per Revenue Hour
White HillYellow Bus
Days of Service School DaysAvg Freq (Wkdy Peak) 17 trips
Avg Freq (Wkdy Non-Peak) -Avg Freq (Wked) -
FY 2017 Farebox Recovery 60 transfer (to route) -
Clipper usage -
Annual Avg Monthly Avg Daily Annual Avg Monthly Avg Daily Annual Avg Monthly Avg DailyWeekday 127219 11565 707 1065 97 6 12096 1100 67 Saturday - - - - - - - - - Sunday - - - - - - - - -
Total 127219 11565 707 1065 97 6 12096 1100 67
Annual Avg Monthly Avg Daily Annual Avg Monthly Avg Daily Annual Avg Monthly Avg DailyWeekday $738585 $67144 $4103 $440896 $40081 $2449 $297689 $27063 $1654Saturday $ - $ - $ - $ - $ - $ - $ - $ - $ -Sunday $ - $ - $ - $ - $ - $ - $ - $ - $ -
Total $738585 $67144 $4103 $440896 $40081 $2449 $297689 $27063 $1654
Passengers per Revenue Hour
Subsidy per Passenger
Cost per Revenue Hour
Farebox Recovery
Weekday 1194 $234 $69325 597Saturday - $ - $ - - Sunday - $ - $ - -
Total 1194 $234 $69325 597
Passengers Revenue Hours Operating CostsPassenger
RevenueOperating Subsidy
Passengers per Revenue Hour
Subsidy per Passenger
Cost per Revenue Hour
Farebox Recovery
FY 2015FY 2016 129635 870 $579937 $385753 $194184 1491 $150 $66698 665FY 2017 127219 1065 $738585 $440896 $297689 1194 $234 $69325 597
Histo
ric Tr
ends
FY 20
161
7 DAT
A
Passengers Revenue Hours Revenue Miles
Operating Costs Passenger Revenue Operating Subsidy
129635 127219
0
20000
40000
60000
80000
100000
120000
140000
FY 2013 FY 2014 FY 2015 FY 2016 FY 2017
Passengers
870
1065
0
200
400
600
800
1000
1200
FY 2013 FY 2014 FY 2015 FY 2016 FY 2017
Revenue Hours
$579937
$738585
$0$100000$200000$300000$400000$500000$600000$700000$800000
FY 2013 FY 2014 FY 2015 FY 2016 FY 2017
Operating Costs
1491
1194
00200400600800
1000120014001600
FY 2013 FY 2014 FY 2015 FY 2016 FY 2017
Passengers per Revenue Hour
$150 $234
$000
$200
$400
$600
$800
$1000
$1200
$1400
FY 2013 FY 2014 FY 2015 FY 2016 FY 2017
Subsidy per Passenger$66698 $69325
$0$100$200$300$400$500$600$700$800
FY 2013 FY 2014 FY 2015 FY 2016 FY 2017
Cost per Revenue Hour
MARIN TRANSIT | 2018ndash2027 SHORT RANGE TRANSIT PLAN Chapter 4 Capital Plan
DRAFT 4-9
Table 4-7 Local Transit Bus Replacement Schedule
Fiscal Year (In-service)
Replacements
Total Cost
Local Share Vehicle Type Seating
Capacity Service(1)
FY 201718 10 $7710000 $1387800 40ft hybrid 39 LB
2 $1662000 $332404 35ft Electric 32 LB
FY 201819
1 $125000 $22500 24ft 20 SH
4 $1600000 $1094880 29ft XHF
(upgrade) 22 SG
FY 201920 10 $8940000 $1609200 60ft 63 LB
FY 202021 8 $1032000 $185760 24ft 20 SH
2 $850000 $153000 35ft XHF 37 MW
FY 202223
7 $5584578 $1005224 35ft hybrid 32 LB
2 $874182 $599281 29ft XHF
(upgrade) 22 SG
FY 202425 3 $1393227 $250781 35ft XHF 37 MW
FY 202526 2 $299093 $53837 24ft 20 SH
5 $2391706 $430507 35ft XHF 37 MW
FY 202627 - - - - - -
Notes (1) Service Types LB ndash Big Bus SH- Shuttle SG- Rural Stagecoach MW- Seasonal Muir Woods and School
Expansion Needs When considering service expansion vehicles are often a constraint on the amount of service that can be added Expansion vehicles are a lower priority in the regional capital plan and typically do not receive federal funds Local state or discretionary grants are required to expand fleets The capital plan does not include any expansion vehicles for the local fixed route program consistent with the current service plan
Marin Transit relies on three retired active vehicles to support operations Retired active vehicles are vehicles that are beyond their FTA-determined useful life that remain in service while their replacements are added the fleet The District intends to replace these as expansion vehicles if funding becomes available
Demand Response Vehicles
Marin Transit has 58 vehicles available for local and regional paratransit service To provide an adequate number of spare vehicles a maximum of about 46 vehicles in service Marin Transit owns 32 vehicles GGBHTD owns 14 and the contractor provides another 13 vehicles to support the operations Eleven of the 13 contractor vehicles will be replaced in early 2018 - five by the District and six by GGBHTD Two of the five replaced by the District will be replaced with smaller accessible vans These will be used for same day
Fixed-Route Passengers (incl Yellow Bus) by Month
July August September October November December January February March April May June
Prior Fiscal Year Passengers Current Fiscal Year PassengersPrior Fiscal Year Passengers Current Fiscal Year Passengers
0
80000
160000
240000
320000
244439
271284484271284
296637296637
2768532276853
252829252829
238010238010
219681219681
2097050505209705
277644277644
240773240773240773240773
284816284816
24935149492493512444392444392442 43999244439244244439439244439244244439999999244200
2600562602600 0000000260056
FISCAL YEAR
2018
Demand Response Passengers by Month
July August September October November December January February March April May June
Prior Fiscal Year Passengers Current Fiscal Year PassengersPrior Fiscal Year Passengers Current Fiscal Year Passengers
0
4000
8000
12000
16000
12 77312773
13631 1362813628 1356413564
1247712477
1206712067 1212412124118100011810
1364613646
1260912609
1359313593
12950129501277312 77312 77312 77312613131612 6133312 6133312613331277312773127731277312613
13 6311363113 631135641363113 613631311363113 6136313113564
Year-to-Date Ridership Trends
Item 3b
2
Average Systemwide Daily Passengers
Weekday Saturday Sunday
Prior Fiscal Year Average Daily Passengers Current Fiscal Year Average Daily PassengersPrior Fiscal Year Average Daily Passengers Current Fiscal Year Average Daily Passengers
0
3000
6000
9000
12000
11370113701109811098
7726772674407440
66576657
60556055
Productivity (paxhr) by Typology
1 Local T
runklin
e
2 Local B
asic
3 Local C
onnecto
r
5 R
ura
l
8 R
ecre
ational
9 D
em
and R
esponse
Prior Fiscal Year Productivity Current Fiscal Year ProductivityPrior Fiscal Year Productivity Current Fiscal Year Productivity
00
80
160
240
320
249249 252252
163163
14814 8148
9292 91918181
757 575
320320
275275
2323 2121
Monthly StatisticsMONTH
August
1 Local Trunkline Routes 35 36 71X
2 Local Basic Routes 17 22 23 23X 29 49
3 Local Connector Routes 219 228 233 245 251 257
5 Rural Routes 61 68
8 Recreational Routes 6666F
9 Demand Response Local Paratransit Novato Dial-A-Ride Rural Dial-A-Ride
Route Typologies
Item 3b
3
Fixed-Route Passengers (incl Yellow Bus) by Month
July August September October November December January February March April May June
Prior Fiscal Year Passengers Current Fiscal Year Passengers
0
80000
160000
240000
320000
244439244439
271284271284
296637296637
276853276853
252829252829
238010238010
219681219681209705209705
277644277644
240773240773
284816284816
249351249351244200244200
260056260056
282441282441
FISCAL YEAR
2018
Demand Response Passengers by Month
July August September October November December January February March April May June
Prior Fiscal Year Passengers Current Fiscal Year Passengers
0
4000
8000
12000
16000
1277312773
1363113631 1362813628 1356413564
12477124771206712067 1212412124
1181011810
1364613646
1260912609
1359313593
12950129501261312613
1356413564 1342713427
Year-to-Date Ridership Trends
Monthly Monitoring Report 11022017
Page 12Item 3b
2
Average Systemwide Daily Passengers
Weekday Saturday Sunday
Prior Fiscal Year Average Daily Passengers Current Fiscal Year Average Daily Passengers
0
3000
6000
9000
12000 11848118481161311613
73637363
67876787
6126612657395739
Productivity (paxhr) by Typology
1 L
ocal
Tru
nklin
e
2 L
ocal
Bas
ic
3 L
ocal
Con
nect
or
5 R
ural
8 R
ecre
atio
nal
9 D
eman
d R
espo
nse
Prior Fiscal Year Productivity Current Fiscal Year Productivity
00
80
160
240
320
278278 274274
174174 168168
9898 9797
7676 7676
304304
222222
2323 2222
Monthly StatisticsMONTH
September
1 Local Trunkline Routes 35 36 71X
2 Local Basic Routes 17 22 23 23X 29 49
3 Local Connector Routes 219 228 233 245 251 257
5 Rural Routes 61 68
8 Recreational Routes 6666F
9 Demand Response Local Paratransit Novato Dial-A-Ride Rural Dial-A-Ride
Route Typologies
Page 22Item 3b
3
Fixed-Route Passengers (incl Yellow Bus) by Month
July August September October November December January February March April May June
Prior Fiscal Year Passengers Current Fiscal Year Passengers
0
80000
160000
240000
320000
244439244439
271284271284
296637296637
276853276853
252829252829
238010238010
219681219681209705209705
277644277644
240773240773
284816284816
249351249351244200244200
260056260056
282441282441 282922282922
FISCAL YEAR
2018
Demand Response Passengers by Month
July August September October November December January February March April May June
Prior Fiscal Year Passengers Current Fiscal Year Passengers
0
4000
8000
12000
16000
1277312773
1363113631 1362813628 1356413564
12477124771206712067 1212412124
1181011810
1364613646
1260912609
1359313593
12950129501261312613
1356413564 13427134271373413734
Year-to-Date Ridership Trends
Monthly Monitoring Report 12082017
Page 12Item 3b
2
Average Systemwide Daily Passengers
Weekday Saturday Sunday
Prior Fiscal Year Average Daily Passengers Current Fiscal Year Average Daily Passengers
0
3000
6000
9000
120001125811258 1115111151
6043604364326432
4717471750675067
Productivity (paxhr) by Typology
1 L
ocal
Tru
nklin
e
2 L
ocal
Bas
ic
3 L
ocal
Con
nect
or
5 R
ural
8 R
ecre
atio
nal
9 D
eman
d R
espo
nse
Prior Fiscal Year Productivity Current Fiscal Year Productivity
00
70
140
210
280258258
270270
163163 161161
9696 9595
6363 7070
202202190190
2323 2121
Monthly StatisticsMONTH
October
1 Local Trunkline Routes 35 36 71X
2 Local Basic Routes 17 22 23 23X 29 49
3 Local Connector Routes 219 228 233 245 251 257
5 Rural Routes 61 68
8 Recreational Routes 6666F
9 Demand Response Local Paratransit Novato Dial-A-Ride Rural Dial-A-Ride
Route Typologies
Page 22Item 3b
3
- RFP - OampM for Fixed Route Service - Addendum 3 12-18-2017
- MV Fee Schedule
- Airporter Fee Schedule
- FY2017Performance
-
- System Performance Summary for FY 201617
-
- Fixed Route
- Yellow Bus
- Demand Response
- Other Services
-
- Performance Goals
- Ridership Trends
- FY 201718 Performance Outlook
-
- Attachment A Route Profiles
-
- Local Transit Bus Replacement Schedule
- August 2017 Monthly Monitoring Report
- September 2017 Monthly Monitoring Report
- October 2017 Monthly Monitoring Report
-
Addendum 3
6
Addendum 3 It is anticipated that vehicles will be replaced with vehicles that are similar to what is being operated today but is subject to change at Marin Transitrsquos discretion Q33 Page 13 Item 10 Information Technology Plan Is the contractor responsible for the cost and maintenance of all electric maintenance components in this section ie GFI Radios passenger counters MDTrsquos and other components A33 The Intelligent Transportation Technology equipment consists mostly of onboard equipment (ie GFI fareboxes MDTrsquos cameras etc) and will be provided by Marin Transit as described in Section 1 ndash General Information Onboard Equipment (Intelligent Transportation Technology) of the RFP Contractors are responsible for repairs preventive maintenance and maintaining spare parts associated with this equipment as outlined in the Operations Responsibilities and Maintenance Responsibilities sections of the RFP Marin Transit will provide an initial inventory of spare parts (excluding major vehicle parts such as engines or transmissions etc) but the Contractor will be responsible for ensuring that any spare parts that are swapped out or used are immediately replaced in order to maintain an adequate spare parts inventory Most of the onboard equipment has an initial warranty associated with failure of hardware Q34 Please provide the total annual miles operated for each package A34 See annual miles for each route in the attachment to Addendum 3 Q35 What is the current spare ratio for each service provided A35 Services in Package 1 and Package 2 currently differ than what is operated today Currently Package 1 contains one vehicle that is not owned by Marin Transit Package 1 services have a weekday spare ratio of 17 percent and 61 percent on the weekend Package 2 currently has a weekday spare ratio of 38 percent weekday during non-school days is 50 percent weekend peakpeak at 21 percent weekend peakoff peak of 38 percent and weekend off peakoff peak at 46 percent It is projected that Package 1 will have a weekday spare ratio of 17 percent and a weekend spare ratio of 52 percent Package 2 is projected to have a weekday spare ratio of 21 percent weekday (non-school days) is 58 percent weekend peakpeak of 11 percent weekend peakoff-peak of 35 percent and weekend off peakoff peak at 48 percent Q36 Will Marin Transit be responsible for the cost of battery packs for all of the hybrid vehicles
Addendum 3
7
A36 Yes Marin Transit would consider hybrid vehicle battery pack replacement as an Unforeseen Major Repair an assume the cost to refresh or replace the battery packs per Maintenance Responsibilities Section of the RFP Q37 Page 28 Section 3 Are the DPF filters considered a major component that Marin Transit will be responsible for covering the cost for A37 DPF filters are not considered a major component and Marin Transit will not be responsible for covering the costs for providing or replacing DPF filters Q38 Section 405d Auto Physical Damage ndash Transportation providers to maintain a higher deductible than the $50K for each loss noted in this section would Marin Transit modify this section to remove the deductible limitation A38 No The referenced draft contract language requires that ldquoDeductibles shall not exceed $50000 for each lossrdquo Q39 Section 405i Certified Copies of Policies ndash It typically takes insurance companies around 30 days after policy expiration before a new policy is issued As an alternative would Marin Transit please modify this section to state that the replacement policy or binder shall be furnished 5 days after expiration A39 Marin Transitrsquos primary concern is that there not be a gap in insurance coverage whether for new or replacement policies during the term of an awarded contract and will not modify this language beyond the expiration date of a policy Q40 Section 405j MCTD Purchase of Insurance ndash As an alternative to the current language would Marin Transit modify this section to provide that Marin Transitrsquos recourse for failure to comply with the insurance requirements be cancellation of the contract A40 No Marin Transit reserves to right terminate its contracts for convenience This provision ensures that insurance coverage is always in place Q41 Page 18 Draft Contract Item b Dedication to Project vs Page 11 Item 4 A) Summary of Key Personnel The language in these sections seems to conflict Please confirm it is acceptable to share key personnel with other projects as long as the percentage of time dedicated to this project is clearly identified A41 Personnel can be shared Of the key personnel the General Manager Operations Manager Maintenance Manager are to be full time positions and the Operations Manager and Maintenance Manager are to be located on-site Proposers must indicate if key personnel and non-key personnel (ie mechanics dispatchers road supervisors) will be shared on other projects and the percentage of time that will be
Addendum 3
8
dedicated to Marin Transit contract(s) Refer to Attachment I ndash Draft Operations and Maintenance Contract Article 2 ndash Personnel Requirements Sec 201 General Requirements for Contractor Personnel Dedication to Project Q42 Page 14 Item 13 Employee Training Please confirm whether CPR and First Aid training is a new requirement A42 No Proposers are being asked to present their initial training program for operators ldquoto Include any certifications and licensing to be included along with the initial training (CPR First Aid Class B etc)rdquo as referred to in the RFP Section 2 ndash Terms and Conditions Proposal Requirements Employee Training Q43 Page 28 Unforeseen Major Repairs Would Marin Transit identify a dollar amount such as $2000 for single maintenance items that would classify an item as an unforeseen major repair Marin Transit would be responsible for the cost of There are various parts on the fleet vehicles that exceed the cost of a transmission rebuild for example A43 No Q44 Page 8 Draft Contract b Facilities ii Would Marin Transit please remove this language from the RFP and Draft Contract Proposerrsquos are not able to require a landlord to consent to assignment of a property lease A44 No Proposerrsquos are encouraged to work closely with property managers agents or owners on how best to address this requirement Q45 Page 7 Radio Communications For package 2 services should bidders account for two-way radios vs push to talk devices due to the service area and poor cell phone reception A45 Package 1 and 2 proposers should provide a radio communication system that meets the service requirements outlined in the RFP Proposers are encouraged to obtain signal coverage area maps to include with their proposed systems that minimize or eliminate ldquodead spotsrdquo Q46 Draft Contract sect104E TermRenewal Options Please revise to require mutual agreement for any extension of the Agreement with pricing to be negotiated by the parties in order to allow for price adjustments to reflect changes in Contractorrsquos cost to operate the service A46 The RFP and contract address changes to Contractorrsquos cost to operate service though the two-tiered (variable hourly rate and monthly fixed cost) structure and the
Addendum 3
9
Possible Rate Adjustments contract provision (304f) The optional contract extension terms will not be made subject to renegotiation Q47 Draft Contract sect523 ndashAssignment Please delete ldquoAssignment provision extends to any purchase merger or consolidation change in control etcrdquo from the draft contract as a change in stockholders of a contractor shall not require consent or result in a default or termination of the Agreement A47 No This contract provision does not require consent for a change in a contractorrsquos stockholders but instead a change in contract assignment resulting from a change in stockholders Q48 Draft Contract sect408 ndashTermination ndash Would Marin Transit please consider modifying this requirement to provide a minimum of 60 daysrsquo notice of cancellation in order to provide the contractor with enough time to complete obligations required such as WARN Act lease terminations etc A48 No Marin Transit prefers the 30-day notice period Q49 Draft Contract sect406 ndash Indemnity Would Marin Transit please consider revising indemnification to limit the indemnity to actions or omissions of the Contractor or its employees agents subcontractors etc The Contractor should not be liable for items outside of its control A49 No Marin Transit is not considering a revision to the indemnification clause at this time Q50 General Draft Contract Would Marin Transit please add a force majeure provision to relieve both parties from performance under the Contract for circumstances beyond their reasonable control (acts of God war labor strikes or disputes terrorism etc) The contractor should be excused from performance under the contract for circumstances outside of its control A50 No See response for Q38 Q51 General Draft Contract Would Marin Transit include a provision that provides for price adjustments if Contractorrsquos revenue decreases or Contractorrsquos costs increase as a result of (i) changes to the scope of work service hours requested by the Authority (ii) changes in laws rules regulations etc applicable to the services to be provided by Contractor andor (iii) wage increases necessary for Contractor to be able to recruit and retain qualified employees as a result of an increase in the minimum wage in the County or surrounding jurisdictions If the parties are unable to agree on a rate adjustment then either party may terminate the contract upon 120 daysrsquo written notice to the other party Doing so would
Addendum 3
10
provide protection for the contractor to cover changes requested by the District or matters that were not contemplated at the time of Contractorrsquos proposal A51 No The RFP and contract address potential changes to scope of work changes in lawrulesregulations and requires proposers to consider wages and benefits to recruit and attract qualified employees without requiring contract price renegotiation
Attachments MV Transportation Fees and Payment Schedule (Revised November 20 2017)
Marin Airporter Fees and Payment Schedule (Revised November 20 2017) System Performance Summary for FY201617
August 2017 Monthly Monitoring Report September 2017 Monthly Monitoring Report October 2017 Monthly Monitoring Report Local Transit Bus Replacement Schedule
171801
EXHIBIT ldquoCrdquo
FEES AND PAYMENT SCHEDULE (revised)
Contractor shall bill Marin Transit monthly for service hours provided Additional hours shall only be used with approval from Marin Transit Proper back-up including TransTrack reports showing hours miles and fuel usage must be attached to invoices For Fiscal Year 1718 Contractor shall provide proof of wage increase (eg month over month payroll comparisons)
Service Cost per Service Hour
Contract Service Hours
Contract Maximum Obligation
Total year 1 January 30 2012 to December 31 2012 13881 $737832 Total year 2 January 1 2013 to December 31 2013 16686 $892890 Total year 3 January 1 2014 to December 31 2014 20913 $1297726 Total year 4 January 1 2015 to December 31 2015 27250 $1715566
Fixed Administrative Costs $277094 West Marin StagecoachMuir Woods Shuttle $3682 10750 $395815 Supplemental Service $6601 3750 $247538 Start-Up Costs $47571 First Half Year 5 January 1 2016 to June 30 2016 14500 $968018
Fixed Administrative Costs $975995 West Marin StagecoachMuir Woods Shuttle $4094 21500 $880210 Local Fixed Route $4094 14000 $573160 Supplemental Service $6814 7500 $511050 Fiscal Year 1617 July 1 2016 to June 30 2017 43000 $2940415
Fixed Administrative Costs1 $1137363 West Marin StagecoachMuir Woods Shuttle $4439 21500 $954455 Local Fixed Route $4439 14000 $621505 Supplemental Service $7018 7500 $526350 Fiscal Year 1718 July 1 2017 to June 30 2018 43000 $3239674
1 Includes the addition of one Road Supervisor position and one Level A Mechanic Contractor shall credit Marin Transit $5900 per month for the wage benefit and tax cost of the Level A Mechanic from July 1 2017 until the date of hire of this position
Item 10
404
asmith
Typewritten Text
MV Transportation
171830
EXHIBIT ldquoBrdquo
FEES AND PAYMENT SCHEDULE (revised)
Cost per Revenue Hour Community Shuttle Service
Base Years Option Years FY1314 FY1415 FY1516 FY1617 FY1718
Rate $7078 $6866 $7072 $7284 $7614 Maximum Revenue Hours 40000 40000 40000 60000 60000
In addition to payment of a cost per revenue hour District will directly reimburse Contractor for lease payments associated with storage of heavy duty transit buses beginning June 2016 Contractor must substantiate lease expense by providing District with a copy of the lease agreement In no event will lease payments exceed $1800 per month without written approval of District
Contractor to provide proof of wage increase (eg month over month payroll comparisons)
Item 11
410
asmith
Typewritten Text
Marin Airporter
asmith
Typewritten Text
asmith
Typewritten Text
1
System Performance Summary for FY 201617
This report summarizes the unaudited operational performance of Marin Transit local transit services for FY 201617 and compares these results to the Districtrsquos route level performance goals identified in the Short-Range Transit Plan The report provides a detailed route level assessment of all Marin Transit services operating in FY 201617 On June 12 2016 Marin Transit implemented a major service change with a 19 increase in local fixed-route service levels and a restructuring of routes throughout the County This FY 201617 report includes data from a full year of the new service plan There were a few additional changes to transit services during FY 201617 including the following In July 2016 the District launched a new general public dial-a-ride service between Point Reyes Station and Novato
The service provides curb-to-curb pick-up and drop-off and only operates on the second Monday of each month The closure of Hwy 1 in early 2017 delayed the start of the Muir Woods Shuttle season which typically begins in April
The Shuttle season began on May 13 resulting in 12 fewer days of service A number of recent changes to Marin Transitrsquos contracts and agreements have had an impact on the Districtrsquos financials These include the following The District completed a procurement for paratransit services in 2015 The new contract went into effect on January 1
2016 and provides significantly lower rates for paratransit and dial-a-ride services This report provides data from the first full year of the new contract
Effective February 1 2017 the District increased the subsidy paid to Catch-A-Ride service providers for operating wheelchair accessible vehicles to further incentivize the availability of accessible vehicles for Catch-A-Ride trips
For FY 201617 Marin Transit updated the methodology for calculating revenue hours for demand response services to be more consistent with the National Transit Database definitions These include local paratransit and the Novato Dial-A-Ride This change has reduced the amount of time that is considered as part of revenue hours Overall Marin Transit provided over 32 million unlinked passenger trips in FY 201617 with over 235000 revenue hours of service Compared to FY 201516 these numbers represent a decrease in unlinked passenger trips (-35) and an increase in revenue hours (+82) Growth in service was primarily on local fixed-route services due to the June 2016 changes Some of this growth was partially offset by decreases in hours on local paratransit and Route 122 The system-wide productivity rate was 136 riders per hour about 108 lower than FY 201617 Passenger revenues increased slightly (+06) Due to higher operating costs passenger subsidy increased by 127 to a system-wide average of $678 per passenger Fixed Route Fixed Route operations carried over 29 million unlinked passenger trips in FY 201617 with 178052 revenue hours These totals represent 91 of the Districtrsquos total trips and 76 of revenue hours Compared to FY 201516 unlinked passenger trips on fixed route services decreased by 35 and revenue hours increased by 136 Overall productivity was 164 passengers per hour approximately 150 lower than the 193 mark last fiscal year Compared to FY 201516 almost all fixed-route typologies experienced a decrease in overall ridership These include Local Basic (-120) Local Connector (-127) Supplemental (-32) and Partnership (-25) However some services experienced a modest increase in ridership compared to last year including Local Trunkline (+77) the Muir Woods Shuttle (+44) and Rural (+48)
2
Total passenger revenue decreased slightly (-11) in FY 201617 compared to last year Increases in operating costs resulted in a decrease in overall farebox recovery from 199 last year to 176 in FY 201617 Only the Local Trunkline and Recreational (Muir Woods Shuttle) typologies experienced an overall increase in both passenger revenue and farebox recovery Yellow Bus In FY 201617 yellow bus service for the Ross Valley School District carried over 136000 unlinked passenger trips a decrease of 13 compared to last year and operated 1245 revenue hours These totals represent 4 of the Districtrsquos total ridership and 1 of revenue hours Passenger revenues increased 150 due to higher pass prices This boost in revenues did not keep pace with the rise in operating costs and overall farebox recovery decreased from 571 last year to 548 in FY 201617 Demand Response Demand Response programs carried 124325 unlinked passenger trips in FY 201617 and provided 55191 revenue hours of service These totals represent 4 of the Districtrsquos total trips and 24 of revenue hours Compared to FY 201516 unlinked passenger trips on demand response services decreased by 39 (-5096 trips) and revenue hours decreased by 61 The more significant reduction in revenue hours compared to passengers is likely due to the new method for calculating those hours Overall productivity was 23 passengers per hour slightly higher than last fiscal year Ridership on local paratransit and the Novato Dial-A-Ride decreased in FY 201617 compared to the prior year Rural Dial-A-Ride experienced growth in ridership mainly because these services were only recently introduced These include the Dillon BeachTomales and Point Reyes Station Dial-A-Ride Passenger revenues for demand response services dropped slightly (-15) compared to last year However lower operating costs due to the new contract rate resulted in reductions in subsidies and an increase in farebox recovery Other Services Other Marin Access Mobility Management services include the Volunteer Driver and Catch-A-Ride programs In FY 201617 these programs provided 30547 unlinked passenger trips about 1 of the Districtrsquos total trips Compared to the prior fiscal year ridership decreased by 77 mostly due to the Catch-A-Ride program However passenger revenues increased by 90 primarily on the Catch-A-Ride program This increase may have been due to riders taking longer trips Performance Goals
The 2016-2025 Short-Range Transit Plan identifies fifteen different goals and associated metrics that staff use to evaluate system performance Performance goals at the route level are measured in both productivity (unlinked passengers per hour and per trip) and cost effectiveness (subsidy per unlinked passenger trip) These measures follow the service typologies updated in the most recent Short Range Transit Plan Table 1 below summarizes route level performance goals by typology Marin Transit has not identified productivity or cost-effectiveness goals for the Yellow Bus or Partnership service typologies Table 2 provides a detailed summary of annual FY 201617 performance data by program route and service typology
3
Table 1 Productivity and Subsidy Goals by Service Typology
Service Typology Routes Unlinked Passenger
Trips per Hour (at or above)
Subsidy per Passenger Trip
(at or below)
Local Trunkline 35 36 71X 25 $300
Regular Local 17 22 23 23X 29 49 20 $500
Local Connector 219 228 233 245 251 257 8 $800
Supplemental 113 115 117 119 125 139 145 151 154 20 per trip $300
Rural 61 68 4 $1200
Recreational 66 (Muir Woods Shuttle) 25 $300
Demand Response Local DAR Novato DAR Dillon BeachTomales DAR Point Reyes DAR
2 $3000
Using the productivity goals identified in Table 1 all the service typology groups except for Local Basic met their unlinked passengers per hour goal overall Twelve individual routes and two demand response services did not meet their productivity targets These include Routes 17 22 23 23X 29 49 71X 115 125 139 219 228 the Dillon BeachTomales Dial-A-Ride and the Point Reyes Dial-A-Ride In the previous fiscal year ten routes did not meet this target Figure 1 provides FY 201617 productivity levels and respective productivity goals by service typology and at the route level Route 35 was the most productive fixed-route service carrying an average of 286 passengers per hour Route 151 (Hamilton ndash San Jose MS ndash Novato HS - San Marin HS) was the best performing supplemental school route with 428 passengers per trip and met its subsidy target at $150 per passenger Route 228 had the highest growth in productivity (+291) due to the addition of weekday service in June 2016 In terms of cost effectiveness the Supplemental School Rural and Recreational services collectively met their goals In total 17 individual routes and two demand response services did not meet their subsidy target (Routes 17 22 23 23X 29 35 36 49 71X 219 228 233 251 257 115 125 139 Local Paratransit and Novato Dial-A-Ride) This is an increase from the 13 routes and three demand response services reported for FY 201516 Figure 2 provides a breakdown of FY 201617 subsidy levels and respective subsidy goals by service typology and at the individual route level Ridership Trends
In FY 201617 there was an overall 35 decline in fixed-route ridership compared to the previous year despite increases to service levels One of the major contributors to this decline was the delayed start of the 2017 Muir Woods Shuttle season that reduced the amount of service provided by 76 The overall decrease in ridership is relatively consistent with trends among bus operators nationwide and in the Bay Area According to the National Transit Database bus ridership declined 66 nationwide during FY 201617 compared to the prior year Within in the Bay Area peer agencies experienced ridership declines between 6 and 12 These include Golden Gate Transit Sonoma County Transit SamTrans and Napa VINE One of the biggest external factors that may have contributed to this trend is weather Rainfall in FY 201617 almost doubled over the prior year Weather can have a significant impact on travel decisions affecting whether a person makes a trip as well as how that person ultimately makes the trip It can also impact operations and cause detours major delays and canceled trips
4
In FY 201617 there was a 34 increase in the number of canceled trips Almost half of these canceled trips occurred in February due to heavy rains that caused flooding and school closures In June 2016 Marin Transit implemented a major service change One of the main goals of the service restructuring was to reduce the need to transfer by providing faster and more direct connections While this approach improves the system for riders it has implications in terms of how ridership is counted and on performance metrics The number of passengers is measured in terms of unlinked passenger trips Each time a person boards a bus is counted as a separate trip regardless of whether that person is transferring from another bus Reducing the amount of transfers needed to complete a riderrsquos journey reduces the number of unlinked trips Replacing trips that require a transfer with direct trips to destinations does not change the number of individual riders using the system which is defined as linked passenger trips In FY 201617 there was a 75 overall decrease in the number of transfers for passengers using cash to pay their original fare Some of this decline reflects the systemwide decrease in ridership The transfer ratio is defined as the number of boarding trips (unlinked passenger trips) divided by the number of originating trips (linked passenger trips) This ratio can be used to evaluate the impact of transfers on ridership independent of other factors In FY 201617 the overall transfer ratio dropped 38 from 136 to 131 When estimating linked passenger trips based on these ratios the number of individual Marin Transit passengers in FY 201617 remained relatively constant compared to last year Demand for Marin Access mobility management programs declined overall 47 from FY 201516 to FY 201617 Changes in ridership varied from program to program The largest decline was on Catch-A-Ride which experienced a 129 decrease in ridership Local paratransit and Novato Dial-A-Ride ridership may have been affected by many of the same external factors as fixed route transit particularly weather It is also possible that paratransit clients have started to shift some or all their trips to services that are not provided by Marin Transit These may include Non-Emergency Medical Transportation services arranged by managed care organizations Private transportation
providers hired under contract to institutions typically served by paratransit (such as adult day care centers) Trips taken on Uber or Lyft and Volunteer transportation services that may be supported by Marin Transit in some way but whose ridership is not
reported in the Districtrsquos performance statistics Furthermore staff attributed much of the previous growth in the Marin Access program to the Catch-A-Ride program This program experienced a 473 increase in ridership between FY 201314 and FY 201415 Towards the end of FY 201415 On the Move one of the largest taxi companies in Marin went out of business To this day service is limited during hours of peak demand and in certain service areas especially Novato Therefore FY 201617 ridership on Catch-A-Ride may reflect two factors These include a slowdown in attracting new customers and a reduction in service availability following On the Moversquos closure Table 2 summarizes the factors that can influence ridership numbers year-over-year and qualitatively evaluates their impact
5
Table 2 Factors Impacting Ridership Comparison
Factor FY 201516 FY 201617 Impact
Calendar
School Days 181 183 --
Weekdays 256 253
Weekends amp Holidays 110 111 --
Muir Woods Shuttle 113 104
Transfer Ratio (ratio of unlinked to linked trips) 136 131
Service Disruptions Canceled service (trips) 200 268
Major detourclosure (days) (1) 18 29
Rainfall (inches) 2928 5653
Gas Prices $298 $291 --
Unemployment Rate 32 32 -- Notes (1) Data on major detours and closure collected starting January 2016 Comparison includes the months of January through June FY 201718 Performance Outlook
In June 2016 Marin Transit implemented a major service change aimed in part to help underperforming routes meet established performance standards Staff has continued to monitor service performance and has made minor adjustments to improve on-time performance and cancel low-ridership trips In early 2018 staff is planning a comprehensive assessment of service performance since the June 2016 service changes This effort will include data from a recently completed onboard survey from April 2017 on passenger origins and destinations and a 100 passenger ridecheck The ridecheck will provide data on stop-level ridership activity for each route The assessment will use this analysis to recommend service changes to improve underperforming routes There are several unknowns that may also affect route performance primarily in terms of operating costs The District relies on its contractors to either lease or own property to store and maintain the vehicles needed to operate service For contractors that do not own suitable property finding and leasing these types of facilities in Marin County is challenging and expensive Recent surveys of current and potential service providers identified securing a facility as the most significant factor in determining their interest in bidding on Marin Transit services ability to provide the service and proposed pricing Marin Transit has been actively working to secure and develop its own operations and maintenance facility A District-owned facility will eliminate the need for potential service providers to lease property and lower operating costs It may also improve efficiency by reducing deadhead or non-revenue time when vehicles are traveling to and from the yard and further lower the Districtrsquos contract rates In late 2017 Marin Transit will release for bid over half of its fixed-route service and there are many uncertainties that may affect the outcome The tight labor market in Marin County and the greater Bay Area has made it difficult for service providers to hire and retain employees Potential contractors are required to secure property in a County with limited real estate opportunities If the District provides its own facility there will be more interest among potential bidders and more competitive rates
6
Table 3 System-wide Performance Statistics FY 201617 (unaudited)
Route Passengers Revenue
Hours Operating
Costs Passenger
Revenue Pass Trips Per
Rev Hr (Trip) Subsidy Per
Passenger Farebox
Recovery Fixed Route 2925522 178052 $20173419 $3550259 164 $568 176 Local Trunkline 1122188 44393 $6252940 $1263870 253 $445 202
35 658869 23052 $3234308 $729775 286 $380 226 36 342178 13636 $1901678 $369132 251 $448 194
71X 121141 7705 $1116954 $164963 157 $786 148 Local Basic 989500 65117 $7451946 $1221298 152 $630 164
17 247998 14757 $2076786 $319761 168 $708 154 22 215758 17553 $1619319 $273059 123 $624 169 23 199150 11065 $1508659 $246908 180 $634 164
23X 49255 3445 $473413 $57438 143 $845 121 29 40103 3707 $509475 $49634 108 $1147 97 49 237236 14590 $1264294 $274498 163 $417 217
Local Connector 378985 42396 $3873801 $461426 89 $900 119 219 50449 6392 $591224 $64101 79 $1045 108 228 71340 10042 $904806 $103912 71 $1123 115 233 42798 4363 $399203 $52001 98 $811 130 245 49766 4349 $391596 $56968 114 $672 145 251 95506 9607 $889019 $101823 99 $824 115 257 69126 7643 $697953 $82621 90 $890 118
Supplemental 179947 3963 $514380 $110503 454 (286) $224 215 113 16829 317 $42180 $12227 530 (315) $178 290 115 14021 637 $87534 $9504 220 (185) $557 109 117 34820 640 $81509 $17140 544 (284) $185 210 119 27161 374 $56273 $18859 727 (313) $138 335 125 13757 600 $72469 $11570 229 (193) $443 160 139 6414 253 $33182 $6635 253 (179) $414 200 145 16406 191 $25426 $7258 861 (372) $111 285 151 36801 594 $73842 $18463 620 (428) $150 250 154 13738 358 $41965 $8847 384 (255) $241 211
Recreational 122116 4316 $473726 $249748 283 $183 527 66 122116 4316 $473726 $249748 283 $183 527
Rural 112926 16172 $1422683 $122407 70 $1151 86 61 36328 5492 $475778 $39959 66 $1200 84 68 76598 10680 $946905 $82448 72 $1129 87
Partnership 19860 1696 $183943 $121007 117 $317 658 122 19860 1696 $183943 $121007 117 $317 658
Yellow Bus 136500 1245 $863348 $473066 1096 (448) $286 548 Hidden Valley 9281 180 $124763 $32170 516 (265) $998 258
White Hill 127219 1065 $738585 $440896 1194 (471) $234 597 Demand Response 124325 55191 $4571296 $236980 23 $3486 52
Local Paratransit 119673 53011 $4404928 $226387 23 $3492 51 Novato DAR 4057 1856 $150815 $8815 22 $3487 58
Dillon Beach DAR 488 260 $12511 $1356 19 $2285 108 Pt Reyes DAR 107 64 $3042 $422 17 $2447 139
Other Services 30547 - $511316 $41956 - $1537 82 Volunteer Driver(1) 16162 - $152714 - - $945 -
Catch-A-Ride(1) 14385 - $358602 $41956 - $2201 117 Total 3216894 234489 $26118572 $4302085 136 $678 165
Notes Values in red indicate performance that does not meet District
7
Figure 1 FY 201617 Passengers per Revenue Hour by Route
0
5
10
15
20
25
30
35
40
45
50Lo
cal T
runk
line T
otals 35 36 71
X
Loca
l Bas
ic To
tals 17 22 23 23X 29 49
Loca
l Con
necto
r Tot
als 219
228
233
245
251
257
Supp
lemen
tal T
otals 11
311
511
711
912
513
914
515
115
4
Recre
ation
al To
tals 66
Rura
l Tot
als 61 68
Dem
and R
espo
nse T
otals
Loca
l Par
atra
nsit
Nova
to D
ARDi
llon D
ARPt
Reye
s DAR
Pass
enge
rs p
er R
even
ue H
our
meets goalservice standard
does not meet goal
school routes show passengers per trip
8
Figure 2 FY 201617 Subsidy per Passenger by Route
$0
$5
$10
$15
$20
$25
$30
$35
$40
Loca
l Tru
nklin
e Tot
als 35 36 71X
Loca
l Bas
ic To
tals 17 22 23 23X 29 49
Loca
l Con
necto
r Tot
als 219
228
233
245
251
257
Supp
lemen
tal T
otals 11
311
511
711
912
513
914
515
115
4
Recre
ation
al To
tals 66
Rura
l Tot
als 61 68
Dem
and R
espo
nse T
otals
Loca
l Par
atra
nsit
Nova
to D
ARDi
llon D
ARPt
Reye
s DAR
Subs
idy p
er P
asse
nger
does not meet goal
service standard
meets goal
9
Attachment A Route Profiles 17 Sausalito ndash Marin City ndash Mill Valley ndash San Rafael 22 San Rafael Transit Center ndash San Anselmo ndash Marin City 23 Fairfax ndash San Anselmo ndash San Rafael ndash Canal 23X Manor ndash Fairfax ndash San Anselmo ndash San Rafael ndash Canal 29 Canal ndash San Rafael Transit Center ndash Larkspur ndash College of Marin ndash Marin General 35 Canal ndash San Rafael Transit Center ndash Marin Civic Center ndash Northgate Mall ndash Novato 36 Canal ndash San Rafael Transit Center ndash Marin City 49 Novato ndash Ignacio ndash Hamilton ndash Marin Civic Center ndash San Rafael Transit Center 61 West Marin Stagecoach (Sausalito ndash Marin City ndash Mill Valley ndash Stinson Beach ndash Bolinas) 66 Muir Woods Shuttle 68 West Marin Stagecoach (San Rafael Transit Center ndash San Anselmo ndash Pt Reyes Station ndash Inverness) 71X Novato ndash San Rafael Transit Center ndash Marin City ndash Sausalito 113 Redwood High School ndash Paradise Cay 115 Sausalito ndash Willow Creek ndash Marin City ndash Mill Valley ndash St Hilary 117 Neil Cummins Hall Middle School ndash E Corte Madera ndash Cove School 119 Tiburon ndash Belvedere ndash Redwood High School 122 San Rafael Transit Center ndash San Anselmo ndash College of Marin 125 Lagunitas ndash Sir Francis Drake HS ndash San Anselmo ndash San Rafael 139 Terra Linda High School ndash Lucas Valley 145 Terra Linda High School ndash San Rafael 151 Hamilton ndash Ignacio ndash San Jose Middle School ndash Novato High School ndash San Marin High School 154 Olive ndash San Marin High School ndash Sinaloa Middle School ndash Novato 219 Tiburon ndash Strawberry 228 San Rafael Transit Center ndash Larkspur ndash San Anselmo ndash Fairfax 233 Santa Venetia ndash Marin Civic Center ndash San Rafael Transit Center 245 San Rafael Transit Center ndash Northgate Mall ndash Kaiser ndash Smith Ranch Road 251 San Marin ndash Novato ndash Vintage Oaks ndash IVC ndash Ignacio ndash Hamilton 257 San Rafael ndash Northgate Mall ndash Kaiser ndash Marinwood ndash Hamilton ndash Ignacio ndash IVC Hdn Valley Ross Valley Yellow Bus (Fairfax ndash San Anselmo ndash Hidden Valley ES) White Hill Ross Valley Yellow Bus (San Anselmo ndash Sleepy Hollow ndash Fairfax ndash White Hill MS)
17Local Basic
Days of Service Wkdy Sa SuAvg Freq (Wkdy Peak) 30 min
Avg Freq (Wkdy Non-Peak) 60 minAvg Freq (Wked) 60 min
FY 2017 Farebox Recovery 15 transfer (to route) 25
Clipper usage 16
Annual Avg Monthly Avg Daily Annual Avg Monthly Avg Daily Annual Avg Monthly Avg DailyWeekday 194263 16189 768 11496 958 45 177386 14782 701 Saturday 27564 2297 530 1541 128 30 24621 2052 473 Sunday 26171 2181 436 1720 143 29 27378 2282 456
Total 247998 20667 679 14757 1230 40 229385 19115 628
Annual Avg Monthly Avg Daily Annual Avg Monthly Avg Daily Annual Avg Monthly Avg DailyWeekday $1617108 $134759 $6392 $247041 $20587 $976 $1370067 $114172 $5415Saturday $217536 $18128 $4183 $36894 $3075 $710 $180642 $15054 $3474Sunday $242142 $20179 $4036 $35826 $2986 $597 $206316 $17193 $3439
Total $2076786 $173066 $5690 $319761 $26647 $876 $1757025 $146419 $4814
Passengers per Revenue Hour
Subsidy per Passenger
Cost per Revenue Hour
Farebox Recovery
Weekday 169 $705 $14067 153Saturday 179 $655 $14117 170Sunday 152 $788 $14078 148
Total 168 $708 $14073 154
Passengers Revenue Hours Operating CostsPassenger
RevenueOperating Subsidy
Passengers per Revenue Hour
Subsidy per Passenger
Cost per Revenue Hour
Farebox Recovery
FY 2015 301136 15167 $2108822 $340410 $1768412 199 $587 $13904 161FY 2016 280486 15330 $2041616 $302337 $1739279 183 $620 $13317 148FY 2017 247998 14757 $2076786 $319761 $1757025 168 $708 $14073 154
Histo
ric Tr
ends
FY 20
161
7 DAT
A
Passengers Revenue Hours Revenue Miles
Operating Costs Passenger Revenue Operating Subsidy
277892 322826
301136 280486
247998
0
50000
100000
150000
200000
250000
300000
350000
FY 2013 FY 2014 FY 2015 FY 2016 FY 2017
Passengers
12402 14818 15167 15330 14757
0
5000
10000
15000
20000
FY 2013 FY 2014 FY 2015 FY 2016 FY 2017
Revenue Hours
$1717002
$2179526 $2108822 $2041616 $2076786
$0
$500000
$1000000
$1500000
$2000000
$2500000
FY 2013 FY 2014 FY 2015 FY 2016 FY 2017
Operating Costs
224 218 199 183 168
00
50
100
150
200
250
300
FY 2013 FY 2014 FY 2015 FY 2016 FY 2017
Passengers per Revenue Hour
$504 $558 $587 $620 $708
$000$200$400$600$800
$1000$1200$1400
FY 2013 FY 2014 FY 2015 FY 2016 FY 2017
Subsidy per Passenger
$13845 $14709 $13904 $13317 $14073
$0
$50
$100
$150
$200
FY 2013 FY 2014 FY 2015 FY 2016 FY 2017
Cost per Revenue Hour
22Local Basic
Days of Service Wkdy Sa SuAvg Freq (Wkdy Peak) 30 min
Avg Freq (Wkdy Non-Peak) 60 minAvg Freq (Wked) 60 min
FY 2017 Farebox Recovery 17 transfer (to route) 10
Clipper usage 11
Annual Avg Monthly Avg Daily Annual Avg Monthly Avg Daily Annual Avg Monthly Avg DailyWeekday 184918 15410 731 14244 1187 56 126319 10527 499 Saturday 16752 1396 322 1537 128 30 16232 1353 312 Sunday 14088 1174 235 1773 148 30 18729 1561 312
Total 215758 17980 591 17553 1463 48 161280 13440 442
Annual Avg Monthly Avg Daily Annual Avg Monthly Avg Daily Annual Avg Monthly Avg DailyWeekday $1312992 $109416 $5190 $232926 $19411 $921 $1080066 $90006 $4269Saturday $142334 $11861 $2737 $21235 $1770 $408 $121099 $10092 $2329Sunday $163993 $13666 $2733 $18898 $1575 $315 $145095 $12091 $2418
Total $1619319 $134943 $4436 $273059 $22755 $748 $1346260 $112188 $3688
Passengers per Revenue Hour
Subsidy per Passenger
Cost per Revenue Hour
Farebox Recovery
Weekday 130 $584 $9218 177Saturday 109 $723 $9263 149Sunday 79 $1030 $9251 115
Total 123 $624 $9225 169
Passengers Revenue Hours Operating CostsPassenger
RevenueOperating Subsidy
Passengers per Revenue Hour
Subsidy per Passenger
Cost per Revenue Hour
Farebox Recovery
FY 2015 249148 14777 $2054433 $292215 $1762218 169 $707 $13903 142FY 2016 243635 14872 $1971172 $259453 $1711719 164 $703 $13255 132FY 2017 215758 17553 $1619319 $273059 $1346260 123 $624 $9225 169
Histo
ric Tr
ends
FY 20
161
7 DAT
A
Passengers Revenue Hours Revenue Miles
Operating Costs Passenger Revenue Operating Subsidy
366301
281761 249148 243635
215758
050000
100000150000200000250000300000350000400000
FY 2013 FY 2014 FY 2015 FY 2016 FY 2017
Passengers18061
15083 14777 14872 17553
0
5000
10000
15000
20000
FY 2013 FY 2014 FY 2015 FY 2016 FY 2017
Revenue Hours$2498169
$2220145 $2054433 $1971172
$1619319
$0
$500000
$1000000
$1500000
$2000000
$2500000
$3000000
FY 2013 FY 2014 FY 2015 FY 2016 FY 2017
Operating Costs
203 187 169 164
123
00
50
100
150
200
250
300
FY 2013 FY 2014 FY 2015 FY 2016 FY 2017
Passengers per Revenue Hour
$567 $667 $707 $703 $624
$000$200$400$600$800
$1000$1200$1400
FY 2013 FY 2014 FY 2015 FY 2016 FY 2017
Subsidy per Passenger
$13832 $14720 $13903 $13255
$9225
$0
$50
$100
$150
$200
FY 2013 FY 2014 FY 2015 FY 2016 FY 2017
Cost per Revenue Hour
23Local Basic
Days of Service Wkdy Sa SuAvg Freq (Wkdy Peak) 60 min
Avg Freq (Wkdy Non-Peak) 60 minAvg Freq (Wked) 60 min
FY 2017 Farebox Recovery 16 transfer (to route) 24
Clipper usage 12
Annual Avg Monthly Avg Daily Annual Avg Monthly Avg Daily Annual Avg Monthly Avg DailyWeekday 145707 12142 576 8042 670 32 64277 5356 254 Saturday 28305 2359 544 1434 120 28 11466 956 221 Sunday 25138 2095 419 1589 132 26 12750 1062 212
Total 199150 16596 546 11065 922 30 88492 7374 242
Annual Avg Monthly Avg Daily Annual Avg Monthly Avg Daily Annual Avg Monthly Avg DailyWeekday $1096892 $91408 $4336 $179427 $14952 $709 $917465 $76455 $3626Saturday $195468 $16289 $3759 $35226 $2936 $677 $160242 $13354 $3082Sunday $216299 $18025 $3605 $32255 $2688 $538 $184044 $15337 $3067
Total $1508659 $125722 $4133 $246908 $20576 $676 $1261751 $105146 $3457
Passengers per Revenue Hour
Subsidy per Passenger
Cost per Revenue Hour
Farebox Recovery
Weekday 181 $630 $13640 164Saturday 197 $566 $13629 180Sunday 158 $732 $13612 149
Total 180 $634 $13635 164
Passengers Revenue Hours Operating CostsPassenger
RevenueOperating Subsidy
Passengers per Revenue Hour
Subsidy per Passenger
Cost per Revenue Hour
Farebox Recovery
FY 2015 354706 14168 $1969650 $381111 $1588539 250 $448 $13902 193FY 2016 268218 13154 $1703216 $308138 $1395078 204 $520 $12948 181FY 2017 199150 11065 $1508659 $246908 $1261751 180 $634 $13635 164
Histo
ric Tr
ends
FY 20
161
7 DAT
A
Passengers Revenue Hours Revenue Miles
Operating Costs Passenger Revenue Operating Subsidy
212064
339118 354706
268218
199150
050000
100000150000200000250000300000350000400000
FY 2013 FY 2014 FY 2015 FY 2016 FY 2017
Passengers
8716
14034 14168 13154
11065
02000400060008000
10000120001400016000
FY 2013 FY 2014 FY 2015 FY 2016 FY 2017
Revenue Hours
$1202564
$2061985 $1969650 $1703216
$1508659
$0
$500000
$1000000
$1500000
$2000000
$2500000
FY 2013 FY 2014 FY 2015 FY 2016 FY 2017
Operating Costs
243 242 250
204 180
00
50
100
150
200
250
300
FY 2013 FY 2014 FY 2015 FY 2016 FY 2017
Passengers per Revenue Hour
$455 $494 $448 $520 $634
$000$200$400$600$800
$1000$1200$1400
FY 2013 FY 2014 FY 2015 FY 2016 FY 2017
Subsidy per Passenger
$13797 $14692 $13902 $12948 $13635
$0
$50
$100
$150
$200
FY 2013 FY 2014 FY 2015 FY 2016 FY 2017
Cost per Revenue Hour
23XLocal Basic
Days of Service WkdyAvg Freq (Wkdy Peak) 60 min
Avg Freq (Wkdy Non-Peak) -Avg Freq (Wked) -
FY 2017 Farebox Recovery 12 transfer (to route) 31
Clipper usage 12
Annual Avg Monthly Avg Daily Annual Avg Monthly Avg Daily Annual Avg Monthly Avg DailyWeekday 49255 4105 195 3445 287 14 32408 2701 128 Saturday - - - - - - - - - Sunday - - - - - - - - -
Total 49255 4105 195 3445 287 14 32408 2701 128
Annual Avg Monthly Avg Daily Annual Avg Monthly Avg Daily Annual Avg Monthly Avg DailyWeekday $473413 $39451 $1871 $57438 $4787 $227 $415975 $34665 $1644Saturday $ - $ - $ - $ - $ - $ - $ - $ - $ -Sunday $ - $ - $ - $ - $ - $ - $ - $ - $ -
Total $473413 $39451 $1871 $57438 $4787 $227 $415975 $34665 $1644
Passengers per Revenue Hour
Subsidy per Passenger
Cost per Revenue Hour
Farebox Recovery
Weekday 143 $845 $13744 121Saturday - $ - $ - - Sunday - $ - $ - -
Total 143 $845 $13744 121
Passengers Revenue Hours Operating CostsPassenger
RevenueOperating Subsidy
Passengers per Revenue Hour
Subsidy per Passenger
Cost per Revenue Hour
Farebox Recovery
FY 2015FY 2016 2548 189 $23303 $2272 $21031 135 $825 $12330 97FY 2017 49255 3445 $473413 $57438 $415975 143 $845 $13744 121
Histo
ric Tr
ends
FY 20
161
7 DAT
A
Passengers Revenue Hours Revenue Miles
Operating Costs Passenger Revenue Operating Subsidy
2548
49255
0
10000
20000
30000
40000
50000
60000
FY 2013 FY 2014 FY 2015 FY 2016 FY 2017
Passengers
189
3445
0500
1000150020002500300035004000
FY 2013 FY 2014 FY 2015 FY 2016 FY 2017
Revenue Hours
$23303
$473413
$0
$100000
$200000
$300000
$400000
$500000
FY 2013 FY 2014 FY 2015 FY 2016 FY 2017
Operating Costs
135 143
00
50
100
150
200
250
300
FY 2013 FY 2014 FY 2015 FY 2016 FY 2017
Passengers per Revenue Hour
$825 $845
$000$200$400$600$800
$1000$1200$1400
FY 2013 FY 2014 FY 2015 FY 2016 FY 2017
Subsidy per Passenger
$12330 $13744
$0
$50
$100
$150
$200
FY 2013 FY 2014 FY 2015 FY 2016 FY 2017
Cost per Revenue Hour
29Local Basic
Days of Service WkdyAvg Freq (Wkdy Peak) 60 min
Avg Freq (Wkdy Non-Peak) -Avg Freq (Wked) -
FY 2017 Farebox Recovery 10 transfer (to route) 26
Clipper usage 12
Annual Avg Monthly Avg Daily Annual Avg Monthly Avg Daily Annual Avg Monthly Avg DailyWeekday 40103 3342 159 3707 309 15 37048 3087 146 Saturday - - - - - - - - - Sunday - - - - - - - - -
Total 40103 3342 159 3707 309 15 37048 3087 146
Annual Avg Monthly Avg Daily Annual Avg Monthly Avg Daily Annual Avg Monthly Avg DailyWeekday $509475 $42456 $2014 $49634 $4136 $196 $459841 $38320 $1818Saturday $ - $ - $ - $ - $ - $ - $ - $ - $ -Sunday $ - $ - $ - $ - $ - $ - $ - $ - $ -
Total $509475 $42456 $2014 $49634 $4136 $196 $459841 $38320 $1818
Passengers per Revenue Hour
Subsidy per Passenger
Cost per Revenue Hour
Farebox Recovery
Weekday 108 $1147 $13745 97Saturday - $ - $ - - Sunday - $ - $ - -
Total 108 $1147 $13745 97
Passengers Revenue Hours Operating CostsPassenger
RevenueOperating Subsidy
Passengers per Revenue Hour
Subsidy per Passenger
Cost per Revenue Hour
Farebox Recovery
FY 2015 203632 10795 $1500887 $232286 $1268601 189 $623 $13904 155FY 2016 181786 10502 $1378760 $219997 $1158763 173 $637 $13129 160FY 2017 40103 3707 $509475 $49634 $459841 108 $1147 $13745 97
Histo
ric Tr
ends
FY 20
161
7 DAT
A
Passengers Revenue Hours Revenue Miles
Operating Costs Passenger Revenue Operating Subsidy
238310 225998 203632
181786
40103
0
50000
100000
150000
200000
250000
300000
FY 2013 FY 2014 FY 2015 FY 2016 FY 2017
Passengers12248
10927 10795 10502
3707
0
2000
4000
6000
8000
10000
12000
14000
FY 2013 FY 2014 FY 2015 FY 2016 FY 2017
Revenue Hours$1692980 $1607795 $1500887
$1378760
$509475
$0
$500000
$1000000
$1500000
$2000000
FY 2013 FY 2014 FY 2015 FY 2016 FY 2017
Operating Costs
195 207 189 173
108
00
50
100
150
200
250
300
FY 2013 FY 2014 FY 2015 FY 2016 FY 2017
Passengers per Revenue Hour
$595 $593 $623 $637
$1147
$000$200$400$600$800
$1000$1200$1400
FY 2013 FY 2014 FY 2015 FY 2016 FY 2017
Subsidy per Passenger
$13822 $14714 $13904 $13129 $13745
$0
$50
$100
$150
$200
FY 2013 FY 2014 FY 2015 FY 2016 FY 2017
Cost per Revenue Hour
35Local Trunkline
Days of Service Wkdy Sa SuAvg Freq (Wkdy Peak) 30 min
Avg Freq (Wkdy Non-Peak) 30 minAvg Freq (Wked) 30 min
FY 2017 Farebox Recovery 23 transfer (to route) 17
Clipper usage 8
Annual Avg Monthly Avg Daily Annual Avg Monthly Avg Daily Annual Avg Monthly Avg DailyWeekday 492328 41027 1946 16909 1409 67 224421 18702 887 Saturday 84453 7038 1624 2860 238 55 43336 3611 833 Sunday 82088 6841 1368 3284 274 55 50021 4168 834
Total 658869 54906 1805 23052 1921 63 317778 26482 871
Annual Avg Monthly Avg Daily Annual Avg Monthly Avg Daily Annual Avg Monthly Avg DailyWeekday $2367217 $197268 $9357 $533190 $44433 $2107 $1834027 $152836 $7249Saturday $403729 $33644 $7764 $97853 $8154 $1882 $305876 $25490 $5882Sunday $463362 $38614 $7723 $98732 $8228 $1646 $364630 $30386 $6077
Total $3234308 $269526 $8861 $729775 $60815 $1999 $2504533 $208711 $6862
Passengers per Revenue Hour
Subsidy per Passenger
Cost per Revenue Hour
Farebox Recovery
Weekday 291 $373 $14000 225Saturday 295 $362 $14118 242Sunday 250 $444 $14111 213
Total 286 $380 $14030 226
Passengers Revenue Hours Operating CostsPassenger
RevenueOperating Subsidy
Passengers per Revenue Hour
Subsidy per Passenger
Cost per Revenue Hour
Farebox Recovery
FY 2015 476489 8544 $1187694 $462204 $725490 558 $152 $13901 389FY 2016 472718 9300 $1202986 $544109 $658877 508 $139 $12935 452FY 2017 658869 23052 $3234308 $729775 $2504533 286 $380 $14030 226
Histo
ric Tr
ends
FY 20
161
7 DAT
A
Passengers Revenue Hours Revenue Miles
Operating Costs Passenger Revenue Operating Subsidy
669860 574669
476489 472718
658869
0100000200000300000400000500000600000700000800000
FY 2013 FY 2014 FY 2015 FY 2016 FY 2017
Passengers
9755 8644 8544 9300
23052
0
5000
10000
15000
20000
25000
FY 2013 FY 2014 FY 2015 FY 2016 FY 2017
Revenue Hours
$1345711 $1271601 $1187694 $1202986
$3234308
$0
$500000
$1000000
$1500000
$2000000
$2500000
$3000000
$3500000
FY 2013 FY 2014 FY 2015 FY 2016 FY 2017
Operating Costs
687 665 558
508
286
00100200300400500600700800
FY 2013 FY 2014 FY 2015 FY 2016 FY 2017
Passengers per Revenue Hour
$097 $120 $152 $139
$380
$000
$200
$400
$600
$800
$1000
FY 2013 FY 2014 FY 2015 FY 2016 FY 2017
Subsidy per Passenger
$13796 $14710 $13901 $12935 $14030
$0
$50
$100
$150
$200
FY 2013 FY 2014 FY 2015 FY 2016 FY 2017
Cost per Revenue Hour
36Local Trunkline
Days of Service Wkdy Sa SuAvg Freq (Wkdy Peak) 30 min
Avg Freq (Wkdy Non-Peak) 30 minAvg Freq (Wked) 30 min
FY 2017 Farebox Recovery 19 transfer (to route) 18
Clipper usage 6
Annual Avg Monthly Avg Daily Annual Avg Monthly Avg Daily Annual Avg Monthly Avg DailyWeekday 278217 23185 1100 9938 828 39 133318 11110 527 Saturday 33779 2815 650 1715 143 33 24259 2022 467 Sunday 30182 2515 503 1983 165 33 28002 2334 467
Total 342178 28515 937 13636 1136 37 185579 15465 508
Annual Avg Monthly Avg Daily Annual Avg Monthly Avg Daily Annual Avg Monthly Avg DailyWeekday $1384291 $115358 $5472 $290481 $24207 $1148 $1093810 $91151 $4323Saturday $240062 $20005 $4617 $40774 $3398 $784 $199288 $16607 $3832Sunday $277325 $23110 $4622 $37877 $3156 $631 $239448 $19954 $3991
Total $1901678 $158473 $5210 $369132 $30761 $1011 $1532546 $127712 $4199
Passengers per Revenue Hour
Subsidy per Passenger
Cost per Revenue Hour
Farebox Recovery
Weekday 280 $393 $13930 210Saturday 197 $590 $13999 170Sunday 152 $793 $13984 137
Total 251 $448 $13946 194
Passengers Revenue Hours Operating CostsPassenger
RevenueOperating Subsidy
Passengers per Revenue Hour
Subsidy per Passenger
Cost per Revenue Hour
Farebox Recovery
FY 2015 109347 2894 $402355 $110471 $291884 378 $267 $13905 275FY 2016 119593 3462 $457211 $129715 $327496 345 $274 $13205 284FY 2017 342178 13636 $1901678 $369132 $1532546 251 $448 $13946 194
Histo
ric Tr
ends
FY 20
161
7 DAT
A
Passengers Revenue Hours Revenue Miles
Operating Costs Passenger Revenue Operating Subsidy
106988 103673 109347 119593
342178
050000
100000150000200000250000300000350000400000
FY 2013 FY 2014 FY 2015 FY 2016 FY 2017
Passengers
2878 2822 2894 3462
13636
02000400060008000
10000120001400016000
FY 2013 FY 2014 FY 2015 FY 2016 FY 2017
Revenue Hours
$398410 $415238 $402355 $457211
$1901678
$0
$500000
$1000000
$1500000
$2000000
FY 2013 FY 2014 FY 2015 FY 2016 FY 2017
Operating Costs
372 367 378 345 251
00100200300400500600700800
FY 2013 FY 2014 FY 2015 FY 2016 FY 2017
Passengers per Revenue Hour
$265 $293 $267 $274
$448
$000
$200
$400
$600
$800
$1000
FY 2013 FY 2014 FY 2015 FY 2016 FY 2017
Subsidy per Passenger
$13842 $14713 $13905 $13205 $13946
$0
$50
$100
$150
$200
FY 2013 FY 2014 FY 2015 FY 2016 FY 2017
Cost per Revenue Hour
49Local Basic
Days of Service Wkdy Sa SuAvg Freq (Wkdy Peak) 30 min
Avg Freq (Wkdy Non-Peak) 60 minAvg Freq (Wked) 60 min
FY 2017 Farebox Recovery 22 transfer (to route) 9
Clipper usage 11
Annual Avg Monthly Avg Daily Annual Avg Monthly Avg Daily Annual Avg Monthly Avg DailyWeekday 201564 16797 797 11313 943 45 139528 11627 551 Saturday 18489 1541 356 1517 126 29 18370 1531 353 Sunday 17183 1432 286 1761 147 29 21402 1784 357
Total 237236 19770 650 14590 1216 40 179300 14942 491
Annual Avg Monthly Avg Daily Annual Avg Monthly Avg Daily Annual Avg Monthly Avg DailyWeekday $978903 $81575 $3869 $230134 $19178 $910 $748769 $62397 $2960Saturday $131907 $10992 $2537 $22520 $1877 $433 $109387 $9116 $2104Sunday $153484 $12790 $2558 $21844 $1820 $364 $131640 $10970 $2194
Total $1264294 $105358 $3464 $274498 $22875 $752 $989796 $82483 $2712
Passengers per Revenue Hour
Subsidy per Passenger
Cost per Revenue Hour
Farebox Recovery
Weekday 178 $371 $8653 235Saturday 122 $592 $8698 171Sunday 98 $766 $8718 142
Total 163 $417 $8665 217
Passengers Revenue Hours Operating CostsPassenger
RevenueOperating Subsidy
Passengers per Revenue Hour
Subsidy per Passenger
Cost per Revenue Hour
Farebox Recovery
FY 2015 144262 6349 $882801 $158088 $724713 227 $502 $13905 179FY 2016 147480 6795 $900804 $146345 $754459 217 $512 $13257 162FY 2017 237236 14590 $1264294 $274498 $989796 163 $417 $8665 217
Histo
ric Tr
ends
FY 20
161
7 DAT
A
Passengers Revenue Hours Revenue Miles
Operating Costs Passenger Revenue Operating Subsidy
230943
152259 144262 147480
237236
0
50000
100000
150000
200000
250000
FY 2013 FY 2014 FY 2015 FY 2016 FY 2017
Passengers
9814
6440 6349 6795
14590
02000400060008000
10000120001400016000
FY 2013 FY 2014 FY 2015 FY 2016 FY 2017
Revenue Hours$1362499
$948702 $882801 $900804
$1264294
$0$200000$400000$600000$800000
$1000000$1200000$1400000$1600000
FY 2013 FY 2014 FY 2015 FY 2016 FY 2017
Operating Costs
235 236 227 217
163
00
50
100
150
200
250
300
FY 2013 FY 2014 FY 2015 FY 2016 FY 2017
Passengers per Revenue Hour
$477 $507 $502 $512 $417
$000$200$400$600$800
$1000$1200$1400
FY 2013 FY 2014 FY 2015 FY 2016 FY 2017
Subsidy per Passenger
$13884 $14732 $13905 $13257
$8665
$0
$50
$100
$150
$200
FY 2013 FY 2014 FY 2015 FY 2016 FY 2017
Cost per Revenue Hour
61Rural
Days of Service Wkdy Sa SuAvg Freq (Wkdy Peak) 8 trips
Avg Freq (Wkdy Non-Peak) -Avg Freq (Wked) 16 trips
FY 2017 Farebox Recovery 8 transfer (to route) 7
Clipper usage 11
Annual Avg Monthly Avg Daily Annual Avg Monthly Avg Daily Annual Avg Monthly Avg DailyWeekday 17166 1431 68 2631 219 10 45398 3783 181 Saturday 9922 827 198 1319 110 26 20810 1734 416 Sunday 9240 770 144 1542 129 24 24457 2038 382
Total 36328 3027 100 5492 458 15 90665 7555 248
Annual Avg Monthly Avg Daily Annual Avg Monthly Avg Daily Annual Avg Monthly Avg DailyWeekday $229650 $19138 $915 $17691 $1474 $70 $211959 $17663 $844Saturday $113378 $9448 $2268 $11622 $969 $232 $101756 $8480 $2035Sunday $132750 $11063 $2074 $10646 $887 $166 $122104 $10175 $1908
Total $475778 $39648 $1304 $39959 $3330 $109 $435819 $36318 $1194
Passengers per Revenue Hour
Subsidy per Passenger
Cost per Revenue Hour
Farebox Recovery
Weekday 65 $1235 $8730 77Saturday 75 $1026 $8598 103Sunday 60 $1321 $8607 80
Total 66 $1200 $8663 84
Passengers Revenue Hours Operating CostsPassenger
RevenueOperating Subsidy
Passengers per Revenue Hour
Subsidy per Passenger
Cost per Revenue Hour
Farebox Recovery
FY 2015 39478 5379 $417539 $46324 $371215 73 $940 $7762 111FY 2016 37276 5475 $408987 $48421 $360566 68 $967 $7470 118FY 2017 36328 5492 $475778 $39959 $435819 66 $1200 $8663 84
Histo
ric Tr
ends
FY 20
161
7 DAT
A
Passengers Revenue Hours Revenue Miles
Operating Costs Passenger Revenue Operating Subsidy
30642 33386
39478 37276 36328
0
10000
20000
30000
40000
50000
FY 2013 FY 2014 FY 2015 FY 2016 FY 2017
Passengers
5388
5056
5379 5475 5492
480049005000510052005300540055005600
FY 2013 FY 2014 FY 2015 FY 2016 FY 2017
Revenue Hours
$388827 $390358 $417539 $408987 $475778
$0
$100000
$200000
$300000
$400000
$500000
FY 2013 FY 2014 FY 2015 FY 2016 FY 2017
Operating Costs
57 66
73 68 66
00
20
40
60
80
100
FY 2013 FY 2014 FY 2015 FY 2016 FY 2017
Passengers per Revenue Hour
$1136 $1045
$940 $967
$1200
$000$200$400$600$800
$1000$1200$1400
FY 2013 FY 2014 FY 2015 FY 2016 FY 2017
Subsidy per Passenger
$7216 $7721 $7762 $7470 $8663
$0
$50
$100
$150
$200
FY 2013 FY 2014 FY 2015 FY 2016 FY 2017
Cost per Revenue Hour
66Recreational
Days of Service Wkdy Sa SuAvg Freq (Wkdy Peak) 30 min
Avg Freq (Wkdy Non-Peak) 30 minAvg Freq (Wked) 10-20 min
FY 2017 Farebox Recovery 53 transfer (to route) 0
Clipper usage 0
Annual Avg Monthly Avg Daily Annual Avg Monthly Avg Daily Annual Avg Monthly Avg DailyWeekday 21940 7313 549 804 268 20 10735 3578 268 Saturday 43799 7300 1752 1473 245 59 20480 3413 819 Sunday 56377 6264 1446 2040 227 52 28212 3135 723
Total 122116 13568 1174 4316 480 42 59428 6603 571
Annual Avg Monthly Avg Daily Annual Avg Monthly Avg Daily Annual Avg Monthly Avg DailyWeekday $104033 $34678 $2601 $37751 $12584 $944 $66282 $22094 $1657Saturday $152661 $25444 $6106 $79948 $13325 $3198 $72713 $12119 $2909Sunday $217032 $24115 $5565 $132049 $14672 $3386 $84983 $9443 $2179
Total $473726 $52636 $4555 $249748 $27750 $2401 $223978 $24886 $2154
Passengers per Revenue Hour
Subsidy per Passenger
Cost per Revenue Hour
Farebox Recovery
Weekday 273 $302 $12944 363Saturday 297 $166 $10367 524Sunday 276 $151 $10638 608
Total 283 $183 $10975 527
Passengers Revenue Hours Operating CostsPassenger
RevenueOperating Subsidy
Passengers per Revenue Hour
Subsidy per Passenger
Cost per Revenue Hour
Farebox Recovery
FY 2015 103930 3866 $477523 $209514 $268009 269 $258 $12352 439FY 2016 116942 4673 $531384 $245779 $285605 250 $244 $11373 463FY 2017 122116 4316 $473726 $249748 $223978 283 $183 $10975 527
Histo
ric Tr
ends
FY 20
161
7 DAT
A
Passengers Revenue Hours Revenue Miles
Operating Costs Passenger Revenue Operating Subsidy
62624
103052 103930 116942 122116
0
20000
40000
60000
80000
100000
120000
140000
FY 2013 FY 2014 FY 2015 FY 2016 FY 2017
Passengers
2941
3841 3866
4673 4316
0
1000
2000
3000
4000
5000
FY 2013 FY 2014 FY 2015 FY 2016 FY 2017
Revenue Hours
$330076
$538014 $477523
$531384 $473726
$0
$100000
$200000
$300000
$400000
$500000
$600000
FY 2013 FY 2014 FY 2015 FY 2016 FY 2017
Operating Costs
213
268 269 250
283
00
50
100
150
200
250
300
FY 2013 FY 2014 FY 2015 FY 2016 FY 2017
Passengers per Revenue Hour
$360 $322
$258 $244 $183
$000
$100
$200
$300
$400
$500
FY 2013 FY 2014 FY 2015 FY 2016 FY 2017
Subsidy per Passenger
$11223
$14007 $12352 $11373 $10975
$0
$50
$100
$150
$200
FY 2013 FY 2014 FY 2015 FY 2016 FY 2017
Cost per Revenue Hour
68Rural
Days of Service Wkdy Sa SuAvg Freq (Wkdy Peak) 60 min
Avg Freq (Wkdy Non-Peak) 120 minAvg Freq (Wked) 60-120 min
FY 2017 Farebox Recovery 9 transfer (to route) 13
Clipper usage 12
Annual Avg Monthly Avg Daily Annual Avg Monthly Avg Daily Annual Avg Monthly Avg DailyWeekday 59903 4992 239 7282 607 29 133167 11097 531 Saturday 8410 701 168 1492 124 30 27123 2260 542 Sunday 8285 690 129 1907 159 30 34638 2887 541
Total 76598 6383 210 10680 890 29 194928 16244 534
Annual Avg Monthly Avg Daily Annual Avg Monthly Avg Daily Annual Avg Monthly Avg DailyWeekday $645737 $53811 $2573 $64332 $5361 $256 $581405 $48450 $2316Saturday $131882 $10990 $2638 $9260 $772 $185 $122622 $10219 $2452Sunday $169286 $14107 $2645 $8856 $738 $138 $160430 $13369 $2507
Total $946905 $78909 $2594 $82448 $6871 $226 $864457 $72038 $2368
Passengers per Revenue Hour
Subsidy per Passenger
Cost per Revenue Hour
Farebox Recovery
Weekday 82 $971 $8868 100Saturday 56 $1458 $8841 70Sunday 43 $1936 $8879 52
Total 72 $1129 $8866 87
Passengers Revenue Hours Operating CostsPassenger
RevenueOperating Subsidy
Passengers per Revenue Hour
Subsidy per Passenger
Cost per Revenue Hour
Farebox Recovery
FY 2015 65866 10589 $848305 $80846 $767459 62 $1165 $8011 95FY 2016 70292 10611 $811978 $88808 $723170 66 $1029 $7652 109FY 2017 76598 10680 $946905 $82448 $864457 72 $1129 $8866 87
Histo
ric Tr
ends
FY 20
161
7 DAT
A
Passengers Revenue Hours Revenue Miles
Operating Costs Passenger Revenue Operating Subsidy
48113 56988
65866 70292 76598
0
20000
40000
60000
80000
100000
FY 2013 FY 2014 FY 2015 FY 2016 FY 2017
Passengers
7140 7185
10589 10611 10680
0
2000
4000
6000
8000
10000
12000
FY 2013 FY 2014 FY 2015 FY 2016 FY 2017
Revenue Hours
$532879 $571618
$848305 $811978 $946905
$0
$200000
$400000
$600000
$800000
$1000000
FY 2013 FY 2014 FY 2015 FY 2016 FY 2017
Operating Costs
67 79
62 66 72
00
20
40
60
80
100
FY 2013 FY 2014 FY 2015 FY 2016 FY 2017
Passengers per Revenue Hour
$979 $885
$1165 $1029
$1129
$000$200$400$600$800
$1000$1200$1400
FY 2013 FY 2014 FY 2015 FY 2016 FY 2017
Subsidy per Passenger
$7464 $7955 $8011 $7652 $8866
$0
$50
$100
$150
$200
FY 2013 FY 2014 FY 2015 FY 2016 FY 2017
Cost per Revenue Hour
71XLocal Trunkline
Days of Service WkdyAvg Freq (Wkdy Peak) 30 min
Avg Freq (Wkdy Non-Peak) 60 minAvg Freq (Wked) -
FY 2017 Farebox Recovery 15 transfer (to route) 26
Clipper usage 16
Annual Avg Monthly Avg Daily Annual Avg Monthly Avg Daily Annual Avg Monthly Avg DailyWeekday 121141 10095 479 7705 642 30 174624 14552 690 Saturday - - - - - - - - - Sunday - - - - - - - - -
Total 121141 10095 479 7705 642 30 174624 14552 690
Annual Avg Monthly Avg Daily Annual Avg Monthly Avg Daily Annual Avg Monthly Avg DailyWeekday $1116954 $93080 $4415 $164963 $13747 $652 $951991 $79333 $3763Saturday $ - $ - $ - $ - $ - $ - $ - $ - $ -Sunday $ - $ - $ - $ - $ - $ - $ - $ - $ -
Total $1116954 $93080 $4415 $164963 $13747 $652 $951991 $79333 $3763
Passengers per Revenue Hour
Subsidy per Passenger
Cost per Revenue Hour
Farebox Recovery
Weekday 157 $786 $14496 148Saturday - $ - $ - - Sunday - $ - $ - -
Total 157 $786 $14496 148
Passengers Revenue Hours Operating CostsPassenger
RevenueOperating Subsidy
Passengers per Revenue Hour
Subsidy per Passenger
Cost per Revenue Hour
Farebox Recovery
FY 2015 305440 7666 $1066058 $307659 $758399 398 $248 $13906 289FY 2016 259678 7717 $1075263 $300186 $775077 337 $298 $13934 279FY 2017 121141 7705 $1116954 $164963 $951991 157 $786 $14496 148
Histo
ric Tr
ends
FY 20
161
7 DAT
A
Passengers Revenue Hours Revenue Miles
Operating Costs Passenger Revenue Operating Subsidy
347560 341105 305440
259678
121141
050000
100000150000200000250000300000350000400000
FY 2013 FY 2014 FY 2015 FY 2016 FY 2017
Passengers9038
7578 7666 7717 7705
0
2000
4000
6000
8000
10000
FY 2013 FY 2014 FY 2015 FY 2016 FY 2017
Revenue Hours$1254262
$1116004 $1066058 $1075263 $1116954
$0
$200000
$400000
$600000
$800000
$1000000
$1200000
$1400000
FY 2013 FY 2014 FY 2015 FY 2016 FY 2017
Operating Costs
385 450
398 337
157
00100200300400500600700800
FY 2013 FY 2014 FY 2015 FY 2016 FY 2017
Passengers per Revenue Hour
$253 $222 $248 $298
$786
$000
$200
$400
$600
$800
$1000
FY 2013 FY 2014 FY 2015 FY 2016 FY 2017
Subsidy per Passenger
$13877 $14728 $13906 $13934 $14496
$0
$50
$100
$150
$200
FY 2013 FY 2014 FY 2015 FY 2016 FY 2017
Cost per Revenue Hour
113Supplemental
Days of Service School DaysAvg Freq (Wkdy Peak) 3 trips
Avg Freq (Wkdy Non-Peak) -Avg Freq (Wked) -
FY 2017 Farebox Recovery 29 transfer (to route) 0
Clipper usage 4
Annual Avg Monthly Avg Daily Annual Avg Monthly Avg Daily Annual Avg Monthly Avg DailyWeekday 16829 1530 92 317 29 2 2404 219 13 Saturday - - - - - - - - - Sunday - - - - - - - - -
Total 16829 1530 92 317 29 2 2404 219 13
Annual Avg Monthly Avg Daily Annual Avg Monthly Avg Daily Annual Avg Monthly Avg DailyWeekday $42180 $3835 $230 $12227 $1112 $67 $29953 $2723 $164Saturday $ - $ - $ - $ - $ - $ - $ - $ - $ -Sunday $ - $ - $ - $ - $ - $ - $ - $ - $ -
Total $42180 $3835 $230 $12227 $1112 $67 $29953 $2723 $164
Passengers per TripSubsidy per
PassengerCost per Revenue
HourFarebox Recovery
Weekday 315 $178 $13289 290Saturday - $ - $ - - Sunday - $ - $ - -
Total 315 $178 $13289 290
Passengers Revenue Hours Operating CostsPassenger
RevenueOperating Subsidy Passengers per Trip
Subsidy per Passenger
Cost per Revenue Hour
Farebox Recovery
FY 2015 12241 161 $28599 $10703 $17896 342 $146 $17752 374FY 2016 14601 263 $36924 $12809 $24115 317 $165 $14050 347FY 2017 16829 317 $42180 $12227 $29953 315 $178 $13289 290
Histo
ric Tr
ends
FY 20
161
7 DAT
A
Passengers Revenue Hours Revenue Miles
Operating Costs Passenger Revenue Operating Subsidy
15232 13521
12241 14601
16829
0
5000
10000
15000
20000
FY 2013 FY 2014 FY 2015 FY 2016 FY 2017
Passengers
229
165 161
263
317
0
50
100
150
200
250
300
350
FY 2013 FY 2014 FY 2015 FY 2016 FY 2017
Revenue Hours
$31562
$20182
$28599
$36924 $42180
$0
$10000
$20000
$30000
$40000
$50000
FY 2013 FY 2014 FY 2015 FY 2016 FY 2017
Operating Costs
220
365 342 317 315
00
100
200
300
400
500
FY 2013 FY 2014 FY 2015 FY 2016 FY 2017
Passengers per Trip
$051 $095
$146 $165 $178
$000$100$200$300$400$500$600$700$800
FY 2013 FY 2014 FY 2015 FY 2016 FY 2017
Subsidy per Passenger
$13795 $12261
$17752
$14050 $13289
$0
$50
$100
$150
$200
FY 2013 FY 2014 FY 2015 FY 2016 FY 2017
Cost per Revenue Hour
115Supplemental
Days of Service School DaysAvg Freq (Wkdy Peak) 5 trips
Avg Freq (Wkdy Non-Peak) -Avg Freq (Wked) -
FY 2017 Farebox Recovery 11 transfer (to route) 0
Clipper usage 7
Annual Avg Monthly Avg Daily Annual Avg Monthly Avg Daily Annual Avg Monthly Avg DailyWeekday 14021 1275 71 637 58 3 6963 633 35 Saturday - - - - - - - - - Sunday - - - - - - - - -
Total 14021 1275 71 637 58 3 6963 633 35
Annual Avg Monthly Avg Daily Annual Avg Monthly Avg Daily Annual Avg Monthly Avg DailyWeekday $87534 $7958 $444 $9504 $864 $48 $78030 $7094 $396Saturday $ - $ - $ - $ - $ - $ - $ - $ - $ -Sunday $ - $ - $ - $ - $ - $ - $ - $ - $ -
Total $87534 $7958 $444 $9504 $864 $48 $78030 $7094 $396
Passengers per TripSubsidy per
PassengerCost per Revenue
HourFarebox Recovery
Weekday 185 $557 $13744 109Saturday - $ - $ - - Sunday - $ - $ - -
Total 185 $557 $13744 109
Passengers Revenue Hours Operating CostsPassenger
RevenueOperating Subsidy Passengers per Trip
Subsidy per Passenger
Cost per Revenue Hour
Farebox Recovery
FY 2015 21488 775 $131168 $18863 $112305 221 $523 $16918 144FY 2016 16366 559 $82403 $12638 $69765 168 $426 $14754 153FY 2017 14021 637 $87534 $9504 $78030 185 $557 $13744 109
Histo
ric Tr
ends
FY 20
161
7 DAT
A
Passengers Revenue Hours Revenue Miles
Operating Costs Passenger Revenue Operating Subsidy
13524
21488
16366 14021
0
5000
10000
15000
20000
25000
FY 2013 FY 2014 FY 2015 FY 2016 FY 2017
Passengers
463
775
559 637
0
200
400
600
800
1000
FY 2013 FY 2014 FY 2015 FY 2016 FY 2017
Revenue Hours
$56706
$131168
$82403 $87534
$0
$20000
$40000
$60000
$80000
$100000
$120000
$140000
FY 2013 FY 2014 FY 2015 FY 2016 FY 2017
Operating Costs
232 221 168 185
00
100
200
300
400
500
FY 2013 FY 2014 FY 2015 FY 2016 FY 2017
Passengers per Trip
$362
$523 $426
$557
$000$100$200$300$400$500$600$700$800
FY 2013 FY 2014 FY 2015 FY 2016 FY 2017
Subsidy per Passenger
$12250
$16918 $14754 $13744
$0
$50
$100
$150
$200
FY 2013 FY 2014 FY 2015 FY 2016 FY 2017
Cost per Revenue Hour
117Supplemental
Days of Service School DaysAvg Freq (Wkdy Peak) 6 trips
Avg Freq (Wkdy Non-Peak) -Avg Freq (Wked) -
FY 2017 Farebox Recovery 21 transfer (to route) 0
Clipper usage 2
Annual Avg Monthly Avg Daily Annual Avg Monthly Avg Daily Annual Avg Monthly Avg DailyWeekday 34820 3165 193 640 58 4 4753 432 26 Saturday - - - - - - - - - Sunday - - - - - - - - -
Total 34820 3165 193 640 58 4 4753 432 26
Annual Avg Monthly Avg Daily Annual Avg Monthly Avg Daily Annual Avg Monthly Avg DailyWeekday $81509 $7410 $453 $17140 $1558 $95 $64369 $5852 $358Saturday $ - $ - $ - $ - $ - $ - $ - $ - $ -Sunday $ - $ - $ - $ - $ - $ - $ - $ - $ -
Total $81509 $7410 $453 $17140 $1558 $95 $64369 $5852 $358
Passengers per TripSubsidy per
PassengerCost per Revenue
HourFarebox Recovery
Weekday 284 $185 $12732 210Saturday - $ - $ - - Sunday - $ - $ - -
Total 284 $185 $12732 210
Passengers Revenue Hours Operating CostsPassenger
RevenueOperating Subsidy Passengers per Trip
Subsidy per Passenger
Cost per Revenue Hour
Farebox Recovery
FY 2015 50008 509 $77168 $77528 ($360) 399 ($001) $15158 1005FY 2016 33705 552 $77694 $23478 $54216 269 $161 $14075 302FY 2017 34820 640 $81509 $17140 $64369 284 $185 $12732 210
Histo
ric Tr
ends
FY 20
161
7 DAT
A
Passengers Revenue Hours Revenue Miles
Operating Costs Passenger Revenue Operating Subsidy
35174 34496
50008
33705 34820
0
10000
20000
30000
40000
50000
60000
FY 2013 FY 2014 FY 2015 FY 2016 FY 2017
Passengers
299 341
509 552
640
0
100
200
300
400
500
600
700
FY 2013 FY 2014 FY 2015 FY 2016 FY 2017
Revenue Hours
$41176 $41796
$77168 $77694 $81509
$0
$20000
$40000
$60000
$80000
$100000
FY 2013 FY 2014 FY 2015 FY 2016 FY 2017
Operating Costs
436 406 399
269 284
00
100
200
300
400
500
FY 2013 FY 2014 FY 2015 FY 2016 FY 2017
Passengers per Trip
($012) ($028) ($001)
$161 $185
-$200
-$100
$000
$100
$200
$300
$400
$500
$600
FY 2013 FY 2014 FY 2015 FY 2016 FY 2017
Subsidy per Passenger$13790
$12253
$15158 $14075
$12732
$0$20$40$60$80
$100$120$140$160
FY 2013 FY 2014 FY 2015 FY 2016 FY 2017
Cost per Revenue Hour
119Supplemental
Days of Service School DaysAvg Freq (Wkdy Peak) 5 trips
Avg Freq (Wkdy Non-Peak) -Avg Freq (Wked) -
FY 2017 Farebox Recovery 34 transfer (to route) 0
Clipper usage 5
Annual Avg Monthly Avg Daily Annual Avg Monthly Avg Daily Annual Avg Monthly Avg DailyWeekday 27161 2469 151 374 34 2 6893 627 38 Saturday - - - - - - - - - Sunday - - - - - - - - -
Total 27161 2469 151 374 34 2 6893 627 38
Annual Avg Monthly Avg Daily Annual Avg Monthly Avg Daily Annual Avg Monthly Avg DailyWeekday $56273 $5116 $313 $18859 $1714 $105 $37414 $3401 $208Saturday $ - $ - $ - $ - $ - $ - $ - $ - $ -Sunday $ - $ - $ - $ - $ - $ - $ - $ - $ -
Total $56273 $5116 $313 $18859 $1714 $105 $37414 $3401 $208
Passengers per TripSubsidy per
PassengerCost per Revenue
HourFarebox Recovery
Weekday 313 $138 $15058 335Saturday - $ - $ - - Sunday - $ - $ - -
Total 313 $138 $15058 335
Passengers Revenue Hours Operating CostsPassenger
RevenueOperating Subsidy Passengers per Trip
Subsidy per Passenger
Cost per Revenue Hour
Farebox Recovery
FY 2015 28376 466 $85243 $24699 $60544 319 $213 $18292 290FY 2016 30906 431 $68366 $28456 $39910 317 $129 $15877 416FY 2017 27161 374 $56273 $18859 $37414 313 $138 $15058 335
Histo
ric Tr
ends
FY 20
161
7 DAT
A
Passengers Revenue Hours Revenue Miles
Operating Costs Passenger Revenue Operating Subsidy
27987 28376
30906
27161
25000
26000
27000
28000
29000
30000
31000
32000
FY 2013 FY 2014 FY 2015 FY 2016 FY 2017
Passengers526
466 431
374
0
100
200
300
400
500
600
FY 2013 FY 2014 FY 2015 FY 2016 FY 2017
Revenue Hours
$64440
$85243
$68366 $56273
$0
$20000
$40000
$60000
$80000
$100000
FY 2013 FY 2014 FY 2015 FY 2016 FY 2017
Operating Costs
272 319 317 313
00
100
200
300
400
500
FY 2013 FY 2014 FY 2015 FY 2016 FY 2017
Passengers per Trip
$175 $213 $129 $138
$000$100$200$300$400$500$600$700$800
FY 2013 FY 2014 FY 2015 FY 2016 FY 2017
Subsidy per Passenger
$12251
$18292 $15877 $15058
$0
$50
$100
$150
$200
FY 2013 FY 2014 FY 2015 FY 2016 FY 2017
Cost per Revenue Hour
122Partnership
Days of Service WkdyAvg Freq (Wkdy Peak) -
Avg Freq (Wkdy Non-Peak) 30 minAvg Freq (Wked) -
FY 2017 Farebox Recovery 66 transfer (to route) 9
Clipper usage 6
Annual Avg Monthly Avg Daily Annual Avg Monthly Avg Daily Annual Avg Monthly Avg DailyWeekday 19860 1986 113 1696 170 10 15480 1548 88 Saturday - - - - - - - - - Sunday - - - - - - - - -
Total 19860 1986 113 1696 170 10 15480 1548 88
Annual Avg Monthly Avg Daily Annual Avg Monthly Avg Daily Annual Avg Monthly Avg DailyWeekday $183943 $18394 $1045 $121007 $12101 $688 $62936 $6294 $358Saturday $ - $ - $ - $ - $ - $ - $ - $ - $ -Sunday $ - $ - $ - $ - $ - $ - $ - $ - $ -
Total $183943 $18394 $1045 $121007 $12101 $688 $62936 $6294 $358
Passengers per Revenue Hour
Subsidy per Passenger
Cost per Revenue Hour
Farebox Recovery
Weekday 117 $317 $10844 658Saturday - $ - $ - - Sunday - $ - $ - -
Total 117 $317 $10844 658
Passengers Revenue Hours Operating CostsPassenger
RevenueOperating Subsidy
Passengers per Revenue Hour
Subsidy per Passenger
Cost per Revenue Hour
Farebox Recovery
FY 2015FY 2016 20360 2932 $325230 $149686 $175544 69 $862 $11094 460FY 2017 19860 1696 $183943 $121007 $62936 117 $317 $10844 658
Histo
ric Tr
ends
FY 20
161
7 DAT
A
Passengers Revenue Hours Revenue Miles
Operating Costs Passenger Revenue Operating Subsidy
20360 19860
0
5000
10000
15000
20000
25000
FY 2013 FY 2014 FY 2015 FY 2016 FY 2017
Passengers2932
1696
0
500
1000
1500
2000
2500
3000
3500
FY 2013 FY 2014 FY 2015 FY 2016 FY 2017
Revenue Hours$325230
$183943
$0
$50000
$100000
$150000
$200000
$250000
$300000
$350000
FY 2013 FY 2014 FY 2015 FY 2016 FY 2017
Operating Costs
69
117
00
20
40
60
80
100
120
140
FY 2013 FY 2014 FY 2015 FY 2016 FY 2017
Passengers per Revenue Hour$862
$317
$000
$200
$400
$600
$800
$1000
FY 2013 FY 2014 FY 2015 FY 2016 FY 2017
Subsidy per Passenger
$11094 $10844
$0
$50
$100
$150
$200
FY 2013 FY 2014 FY 2015 FY 2016 FY 2017
Cost per Revenue Hour
125Supplemental
Days of Service School DaysAvg Freq (Wkdy Peak) 4 trips
Avg Freq (Wkdy Non-Peak) -Avg Freq (Wked) -
FY 2017 Farebox Recovery 16 transfer (to route) 1
Clipper usage 8
Annual Avg Monthly Avg Daily Annual Avg Monthly Avg Daily Annual Avg Monthly Avg DailyWeekday 13757 1251 76 600 55 3 8580 780 48 Saturday - - - - - - - - - Sunday - - - - - - - - -
Total 13757 1251 76 600 55 3 8580 780 48
Annual Avg Monthly Avg Daily Annual Avg Monthly Avg Daily Annual Avg Monthly Avg DailyWeekday $72469 $6588 $403 $11570 $1052 $64 $60899 $5536 $338Saturday $ - $ - $ - $ - $ - $ - $ - $ - $ -Sunday $ - $ - $ - $ - $ - $ - $ - $ - $ -
Total $72469 $6588 $403 $11570 $1052 $64 $60899 $5536 $338
Passengers per TripSubsidy per
PassengerCost per Revenue
HourFarebox Recovery
Weekday 193 $443 $12086 160Saturday - $ - $ - - Sunday - $ - $ - -
Total 193 $443 $12086 160
Passengers Revenue Hours Operating CostsPassenger
RevenueOperating Subsidy Passengers per Trip
Subsidy per Passenger
Cost per Revenue Hour
Farebox Recovery
FY 2015 13298 578 $87015 $11914 $75101 186 $565 $15054 137FY 2016 13197 595 $77991 $12684 $65307 182 $495 $13117 163FY 2017 13757 600 $72469 $11570 $60899 193 $443 $12086 160
Histo
ric Tr
ends
FY 20
161
7 DAT
A
Passengers Revenue Hours Revenue Miles
Operating Costs Passenger Revenue Operating Subsidy
8798 7189
13298 13197 13757
02000400060008000
10000120001400016000
FY 2013 FY 2014 FY 2015 FY 2016 FY 2017
Passengers
100 90
578 595 600
0
100
200
300
400
500
600
700
FY 2013 FY 2014 FY 2015 FY 2016 FY 2017
Revenue Hours
$13752 $10979
$87015 $77991
$72469
$0
$20000
$40000
$60000
$80000
$100000
FY 2013 FY 2014 FY 2015 FY 2016 FY 2017
Operating Costs
492
402
186 182 193
00
100
200
300
400
500
FY 2013 FY 2014 FY 2015 FY 2016 FY 2017
Passengers per Trip
$015 $002
$565 $495
$443
$000$100$200$300$400$500$600$700$800
FY 2013 FY 2014 FY 2015 FY 2016 FY 2017
Subsidy per Passenger$13821
$12267
$15054 $13117
$12086
$0$20$40$60$80
$100$120$140$160
FY 2013 FY 2014 FY 2015 FY 2016 FY 2017
Cost per Revenue Hour
139Supplemental
Days of Service School DaysAvg Freq (Wkdy Peak) 2 trips
Avg Freq (Wkdy Non-Peak) -Avg Freq (Wked) -
FY 2017 Farebox Recovery 20 transfer (to route) 0
Clipper usage 24
Annual Avg Monthly Avg Daily Annual Avg Monthly Avg Daily Annual Avg Monthly Avg DailyWeekday 6414 583 36 253 23 1 4127 375 23 Saturday - - - - - - - - - Sunday - - - - - - - - -
Total 6414 583 36 253 23 1 4127 375 23
Annual Avg Monthly Avg Daily Annual Avg Monthly Avg Daily Annual Avg Monthly Avg DailyWeekday $33182 $3017 $184 $6635 $603 $37 $26547 $2413 $147Saturday $ - $ - $ - $ - $ - $ - $ - $ - $ -Sunday $ - $ - $ - $ - $ - $ - $ - $ - $ -
Total $33182 $3017 $184 $6635 $603 $37 $26547 $2413 $147
Passengers per TripSubsidy per
PassengerCost per Revenue
HourFarebox Recovery
Weekday 179 $414 $13110 200Saturday - $ - $ - - Sunday - $ - $ - -
Total 179 $414 $13110 200
Passengers Revenue Hours Operating CostsPassenger
RevenueOperating Subsidy Passengers per Trip
Subsidy per Passenger
Cost per Revenue Hour
Farebox Recovery
FY 2015 5906 225 $36437 $5258 $31179 164 $528 $16173 144FY 2016 6391 315 $43776 $6241 $37535 160 $587 $13880 143FY 2017 6414 253 $33182 $6635 $26547 179 $414 $13110 200
Histo
ric Tr
ends
FY 20
161
7 DAT
A
Passengers Revenue Hours Revenue Miles
Operating Costs Passenger Revenue Operating Subsidy
4232 4026
5906 6391 6414
0
1000
2000
3000
4000
5000
6000
7000
FY 2013 FY 2014 FY 2015 FY 2016 FY 2017
Passengers
226 227 225
315
253
0
50
100
150
200
250
300
350
FY 2013 FY 2014 FY 2015 FY 2016 FY 2017
Revenue Hours
$31306 $27734
$36437
$43776
$33182
$0
$10000
$20000
$30000
$40000
$50000
FY 2013 FY 2014 FY 2015 FY 2016 FY 2017
Operating Costs
120 111 164 160 179
00
100
200
300
400
500
FY 2013 FY 2014 FY 2015 FY 2016 FY 2017
Passengers per Trip
$427
$628 $528
$587
$414
$000$100$200$300$400$500$600$700$800
FY 2013 FY 2014 FY 2015 FY 2016 FY 2017
Subsidy per Passenger
$13834 $12239
$16173 $13880 $13110
$0
$50
$100
$150
$200
FY 2013 FY 2014 FY 2015 FY 2016 FY 2017
Cost per Revenue Hour
145Supplemental
Days of Service School DaysAvg Freq (Wkdy Peak) 2-3 trips
Avg Freq (Wkdy Non-Peak) -Avg Freq (Wked) -
FY 2017 Farebox Recovery 29 transfer (to route) 5
Clipper usage 2
Annual Avg Monthly Avg Daily Annual Avg Monthly Avg Daily Annual Avg Monthly Avg DailyWeekday 16406 1491 90 191 17 1 2175 198 12 Saturday - - - - - - - - - Sunday - - - - - - - - -
Total 16406 1491 90 191 17 1 2175 198 12
Annual Avg Monthly Avg Daily Annual Avg Monthly Avg Daily Annual Avg Monthly Avg DailyWeekday $25426 $2311 $139 $7258 $660 $40 $18168 $1652 $99Saturday $ - $ - $ - $ - $ - $ - $ - $ - $ -Sunday $ - $ - $ - $ - $ - $ - $ - $ - $ -
Total $25426 $2311 $139 $7258 $660 $40 $18168 $1652 $99
Passengers per TripSubsidy per
PassengerCost per Revenue
HourFarebox Recovery
Weekday 372 $111 $13347 285Saturday - $ - $ - - Sunday - $ - $ - -
Total 372 $111 $13347 285
Passengers Revenue Hours Operating CostsPassenger
RevenueOperating Subsidy Passengers per Trip
Subsidy per Passenger
Cost per Revenue Hour
Farebox Recovery
FY 2015 6911 87 $13373 $5858 $7515 337 $109 $15442 438FY 2016 10268 167 $21672 $6341 $15331 396 $149 $12993 293FY 2017 16406 191 $25426 $7258 $18168 372 $111 $13347 285
Histo
ric Tr
ends
FY 20
161
7 DAT
A
Passengers Revenue Hours Revenue Miles
Operating Costs Passenger Revenue Operating Subsidy
6911
10268
16406
0
5000
10000
15000
20000
FY 2013 FY 2014 FY 2015 FY 2016 FY 2017
Passengers
87
167 191
0
50
100
150
200
250
FY 2013 FY 2014 FY 2015 FY 2016 FY 2017
Revenue Hours
$13373
$21672 $25426
$0
$5000
$10000
$15000
$20000
$25000
$30000
FY 2013 FY 2014 FY 2015 FY 2016 FY 2017
Operating Costs
337 396 372
00
100
200
300
400
500
FY 2013 FY 2014 FY 2015 FY 2016 FY 2017
Passengers per Trip
$109 $149 $111
$000$100$200$300$400$500$600$700$800
FY 2013 FY 2014 FY 2015 FY 2016 FY 2017
Subsidy per Passenger
$15442 $12993 $13347
$0
$50
$100
$150
$200
FY 2013 FY 2014 FY 2015 FY 2016 FY 2017
Cost per Revenue Hour
151Supplemental
Days of Service School DaysAvg Freq (Wkdy Peak) 4-5 trips
Avg Freq (Wkdy Non-Peak) -Avg Freq (Wked) -
FY 2017 Farebox Recovery 25 transfer (to route) 1
Clipper usage 4
Annual Avg Monthly Avg Daily Annual Avg Monthly Avg Daily Annual Avg Monthly Avg DailyWeekday 36801 3346 204 594 54 3 10649 968 59 Saturday - - - - - - - - - Sunday - - - - - - - - -
Total 36801 3346 204 594 54 3 10649 968 59
Annual Avg Monthly Avg Daily Annual Avg Monthly Avg Daily Annual Avg Monthly Avg DailyWeekday $73842 $6713 $410 $18463 $1678 $103 $55379 $5034 $308Saturday $ - $ - $ - $ - $ - $ - $ - $ - $ -Sunday $ - $ - $ - $ - $ - $ - $ - $ - $ -
Total $73842 $6713 $410 $18463 $1678 $103 $55379 $5034 $308
Passengers per TripSubsidy per
PassengerCost per Revenue
HourFarebox Recovery
Weekday 428 $150 $12442 250Saturday - $ - $ - - Sunday - $ - $ - -
Total 428 $150 $12442 250
Passengers Revenue Hours Operating CostsPassenger
RevenueOperating Subsidy Passengers per Trip
Subsidy per Passenger
Cost per Revenue Hour
Farebox Recovery
FY 2015 39309 911 $134174 $34376 $99798 315 $254 $14722 256FY 2016 42643 759 $100712 $25851 $74861 456 $176 $13267 257FY 2017 36801 594 $73842 $18463 $55379 428 $150 $12442 250
Histo
ric Tr
ends
FY 20
161
7 DAT
A
Passengers Revenue Hours Revenue Miles
Operating Costs Passenger Revenue Operating Subsidy
39537 39309
42643
36801
32000
34000
36000
38000
40000
42000
44000
FY 2013 FY 2014 FY 2015 FY 2016 FY 2017
Passengers
784 911
759
594
0
200
400
600
800
1000
FY 2013 FY 2014 FY 2015 FY 2016 FY 2017
Revenue Hours
$95932
$134174
$100712
$73842
$0$20000$40000$60000$80000
$100000$120000$140000$160000
FY 2013 FY 2014 FY 2015 FY 2016 FY 2017
Operating Costs
368 315
456 428
00
100
200
300
400
500
FY 2013 FY 2014 FY 2015 FY 2016 FY 2017
Passengers per Trip
$188 $254
$176 $150
$000$100$200$300$400$500$600$700$800
FY 2013 FY 2014 FY 2015 FY 2016 FY 2017
Subsidy per Passenger
$12233
$14722 $13267 $12442
$0$20$40$60$80
$100$120$140$160
FY 2013 FY 2014 FY 2015 FY 2016 FY 2017
Cost per Revenue Hour
154Supplemental
Days of Service School DaysAvg Freq (Wkdy Peak) 3 trips
Avg Freq (Wkdy Non-Peak) -Avg Freq (Wked) -
FY 2017 Farebox Recovery 21 transfer (to route) 0
Clipper usage 5
Annual Avg Monthly Avg Daily Annual Avg Monthly Avg Daily Annual Avg Monthly Avg DailyWeekday 13738 1249 76 358 33 2 4342 395 24 Saturday - - - - - - - - - Sunday - - - - - - - - -
Total 13738 1249 76 358 33 2 4342 395 24
Annual Avg Monthly Avg Daily Annual Avg Monthly Avg Daily Annual Avg Monthly Avg DailyWeekday $41965 $3815 $233 $8847 $804 $49 $33118 $3011 $184Saturday $ - $ - $ - $ - $ - $ - $ - $ - $ -Sunday $ - $ - $ - $ - $ - $ - $ - $ - $ -
Total $41965 $3815 $233 $8847 $804 $49 $33118 $3011 $184
Passengers per TripSubsidy per
PassengerCost per Revenue
HourFarebox Recovery
Weekday 255 $241 $11729 211Saturday - $ - $ - - Sunday - $ - $ - -
Total 255 $241 $11729 211
Passengers Revenue Hours Operating CostsPassenger
RevenueOperating Subsidy Passengers per Trip
Subsidy per Passenger
Cost per Revenue Hour
Farebox Recovery
FY 2015 15376 293 $42604 $13174 $29430 388 $191 $14541 309FY 2016 17858 360 $46133 $14660 $31473 311 $176 $12808 318FY 2017 13738 358 $41965 $8847 $33118 255 $241 $11729 211
Histo
ric Tr
ends
FY 20
161
7 DAT
A
Passengers Revenue Hours Revenue Miles
Operating Costs Passenger Revenue Operating Subsidy
12138
15376 17858
13738
0
5000
10000
15000
20000
FY 2013 FY 2014 FY 2015 FY 2016 FY 2017
Passengers
310 293
360 358
050
100150200250300350400
FY 2013 FY 2014 FY 2015 FY 2016 FY 2017
Revenue Hours
$37913 $42604
$46133 $41965
$0
$10000
$20000
$30000
$40000
$50000
FY 2013 FY 2014 FY 2015 FY 2016 FY 2017
Operating Costs
291
388
311 255
00
100
200
300
400
500
FY 2013 FY 2014 FY 2015 FY 2016 FY 2017
Passengers per Trip
$256 $191 $176
$241
$000$100$200$300$400$500$600$700$800
FY 2013 FY 2014 FY 2015 FY 2016 FY 2017
Subsidy per Passenger
$12246
$14541 $12808
$11729
$0$20$40$60$80
$100$120$140$160
FY 2013 FY 2014 FY 2015 FY 2016 FY 2017
Cost per Revenue Hour
219Local Connector
Days of Service Wkdy Sa SuAvg Freq (Wkdy Peak) 30 min
Avg Freq (Wkdy Non-Peak) 30 minAvg Freq (Wked) 30 min
FY 2017 Farebox Recovery 11 transfer (to route) 20
Clipper usage 11
Annual Avg Monthly Avg Daily Annual Avg Monthly Avg Daily Annual Avg Monthly Avg DailyWeekday 40817 3401 161 5020 418 20 58766 4897 232 Saturday 4888 407 94 637 53 12 10931 911 210 Sunday 4744 395 79 735 61 12 12607 1051 210
Total 50449 4204 138 6392 533 18 82304 6859 225
Annual Avg Monthly Avg Daily Annual Avg Monthly Avg Daily Annual Avg Monthly Avg DailyWeekday $462388 $38532 $1828 $51411 $4284 $203 $410977 $34248 $1624Saturday $59904 $4992 $1152 $6230 $519 $120 $53674 $4473 $1032Sunday $68932 $5744 $1149 $6460 $538 $108 $62472 $5206 $1041
Total $591224 $49269 $1620 $64101 $5342 $176 $527123 $43927 $1444
Passengers per Revenue Hour
Subsidy per Passenger
Cost per Revenue Hour
Farebox Recovery
Weekday 81 $1007 $9212 111Saturday 77 $1098 $9401 104Sunday 65 $1317 $9381 94
Total 79 $1045 $9250 108
Passengers Revenue Hours Operating CostsPassenger
RevenueOperating Subsidy
Passengers per Revenue Hour
Subsidy per Passenger
Cost per Revenue Hour
Farebox Recovery
FY 2015 60906 6585 $569962 $65747 $504215 92 $828 $8656 115FY 2016 55610 6591 $590663 $73164 $517499 84 $931 $8961 124FY 2017 50449 6392 $591224 $64101 $527123 79 $1045 $9250 108
Histo
ric Tr
ends
FY 20
161
7 DAT
A
Passengers Revenue Hours Revenue Miles
Operating Costs Passenger Revenue Operating Subsidy
55543 60906
55610 50449
0
10000
20000
30000
40000
50000
60000
70000
FY 2013 FY 2014 FY 2015 FY 2016 FY 2017
Passengers
5734
6585 6591 6392
520054005600580060006200640066006800
FY 2013 FY 2014 FY 2015 FY 2016 FY 2017
Revenue Hours
$522978
$569962
$590663 $591224
$480000
$500000
$520000
$540000
$560000
$580000
$600000
FY 2013 FY 2014 FY 2015 FY 2016 FY 2017
Operating Costs
97 92 84 79
00
20
40
60
80
100
120
140
FY 2013 FY 2014 FY 2015 FY 2016 FY 2017
Passengers per Revenue Hour
$851 $828 $931
$1045
$000$200$400$600$800
$1000$1200$1400
FY 2013 FY 2014 FY 2015 FY 2016 FY 2017
Subsidy per Passenger
$9121 $8656 $8961 $9250
$0
$50
$100
$150
$200
FY 2013 FY 2014 FY 2015 FY 2016 FY 2017
Cost per Revenue Hour
228Local Connector
Days of Service Wkdy Sa SuAvg Freq (Wkdy Peak) 60 min
Avg Freq (Wkdy Non-Peak) 60 minAvg Freq (Wked) 60 min
FY 2017 Farebox Recovery 11 transfer (to route) 17
Clipper usage 15
Annual Avg Monthly Avg Daily Annual Avg Monthly Avg Daily Annual Avg Monthly Avg DailyWeekday 57316 4776 227 7175 598 28 65884 5490 260 Saturday 8218 685 158 1331 111 26 13020 1085 250 Sunday 5806 484 97 1536 128 26 15023 1252 250
Total 71340 5945 195 10042 837 28 93926 7827 257
Annual Avg Monthly Avg Daily Annual Avg Monthly Avg Daily Annual Avg Monthly Avg DailyWeekday $646194 $53850 $2554 $80857 $6738 $320 $565337 $47111 $2235Saturday $120205 $10017 $2312 $12568 $1047 $242 $107637 $8970 $2070Sunday $138407 $11534 $2307 $10487 $874 $175 $127920 $10660 $2132
Total $904806 $75401 $2479 $103912 $8659 $285 $800894 $66741 $2194
Passengers per Revenue Hour
Subsidy per Passenger
Cost per Revenue Hour
Farebox Recovery
Weekday 80 $986 $9006 125Saturday 62 $1310 $9030 105Sunday 38 $2203 $9011 76
Total 71 $1123 $9010 115
Passengers Revenue Hours Operating CostsPassenger
RevenueOperating Subsidy
Passengers per Revenue Hour
Subsidy per Passenger
Cost per Revenue Hour
Farebox Recovery
FY 2015 15287 2828 $239879 $18274 $221605 54 $1450 $8482 76FY 2016 17522 3185 $280634 $28092 $252542 55 $1441 $8812 100FY 2017 71340 10042 $904806 $103912 $800894 71 $1123 $9010 115
Histo
ric Tr
ends
FY 20
161
7 DAT
A
Passengers Revenue Hours Revenue Miles
Operating Costs Passenger Revenue Operating Subsidy
5854 15287 17522
71340
01000020000300004000050000600007000080000
FY 2013 FY 2014 FY 2015 FY 2016 FY 2017
Passengers
970
2828 3185
10042
0
2000
4000
6000
8000
10000
12000
FY 2013 FY 2014 FY 2015 FY 2016 FY 2017
Revenue Hours
$85183
$239879 $280634
$904806
$0
$200000
$400000
$600000
$800000
$1000000
FY 2013 FY 2014 FY 2015 FY 2016 FY 2017
Operating Costs
60 54 55 71
00
20
40
60
80
100
120
140
FY 2013 FY 2014 FY 2015 FY 2016 FY 2017
Passengers per Revenue Hour$1358
$1450 $1441
$1123
$000$200$400$600$800
$1000$1200$1400
FY 2013 FY 2014 FY 2015 FY 2016 FY 2017
Subsidy per Passenger
$8779 $8482 $8812 $9010
$0
$50
$100
$150
$200
FY 2013 FY 2014 FY 2015 FY 2016 FY 2017
Cost per Revenue Hour
233Local Connector
Days of Service Wkdy Sa SuAvg Freq (Wkdy Peak) 60 min
Avg Freq (Wkdy Non-Peak) 60 minAvg Freq (Wked) 60 min
FY 2017 Farebox Recovery 13 transfer (to route) 16
Clipper usage 10
Annual Avg Monthly Avg Daily Annual Avg Monthly Avg Daily Annual Avg Monthly Avg DailyWeekday 35589 2966 141 3306 276 13 38809 3234 153 Saturday 3911 326 75 490 41 9 5829 486 112 Sunday 3298 275 55 566 47 9 6726 561 112
Total 42798 3567 117 4363 364 12 51364 4280 141
Annual Avg Monthly Avg Daily Annual Avg Monthly Avg Daily Annual Avg Monthly Avg DailyWeekday $302758 $25230 $1197 $42450 $3538 $168 $260308 $21692 $1029Saturday $44829 $3736 $862 $5018 $418 $97 $39811 $3318 $766Sunday $51616 $4301 $860 $4533 $378 $76 $47083 $3924 $785
Total $399203 $33267 $1094 $52001 $4333 $142 $347202 $28934 $951
Passengers per Revenue Hour
Subsidy per Passenger
Cost per Revenue Hour
Farebox Recovery
Weekday 108 $731 $9158 140Saturday 80 $1018 $9141 112Sunday 58 $1428 $9118 88
Total 98 $811 $9151 130
Passengers Revenue Hours Operating CostsPassenger
RevenueOperating Subsidy
Passengers per Revenue Hour
Subsidy per Passenger
Cost per Revenue Hour
Farebox Recovery
FY 2015 50342 4366 $371602 $52526 $319076 115 $634 $8512 141FY 2016 49494 4384 $388005 $59296 $328709 113 $664 $8851 153FY 2017 42798 4363 $399203 $52001 $347202 98 $811 $9151 130
Histo
ric Tr
ends
FY 20
161
7 DAT
A
Passengers Revenue Hours Revenue Miles
Operating Costs Passenger Revenue Operating Subsidy
39956
50422 50342 49494 42798
0
10000
20000
30000
40000
50000
60000
FY 2013 FY 2014 FY 2015 FY 2016 FY 2017
Passengers
3981
4144
4366 4384 4363
370038003900400041004200430044004500
FY 2013 FY 2014 FY 2015 FY 2016 FY 2017
Revenue Hours
$350499
$378792 $371602
$388005 $399203
$320000$330000$340000$350000$360000$370000$380000$390000$400000$410000
FY 2013 FY 2014 FY 2015 FY 2016 FY 2017
Operating Costs
100
122 115 113 98
00
20
40
60
80
100
120
140
FY 2013 FY 2014 FY 2015 FY 2016 FY 2017
Passengers per Revenue Hour
$760 $661 $634 $664
$811
$000$200$400$600$800
$1000$1200$1400
FY 2013 FY 2014 FY 2015 FY 2016 FY 2017
Subsidy per Passenger
$8805 $9142 $8512 $8851 $9151
$0
$50
$100
$150
$200
FY 2013 FY 2014 FY 2015 FY 2016 FY 2017
Cost per Revenue Hour
245Local Connector
Days of Service Wkdy Sa SuAvg Freq (Wkdy Peak) 60 min
Avg Freq (Wkdy Non-Peak) 60 minAvg Freq (Wked) 60 min
FY 2017 Farebox Recovery 15 transfer (to route) 13
Clipper usage 13
Annual Avg Monthly Avg Daily Annual Avg Monthly Avg Daily Annual Avg Monthly Avg DailyWeekday 41761 3480 165 3014 251 12 28706 2392 113 Saturday 4220 352 81 620 52 12 5778 482 111 Sunday 3785 315 63 715 60 12 6667 556 111
Total 49766 4147 136 4349 362 12 41152 3429 113
Annual Avg Monthly Avg Daily Annual Avg Monthly Avg Daily Annual Avg Monthly Avg DailyWeekday $271762 $22647 $1074 $44873 $3739 $177 $226889 $18907 $897Saturday $55697 $4641 $1071 $6217 $518 $120 $49480 $4123 $952Sunday $64137 $5345 $1069 $5878 $490 $98 $58259 $4855 $971
Total $391596 $32633 $1073 $56968 $4747 $156 $334628 $27886 $917
Passengers per Revenue Hour
Subsidy per Passenger
Cost per Revenue Hour
Farebox Recovery
Weekday 139 $543 $9016 165Saturday 68 $1173 $8988 112Sunday 53 $1539 $8970 92
Total 114 $672 $9004 145
Passengers Revenue Hours Operating CostsPassenger
RevenueOperating Subsidy
Passengers per Revenue Hour
Subsidy per Passenger
Cost per Revenue Hour
Farebox Recovery
FY 2015FY 2016 2184 227 $19695 $3137 $16558 96 $758 $8695 159FY 2017 49766 4349 $391596 $56968 $334628 114 $672 $9004 145
Histo
ric Tr
ends
FY 20
161
7 DAT
A
Passengers Revenue Hours Revenue Miles
Operating Costs Passenger Revenue Operating Subsidy
2184
49766
0
10000
20000
30000
40000
50000
60000
FY 2013 FY 2014 FY 2015 FY 2016 FY 2017
Passengers
227
4349
0
1000
2000
3000
4000
5000
FY 2013 FY 2014 FY 2015 FY 2016 FY 2017
Revenue Hours
$19695
$391596
$0
$100000
$200000
$300000
$400000
$500000
FY 2013 FY 2014 FY 2015 FY 2016 FY 2017
Operating Costs
96 114
00
20
40
60
80
100
120
140
FY 2013 FY 2014 FY 2015 FY 2016 FY 2017
Passengers per Revenue Hour
$758 $672
$000$200$400$600$800
$1000$1200$1400
FY 2013 FY 2014 FY 2015 FY 2016 FY 2017
Subsidy per Passenger
$8695 $9004
$0
$50
$100
$150
$200
FY 2013 FY 2014 FY 2015 FY 2016 FY 2017
Cost per Revenue Hour
251Local Connector
Days of Service Wkdy Sa SuAvg Freq (Wkdy Peak) 60 min
Avg Freq (Wkdy Non-Peak) 60 minAvg Freq (Wked) 60 min
FY 2017 Farebox Recovery 11 transfer (to route) 8
Clipper usage 8
Annual Avg Monthly Avg Daily Annual Avg Monthly Avg Daily Annual Avg Monthly Avg DailyWeekday 76675 6390 303 6754 563 27 95654 7971 378 Saturday 9952 829 191 1325 110 25 18630 1553 358 Sunday 8879 740 148 1528 127 25 21497 1791 358
Total 95506 7959 262 9607 801 26 135781 11315 372
Annual Avg Monthly Avg Daily Annual Avg Monthly Avg Daily Annual Avg Monthly Avg DailyWeekday $625542 $52129 $2472 $78006 $6501 $308 $547536 $45628 $2164Saturday $122485 $10207 $2355 $12104 $1009 $233 $110381 $9198 $2123Sunday $140992 $11749 $2350 $11713 $976 $195 $129279 $10773 $2155
Total $889019 $74085 $2436 $101823 $8485 $279 $787196 $65600 $2157
Passengers per Revenue Hour
Subsidy per Passenger
Cost per Revenue Hour
Farebox Recovery
Weekday 114 $714 $9262 125Saturday 75 $1109 $9246 99Sunday 58 $1456 $9225 83
Total 99 $824 $9254 115
Passengers Revenue Hours Operating CostsPassenger
RevenueOperating Subsidy
Passengers per Revenue Hour
Subsidy per Passenger
Cost per Revenue Hour
Farebox Recovery
FY 2015 97647 9172 $800242 $103081 $697161 106 $714 $8725 129FY 2016 98886 9226 $831623 $120959 $710664 107 $719 $9014 145FY 2017 95506 9607 $889019 $101823 $787196 99 $824 $9254 115
Histo
ric Tr
ends
FY 20
161
7 DAT
A
Passengers Revenue Hours Revenue Miles
Operating Costs Passenger Revenue Operating Subsidy
87073
97647 98886
95506
80000
85000
90000
95000
100000
FY 2013 FY 2014 FY 2015 FY 2016 FY 2017
Passengers
8322
9172 9226
9607
7500
8000
8500
9000
9500
10000
FY 2013 FY 2014 FY 2015 FY 2016 FY 2017
Revenue Hours
$772570
$800242
$831623
$889019
$700000
$750000
$800000
$850000
$900000
FY 2013 FY 2014 FY 2015 FY 2016 FY 2017
Operating Costs
105 106 107 99
00
20
40
60
80
100
120
140
FY 2013 FY 2014 FY 2015 FY 2016 FY 2017
Passengers per Revenue Hour
$797 $714 $719
$824
$000$200$400$600$800
$1000$1200$1400
FY 2013 FY 2014 FY 2015 FY 2016 FY 2017
Subsidy per Passenger
$9284 $8725 $9014 $9254
$0
$50
$100
$150
$200
FY 2013 FY 2014 FY 2015 FY 2016 FY 2017
Cost per Revenue Hour
257Local Connector
Days of Service WkdyAvg Freq (Wkdy Peak) 60 min
Avg Freq (Wkdy Non-Peak) 60 minAvg Freq (Wked) -
FY 2017 Farebox Recovery 12 transfer (to route) 6
Clipper usage 13
Annual Avg Monthly Avg Daily Annual Avg Monthly Avg Daily Annual Avg Monthly Avg DailyWeekday 69126 5761 273 7643 637 30 85748 7146 339 Saturday - - - - - - - - - Sunday - - - - - - - - -
Total 69126 5761 273 7643 637 30 85748 7146 339
Annual Avg Monthly Avg Daily Annual Avg Monthly Avg Daily Annual Avg Monthly Avg DailyWeekday $697953 $58163 $2759 $82621 $6885 $327 $615332 $51278 $2432Saturday $ - $ - $ - $ - $ - $ - $ - $ - $ -Sunday $ - $ - $ - $ - $ - $ - $ - $ - $ -
Total $697953 $58163 $2759 $82621 $6885 $327 $615332 $51278 $2432
Passengers per Revenue Hour
Subsidy per Passenger
Cost per Revenue Hour
Farebox Recovery
Weekday 90 $890 $9132 118Saturday - $ - $ - - Sunday - $ - $ - -
Total 90 $890 $9132 118
Passengers Revenue Hours Operating CostsPassenger
RevenueOperating Subsidy
Passengers per Revenue Hour
Subsidy per Passenger
Cost per Revenue Hour
Farebox Recovery
FY 2015 69984 6289 $546363 $73402 $472961 111 $676 $8687 134FY 2016 71429 6414 $575805 $83288 $492517 111 $690 $8977 145FY 2017 69126 7643 $697953 $82621 $615332 90 $890 $9132 118
Histo
ric Tr
ends
FY 20
161
7 DAT
A
Passengers Revenue Hours Revenue Miles
Operating Costs Passenger Revenue Operating Subsidy
35511
68515 69984 71429 69126
01000020000300004000050000600007000080000
FY 2013 FY 2014 FY 2015 FY 2016 FY 2017
Passengers
2909
5965 6289 6414 7643
0
2000
4000
6000
8000
10000
FY 2013 FY 2014 FY 2015 FY 2016 FY 2017
Revenue Hours
$263500
$555608 $546363 $575805
$697953
$0$100000$200000$300000$400000$500000$600000$700000$800000
FY 2013 FY 2014 FY 2015 FY 2016 FY 2017
Operating Costs
122 115 111 111
90
00
20
40
60
80
100
120
140
FY 2013 FY 2014 FY 2015 FY 2016 FY 2017
Passengers per Revenue Hour
$625 $721 $676 $690
$890
$000$200$400$600$800
$1000$1200$1400
FY 2013 FY 2014 FY 2015 FY 2016 FY 2017
Subsidy per Passenger
$9057 $9315 $8687 $8977 $9132
$0
$50
$100
$150
$200
FY 2013 FY 2014 FY 2015 FY 2016 FY 2017
Cost per Revenue Hour
Hdn ValleyYellow Bus
Days of Service School DaysAvg Freq (Wkdy Peak) 2 trips
Avg Freq (Wkdy Non-Peak) -Avg Freq (Wked) -
FY 2017 Farebox Recovery 26 transfer (to route) -
Clipper usage -
Annual Avg Monthly Avg Daily Annual Avg Monthly Avg Daily Annual Avg Monthly Avg DailyWeekday 9281 844 52 180 16 1 1638 149 9 Saturday - - - - - - - - - Sunday - - - - - - - - -
Total 9281 844 52 180 16 1 1638 149 9
Annual Avg Monthly Avg Daily Annual Avg Monthly Avg Daily Annual Avg Monthly Avg DailyWeekday $124763 $11342 $693 $32170 $2925 $179 $92593 $8418 $514Saturday $ - $ - $ - $ - $ - $ - $ - $ - $ -Sunday $ - $ - $ - $ - $ - $ - $ - $ - $ -
Total $124763 $11342 $693 $32170 $2925 $179 $92593 $8418 $514
Passengers per Revenue Hour
Subsidy per Passenger
Cost per Revenue Hour
Farebox Recovery
Weekday 516 $998 $69313 258Saturday - $ - $ - - Sunday - $ - $ - -
Total 516 $998 $69313 258
Passengers Revenue Hours Operating CostsPassenger
RevenueOperating Subsidy
Passengers per Revenue Hour
Subsidy per Passenger
Cost per Revenue Hour
Farebox Recovery
FY 2015FY 2016 8669 211 $140482 $25658 $114824 412 $1325 $66706 183FY 2017 9281 180 $124763 $32170 $92593 516 $998 $69313 258
Histo
ric Tr
ends
FY 20
161
7 DAT
A
Passengers Revenue Hours Revenue Miles
Operating Costs Passenger Revenue Operating Subsidy
8669 9281
0
2000
4000
6000
8000
10000
FY 2013 FY 2014 FY 2015 FY 2016 FY 2017
Passengers211
180
0
50
100
150
200
250
FY 2013 FY 2014 FY 2015 FY 2016 FY 2017
Revenue Hours$140482
$124763
$0$20000$40000$60000$80000
$100000$120000$140000$160000
FY 2013 FY 2014 FY 2015 FY 2016 FY 2017
Operating Costs
412 516
00
500
1000
1500
2000
FY 2013 FY 2014 FY 2015 FY 2016 FY 2017
Passengers per Revenue Hour
$1325
$998
$000
$200
$400
$600
$800
$1000
$1200
$1400
FY 2013 FY 2014 FY 2015 FY 2016 FY 2017
Subsidy per Passenger
$66706 $69313
$0$100$200$300$400$500$600$700$800
FY 2013 FY 2014 FY 2015 FY 2016 FY 2017
Cost per Revenue Hour
White HillYellow Bus
Days of Service School DaysAvg Freq (Wkdy Peak) 17 trips
Avg Freq (Wkdy Non-Peak) -Avg Freq (Wked) -
FY 2017 Farebox Recovery 60 transfer (to route) -
Clipper usage -
Annual Avg Monthly Avg Daily Annual Avg Monthly Avg Daily Annual Avg Monthly Avg DailyWeekday 127219 11565 707 1065 97 6 12096 1100 67 Saturday - - - - - - - - - Sunday - - - - - - - - -
Total 127219 11565 707 1065 97 6 12096 1100 67
Annual Avg Monthly Avg Daily Annual Avg Monthly Avg Daily Annual Avg Monthly Avg DailyWeekday $738585 $67144 $4103 $440896 $40081 $2449 $297689 $27063 $1654Saturday $ - $ - $ - $ - $ - $ - $ - $ - $ -Sunday $ - $ - $ - $ - $ - $ - $ - $ - $ -
Total $738585 $67144 $4103 $440896 $40081 $2449 $297689 $27063 $1654
Passengers per Revenue Hour
Subsidy per Passenger
Cost per Revenue Hour
Farebox Recovery
Weekday 1194 $234 $69325 597Saturday - $ - $ - - Sunday - $ - $ - -
Total 1194 $234 $69325 597
Passengers Revenue Hours Operating CostsPassenger
RevenueOperating Subsidy
Passengers per Revenue Hour
Subsidy per Passenger
Cost per Revenue Hour
Farebox Recovery
FY 2015FY 2016 129635 870 $579937 $385753 $194184 1491 $150 $66698 665FY 2017 127219 1065 $738585 $440896 $297689 1194 $234 $69325 597
Histo
ric Tr
ends
FY 20
161
7 DAT
A
Passengers Revenue Hours Revenue Miles
Operating Costs Passenger Revenue Operating Subsidy
129635 127219
0
20000
40000
60000
80000
100000
120000
140000
FY 2013 FY 2014 FY 2015 FY 2016 FY 2017
Passengers
870
1065
0
200
400
600
800
1000
1200
FY 2013 FY 2014 FY 2015 FY 2016 FY 2017
Revenue Hours
$579937
$738585
$0$100000$200000$300000$400000$500000$600000$700000$800000
FY 2013 FY 2014 FY 2015 FY 2016 FY 2017
Operating Costs
1491
1194
00200400600800
1000120014001600
FY 2013 FY 2014 FY 2015 FY 2016 FY 2017
Passengers per Revenue Hour
$150 $234
$000
$200
$400
$600
$800
$1000
$1200
$1400
FY 2013 FY 2014 FY 2015 FY 2016 FY 2017
Subsidy per Passenger$66698 $69325
$0$100$200$300$400$500$600$700$800
FY 2013 FY 2014 FY 2015 FY 2016 FY 2017
Cost per Revenue Hour
MARIN TRANSIT | 2018ndash2027 SHORT RANGE TRANSIT PLAN Chapter 4 Capital Plan
DRAFT 4-9
Table 4-7 Local Transit Bus Replacement Schedule
Fiscal Year (In-service)
Replacements
Total Cost
Local Share Vehicle Type Seating
Capacity Service(1)
FY 201718 10 $7710000 $1387800 40ft hybrid 39 LB
2 $1662000 $332404 35ft Electric 32 LB
FY 201819
1 $125000 $22500 24ft 20 SH
4 $1600000 $1094880 29ft XHF
(upgrade) 22 SG
FY 201920 10 $8940000 $1609200 60ft 63 LB
FY 202021 8 $1032000 $185760 24ft 20 SH
2 $850000 $153000 35ft XHF 37 MW
FY 202223
7 $5584578 $1005224 35ft hybrid 32 LB
2 $874182 $599281 29ft XHF
(upgrade) 22 SG
FY 202425 3 $1393227 $250781 35ft XHF 37 MW
FY 202526 2 $299093 $53837 24ft 20 SH
5 $2391706 $430507 35ft XHF 37 MW
FY 202627 - - - - - -
Notes (1) Service Types LB ndash Big Bus SH- Shuttle SG- Rural Stagecoach MW- Seasonal Muir Woods and School
Expansion Needs When considering service expansion vehicles are often a constraint on the amount of service that can be added Expansion vehicles are a lower priority in the regional capital plan and typically do not receive federal funds Local state or discretionary grants are required to expand fleets The capital plan does not include any expansion vehicles for the local fixed route program consistent with the current service plan
Marin Transit relies on three retired active vehicles to support operations Retired active vehicles are vehicles that are beyond their FTA-determined useful life that remain in service while their replacements are added the fleet The District intends to replace these as expansion vehicles if funding becomes available
Demand Response Vehicles
Marin Transit has 58 vehicles available for local and regional paratransit service To provide an adequate number of spare vehicles a maximum of about 46 vehicles in service Marin Transit owns 32 vehicles GGBHTD owns 14 and the contractor provides another 13 vehicles to support the operations Eleven of the 13 contractor vehicles will be replaced in early 2018 - five by the District and six by GGBHTD Two of the five replaced by the District will be replaced with smaller accessible vans These will be used for same day
Fixed-Route Passengers (incl Yellow Bus) by Month
July August September October November December January February March April May June
Prior Fiscal Year Passengers Current Fiscal Year PassengersPrior Fiscal Year Passengers Current Fiscal Year Passengers
0
80000
160000
240000
320000
244439
271284484271284
296637296637
2768532276853
252829252829
238010238010
219681219681
2097050505209705
277644277644
240773240773240773240773
284816284816
24935149492493512444392444392442 43999244439244244439439244439244244439999999244200
2600562602600 0000000260056
FISCAL YEAR
2018
Demand Response Passengers by Month
July August September October November December January February March April May June
Prior Fiscal Year Passengers Current Fiscal Year PassengersPrior Fiscal Year Passengers Current Fiscal Year Passengers
0
4000
8000
12000
16000
12 77312773
13631 1362813628 1356413564
1247712477
1206712067 1212412124118100011810
1364613646
1260912609
1359313593
12950129501277312 77312 77312 77312613131612 6133312 6133312613331277312773127731277312613
13 6311363113 631135641363113 613631311363113 6136313113564
Year-to-Date Ridership Trends
Item 3b
2
Average Systemwide Daily Passengers
Weekday Saturday Sunday
Prior Fiscal Year Average Daily Passengers Current Fiscal Year Average Daily PassengersPrior Fiscal Year Average Daily Passengers Current Fiscal Year Average Daily Passengers
0
3000
6000
9000
12000
11370113701109811098
7726772674407440
66576657
60556055
Productivity (paxhr) by Typology
1 Local T
runklin
e
2 Local B
asic
3 Local C
onnecto
r
5 R
ura
l
8 R
ecre
ational
9 D
em
and R
esponse
Prior Fiscal Year Productivity Current Fiscal Year ProductivityPrior Fiscal Year Productivity Current Fiscal Year Productivity
00
80
160
240
320
249249 252252
163163
14814 8148
9292 91918181
757 575
320320
275275
2323 2121
Monthly StatisticsMONTH
August
1 Local Trunkline Routes 35 36 71X
2 Local Basic Routes 17 22 23 23X 29 49
3 Local Connector Routes 219 228 233 245 251 257
5 Rural Routes 61 68
8 Recreational Routes 6666F
9 Demand Response Local Paratransit Novato Dial-A-Ride Rural Dial-A-Ride
Route Typologies
Item 3b
3
Fixed-Route Passengers (incl Yellow Bus) by Month
July August September October November December January February March April May June
Prior Fiscal Year Passengers Current Fiscal Year Passengers
0
80000
160000
240000
320000
244439244439
271284271284
296637296637
276853276853
252829252829
238010238010
219681219681209705209705
277644277644
240773240773
284816284816
249351249351244200244200
260056260056
282441282441
FISCAL YEAR
2018
Demand Response Passengers by Month
July August September October November December January February March April May June
Prior Fiscal Year Passengers Current Fiscal Year Passengers
0
4000
8000
12000
16000
1277312773
1363113631 1362813628 1356413564
12477124771206712067 1212412124
1181011810
1364613646
1260912609
1359313593
12950129501261312613
1356413564 1342713427
Year-to-Date Ridership Trends
Monthly Monitoring Report 11022017
Page 12Item 3b
2
Average Systemwide Daily Passengers
Weekday Saturday Sunday
Prior Fiscal Year Average Daily Passengers Current Fiscal Year Average Daily Passengers
0
3000
6000
9000
12000 11848118481161311613
73637363
67876787
6126612657395739
Productivity (paxhr) by Typology
1 L
ocal
Tru
nklin
e
2 L
ocal
Bas
ic
3 L
ocal
Con
nect
or
5 R
ural
8 R
ecre
atio
nal
9 D
eman
d R
espo
nse
Prior Fiscal Year Productivity Current Fiscal Year Productivity
00
80
160
240
320
278278 274274
174174 168168
9898 9797
7676 7676
304304
222222
2323 2222
Monthly StatisticsMONTH
September
1 Local Trunkline Routes 35 36 71X
2 Local Basic Routes 17 22 23 23X 29 49
3 Local Connector Routes 219 228 233 245 251 257
5 Rural Routes 61 68
8 Recreational Routes 6666F
9 Demand Response Local Paratransit Novato Dial-A-Ride Rural Dial-A-Ride
Route Typologies
Page 22Item 3b
3
Fixed-Route Passengers (incl Yellow Bus) by Month
July August September October November December January February March April May June
Prior Fiscal Year Passengers Current Fiscal Year Passengers
0
80000
160000
240000
320000
244439244439
271284271284
296637296637
276853276853
252829252829
238010238010
219681219681209705209705
277644277644
240773240773
284816284816
249351249351244200244200
260056260056
282441282441 282922282922
FISCAL YEAR
2018
Demand Response Passengers by Month
July August September October November December January February March April May June
Prior Fiscal Year Passengers Current Fiscal Year Passengers
0
4000
8000
12000
16000
1277312773
1363113631 1362813628 1356413564
12477124771206712067 1212412124
1181011810
1364613646
1260912609
1359313593
12950129501261312613
1356413564 13427134271373413734
Year-to-Date Ridership Trends
Monthly Monitoring Report 12082017
Page 12Item 3b
2
Average Systemwide Daily Passengers
Weekday Saturday Sunday
Prior Fiscal Year Average Daily Passengers Current Fiscal Year Average Daily Passengers
0
3000
6000
9000
120001125811258 1115111151
6043604364326432
4717471750675067
Productivity (paxhr) by Typology
1 L
ocal
Tru
nklin
e
2 L
ocal
Bas
ic
3 L
ocal
Con
nect
or
5 R
ural
8 R
ecre
atio
nal
9 D
eman
d R
espo
nse
Prior Fiscal Year Productivity Current Fiscal Year Productivity
00
70
140
210
280258258
270270
163163 161161
9696 9595
6363 7070
202202190190
2323 2121
Monthly StatisticsMONTH
October
1 Local Trunkline Routes 35 36 71X
2 Local Basic Routes 17 22 23 23X 29 49
3 Local Connector Routes 219 228 233 245 251 257
5 Rural Routes 61 68
8 Recreational Routes 6666F
9 Demand Response Local Paratransit Novato Dial-A-Ride Rural Dial-A-Ride
Route Typologies
Page 22Item 3b
3
- RFP - OampM for Fixed Route Service - Addendum 3 12-18-2017
- MV Fee Schedule
- Airporter Fee Schedule
- FY2017Performance
-
- System Performance Summary for FY 201617
-
- Fixed Route
- Yellow Bus
- Demand Response
- Other Services
-
- Performance Goals
- Ridership Trends
- FY 201718 Performance Outlook
-
- Attachment A Route Profiles
-
- Local Transit Bus Replacement Schedule
- August 2017 Monthly Monitoring Report
- September 2017 Monthly Monitoring Report
- October 2017 Monthly Monitoring Report
-
Addendum 3
7
A36 Yes Marin Transit would consider hybrid vehicle battery pack replacement as an Unforeseen Major Repair an assume the cost to refresh or replace the battery packs per Maintenance Responsibilities Section of the RFP Q37 Page 28 Section 3 Are the DPF filters considered a major component that Marin Transit will be responsible for covering the cost for A37 DPF filters are not considered a major component and Marin Transit will not be responsible for covering the costs for providing or replacing DPF filters Q38 Section 405d Auto Physical Damage ndash Transportation providers to maintain a higher deductible than the $50K for each loss noted in this section would Marin Transit modify this section to remove the deductible limitation A38 No The referenced draft contract language requires that ldquoDeductibles shall not exceed $50000 for each lossrdquo Q39 Section 405i Certified Copies of Policies ndash It typically takes insurance companies around 30 days after policy expiration before a new policy is issued As an alternative would Marin Transit please modify this section to state that the replacement policy or binder shall be furnished 5 days after expiration A39 Marin Transitrsquos primary concern is that there not be a gap in insurance coverage whether for new or replacement policies during the term of an awarded contract and will not modify this language beyond the expiration date of a policy Q40 Section 405j MCTD Purchase of Insurance ndash As an alternative to the current language would Marin Transit modify this section to provide that Marin Transitrsquos recourse for failure to comply with the insurance requirements be cancellation of the contract A40 No Marin Transit reserves to right terminate its contracts for convenience This provision ensures that insurance coverage is always in place Q41 Page 18 Draft Contract Item b Dedication to Project vs Page 11 Item 4 A) Summary of Key Personnel The language in these sections seems to conflict Please confirm it is acceptable to share key personnel with other projects as long as the percentage of time dedicated to this project is clearly identified A41 Personnel can be shared Of the key personnel the General Manager Operations Manager Maintenance Manager are to be full time positions and the Operations Manager and Maintenance Manager are to be located on-site Proposers must indicate if key personnel and non-key personnel (ie mechanics dispatchers road supervisors) will be shared on other projects and the percentage of time that will be
Addendum 3
8
dedicated to Marin Transit contract(s) Refer to Attachment I ndash Draft Operations and Maintenance Contract Article 2 ndash Personnel Requirements Sec 201 General Requirements for Contractor Personnel Dedication to Project Q42 Page 14 Item 13 Employee Training Please confirm whether CPR and First Aid training is a new requirement A42 No Proposers are being asked to present their initial training program for operators ldquoto Include any certifications and licensing to be included along with the initial training (CPR First Aid Class B etc)rdquo as referred to in the RFP Section 2 ndash Terms and Conditions Proposal Requirements Employee Training Q43 Page 28 Unforeseen Major Repairs Would Marin Transit identify a dollar amount such as $2000 for single maintenance items that would classify an item as an unforeseen major repair Marin Transit would be responsible for the cost of There are various parts on the fleet vehicles that exceed the cost of a transmission rebuild for example A43 No Q44 Page 8 Draft Contract b Facilities ii Would Marin Transit please remove this language from the RFP and Draft Contract Proposerrsquos are not able to require a landlord to consent to assignment of a property lease A44 No Proposerrsquos are encouraged to work closely with property managers agents or owners on how best to address this requirement Q45 Page 7 Radio Communications For package 2 services should bidders account for two-way radios vs push to talk devices due to the service area and poor cell phone reception A45 Package 1 and 2 proposers should provide a radio communication system that meets the service requirements outlined in the RFP Proposers are encouraged to obtain signal coverage area maps to include with their proposed systems that minimize or eliminate ldquodead spotsrdquo Q46 Draft Contract sect104E TermRenewal Options Please revise to require mutual agreement for any extension of the Agreement with pricing to be negotiated by the parties in order to allow for price adjustments to reflect changes in Contractorrsquos cost to operate the service A46 The RFP and contract address changes to Contractorrsquos cost to operate service though the two-tiered (variable hourly rate and monthly fixed cost) structure and the
Addendum 3
9
Possible Rate Adjustments contract provision (304f) The optional contract extension terms will not be made subject to renegotiation Q47 Draft Contract sect523 ndashAssignment Please delete ldquoAssignment provision extends to any purchase merger or consolidation change in control etcrdquo from the draft contract as a change in stockholders of a contractor shall not require consent or result in a default or termination of the Agreement A47 No This contract provision does not require consent for a change in a contractorrsquos stockholders but instead a change in contract assignment resulting from a change in stockholders Q48 Draft Contract sect408 ndashTermination ndash Would Marin Transit please consider modifying this requirement to provide a minimum of 60 daysrsquo notice of cancellation in order to provide the contractor with enough time to complete obligations required such as WARN Act lease terminations etc A48 No Marin Transit prefers the 30-day notice period Q49 Draft Contract sect406 ndash Indemnity Would Marin Transit please consider revising indemnification to limit the indemnity to actions or omissions of the Contractor or its employees agents subcontractors etc The Contractor should not be liable for items outside of its control A49 No Marin Transit is not considering a revision to the indemnification clause at this time Q50 General Draft Contract Would Marin Transit please add a force majeure provision to relieve both parties from performance under the Contract for circumstances beyond their reasonable control (acts of God war labor strikes or disputes terrorism etc) The contractor should be excused from performance under the contract for circumstances outside of its control A50 No See response for Q38 Q51 General Draft Contract Would Marin Transit include a provision that provides for price adjustments if Contractorrsquos revenue decreases or Contractorrsquos costs increase as a result of (i) changes to the scope of work service hours requested by the Authority (ii) changes in laws rules regulations etc applicable to the services to be provided by Contractor andor (iii) wage increases necessary for Contractor to be able to recruit and retain qualified employees as a result of an increase in the minimum wage in the County or surrounding jurisdictions If the parties are unable to agree on a rate adjustment then either party may terminate the contract upon 120 daysrsquo written notice to the other party Doing so would
Addendum 3
10
provide protection for the contractor to cover changes requested by the District or matters that were not contemplated at the time of Contractorrsquos proposal A51 No The RFP and contract address potential changes to scope of work changes in lawrulesregulations and requires proposers to consider wages and benefits to recruit and attract qualified employees without requiring contract price renegotiation
Attachments MV Transportation Fees and Payment Schedule (Revised November 20 2017)
Marin Airporter Fees and Payment Schedule (Revised November 20 2017) System Performance Summary for FY201617
August 2017 Monthly Monitoring Report September 2017 Monthly Monitoring Report October 2017 Monthly Monitoring Report Local Transit Bus Replacement Schedule
171801
EXHIBIT ldquoCrdquo
FEES AND PAYMENT SCHEDULE (revised)
Contractor shall bill Marin Transit monthly for service hours provided Additional hours shall only be used with approval from Marin Transit Proper back-up including TransTrack reports showing hours miles and fuel usage must be attached to invoices For Fiscal Year 1718 Contractor shall provide proof of wage increase (eg month over month payroll comparisons)
Service Cost per Service Hour
Contract Service Hours
Contract Maximum Obligation
Total year 1 January 30 2012 to December 31 2012 13881 $737832 Total year 2 January 1 2013 to December 31 2013 16686 $892890 Total year 3 January 1 2014 to December 31 2014 20913 $1297726 Total year 4 January 1 2015 to December 31 2015 27250 $1715566
Fixed Administrative Costs $277094 West Marin StagecoachMuir Woods Shuttle $3682 10750 $395815 Supplemental Service $6601 3750 $247538 Start-Up Costs $47571 First Half Year 5 January 1 2016 to June 30 2016 14500 $968018
Fixed Administrative Costs $975995 West Marin StagecoachMuir Woods Shuttle $4094 21500 $880210 Local Fixed Route $4094 14000 $573160 Supplemental Service $6814 7500 $511050 Fiscal Year 1617 July 1 2016 to June 30 2017 43000 $2940415
Fixed Administrative Costs1 $1137363 West Marin StagecoachMuir Woods Shuttle $4439 21500 $954455 Local Fixed Route $4439 14000 $621505 Supplemental Service $7018 7500 $526350 Fiscal Year 1718 July 1 2017 to June 30 2018 43000 $3239674
1 Includes the addition of one Road Supervisor position and one Level A Mechanic Contractor shall credit Marin Transit $5900 per month for the wage benefit and tax cost of the Level A Mechanic from July 1 2017 until the date of hire of this position
Item 10
404
asmith
Typewritten Text
MV Transportation
171830
EXHIBIT ldquoBrdquo
FEES AND PAYMENT SCHEDULE (revised)
Cost per Revenue Hour Community Shuttle Service
Base Years Option Years FY1314 FY1415 FY1516 FY1617 FY1718
Rate $7078 $6866 $7072 $7284 $7614 Maximum Revenue Hours 40000 40000 40000 60000 60000
In addition to payment of a cost per revenue hour District will directly reimburse Contractor for lease payments associated with storage of heavy duty transit buses beginning June 2016 Contractor must substantiate lease expense by providing District with a copy of the lease agreement In no event will lease payments exceed $1800 per month without written approval of District
Contractor to provide proof of wage increase (eg month over month payroll comparisons)
Item 11
410
asmith
Typewritten Text
Marin Airporter
asmith
Typewritten Text
asmith
Typewritten Text
1
System Performance Summary for FY 201617
This report summarizes the unaudited operational performance of Marin Transit local transit services for FY 201617 and compares these results to the Districtrsquos route level performance goals identified in the Short-Range Transit Plan The report provides a detailed route level assessment of all Marin Transit services operating in FY 201617 On June 12 2016 Marin Transit implemented a major service change with a 19 increase in local fixed-route service levels and a restructuring of routes throughout the County This FY 201617 report includes data from a full year of the new service plan There were a few additional changes to transit services during FY 201617 including the following In July 2016 the District launched a new general public dial-a-ride service between Point Reyes Station and Novato
The service provides curb-to-curb pick-up and drop-off and only operates on the second Monday of each month The closure of Hwy 1 in early 2017 delayed the start of the Muir Woods Shuttle season which typically begins in April
The Shuttle season began on May 13 resulting in 12 fewer days of service A number of recent changes to Marin Transitrsquos contracts and agreements have had an impact on the Districtrsquos financials These include the following The District completed a procurement for paratransit services in 2015 The new contract went into effect on January 1
2016 and provides significantly lower rates for paratransit and dial-a-ride services This report provides data from the first full year of the new contract
Effective February 1 2017 the District increased the subsidy paid to Catch-A-Ride service providers for operating wheelchair accessible vehicles to further incentivize the availability of accessible vehicles for Catch-A-Ride trips
For FY 201617 Marin Transit updated the methodology for calculating revenue hours for demand response services to be more consistent with the National Transit Database definitions These include local paratransit and the Novato Dial-A-Ride This change has reduced the amount of time that is considered as part of revenue hours Overall Marin Transit provided over 32 million unlinked passenger trips in FY 201617 with over 235000 revenue hours of service Compared to FY 201516 these numbers represent a decrease in unlinked passenger trips (-35) and an increase in revenue hours (+82) Growth in service was primarily on local fixed-route services due to the June 2016 changes Some of this growth was partially offset by decreases in hours on local paratransit and Route 122 The system-wide productivity rate was 136 riders per hour about 108 lower than FY 201617 Passenger revenues increased slightly (+06) Due to higher operating costs passenger subsidy increased by 127 to a system-wide average of $678 per passenger Fixed Route Fixed Route operations carried over 29 million unlinked passenger trips in FY 201617 with 178052 revenue hours These totals represent 91 of the Districtrsquos total trips and 76 of revenue hours Compared to FY 201516 unlinked passenger trips on fixed route services decreased by 35 and revenue hours increased by 136 Overall productivity was 164 passengers per hour approximately 150 lower than the 193 mark last fiscal year Compared to FY 201516 almost all fixed-route typologies experienced a decrease in overall ridership These include Local Basic (-120) Local Connector (-127) Supplemental (-32) and Partnership (-25) However some services experienced a modest increase in ridership compared to last year including Local Trunkline (+77) the Muir Woods Shuttle (+44) and Rural (+48)
2
Total passenger revenue decreased slightly (-11) in FY 201617 compared to last year Increases in operating costs resulted in a decrease in overall farebox recovery from 199 last year to 176 in FY 201617 Only the Local Trunkline and Recreational (Muir Woods Shuttle) typologies experienced an overall increase in both passenger revenue and farebox recovery Yellow Bus In FY 201617 yellow bus service for the Ross Valley School District carried over 136000 unlinked passenger trips a decrease of 13 compared to last year and operated 1245 revenue hours These totals represent 4 of the Districtrsquos total ridership and 1 of revenue hours Passenger revenues increased 150 due to higher pass prices This boost in revenues did not keep pace with the rise in operating costs and overall farebox recovery decreased from 571 last year to 548 in FY 201617 Demand Response Demand Response programs carried 124325 unlinked passenger trips in FY 201617 and provided 55191 revenue hours of service These totals represent 4 of the Districtrsquos total trips and 24 of revenue hours Compared to FY 201516 unlinked passenger trips on demand response services decreased by 39 (-5096 trips) and revenue hours decreased by 61 The more significant reduction in revenue hours compared to passengers is likely due to the new method for calculating those hours Overall productivity was 23 passengers per hour slightly higher than last fiscal year Ridership on local paratransit and the Novato Dial-A-Ride decreased in FY 201617 compared to the prior year Rural Dial-A-Ride experienced growth in ridership mainly because these services were only recently introduced These include the Dillon BeachTomales and Point Reyes Station Dial-A-Ride Passenger revenues for demand response services dropped slightly (-15) compared to last year However lower operating costs due to the new contract rate resulted in reductions in subsidies and an increase in farebox recovery Other Services Other Marin Access Mobility Management services include the Volunteer Driver and Catch-A-Ride programs In FY 201617 these programs provided 30547 unlinked passenger trips about 1 of the Districtrsquos total trips Compared to the prior fiscal year ridership decreased by 77 mostly due to the Catch-A-Ride program However passenger revenues increased by 90 primarily on the Catch-A-Ride program This increase may have been due to riders taking longer trips Performance Goals
The 2016-2025 Short-Range Transit Plan identifies fifteen different goals and associated metrics that staff use to evaluate system performance Performance goals at the route level are measured in both productivity (unlinked passengers per hour and per trip) and cost effectiveness (subsidy per unlinked passenger trip) These measures follow the service typologies updated in the most recent Short Range Transit Plan Table 1 below summarizes route level performance goals by typology Marin Transit has not identified productivity or cost-effectiveness goals for the Yellow Bus or Partnership service typologies Table 2 provides a detailed summary of annual FY 201617 performance data by program route and service typology
3
Table 1 Productivity and Subsidy Goals by Service Typology
Service Typology Routes Unlinked Passenger
Trips per Hour (at or above)
Subsidy per Passenger Trip
(at or below)
Local Trunkline 35 36 71X 25 $300
Regular Local 17 22 23 23X 29 49 20 $500
Local Connector 219 228 233 245 251 257 8 $800
Supplemental 113 115 117 119 125 139 145 151 154 20 per trip $300
Rural 61 68 4 $1200
Recreational 66 (Muir Woods Shuttle) 25 $300
Demand Response Local DAR Novato DAR Dillon BeachTomales DAR Point Reyes DAR
2 $3000
Using the productivity goals identified in Table 1 all the service typology groups except for Local Basic met their unlinked passengers per hour goal overall Twelve individual routes and two demand response services did not meet their productivity targets These include Routes 17 22 23 23X 29 49 71X 115 125 139 219 228 the Dillon BeachTomales Dial-A-Ride and the Point Reyes Dial-A-Ride In the previous fiscal year ten routes did not meet this target Figure 1 provides FY 201617 productivity levels and respective productivity goals by service typology and at the route level Route 35 was the most productive fixed-route service carrying an average of 286 passengers per hour Route 151 (Hamilton ndash San Jose MS ndash Novato HS - San Marin HS) was the best performing supplemental school route with 428 passengers per trip and met its subsidy target at $150 per passenger Route 228 had the highest growth in productivity (+291) due to the addition of weekday service in June 2016 In terms of cost effectiveness the Supplemental School Rural and Recreational services collectively met their goals In total 17 individual routes and two demand response services did not meet their subsidy target (Routes 17 22 23 23X 29 35 36 49 71X 219 228 233 251 257 115 125 139 Local Paratransit and Novato Dial-A-Ride) This is an increase from the 13 routes and three demand response services reported for FY 201516 Figure 2 provides a breakdown of FY 201617 subsidy levels and respective subsidy goals by service typology and at the individual route level Ridership Trends
In FY 201617 there was an overall 35 decline in fixed-route ridership compared to the previous year despite increases to service levels One of the major contributors to this decline was the delayed start of the 2017 Muir Woods Shuttle season that reduced the amount of service provided by 76 The overall decrease in ridership is relatively consistent with trends among bus operators nationwide and in the Bay Area According to the National Transit Database bus ridership declined 66 nationwide during FY 201617 compared to the prior year Within in the Bay Area peer agencies experienced ridership declines between 6 and 12 These include Golden Gate Transit Sonoma County Transit SamTrans and Napa VINE One of the biggest external factors that may have contributed to this trend is weather Rainfall in FY 201617 almost doubled over the prior year Weather can have a significant impact on travel decisions affecting whether a person makes a trip as well as how that person ultimately makes the trip It can also impact operations and cause detours major delays and canceled trips
4
In FY 201617 there was a 34 increase in the number of canceled trips Almost half of these canceled trips occurred in February due to heavy rains that caused flooding and school closures In June 2016 Marin Transit implemented a major service change One of the main goals of the service restructuring was to reduce the need to transfer by providing faster and more direct connections While this approach improves the system for riders it has implications in terms of how ridership is counted and on performance metrics The number of passengers is measured in terms of unlinked passenger trips Each time a person boards a bus is counted as a separate trip regardless of whether that person is transferring from another bus Reducing the amount of transfers needed to complete a riderrsquos journey reduces the number of unlinked trips Replacing trips that require a transfer with direct trips to destinations does not change the number of individual riders using the system which is defined as linked passenger trips In FY 201617 there was a 75 overall decrease in the number of transfers for passengers using cash to pay their original fare Some of this decline reflects the systemwide decrease in ridership The transfer ratio is defined as the number of boarding trips (unlinked passenger trips) divided by the number of originating trips (linked passenger trips) This ratio can be used to evaluate the impact of transfers on ridership independent of other factors In FY 201617 the overall transfer ratio dropped 38 from 136 to 131 When estimating linked passenger trips based on these ratios the number of individual Marin Transit passengers in FY 201617 remained relatively constant compared to last year Demand for Marin Access mobility management programs declined overall 47 from FY 201516 to FY 201617 Changes in ridership varied from program to program The largest decline was on Catch-A-Ride which experienced a 129 decrease in ridership Local paratransit and Novato Dial-A-Ride ridership may have been affected by many of the same external factors as fixed route transit particularly weather It is also possible that paratransit clients have started to shift some or all their trips to services that are not provided by Marin Transit These may include Non-Emergency Medical Transportation services arranged by managed care organizations Private transportation
providers hired under contract to institutions typically served by paratransit (such as adult day care centers) Trips taken on Uber or Lyft and Volunteer transportation services that may be supported by Marin Transit in some way but whose ridership is not
reported in the Districtrsquos performance statistics Furthermore staff attributed much of the previous growth in the Marin Access program to the Catch-A-Ride program This program experienced a 473 increase in ridership between FY 201314 and FY 201415 Towards the end of FY 201415 On the Move one of the largest taxi companies in Marin went out of business To this day service is limited during hours of peak demand and in certain service areas especially Novato Therefore FY 201617 ridership on Catch-A-Ride may reflect two factors These include a slowdown in attracting new customers and a reduction in service availability following On the Moversquos closure Table 2 summarizes the factors that can influence ridership numbers year-over-year and qualitatively evaluates their impact
5
Table 2 Factors Impacting Ridership Comparison
Factor FY 201516 FY 201617 Impact
Calendar
School Days 181 183 --
Weekdays 256 253
Weekends amp Holidays 110 111 --
Muir Woods Shuttle 113 104
Transfer Ratio (ratio of unlinked to linked trips) 136 131
Service Disruptions Canceled service (trips) 200 268
Major detourclosure (days) (1) 18 29
Rainfall (inches) 2928 5653
Gas Prices $298 $291 --
Unemployment Rate 32 32 -- Notes (1) Data on major detours and closure collected starting January 2016 Comparison includes the months of January through June FY 201718 Performance Outlook
In June 2016 Marin Transit implemented a major service change aimed in part to help underperforming routes meet established performance standards Staff has continued to monitor service performance and has made minor adjustments to improve on-time performance and cancel low-ridership trips In early 2018 staff is planning a comprehensive assessment of service performance since the June 2016 service changes This effort will include data from a recently completed onboard survey from April 2017 on passenger origins and destinations and a 100 passenger ridecheck The ridecheck will provide data on stop-level ridership activity for each route The assessment will use this analysis to recommend service changes to improve underperforming routes There are several unknowns that may also affect route performance primarily in terms of operating costs The District relies on its contractors to either lease or own property to store and maintain the vehicles needed to operate service For contractors that do not own suitable property finding and leasing these types of facilities in Marin County is challenging and expensive Recent surveys of current and potential service providers identified securing a facility as the most significant factor in determining their interest in bidding on Marin Transit services ability to provide the service and proposed pricing Marin Transit has been actively working to secure and develop its own operations and maintenance facility A District-owned facility will eliminate the need for potential service providers to lease property and lower operating costs It may also improve efficiency by reducing deadhead or non-revenue time when vehicles are traveling to and from the yard and further lower the Districtrsquos contract rates In late 2017 Marin Transit will release for bid over half of its fixed-route service and there are many uncertainties that may affect the outcome The tight labor market in Marin County and the greater Bay Area has made it difficult for service providers to hire and retain employees Potential contractors are required to secure property in a County with limited real estate opportunities If the District provides its own facility there will be more interest among potential bidders and more competitive rates
6
Table 3 System-wide Performance Statistics FY 201617 (unaudited)
Route Passengers Revenue
Hours Operating
Costs Passenger
Revenue Pass Trips Per
Rev Hr (Trip) Subsidy Per
Passenger Farebox
Recovery Fixed Route 2925522 178052 $20173419 $3550259 164 $568 176 Local Trunkline 1122188 44393 $6252940 $1263870 253 $445 202
35 658869 23052 $3234308 $729775 286 $380 226 36 342178 13636 $1901678 $369132 251 $448 194
71X 121141 7705 $1116954 $164963 157 $786 148 Local Basic 989500 65117 $7451946 $1221298 152 $630 164
17 247998 14757 $2076786 $319761 168 $708 154 22 215758 17553 $1619319 $273059 123 $624 169 23 199150 11065 $1508659 $246908 180 $634 164
23X 49255 3445 $473413 $57438 143 $845 121 29 40103 3707 $509475 $49634 108 $1147 97 49 237236 14590 $1264294 $274498 163 $417 217
Local Connector 378985 42396 $3873801 $461426 89 $900 119 219 50449 6392 $591224 $64101 79 $1045 108 228 71340 10042 $904806 $103912 71 $1123 115 233 42798 4363 $399203 $52001 98 $811 130 245 49766 4349 $391596 $56968 114 $672 145 251 95506 9607 $889019 $101823 99 $824 115 257 69126 7643 $697953 $82621 90 $890 118
Supplemental 179947 3963 $514380 $110503 454 (286) $224 215 113 16829 317 $42180 $12227 530 (315) $178 290 115 14021 637 $87534 $9504 220 (185) $557 109 117 34820 640 $81509 $17140 544 (284) $185 210 119 27161 374 $56273 $18859 727 (313) $138 335 125 13757 600 $72469 $11570 229 (193) $443 160 139 6414 253 $33182 $6635 253 (179) $414 200 145 16406 191 $25426 $7258 861 (372) $111 285 151 36801 594 $73842 $18463 620 (428) $150 250 154 13738 358 $41965 $8847 384 (255) $241 211
Recreational 122116 4316 $473726 $249748 283 $183 527 66 122116 4316 $473726 $249748 283 $183 527
Rural 112926 16172 $1422683 $122407 70 $1151 86 61 36328 5492 $475778 $39959 66 $1200 84 68 76598 10680 $946905 $82448 72 $1129 87
Partnership 19860 1696 $183943 $121007 117 $317 658 122 19860 1696 $183943 $121007 117 $317 658
Yellow Bus 136500 1245 $863348 $473066 1096 (448) $286 548 Hidden Valley 9281 180 $124763 $32170 516 (265) $998 258
White Hill 127219 1065 $738585 $440896 1194 (471) $234 597 Demand Response 124325 55191 $4571296 $236980 23 $3486 52
Local Paratransit 119673 53011 $4404928 $226387 23 $3492 51 Novato DAR 4057 1856 $150815 $8815 22 $3487 58
Dillon Beach DAR 488 260 $12511 $1356 19 $2285 108 Pt Reyes DAR 107 64 $3042 $422 17 $2447 139
Other Services 30547 - $511316 $41956 - $1537 82 Volunteer Driver(1) 16162 - $152714 - - $945 -
Catch-A-Ride(1) 14385 - $358602 $41956 - $2201 117 Total 3216894 234489 $26118572 $4302085 136 $678 165
Notes Values in red indicate performance that does not meet District
7
Figure 1 FY 201617 Passengers per Revenue Hour by Route
0
5
10
15
20
25
30
35
40
45
50Lo
cal T
runk
line T
otals 35 36 71
X
Loca
l Bas
ic To
tals 17 22 23 23X 29 49
Loca
l Con
necto
r Tot
als 219
228
233
245
251
257
Supp
lemen
tal T
otals 11
311
511
711
912
513
914
515
115
4
Recre
ation
al To
tals 66
Rura
l Tot
als 61 68
Dem
and R
espo
nse T
otals
Loca
l Par
atra
nsit
Nova
to D
ARDi
llon D
ARPt
Reye
s DAR
Pass
enge
rs p
er R
even
ue H
our
meets goalservice standard
does not meet goal
school routes show passengers per trip
8
Figure 2 FY 201617 Subsidy per Passenger by Route
$0
$5
$10
$15
$20
$25
$30
$35
$40
Loca
l Tru
nklin
e Tot
als 35 36 71X
Loca
l Bas
ic To
tals 17 22 23 23X 29 49
Loca
l Con
necto
r Tot
als 219
228
233
245
251
257
Supp
lemen
tal T
otals 11
311
511
711
912
513
914
515
115
4
Recre
ation
al To
tals 66
Rura
l Tot
als 61 68
Dem
and R
espo
nse T
otals
Loca
l Par
atra
nsit
Nova
to D
ARDi
llon D
ARPt
Reye
s DAR
Subs
idy p
er P
asse
nger
does not meet goal
service standard
meets goal
9
Attachment A Route Profiles 17 Sausalito ndash Marin City ndash Mill Valley ndash San Rafael 22 San Rafael Transit Center ndash San Anselmo ndash Marin City 23 Fairfax ndash San Anselmo ndash San Rafael ndash Canal 23X Manor ndash Fairfax ndash San Anselmo ndash San Rafael ndash Canal 29 Canal ndash San Rafael Transit Center ndash Larkspur ndash College of Marin ndash Marin General 35 Canal ndash San Rafael Transit Center ndash Marin Civic Center ndash Northgate Mall ndash Novato 36 Canal ndash San Rafael Transit Center ndash Marin City 49 Novato ndash Ignacio ndash Hamilton ndash Marin Civic Center ndash San Rafael Transit Center 61 West Marin Stagecoach (Sausalito ndash Marin City ndash Mill Valley ndash Stinson Beach ndash Bolinas) 66 Muir Woods Shuttle 68 West Marin Stagecoach (San Rafael Transit Center ndash San Anselmo ndash Pt Reyes Station ndash Inverness) 71X Novato ndash San Rafael Transit Center ndash Marin City ndash Sausalito 113 Redwood High School ndash Paradise Cay 115 Sausalito ndash Willow Creek ndash Marin City ndash Mill Valley ndash St Hilary 117 Neil Cummins Hall Middle School ndash E Corte Madera ndash Cove School 119 Tiburon ndash Belvedere ndash Redwood High School 122 San Rafael Transit Center ndash San Anselmo ndash College of Marin 125 Lagunitas ndash Sir Francis Drake HS ndash San Anselmo ndash San Rafael 139 Terra Linda High School ndash Lucas Valley 145 Terra Linda High School ndash San Rafael 151 Hamilton ndash Ignacio ndash San Jose Middle School ndash Novato High School ndash San Marin High School 154 Olive ndash San Marin High School ndash Sinaloa Middle School ndash Novato 219 Tiburon ndash Strawberry 228 San Rafael Transit Center ndash Larkspur ndash San Anselmo ndash Fairfax 233 Santa Venetia ndash Marin Civic Center ndash San Rafael Transit Center 245 San Rafael Transit Center ndash Northgate Mall ndash Kaiser ndash Smith Ranch Road 251 San Marin ndash Novato ndash Vintage Oaks ndash IVC ndash Ignacio ndash Hamilton 257 San Rafael ndash Northgate Mall ndash Kaiser ndash Marinwood ndash Hamilton ndash Ignacio ndash IVC Hdn Valley Ross Valley Yellow Bus (Fairfax ndash San Anselmo ndash Hidden Valley ES) White Hill Ross Valley Yellow Bus (San Anselmo ndash Sleepy Hollow ndash Fairfax ndash White Hill MS)
17Local Basic
Days of Service Wkdy Sa SuAvg Freq (Wkdy Peak) 30 min
Avg Freq (Wkdy Non-Peak) 60 minAvg Freq (Wked) 60 min
FY 2017 Farebox Recovery 15 transfer (to route) 25
Clipper usage 16
Annual Avg Monthly Avg Daily Annual Avg Monthly Avg Daily Annual Avg Monthly Avg DailyWeekday 194263 16189 768 11496 958 45 177386 14782 701 Saturday 27564 2297 530 1541 128 30 24621 2052 473 Sunday 26171 2181 436 1720 143 29 27378 2282 456
Total 247998 20667 679 14757 1230 40 229385 19115 628
Annual Avg Monthly Avg Daily Annual Avg Monthly Avg Daily Annual Avg Monthly Avg DailyWeekday $1617108 $134759 $6392 $247041 $20587 $976 $1370067 $114172 $5415Saturday $217536 $18128 $4183 $36894 $3075 $710 $180642 $15054 $3474Sunday $242142 $20179 $4036 $35826 $2986 $597 $206316 $17193 $3439
Total $2076786 $173066 $5690 $319761 $26647 $876 $1757025 $146419 $4814
Passengers per Revenue Hour
Subsidy per Passenger
Cost per Revenue Hour
Farebox Recovery
Weekday 169 $705 $14067 153Saturday 179 $655 $14117 170Sunday 152 $788 $14078 148
Total 168 $708 $14073 154
Passengers Revenue Hours Operating CostsPassenger
RevenueOperating Subsidy
Passengers per Revenue Hour
Subsidy per Passenger
Cost per Revenue Hour
Farebox Recovery
FY 2015 301136 15167 $2108822 $340410 $1768412 199 $587 $13904 161FY 2016 280486 15330 $2041616 $302337 $1739279 183 $620 $13317 148FY 2017 247998 14757 $2076786 $319761 $1757025 168 $708 $14073 154
Histo
ric Tr
ends
FY 20
161
7 DAT
A
Passengers Revenue Hours Revenue Miles
Operating Costs Passenger Revenue Operating Subsidy
277892 322826
301136 280486
247998
0
50000
100000
150000
200000
250000
300000
350000
FY 2013 FY 2014 FY 2015 FY 2016 FY 2017
Passengers
12402 14818 15167 15330 14757
0
5000
10000
15000
20000
FY 2013 FY 2014 FY 2015 FY 2016 FY 2017
Revenue Hours
$1717002
$2179526 $2108822 $2041616 $2076786
$0
$500000
$1000000
$1500000
$2000000
$2500000
FY 2013 FY 2014 FY 2015 FY 2016 FY 2017
Operating Costs
224 218 199 183 168
00
50
100
150
200
250
300
FY 2013 FY 2014 FY 2015 FY 2016 FY 2017
Passengers per Revenue Hour
$504 $558 $587 $620 $708
$000$200$400$600$800
$1000$1200$1400
FY 2013 FY 2014 FY 2015 FY 2016 FY 2017
Subsidy per Passenger
$13845 $14709 $13904 $13317 $14073
$0
$50
$100
$150
$200
FY 2013 FY 2014 FY 2015 FY 2016 FY 2017
Cost per Revenue Hour
22Local Basic
Days of Service Wkdy Sa SuAvg Freq (Wkdy Peak) 30 min
Avg Freq (Wkdy Non-Peak) 60 minAvg Freq (Wked) 60 min
FY 2017 Farebox Recovery 17 transfer (to route) 10
Clipper usage 11
Annual Avg Monthly Avg Daily Annual Avg Monthly Avg Daily Annual Avg Monthly Avg DailyWeekday 184918 15410 731 14244 1187 56 126319 10527 499 Saturday 16752 1396 322 1537 128 30 16232 1353 312 Sunday 14088 1174 235 1773 148 30 18729 1561 312
Total 215758 17980 591 17553 1463 48 161280 13440 442
Annual Avg Monthly Avg Daily Annual Avg Monthly Avg Daily Annual Avg Monthly Avg DailyWeekday $1312992 $109416 $5190 $232926 $19411 $921 $1080066 $90006 $4269Saturday $142334 $11861 $2737 $21235 $1770 $408 $121099 $10092 $2329Sunday $163993 $13666 $2733 $18898 $1575 $315 $145095 $12091 $2418
Total $1619319 $134943 $4436 $273059 $22755 $748 $1346260 $112188 $3688
Passengers per Revenue Hour
Subsidy per Passenger
Cost per Revenue Hour
Farebox Recovery
Weekday 130 $584 $9218 177Saturday 109 $723 $9263 149Sunday 79 $1030 $9251 115
Total 123 $624 $9225 169
Passengers Revenue Hours Operating CostsPassenger
RevenueOperating Subsidy
Passengers per Revenue Hour
Subsidy per Passenger
Cost per Revenue Hour
Farebox Recovery
FY 2015 249148 14777 $2054433 $292215 $1762218 169 $707 $13903 142FY 2016 243635 14872 $1971172 $259453 $1711719 164 $703 $13255 132FY 2017 215758 17553 $1619319 $273059 $1346260 123 $624 $9225 169
Histo
ric Tr
ends
FY 20
161
7 DAT
A
Passengers Revenue Hours Revenue Miles
Operating Costs Passenger Revenue Operating Subsidy
366301
281761 249148 243635
215758
050000
100000150000200000250000300000350000400000
FY 2013 FY 2014 FY 2015 FY 2016 FY 2017
Passengers18061
15083 14777 14872 17553
0
5000
10000
15000
20000
FY 2013 FY 2014 FY 2015 FY 2016 FY 2017
Revenue Hours$2498169
$2220145 $2054433 $1971172
$1619319
$0
$500000
$1000000
$1500000
$2000000
$2500000
$3000000
FY 2013 FY 2014 FY 2015 FY 2016 FY 2017
Operating Costs
203 187 169 164
123
00
50
100
150
200
250
300
FY 2013 FY 2014 FY 2015 FY 2016 FY 2017
Passengers per Revenue Hour
$567 $667 $707 $703 $624
$000$200$400$600$800
$1000$1200$1400
FY 2013 FY 2014 FY 2015 FY 2016 FY 2017
Subsidy per Passenger
$13832 $14720 $13903 $13255
$9225
$0
$50
$100
$150
$200
FY 2013 FY 2014 FY 2015 FY 2016 FY 2017
Cost per Revenue Hour
23Local Basic
Days of Service Wkdy Sa SuAvg Freq (Wkdy Peak) 60 min
Avg Freq (Wkdy Non-Peak) 60 minAvg Freq (Wked) 60 min
FY 2017 Farebox Recovery 16 transfer (to route) 24
Clipper usage 12
Annual Avg Monthly Avg Daily Annual Avg Monthly Avg Daily Annual Avg Monthly Avg DailyWeekday 145707 12142 576 8042 670 32 64277 5356 254 Saturday 28305 2359 544 1434 120 28 11466 956 221 Sunday 25138 2095 419 1589 132 26 12750 1062 212
Total 199150 16596 546 11065 922 30 88492 7374 242
Annual Avg Monthly Avg Daily Annual Avg Monthly Avg Daily Annual Avg Monthly Avg DailyWeekday $1096892 $91408 $4336 $179427 $14952 $709 $917465 $76455 $3626Saturday $195468 $16289 $3759 $35226 $2936 $677 $160242 $13354 $3082Sunday $216299 $18025 $3605 $32255 $2688 $538 $184044 $15337 $3067
Total $1508659 $125722 $4133 $246908 $20576 $676 $1261751 $105146 $3457
Passengers per Revenue Hour
Subsidy per Passenger
Cost per Revenue Hour
Farebox Recovery
Weekday 181 $630 $13640 164Saturday 197 $566 $13629 180Sunday 158 $732 $13612 149
Total 180 $634 $13635 164
Passengers Revenue Hours Operating CostsPassenger
RevenueOperating Subsidy
Passengers per Revenue Hour
Subsidy per Passenger
Cost per Revenue Hour
Farebox Recovery
FY 2015 354706 14168 $1969650 $381111 $1588539 250 $448 $13902 193FY 2016 268218 13154 $1703216 $308138 $1395078 204 $520 $12948 181FY 2017 199150 11065 $1508659 $246908 $1261751 180 $634 $13635 164
Histo
ric Tr
ends
FY 20
161
7 DAT
A
Passengers Revenue Hours Revenue Miles
Operating Costs Passenger Revenue Operating Subsidy
212064
339118 354706
268218
199150
050000
100000150000200000250000300000350000400000
FY 2013 FY 2014 FY 2015 FY 2016 FY 2017
Passengers
8716
14034 14168 13154
11065
02000400060008000
10000120001400016000
FY 2013 FY 2014 FY 2015 FY 2016 FY 2017
Revenue Hours
$1202564
$2061985 $1969650 $1703216
$1508659
$0
$500000
$1000000
$1500000
$2000000
$2500000
FY 2013 FY 2014 FY 2015 FY 2016 FY 2017
Operating Costs
243 242 250
204 180
00
50
100
150
200
250
300
FY 2013 FY 2014 FY 2015 FY 2016 FY 2017
Passengers per Revenue Hour
$455 $494 $448 $520 $634
$000$200$400$600$800
$1000$1200$1400
FY 2013 FY 2014 FY 2015 FY 2016 FY 2017
Subsidy per Passenger
$13797 $14692 $13902 $12948 $13635
$0
$50
$100
$150
$200
FY 2013 FY 2014 FY 2015 FY 2016 FY 2017
Cost per Revenue Hour
23XLocal Basic
Days of Service WkdyAvg Freq (Wkdy Peak) 60 min
Avg Freq (Wkdy Non-Peak) -Avg Freq (Wked) -
FY 2017 Farebox Recovery 12 transfer (to route) 31
Clipper usage 12
Annual Avg Monthly Avg Daily Annual Avg Monthly Avg Daily Annual Avg Monthly Avg DailyWeekday 49255 4105 195 3445 287 14 32408 2701 128 Saturday - - - - - - - - - Sunday - - - - - - - - -
Total 49255 4105 195 3445 287 14 32408 2701 128
Annual Avg Monthly Avg Daily Annual Avg Monthly Avg Daily Annual Avg Monthly Avg DailyWeekday $473413 $39451 $1871 $57438 $4787 $227 $415975 $34665 $1644Saturday $ - $ - $ - $ - $ - $ - $ - $ - $ -Sunday $ - $ - $ - $ - $ - $ - $ - $ - $ -
Total $473413 $39451 $1871 $57438 $4787 $227 $415975 $34665 $1644
Passengers per Revenue Hour
Subsidy per Passenger
Cost per Revenue Hour
Farebox Recovery
Weekday 143 $845 $13744 121Saturday - $ - $ - - Sunday - $ - $ - -
Total 143 $845 $13744 121
Passengers Revenue Hours Operating CostsPassenger
RevenueOperating Subsidy
Passengers per Revenue Hour
Subsidy per Passenger
Cost per Revenue Hour
Farebox Recovery
FY 2015FY 2016 2548 189 $23303 $2272 $21031 135 $825 $12330 97FY 2017 49255 3445 $473413 $57438 $415975 143 $845 $13744 121
Histo
ric Tr
ends
FY 20
161
7 DAT
A
Passengers Revenue Hours Revenue Miles
Operating Costs Passenger Revenue Operating Subsidy
2548
49255
0
10000
20000
30000
40000
50000
60000
FY 2013 FY 2014 FY 2015 FY 2016 FY 2017
Passengers
189
3445
0500
1000150020002500300035004000
FY 2013 FY 2014 FY 2015 FY 2016 FY 2017
Revenue Hours
$23303
$473413
$0
$100000
$200000
$300000
$400000
$500000
FY 2013 FY 2014 FY 2015 FY 2016 FY 2017
Operating Costs
135 143
00
50
100
150
200
250
300
FY 2013 FY 2014 FY 2015 FY 2016 FY 2017
Passengers per Revenue Hour
$825 $845
$000$200$400$600$800
$1000$1200$1400
FY 2013 FY 2014 FY 2015 FY 2016 FY 2017
Subsidy per Passenger
$12330 $13744
$0
$50
$100
$150
$200
FY 2013 FY 2014 FY 2015 FY 2016 FY 2017
Cost per Revenue Hour
29Local Basic
Days of Service WkdyAvg Freq (Wkdy Peak) 60 min
Avg Freq (Wkdy Non-Peak) -Avg Freq (Wked) -
FY 2017 Farebox Recovery 10 transfer (to route) 26
Clipper usage 12
Annual Avg Monthly Avg Daily Annual Avg Monthly Avg Daily Annual Avg Monthly Avg DailyWeekday 40103 3342 159 3707 309 15 37048 3087 146 Saturday - - - - - - - - - Sunday - - - - - - - - -
Total 40103 3342 159 3707 309 15 37048 3087 146
Annual Avg Monthly Avg Daily Annual Avg Monthly Avg Daily Annual Avg Monthly Avg DailyWeekday $509475 $42456 $2014 $49634 $4136 $196 $459841 $38320 $1818Saturday $ - $ - $ - $ - $ - $ - $ - $ - $ -Sunday $ - $ - $ - $ - $ - $ - $ - $ - $ -
Total $509475 $42456 $2014 $49634 $4136 $196 $459841 $38320 $1818
Passengers per Revenue Hour
Subsidy per Passenger
Cost per Revenue Hour
Farebox Recovery
Weekday 108 $1147 $13745 97Saturday - $ - $ - - Sunday - $ - $ - -
Total 108 $1147 $13745 97
Passengers Revenue Hours Operating CostsPassenger
RevenueOperating Subsidy
Passengers per Revenue Hour
Subsidy per Passenger
Cost per Revenue Hour
Farebox Recovery
FY 2015 203632 10795 $1500887 $232286 $1268601 189 $623 $13904 155FY 2016 181786 10502 $1378760 $219997 $1158763 173 $637 $13129 160FY 2017 40103 3707 $509475 $49634 $459841 108 $1147 $13745 97
Histo
ric Tr
ends
FY 20
161
7 DAT
A
Passengers Revenue Hours Revenue Miles
Operating Costs Passenger Revenue Operating Subsidy
238310 225998 203632
181786
40103
0
50000
100000
150000
200000
250000
300000
FY 2013 FY 2014 FY 2015 FY 2016 FY 2017
Passengers12248
10927 10795 10502
3707
0
2000
4000
6000
8000
10000
12000
14000
FY 2013 FY 2014 FY 2015 FY 2016 FY 2017
Revenue Hours$1692980 $1607795 $1500887
$1378760
$509475
$0
$500000
$1000000
$1500000
$2000000
FY 2013 FY 2014 FY 2015 FY 2016 FY 2017
Operating Costs
195 207 189 173
108
00
50
100
150
200
250
300
FY 2013 FY 2014 FY 2015 FY 2016 FY 2017
Passengers per Revenue Hour
$595 $593 $623 $637
$1147
$000$200$400$600$800
$1000$1200$1400
FY 2013 FY 2014 FY 2015 FY 2016 FY 2017
Subsidy per Passenger
$13822 $14714 $13904 $13129 $13745
$0
$50
$100
$150
$200
FY 2013 FY 2014 FY 2015 FY 2016 FY 2017
Cost per Revenue Hour
35Local Trunkline
Days of Service Wkdy Sa SuAvg Freq (Wkdy Peak) 30 min
Avg Freq (Wkdy Non-Peak) 30 minAvg Freq (Wked) 30 min
FY 2017 Farebox Recovery 23 transfer (to route) 17
Clipper usage 8
Annual Avg Monthly Avg Daily Annual Avg Monthly Avg Daily Annual Avg Monthly Avg DailyWeekday 492328 41027 1946 16909 1409 67 224421 18702 887 Saturday 84453 7038 1624 2860 238 55 43336 3611 833 Sunday 82088 6841 1368 3284 274 55 50021 4168 834
Total 658869 54906 1805 23052 1921 63 317778 26482 871
Annual Avg Monthly Avg Daily Annual Avg Monthly Avg Daily Annual Avg Monthly Avg DailyWeekday $2367217 $197268 $9357 $533190 $44433 $2107 $1834027 $152836 $7249Saturday $403729 $33644 $7764 $97853 $8154 $1882 $305876 $25490 $5882Sunday $463362 $38614 $7723 $98732 $8228 $1646 $364630 $30386 $6077
Total $3234308 $269526 $8861 $729775 $60815 $1999 $2504533 $208711 $6862
Passengers per Revenue Hour
Subsidy per Passenger
Cost per Revenue Hour
Farebox Recovery
Weekday 291 $373 $14000 225Saturday 295 $362 $14118 242Sunday 250 $444 $14111 213
Total 286 $380 $14030 226
Passengers Revenue Hours Operating CostsPassenger
RevenueOperating Subsidy
Passengers per Revenue Hour
Subsidy per Passenger
Cost per Revenue Hour
Farebox Recovery
FY 2015 476489 8544 $1187694 $462204 $725490 558 $152 $13901 389FY 2016 472718 9300 $1202986 $544109 $658877 508 $139 $12935 452FY 2017 658869 23052 $3234308 $729775 $2504533 286 $380 $14030 226
Histo
ric Tr
ends
FY 20
161
7 DAT
A
Passengers Revenue Hours Revenue Miles
Operating Costs Passenger Revenue Operating Subsidy
669860 574669
476489 472718
658869
0100000200000300000400000500000600000700000800000
FY 2013 FY 2014 FY 2015 FY 2016 FY 2017
Passengers
9755 8644 8544 9300
23052
0
5000
10000
15000
20000
25000
FY 2013 FY 2014 FY 2015 FY 2016 FY 2017
Revenue Hours
$1345711 $1271601 $1187694 $1202986
$3234308
$0
$500000
$1000000
$1500000
$2000000
$2500000
$3000000
$3500000
FY 2013 FY 2014 FY 2015 FY 2016 FY 2017
Operating Costs
687 665 558
508
286
00100200300400500600700800
FY 2013 FY 2014 FY 2015 FY 2016 FY 2017
Passengers per Revenue Hour
$097 $120 $152 $139
$380
$000
$200
$400
$600
$800
$1000
FY 2013 FY 2014 FY 2015 FY 2016 FY 2017
Subsidy per Passenger
$13796 $14710 $13901 $12935 $14030
$0
$50
$100
$150
$200
FY 2013 FY 2014 FY 2015 FY 2016 FY 2017
Cost per Revenue Hour
36Local Trunkline
Days of Service Wkdy Sa SuAvg Freq (Wkdy Peak) 30 min
Avg Freq (Wkdy Non-Peak) 30 minAvg Freq (Wked) 30 min
FY 2017 Farebox Recovery 19 transfer (to route) 18
Clipper usage 6
Annual Avg Monthly Avg Daily Annual Avg Monthly Avg Daily Annual Avg Monthly Avg DailyWeekday 278217 23185 1100 9938 828 39 133318 11110 527 Saturday 33779 2815 650 1715 143 33 24259 2022 467 Sunday 30182 2515 503 1983 165 33 28002 2334 467
Total 342178 28515 937 13636 1136 37 185579 15465 508
Annual Avg Monthly Avg Daily Annual Avg Monthly Avg Daily Annual Avg Monthly Avg DailyWeekday $1384291 $115358 $5472 $290481 $24207 $1148 $1093810 $91151 $4323Saturday $240062 $20005 $4617 $40774 $3398 $784 $199288 $16607 $3832Sunday $277325 $23110 $4622 $37877 $3156 $631 $239448 $19954 $3991
Total $1901678 $158473 $5210 $369132 $30761 $1011 $1532546 $127712 $4199
Passengers per Revenue Hour
Subsidy per Passenger
Cost per Revenue Hour
Farebox Recovery
Weekday 280 $393 $13930 210Saturday 197 $590 $13999 170Sunday 152 $793 $13984 137
Total 251 $448 $13946 194
Passengers Revenue Hours Operating CostsPassenger
RevenueOperating Subsidy
Passengers per Revenue Hour
Subsidy per Passenger
Cost per Revenue Hour
Farebox Recovery
FY 2015 109347 2894 $402355 $110471 $291884 378 $267 $13905 275FY 2016 119593 3462 $457211 $129715 $327496 345 $274 $13205 284FY 2017 342178 13636 $1901678 $369132 $1532546 251 $448 $13946 194
Histo
ric Tr
ends
FY 20
161
7 DAT
A
Passengers Revenue Hours Revenue Miles
Operating Costs Passenger Revenue Operating Subsidy
106988 103673 109347 119593
342178
050000
100000150000200000250000300000350000400000
FY 2013 FY 2014 FY 2015 FY 2016 FY 2017
Passengers
2878 2822 2894 3462
13636
02000400060008000
10000120001400016000
FY 2013 FY 2014 FY 2015 FY 2016 FY 2017
Revenue Hours
$398410 $415238 $402355 $457211
$1901678
$0
$500000
$1000000
$1500000
$2000000
FY 2013 FY 2014 FY 2015 FY 2016 FY 2017
Operating Costs
372 367 378 345 251
00100200300400500600700800
FY 2013 FY 2014 FY 2015 FY 2016 FY 2017
Passengers per Revenue Hour
$265 $293 $267 $274
$448
$000
$200
$400
$600
$800
$1000
FY 2013 FY 2014 FY 2015 FY 2016 FY 2017
Subsidy per Passenger
$13842 $14713 $13905 $13205 $13946
$0
$50
$100
$150
$200
FY 2013 FY 2014 FY 2015 FY 2016 FY 2017
Cost per Revenue Hour
49Local Basic
Days of Service Wkdy Sa SuAvg Freq (Wkdy Peak) 30 min
Avg Freq (Wkdy Non-Peak) 60 minAvg Freq (Wked) 60 min
FY 2017 Farebox Recovery 22 transfer (to route) 9
Clipper usage 11
Annual Avg Monthly Avg Daily Annual Avg Monthly Avg Daily Annual Avg Monthly Avg DailyWeekday 201564 16797 797 11313 943 45 139528 11627 551 Saturday 18489 1541 356 1517 126 29 18370 1531 353 Sunday 17183 1432 286 1761 147 29 21402 1784 357
Total 237236 19770 650 14590 1216 40 179300 14942 491
Annual Avg Monthly Avg Daily Annual Avg Monthly Avg Daily Annual Avg Monthly Avg DailyWeekday $978903 $81575 $3869 $230134 $19178 $910 $748769 $62397 $2960Saturday $131907 $10992 $2537 $22520 $1877 $433 $109387 $9116 $2104Sunday $153484 $12790 $2558 $21844 $1820 $364 $131640 $10970 $2194
Total $1264294 $105358 $3464 $274498 $22875 $752 $989796 $82483 $2712
Passengers per Revenue Hour
Subsidy per Passenger
Cost per Revenue Hour
Farebox Recovery
Weekday 178 $371 $8653 235Saturday 122 $592 $8698 171Sunday 98 $766 $8718 142
Total 163 $417 $8665 217
Passengers Revenue Hours Operating CostsPassenger
RevenueOperating Subsidy
Passengers per Revenue Hour
Subsidy per Passenger
Cost per Revenue Hour
Farebox Recovery
FY 2015 144262 6349 $882801 $158088 $724713 227 $502 $13905 179FY 2016 147480 6795 $900804 $146345 $754459 217 $512 $13257 162FY 2017 237236 14590 $1264294 $274498 $989796 163 $417 $8665 217
Histo
ric Tr
ends
FY 20
161
7 DAT
A
Passengers Revenue Hours Revenue Miles
Operating Costs Passenger Revenue Operating Subsidy
230943
152259 144262 147480
237236
0
50000
100000
150000
200000
250000
FY 2013 FY 2014 FY 2015 FY 2016 FY 2017
Passengers
9814
6440 6349 6795
14590
02000400060008000
10000120001400016000
FY 2013 FY 2014 FY 2015 FY 2016 FY 2017
Revenue Hours$1362499
$948702 $882801 $900804
$1264294
$0$200000$400000$600000$800000
$1000000$1200000$1400000$1600000
FY 2013 FY 2014 FY 2015 FY 2016 FY 2017
Operating Costs
235 236 227 217
163
00
50
100
150
200
250
300
FY 2013 FY 2014 FY 2015 FY 2016 FY 2017
Passengers per Revenue Hour
$477 $507 $502 $512 $417
$000$200$400$600$800
$1000$1200$1400
FY 2013 FY 2014 FY 2015 FY 2016 FY 2017
Subsidy per Passenger
$13884 $14732 $13905 $13257
$8665
$0
$50
$100
$150
$200
FY 2013 FY 2014 FY 2015 FY 2016 FY 2017
Cost per Revenue Hour
61Rural
Days of Service Wkdy Sa SuAvg Freq (Wkdy Peak) 8 trips
Avg Freq (Wkdy Non-Peak) -Avg Freq (Wked) 16 trips
FY 2017 Farebox Recovery 8 transfer (to route) 7
Clipper usage 11
Annual Avg Monthly Avg Daily Annual Avg Monthly Avg Daily Annual Avg Monthly Avg DailyWeekday 17166 1431 68 2631 219 10 45398 3783 181 Saturday 9922 827 198 1319 110 26 20810 1734 416 Sunday 9240 770 144 1542 129 24 24457 2038 382
Total 36328 3027 100 5492 458 15 90665 7555 248
Annual Avg Monthly Avg Daily Annual Avg Monthly Avg Daily Annual Avg Monthly Avg DailyWeekday $229650 $19138 $915 $17691 $1474 $70 $211959 $17663 $844Saturday $113378 $9448 $2268 $11622 $969 $232 $101756 $8480 $2035Sunday $132750 $11063 $2074 $10646 $887 $166 $122104 $10175 $1908
Total $475778 $39648 $1304 $39959 $3330 $109 $435819 $36318 $1194
Passengers per Revenue Hour
Subsidy per Passenger
Cost per Revenue Hour
Farebox Recovery
Weekday 65 $1235 $8730 77Saturday 75 $1026 $8598 103Sunday 60 $1321 $8607 80
Total 66 $1200 $8663 84
Passengers Revenue Hours Operating CostsPassenger
RevenueOperating Subsidy
Passengers per Revenue Hour
Subsidy per Passenger
Cost per Revenue Hour
Farebox Recovery
FY 2015 39478 5379 $417539 $46324 $371215 73 $940 $7762 111FY 2016 37276 5475 $408987 $48421 $360566 68 $967 $7470 118FY 2017 36328 5492 $475778 $39959 $435819 66 $1200 $8663 84
Histo
ric Tr
ends
FY 20
161
7 DAT
A
Passengers Revenue Hours Revenue Miles
Operating Costs Passenger Revenue Operating Subsidy
30642 33386
39478 37276 36328
0
10000
20000
30000
40000
50000
FY 2013 FY 2014 FY 2015 FY 2016 FY 2017
Passengers
5388
5056
5379 5475 5492
480049005000510052005300540055005600
FY 2013 FY 2014 FY 2015 FY 2016 FY 2017
Revenue Hours
$388827 $390358 $417539 $408987 $475778
$0
$100000
$200000
$300000
$400000
$500000
FY 2013 FY 2014 FY 2015 FY 2016 FY 2017
Operating Costs
57 66
73 68 66
00
20
40
60
80
100
FY 2013 FY 2014 FY 2015 FY 2016 FY 2017
Passengers per Revenue Hour
$1136 $1045
$940 $967
$1200
$000$200$400$600$800
$1000$1200$1400
FY 2013 FY 2014 FY 2015 FY 2016 FY 2017
Subsidy per Passenger
$7216 $7721 $7762 $7470 $8663
$0
$50
$100
$150
$200
FY 2013 FY 2014 FY 2015 FY 2016 FY 2017
Cost per Revenue Hour
66Recreational
Days of Service Wkdy Sa SuAvg Freq (Wkdy Peak) 30 min
Avg Freq (Wkdy Non-Peak) 30 minAvg Freq (Wked) 10-20 min
FY 2017 Farebox Recovery 53 transfer (to route) 0
Clipper usage 0
Annual Avg Monthly Avg Daily Annual Avg Monthly Avg Daily Annual Avg Monthly Avg DailyWeekday 21940 7313 549 804 268 20 10735 3578 268 Saturday 43799 7300 1752 1473 245 59 20480 3413 819 Sunday 56377 6264 1446 2040 227 52 28212 3135 723
Total 122116 13568 1174 4316 480 42 59428 6603 571
Annual Avg Monthly Avg Daily Annual Avg Monthly Avg Daily Annual Avg Monthly Avg DailyWeekday $104033 $34678 $2601 $37751 $12584 $944 $66282 $22094 $1657Saturday $152661 $25444 $6106 $79948 $13325 $3198 $72713 $12119 $2909Sunday $217032 $24115 $5565 $132049 $14672 $3386 $84983 $9443 $2179
Total $473726 $52636 $4555 $249748 $27750 $2401 $223978 $24886 $2154
Passengers per Revenue Hour
Subsidy per Passenger
Cost per Revenue Hour
Farebox Recovery
Weekday 273 $302 $12944 363Saturday 297 $166 $10367 524Sunday 276 $151 $10638 608
Total 283 $183 $10975 527
Passengers Revenue Hours Operating CostsPassenger
RevenueOperating Subsidy
Passengers per Revenue Hour
Subsidy per Passenger
Cost per Revenue Hour
Farebox Recovery
FY 2015 103930 3866 $477523 $209514 $268009 269 $258 $12352 439FY 2016 116942 4673 $531384 $245779 $285605 250 $244 $11373 463FY 2017 122116 4316 $473726 $249748 $223978 283 $183 $10975 527
Histo
ric Tr
ends
FY 20
161
7 DAT
A
Passengers Revenue Hours Revenue Miles
Operating Costs Passenger Revenue Operating Subsidy
62624
103052 103930 116942 122116
0
20000
40000
60000
80000
100000
120000
140000
FY 2013 FY 2014 FY 2015 FY 2016 FY 2017
Passengers
2941
3841 3866
4673 4316
0
1000
2000
3000
4000
5000
FY 2013 FY 2014 FY 2015 FY 2016 FY 2017
Revenue Hours
$330076
$538014 $477523
$531384 $473726
$0
$100000
$200000
$300000
$400000
$500000
$600000
FY 2013 FY 2014 FY 2015 FY 2016 FY 2017
Operating Costs
213
268 269 250
283
00
50
100
150
200
250
300
FY 2013 FY 2014 FY 2015 FY 2016 FY 2017
Passengers per Revenue Hour
$360 $322
$258 $244 $183
$000
$100
$200
$300
$400
$500
FY 2013 FY 2014 FY 2015 FY 2016 FY 2017
Subsidy per Passenger
$11223
$14007 $12352 $11373 $10975
$0
$50
$100
$150
$200
FY 2013 FY 2014 FY 2015 FY 2016 FY 2017
Cost per Revenue Hour
68Rural
Days of Service Wkdy Sa SuAvg Freq (Wkdy Peak) 60 min
Avg Freq (Wkdy Non-Peak) 120 minAvg Freq (Wked) 60-120 min
FY 2017 Farebox Recovery 9 transfer (to route) 13
Clipper usage 12
Annual Avg Monthly Avg Daily Annual Avg Monthly Avg Daily Annual Avg Monthly Avg DailyWeekday 59903 4992 239 7282 607 29 133167 11097 531 Saturday 8410 701 168 1492 124 30 27123 2260 542 Sunday 8285 690 129 1907 159 30 34638 2887 541
Total 76598 6383 210 10680 890 29 194928 16244 534
Annual Avg Monthly Avg Daily Annual Avg Monthly Avg Daily Annual Avg Monthly Avg DailyWeekday $645737 $53811 $2573 $64332 $5361 $256 $581405 $48450 $2316Saturday $131882 $10990 $2638 $9260 $772 $185 $122622 $10219 $2452Sunday $169286 $14107 $2645 $8856 $738 $138 $160430 $13369 $2507
Total $946905 $78909 $2594 $82448 $6871 $226 $864457 $72038 $2368
Passengers per Revenue Hour
Subsidy per Passenger
Cost per Revenue Hour
Farebox Recovery
Weekday 82 $971 $8868 100Saturday 56 $1458 $8841 70Sunday 43 $1936 $8879 52
Total 72 $1129 $8866 87
Passengers Revenue Hours Operating CostsPassenger
RevenueOperating Subsidy
Passengers per Revenue Hour
Subsidy per Passenger
Cost per Revenue Hour
Farebox Recovery
FY 2015 65866 10589 $848305 $80846 $767459 62 $1165 $8011 95FY 2016 70292 10611 $811978 $88808 $723170 66 $1029 $7652 109FY 2017 76598 10680 $946905 $82448 $864457 72 $1129 $8866 87
Histo
ric Tr
ends
FY 20
161
7 DAT
A
Passengers Revenue Hours Revenue Miles
Operating Costs Passenger Revenue Operating Subsidy
48113 56988
65866 70292 76598
0
20000
40000
60000
80000
100000
FY 2013 FY 2014 FY 2015 FY 2016 FY 2017
Passengers
7140 7185
10589 10611 10680
0
2000
4000
6000
8000
10000
12000
FY 2013 FY 2014 FY 2015 FY 2016 FY 2017
Revenue Hours
$532879 $571618
$848305 $811978 $946905
$0
$200000
$400000
$600000
$800000
$1000000
FY 2013 FY 2014 FY 2015 FY 2016 FY 2017
Operating Costs
67 79
62 66 72
00
20
40
60
80
100
FY 2013 FY 2014 FY 2015 FY 2016 FY 2017
Passengers per Revenue Hour
$979 $885
$1165 $1029
$1129
$000$200$400$600$800
$1000$1200$1400
FY 2013 FY 2014 FY 2015 FY 2016 FY 2017
Subsidy per Passenger
$7464 $7955 $8011 $7652 $8866
$0
$50
$100
$150
$200
FY 2013 FY 2014 FY 2015 FY 2016 FY 2017
Cost per Revenue Hour
71XLocal Trunkline
Days of Service WkdyAvg Freq (Wkdy Peak) 30 min
Avg Freq (Wkdy Non-Peak) 60 minAvg Freq (Wked) -
FY 2017 Farebox Recovery 15 transfer (to route) 26
Clipper usage 16
Annual Avg Monthly Avg Daily Annual Avg Monthly Avg Daily Annual Avg Monthly Avg DailyWeekday 121141 10095 479 7705 642 30 174624 14552 690 Saturday - - - - - - - - - Sunday - - - - - - - - -
Total 121141 10095 479 7705 642 30 174624 14552 690
Annual Avg Monthly Avg Daily Annual Avg Monthly Avg Daily Annual Avg Monthly Avg DailyWeekday $1116954 $93080 $4415 $164963 $13747 $652 $951991 $79333 $3763Saturday $ - $ - $ - $ - $ - $ - $ - $ - $ -Sunday $ - $ - $ - $ - $ - $ - $ - $ - $ -
Total $1116954 $93080 $4415 $164963 $13747 $652 $951991 $79333 $3763
Passengers per Revenue Hour
Subsidy per Passenger
Cost per Revenue Hour
Farebox Recovery
Weekday 157 $786 $14496 148Saturday - $ - $ - - Sunday - $ - $ - -
Total 157 $786 $14496 148
Passengers Revenue Hours Operating CostsPassenger
RevenueOperating Subsidy
Passengers per Revenue Hour
Subsidy per Passenger
Cost per Revenue Hour
Farebox Recovery
FY 2015 305440 7666 $1066058 $307659 $758399 398 $248 $13906 289FY 2016 259678 7717 $1075263 $300186 $775077 337 $298 $13934 279FY 2017 121141 7705 $1116954 $164963 $951991 157 $786 $14496 148
Histo
ric Tr
ends
FY 20
161
7 DAT
A
Passengers Revenue Hours Revenue Miles
Operating Costs Passenger Revenue Operating Subsidy
347560 341105 305440
259678
121141
050000
100000150000200000250000300000350000400000
FY 2013 FY 2014 FY 2015 FY 2016 FY 2017
Passengers9038
7578 7666 7717 7705
0
2000
4000
6000
8000
10000
FY 2013 FY 2014 FY 2015 FY 2016 FY 2017
Revenue Hours$1254262
$1116004 $1066058 $1075263 $1116954
$0
$200000
$400000
$600000
$800000
$1000000
$1200000
$1400000
FY 2013 FY 2014 FY 2015 FY 2016 FY 2017
Operating Costs
385 450
398 337
157
00100200300400500600700800
FY 2013 FY 2014 FY 2015 FY 2016 FY 2017
Passengers per Revenue Hour
$253 $222 $248 $298
$786
$000
$200
$400
$600
$800
$1000
FY 2013 FY 2014 FY 2015 FY 2016 FY 2017
Subsidy per Passenger
$13877 $14728 $13906 $13934 $14496
$0
$50
$100
$150
$200
FY 2013 FY 2014 FY 2015 FY 2016 FY 2017
Cost per Revenue Hour
113Supplemental
Days of Service School DaysAvg Freq (Wkdy Peak) 3 trips
Avg Freq (Wkdy Non-Peak) -Avg Freq (Wked) -
FY 2017 Farebox Recovery 29 transfer (to route) 0
Clipper usage 4
Annual Avg Monthly Avg Daily Annual Avg Monthly Avg Daily Annual Avg Monthly Avg DailyWeekday 16829 1530 92 317 29 2 2404 219 13 Saturday - - - - - - - - - Sunday - - - - - - - - -
Total 16829 1530 92 317 29 2 2404 219 13
Annual Avg Monthly Avg Daily Annual Avg Monthly Avg Daily Annual Avg Monthly Avg DailyWeekday $42180 $3835 $230 $12227 $1112 $67 $29953 $2723 $164Saturday $ - $ - $ - $ - $ - $ - $ - $ - $ -Sunday $ - $ - $ - $ - $ - $ - $ - $ - $ -
Total $42180 $3835 $230 $12227 $1112 $67 $29953 $2723 $164
Passengers per TripSubsidy per
PassengerCost per Revenue
HourFarebox Recovery
Weekday 315 $178 $13289 290Saturday - $ - $ - - Sunday - $ - $ - -
Total 315 $178 $13289 290
Passengers Revenue Hours Operating CostsPassenger
RevenueOperating Subsidy Passengers per Trip
Subsidy per Passenger
Cost per Revenue Hour
Farebox Recovery
FY 2015 12241 161 $28599 $10703 $17896 342 $146 $17752 374FY 2016 14601 263 $36924 $12809 $24115 317 $165 $14050 347FY 2017 16829 317 $42180 $12227 $29953 315 $178 $13289 290
Histo
ric Tr
ends
FY 20
161
7 DAT
A
Passengers Revenue Hours Revenue Miles
Operating Costs Passenger Revenue Operating Subsidy
15232 13521
12241 14601
16829
0
5000
10000
15000
20000
FY 2013 FY 2014 FY 2015 FY 2016 FY 2017
Passengers
229
165 161
263
317
0
50
100
150
200
250
300
350
FY 2013 FY 2014 FY 2015 FY 2016 FY 2017
Revenue Hours
$31562
$20182
$28599
$36924 $42180
$0
$10000
$20000
$30000
$40000
$50000
FY 2013 FY 2014 FY 2015 FY 2016 FY 2017
Operating Costs
220
365 342 317 315
00
100
200
300
400
500
FY 2013 FY 2014 FY 2015 FY 2016 FY 2017
Passengers per Trip
$051 $095
$146 $165 $178
$000$100$200$300$400$500$600$700$800
FY 2013 FY 2014 FY 2015 FY 2016 FY 2017
Subsidy per Passenger
$13795 $12261
$17752
$14050 $13289
$0
$50
$100
$150
$200
FY 2013 FY 2014 FY 2015 FY 2016 FY 2017
Cost per Revenue Hour
115Supplemental
Days of Service School DaysAvg Freq (Wkdy Peak) 5 trips
Avg Freq (Wkdy Non-Peak) -Avg Freq (Wked) -
FY 2017 Farebox Recovery 11 transfer (to route) 0
Clipper usage 7
Annual Avg Monthly Avg Daily Annual Avg Monthly Avg Daily Annual Avg Monthly Avg DailyWeekday 14021 1275 71 637 58 3 6963 633 35 Saturday - - - - - - - - - Sunday - - - - - - - - -
Total 14021 1275 71 637 58 3 6963 633 35
Annual Avg Monthly Avg Daily Annual Avg Monthly Avg Daily Annual Avg Monthly Avg DailyWeekday $87534 $7958 $444 $9504 $864 $48 $78030 $7094 $396Saturday $ - $ - $ - $ - $ - $ - $ - $ - $ -Sunday $ - $ - $ - $ - $ - $ - $ - $ - $ -
Total $87534 $7958 $444 $9504 $864 $48 $78030 $7094 $396
Passengers per TripSubsidy per
PassengerCost per Revenue
HourFarebox Recovery
Weekday 185 $557 $13744 109Saturday - $ - $ - - Sunday - $ - $ - -
Total 185 $557 $13744 109
Passengers Revenue Hours Operating CostsPassenger
RevenueOperating Subsidy Passengers per Trip
Subsidy per Passenger
Cost per Revenue Hour
Farebox Recovery
FY 2015 21488 775 $131168 $18863 $112305 221 $523 $16918 144FY 2016 16366 559 $82403 $12638 $69765 168 $426 $14754 153FY 2017 14021 637 $87534 $9504 $78030 185 $557 $13744 109
Histo
ric Tr
ends
FY 20
161
7 DAT
A
Passengers Revenue Hours Revenue Miles
Operating Costs Passenger Revenue Operating Subsidy
13524
21488
16366 14021
0
5000
10000
15000
20000
25000
FY 2013 FY 2014 FY 2015 FY 2016 FY 2017
Passengers
463
775
559 637
0
200
400
600
800
1000
FY 2013 FY 2014 FY 2015 FY 2016 FY 2017
Revenue Hours
$56706
$131168
$82403 $87534
$0
$20000
$40000
$60000
$80000
$100000
$120000
$140000
FY 2013 FY 2014 FY 2015 FY 2016 FY 2017
Operating Costs
232 221 168 185
00
100
200
300
400
500
FY 2013 FY 2014 FY 2015 FY 2016 FY 2017
Passengers per Trip
$362
$523 $426
$557
$000$100$200$300$400$500$600$700$800
FY 2013 FY 2014 FY 2015 FY 2016 FY 2017
Subsidy per Passenger
$12250
$16918 $14754 $13744
$0
$50
$100
$150
$200
FY 2013 FY 2014 FY 2015 FY 2016 FY 2017
Cost per Revenue Hour
117Supplemental
Days of Service School DaysAvg Freq (Wkdy Peak) 6 trips
Avg Freq (Wkdy Non-Peak) -Avg Freq (Wked) -
FY 2017 Farebox Recovery 21 transfer (to route) 0
Clipper usage 2
Annual Avg Monthly Avg Daily Annual Avg Monthly Avg Daily Annual Avg Monthly Avg DailyWeekday 34820 3165 193 640 58 4 4753 432 26 Saturday - - - - - - - - - Sunday - - - - - - - - -
Total 34820 3165 193 640 58 4 4753 432 26
Annual Avg Monthly Avg Daily Annual Avg Monthly Avg Daily Annual Avg Monthly Avg DailyWeekday $81509 $7410 $453 $17140 $1558 $95 $64369 $5852 $358Saturday $ - $ - $ - $ - $ - $ - $ - $ - $ -Sunday $ - $ - $ - $ - $ - $ - $ - $ - $ -
Total $81509 $7410 $453 $17140 $1558 $95 $64369 $5852 $358
Passengers per TripSubsidy per
PassengerCost per Revenue
HourFarebox Recovery
Weekday 284 $185 $12732 210Saturday - $ - $ - - Sunday - $ - $ - -
Total 284 $185 $12732 210
Passengers Revenue Hours Operating CostsPassenger
RevenueOperating Subsidy Passengers per Trip
Subsidy per Passenger
Cost per Revenue Hour
Farebox Recovery
FY 2015 50008 509 $77168 $77528 ($360) 399 ($001) $15158 1005FY 2016 33705 552 $77694 $23478 $54216 269 $161 $14075 302FY 2017 34820 640 $81509 $17140 $64369 284 $185 $12732 210
Histo
ric Tr
ends
FY 20
161
7 DAT
A
Passengers Revenue Hours Revenue Miles
Operating Costs Passenger Revenue Operating Subsidy
35174 34496
50008
33705 34820
0
10000
20000
30000
40000
50000
60000
FY 2013 FY 2014 FY 2015 FY 2016 FY 2017
Passengers
299 341
509 552
640
0
100
200
300
400
500
600
700
FY 2013 FY 2014 FY 2015 FY 2016 FY 2017
Revenue Hours
$41176 $41796
$77168 $77694 $81509
$0
$20000
$40000
$60000
$80000
$100000
FY 2013 FY 2014 FY 2015 FY 2016 FY 2017
Operating Costs
436 406 399
269 284
00
100
200
300
400
500
FY 2013 FY 2014 FY 2015 FY 2016 FY 2017
Passengers per Trip
($012) ($028) ($001)
$161 $185
-$200
-$100
$000
$100
$200
$300
$400
$500
$600
FY 2013 FY 2014 FY 2015 FY 2016 FY 2017
Subsidy per Passenger$13790
$12253
$15158 $14075
$12732
$0$20$40$60$80
$100$120$140$160
FY 2013 FY 2014 FY 2015 FY 2016 FY 2017
Cost per Revenue Hour
119Supplemental
Days of Service School DaysAvg Freq (Wkdy Peak) 5 trips
Avg Freq (Wkdy Non-Peak) -Avg Freq (Wked) -
FY 2017 Farebox Recovery 34 transfer (to route) 0
Clipper usage 5
Annual Avg Monthly Avg Daily Annual Avg Monthly Avg Daily Annual Avg Monthly Avg DailyWeekday 27161 2469 151 374 34 2 6893 627 38 Saturday - - - - - - - - - Sunday - - - - - - - - -
Total 27161 2469 151 374 34 2 6893 627 38
Annual Avg Monthly Avg Daily Annual Avg Monthly Avg Daily Annual Avg Monthly Avg DailyWeekday $56273 $5116 $313 $18859 $1714 $105 $37414 $3401 $208Saturday $ - $ - $ - $ - $ - $ - $ - $ - $ -Sunday $ - $ - $ - $ - $ - $ - $ - $ - $ -
Total $56273 $5116 $313 $18859 $1714 $105 $37414 $3401 $208
Passengers per TripSubsidy per
PassengerCost per Revenue
HourFarebox Recovery
Weekday 313 $138 $15058 335Saturday - $ - $ - - Sunday - $ - $ - -
Total 313 $138 $15058 335
Passengers Revenue Hours Operating CostsPassenger
RevenueOperating Subsidy Passengers per Trip
Subsidy per Passenger
Cost per Revenue Hour
Farebox Recovery
FY 2015 28376 466 $85243 $24699 $60544 319 $213 $18292 290FY 2016 30906 431 $68366 $28456 $39910 317 $129 $15877 416FY 2017 27161 374 $56273 $18859 $37414 313 $138 $15058 335
Histo
ric Tr
ends
FY 20
161
7 DAT
A
Passengers Revenue Hours Revenue Miles
Operating Costs Passenger Revenue Operating Subsidy
27987 28376
30906
27161
25000
26000
27000
28000
29000
30000
31000
32000
FY 2013 FY 2014 FY 2015 FY 2016 FY 2017
Passengers526
466 431
374
0
100
200
300
400
500
600
FY 2013 FY 2014 FY 2015 FY 2016 FY 2017
Revenue Hours
$64440
$85243
$68366 $56273
$0
$20000
$40000
$60000
$80000
$100000
FY 2013 FY 2014 FY 2015 FY 2016 FY 2017
Operating Costs
272 319 317 313
00
100
200
300
400
500
FY 2013 FY 2014 FY 2015 FY 2016 FY 2017
Passengers per Trip
$175 $213 $129 $138
$000$100$200$300$400$500$600$700$800
FY 2013 FY 2014 FY 2015 FY 2016 FY 2017
Subsidy per Passenger
$12251
$18292 $15877 $15058
$0
$50
$100
$150
$200
FY 2013 FY 2014 FY 2015 FY 2016 FY 2017
Cost per Revenue Hour
122Partnership
Days of Service WkdyAvg Freq (Wkdy Peak) -
Avg Freq (Wkdy Non-Peak) 30 minAvg Freq (Wked) -
FY 2017 Farebox Recovery 66 transfer (to route) 9
Clipper usage 6
Annual Avg Monthly Avg Daily Annual Avg Monthly Avg Daily Annual Avg Monthly Avg DailyWeekday 19860 1986 113 1696 170 10 15480 1548 88 Saturday - - - - - - - - - Sunday - - - - - - - - -
Total 19860 1986 113 1696 170 10 15480 1548 88
Annual Avg Monthly Avg Daily Annual Avg Monthly Avg Daily Annual Avg Monthly Avg DailyWeekday $183943 $18394 $1045 $121007 $12101 $688 $62936 $6294 $358Saturday $ - $ - $ - $ - $ - $ - $ - $ - $ -Sunday $ - $ - $ - $ - $ - $ - $ - $ - $ -
Total $183943 $18394 $1045 $121007 $12101 $688 $62936 $6294 $358
Passengers per Revenue Hour
Subsidy per Passenger
Cost per Revenue Hour
Farebox Recovery
Weekday 117 $317 $10844 658Saturday - $ - $ - - Sunday - $ - $ - -
Total 117 $317 $10844 658
Passengers Revenue Hours Operating CostsPassenger
RevenueOperating Subsidy
Passengers per Revenue Hour
Subsidy per Passenger
Cost per Revenue Hour
Farebox Recovery
FY 2015FY 2016 20360 2932 $325230 $149686 $175544 69 $862 $11094 460FY 2017 19860 1696 $183943 $121007 $62936 117 $317 $10844 658
Histo
ric Tr
ends
FY 20
161
7 DAT
A
Passengers Revenue Hours Revenue Miles
Operating Costs Passenger Revenue Operating Subsidy
20360 19860
0
5000
10000
15000
20000
25000
FY 2013 FY 2014 FY 2015 FY 2016 FY 2017
Passengers2932
1696
0
500
1000
1500
2000
2500
3000
3500
FY 2013 FY 2014 FY 2015 FY 2016 FY 2017
Revenue Hours$325230
$183943
$0
$50000
$100000
$150000
$200000
$250000
$300000
$350000
FY 2013 FY 2014 FY 2015 FY 2016 FY 2017
Operating Costs
69
117
00
20
40
60
80
100
120
140
FY 2013 FY 2014 FY 2015 FY 2016 FY 2017
Passengers per Revenue Hour$862
$317
$000
$200
$400
$600
$800
$1000
FY 2013 FY 2014 FY 2015 FY 2016 FY 2017
Subsidy per Passenger
$11094 $10844
$0
$50
$100
$150
$200
FY 2013 FY 2014 FY 2015 FY 2016 FY 2017
Cost per Revenue Hour
125Supplemental
Days of Service School DaysAvg Freq (Wkdy Peak) 4 trips
Avg Freq (Wkdy Non-Peak) -Avg Freq (Wked) -
FY 2017 Farebox Recovery 16 transfer (to route) 1
Clipper usage 8
Annual Avg Monthly Avg Daily Annual Avg Monthly Avg Daily Annual Avg Monthly Avg DailyWeekday 13757 1251 76 600 55 3 8580 780 48 Saturday - - - - - - - - - Sunday - - - - - - - - -
Total 13757 1251 76 600 55 3 8580 780 48
Annual Avg Monthly Avg Daily Annual Avg Monthly Avg Daily Annual Avg Monthly Avg DailyWeekday $72469 $6588 $403 $11570 $1052 $64 $60899 $5536 $338Saturday $ - $ - $ - $ - $ - $ - $ - $ - $ -Sunday $ - $ - $ - $ - $ - $ - $ - $ - $ -
Total $72469 $6588 $403 $11570 $1052 $64 $60899 $5536 $338
Passengers per TripSubsidy per
PassengerCost per Revenue
HourFarebox Recovery
Weekday 193 $443 $12086 160Saturday - $ - $ - - Sunday - $ - $ - -
Total 193 $443 $12086 160
Passengers Revenue Hours Operating CostsPassenger
RevenueOperating Subsidy Passengers per Trip
Subsidy per Passenger
Cost per Revenue Hour
Farebox Recovery
FY 2015 13298 578 $87015 $11914 $75101 186 $565 $15054 137FY 2016 13197 595 $77991 $12684 $65307 182 $495 $13117 163FY 2017 13757 600 $72469 $11570 $60899 193 $443 $12086 160
Histo
ric Tr
ends
FY 20
161
7 DAT
A
Passengers Revenue Hours Revenue Miles
Operating Costs Passenger Revenue Operating Subsidy
8798 7189
13298 13197 13757
02000400060008000
10000120001400016000
FY 2013 FY 2014 FY 2015 FY 2016 FY 2017
Passengers
100 90
578 595 600
0
100
200
300
400
500
600
700
FY 2013 FY 2014 FY 2015 FY 2016 FY 2017
Revenue Hours
$13752 $10979
$87015 $77991
$72469
$0
$20000
$40000
$60000
$80000
$100000
FY 2013 FY 2014 FY 2015 FY 2016 FY 2017
Operating Costs
492
402
186 182 193
00
100
200
300
400
500
FY 2013 FY 2014 FY 2015 FY 2016 FY 2017
Passengers per Trip
$015 $002
$565 $495
$443
$000$100$200$300$400$500$600$700$800
FY 2013 FY 2014 FY 2015 FY 2016 FY 2017
Subsidy per Passenger$13821
$12267
$15054 $13117
$12086
$0$20$40$60$80
$100$120$140$160
FY 2013 FY 2014 FY 2015 FY 2016 FY 2017
Cost per Revenue Hour
139Supplemental
Days of Service School DaysAvg Freq (Wkdy Peak) 2 trips
Avg Freq (Wkdy Non-Peak) -Avg Freq (Wked) -
FY 2017 Farebox Recovery 20 transfer (to route) 0
Clipper usage 24
Annual Avg Monthly Avg Daily Annual Avg Monthly Avg Daily Annual Avg Monthly Avg DailyWeekday 6414 583 36 253 23 1 4127 375 23 Saturday - - - - - - - - - Sunday - - - - - - - - -
Total 6414 583 36 253 23 1 4127 375 23
Annual Avg Monthly Avg Daily Annual Avg Monthly Avg Daily Annual Avg Monthly Avg DailyWeekday $33182 $3017 $184 $6635 $603 $37 $26547 $2413 $147Saturday $ - $ - $ - $ - $ - $ - $ - $ - $ -Sunday $ - $ - $ - $ - $ - $ - $ - $ - $ -
Total $33182 $3017 $184 $6635 $603 $37 $26547 $2413 $147
Passengers per TripSubsidy per
PassengerCost per Revenue
HourFarebox Recovery
Weekday 179 $414 $13110 200Saturday - $ - $ - - Sunday - $ - $ - -
Total 179 $414 $13110 200
Passengers Revenue Hours Operating CostsPassenger
RevenueOperating Subsidy Passengers per Trip
Subsidy per Passenger
Cost per Revenue Hour
Farebox Recovery
FY 2015 5906 225 $36437 $5258 $31179 164 $528 $16173 144FY 2016 6391 315 $43776 $6241 $37535 160 $587 $13880 143FY 2017 6414 253 $33182 $6635 $26547 179 $414 $13110 200
Histo
ric Tr
ends
FY 20
161
7 DAT
A
Passengers Revenue Hours Revenue Miles
Operating Costs Passenger Revenue Operating Subsidy
4232 4026
5906 6391 6414
0
1000
2000
3000
4000
5000
6000
7000
FY 2013 FY 2014 FY 2015 FY 2016 FY 2017
Passengers
226 227 225
315
253
0
50
100
150
200
250
300
350
FY 2013 FY 2014 FY 2015 FY 2016 FY 2017
Revenue Hours
$31306 $27734
$36437
$43776
$33182
$0
$10000
$20000
$30000
$40000
$50000
FY 2013 FY 2014 FY 2015 FY 2016 FY 2017
Operating Costs
120 111 164 160 179
00
100
200
300
400
500
FY 2013 FY 2014 FY 2015 FY 2016 FY 2017
Passengers per Trip
$427
$628 $528
$587
$414
$000$100$200$300$400$500$600$700$800
FY 2013 FY 2014 FY 2015 FY 2016 FY 2017
Subsidy per Passenger
$13834 $12239
$16173 $13880 $13110
$0
$50
$100
$150
$200
FY 2013 FY 2014 FY 2015 FY 2016 FY 2017
Cost per Revenue Hour
145Supplemental
Days of Service School DaysAvg Freq (Wkdy Peak) 2-3 trips
Avg Freq (Wkdy Non-Peak) -Avg Freq (Wked) -
FY 2017 Farebox Recovery 29 transfer (to route) 5
Clipper usage 2
Annual Avg Monthly Avg Daily Annual Avg Monthly Avg Daily Annual Avg Monthly Avg DailyWeekday 16406 1491 90 191 17 1 2175 198 12 Saturday - - - - - - - - - Sunday - - - - - - - - -
Total 16406 1491 90 191 17 1 2175 198 12
Annual Avg Monthly Avg Daily Annual Avg Monthly Avg Daily Annual Avg Monthly Avg DailyWeekday $25426 $2311 $139 $7258 $660 $40 $18168 $1652 $99Saturday $ - $ - $ - $ - $ - $ - $ - $ - $ -Sunday $ - $ - $ - $ - $ - $ - $ - $ - $ -
Total $25426 $2311 $139 $7258 $660 $40 $18168 $1652 $99
Passengers per TripSubsidy per
PassengerCost per Revenue
HourFarebox Recovery
Weekday 372 $111 $13347 285Saturday - $ - $ - - Sunday - $ - $ - -
Total 372 $111 $13347 285
Passengers Revenue Hours Operating CostsPassenger
RevenueOperating Subsidy Passengers per Trip
Subsidy per Passenger
Cost per Revenue Hour
Farebox Recovery
FY 2015 6911 87 $13373 $5858 $7515 337 $109 $15442 438FY 2016 10268 167 $21672 $6341 $15331 396 $149 $12993 293FY 2017 16406 191 $25426 $7258 $18168 372 $111 $13347 285
Histo
ric Tr
ends
FY 20
161
7 DAT
A
Passengers Revenue Hours Revenue Miles
Operating Costs Passenger Revenue Operating Subsidy
6911
10268
16406
0
5000
10000
15000
20000
FY 2013 FY 2014 FY 2015 FY 2016 FY 2017
Passengers
87
167 191
0
50
100
150
200
250
FY 2013 FY 2014 FY 2015 FY 2016 FY 2017
Revenue Hours
$13373
$21672 $25426
$0
$5000
$10000
$15000
$20000
$25000
$30000
FY 2013 FY 2014 FY 2015 FY 2016 FY 2017
Operating Costs
337 396 372
00
100
200
300
400
500
FY 2013 FY 2014 FY 2015 FY 2016 FY 2017
Passengers per Trip
$109 $149 $111
$000$100$200$300$400$500$600$700$800
FY 2013 FY 2014 FY 2015 FY 2016 FY 2017
Subsidy per Passenger
$15442 $12993 $13347
$0
$50
$100
$150
$200
FY 2013 FY 2014 FY 2015 FY 2016 FY 2017
Cost per Revenue Hour
151Supplemental
Days of Service School DaysAvg Freq (Wkdy Peak) 4-5 trips
Avg Freq (Wkdy Non-Peak) -Avg Freq (Wked) -
FY 2017 Farebox Recovery 25 transfer (to route) 1
Clipper usage 4
Annual Avg Monthly Avg Daily Annual Avg Monthly Avg Daily Annual Avg Monthly Avg DailyWeekday 36801 3346 204 594 54 3 10649 968 59 Saturday - - - - - - - - - Sunday - - - - - - - - -
Total 36801 3346 204 594 54 3 10649 968 59
Annual Avg Monthly Avg Daily Annual Avg Monthly Avg Daily Annual Avg Monthly Avg DailyWeekday $73842 $6713 $410 $18463 $1678 $103 $55379 $5034 $308Saturday $ - $ - $ - $ - $ - $ - $ - $ - $ -Sunday $ - $ - $ - $ - $ - $ - $ - $ - $ -
Total $73842 $6713 $410 $18463 $1678 $103 $55379 $5034 $308
Passengers per TripSubsidy per
PassengerCost per Revenue
HourFarebox Recovery
Weekday 428 $150 $12442 250Saturday - $ - $ - - Sunday - $ - $ - -
Total 428 $150 $12442 250
Passengers Revenue Hours Operating CostsPassenger
RevenueOperating Subsidy Passengers per Trip
Subsidy per Passenger
Cost per Revenue Hour
Farebox Recovery
FY 2015 39309 911 $134174 $34376 $99798 315 $254 $14722 256FY 2016 42643 759 $100712 $25851 $74861 456 $176 $13267 257FY 2017 36801 594 $73842 $18463 $55379 428 $150 $12442 250
Histo
ric Tr
ends
FY 20
161
7 DAT
A
Passengers Revenue Hours Revenue Miles
Operating Costs Passenger Revenue Operating Subsidy
39537 39309
42643
36801
32000
34000
36000
38000
40000
42000
44000
FY 2013 FY 2014 FY 2015 FY 2016 FY 2017
Passengers
784 911
759
594
0
200
400
600
800
1000
FY 2013 FY 2014 FY 2015 FY 2016 FY 2017
Revenue Hours
$95932
$134174
$100712
$73842
$0$20000$40000$60000$80000
$100000$120000$140000$160000
FY 2013 FY 2014 FY 2015 FY 2016 FY 2017
Operating Costs
368 315
456 428
00
100
200
300
400
500
FY 2013 FY 2014 FY 2015 FY 2016 FY 2017
Passengers per Trip
$188 $254
$176 $150
$000$100$200$300$400$500$600$700$800
FY 2013 FY 2014 FY 2015 FY 2016 FY 2017
Subsidy per Passenger
$12233
$14722 $13267 $12442
$0$20$40$60$80
$100$120$140$160
FY 2013 FY 2014 FY 2015 FY 2016 FY 2017
Cost per Revenue Hour
154Supplemental
Days of Service School DaysAvg Freq (Wkdy Peak) 3 trips
Avg Freq (Wkdy Non-Peak) -Avg Freq (Wked) -
FY 2017 Farebox Recovery 21 transfer (to route) 0
Clipper usage 5
Annual Avg Monthly Avg Daily Annual Avg Monthly Avg Daily Annual Avg Monthly Avg DailyWeekday 13738 1249 76 358 33 2 4342 395 24 Saturday - - - - - - - - - Sunday - - - - - - - - -
Total 13738 1249 76 358 33 2 4342 395 24
Annual Avg Monthly Avg Daily Annual Avg Monthly Avg Daily Annual Avg Monthly Avg DailyWeekday $41965 $3815 $233 $8847 $804 $49 $33118 $3011 $184Saturday $ - $ - $ - $ - $ - $ - $ - $ - $ -Sunday $ - $ - $ - $ - $ - $ - $ - $ - $ -
Total $41965 $3815 $233 $8847 $804 $49 $33118 $3011 $184
Passengers per TripSubsidy per
PassengerCost per Revenue
HourFarebox Recovery
Weekday 255 $241 $11729 211Saturday - $ - $ - - Sunday - $ - $ - -
Total 255 $241 $11729 211
Passengers Revenue Hours Operating CostsPassenger
RevenueOperating Subsidy Passengers per Trip
Subsidy per Passenger
Cost per Revenue Hour
Farebox Recovery
FY 2015 15376 293 $42604 $13174 $29430 388 $191 $14541 309FY 2016 17858 360 $46133 $14660 $31473 311 $176 $12808 318FY 2017 13738 358 $41965 $8847 $33118 255 $241 $11729 211
Histo
ric Tr
ends
FY 20
161
7 DAT
A
Passengers Revenue Hours Revenue Miles
Operating Costs Passenger Revenue Operating Subsidy
12138
15376 17858
13738
0
5000
10000
15000
20000
FY 2013 FY 2014 FY 2015 FY 2016 FY 2017
Passengers
310 293
360 358
050
100150200250300350400
FY 2013 FY 2014 FY 2015 FY 2016 FY 2017
Revenue Hours
$37913 $42604
$46133 $41965
$0
$10000
$20000
$30000
$40000
$50000
FY 2013 FY 2014 FY 2015 FY 2016 FY 2017
Operating Costs
291
388
311 255
00
100
200
300
400
500
FY 2013 FY 2014 FY 2015 FY 2016 FY 2017
Passengers per Trip
$256 $191 $176
$241
$000$100$200$300$400$500$600$700$800
FY 2013 FY 2014 FY 2015 FY 2016 FY 2017
Subsidy per Passenger
$12246
$14541 $12808
$11729
$0$20$40$60$80
$100$120$140$160
FY 2013 FY 2014 FY 2015 FY 2016 FY 2017
Cost per Revenue Hour
219Local Connector
Days of Service Wkdy Sa SuAvg Freq (Wkdy Peak) 30 min
Avg Freq (Wkdy Non-Peak) 30 minAvg Freq (Wked) 30 min
FY 2017 Farebox Recovery 11 transfer (to route) 20
Clipper usage 11
Annual Avg Monthly Avg Daily Annual Avg Monthly Avg Daily Annual Avg Monthly Avg DailyWeekday 40817 3401 161 5020 418 20 58766 4897 232 Saturday 4888 407 94 637 53 12 10931 911 210 Sunday 4744 395 79 735 61 12 12607 1051 210
Total 50449 4204 138 6392 533 18 82304 6859 225
Annual Avg Monthly Avg Daily Annual Avg Monthly Avg Daily Annual Avg Monthly Avg DailyWeekday $462388 $38532 $1828 $51411 $4284 $203 $410977 $34248 $1624Saturday $59904 $4992 $1152 $6230 $519 $120 $53674 $4473 $1032Sunday $68932 $5744 $1149 $6460 $538 $108 $62472 $5206 $1041
Total $591224 $49269 $1620 $64101 $5342 $176 $527123 $43927 $1444
Passengers per Revenue Hour
Subsidy per Passenger
Cost per Revenue Hour
Farebox Recovery
Weekday 81 $1007 $9212 111Saturday 77 $1098 $9401 104Sunday 65 $1317 $9381 94
Total 79 $1045 $9250 108
Passengers Revenue Hours Operating CostsPassenger
RevenueOperating Subsidy
Passengers per Revenue Hour
Subsidy per Passenger
Cost per Revenue Hour
Farebox Recovery
FY 2015 60906 6585 $569962 $65747 $504215 92 $828 $8656 115FY 2016 55610 6591 $590663 $73164 $517499 84 $931 $8961 124FY 2017 50449 6392 $591224 $64101 $527123 79 $1045 $9250 108
Histo
ric Tr
ends
FY 20
161
7 DAT
A
Passengers Revenue Hours Revenue Miles
Operating Costs Passenger Revenue Operating Subsidy
55543 60906
55610 50449
0
10000
20000
30000
40000
50000
60000
70000
FY 2013 FY 2014 FY 2015 FY 2016 FY 2017
Passengers
5734
6585 6591 6392
520054005600580060006200640066006800
FY 2013 FY 2014 FY 2015 FY 2016 FY 2017
Revenue Hours
$522978
$569962
$590663 $591224
$480000
$500000
$520000
$540000
$560000
$580000
$600000
FY 2013 FY 2014 FY 2015 FY 2016 FY 2017
Operating Costs
97 92 84 79
00
20
40
60
80
100
120
140
FY 2013 FY 2014 FY 2015 FY 2016 FY 2017
Passengers per Revenue Hour
$851 $828 $931
$1045
$000$200$400$600$800
$1000$1200$1400
FY 2013 FY 2014 FY 2015 FY 2016 FY 2017
Subsidy per Passenger
$9121 $8656 $8961 $9250
$0
$50
$100
$150
$200
FY 2013 FY 2014 FY 2015 FY 2016 FY 2017
Cost per Revenue Hour
228Local Connector
Days of Service Wkdy Sa SuAvg Freq (Wkdy Peak) 60 min
Avg Freq (Wkdy Non-Peak) 60 minAvg Freq (Wked) 60 min
FY 2017 Farebox Recovery 11 transfer (to route) 17
Clipper usage 15
Annual Avg Monthly Avg Daily Annual Avg Monthly Avg Daily Annual Avg Monthly Avg DailyWeekday 57316 4776 227 7175 598 28 65884 5490 260 Saturday 8218 685 158 1331 111 26 13020 1085 250 Sunday 5806 484 97 1536 128 26 15023 1252 250
Total 71340 5945 195 10042 837 28 93926 7827 257
Annual Avg Monthly Avg Daily Annual Avg Monthly Avg Daily Annual Avg Monthly Avg DailyWeekday $646194 $53850 $2554 $80857 $6738 $320 $565337 $47111 $2235Saturday $120205 $10017 $2312 $12568 $1047 $242 $107637 $8970 $2070Sunday $138407 $11534 $2307 $10487 $874 $175 $127920 $10660 $2132
Total $904806 $75401 $2479 $103912 $8659 $285 $800894 $66741 $2194
Passengers per Revenue Hour
Subsidy per Passenger
Cost per Revenue Hour
Farebox Recovery
Weekday 80 $986 $9006 125Saturday 62 $1310 $9030 105Sunday 38 $2203 $9011 76
Total 71 $1123 $9010 115
Passengers Revenue Hours Operating CostsPassenger
RevenueOperating Subsidy
Passengers per Revenue Hour
Subsidy per Passenger
Cost per Revenue Hour
Farebox Recovery
FY 2015 15287 2828 $239879 $18274 $221605 54 $1450 $8482 76FY 2016 17522 3185 $280634 $28092 $252542 55 $1441 $8812 100FY 2017 71340 10042 $904806 $103912 $800894 71 $1123 $9010 115
Histo
ric Tr
ends
FY 20
161
7 DAT
A
Passengers Revenue Hours Revenue Miles
Operating Costs Passenger Revenue Operating Subsidy
5854 15287 17522
71340
01000020000300004000050000600007000080000
FY 2013 FY 2014 FY 2015 FY 2016 FY 2017
Passengers
970
2828 3185
10042
0
2000
4000
6000
8000
10000
12000
FY 2013 FY 2014 FY 2015 FY 2016 FY 2017
Revenue Hours
$85183
$239879 $280634
$904806
$0
$200000
$400000
$600000
$800000
$1000000
FY 2013 FY 2014 FY 2015 FY 2016 FY 2017
Operating Costs
60 54 55 71
00
20
40
60
80
100
120
140
FY 2013 FY 2014 FY 2015 FY 2016 FY 2017
Passengers per Revenue Hour$1358
$1450 $1441
$1123
$000$200$400$600$800
$1000$1200$1400
FY 2013 FY 2014 FY 2015 FY 2016 FY 2017
Subsidy per Passenger
$8779 $8482 $8812 $9010
$0
$50
$100
$150
$200
FY 2013 FY 2014 FY 2015 FY 2016 FY 2017
Cost per Revenue Hour
233Local Connector
Days of Service Wkdy Sa SuAvg Freq (Wkdy Peak) 60 min
Avg Freq (Wkdy Non-Peak) 60 minAvg Freq (Wked) 60 min
FY 2017 Farebox Recovery 13 transfer (to route) 16
Clipper usage 10
Annual Avg Monthly Avg Daily Annual Avg Monthly Avg Daily Annual Avg Monthly Avg DailyWeekday 35589 2966 141 3306 276 13 38809 3234 153 Saturday 3911 326 75 490 41 9 5829 486 112 Sunday 3298 275 55 566 47 9 6726 561 112
Total 42798 3567 117 4363 364 12 51364 4280 141
Annual Avg Monthly Avg Daily Annual Avg Monthly Avg Daily Annual Avg Monthly Avg DailyWeekday $302758 $25230 $1197 $42450 $3538 $168 $260308 $21692 $1029Saturday $44829 $3736 $862 $5018 $418 $97 $39811 $3318 $766Sunday $51616 $4301 $860 $4533 $378 $76 $47083 $3924 $785
Total $399203 $33267 $1094 $52001 $4333 $142 $347202 $28934 $951
Passengers per Revenue Hour
Subsidy per Passenger
Cost per Revenue Hour
Farebox Recovery
Weekday 108 $731 $9158 140Saturday 80 $1018 $9141 112Sunday 58 $1428 $9118 88
Total 98 $811 $9151 130
Passengers Revenue Hours Operating CostsPassenger
RevenueOperating Subsidy
Passengers per Revenue Hour
Subsidy per Passenger
Cost per Revenue Hour
Farebox Recovery
FY 2015 50342 4366 $371602 $52526 $319076 115 $634 $8512 141FY 2016 49494 4384 $388005 $59296 $328709 113 $664 $8851 153FY 2017 42798 4363 $399203 $52001 $347202 98 $811 $9151 130
Histo
ric Tr
ends
FY 20
161
7 DAT
A
Passengers Revenue Hours Revenue Miles
Operating Costs Passenger Revenue Operating Subsidy
39956
50422 50342 49494 42798
0
10000
20000
30000
40000
50000
60000
FY 2013 FY 2014 FY 2015 FY 2016 FY 2017
Passengers
3981
4144
4366 4384 4363
370038003900400041004200430044004500
FY 2013 FY 2014 FY 2015 FY 2016 FY 2017
Revenue Hours
$350499
$378792 $371602
$388005 $399203
$320000$330000$340000$350000$360000$370000$380000$390000$400000$410000
FY 2013 FY 2014 FY 2015 FY 2016 FY 2017
Operating Costs
100
122 115 113 98
00
20
40
60
80
100
120
140
FY 2013 FY 2014 FY 2015 FY 2016 FY 2017
Passengers per Revenue Hour
$760 $661 $634 $664
$811
$000$200$400$600$800
$1000$1200$1400
FY 2013 FY 2014 FY 2015 FY 2016 FY 2017
Subsidy per Passenger
$8805 $9142 $8512 $8851 $9151
$0
$50
$100
$150
$200
FY 2013 FY 2014 FY 2015 FY 2016 FY 2017
Cost per Revenue Hour
245Local Connector
Days of Service Wkdy Sa SuAvg Freq (Wkdy Peak) 60 min
Avg Freq (Wkdy Non-Peak) 60 minAvg Freq (Wked) 60 min
FY 2017 Farebox Recovery 15 transfer (to route) 13
Clipper usage 13
Annual Avg Monthly Avg Daily Annual Avg Monthly Avg Daily Annual Avg Monthly Avg DailyWeekday 41761 3480 165 3014 251 12 28706 2392 113 Saturday 4220 352 81 620 52 12 5778 482 111 Sunday 3785 315 63 715 60 12 6667 556 111
Total 49766 4147 136 4349 362 12 41152 3429 113
Annual Avg Monthly Avg Daily Annual Avg Monthly Avg Daily Annual Avg Monthly Avg DailyWeekday $271762 $22647 $1074 $44873 $3739 $177 $226889 $18907 $897Saturday $55697 $4641 $1071 $6217 $518 $120 $49480 $4123 $952Sunday $64137 $5345 $1069 $5878 $490 $98 $58259 $4855 $971
Total $391596 $32633 $1073 $56968 $4747 $156 $334628 $27886 $917
Passengers per Revenue Hour
Subsidy per Passenger
Cost per Revenue Hour
Farebox Recovery
Weekday 139 $543 $9016 165Saturday 68 $1173 $8988 112Sunday 53 $1539 $8970 92
Total 114 $672 $9004 145
Passengers Revenue Hours Operating CostsPassenger
RevenueOperating Subsidy
Passengers per Revenue Hour
Subsidy per Passenger
Cost per Revenue Hour
Farebox Recovery
FY 2015FY 2016 2184 227 $19695 $3137 $16558 96 $758 $8695 159FY 2017 49766 4349 $391596 $56968 $334628 114 $672 $9004 145
Histo
ric Tr
ends
FY 20
161
7 DAT
A
Passengers Revenue Hours Revenue Miles
Operating Costs Passenger Revenue Operating Subsidy
2184
49766
0
10000
20000
30000
40000
50000
60000
FY 2013 FY 2014 FY 2015 FY 2016 FY 2017
Passengers
227
4349
0
1000
2000
3000
4000
5000
FY 2013 FY 2014 FY 2015 FY 2016 FY 2017
Revenue Hours
$19695
$391596
$0
$100000
$200000
$300000
$400000
$500000
FY 2013 FY 2014 FY 2015 FY 2016 FY 2017
Operating Costs
96 114
00
20
40
60
80
100
120
140
FY 2013 FY 2014 FY 2015 FY 2016 FY 2017
Passengers per Revenue Hour
$758 $672
$000$200$400$600$800
$1000$1200$1400
FY 2013 FY 2014 FY 2015 FY 2016 FY 2017
Subsidy per Passenger
$8695 $9004
$0
$50
$100
$150
$200
FY 2013 FY 2014 FY 2015 FY 2016 FY 2017
Cost per Revenue Hour
251Local Connector
Days of Service Wkdy Sa SuAvg Freq (Wkdy Peak) 60 min
Avg Freq (Wkdy Non-Peak) 60 minAvg Freq (Wked) 60 min
FY 2017 Farebox Recovery 11 transfer (to route) 8
Clipper usage 8
Annual Avg Monthly Avg Daily Annual Avg Monthly Avg Daily Annual Avg Monthly Avg DailyWeekday 76675 6390 303 6754 563 27 95654 7971 378 Saturday 9952 829 191 1325 110 25 18630 1553 358 Sunday 8879 740 148 1528 127 25 21497 1791 358
Total 95506 7959 262 9607 801 26 135781 11315 372
Annual Avg Monthly Avg Daily Annual Avg Monthly Avg Daily Annual Avg Monthly Avg DailyWeekday $625542 $52129 $2472 $78006 $6501 $308 $547536 $45628 $2164Saturday $122485 $10207 $2355 $12104 $1009 $233 $110381 $9198 $2123Sunday $140992 $11749 $2350 $11713 $976 $195 $129279 $10773 $2155
Total $889019 $74085 $2436 $101823 $8485 $279 $787196 $65600 $2157
Passengers per Revenue Hour
Subsidy per Passenger
Cost per Revenue Hour
Farebox Recovery
Weekday 114 $714 $9262 125Saturday 75 $1109 $9246 99Sunday 58 $1456 $9225 83
Total 99 $824 $9254 115
Passengers Revenue Hours Operating CostsPassenger
RevenueOperating Subsidy
Passengers per Revenue Hour
Subsidy per Passenger
Cost per Revenue Hour
Farebox Recovery
FY 2015 97647 9172 $800242 $103081 $697161 106 $714 $8725 129FY 2016 98886 9226 $831623 $120959 $710664 107 $719 $9014 145FY 2017 95506 9607 $889019 $101823 $787196 99 $824 $9254 115
Histo
ric Tr
ends
FY 20
161
7 DAT
A
Passengers Revenue Hours Revenue Miles
Operating Costs Passenger Revenue Operating Subsidy
87073
97647 98886
95506
80000
85000
90000
95000
100000
FY 2013 FY 2014 FY 2015 FY 2016 FY 2017
Passengers
8322
9172 9226
9607
7500
8000
8500
9000
9500
10000
FY 2013 FY 2014 FY 2015 FY 2016 FY 2017
Revenue Hours
$772570
$800242
$831623
$889019
$700000
$750000
$800000
$850000
$900000
FY 2013 FY 2014 FY 2015 FY 2016 FY 2017
Operating Costs
105 106 107 99
00
20
40
60
80
100
120
140
FY 2013 FY 2014 FY 2015 FY 2016 FY 2017
Passengers per Revenue Hour
$797 $714 $719
$824
$000$200$400$600$800
$1000$1200$1400
FY 2013 FY 2014 FY 2015 FY 2016 FY 2017
Subsidy per Passenger
$9284 $8725 $9014 $9254
$0
$50
$100
$150
$200
FY 2013 FY 2014 FY 2015 FY 2016 FY 2017
Cost per Revenue Hour
257Local Connector
Days of Service WkdyAvg Freq (Wkdy Peak) 60 min
Avg Freq (Wkdy Non-Peak) 60 minAvg Freq (Wked) -
FY 2017 Farebox Recovery 12 transfer (to route) 6
Clipper usage 13
Annual Avg Monthly Avg Daily Annual Avg Monthly Avg Daily Annual Avg Monthly Avg DailyWeekday 69126 5761 273 7643 637 30 85748 7146 339 Saturday - - - - - - - - - Sunday - - - - - - - - -
Total 69126 5761 273 7643 637 30 85748 7146 339
Annual Avg Monthly Avg Daily Annual Avg Monthly Avg Daily Annual Avg Monthly Avg DailyWeekday $697953 $58163 $2759 $82621 $6885 $327 $615332 $51278 $2432Saturday $ - $ - $ - $ - $ - $ - $ - $ - $ -Sunday $ - $ - $ - $ - $ - $ - $ - $ - $ -
Total $697953 $58163 $2759 $82621 $6885 $327 $615332 $51278 $2432
Passengers per Revenue Hour
Subsidy per Passenger
Cost per Revenue Hour
Farebox Recovery
Weekday 90 $890 $9132 118Saturday - $ - $ - - Sunday - $ - $ - -
Total 90 $890 $9132 118
Passengers Revenue Hours Operating CostsPassenger
RevenueOperating Subsidy
Passengers per Revenue Hour
Subsidy per Passenger
Cost per Revenue Hour
Farebox Recovery
FY 2015 69984 6289 $546363 $73402 $472961 111 $676 $8687 134FY 2016 71429 6414 $575805 $83288 $492517 111 $690 $8977 145FY 2017 69126 7643 $697953 $82621 $615332 90 $890 $9132 118
Histo
ric Tr
ends
FY 20
161
7 DAT
A
Passengers Revenue Hours Revenue Miles
Operating Costs Passenger Revenue Operating Subsidy
35511
68515 69984 71429 69126
01000020000300004000050000600007000080000
FY 2013 FY 2014 FY 2015 FY 2016 FY 2017
Passengers
2909
5965 6289 6414 7643
0
2000
4000
6000
8000
10000
FY 2013 FY 2014 FY 2015 FY 2016 FY 2017
Revenue Hours
$263500
$555608 $546363 $575805
$697953
$0$100000$200000$300000$400000$500000$600000$700000$800000
FY 2013 FY 2014 FY 2015 FY 2016 FY 2017
Operating Costs
122 115 111 111
90
00
20
40
60
80
100
120
140
FY 2013 FY 2014 FY 2015 FY 2016 FY 2017
Passengers per Revenue Hour
$625 $721 $676 $690
$890
$000$200$400$600$800
$1000$1200$1400
FY 2013 FY 2014 FY 2015 FY 2016 FY 2017
Subsidy per Passenger
$9057 $9315 $8687 $8977 $9132
$0
$50
$100
$150
$200
FY 2013 FY 2014 FY 2015 FY 2016 FY 2017
Cost per Revenue Hour
Hdn ValleyYellow Bus
Days of Service School DaysAvg Freq (Wkdy Peak) 2 trips
Avg Freq (Wkdy Non-Peak) -Avg Freq (Wked) -
FY 2017 Farebox Recovery 26 transfer (to route) -
Clipper usage -
Annual Avg Monthly Avg Daily Annual Avg Monthly Avg Daily Annual Avg Monthly Avg DailyWeekday 9281 844 52 180 16 1 1638 149 9 Saturday - - - - - - - - - Sunday - - - - - - - - -
Total 9281 844 52 180 16 1 1638 149 9
Annual Avg Monthly Avg Daily Annual Avg Monthly Avg Daily Annual Avg Monthly Avg DailyWeekday $124763 $11342 $693 $32170 $2925 $179 $92593 $8418 $514Saturday $ - $ - $ - $ - $ - $ - $ - $ - $ -Sunday $ - $ - $ - $ - $ - $ - $ - $ - $ -
Total $124763 $11342 $693 $32170 $2925 $179 $92593 $8418 $514
Passengers per Revenue Hour
Subsidy per Passenger
Cost per Revenue Hour
Farebox Recovery
Weekday 516 $998 $69313 258Saturday - $ - $ - - Sunday - $ - $ - -
Total 516 $998 $69313 258
Passengers Revenue Hours Operating CostsPassenger
RevenueOperating Subsidy
Passengers per Revenue Hour
Subsidy per Passenger
Cost per Revenue Hour
Farebox Recovery
FY 2015FY 2016 8669 211 $140482 $25658 $114824 412 $1325 $66706 183FY 2017 9281 180 $124763 $32170 $92593 516 $998 $69313 258
Histo
ric Tr
ends
FY 20
161
7 DAT
A
Passengers Revenue Hours Revenue Miles
Operating Costs Passenger Revenue Operating Subsidy
8669 9281
0
2000
4000
6000
8000
10000
FY 2013 FY 2014 FY 2015 FY 2016 FY 2017
Passengers211
180
0
50
100
150
200
250
FY 2013 FY 2014 FY 2015 FY 2016 FY 2017
Revenue Hours$140482
$124763
$0$20000$40000$60000$80000
$100000$120000$140000$160000
FY 2013 FY 2014 FY 2015 FY 2016 FY 2017
Operating Costs
412 516
00
500
1000
1500
2000
FY 2013 FY 2014 FY 2015 FY 2016 FY 2017
Passengers per Revenue Hour
$1325
$998
$000
$200
$400
$600
$800
$1000
$1200
$1400
FY 2013 FY 2014 FY 2015 FY 2016 FY 2017
Subsidy per Passenger
$66706 $69313
$0$100$200$300$400$500$600$700$800
FY 2013 FY 2014 FY 2015 FY 2016 FY 2017
Cost per Revenue Hour
White HillYellow Bus
Days of Service School DaysAvg Freq (Wkdy Peak) 17 trips
Avg Freq (Wkdy Non-Peak) -Avg Freq (Wked) -
FY 2017 Farebox Recovery 60 transfer (to route) -
Clipper usage -
Annual Avg Monthly Avg Daily Annual Avg Monthly Avg Daily Annual Avg Monthly Avg DailyWeekday 127219 11565 707 1065 97 6 12096 1100 67 Saturday - - - - - - - - - Sunday - - - - - - - - -
Total 127219 11565 707 1065 97 6 12096 1100 67
Annual Avg Monthly Avg Daily Annual Avg Monthly Avg Daily Annual Avg Monthly Avg DailyWeekday $738585 $67144 $4103 $440896 $40081 $2449 $297689 $27063 $1654Saturday $ - $ - $ - $ - $ - $ - $ - $ - $ -Sunday $ - $ - $ - $ - $ - $ - $ - $ - $ -
Total $738585 $67144 $4103 $440896 $40081 $2449 $297689 $27063 $1654
Passengers per Revenue Hour
Subsidy per Passenger
Cost per Revenue Hour
Farebox Recovery
Weekday 1194 $234 $69325 597Saturday - $ - $ - - Sunday - $ - $ - -
Total 1194 $234 $69325 597
Passengers Revenue Hours Operating CostsPassenger
RevenueOperating Subsidy
Passengers per Revenue Hour
Subsidy per Passenger
Cost per Revenue Hour
Farebox Recovery
FY 2015FY 2016 129635 870 $579937 $385753 $194184 1491 $150 $66698 665FY 2017 127219 1065 $738585 $440896 $297689 1194 $234 $69325 597
Histo
ric Tr
ends
FY 20
161
7 DAT
A
Passengers Revenue Hours Revenue Miles
Operating Costs Passenger Revenue Operating Subsidy
129635 127219
0
20000
40000
60000
80000
100000
120000
140000
FY 2013 FY 2014 FY 2015 FY 2016 FY 2017
Passengers
870
1065
0
200
400
600
800
1000
1200
FY 2013 FY 2014 FY 2015 FY 2016 FY 2017
Revenue Hours
$579937
$738585
$0$100000$200000$300000$400000$500000$600000$700000$800000
FY 2013 FY 2014 FY 2015 FY 2016 FY 2017
Operating Costs
1491
1194
00200400600800
1000120014001600
FY 2013 FY 2014 FY 2015 FY 2016 FY 2017
Passengers per Revenue Hour
$150 $234
$000
$200
$400
$600
$800
$1000
$1200
$1400
FY 2013 FY 2014 FY 2015 FY 2016 FY 2017
Subsidy per Passenger$66698 $69325
$0$100$200$300$400$500$600$700$800
FY 2013 FY 2014 FY 2015 FY 2016 FY 2017
Cost per Revenue Hour
MARIN TRANSIT | 2018ndash2027 SHORT RANGE TRANSIT PLAN Chapter 4 Capital Plan
DRAFT 4-9
Table 4-7 Local Transit Bus Replacement Schedule
Fiscal Year (In-service)
Replacements
Total Cost
Local Share Vehicle Type Seating
Capacity Service(1)
FY 201718 10 $7710000 $1387800 40ft hybrid 39 LB
2 $1662000 $332404 35ft Electric 32 LB
FY 201819
1 $125000 $22500 24ft 20 SH
4 $1600000 $1094880 29ft XHF
(upgrade) 22 SG
FY 201920 10 $8940000 $1609200 60ft 63 LB
FY 202021 8 $1032000 $185760 24ft 20 SH
2 $850000 $153000 35ft XHF 37 MW
FY 202223
7 $5584578 $1005224 35ft hybrid 32 LB
2 $874182 $599281 29ft XHF
(upgrade) 22 SG
FY 202425 3 $1393227 $250781 35ft XHF 37 MW
FY 202526 2 $299093 $53837 24ft 20 SH
5 $2391706 $430507 35ft XHF 37 MW
FY 202627 - - - - - -
Notes (1) Service Types LB ndash Big Bus SH- Shuttle SG- Rural Stagecoach MW- Seasonal Muir Woods and School
Expansion Needs When considering service expansion vehicles are often a constraint on the amount of service that can be added Expansion vehicles are a lower priority in the regional capital plan and typically do not receive federal funds Local state or discretionary grants are required to expand fleets The capital plan does not include any expansion vehicles for the local fixed route program consistent with the current service plan
Marin Transit relies on three retired active vehicles to support operations Retired active vehicles are vehicles that are beyond their FTA-determined useful life that remain in service while their replacements are added the fleet The District intends to replace these as expansion vehicles if funding becomes available
Demand Response Vehicles
Marin Transit has 58 vehicles available for local and regional paratransit service To provide an adequate number of spare vehicles a maximum of about 46 vehicles in service Marin Transit owns 32 vehicles GGBHTD owns 14 and the contractor provides another 13 vehicles to support the operations Eleven of the 13 contractor vehicles will be replaced in early 2018 - five by the District and six by GGBHTD Two of the five replaced by the District will be replaced with smaller accessible vans These will be used for same day
Fixed-Route Passengers (incl Yellow Bus) by Month
July August September October November December January February March April May June
Prior Fiscal Year Passengers Current Fiscal Year PassengersPrior Fiscal Year Passengers Current Fiscal Year Passengers
0
80000
160000
240000
320000
244439
271284484271284
296637296637
2768532276853
252829252829
238010238010
219681219681
2097050505209705
277644277644
240773240773240773240773
284816284816
24935149492493512444392444392442 43999244439244244439439244439244244439999999244200
2600562602600 0000000260056
FISCAL YEAR
2018
Demand Response Passengers by Month
July August September October November December January February March April May June
Prior Fiscal Year Passengers Current Fiscal Year PassengersPrior Fiscal Year Passengers Current Fiscal Year Passengers
0
4000
8000
12000
16000
12 77312773
13631 1362813628 1356413564
1247712477
1206712067 1212412124118100011810
1364613646
1260912609
1359313593
12950129501277312 77312 77312 77312613131612 6133312 6133312613331277312773127731277312613
13 6311363113 631135641363113 613631311363113 6136313113564
Year-to-Date Ridership Trends
Item 3b
2
Average Systemwide Daily Passengers
Weekday Saturday Sunday
Prior Fiscal Year Average Daily Passengers Current Fiscal Year Average Daily PassengersPrior Fiscal Year Average Daily Passengers Current Fiscal Year Average Daily Passengers
0
3000
6000
9000
12000
11370113701109811098
7726772674407440
66576657
60556055
Productivity (paxhr) by Typology
1 Local T
runklin
e
2 Local B
asic
3 Local C
onnecto
r
5 R
ura
l
8 R
ecre
ational
9 D
em
and R
esponse
Prior Fiscal Year Productivity Current Fiscal Year ProductivityPrior Fiscal Year Productivity Current Fiscal Year Productivity
00
80
160
240
320
249249 252252
163163
14814 8148
9292 91918181
757 575
320320
275275
2323 2121
Monthly StatisticsMONTH
August
1 Local Trunkline Routes 35 36 71X
2 Local Basic Routes 17 22 23 23X 29 49
3 Local Connector Routes 219 228 233 245 251 257
5 Rural Routes 61 68
8 Recreational Routes 6666F
9 Demand Response Local Paratransit Novato Dial-A-Ride Rural Dial-A-Ride
Route Typologies
Item 3b
3
Fixed-Route Passengers (incl Yellow Bus) by Month
July August September October November December January February March April May June
Prior Fiscal Year Passengers Current Fiscal Year Passengers
0
80000
160000
240000
320000
244439244439
271284271284
296637296637
276853276853
252829252829
238010238010
219681219681209705209705
277644277644
240773240773
284816284816
249351249351244200244200
260056260056
282441282441
FISCAL YEAR
2018
Demand Response Passengers by Month
July August September October November December January February March April May June
Prior Fiscal Year Passengers Current Fiscal Year Passengers
0
4000
8000
12000
16000
1277312773
1363113631 1362813628 1356413564
12477124771206712067 1212412124
1181011810
1364613646
1260912609
1359313593
12950129501261312613
1356413564 1342713427
Year-to-Date Ridership Trends
Monthly Monitoring Report 11022017
Page 12Item 3b
2
Average Systemwide Daily Passengers
Weekday Saturday Sunday
Prior Fiscal Year Average Daily Passengers Current Fiscal Year Average Daily Passengers
0
3000
6000
9000
12000 11848118481161311613
73637363
67876787
6126612657395739
Productivity (paxhr) by Typology
1 L
ocal
Tru
nklin
e
2 L
ocal
Bas
ic
3 L
ocal
Con
nect
or
5 R
ural
8 R
ecre
atio
nal
9 D
eman
d R
espo
nse
Prior Fiscal Year Productivity Current Fiscal Year Productivity
00
80
160
240
320
278278 274274
174174 168168
9898 9797
7676 7676
304304
222222
2323 2222
Monthly StatisticsMONTH
September
1 Local Trunkline Routes 35 36 71X
2 Local Basic Routes 17 22 23 23X 29 49
3 Local Connector Routes 219 228 233 245 251 257
5 Rural Routes 61 68
8 Recreational Routes 6666F
9 Demand Response Local Paratransit Novato Dial-A-Ride Rural Dial-A-Ride
Route Typologies
Page 22Item 3b
3
Fixed-Route Passengers (incl Yellow Bus) by Month
July August September October November December January February March April May June
Prior Fiscal Year Passengers Current Fiscal Year Passengers
0
80000
160000
240000
320000
244439244439
271284271284
296637296637
276853276853
252829252829
238010238010
219681219681209705209705
277644277644
240773240773
284816284816
249351249351244200244200
260056260056
282441282441 282922282922
FISCAL YEAR
2018
Demand Response Passengers by Month
July August September October November December January February March April May June
Prior Fiscal Year Passengers Current Fiscal Year Passengers
0
4000
8000
12000
16000
1277312773
1363113631 1362813628 1356413564
12477124771206712067 1212412124
1181011810
1364613646
1260912609
1359313593
12950129501261312613
1356413564 13427134271373413734
Year-to-Date Ridership Trends
Monthly Monitoring Report 12082017
Page 12Item 3b
2
Average Systemwide Daily Passengers
Weekday Saturday Sunday
Prior Fiscal Year Average Daily Passengers Current Fiscal Year Average Daily Passengers
0
3000
6000
9000
120001125811258 1115111151
6043604364326432
4717471750675067
Productivity (paxhr) by Typology
1 L
ocal
Tru
nklin
e
2 L
ocal
Bas
ic
3 L
ocal
Con
nect
or
5 R
ural
8 R
ecre
atio
nal
9 D
eman
d R
espo
nse
Prior Fiscal Year Productivity Current Fiscal Year Productivity
00
70
140
210
280258258
270270
163163 161161
9696 9595
6363 7070
202202190190
2323 2121
Monthly StatisticsMONTH
October
1 Local Trunkline Routes 35 36 71X
2 Local Basic Routes 17 22 23 23X 29 49
3 Local Connector Routes 219 228 233 245 251 257
5 Rural Routes 61 68
8 Recreational Routes 6666F
9 Demand Response Local Paratransit Novato Dial-A-Ride Rural Dial-A-Ride
Route Typologies
Page 22Item 3b
3
- RFP - OampM for Fixed Route Service - Addendum 3 12-18-2017
- MV Fee Schedule
- Airporter Fee Schedule
- FY2017Performance
-
- System Performance Summary for FY 201617
-
- Fixed Route
- Yellow Bus
- Demand Response
- Other Services
-
- Performance Goals
- Ridership Trends
- FY 201718 Performance Outlook
-
- Attachment A Route Profiles
-
- Local Transit Bus Replacement Schedule
- August 2017 Monthly Monitoring Report
- September 2017 Monthly Monitoring Report
- October 2017 Monthly Monitoring Report
-
Addendum 3
8
dedicated to Marin Transit contract(s) Refer to Attachment I ndash Draft Operations and Maintenance Contract Article 2 ndash Personnel Requirements Sec 201 General Requirements for Contractor Personnel Dedication to Project Q42 Page 14 Item 13 Employee Training Please confirm whether CPR and First Aid training is a new requirement A42 No Proposers are being asked to present their initial training program for operators ldquoto Include any certifications and licensing to be included along with the initial training (CPR First Aid Class B etc)rdquo as referred to in the RFP Section 2 ndash Terms and Conditions Proposal Requirements Employee Training Q43 Page 28 Unforeseen Major Repairs Would Marin Transit identify a dollar amount such as $2000 for single maintenance items that would classify an item as an unforeseen major repair Marin Transit would be responsible for the cost of There are various parts on the fleet vehicles that exceed the cost of a transmission rebuild for example A43 No Q44 Page 8 Draft Contract b Facilities ii Would Marin Transit please remove this language from the RFP and Draft Contract Proposerrsquos are not able to require a landlord to consent to assignment of a property lease A44 No Proposerrsquos are encouraged to work closely with property managers agents or owners on how best to address this requirement Q45 Page 7 Radio Communications For package 2 services should bidders account for two-way radios vs push to talk devices due to the service area and poor cell phone reception A45 Package 1 and 2 proposers should provide a radio communication system that meets the service requirements outlined in the RFP Proposers are encouraged to obtain signal coverage area maps to include with their proposed systems that minimize or eliminate ldquodead spotsrdquo Q46 Draft Contract sect104E TermRenewal Options Please revise to require mutual agreement for any extension of the Agreement with pricing to be negotiated by the parties in order to allow for price adjustments to reflect changes in Contractorrsquos cost to operate the service A46 The RFP and contract address changes to Contractorrsquos cost to operate service though the two-tiered (variable hourly rate and monthly fixed cost) structure and the
Addendum 3
9
Possible Rate Adjustments contract provision (304f) The optional contract extension terms will not be made subject to renegotiation Q47 Draft Contract sect523 ndashAssignment Please delete ldquoAssignment provision extends to any purchase merger or consolidation change in control etcrdquo from the draft contract as a change in stockholders of a contractor shall not require consent or result in a default or termination of the Agreement A47 No This contract provision does not require consent for a change in a contractorrsquos stockholders but instead a change in contract assignment resulting from a change in stockholders Q48 Draft Contract sect408 ndashTermination ndash Would Marin Transit please consider modifying this requirement to provide a minimum of 60 daysrsquo notice of cancellation in order to provide the contractor with enough time to complete obligations required such as WARN Act lease terminations etc A48 No Marin Transit prefers the 30-day notice period Q49 Draft Contract sect406 ndash Indemnity Would Marin Transit please consider revising indemnification to limit the indemnity to actions or omissions of the Contractor or its employees agents subcontractors etc The Contractor should not be liable for items outside of its control A49 No Marin Transit is not considering a revision to the indemnification clause at this time Q50 General Draft Contract Would Marin Transit please add a force majeure provision to relieve both parties from performance under the Contract for circumstances beyond their reasonable control (acts of God war labor strikes or disputes terrorism etc) The contractor should be excused from performance under the contract for circumstances outside of its control A50 No See response for Q38 Q51 General Draft Contract Would Marin Transit include a provision that provides for price adjustments if Contractorrsquos revenue decreases or Contractorrsquos costs increase as a result of (i) changes to the scope of work service hours requested by the Authority (ii) changes in laws rules regulations etc applicable to the services to be provided by Contractor andor (iii) wage increases necessary for Contractor to be able to recruit and retain qualified employees as a result of an increase in the minimum wage in the County or surrounding jurisdictions If the parties are unable to agree on a rate adjustment then either party may terminate the contract upon 120 daysrsquo written notice to the other party Doing so would
Addendum 3
10
provide protection for the contractor to cover changes requested by the District or matters that were not contemplated at the time of Contractorrsquos proposal A51 No The RFP and contract address potential changes to scope of work changes in lawrulesregulations and requires proposers to consider wages and benefits to recruit and attract qualified employees without requiring contract price renegotiation
Attachments MV Transportation Fees and Payment Schedule (Revised November 20 2017)
Marin Airporter Fees and Payment Schedule (Revised November 20 2017) System Performance Summary for FY201617
August 2017 Monthly Monitoring Report September 2017 Monthly Monitoring Report October 2017 Monthly Monitoring Report Local Transit Bus Replacement Schedule
171801
EXHIBIT ldquoCrdquo
FEES AND PAYMENT SCHEDULE (revised)
Contractor shall bill Marin Transit monthly for service hours provided Additional hours shall only be used with approval from Marin Transit Proper back-up including TransTrack reports showing hours miles and fuel usage must be attached to invoices For Fiscal Year 1718 Contractor shall provide proof of wage increase (eg month over month payroll comparisons)
Service Cost per Service Hour
Contract Service Hours
Contract Maximum Obligation
Total year 1 January 30 2012 to December 31 2012 13881 $737832 Total year 2 January 1 2013 to December 31 2013 16686 $892890 Total year 3 January 1 2014 to December 31 2014 20913 $1297726 Total year 4 January 1 2015 to December 31 2015 27250 $1715566
Fixed Administrative Costs $277094 West Marin StagecoachMuir Woods Shuttle $3682 10750 $395815 Supplemental Service $6601 3750 $247538 Start-Up Costs $47571 First Half Year 5 January 1 2016 to June 30 2016 14500 $968018
Fixed Administrative Costs $975995 West Marin StagecoachMuir Woods Shuttle $4094 21500 $880210 Local Fixed Route $4094 14000 $573160 Supplemental Service $6814 7500 $511050 Fiscal Year 1617 July 1 2016 to June 30 2017 43000 $2940415
Fixed Administrative Costs1 $1137363 West Marin StagecoachMuir Woods Shuttle $4439 21500 $954455 Local Fixed Route $4439 14000 $621505 Supplemental Service $7018 7500 $526350 Fiscal Year 1718 July 1 2017 to June 30 2018 43000 $3239674
1 Includes the addition of one Road Supervisor position and one Level A Mechanic Contractor shall credit Marin Transit $5900 per month for the wage benefit and tax cost of the Level A Mechanic from July 1 2017 until the date of hire of this position
Item 10
404
asmith
Typewritten Text
MV Transportation
171830
EXHIBIT ldquoBrdquo
FEES AND PAYMENT SCHEDULE (revised)
Cost per Revenue Hour Community Shuttle Service
Base Years Option Years FY1314 FY1415 FY1516 FY1617 FY1718
Rate $7078 $6866 $7072 $7284 $7614 Maximum Revenue Hours 40000 40000 40000 60000 60000
In addition to payment of a cost per revenue hour District will directly reimburse Contractor for lease payments associated with storage of heavy duty transit buses beginning June 2016 Contractor must substantiate lease expense by providing District with a copy of the lease agreement In no event will lease payments exceed $1800 per month without written approval of District
Contractor to provide proof of wage increase (eg month over month payroll comparisons)
Item 11
410
asmith
Typewritten Text
Marin Airporter
asmith
Typewritten Text
asmith
Typewritten Text
1
System Performance Summary for FY 201617
This report summarizes the unaudited operational performance of Marin Transit local transit services for FY 201617 and compares these results to the Districtrsquos route level performance goals identified in the Short-Range Transit Plan The report provides a detailed route level assessment of all Marin Transit services operating in FY 201617 On June 12 2016 Marin Transit implemented a major service change with a 19 increase in local fixed-route service levels and a restructuring of routes throughout the County This FY 201617 report includes data from a full year of the new service plan There were a few additional changes to transit services during FY 201617 including the following In July 2016 the District launched a new general public dial-a-ride service between Point Reyes Station and Novato
The service provides curb-to-curb pick-up and drop-off and only operates on the second Monday of each month The closure of Hwy 1 in early 2017 delayed the start of the Muir Woods Shuttle season which typically begins in April
The Shuttle season began on May 13 resulting in 12 fewer days of service A number of recent changes to Marin Transitrsquos contracts and agreements have had an impact on the Districtrsquos financials These include the following The District completed a procurement for paratransit services in 2015 The new contract went into effect on January 1
2016 and provides significantly lower rates for paratransit and dial-a-ride services This report provides data from the first full year of the new contract
Effective February 1 2017 the District increased the subsidy paid to Catch-A-Ride service providers for operating wheelchair accessible vehicles to further incentivize the availability of accessible vehicles for Catch-A-Ride trips
For FY 201617 Marin Transit updated the methodology for calculating revenue hours for demand response services to be more consistent with the National Transit Database definitions These include local paratransit and the Novato Dial-A-Ride This change has reduced the amount of time that is considered as part of revenue hours Overall Marin Transit provided over 32 million unlinked passenger trips in FY 201617 with over 235000 revenue hours of service Compared to FY 201516 these numbers represent a decrease in unlinked passenger trips (-35) and an increase in revenue hours (+82) Growth in service was primarily on local fixed-route services due to the June 2016 changes Some of this growth was partially offset by decreases in hours on local paratransit and Route 122 The system-wide productivity rate was 136 riders per hour about 108 lower than FY 201617 Passenger revenues increased slightly (+06) Due to higher operating costs passenger subsidy increased by 127 to a system-wide average of $678 per passenger Fixed Route Fixed Route operations carried over 29 million unlinked passenger trips in FY 201617 with 178052 revenue hours These totals represent 91 of the Districtrsquos total trips and 76 of revenue hours Compared to FY 201516 unlinked passenger trips on fixed route services decreased by 35 and revenue hours increased by 136 Overall productivity was 164 passengers per hour approximately 150 lower than the 193 mark last fiscal year Compared to FY 201516 almost all fixed-route typologies experienced a decrease in overall ridership These include Local Basic (-120) Local Connector (-127) Supplemental (-32) and Partnership (-25) However some services experienced a modest increase in ridership compared to last year including Local Trunkline (+77) the Muir Woods Shuttle (+44) and Rural (+48)
2
Total passenger revenue decreased slightly (-11) in FY 201617 compared to last year Increases in operating costs resulted in a decrease in overall farebox recovery from 199 last year to 176 in FY 201617 Only the Local Trunkline and Recreational (Muir Woods Shuttle) typologies experienced an overall increase in both passenger revenue and farebox recovery Yellow Bus In FY 201617 yellow bus service for the Ross Valley School District carried over 136000 unlinked passenger trips a decrease of 13 compared to last year and operated 1245 revenue hours These totals represent 4 of the Districtrsquos total ridership and 1 of revenue hours Passenger revenues increased 150 due to higher pass prices This boost in revenues did not keep pace with the rise in operating costs and overall farebox recovery decreased from 571 last year to 548 in FY 201617 Demand Response Demand Response programs carried 124325 unlinked passenger trips in FY 201617 and provided 55191 revenue hours of service These totals represent 4 of the Districtrsquos total trips and 24 of revenue hours Compared to FY 201516 unlinked passenger trips on demand response services decreased by 39 (-5096 trips) and revenue hours decreased by 61 The more significant reduction in revenue hours compared to passengers is likely due to the new method for calculating those hours Overall productivity was 23 passengers per hour slightly higher than last fiscal year Ridership on local paratransit and the Novato Dial-A-Ride decreased in FY 201617 compared to the prior year Rural Dial-A-Ride experienced growth in ridership mainly because these services were only recently introduced These include the Dillon BeachTomales and Point Reyes Station Dial-A-Ride Passenger revenues for demand response services dropped slightly (-15) compared to last year However lower operating costs due to the new contract rate resulted in reductions in subsidies and an increase in farebox recovery Other Services Other Marin Access Mobility Management services include the Volunteer Driver and Catch-A-Ride programs In FY 201617 these programs provided 30547 unlinked passenger trips about 1 of the Districtrsquos total trips Compared to the prior fiscal year ridership decreased by 77 mostly due to the Catch-A-Ride program However passenger revenues increased by 90 primarily on the Catch-A-Ride program This increase may have been due to riders taking longer trips Performance Goals
The 2016-2025 Short-Range Transit Plan identifies fifteen different goals and associated metrics that staff use to evaluate system performance Performance goals at the route level are measured in both productivity (unlinked passengers per hour and per trip) and cost effectiveness (subsidy per unlinked passenger trip) These measures follow the service typologies updated in the most recent Short Range Transit Plan Table 1 below summarizes route level performance goals by typology Marin Transit has not identified productivity or cost-effectiveness goals for the Yellow Bus or Partnership service typologies Table 2 provides a detailed summary of annual FY 201617 performance data by program route and service typology
3
Table 1 Productivity and Subsidy Goals by Service Typology
Service Typology Routes Unlinked Passenger
Trips per Hour (at or above)
Subsidy per Passenger Trip
(at or below)
Local Trunkline 35 36 71X 25 $300
Regular Local 17 22 23 23X 29 49 20 $500
Local Connector 219 228 233 245 251 257 8 $800
Supplemental 113 115 117 119 125 139 145 151 154 20 per trip $300
Rural 61 68 4 $1200
Recreational 66 (Muir Woods Shuttle) 25 $300
Demand Response Local DAR Novato DAR Dillon BeachTomales DAR Point Reyes DAR
2 $3000
Using the productivity goals identified in Table 1 all the service typology groups except for Local Basic met their unlinked passengers per hour goal overall Twelve individual routes and two demand response services did not meet their productivity targets These include Routes 17 22 23 23X 29 49 71X 115 125 139 219 228 the Dillon BeachTomales Dial-A-Ride and the Point Reyes Dial-A-Ride In the previous fiscal year ten routes did not meet this target Figure 1 provides FY 201617 productivity levels and respective productivity goals by service typology and at the route level Route 35 was the most productive fixed-route service carrying an average of 286 passengers per hour Route 151 (Hamilton ndash San Jose MS ndash Novato HS - San Marin HS) was the best performing supplemental school route with 428 passengers per trip and met its subsidy target at $150 per passenger Route 228 had the highest growth in productivity (+291) due to the addition of weekday service in June 2016 In terms of cost effectiveness the Supplemental School Rural and Recreational services collectively met their goals In total 17 individual routes and two demand response services did not meet their subsidy target (Routes 17 22 23 23X 29 35 36 49 71X 219 228 233 251 257 115 125 139 Local Paratransit and Novato Dial-A-Ride) This is an increase from the 13 routes and three demand response services reported for FY 201516 Figure 2 provides a breakdown of FY 201617 subsidy levels and respective subsidy goals by service typology and at the individual route level Ridership Trends
In FY 201617 there was an overall 35 decline in fixed-route ridership compared to the previous year despite increases to service levels One of the major contributors to this decline was the delayed start of the 2017 Muir Woods Shuttle season that reduced the amount of service provided by 76 The overall decrease in ridership is relatively consistent with trends among bus operators nationwide and in the Bay Area According to the National Transit Database bus ridership declined 66 nationwide during FY 201617 compared to the prior year Within in the Bay Area peer agencies experienced ridership declines between 6 and 12 These include Golden Gate Transit Sonoma County Transit SamTrans and Napa VINE One of the biggest external factors that may have contributed to this trend is weather Rainfall in FY 201617 almost doubled over the prior year Weather can have a significant impact on travel decisions affecting whether a person makes a trip as well as how that person ultimately makes the trip It can also impact operations and cause detours major delays and canceled trips
4
In FY 201617 there was a 34 increase in the number of canceled trips Almost half of these canceled trips occurred in February due to heavy rains that caused flooding and school closures In June 2016 Marin Transit implemented a major service change One of the main goals of the service restructuring was to reduce the need to transfer by providing faster and more direct connections While this approach improves the system for riders it has implications in terms of how ridership is counted and on performance metrics The number of passengers is measured in terms of unlinked passenger trips Each time a person boards a bus is counted as a separate trip regardless of whether that person is transferring from another bus Reducing the amount of transfers needed to complete a riderrsquos journey reduces the number of unlinked trips Replacing trips that require a transfer with direct trips to destinations does not change the number of individual riders using the system which is defined as linked passenger trips In FY 201617 there was a 75 overall decrease in the number of transfers for passengers using cash to pay their original fare Some of this decline reflects the systemwide decrease in ridership The transfer ratio is defined as the number of boarding trips (unlinked passenger trips) divided by the number of originating trips (linked passenger trips) This ratio can be used to evaluate the impact of transfers on ridership independent of other factors In FY 201617 the overall transfer ratio dropped 38 from 136 to 131 When estimating linked passenger trips based on these ratios the number of individual Marin Transit passengers in FY 201617 remained relatively constant compared to last year Demand for Marin Access mobility management programs declined overall 47 from FY 201516 to FY 201617 Changes in ridership varied from program to program The largest decline was on Catch-A-Ride which experienced a 129 decrease in ridership Local paratransit and Novato Dial-A-Ride ridership may have been affected by many of the same external factors as fixed route transit particularly weather It is also possible that paratransit clients have started to shift some or all their trips to services that are not provided by Marin Transit These may include Non-Emergency Medical Transportation services arranged by managed care organizations Private transportation
providers hired under contract to institutions typically served by paratransit (such as adult day care centers) Trips taken on Uber or Lyft and Volunteer transportation services that may be supported by Marin Transit in some way but whose ridership is not
reported in the Districtrsquos performance statistics Furthermore staff attributed much of the previous growth in the Marin Access program to the Catch-A-Ride program This program experienced a 473 increase in ridership between FY 201314 and FY 201415 Towards the end of FY 201415 On the Move one of the largest taxi companies in Marin went out of business To this day service is limited during hours of peak demand and in certain service areas especially Novato Therefore FY 201617 ridership on Catch-A-Ride may reflect two factors These include a slowdown in attracting new customers and a reduction in service availability following On the Moversquos closure Table 2 summarizes the factors that can influence ridership numbers year-over-year and qualitatively evaluates their impact
5
Table 2 Factors Impacting Ridership Comparison
Factor FY 201516 FY 201617 Impact
Calendar
School Days 181 183 --
Weekdays 256 253
Weekends amp Holidays 110 111 --
Muir Woods Shuttle 113 104
Transfer Ratio (ratio of unlinked to linked trips) 136 131
Service Disruptions Canceled service (trips) 200 268
Major detourclosure (days) (1) 18 29
Rainfall (inches) 2928 5653
Gas Prices $298 $291 --
Unemployment Rate 32 32 -- Notes (1) Data on major detours and closure collected starting January 2016 Comparison includes the months of January through June FY 201718 Performance Outlook
In June 2016 Marin Transit implemented a major service change aimed in part to help underperforming routes meet established performance standards Staff has continued to monitor service performance and has made minor adjustments to improve on-time performance and cancel low-ridership trips In early 2018 staff is planning a comprehensive assessment of service performance since the June 2016 service changes This effort will include data from a recently completed onboard survey from April 2017 on passenger origins and destinations and a 100 passenger ridecheck The ridecheck will provide data on stop-level ridership activity for each route The assessment will use this analysis to recommend service changes to improve underperforming routes There are several unknowns that may also affect route performance primarily in terms of operating costs The District relies on its contractors to either lease or own property to store and maintain the vehicles needed to operate service For contractors that do not own suitable property finding and leasing these types of facilities in Marin County is challenging and expensive Recent surveys of current and potential service providers identified securing a facility as the most significant factor in determining their interest in bidding on Marin Transit services ability to provide the service and proposed pricing Marin Transit has been actively working to secure and develop its own operations and maintenance facility A District-owned facility will eliminate the need for potential service providers to lease property and lower operating costs It may also improve efficiency by reducing deadhead or non-revenue time when vehicles are traveling to and from the yard and further lower the Districtrsquos contract rates In late 2017 Marin Transit will release for bid over half of its fixed-route service and there are many uncertainties that may affect the outcome The tight labor market in Marin County and the greater Bay Area has made it difficult for service providers to hire and retain employees Potential contractors are required to secure property in a County with limited real estate opportunities If the District provides its own facility there will be more interest among potential bidders and more competitive rates
6
Table 3 System-wide Performance Statistics FY 201617 (unaudited)
Route Passengers Revenue
Hours Operating
Costs Passenger
Revenue Pass Trips Per
Rev Hr (Trip) Subsidy Per
Passenger Farebox
Recovery Fixed Route 2925522 178052 $20173419 $3550259 164 $568 176 Local Trunkline 1122188 44393 $6252940 $1263870 253 $445 202
35 658869 23052 $3234308 $729775 286 $380 226 36 342178 13636 $1901678 $369132 251 $448 194
71X 121141 7705 $1116954 $164963 157 $786 148 Local Basic 989500 65117 $7451946 $1221298 152 $630 164
17 247998 14757 $2076786 $319761 168 $708 154 22 215758 17553 $1619319 $273059 123 $624 169 23 199150 11065 $1508659 $246908 180 $634 164
23X 49255 3445 $473413 $57438 143 $845 121 29 40103 3707 $509475 $49634 108 $1147 97 49 237236 14590 $1264294 $274498 163 $417 217
Local Connector 378985 42396 $3873801 $461426 89 $900 119 219 50449 6392 $591224 $64101 79 $1045 108 228 71340 10042 $904806 $103912 71 $1123 115 233 42798 4363 $399203 $52001 98 $811 130 245 49766 4349 $391596 $56968 114 $672 145 251 95506 9607 $889019 $101823 99 $824 115 257 69126 7643 $697953 $82621 90 $890 118
Supplemental 179947 3963 $514380 $110503 454 (286) $224 215 113 16829 317 $42180 $12227 530 (315) $178 290 115 14021 637 $87534 $9504 220 (185) $557 109 117 34820 640 $81509 $17140 544 (284) $185 210 119 27161 374 $56273 $18859 727 (313) $138 335 125 13757 600 $72469 $11570 229 (193) $443 160 139 6414 253 $33182 $6635 253 (179) $414 200 145 16406 191 $25426 $7258 861 (372) $111 285 151 36801 594 $73842 $18463 620 (428) $150 250 154 13738 358 $41965 $8847 384 (255) $241 211
Recreational 122116 4316 $473726 $249748 283 $183 527 66 122116 4316 $473726 $249748 283 $183 527
Rural 112926 16172 $1422683 $122407 70 $1151 86 61 36328 5492 $475778 $39959 66 $1200 84 68 76598 10680 $946905 $82448 72 $1129 87
Partnership 19860 1696 $183943 $121007 117 $317 658 122 19860 1696 $183943 $121007 117 $317 658
Yellow Bus 136500 1245 $863348 $473066 1096 (448) $286 548 Hidden Valley 9281 180 $124763 $32170 516 (265) $998 258
White Hill 127219 1065 $738585 $440896 1194 (471) $234 597 Demand Response 124325 55191 $4571296 $236980 23 $3486 52
Local Paratransit 119673 53011 $4404928 $226387 23 $3492 51 Novato DAR 4057 1856 $150815 $8815 22 $3487 58
Dillon Beach DAR 488 260 $12511 $1356 19 $2285 108 Pt Reyes DAR 107 64 $3042 $422 17 $2447 139
Other Services 30547 - $511316 $41956 - $1537 82 Volunteer Driver(1) 16162 - $152714 - - $945 -
Catch-A-Ride(1) 14385 - $358602 $41956 - $2201 117 Total 3216894 234489 $26118572 $4302085 136 $678 165
Notes Values in red indicate performance that does not meet District
7
Figure 1 FY 201617 Passengers per Revenue Hour by Route
0
5
10
15
20
25
30
35
40
45
50Lo
cal T
runk
line T
otals 35 36 71
X
Loca
l Bas
ic To
tals 17 22 23 23X 29 49
Loca
l Con
necto
r Tot
als 219
228
233
245
251
257
Supp
lemen
tal T
otals 11
311
511
711
912
513
914
515
115
4
Recre
ation
al To
tals 66
Rura
l Tot
als 61 68
Dem
and R
espo
nse T
otals
Loca
l Par
atra
nsit
Nova
to D
ARDi
llon D
ARPt
Reye
s DAR
Pass
enge
rs p
er R
even
ue H
our
meets goalservice standard
does not meet goal
school routes show passengers per trip
8
Figure 2 FY 201617 Subsidy per Passenger by Route
$0
$5
$10
$15
$20
$25
$30
$35
$40
Loca
l Tru
nklin
e Tot
als 35 36 71X
Loca
l Bas
ic To
tals 17 22 23 23X 29 49
Loca
l Con
necto
r Tot
als 219
228
233
245
251
257
Supp
lemen
tal T
otals 11
311
511
711
912
513
914
515
115
4
Recre
ation
al To
tals 66
Rura
l Tot
als 61 68
Dem
and R
espo
nse T
otals
Loca
l Par
atra
nsit
Nova
to D
ARDi
llon D
ARPt
Reye
s DAR
Subs
idy p
er P
asse
nger
does not meet goal
service standard
meets goal
9
Attachment A Route Profiles 17 Sausalito ndash Marin City ndash Mill Valley ndash San Rafael 22 San Rafael Transit Center ndash San Anselmo ndash Marin City 23 Fairfax ndash San Anselmo ndash San Rafael ndash Canal 23X Manor ndash Fairfax ndash San Anselmo ndash San Rafael ndash Canal 29 Canal ndash San Rafael Transit Center ndash Larkspur ndash College of Marin ndash Marin General 35 Canal ndash San Rafael Transit Center ndash Marin Civic Center ndash Northgate Mall ndash Novato 36 Canal ndash San Rafael Transit Center ndash Marin City 49 Novato ndash Ignacio ndash Hamilton ndash Marin Civic Center ndash San Rafael Transit Center 61 West Marin Stagecoach (Sausalito ndash Marin City ndash Mill Valley ndash Stinson Beach ndash Bolinas) 66 Muir Woods Shuttle 68 West Marin Stagecoach (San Rafael Transit Center ndash San Anselmo ndash Pt Reyes Station ndash Inverness) 71X Novato ndash San Rafael Transit Center ndash Marin City ndash Sausalito 113 Redwood High School ndash Paradise Cay 115 Sausalito ndash Willow Creek ndash Marin City ndash Mill Valley ndash St Hilary 117 Neil Cummins Hall Middle School ndash E Corte Madera ndash Cove School 119 Tiburon ndash Belvedere ndash Redwood High School 122 San Rafael Transit Center ndash San Anselmo ndash College of Marin 125 Lagunitas ndash Sir Francis Drake HS ndash San Anselmo ndash San Rafael 139 Terra Linda High School ndash Lucas Valley 145 Terra Linda High School ndash San Rafael 151 Hamilton ndash Ignacio ndash San Jose Middle School ndash Novato High School ndash San Marin High School 154 Olive ndash San Marin High School ndash Sinaloa Middle School ndash Novato 219 Tiburon ndash Strawberry 228 San Rafael Transit Center ndash Larkspur ndash San Anselmo ndash Fairfax 233 Santa Venetia ndash Marin Civic Center ndash San Rafael Transit Center 245 San Rafael Transit Center ndash Northgate Mall ndash Kaiser ndash Smith Ranch Road 251 San Marin ndash Novato ndash Vintage Oaks ndash IVC ndash Ignacio ndash Hamilton 257 San Rafael ndash Northgate Mall ndash Kaiser ndash Marinwood ndash Hamilton ndash Ignacio ndash IVC Hdn Valley Ross Valley Yellow Bus (Fairfax ndash San Anselmo ndash Hidden Valley ES) White Hill Ross Valley Yellow Bus (San Anselmo ndash Sleepy Hollow ndash Fairfax ndash White Hill MS)
17Local Basic
Days of Service Wkdy Sa SuAvg Freq (Wkdy Peak) 30 min
Avg Freq (Wkdy Non-Peak) 60 minAvg Freq (Wked) 60 min
FY 2017 Farebox Recovery 15 transfer (to route) 25
Clipper usage 16
Annual Avg Monthly Avg Daily Annual Avg Monthly Avg Daily Annual Avg Monthly Avg DailyWeekday 194263 16189 768 11496 958 45 177386 14782 701 Saturday 27564 2297 530 1541 128 30 24621 2052 473 Sunday 26171 2181 436 1720 143 29 27378 2282 456
Total 247998 20667 679 14757 1230 40 229385 19115 628
Annual Avg Monthly Avg Daily Annual Avg Monthly Avg Daily Annual Avg Monthly Avg DailyWeekday $1617108 $134759 $6392 $247041 $20587 $976 $1370067 $114172 $5415Saturday $217536 $18128 $4183 $36894 $3075 $710 $180642 $15054 $3474Sunday $242142 $20179 $4036 $35826 $2986 $597 $206316 $17193 $3439
Total $2076786 $173066 $5690 $319761 $26647 $876 $1757025 $146419 $4814
Passengers per Revenue Hour
Subsidy per Passenger
Cost per Revenue Hour
Farebox Recovery
Weekday 169 $705 $14067 153Saturday 179 $655 $14117 170Sunday 152 $788 $14078 148
Total 168 $708 $14073 154
Passengers Revenue Hours Operating CostsPassenger
RevenueOperating Subsidy
Passengers per Revenue Hour
Subsidy per Passenger
Cost per Revenue Hour
Farebox Recovery
FY 2015 301136 15167 $2108822 $340410 $1768412 199 $587 $13904 161FY 2016 280486 15330 $2041616 $302337 $1739279 183 $620 $13317 148FY 2017 247998 14757 $2076786 $319761 $1757025 168 $708 $14073 154
Histo
ric Tr
ends
FY 20
161
7 DAT
A
Passengers Revenue Hours Revenue Miles
Operating Costs Passenger Revenue Operating Subsidy
277892 322826
301136 280486
247998
0
50000
100000
150000
200000
250000
300000
350000
FY 2013 FY 2014 FY 2015 FY 2016 FY 2017
Passengers
12402 14818 15167 15330 14757
0
5000
10000
15000
20000
FY 2013 FY 2014 FY 2015 FY 2016 FY 2017
Revenue Hours
$1717002
$2179526 $2108822 $2041616 $2076786
$0
$500000
$1000000
$1500000
$2000000
$2500000
FY 2013 FY 2014 FY 2015 FY 2016 FY 2017
Operating Costs
224 218 199 183 168
00
50
100
150
200
250
300
FY 2013 FY 2014 FY 2015 FY 2016 FY 2017
Passengers per Revenue Hour
$504 $558 $587 $620 $708
$000$200$400$600$800
$1000$1200$1400
FY 2013 FY 2014 FY 2015 FY 2016 FY 2017
Subsidy per Passenger
$13845 $14709 $13904 $13317 $14073
$0
$50
$100
$150
$200
FY 2013 FY 2014 FY 2015 FY 2016 FY 2017
Cost per Revenue Hour
22Local Basic
Days of Service Wkdy Sa SuAvg Freq (Wkdy Peak) 30 min
Avg Freq (Wkdy Non-Peak) 60 minAvg Freq (Wked) 60 min
FY 2017 Farebox Recovery 17 transfer (to route) 10
Clipper usage 11
Annual Avg Monthly Avg Daily Annual Avg Monthly Avg Daily Annual Avg Monthly Avg DailyWeekday 184918 15410 731 14244 1187 56 126319 10527 499 Saturday 16752 1396 322 1537 128 30 16232 1353 312 Sunday 14088 1174 235 1773 148 30 18729 1561 312
Total 215758 17980 591 17553 1463 48 161280 13440 442
Annual Avg Monthly Avg Daily Annual Avg Monthly Avg Daily Annual Avg Monthly Avg DailyWeekday $1312992 $109416 $5190 $232926 $19411 $921 $1080066 $90006 $4269Saturday $142334 $11861 $2737 $21235 $1770 $408 $121099 $10092 $2329Sunday $163993 $13666 $2733 $18898 $1575 $315 $145095 $12091 $2418
Total $1619319 $134943 $4436 $273059 $22755 $748 $1346260 $112188 $3688
Passengers per Revenue Hour
Subsidy per Passenger
Cost per Revenue Hour
Farebox Recovery
Weekday 130 $584 $9218 177Saturday 109 $723 $9263 149Sunday 79 $1030 $9251 115
Total 123 $624 $9225 169
Passengers Revenue Hours Operating CostsPassenger
RevenueOperating Subsidy
Passengers per Revenue Hour
Subsidy per Passenger
Cost per Revenue Hour
Farebox Recovery
FY 2015 249148 14777 $2054433 $292215 $1762218 169 $707 $13903 142FY 2016 243635 14872 $1971172 $259453 $1711719 164 $703 $13255 132FY 2017 215758 17553 $1619319 $273059 $1346260 123 $624 $9225 169
Histo
ric Tr
ends
FY 20
161
7 DAT
A
Passengers Revenue Hours Revenue Miles
Operating Costs Passenger Revenue Operating Subsidy
366301
281761 249148 243635
215758
050000
100000150000200000250000300000350000400000
FY 2013 FY 2014 FY 2015 FY 2016 FY 2017
Passengers18061
15083 14777 14872 17553
0
5000
10000
15000
20000
FY 2013 FY 2014 FY 2015 FY 2016 FY 2017
Revenue Hours$2498169
$2220145 $2054433 $1971172
$1619319
$0
$500000
$1000000
$1500000
$2000000
$2500000
$3000000
FY 2013 FY 2014 FY 2015 FY 2016 FY 2017
Operating Costs
203 187 169 164
123
00
50
100
150
200
250
300
FY 2013 FY 2014 FY 2015 FY 2016 FY 2017
Passengers per Revenue Hour
$567 $667 $707 $703 $624
$000$200$400$600$800
$1000$1200$1400
FY 2013 FY 2014 FY 2015 FY 2016 FY 2017
Subsidy per Passenger
$13832 $14720 $13903 $13255
$9225
$0
$50
$100
$150
$200
FY 2013 FY 2014 FY 2015 FY 2016 FY 2017
Cost per Revenue Hour
23Local Basic
Days of Service Wkdy Sa SuAvg Freq (Wkdy Peak) 60 min
Avg Freq (Wkdy Non-Peak) 60 minAvg Freq (Wked) 60 min
FY 2017 Farebox Recovery 16 transfer (to route) 24
Clipper usage 12
Annual Avg Monthly Avg Daily Annual Avg Monthly Avg Daily Annual Avg Monthly Avg DailyWeekday 145707 12142 576 8042 670 32 64277 5356 254 Saturday 28305 2359 544 1434 120 28 11466 956 221 Sunday 25138 2095 419 1589 132 26 12750 1062 212
Total 199150 16596 546 11065 922 30 88492 7374 242
Annual Avg Monthly Avg Daily Annual Avg Monthly Avg Daily Annual Avg Monthly Avg DailyWeekday $1096892 $91408 $4336 $179427 $14952 $709 $917465 $76455 $3626Saturday $195468 $16289 $3759 $35226 $2936 $677 $160242 $13354 $3082Sunday $216299 $18025 $3605 $32255 $2688 $538 $184044 $15337 $3067
Total $1508659 $125722 $4133 $246908 $20576 $676 $1261751 $105146 $3457
Passengers per Revenue Hour
Subsidy per Passenger
Cost per Revenue Hour
Farebox Recovery
Weekday 181 $630 $13640 164Saturday 197 $566 $13629 180Sunday 158 $732 $13612 149
Total 180 $634 $13635 164
Passengers Revenue Hours Operating CostsPassenger
RevenueOperating Subsidy
Passengers per Revenue Hour
Subsidy per Passenger
Cost per Revenue Hour
Farebox Recovery
FY 2015 354706 14168 $1969650 $381111 $1588539 250 $448 $13902 193FY 2016 268218 13154 $1703216 $308138 $1395078 204 $520 $12948 181FY 2017 199150 11065 $1508659 $246908 $1261751 180 $634 $13635 164
Histo
ric Tr
ends
FY 20
161
7 DAT
A
Passengers Revenue Hours Revenue Miles
Operating Costs Passenger Revenue Operating Subsidy
212064
339118 354706
268218
199150
050000
100000150000200000250000300000350000400000
FY 2013 FY 2014 FY 2015 FY 2016 FY 2017
Passengers
8716
14034 14168 13154
11065
02000400060008000
10000120001400016000
FY 2013 FY 2014 FY 2015 FY 2016 FY 2017
Revenue Hours
$1202564
$2061985 $1969650 $1703216
$1508659
$0
$500000
$1000000
$1500000
$2000000
$2500000
FY 2013 FY 2014 FY 2015 FY 2016 FY 2017
Operating Costs
243 242 250
204 180
00
50
100
150
200
250
300
FY 2013 FY 2014 FY 2015 FY 2016 FY 2017
Passengers per Revenue Hour
$455 $494 $448 $520 $634
$000$200$400$600$800
$1000$1200$1400
FY 2013 FY 2014 FY 2015 FY 2016 FY 2017
Subsidy per Passenger
$13797 $14692 $13902 $12948 $13635
$0
$50
$100
$150
$200
FY 2013 FY 2014 FY 2015 FY 2016 FY 2017
Cost per Revenue Hour
23XLocal Basic
Days of Service WkdyAvg Freq (Wkdy Peak) 60 min
Avg Freq (Wkdy Non-Peak) -Avg Freq (Wked) -
FY 2017 Farebox Recovery 12 transfer (to route) 31
Clipper usage 12
Annual Avg Monthly Avg Daily Annual Avg Monthly Avg Daily Annual Avg Monthly Avg DailyWeekday 49255 4105 195 3445 287 14 32408 2701 128 Saturday - - - - - - - - - Sunday - - - - - - - - -
Total 49255 4105 195 3445 287 14 32408 2701 128
Annual Avg Monthly Avg Daily Annual Avg Monthly Avg Daily Annual Avg Monthly Avg DailyWeekday $473413 $39451 $1871 $57438 $4787 $227 $415975 $34665 $1644Saturday $ - $ - $ - $ - $ - $ - $ - $ - $ -Sunday $ - $ - $ - $ - $ - $ - $ - $ - $ -
Total $473413 $39451 $1871 $57438 $4787 $227 $415975 $34665 $1644
Passengers per Revenue Hour
Subsidy per Passenger
Cost per Revenue Hour
Farebox Recovery
Weekday 143 $845 $13744 121Saturday - $ - $ - - Sunday - $ - $ - -
Total 143 $845 $13744 121
Passengers Revenue Hours Operating CostsPassenger
RevenueOperating Subsidy
Passengers per Revenue Hour
Subsidy per Passenger
Cost per Revenue Hour
Farebox Recovery
FY 2015FY 2016 2548 189 $23303 $2272 $21031 135 $825 $12330 97FY 2017 49255 3445 $473413 $57438 $415975 143 $845 $13744 121
Histo
ric Tr
ends
FY 20
161
7 DAT
A
Passengers Revenue Hours Revenue Miles
Operating Costs Passenger Revenue Operating Subsidy
2548
49255
0
10000
20000
30000
40000
50000
60000
FY 2013 FY 2014 FY 2015 FY 2016 FY 2017
Passengers
189
3445
0500
1000150020002500300035004000
FY 2013 FY 2014 FY 2015 FY 2016 FY 2017
Revenue Hours
$23303
$473413
$0
$100000
$200000
$300000
$400000
$500000
FY 2013 FY 2014 FY 2015 FY 2016 FY 2017
Operating Costs
135 143
00
50
100
150
200
250
300
FY 2013 FY 2014 FY 2015 FY 2016 FY 2017
Passengers per Revenue Hour
$825 $845
$000$200$400$600$800
$1000$1200$1400
FY 2013 FY 2014 FY 2015 FY 2016 FY 2017
Subsidy per Passenger
$12330 $13744
$0
$50
$100
$150
$200
FY 2013 FY 2014 FY 2015 FY 2016 FY 2017
Cost per Revenue Hour
29Local Basic
Days of Service WkdyAvg Freq (Wkdy Peak) 60 min
Avg Freq (Wkdy Non-Peak) -Avg Freq (Wked) -
FY 2017 Farebox Recovery 10 transfer (to route) 26
Clipper usage 12
Annual Avg Monthly Avg Daily Annual Avg Monthly Avg Daily Annual Avg Monthly Avg DailyWeekday 40103 3342 159 3707 309 15 37048 3087 146 Saturday - - - - - - - - - Sunday - - - - - - - - -
Total 40103 3342 159 3707 309 15 37048 3087 146
Annual Avg Monthly Avg Daily Annual Avg Monthly Avg Daily Annual Avg Monthly Avg DailyWeekday $509475 $42456 $2014 $49634 $4136 $196 $459841 $38320 $1818Saturday $ - $ - $ - $ - $ - $ - $ - $ - $ -Sunday $ - $ - $ - $ - $ - $ - $ - $ - $ -
Total $509475 $42456 $2014 $49634 $4136 $196 $459841 $38320 $1818
Passengers per Revenue Hour
Subsidy per Passenger
Cost per Revenue Hour
Farebox Recovery
Weekday 108 $1147 $13745 97Saturday - $ - $ - - Sunday - $ - $ - -
Total 108 $1147 $13745 97
Passengers Revenue Hours Operating CostsPassenger
RevenueOperating Subsidy
Passengers per Revenue Hour
Subsidy per Passenger
Cost per Revenue Hour
Farebox Recovery
FY 2015 203632 10795 $1500887 $232286 $1268601 189 $623 $13904 155FY 2016 181786 10502 $1378760 $219997 $1158763 173 $637 $13129 160FY 2017 40103 3707 $509475 $49634 $459841 108 $1147 $13745 97
Histo
ric Tr
ends
FY 20
161
7 DAT
A
Passengers Revenue Hours Revenue Miles
Operating Costs Passenger Revenue Operating Subsidy
238310 225998 203632
181786
40103
0
50000
100000
150000
200000
250000
300000
FY 2013 FY 2014 FY 2015 FY 2016 FY 2017
Passengers12248
10927 10795 10502
3707
0
2000
4000
6000
8000
10000
12000
14000
FY 2013 FY 2014 FY 2015 FY 2016 FY 2017
Revenue Hours$1692980 $1607795 $1500887
$1378760
$509475
$0
$500000
$1000000
$1500000
$2000000
FY 2013 FY 2014 FY 2015 FY 2016 FY 2017
Operating Costs
195 207 189 173
108
00
50
100
150
200
250
300
FY 2013 FY 2014 FY 2015 FY 2016 FY 2017
Passengers per Revenue Hour
$595 $593 $623 $637
$1147
$000$200$400$600$800
$1000$1200$1400
FY 2013 FY 2014 FY 2015 FY 2016 FY 2017
Subsidy per Passenger
$13822 $14714 $13904 $13129 $13745
$0
$50
$100
$150
$200
FY 2013 FY 2014 FY 2015 FY 2016 FY 2017
Cost per Revenue Hour
35Local Trunkline
Days of Service Wkdy Sa SuAvg Freq (Wkdy Peak) 30 min
Avg Freq (Wkdy Non-Peak) 30 minAvg Freq (Wked) 30 min
FY 2017 Farebox Recovery 23 transfer (to route) 17
Clipper usage 8
Annual Avg Monthly Avg Daily Annual Avg Monthly Avg Daily Annual Avg Monthly Avg DailyWeekday 492328 41027 1946 16909 1409 67 224421 18702 887 Saturday 84453 7038 1624 2860 238 55 43336 3611 833 Sunday 82088 6841 1368 3284 274 55 50021 4168 834
Total 658869 54906 1805 23052 1921 63 317778 26482 871
Annual Avg Monthly Avg Daily Annual Avg Monthly Avg Daily Annual Avg Monthly Avg DailyWeekday $2367217 $197268 $9357 $533190 $44433 $2107 $1834027 $152836 $7249Saturday $403729 $33644 $7764 $97853 $8154 $1882 $305876 $25490 $5882Sunday $463362 $38614 $7723 $98732 $8228 $1646 $364630 $30386 $6077
Total $3234308 $269526 $8861 $729775 $60815 $1999 $2504533 $208711 $6862
Passengers per Revenue Hour
Subsidy per Passenger
Cost per Revenue Hour
Farebox Recovery
Weekday 291 $373 $14000 225Saturday 295 $362 $14118 242Sunday 250 $444 $14111 213
Total 286 $380 $14030 226
Passengers Revenue Hours Operating CostsPassenger
RevenueOperating Subsidy
Passengers per Revenue Hour
Subsidy per Passenger
Cost per Revenue Hour
Farebox Recovery
FY 2015 476489 8544 $1187694 $462204 $725490 558 $152 $13901 389FY 2016 472718 9300 $1202986 $544109 $658877 508 $139 $12935 452FY 2017 658869 23052 $3234308 $729775 $2504533 286 $380 $14030 226
Histo
ric Tr
ends
FY 20
161
7 DAT
A
Passengers Revenue Hours Revenue Miles
Operating Costs Passenger Revenue Operating Subsidy
669860 574669
476489 472718
658869
0100000200000300000400000500000600000700000800000
FY 2013 FY 2014 FY 2015 FY 2016 FY 2017
Passengers
9755 8644 8544 9300
23052
0
5000
10000
15000
20000
25000
FY 2013 FY 2014 FY 2015 FY 2016 FY 2017
Revenue Hours
$1345711 $1271601 $1187694 $1202986
$3234308
$0
$500000
$1000000
$1500000
$2000000
$2500000
$3000000
$3500000
FY 2013 FY 2014 FY 2015 FY 2016 FY 2017
Operating Costs
687 665 558
508
286
00100200300400500600700800
FY 2013 FY 2014 FY 2015 FY 2016 FY 2017
Passengers per Revenue Hour
$097 $120 $152 $139
$380
$000
$200
$400
$600
$800
$1000
FY 2013 FY 2014 FY 2015 FY 2016 FY 2017
Subsidy per Passenger
$13796 $14710 $13901 $12935 $14030
$0
$50
$100
$150
$200
FY 2013 FY 2014 FY 2015 FY 2016 FY 2017
Cost per Revenue Hour
36Local Trunkline
Days of Service Wkdy Sa SuAvg Freq (Wkdy Peak) 30 min
Avg Freq (Wkdy Non-Peak) 30 minAvg Freq (Wked) 30 min
FY 2017 Farebox Recovery 19 transfer (to route) 18
Clipper usage 6
Annual Avg Monthly Avg Daily Annual Avg Monthly Avg Daily Annual Avg Monthly Avg DailyWeekday 278217 23185 1100 9938 828 39 133318 11110 527 Saturday 33779 2815 650 1715 143 33 24259 2022 467 Sunday 30182 2515 503 1983 165 33 28002 2334 467
Total 342178 28515 937 13636 1136 37 185579 15465 508
Annual Avg Monthly Avg Daily Annual Avg Monthly Avg Daily Annual Avg Monthly Avg DailyWeekday $1384291 $115358 $5472 $290481 $24207 $1148 $1093810 $91151 $4323Saturday $240062 $20005 $4617 $40774 $3398 $784 $199288 $16607 $3832Sunday $277325 $23110 $4622 $37877 $3156 $631 $239448 $19954 $3991
Total $1901678 $158473 $5210 $369132 $30761 $1011 $1532546 $127712 $4199
Passengers per Revenue Hour
Subsidy per Passenger
Cost per Revenue Hour
Farebox Recovery
Weekday 280 $393 $13930 210Saturday 197 $590 $13999 170Sunday 152 $793 $13984 137
Total 251 $448 $13946 194
Passengers Revenue Hours Operating CostsPassenger
RevenueOperating Subsidy
Passengers per Revenue Hour
Subsidy per Passenger
Cost per Revenue Hour
Farebox Recovery
FY 2015 109347 2894 $402355 $110471 $291884 378 $267 $13905 275FY 2016 119593 3462 $457211 $129715 $327496 345 $274 $13205 284FY 2017 342178 13636 $1901678 $369132 $1532546 251 $448 $13946 194
Histo
ric Tr
ends
FY 20
161
7 DAT
A
Passengers Revenue Hours Revenue Miles
Operating Costs Passenger Revenue Operating Subsidy
106988 103673 109347 119593
342178
050000
100000150000200000250000300000350000400000
FY 2013 FY 2014 FY 2015 FY 2016 FY 2017
Passengers
2878 2822 2894 3462
13636
02000400060008000
10000120001400016000
FY 2013 FY 2014 FY 2015 FY 2016 FY 2017
Revenue Hours
$398410 $415238 $402355 $457211
$1901678
$0
$500000
$1000000
$1500000
$2000000
FY 2013 FY 2014 FY 2015 FY 2016 FY 2017
Operating Costs
372 367 378 345 251
00100200300400500600700800
FY 2013 FY 2014 FY 2015 FY 2016 FY 2017
Passengers per Revenue Hour
$265 $293 $267 $274
$448
$000
$200
$400
$600
$800
$1000
FY 2013 FY 2014 FY 2015 FY 2016 FY 2017
Subsidy per Passenger
$13842 $14713 $13905 $13205 $13946
$0
$50
$100
$150
$200
FY 2013 FY 2014 FY 2015 FY 2016 FY 2017
Cost per Revenue Hour
49Local Basic
Days of Service Wkdy Sa SuAvg Freq (Wkdy Peak) 30 min
Avg Freq (Wkdy Non-Peak) 60 minAvg Freq (Wked) 60 min
FY 2017 Farebox Recovery 22 transfer (to route) 9
Clipper usage 11
Annual Avg Monthly Avg Daily Annual Avg Monthly Avg Daily Annual Avg Monthly Avg DailyWeekday 201564 16797 797 11313 943 45 139528 11627 551 Saturday 18489 1541 356 1517 126 29 18370 1531 353 Sunday 17183 1432 286 1761 147 29 21402 1784 357
Total 237236 19770 650 14590 1216 40 179300 14942 491
Annual Avg Monthly Avg Daily Annual Avg Monthly Avg Daily Annual Avg Monthly Avg DailyWeekday $978903 $81575 $3869 $230134 $19178 $910 $748769 $62397 $2960Saturday $131907 $10992 $2537 $22520 $1877 $433 $109387 $9116 $2104Sunday $153484 $12790 $2558 $21844 $1820 $364 $131640 $10970 $2194
Total $1264294 $105358 $3464 $274498 $22875 $752 $989796 $82483 $2712
Passengers per Revenue Hour
Subsidy per Passenger
Cost per Revenue Hour
Farebox Recovery
Weekday 178 $371 $8653 235Saturday 122 $592 $8698 171Sunday 98 $766 $8718 142
Total 163 $417 $8665 217
Passengers Revenue Hours Operating CostsPassenger
RevenueOperating Subsidy
Passengers per Revenue Hour
Subsidy per Passenger
Cost per Revenue Hour
Farebox Recovery
FY 2015 144262 6349 $882801 $158088 $724713 227 $502 $13905 179FY 2016 147480 6795 $900804 $146345 $754459 217 $512 $13257 162FY 2017 237236 14590 $1264294 $274498 $989796 163 $417 $8665 217
Histo
ric Tr
ends
FY 20
161
7 DAT
A
Passengers Revenue Hours Revenue Miles
Operating Costs Passenger Revenue Operating Subsidy
230943
152259 144262 147480
237236
0
50000
100000
150000
200000
250000
FY 2013 FY 2014 FY 2015 FY 2016 FY 2017
Passengers
9814
6440 6349 6795
14590
02000400060008000
10000120001400016000
FY 2013 FY 2014 FY 2015 FY 2016 FY 2017
Revenue Hours$1362499
$948702 $882801 $900804
$1264294
$0$200000$400000$600000$800000
$1000000$1200000$1400000$1600000
FY 2013 FY 2014 FY 2015 FY 2016 FY 2017
Operating Costs
235 236 227 217
163
00
50
100
150
200
250
300
FY 2013 FY 2014 FY 2015 FY 2016 FY 2017
Passengers per Revenue Hour
$477 $507 $502 $512 $417
$000$200$400$600$800
$1000$1200$1400
FY 2013 FY 2014 FY 2015 FY 2016 FY 2017
Subsidy per Passenger
$13884 $14732 $13905 $13257
$8665
$0
$50
$100
$150
$200
FY 2013 FY 2014 FY 2015 FY 2016 FY 2017
Cost per Revenue Hour
61Rural
Days of Service Wkdy Sa SuAvg Freq (Wkdy Peak) 8 trips
Avg Freq (Wkdy Non-Peak) -Avg Freq (Wked) 16 trips
FY 2017 Farebox Recovery 8 transfer (to route) 7
Clipper usage 11
Annual Avg Monthly Avg Daily Annual Avg Monthly Avg Daily Annual Avg Monthly Avg DailyWeekday 17166 1431 68 2631 219 10 45398 3783 181 Saturday 9922 827 198 1319 110 26 20810 1734 416 Sunday 9240 770 144 1542 129 24 24457 2038 382
Total 36328 3027 100 5492 458 15 90665 7555 248
Annual Avg Monthly Avg Daily Annual Avg Monthly Avg Daily Annual Avg Monthly Avg DailyWeekday $229650 $19138 $915 $17691 $1474 $70 $211959 $17663 $844Saturday $113378 $9448 $2268 $11622 $969 $232 $101756 $8480 $2035Sunday $132750 $11063 $2074 $10646 $887 $166 $122104 $10175 $1908
Total $475778 $39648 $1304 $39959 $3330 $109 $435819 $36318 $1194
Passengers per Revenue Hour
Subsidy per Passenger
Cost per Revenue Hour
Farebox Recovery
Weekday 65 $1235 $8730 77Saturday 75 $1026 $8598 103Sunday 60 $1321 $8607 80
Total 66 $1200 $8663 84
Passengers Revenue Hours Operating CostsPassenger
RevenueOperating Subsidy
Passengers per Revenue Hour
Subsidy per Passenger
Cost per Revenue Hour
Farebox Recovery
FY 2015 39478 5379 $417539 $46324 $371215 73 $940 $7762 111FY 2016 37276 5475 $408987 $48421 $360566 68 $967 $7470 118FY 2017 36328 5492 $475778 $39959 $435819 66 $1200 $8663 84
Histo
ric Tr
ends
FY 20
161
7 DAT
A
Passengers Revenue Hours Revenue Miles
Operating Costs Passenger Revenue Operating Subsidy
30642 33386
39478 37276 36328
0
10000
20000
30000
40000
50000
FY 2013 FY 2014 FY 2015 FY 2016 FY 2017
Passengers
5388
5056
5379 5475 5492
480049005000510052005300540055005600
FY 2013 FY 2014 FY 2015 FY 2016 FY 2017
Revenue Hours
$388827 $390358 $417539 $408987 $475778
$0
$100000
$200000
$300000
$400000
$500000
FY 2013 FY 2014 FY 2015 FY 2016 FY 2017
Operating Costs
57 66
73 68 66
00
20
40
60
80
100
FY 2013 FY 2014 FY 2015 FY 2016 FY 2017
Passengers per Revenue Hour
$1136 $1045
$940 $967
$1200
$000$200$400$600$800
$1000$1200$1400
FY 2013 FY 2014 FY 2015 FY 2016 FY 2017
Subsidy per Passenger
$7216 $7721 $7762 $7470 $8663
$0
$50
$100
$150
$200
FY 2013 FY 2014 FY 2015 FY 2016 FY 2017
Cost per Revenue Hour
66Recreational
Days of Service Wkdy Sa SuAvg Freq (Wkdy Peak) 30 min
Avg Freq (Wkdy Non-Peak) 30 minAvg Freq (Wked) 10-20 min
FY 2017 Farebox Recovery 53 transfer (to route) 0
Clipper usage 0
Annual Avg Monthly Avg Daily Annual Avg Monthly Avg Daily Annual Avg Monthly Avg DailyWeekday 21940 7313 549 804 268 20 10735 3578 268 Saturday 43799 7300 1752 1473 245 59 20480 3413 819 Sunday 56377 6264 1446 2040 227 52 28212 3135 723
Total 122116 13568 1174 4316 480 42 59428 6603 571
Annual Avg Monthly Avg Daily Annual Avg Monthly Avg Daily Annual Avg Monthly Avg DailyWeekday $104033 $34678 $2601 $37751 $12584 $944 $66282 $22094 $1657Saturday $152661 $25444 $6106 $79948 $13325 $3198 $72713 $12119 $2909Sunday $217032 $24115 $5565 $132049 $14672 $3386 $84983 $9443 $2179
Total $473726 $52636 $4555 $249748 $27750 $2401 $223978 $24886 $2154
Passengers per Revenue Hour
Subsidy per Passenger
Cost per Revenue Hour
Farebox Recovery
Weekday 273 $302 $12944 363Saturday 297 $166 $10367 524Sunday 276 $151 $10638 608
Total 283 $183 $10975 527
Passengers Revenue Hours Operating CostsPassenger
RevenueOperating Subsidy
Passengers per Revenue Hour
Subsidy per Passenger
Cost per Revenue Hour
Farebox Recovery
FY 2015 103930 3866 $477523 $209514 $268009 269 $258 $12352 439FY 2016 116942 4673 $531384 $245779 $285605 250 $244 $11373 463FY 2017 122116 4316 $473726 $249748 $223978 283 $183 $10975 527
Histo
ric Tr
ends
FY 20
161
7 DAT
A
Passengers Revenue Hours Revenue Miles
Operating Costs Passenger Revenue Operating Subsidy
62624
103052 103930 116942 122116
0
20000
40000
60000
80000
100000
120000
140000
FY 2013 FY 2014 FY 2015 FY 2016 FY 2017
Passengers
2941
3841 3866
4673 4316
0
1000
2000
3000
4000
5000
FY 2013 FY 2014 FY 2015 FY 2016 FY 2017
Revenue Hours
$330076
$538014 $477523
$531384 $473726
$0
$100000
$200000
$300000
$400000
$500000
$600000
FY 2013 FY 2014 FY 2015 FY 2016 FY 2017
Operating Costs
213
268 269 250
283
00
50
100
150
200
250
300
FY 2013 FY 2014 FY 2015 FY 2016 FY 2017
Passengers per Revenue Hour
$360 $322
$258 $244 $183
$000
$100
$200
$300
$400
$500
FY 2013 FY 2014 FY 2015 FY 2016 FY 2017
Subsidy per Passenger
$11223
$14007 $12352 $11373 $10975
$0
$50
$100
$150
$200
FY 2013 FY 2014 FY 2015 FY 2016 FY 2017
Cost per Revenue Hour
68Rural
Days of Service Wkdy Sa SuAvg Freq (Wkdy Peak) 60 min
Avg Freq (Wkdy Non-Peak) 120 minAvg Freq (Wked) 60-120 min
FY 2017 Farebox Recovery 9 transfer (to route) 13
Clipper usage 12
Annual Avg Monthly Avg Daily Annual Avg Monthly Avg Daily Annual Avg Monthly Avg DailyWeekday 59903 4992 239 7282 607 29 133167 11097 531 Saturday 8410 701 168 1492 124 30 27123 2260 542 Sunday 8285 690 129 1907 159 30 34638 2887 541
Total 76598 6383 210 10680 890 29 194928 16244 534
Annual Avg Monthly Avg Daily Annual Avg Monthly Avg Daily Annual Avg Monthly Avg DailyWeekday $645737 $53811 $2573 $64332 $5361 $256 $581405 $48450 $2316Saturday $131882 $10990 $2638 $9260 $772 $185 $122622 $10219 $2452Sunday $169286 $14107 $2645 $8856 $738 $138 $160430 $13369 $2507
Total $946905 $78909 $2594 $82448 $6871 $226 $864457 $72038 $2368
Passengers per Revenue Hour
Subsidy per Passenger
Cost per Revenue Hour
Farebox Recovery
Weekday 82 $971 $8868 100Saturday 56 $1458 $8841 70Sunday 43 $1936 $8879 52
Total 72 $1129 $8866 87
Passengers Revenue Hours Operating CostsPassenger
RevenueOperating Subsidy
Passengers per Revenue Hour
Subsidy per Passenger
Cost per Revenue Hour
Farebox Recovery
FY 2015 65866 10589 $848305 $80846 $767459 62 $1165 $8011 95FY 2016 70292 10611 $811978 $88808 $723170 66 $1029 $7652 109FY 2017 76598 10680 $946905 $82448 $864457 72 $1129 $8866 87
Histo
ric Tr
ends
FY 20
161
7 DAT
A
Passengers Revenue Hours Revenue Miles
Operating Costs Passenger Revenue Operating Subsidy
48113 56988
65866 70292 76598
0
20000
40000
60000
80000
100000
FY 2013 FY 2014 FY 2015 FY 2016 FY 2017
Passengers
7140 7185
10589 10611 10680
0
2000
4000
6000
8000
10000
12000
FY 2013 FY 2014 FY 2015 FY 2016 FY 2017
Revenue Hours
$532879 $571618
$848305 $811978 $946905
$0
$200000
$400000
$600000
$800000
$1000000
FY 2013 FY 2014 FY 2015 FY 2016 FY 2017
Operating Costs
67 79
62 66 72
00
20
40
60
80
100
FY 2013 FY 2014 FY 2015 FY 2016 FY 2017
Passengers per Revenue Hour
$979 $885
$1165 $1029
$1129
$000$200$400$600$800
$1000$1200$1400
FY 2013 FY 2014 FY 2015 FY 2016 FY 2017
Subsidy per Passenger
$7464 $7955 $8011 $7652 $8866
$0
$50
$100
$150
$200
FY 2013 FY 2014 FY 2015 FY 2016 FY 2017
Cost per Revenue Hour
71XLocal Trunkline
Days of Service WkdyAvg Freq (Wkdy Peak) 30 min
Avg Freq (Wkdy Non-Peak) 60 minAvg Freq (Wked) -
FY 2017 Farebox Recovery 15 transfer (to route) 26
Clipper usage 16
Annual Avg Monthly Avg Daily Annual Avg Monthly Avg Daily Annual Avg Monthly Avg DailyWeekday 121141 10095 479 7705 642 30 174624 14552 690 Saturday - - - - - - - - - Sunday - - - - - - - - -
Total 121141 10095 479 7705 642 30 174624 14552 690
Annual Avg Monthly Avg Daily Annual Avg Monthly Avg Daily Annual Avg Monthly Avg DailyWeekday $1116954 $93080 $4415 $164963 $13747 $652 $951991 $79333 $3763Saturday $ - $ - $ - $ - $ - $ - $ - $ - $ -Sunday $ - $ - $ - $ - $ - $ - $ - $ - $ -
Total $1116954 $93080 $4415 $164963 $13747 $652 $951991 $79333 $3763
Passengers per Revenue Hour
Subsidy per Passenger
Cost per Revenue Hour
Farebox Recovery
Weekday 157 $786 $14496 148Saturday - $ - $ - - Sunday - $ - $ - -
Total 157 $786 $14496 148
Passengers Revenue Hours Operating CostsPassenger
RevenueOperating Subsidy
Passengers per Revenue Hour
Subsidy per Passenger
Cost per Revenue Hour
Farebox Recovery
FY 2015 305440 7666 $1066058 $307659 $758399 398 $248 $13906 289FY 2016 259678 7717 $1075263 $300186 $775077 337 $298 $13934 279FY 2017 121141 7705 $1116954 $164963 $951991 157 $786 $14496 148
Histo
ric Tr
ends
FY 20
161
7 DAT
A
Passengers Revenue Hours Revenue Miles
Operating Costs Passenger Revenue Operating Subsidy
347560 341105 305440
259678
121141
050000
100000150000200000250000300000350000400000
FY 2013 FY 2014 FY 2015 FY 2016 FY 2017
Passengers9038
7578 7666 7717 7705
0
2000
4000
6000
8000
10000
FY 2013 FY 2014 FY 2015 FY 2016 FY 2017
Revenue Hours$1254262
$1116004 $1066058 $1075263 $1116954
$0
$200000
$400000
$600000
$800000
$1000000
$1200000
$1400000
FY 2013 FY 2014 FY 2015 FY 2016 FY 2017
Operating Costs
385 450
398 337
157
00100200300400500600700800
FY 2013 FY 2014 FY 2015 FY 2016 FY 2017
Passengers per Revenue Hour
$253 $222 $248 $298
$786
$000
$200
$400
$600
$800
$1000
FY 2013 FY 2014 FY 2015 FY 2016 FY 2017
Subsidy per Passenger
$13877 $14728 $13906 $13934 $14496
$0
$50
$100
$150
$200
FY 2013 FY 2014 FY 2015 FY 2016 FY 2017
Cost per Revenue Hour
113Supplemental
Days of Service School DaysAvg Freq (Wkdy Peak) 3 trips
Avg Freq (Wkdy Non-Peak) -Avg Freq (Wked) -
FY 2017 Farebox Recovery 29 transfer (to route) 0
Clipper usage 4
Annual Avg Monthly Avg Daily Annual Avg Monthly Avg Daily Annual Avg Monthly Avg DailyWeekday 16829 1530 92 317 29 2 2404 219 13 Saturday - - - - - - - - - Sunday - - - - - - - - -
Total 16829 1530 92 317 29 2 2404 219 13
Annual Avg Monthly Avg Daily Annual Avg Monthly Avg Daily Annual Avg Monthly Avg DailyWeekday $42180 $3835 $230 $12227 $1112 $67 $29953 $2723 $164Saturday $ - $ - $ - $ - $ - $ - $ - $ - $ -Sunday $ - $ - $ - $ - $ - $ - $ - $ - $ -
Total $42180 $3835 $230 $12227 $1112 $67 $29953 $2723 $164
Passengers per TripSubsidy per
PassengerCost per Revenue
HourFarebox Recovery
Weekday 315 $178 $13289 290Saturday - $ - $ - - Sunday - $ - $ - -
Total 315 $178 $13289 290
Passengers Revenue Hours Operating CostsPassenger
RevenueOperating Subsidy Passengers per Trip
Subsidy per Passenger
Cost per Revenue Hour
Farebox Recovery
FY 2015 12241 161 $28599 $10703 $17896 342 $146 $17752 374FY 2016 14601 263 $36924 $12809 $24115 317 $165 $14050 347FY 2017 16829 317 $42180 $12227 $29953 315 $178 $13289 290
Histo
ric Tr
ends
FY 20
161
7 DAT
A
Passengers Revenue Hours Revenue Miles
Operating Costs Passenger Revenue Operating Subsidy
15232 13521
12241 14601
16829
0
5000
10000
15000
20000
FY 2013 FY 2014 FY 2015 FY 2016 FY 2017
Passengers
229
165 161
263
317
0
50
100
150
200
250
300
350
FY 2013 FY 2014 FY 2015 FY 2016 FY 2017
Revenue Hours
$31562
$20182
$28599
$36924 $42180
$0
$10000
$20000
$30000
$40000
$50000
FY 2013 FY 2014 FY 2015 FY 2016 FY 2017
Operating Costs
220
365 342 317 315
00
100
200
300
400
500
FY 2013 FY 2014 FY 2015 FY 2016 FY 2017
Passengers per Trip
$051 $095
$146 $165 $178
$000$100$200$300$400$500$600$700$800
FY 2013 FY 2014 FY 2015 FY 2016 FY 2017
Subsidy per Passenger
$13795 $12261
$17752
$14050 $13289
$0
$50
$100
$150
$200
FY 2013 FY 2014 FY 2015 FY 2016 FY 2017
Cost per Revenue Hour
115Supplemental
Days of Service School DaysAvg Freq (Wkdy Peak) 5 trips
Avg Freq (Wkdy Non-Peak) -Avg Freq (Wked) -
FY 2017 Farebox Recovery 11 transfer (to route) 0
Clipper usage 7
Annual Avg Monthly Avg Daily Annual Avg Monthly Avg Daily Annual Avg Monthly Avg DailyWeekday 14021 1275 71 637 58 3 6963 633 35 Saturday - - - - - - - - - Sunday - - - - - - - - -
Total 14021 1275 71 637 58 3 6963 633 35
Annual Avg Monthly Avg Daily Annual Avg Monthly Avg Daily Annual Avg Monthly Avg DailyWeekday $87534 $7958 $444 $9504 $864 $48 $78030 $7094 $396Saturday $ - $ - $ - $ - $ - $ - $ - $ - $ -Sunday $ - $ - $ - $ - $ - $ - $ - $ - $ -
Total $87534 $7958 $444 $9504 $864 $48 $78030 $7094 $396
Passengers per TripSubsidy per
PassengerCost per Revenue
HourFarebox Recovery
Weekday 185 $557 $13744 109Saturday - $ - $ - - Sunday - $ - $ - -
Total 185 $557 $13744 109
Passengers Revenue Hours Operating CostsPassenger
RevenueOperating Subsidy Passengers per Trip
Subsidy per Passenger
Cost per Revenue Hour
Farebox Recovery
FY 2015 21488 775 $131168 $18863 $112305 221 $523 $16918 144FY 2016 16366 559 $82403 $12638 $69765 168 $426 $14754 153FY 2017 14021 637 $87534 $9504 $78030 185 $557 $13744 109
Histo
ric Tr
ends
FY 20
161
7 DAT
A
Passengers Revenue Hours Revenue Miles
Operating Costs Passenger Revenue Operating Subsidy
13524
21488
16366 14021
0
5000
10000
15000
20000
25000
FY 2013 FY 2014 FY 2015 FY 2016 FY 2017
Passengers
463
775
559 637
0
200
400
600
800
1000
FY 2013 FY 2014 FY 2015 FY 2016 FY 2017
Revenue Hours
$56706
$131168
$82403 $87534
$0
$20000
$40000
$60000
$80000
$100000
$120000
$140000
FY 2013 FY 2014 FY 2015 FY 2016 FY 2017
Operating Costs
232 221 168 185
00
100
200
300
400
500
FY 2013 FY 2014 FY 2015 FY 2016 FY 2017
Passengers per Trip
$362
$523 $426
$557
$000$100$200$300$400$500$600$700$800
FY 2013 FY 2014 FY 2015 FY 2016 FY 2017
Subsidy per Passenger
$12250
$16918 $14754 $13744
$0
$50
$100
$150
$200
FY 2013 FY 2014 FY 2015 FY 2016 FY 2017
Cost per Revenue Hour
117Supplemental
Days of Service School DaysAvg Freq (Wkdy Peak) 6 trips
Avg Freq (Wkdy Non-Peak) -Avg Freq (Wked) -
FY 2017 Farebox Recovery 21 transfer (to route) 0
Clipper usage 2
Annual Avg Monthly Avg Daily Annual Avg Monthly Avg Daily Annual Avg Monthly Avg DailyWeekday 34820 3165 193 640 58 4 4753 432 26 Saturday - - - - - - - - - Sunday - - - - - - - - -
Total 34820 3165 193 640 58 4 4753 432 26
Annual Avg Monthly Avg Daily Annual Avg Monthly Avg Daily Annual Avg Monthly Avg DailyWeekday $81509 $7410 $453 $17140 $1558 $95 $64369 $5852 $358Saturday $ - $ - $ - $ - $ - $ - $ - $ - $ -Sunday $ - $ - $ - $ - $ - $ - $ - $ - $ -
Total $81509 $7410 $453 $17140 $1558 $95 $64369 $5852 $358
Passengers per TripSubsidy per
PassengerCost per Revenue
HourFarebox Recovery
Weekday 284 $185 $12732 210Saturday - $ - $ - - Sunday - $ - $ - -
Total 284 $185 $12732 210
Passengers Revenue Hours Operating CostsPassenger
RevenueOperating Subsidy Passengers per Trip
Subsidy per Passenger
Cost per Revenue Hour
Farebox Recovery
FY 2015 50008 509 $77168 $77528 ($360) 399 ($001) $15158 1005FY 2016 33705 552 $77694 $23478 $54216 269 $161 $14075 302FY 2017 34820 640 $81509 $17140 $64369 284 $185 $12732 210
Histo
ric Tr
ends
FY 20
161
7 DAT
A
Passengers Revenue Hours Revenue Miles
Operating Costs Passenger Revenue Operating Subsidy
35174 34496
50008
33705 34820
0
10000
20000
30000
40000
50000
60000
FY 2013 FY 2014 FY 2015 FY 2016 FY 2017
Passengers
299 341
509 552
640
0
100
200
300
400
500
600
700
FY 2013 FY 2014 FY 2015 FY 2016 FY 2017
Revenue Hours
$41176 $41796
$77168 $77694 $81509
$0
$20000
$40000
$60000
$80000
$100000
FY 2013 FY 2014 FY 2015 FY 2016 FY 2017
Operating Costs
436 406 399
269 284
00
100
200
300
400
500
FY 2013 FY 2014 FY 2015 FY 2016 FY 2017
Passengers per Trip
($012) ($028) ($001)
$161 $185
-$200
-$100
$000
$100
$200
$300
$400
$500
$600
FY 2013 FY 2014 FY 2015 FY 2016 FY 2017
Subsidy per Passenger$13790
$12253
$15158 $14075
$12732
$0$20$40$60$80
$100$120$140$160
FY 2013 FY 2014 FY 2015 FY 2016 FY 2017
Cost per Revenue Hour
119Supplemental
Days of Service School DaysAvg Freq (Wkdy Peak) 5 trips
Avg Freq (Wkdy Non-Peak) -Avg Freq (Wked) -
FY 2017 Farebox Recovery 34 transfer (to route) 0
Clipper usage 5
Annual Avg Monthly Avg Daily Annual Avg Monthly Avg Daily Annual Avg Monthly Avg DailyWeekday 27161 2469 151 374 34 2 6893 627 38 Saturday - - - - - - - - - Sunday - - - - - - - - -
Total 27161 2469 151 374 34 2 6893 627 38
Annual Avg Monthly Avg Daily Annual Avg Monthly Avg Daily Annual Avg Monthly Avg DailyWeekday $56273 $5116 $313 $18859 $1714 $105 $37414 $3401 $208Saturday $ - $ - $ - $ - $ - $ - $ - $ - $ -Sunday $ - $ - $ - $ - $ - $ - $ - $ - $ -
Total $56273 $5116 $313 $18859 $1714 $105 $37414 $3401 $208
Passengers per TripSubsidy per
PassengerCost per Revenue
HourFarebox Recovery
Weekday 313 $138 $15058 335Saturday - $ - $ - - Sunday - $ - $ - -
Total 313 $138 $15058 335
Passengers Revenue Hours Operating CostsPassenger
RevenueOperating Subsidy Passengers per Trip
Subsidy per Passenger
Cost per Revenue Hour
Farebox Recovery
FY 2015 28376 466 $85243 $24699 $60544 319 $213 $18292 290FY 2016 30906 431 $68366 $28456 $39910 317 $129 $15877 416FY 2017 27161 374 $56273 $18859 $37414 313 $138 $15058 335
Histo
ric Tr
ends
FY 20
161
7 DAT
A
Passengers Revenue Hours Revenue Miles
Operating Costs Passenger Revenue Operating Subsidy
27987 28376
30906
27161
25000
26000
27000
28000
29000
30000
31000
32000
FY 2013 FY 2014 FY 2015 FY 2016 FY 2017
Passengers526
466 431
374
0
100
200
300
400
500
600
FY 2013 FY 2014 FY 2015 FY 2016 FY 2017
Revenue Hours
$64440
$85243
$68366 $56273
$0
$20000
$40000
$60000
$80000
$100000
FY 2013 FY 2014 FY 2015 FY 2016 FY 2017
Operating Costs
272 319 317 313
00
100
200
300
400
500
FY 2013 FY 2014 FY 2015 FY 2016 FY 2017
Passengers per Trip
$175 $213 $129 $138
$000$100$200$300$400$500$600$700$800
FY 2013 FY 2014 FY 2015 FY 2016 FY 2017
Subsidy per Passenger
$12251
$18292 $15877 $15058
$0
$50
$100
$150
$200
FY 2013 FY 2014 FY 2015 FY 2016 FY 2017
Cost per Revenue Hour
122Partnership
Days of Service WkdyAvg Freq (Wkdy Peak) -
Avg Freq (Wkdy Non-Peak) 30 minAvg Freq (Wked) -
FY 2017 Farebox Recovery 66 transfer (to route) 9
Clipper usage 6
Annual Avg Monthly Avg Daily Annual Avg Monthly Avg Daily Annual Avg Monthly Avg DailyWeekday 19860 1986 113 1696 170 10 15480 1548 88 Saturday - - - - - - - - - Sunday - - - - - - - - -
Total 19860 1986 113 1696 170 10 15480 1548 88
Annual Avg Monthly Avg Daily Annual Avg Monthly Avg Daily Annual Avg Monthly Avg DailyWeekday $183943 $18394 $1045 $121007 $12101 $688 $62936 $6294 $358Saturday $ - $ - $ - $ - $ - $ - $ - $ - $ -Sunday $ - $ - $ - $ - $ - $ - $ - $ - $ -
Total $183943 $18394 $1045 $121007 $12101 $688 $62936 $6294 $358
Passengers per Revenue Hour
Subsidy per Passenger
Cost per Revenue Hour
Farebox Recovery
Weekday 117 $317 $10844 658Saturday - $ - $ - - Sunday - $ - $ - -
Total 117 $317 $10844 658
Passengers Revenue Hours Operating CostsPassenger
RevenueOperating Subsidy
Passengers per Revenue Hour
Subsidy per Passenger
Cost per Revenue Hour
Farebox Recovery
FY 2015FY 2016 20360 2932 $325230 $149686 $175544 69 $862 $11094 460FY 2017 19860 1696 $183943 $121007 $62936 117 $317 $10844 658
Histo
ric Tr
ends
FY 20
161
7 DAT
A
Passengers Revenue Hours Revenue Miles
Operating Costs Passenger Revenue Operating Subsidy
20360 19860
0
5000
10000
15000
20000
25000
FY 2013 FY 2014 FY 2015 FY 2016 FY 2017
Passengers2932
1696
0
500
1000
1500
2000
2500
3000
3500
FY 2013 FY 2014 FY 2015 FY 2016 FY 2017
Revenue Hours$325230
$183943
$0
$50000
$100000
$150000
$200000
$250000
$300000
$350000
FY 2013 FY 2014 FY 2015 FY 2016 FY 2017
Operating Costs
69
117
00
20
40
60
80
100
120
140
FY 2013 FY 2014 FY 2015 FY 2016 FY 2017
Passengers per Revenue Hour$862
$317
$000
$200
$400
$600
$800
$1000
FY 2013 FY 2014 FY 2015 FY 2016 FY 2017
Subsidy per Passenger
$11094 $10844
$0
$50
$100
$150
$200
FY 2013 FY 2014 FY 2015 FY 2016 FY 2017
Cost per Revenue Hour
125Supplemental
Days of Service School DaysAvg Freq (Wkdy Peak) 4 trips
Avg Freq (Wkdy Non-Peak) -Avg Freq (Wked) -
FY 2017 Farebox Recovery 16 transfer (to route) 1
Clipper usage 8
Annual Avg Monthly Avg Daily Annual Avg Monthly Avg Daily Annual Avg Monthly Avg DailyWeekday 13757 1251 76 600 55 3 8580 780 48 Saturday - - - - - - - - - Sunday - - - - - - - - -
Total 13757 1251 76 600 55 3 8580 780 48
Annual Avg Monthly Avg Daily Annual Avg Monthly Avg Daily Annual Avg Monthly Avg DailyWeekday $72469 $6588 $403 $11570 $1052 $64 $60899 $5536 $338Saturday $ - $ - $ - $ - $ - $ - $ - $ - $ -Sunday $ - $ - $ - $ - $ - $ - $ - $ - $ -
Total $72469 $6588 $403 $11570 $1052 $64 $60899 $5536 $338
Passengers per TripSubsidy per
PassengerCost per Revenue
HourFarebox Recovery
Weekday 193 $443 $12086 160Saturday - $ - $ - - Sunday - $ - $ - -
Total 193 $443 $12086 160
Passengers Revenue Hours Operating CostsPassenger
RevenueOperating Subsidy Passengers per Trip
Subsidy per Passenger
Cost per Revenue Hour
Farebox Recovery
FY 2015 13298 578 $87015 $11914 $75101 186 $565 $15054 137FY 2016 13197 595 $77991 $12684 $65307 182 $495 $13117 163FY 2017 13757 600 $72469 $11570 $60899 193 $443 $12086 160
Histo
ric Tr
ends
FY 20
161
7 DAT
A
Passengers Revenue Hours Revenue Miles
Operating Costs Passenger Revenue Operating Subsidy
8798 7189
13298 13197 13757
02000400060008000
10000120001400016000
FY 2013 FY 2014 FY 2015 FY 2016 FY 2017
Passengers
100 90
578 595 600
0
100
200
300
400
500
600
700
FY 2013 FY 2014 FY 2015 FY 2016 FY 2017
Revenue Hours
$13752 $10979
$87015 $77991
$72469
$0
$20000
$40000
$60000
$80000
$100000
FY 2013 FY 2014 FY 2015 FY 2016 FY 2017
Operating Costs
492
402
186 182 193
00
100
200
300
400
500
FY 2013 FY 2014 FY 2015 FY 2016 FY 2017
Passengers per Trip
$015 $002
$565 $495
$443
$000$100$200$300$400$500$600$700$800
FY 2013 FY 2014 FY 2015 FY 2016 FY 2017
Subsidy per Passenger$13821
$12267
$15054 $13117
$12086
$0$20$40$60$80
$100$120$140$160
FY 2013 FY 2014 FY 2015 FY 2016 FY 2017
Cost per Revenue Hour
139Supplemental
Days of Service School DaysAvg Freq (Wkdy Peak) 2 trips
Avg Freq (Wkdy Non-Peak) -Avg Freq (Wked) -
FY 2017 Farebox Recovery 20 transfer (to route) 0
Clipper usage 24
Annual Avg Monthly Avg Daily Annual Avg Monthly Avg Daily Annual Avg Monthly Avg DailyWeekday 6414 583 36 253 23 1 4127 375 23 Saturday - - - - - - - - - Sunday - - - - - - - - -
Total 6414 583 36 253 23 1 4127 375 23
Annual Avg Monthly Avg Daily Annual Avg Monthly Avg Daily Annual Avg Monthly Avg DailyWeekday $33182 $3017 $184 $6635 $603 $37 $26547 $2413 $147Saturday $ - $ - $ - $ - $ - $ - $ - $ - $ -Sunday $ - $ - $ - $ - $ - $ - $ - $ - $ -
Total $33182 $3017 $184 $6635 $603 $37 $26547 $2413 $147
Passengers per TripSubsidy per
PassengerCost per Revenue
HourFarebox Recovery
Weekday 179 $414 $13110 200Saturday - $ - $ - - Sunday - $ - $ - -
Total 179 $414 $13110 200
Passengers Revenue Hours Operating CostsPassenger
RevenueOperating Subsidy Passengers per Trip
Subsidy per Passenger
Cost per Revenue Hour
Farebox Recovery
FY 2015 5906 225 $36437 $5258 $31179 164 $528 $16173 144FY 2016 6391 315 $43776 $6241 $37535 160 $587 $13880 143FY 2017 6414 253 $33182 $6635 $26547 179 $414 $13110 200
Histo
ric Tr
ends
FY 20
161
7 DAT
A
Passengers Revenue Hours Revenue Miles
Operating Costs Passenger Revenue Operating Subsidy
4232 4026
5906 6391 6414
0
1000
2000
3000
4000
5000
6000
7000
FY 2013 FY 2014 FY 2015 FY 2016 FY 2017
Passengers
226 227 225
315
253
0
50
100
150
200
250
300
350
FY 2013 FY 2014 FY 2015 FY 2016 FY 2017
Revenue Hours
$31306 $27734
$36437
$43776
$33182
$0
$10000
$20000
$30000
$40000
$50000
FY 2013 FY 2014 FY 2015 FY 2016 FY 2017
Operating Costs
120 111 164 160 179
00
100
200
300
400
500
FY 2013 FY 2014 FY 2015 FY 2016 FY 2017
Passengers per Trip
$427
$628 $528
$587
$414
$000$100$200$300$400$500$600$700$800
FY 2013 FY 2014 FY 2015 FY 2016 FY 2017
Subsidy per Passenger
$13834 $12239
$16173 $13880 $13110
$0
$50
$100
$150
$200
FY 2013 FY 2014 FY 2015 FY 2016 FY 2017
Cost per Revenue Hour
145Supplemental
Days of Service School DaysAvg Freq (Wkdy Peak) 2-3 trips
Avg Freq (Wkdy Non-Peak) -Avg Freq (Wked) -
FY 2017 Farebox Recovery 29 transfer (to route) 5
Clipper usage 2
Annual Avg Monthly Avg Daily Annual Avg Monthly Avg Daily Annual Avg Monthly Avg DailyWeekday 16406 1491 90 191 17 1 2175 198 12 Saturday - - - - - - - - - Sunday - - - - - - - - -
Total 16406 1491 90 191 17 1 2175 198 12
Annual Avg Monthly Avg Daily Annual Avg Monthly Avg Daily Annual Avg Monthly Avg DailyWeekday $25426 $2311 $139 $7258 $660 $40 $18168 $1652 $99Saturday $ - $ - $ - $ - $ - $ - $ - $ - $ -Sunday $ - $ - $ - $ - $ - $ - $ - $ - $ -
Total $25426 $2311 $139 $7258 $660 $40 $18168 $1652 $99
Passengers per TripSubsidy per
PassengerCost per Revenue
HourFarebox Recovery
Weekday 372 $111 $13347 285Saturday - $ - $ - - Sunday - $ - $ - -
Total 372 $111 $13347 285
Passengers Revenue Hours Operating CostsPassenger
RevenueOperating Subsidy Passengers per Trip
Subsidy per Passenger
Cost per Revenue Hour
Farebox Recovery
FY 2015 6911 87 $13373 $5858 $7515 337 $109 $15442 438FY 2016 10268 167 $21672 $6341 $15331 396 $149 $12993 293FY 2017 16406 191 $25426 $7258 $18168 372 $111 $13347 285
Histo
ric Tr
ends
FY 20
161
7 DAT
A
Passengers Revenue Hours Revenue Miles
Operating Costs Passenger Revenue Operating Subsidy
6911
10268
16406
0
5000
10000
15000
20000
FY 2013 FY 2014 FY 2015 FY 2016 FY 2017
Passengers
87
167 191
0
50
100
150
200
250
FY 2013 FY 2014 FY 2015 FY 2016 FY 2017
Revenue Hours
$13373
$21672 $25426
$0
$5000
$10000
$15000
$20000
$25000
$30000
FY 2013 FY 2014 FY 2015 FY 2016 FY 2017
Operating Costs
337 396 372
00
100
200
300
400
500
FY 2013 FY 2014 FY 2015 FY 2016 FY 2017
Passengers per Trip
$109 $149 $111
$000$100$200$300$400$500$600$700$800
FY 2013 FY 2014 FY 2015 FY 2016 FY 2017
Subsidy per Passenger
$15442 $12993 $13347
$0
$50
$100
$150
$200
FY 2013 FY 2014 FY 2015 FY 2016 FY 2017
Cost per Revenue Hour
151Supplemental
Days of Service School DaysAvg Freq (Wkdy Peak) 4-5 trips
Avg Freq (Wkdy Non-Peak) -Avg Freq (Wked) -
FY 2017 Farebox Recovery 25 transfer (to route) 1
Clipper usage 4
Annual Avg Monthly Avg Daily Annual Avg Monthly Avg Daily Annual Avg Monthly Avg DailyWeekday 36801 3346 204 594 54 3 10649 968 59 Saturday - - - - - - - - - Sunday - - - - - - - - -
Total 36801 3346 204 594 54 3 10649 968 59
Annual Avg Monthly Avg Daily Annual Avg Monthly Avg Daily Annual Avg Monthly Avg DailyWeekday $73842 $6713 $410 $18463 $1678 $103 $55379 $5034 $308Saturday $ - $ - $ - $ - $ - $ - $ - $ - $ -Sunday $ - $ - $ - $ - $ - $ - $ - $ - $ -
Total $73842 $6713 $410 $18463 $1678 $103 $55379 $5034 $308
Passengers per TripSubsidy per
PassengerCost per Revenue
HourFarebox Recovery
Weekday 428 $150 $12442 250Saturday - $ - $ - - Sunday - $ - $ - -
Total 428 $150 $12442 250
Passengers Revenue Hours Operating CostsPassenger
RevenueOperating Subsidy Passengers per Trip
Subsidy per Passenger
Cost per Revenue Hour
Farebox Recovery
FY 2015 39309 911 $134174 $34376 $99798 315 $254 $14722 256FY 2016 42643 759 $100712 $25851 $74861 456 $176 $13267 257FY 2017 36801 594 $73842 $18463 $55379 428 $150 $12442 250
Histo
ric Tr
ends
FY 20
161
7 DAT
A
Passengers Revenue Hours Revenue Miles
Operating Costs Passenger Revenue Operating Subsidy
39537 39309
42643
36801
32000
34000
36000
38000
40000
42000
44000
FY 2013 FY 2014 FY 2015 FY 2016 FY 2017
Passengers
784 911
759
594
0
200
400
600
800
1000
FY 2013 FY 2014 FY 2015 FY 2016 FY 2017
Revenue Hours
$95932
$134174
$100712
$73842
$0$20000$40000$60000$80000
$100000$120000$140000$160000
FY 2013 FY 2014 FY 2015 FY 2016 FY 2017
Operating Costs
368 315
456 428
00
100
200
300
400
500
FY 2013 FY 2014 FY 2015 FY 2016 FY 2017
Passengers per Trip
$188 $254
$176 $150
$000$100$200$300$400$500$600$700$800
FY 2013 FY 2014 FY 2015 FY 2016 FY 2017
Subsidy per Passenger
$12233
$14722 $13267 $12442
$0$20$40$60$80
$100$120$140$160
FY 2013 FY 2014 FY 2015 FY 2016 FY 2017
Cost per Revenue Hour
154Supplemental
Days of Service School DaysAvg Freq (Wkdy Peak) 3 trips
Avg Freq (Wkdy Non-Peak) -Avg Freq (Wked) -
FY 2017 Farebox Recovery 21 transfer (to route) 0
Clipper usage 5
Annual Avg Monthly Avg Daily Annual Avg Monthly Avg Daily Annual Avg Monthly Avg DailyWeekday 13738 1249 76 358 33 2 4342 395 24 Saturday - - - - - - - - - Sunday - - - - - - - - -
Total 13738 1249 76 358 33 2 4342 395 24
Annual Avg Monthly Avg Daily Annual Avg Monthly Avg Daily Annual Avg Monthly Avg DailyWeekday $41965 $3815 $233 $8847 $804 $49 $33118 $3011 $184Saturday $ - $ - $ - $ - $ - $ - $ - $ - $ -Sunday $ - $ - $ - $ - $ - $ - $ - $ - $ -
Total $41965 $3815 $233 $8847 $804 $49 $33118 $3011 $184
Passengers per TripSubsidy per
PassengerCost per Revenue
HourFarebox Recovery
Weekday 255 $241 $11729 211Saturday - $ - $ - - Sunday - $ - $ - -
Total 255 $241 $11729 211
Passengers Revenue Hours Operating CostsPassenger
RevenueOperating Subsidy Passengers per Trip
Subsidy per Passenger
Cost per Revenue Hour
Farebox Recovery
FY 2015 15376 293 $42604 $13174 $29430 388 $191 $14541 309FY 2016 17858 360 $46133 $14660 $31473 311 $176 $12808 318FY 2017 13738 358 $41965 $8847 $33118 255 $241 $11729 211
Histo
ric Tr
ends
FY 20
161
7 DAT
A
Passengers Revenue Hours Revenue Miles
Operating Costs Passenger Revenue Operating Subsidy
12138
15376 17858
13738
0
5000
10000
15000
20000
FY 2013 FY 2014 FY 2015 FY 2016 FY 2017
Passengers
310 293
360 358
050
100150200250300350400
FY 2013 FY 2014 FY 2015 FY 2016 FY 2017
Revenue Hours
$37913 $42604
$46133 $41965
$0
$10000
$20000
$30000
$40000
$50000
FY 2013 FY 2014 FY 2015 FY 2016 FY 2017
Operating Costs
291
388
311 255
00
100
200
300
400
500
FY 2013 FY 2014 FY 2015 FY 2016 FY 2017
Passengers per Trip
$256 $191 $176
$241
$000$100$200$300$400$500$600$700$800
FY 2013 FY 2014 FY 2015 FY 2016 FY 2017
Subsidy per Passenger
$12246
$14541 $12808
$11729
$0$20$40$60$80
$100$120$140$160
FY 2013 FY 2014 FY 2015 FY 2016 FY 2017
Cost per Revenue Hour
219Local Connector
Days of Service Wkdy Sa SuAvg Freq (Wkdy Peak) 30 min
Avg Freq (Wkdy Non-Peak) 30 minAvg Freq (Wked) 30 min
FY 2017 Farebox Recovery 11 transfer (to route) 20
Clipper usage 11
Annual Avg Monthly Avg Daily Annual Avg Monthly Avg Daily Annual Avg Monthly Avg DailyWeekday 40817 3401 161 5020 418 20 58766 4897 232 Saturday 4888 407 94 637 53 12 10931 911 210 Sunday 4744 395 79 735 61 12 12607 1051 210
Total 50449 4204 138 6392 533 18 82304 6859 225
Annual Avg Monthly Avg Daily Annual Avg Monthly Avg Daily Annual Avg Monthly Avg DailyWeekday $462388 $38532 $1828 $51411 $4284 $203 $410977 $34248 $1624Saturday $59904 $4992 $1152 $6230 $519 $120 $53674 $4473 $1032Sunday $68932 $5744 $1149 $6460 $538 $108 $62472 $5206 $1041
Total $591224 $49269 $1620 $64101 $5342 $176 $527123 $43927 $1444
Passengers per Revenue Hour
Subsidy per Passenger
Cost per Revenue Hour
Farebox Recovery
Weekday 81 $1007 $9212 111Saturday 77 $1098 $9401 104Sunday 65 $1317 $9381 94
Total 79 $1045 $9250 108
Passengers Revenue Hours Operating CostsPassenger
RevenueOperating Subsidy
Passengers per Revenue Hour
Subsidy per Passenger
Cost per Revenue Hour
Farebox Recovery
FY 2015 60906 6585 $569962 $65747 $504215 92 $828 $8656 115FY 2016 55610 6591 $590663 $73164 $517499 84 $931 $8961 124FY 2017 50449 6392 $591224 $64101 $527123 79 $1045 $9250 108
Histo
ric Tr
ends
FY 20
161
7 DAT
A
Passengers Revenue Hours Revenue Miles
Operating Costs Passenger Revenue Operating Subsidy
55543 60906
55610 50449
0
10000
20000
30000
40000
50000
60000
70000
FY 2013 FY 2014 FY 2015 FY 2016 FY 2017
Passengers
5734
6585 6591 6392
520054005600580060006200640066006800
FY 2013 FY 2014 FY 2015 FY 2016 FY 2017
Revenue Hours
$522978
$569962
$590663 $591224
$480000
$500000
$520000
$540000
$560000
$580000
$600000
FY 2013 FY 2014 FY 2015 FY 2016 FY 2017
Operating Costs
97 92 84 79
00
20
40
60
80
100
120
140
FY 2013 FY 2014 FY 2015 FY 2016 FY 2017
Passengers per Revenue Hour
$851 $828 $931
$1045
$000$200$400$600$800
$1000$1200$1400
FY 2013 FY 2014 FY 2015 FY 2016 FY 2017
Subsidy per Passenger
$9121 $8656 $8961 $9250
$0
$50
$100
$150
$200
FY 2013 FY 2014 FY 2015 FY 2016 FY 2017
Cost per Revenue Hour
228Local Connector
Days of Service Wkdy Sa SuAvg Freq (Wkdy Peak) 60 min
Avg Freq (Wkdy Non-Peak) 60 minAvg Freq (Wked) 60 min
FY 2017 Farebox Recovery 11 transfer (to route) 17
Clipper usage 15
Annual Avg Monthly Avg Daily Annual Avg Monthly Avg Daily Annual Avg Monthly Avg DailyWeekday 57316 4776 227 7175 598 28 65884 5490 260 Saturday 8218 685 158 1331 111 26 13020 1085 250 Sunday 5806 484 97 1536 128 26 15023 1252 250
Total 71340 5945 195 10042 837 28 93926 7827 257
Annual Avg Monthly Avg Daily Annual Avg Monthly Avg Daily Annual Avg Monthly Avg DailyWeekday $646194 $53850 $2554 $80857 $6738 $320 $565337 $47111 $2235Saturday $120205 $10017 $2312 $12568 $1047 $242 $107637 $8970 $2070Sunday $138407 $11534 $2307 $10487 $874 $175 $127920 $10660 $2132
Total $904806 $75401 $2479 $103912 $8659 $285 $800894 $66741 $2194
Passengers per Revenue Hour
Subsidy per Passenger
Cost per Revenue Hour
Farebox Recovery
Weekday 80 $986 $9006 125Saturday 62 $1310 $9030 105Sunday 38 $2203 $9011 76
Total 71 $1123 $9010 115
Passengers Revenue Hours Operating CostsPassenger
RevenueOperating Subsidy
Passengers per Revenue Hour
Subsidy per Passenger
Cost per Revenue Hour
Farebox Recovery
FY 2015 15287 2828 $239879 $18274 $221605 54 $1450 $8482 76FY 2016 17522 3185 $280634 $28092 $252542 55 $1441 $8812 100FY 2017 71340 10042 $904806 $103912 $800894 71 $1123 $9010 115
Histo
ric Tr
ends
FY 20
161
7 DAT
A
Passengers Revenue Hours Revenue Miles
Operating Costs Passenger Revenue Operating Subsidy
5854 15287 17522
71340
01000020000300004000050000600007000080000
FY 2013 FY 2014 FY 2015 FY 2016 FY 2017
Passengers
970
2828 3185
10042
0
2000
4000
6000
8000
10000
12000
FY 2013 FY 2014 FY 2015 FY 2016 FY 2017
Revenue Hours
$85183
$239879 $280634
$904806
$0
$200000
$400000
$600000
$800000
$1000000
FY 2013 FY 2014 FY 2015 FY 2016 FY 2017
Operating Costs
60 54 55 71
00
20
40
60
80
100
120
140
FY 2013 FY 2014 FY 2015 FY 2016 FY 2017
Passengers per Revenue Hour$1358
$1450 $1441
$1123
$000$200$400$600$800
$1000$1200$1400
FY 2013 FY 2014 FY 2015 FY 2016 FY 2017
Subsidy per Passenger
$8779 $8482 $8812 $9010
$0
$50
$100
$150
$200
FY 2013 FY 2014 FY 2015 FY 2016 FY 2017
Cost per Revenue Hour
233Local Connector
Days of Service Wkdy Sa SuAvg Freq (Wkdy Peak) 60 min
Avg Freq (Wkdy Non-Peak) 60 minAvg Freq (Wked) 60 min
FY 2017 Farebox Recovery 13 transfer (to route) 16
Clipper usage 10
Annual Avg Monthly Avg Daily Annual Avg Monthly Avg Daily Annual Avg Monthly Avg DailyWeekday 35589 2966 141 3306 276 13 38809 3234 153 Saturday 3911 326 75 490 41 9 5829 486 112 Sunday 3298 275 55 566 47 9 6726 561 112
Total 42798 3567 117 4363 364 12 51364 4280 141
Annual Avg Monthly Avg Daily Annual Avg Monthly Avg Daily Annual Avg Monthly Avg DailyWeekday $302758 $25230 $1197 $42450 $3538 $168 $260308 $21692 $1029Saturday $44829 $3736 $862 $5018 $418 $97 $39811 $3318 $766Sunday $51616 $4301 $860 $4533 $378 $76 $47083 $3924 $785
Total $399203 $33267 $1094 $52001 $4333 $142 $347202 $28934 $951
Passengers per Revenue Hour
Subsidy per Passenger
Cost per Revenue Hour
Farebox Recovery
Weekday 108 $731 $9158 140Saturday 80 $1018 $9141 112Sunday 58 $1428 $9118 88
Total 98 $811 $9151 130
Passengers Revenue Hours Operating CostsPassenger
RevenueOperating Subsidy
Passengers per Revenue Hour
Subsidy per Passenger
Cost per Revenue Hour
Farebox Recovery
FY 2015 50342 4366 $371602 $52526 $319076 115 $634 $8512 141FY 2016 49494 4384 $388005 $59296 $328709 113 $664 $8851 153FY 2017 42798 4363 $399203 $52001 $347202 98 $811 $9151 130
Histo
ric Tr
ends
FY 20
161
7 DAT
A
Passengers Revenue Hours Revenue Miles
Operating Costs Passenger Revenue Operating Subsidy
39956
50422 50342 49494 42798
0
10000
20000
30000
40000
50000
60000
FY 2013 FY 2014 FY 2015 FY 2016 FY 2017
Passengers
3981
4144
4366 4384 4363
370038003900400041004200430044004500
FY 2013 FY 2014 FY 2015 FY 2016 FY 2017
Revenue Hours
$350499
$378792 $371602
$388005 $399203
$320000$330000$340000$350000$360000$370000$380000$390000$400000$410000
FY 2013 FY 2014 FY 2015 FY 2016 FY 2017
Operating Costs
100
122 115 113 98
00
20
40
60
80
100
120
140
FY 2013 FY 2014 FY 2015 FY 2016 FY 2017
Passengers per Revenue Hour
$760 $661 $634 $664
$811
$000$200$400$600$800
$1000$1200$1400
FY 2013 FY 2014 FY 2015 FY 2016 FY 2017
Subsidy per Passenger
$8805 $9142 $8512 $8851 $9151
$0
$50
$100
$150
$200
FY 2013 FY 2014 FY 2015 FY 2016 FY 2017
Cost per Revenue Hour
245Local Connector
Days of Service Wkdy Sa SuAvg Freq (Wkdy Peak) 60 min
Avg Freq (Wkdy Non-Peak) 60 minAvg Freq (Wked) 60 min
FY 2017 Farebox Recovery 15 transfer (to route) 13
Clipper usage 13
Annual Avg Monthly Avg Daily Annual Avg Monthly Avg Daily Annual Avg Monthly Avg DailyWeekday 41761 3480 165 3014 251 12 28706 2392 113 Saturday 4220 352 81 620 52 12 5778 482 111 Sunday 3785 315 63 715 60 12 6667 556 111
Total 49766 4147 136 4349 362 12 41152 3429 113
Annual Avg Monthly Avg Daily Annual Avg Monthly Avg Daily Annual Avg Monthly Avg DailyWeekday $271762 $22647 $1074 $44873 $3739 $177 $226889 $18907 $897Saturday $55697 $4641 $1071 $6217 $518 $120 $49480 $4123 $952Sunday $64137 $5345 $1069 $5878 $490 $98 $58259 $4855 $971
Total $391596 $32633 $1073 $56968 $4747 $156 $334628 $27886 $917
Passengers per Revenue Hour
Subsidy per Passenger
Cost per Revenue Hour
Farebox Recovery
Weekday 139 $543 $9016 165Saturday 68 $1173 $8988 112Sunday 53 $1539 $8970 92
Total 114 $672 $9004 145
Passengers Revenue Hours Operating CostsPassenger
RevenueOperating Subsidy
Passengers per Revenue Hour
Subsidy per Passenger
Cost per Revenue Hour
Farebox Recovery
FY 2015FY 2016 2184 227 $19695 $3137 $16558 96 $758 $8695 159FY 2017 49766 4349 $391596 $56968 $334628 114 $672 $9004 145
Histo
ric Tr
ends
FY 20
161
7 DAT
A
Passengers Revenue Hours Revenue Miles
Operating Costs Passenger Revenue Operating Subsidy
2184
49766
0
10000
20000
30000
40000
50000
60000
FY 2013 FY 2014 FY 2015 FY 2016 FY 2017
Passengers
227
4349
0
1000
2000
3000
4000
5000
FY 2013 FY 2014 FY 2015 FY 2016 FY 2017
Revenue Hours
$19695
$391596
$0
$100000
$200000
$300000
$400000
$500000
FY 2013 FY 2014 FY 2015 FY 2016 FY 2017
Operating Costs
96 114
00
20
40
60
80
100
120
140
FY 2013 FY 2014 FY 2015 FY 2016 FY 2017
Passengers per Revenue Hour
$758 $672
$000$200$400$600$800
$1000$1200$1400
FY 2013 FY 2014 FY 2015 FY 2016 FY 2017
Subsidy per Passenger
$8695 $9004
$0
$50
$100
$150
$200
FY 2013 FY 2014 FY 2015 FY 2016 FY 2017
Cost per Revenue Hour
251Local Connector
Days of Service Wkdy Sa SuAvg Freq (Wkdy Peak) 60 min
Avg Freq (Wkdy Non-Peak) 60 minAvg Freq (Wked) 60 min
FY 2017 Farebox Recovery 11 transfer (to route) 8
Clipper usage 8
Annual Avg Monthly Avg Daily Annual Avg Monthly Avg Daily Annual Avg Monthly Avg DailyWeekday 76675 6390 303 6754 563 27 95654 7971 378 Saturday 9952 829 191 1325 110 25 18630 1553 358 Sunday 8879 740 148 1528 127 25 21497 1791 358
Total 95506 7959 262 9607 801 26 135781 11315 372
Annual Avg Monthly Avg Daily Annual Avg Monthly Avg Daily Annual Avg Monthly Avg DailyWeekday $625542 $52129 $2472 $78006 $6501 $308 $547536 $45628 $2164Saturday $122485 $10207 $2355 $12104 $1009 $233 $110381 $9198 $2123Sunday $140992 $11749 $2350 $11713 $976 $195 $129279 $10773 $2155
Total $889019 $74085 $2436 $101823 $8485 $279 $787196 $65600 $2157
Passengers per Revenue Hour
Subsidy per Passenger
Cost per Revenue Hour
Farebox Recovery
Weekday 114 $714 $9262 125Saturday 75 $1109 $9246 99Sunday 58 $1456 $9225 83
Total 99 $824 $9254 115
Passengers Revenue Hours Operating CostsPassenger
RevenueOperating Subsidy
Passengers per Revenue Hour
Subsidy per Passenger
Cost per Revenue Hour
Farebox Recovery
FY 2015 97647 9172 $800242 $103081 $697161 106 $714 $8725 129FY 2016 98886 9226 $831623 $120959 $710664 107 $719 $9014 145FY 2017 95506 9607 $889019 $101823 $787196 99 $824 $9254 115
Histo
ric Tr
ends
FY 20
161
7 DAT
A
Passengers Revenue Hours Revenue Miles
Operating Costs Passenger Revenue Operating Subsidy
87073
97647 98886
95506
80000
85000
90000
95000
100000
FY 2013 FY 2014 FY 2015 FY 2016 FY 2017
Passengers
8322
9172 9226
9607
7500
8000
8500
9000
9500
10000
FY 2013 FY 2014 FY 2015 FY 2016 FY 2017
Revenue Hours
$772570
$800242
$831623
$889019
$700000
$750000
$800000
$850000
$900000
FY 2013 FY 2014 FY 2015 FY 2016 FY 2017
Operating Costs
105 106 107 99
00
20
40
60
80
100
120
140
FY 2013 FY 2014 FY 2015 FY 2016 FY 2017
Passengers per Revenue Hour
$797 $714 $719
$824
$000$200$400$600$800
$1000$1200$1400
FY 2013 FY 2014 FY 2015 FY 2016 FY 2017
Subsidy per Passenger
$9284 $8725 $9014 $9254
$0
$50
$100
$150
$200
FY 2013 FY 2014 FY 2015 FY 2016 FY 2017
Cost per Revenue Hour
257Local Connector
Days of Service WkdyAvg Freq (Wkdy Peak) 60 min
Avg Freq (Wkdy Non-Peak) 60 minAvg Freq (Wked) -
FY 2017 Farebox Recovery 12 transfer (to route) 6
Clipper usage 13
Annual Avg Monthly Avg Daily Annual Avg Monthly Avg Daily Annual Avg Monthly Avg DailyWeekday 69126 5761 273 7643 637 30 85748 7146 339 Saturday - - - - - - - - - Sunday - - - - - - - - -
Total 69126 5761 273 7643 637 30 85748 7146 339
Annual Avg Monthly Avg Daily Annual Avg Monthly Avg Daily Annual Avg Monthly Avg DailyWeekday $697953 $58163 $2759 $82621 $6885 $327 $615332 $51278 $2432Saturday $ - $ - $ - $ - $ - $ - $ - $ - $ -Sunday $ - $ - $ - $ - $ - $ - $ - $ - $ -
Total $697953 $58163 $2759 $82621 $6885 $327 $615332 $51278 $2432
Passengers per Revenue Hour
Subsidy per Passenger
Cost per Revenue Hour
Farebox Recovery
Weekday 90 $890 $9132 118Saturday - $ - $ - - Sunday - $ - $ - -
Total 90 $890 $9132 118
Passengers Revenue Hours Operating CostsPassenger
RevenueOperating Subsidy
Passengers per Revenue Hour
Subsidy per Passenger
Cost per Revenue Hour
Farebox Recovery
FY 2015 69984 6289 $546363 $73402 $472961 111 $676 $8687 134FY 2016 71429 6414 $575805 $83288 $492517 111 $690 $8977 145FY 2017 69126 7643 $697953 $82621 $615332 90 $890 $9132 118
Histo
ric Tr
ends
FY 20
161
7 DAT
A
Passengers Revenue Hours Revenue Miles
Operating Costs Passenger Revenue Operating Subsidy
35511
68515 69984 71429 69126
01000020000300004000050000600007000080000
FY 2013 FY 2014 FY 2015 FY 2016 FY 2017
Passengers
2909
5965 6289 6414 7643
0
2000
4000
6000
8000
10000
FY 2013 FY 2014 FY 2015 FY 2016 FY 2017
Revenue Hours
$263500
$555608 $546363 $575805
$697953
$0$100000$200000$300000$400000$500000$600000$700000$800000
FY 2013 FY 2014 FY 2015 FY 2016 FY 2017
Operating Costs
122 115 111 111
90
00
20
40
60
80
100
120
140
FY 2013 FY 2014 FY 2015 FY 2016 FY 2017
Passengers per Revenue Hour
$625 $721 $676 $690
$890
$000$200$400$600$800
$1000$1200$1400
FY 2013 FY 2014 FY 2015 FY 2016 FY 2017
Subsidy per Passenger
$9057 $9315 $8687 $8977 $9132
$0
$50
$100
$150
$200
FY 2013 FY 2014 FY 2015 FY 2016 FY 2017
Cost per Revenue Hour
Hdn ValleyYellow Bus
Days of Service School DaysAvg Freq (Wkdy Peak) 2 trips
Avg Freq (Wkdy Non-Peak) -Avg Freq (Wked) -
FY 2017 Farebox Recovery 26 transfer (to route) -
Clipper usage -
Annual Avg Monthly Avg Daily Annual Avg Monthly Avg Daily Annual Avg Monthly Avg DailyWeekday 9281 844 52 180 16 1 1638 149 9 Saturday - - - - - - - - - Sunday - - - - - - - - -
Total 9281 844 52 180 16 1 1638 149 9
Annual Avg Monthly Avg Daily Annual Avg Monthly Avg Daily Annual Avg Monthly Avg DailyWeekday $124763 $11342 $693 $32170 $2925 $179 $92593 $8418 $514Saturday $ - $ - $ - $ - $ - $ - $ - $ - $ -Sunday $ - $ - $ - $ - $ - $ - $ - $ - $ -
Total $124763 $11342 $693 $32170 $2925 $179 $92593 $8418 $514
Passengers per Revenue Hour
Subsidy per Passenger
Cost per Revenue Hour
Farebox Recovery
Weekday 516 $998 $69313 258Saturday - $ - $ - - Sunday - $ - $ - -
Total 516 $998 $69313 258
Passengers Revenue Hours Operating CostsPassenger
RevenueOperating Subsidy
Passengers per Revenue Hour
Subsidy per Passenger
Cost per Revenue Hour
Farebox Recovery
FY 2015FY 2016 8669 211 $140482 $25658 $114824 412 $1325 $66706 183FY 2017 9281 180 $124763 $32170 $92593 516 $998 $69313 258
Histo
ric Tr
ends
FY 20
161
7 DAT
A
Passengers Revenue Hours Revenue Miles
Operating Costs Passenger Revenue Operating Subsidy
8669 9281
0
2000
4000
6000
8000
10000
FY 2013 FY 2014 FY 2015 FY 2016 FY 2017
Passengers211
180
0
50
100
150
200
250
FY 2013 FY 2014 FY 2015 FY 2016 FY 2017
Revenue Hours$140482
$124763
$0$20000$40000$60000$80000
$100000$120000$140000$160000
FY 2013 FY 2014 FY 2015 FY 2016 FY 2017
Operating Costs
412 516
00
500
1000
1500
2000
FY 2013 FY 2014 FY 2015 FY 2016 FY 2017
Passengers per Revenue Hour
$1325
$998
$000
$200
$400
$600
$800
$1000
$1200
$1400
FY 2013 FY 2014 FY 2015 FY 2016 FY 2017
Subsidy per Passenger
$66706 $69313
$0$100$200$300$400$500$600$700$800
FY 2013 FY 2014 FY 2015 FY 2016 FY 2017
Cost per Revenue Hour
White HillYellow Bus
Days of Service School DaysAvg Freq (Wkdy Peak) 17 trips
Avg Freq (Wkdy Non-Peak) -Avg Freq (Wked) -
FY 2017 Farebox Recovery 60 transfer (to route) -
Clipper usage -
Annual Avg Monthly Avg Daily Annual Avg Monthly Avg Daily Annual Avg Monthly Avg DailyWeekday 127219 11565 707 1065 97 6 12096 1100 67 Saturday - - - - - - - - - Sunday - - - - - - - - -
Total 127219 11565 707 1065 97 6 12096 1100 67
Annual Avg Monthly Avg Daily Annual Avg Monthly Avg Daily Annual Avg Monthly Avg DailyWeekday $738585 $67144 $4103 $440896 $40081 $2449 $297689 $27063 $1654Saturday $ - $ - $ - $ - $ - $ - $ - $ - $ -Sunday $ - $ - $ - $ - $ - $ - $ - $ - $ -
Total $738585 $67144 $4103 $440896 $40081 $2449 $297689 $27063 $1654
Passengers per Revenue Hour
Subsidy per Passenger
Cost per Revenue Hour
Farebox Recovery
Weekday 1194 $234 $69325 597Saturday - $ - $ - - Sunday - $ - $ - -
Total 1194 $234 $69325 597
Passengers Revenue Hours Operating CostsPassenger
RevenueOperating Subsidy
Passengers per Revenue Hour
Subsidy per Passenger
Cost per Revenue Hour
Farebox Recovery
FY 2015FY 2016 129635 870 $579937 $385753 $194184 1491 $150 $66698 665FY 2017 127219 1065 $738585 $440896 $297689 1194 $234 $69325 597
Histo
ric Tr
ends
FY 20
161
7 DAT
A
Passengers Revenue Hours Revenue Miles
Operating Costs Passenger Revenue Operating Subsidy
129635 127219
0
20000
40000
60000
80000
100000
120000
140000
FY 2013 FY 2014 FY 2015 FY 2016 FY 2017
Passengers
870
1065
0
200
400
600
800
1000
1200
FY 2013 FY 2014 FY 2015 FY 2016 FY 2017
Revenue Hours
$579937
$738585
$0$100000$200000$300000$400000$500000$600000$700000$800000
FY 2013 FY 2014 FY 2015 FY 2016 FY 2017
Operating Costs
1491
1194
00200400600800
1000120014001600
FY 2013 FY 2014 FY 2015 FY 2016 FY 2017
Passengers per Revenue Hour
$150 $234
$000
$200
$400
$600
$800
$1000
$1200
$1400
FY 2013 FY 2014 FY 2015 FY 2016 FY 2017
Subsidy per Passenger$66698 $69325
$0$100$200$300$400$500$600$700$800
FY 2013 FY 2014 FY 2015 FY 2016 FY 2017
Cost per Revenue Hour
MARIN TRANSIT | 2018ndash2027 SHORT RANGE TRANSIT PLAN Chapter 4 Capital Plan
DRAFT 4-9
Table 4-7 Local Transit Bus Replacement Schedule
Fiscal Year (In-service)
Replacements
Total Cost
Local Share Vehicle Type Seating
Capacity Service(1)
FY 201718 10 $7710000 $1387800 40ft hybrid 39 LB
2 $1662000 $332404 35ft Electric 32 LB
FY 201819
1 $125000 $22500 24ft 20 SH
4 $1600000 $1094880 29ft XHF
(upgrade) 22 SG
FY 201920 10 $8940000 $1609200 60ft 63 LB
FY 202021 8 $1032000 $185760 24ft 20 SH
2 $850000 $153000 35ft XHF 37 MW
FY 202223
7 $5584578 $1005224 35ft hybrid 32 LB
2 $874182 $599281 29ft XHF
(upgrade) 22 SG
FY 202425 3 $1393227 $250781 35ft XHF 37 MW
FY 202526 2 $299093 $53837 24ft 20 SH
5 $2391706 $430507 35ft XHF 37 MW
FY 202627 - - - - - -
Notes (1) Service Types LB ndash Big Bus SH- Shuttle SG- Rural Stagecoach MW- Seasonal Muir Woods and School
Expansion Needs When considering service expansion vehicles are often a constraint on the amount of service that can be added Expansion vehicles are a lower priority in the regional capital plan and typically do not receive federal funds Local state or discretionary grants are required to expand fleets The capital plan does not include any expansion vehicles for the local fixed route program consistent with the current service plan
Marin Transit relies on three retired active vehicles to support operations Retired active vehicles are vehicles that are beyond their FTA-determined useful life that remain in service while their replacements are added the fleet The District intends to replace these as expansion vehicles if funding becomes available
Demand Response Vehicles
Marin Transit has 58 vehicles available for local and regional paratransit service To provide an adequate number of spare vehicles a maximum of about 46 vehicles in service Marin Transit owns 32 vehicles GGBHTD owns 14 and the contractor provides another 13 vehicles to support the operations Eleven of the 13 contractor vehicles will be replaced in early 2018 - five by the District and six by GGBHTD Two of the five replaced by the District will be replaced with smaller accessible vans These will be used for same day
Fixed-Route Passengers (incl Yellow Bus) by Month
July August September October November December January February March April May June
Prior Fiscal Year Passengers Current Fiscal Year PassengersPrior Fiscal Year Passengers Current Fiscal Year Passengers
0
80000
160000
240000
320000
244439
271284484271284
296637296637
2768532276853
252829252829
238010238010
219681219681
2097050505209705
277644277644
240773240773240773240773
284816284816
24935149492493512444392444392442 43999244439244244439439244439244244439999999244200
2600562602600 0000000260056
FISCAL YEAR
2018
Demand Response Passengers by Month
July August September October November December January February March April May June
Prior Fiscal Year Passengers Current Fiscal Year PassengersPrior Fiscal Year Passengers Current Fiscal Year Passengers
0
4000
8000
12000
16000
12 77312773
13631 1362813628 1356413564
1247712477
1206712067 1212412124118100011810
1364613646
1260912609
1359313593
12950129501277312 77312 77312 77312613131612 6133312 6133312613331277312773127731277312613
13 6311363113 631135641363113 613631311363113 6136313113564
Year-to-Date Ridership Trends
Item 3b
2
Average Systemwide Daily Passengers
Weekday Saturday Sunday
Prior Fiscal Year Average Daily Passengers Current Fiscal Year Average Daily PassengersPrior Fiscal Year Average Daily Passengers Current Fiscal Year Average Daily Passengers
0
3000
6000
9000
12000
11370113701109811098
7726772674407440
66576657
60556055
Productivity (paxhr) by Typology
1 Local T
runklin
e
2 Local B
asic
3 Local C
onnecto
r
5 R
ura
l
8 R
ecre
ational
9 D
em
and R
esponse
Prior Fiscal Year Productivity Current Fiscal Year ProductivityPrior Fiscal Year Productivity Current Fiscal Year Productivity
00
80
160
240
320
249249 252252
163163
14814 8148
9292 91918181
757 575
320320
275275
2323 2121
Monthly StatisticsMONTH
August
1 Local Trunkline Routes 35 36 71X
2 Local Basic Routes 17 22 23 23X 29 49
3 Local Connector Routes 219 228 233 245 251 257
5 Rural Routes 61 68
8 Recreational Routes 6666F
9 Demand Response Local Paratransit Novato Dial-A-Ride Rural Dial-A-Ride
Route Typologies
Item 3b
3
Fixed-Route Passengers (incl Yellow Bus) by Month
July August September October November December January February March April May June
Prior Fiscal Year Passengers Current Fiscal Year Passengers
0
80000
160000
240000
320000
244439244439
271284271284
296637296637
276853276853
252829252829
238010238010
219681219681209705209705
277644277644
240773240773
284816284816
249351249351244200244200
260056260056
282441282441
FISCAL YEAR
2018
Demand Response Passengers by Month
July August September October November December January February March April May June
Prior Fiscal Year Passengers Current Fiscal Year Passengers
0
4000
8000
12000
16000
1277312773
1363113631 1362813628 1356413564
12477124771206712067 1212412124
1181011810
1364613646
1260912609
1359313593
12950129501261312613
1356413564 1342713427
Year-to-Date Ridership Trends
Monthly Monitoring Report 11022017
Page 12Item 3b
2
Average Systemwide Daily Passengers
Weekday Saturday Sunday
Prior Fiscal Year Average Daily Passengers Current Fiscal Year Average Daily Passengers
0
3000
6000
9000
12000 11848118481161311613
73637363
67876787
6126612657395739
Productivity (paxhr) by Typology
1 L
ocal
Tru
nklin
e
2 L
ocal
Bas
ic
3 L
ocal
Con
nect
or
5 R
ural
8 R
ecre
atio
nal
9 D
eman
d R
espo
nse
Prior Fiscal Year Productivity Current Fiscal Year Productivity
00
80
160
240
320
278278 274274
174174 168168
9898 9797
7676 7676
304304
222222
2323 2222
Monthly StatisticsMONTH
September
1 Local Trunkline Routes 35 36 71X
2 Local Basic Routes 17 22 23 23X 29 49
3 Local Connector Routes 219 228 233 245 251 257
5 Rural Routes 61 68
8 Recreational Routes 6666F
9 Demand Response Local Paratransit Novato Dial-A-Ride Rural Dial-A-Ride
Route Typologies
Page 22Item 3b
3
Fixed-Route Passengers (incl Yellow Bus) by Month
July August September October November December January February March April May June
Prior Fiscal Year Passengers Current Fiscal Year Passengers
0
80000
160000
240000
320000
244439244439
271284271284
296637296637
276853276853
252829252829
238010238010
219681219681209705209705
277644277644
240773240773
284816284816
249351249351244200244200
260056260056
282441282441 282922282922
FISCAL YEAR
2018
Demand Response Passengers by Month
July August September October November December January February March April May June
Prior Fiscal Year Passengers Current Fiscal Year Passengers
0
4000
8000
12000
16000
1277312773
1363113631 1362813628 1356413564
12477124771206712067 1212412124
1181011810
1364613646
1260912609
1359313593
12950129501261312613
1356413564 13427134271373413734
Year-to-Date Ridership Trends
Monthly Monitoring Report 12082017
Page 12Item 3b
2
Average Systemwide Daily Passengers
Weekday Saturday Sunday
Prior Fiscal Year Average Daily Passengers Current Fiscal Year Average Daily Passengers
0
3000
6000
9000
120001125811258 1115111151
6043604364326432
4717471750675067
Productivity (paxhr) by Typology
1 L
ocal
Tru
nklin
e
2 L
ocal
Bas
ic
3 L
ocal
Con
nect
or
5 R
ural
8 R
ecre
atio
nal
9 D
eman
d R
espo
nse
Prior Fiscal Year Productivity Current Fiscal Year Productivity
00
70
140
210
280258258
270270
163163 161161
9696 9595
6363 7070
202202190190
2323 2121
Monthly StatisticsMONTH
October
1 Local Trunkline Routes 35 36 71X
2 Local Basic Routes 17 22 23 23X 29 49
3 Local Connector Routes 219 228 233 245 251 257
5 Rural Routes 61 68
8 Recreational Routes 6666F
9 Demand Response Local Paratransit Novato Dial-A-Ride Rural Dial-A-Ride
Route Typologies
Page 22Item 3b
3
- RFP - OampM for Fixed Route Service - Addendum 3 12-18-2017
- MV Fee Schedule
- Airporter Fee Schedule
- FY2017Performance
-
- System Performance Summary for FY 201617
-
- Fixed Route
- Yellow Bus
- Demand Response
- Other Services
-
- Performance Goals
- Ridership Trends
- FY 201718 Performance Outlook
-
- Attachment A Route Profiles
-
- Local Transit Bus Replacement Schedule
- August 2017 Monthly Monitoring Report
- September 2017 Monthly Monitoring Report
- October 2017 Monthly Monitoring Report
-

Addendum 3
9
Possible Rate Adjustments contract provision (304f) The optional contract extension terms will not be made subject to renegotiation Q47 Draft Contract sect523 ndashAssignment Please delete ldquoAssignment provision extends to any purchase merger or consolidation change in control etcrdquo from the draft contract as a change in stockholders of a contractor shall not require consent or result in a default or termination of the Agreement A47 No This contract provision does not require consent for a change in a contractorrsquos stockholders but instead a change in contract assignment resulting from a change in stockholders Q48 Draft Contract sect408 ndashTermination ndash Would Marin Transit please consider modifying this requirement to provide a minimum of 60 daysrsquo notice of cancellation in order to provide the contractor with enough time to complete obligations required such as WARN Act lease terminations etc A48 No Marin Transit prefers the 30-day notice period Q49 Draft Contract sect406 ndash Indemnity Would Marin Transit please consider revising indemnification to limit the indemnity to actions or omissions of the Contractor or its employees agents subcontractors etc The Contractor should not be liable for items outside of its control A49 No Marin Transit is not considering a revision to the indemnification clause at this time Q50 General Draft Contract Would Marin Transit please add a force majeure provision to relieve both parties from performance under the Contract for circumstances beyond their reasonable control (acts of God war labor strikes or disputes terrorism etc) The contractor should be excused from performance under the contract for circumstances outside of its control A50 No See response for Q38 Q51 General Draft Contract Would Marin Transit include a provision that provides for price adjustments if Contractorrsquos revenue decreases or Contractorrsquos costs increase as a result of (i) changes to the scope of work service hours requested by the Authority (ii) changes in laws rules regulations etc applicable to the services to be provided by Contractor andor (iii) wage increases necessary for Contractor to be able to recruit and retain qualified employees as a result of an increase in the minimum wage in the County or surrounding jurisdictions If the parties are unable to agree on a rate adjustment then either party may terminate the contract upon 120 daysrsquo written notice to the other party Doing so would
Addendum 3
10
provide protection for the contractor to cover changes requested by the District or matters that were not contemplated at the time of Contractorrsquos proposal A51 No The RFP and contract address potential changes to scope of work changes in lawrulesregulations and requires proposers to consider wages and benefits to recruit and attract qualified employees without requiring contract price renegotiation
Attachments MV Transportation Fees and Payment Schedule (Revised November 20 2017)
Marin Airporter Fees and Payment Schedule (Revised November 20 2017) System Performance Summary for FY201617
August 2017 Monthly Monitoring Report September 2017 Monthly Monitoring Report October 2017 Monthly Monitoring Report Local Transit Bus Replacement Schedule
171801
EXHIBIT ldquoCrdquo
FEES AND PAYMENT SCHEDULE (revised)
Contractor shall bill Marin Transit monthly for service hours provided Additional hours shall only be used with approval from Marin Transit Proper back-up including TransTrack reports showing hours miles and fuel usage must be attached to invoices For Fiscal Year 1718 Contractor shall provide proof of wage increase (eg month over month payroll comparisons)
Service Cost per Service Hour
Contract Service Hours
Contract Maximum Obligation
Total year 1 January 30 2012 to December 31 2012 13881 $737832 Total year 2 January 1 2013 to December 31 2013 16686 $892890 Total year 3 January 1 2014 to December 31 2014 20913 $1297726 Total year 4 January 1 2015 to December 31 2015 27250 $1715566
Fixed Administrative Costs $277094 West Marin StagecoachMuir Woods Shuttle $3682 10750 $395815 Supplemental Service $6601 3750 $247538 Start-Up Costs $47571 First Half Year 5 January 1 2016 to June 30 2016 14500 $968018
Fixed Administrative Costs $975995 West Marin StagecoachMuir Woods Shuttle $4094 21500 $880210 Local Fixed Route $4094 14000 $573160 Supplemental Service $6814 7500 $511050 Fiscal Year 1617 July 1 2016 to June 30 2017 43000 $2940415
Fixed Administrative Costs1 $1137363 West Marin StagecoachMuir Woods Shuttle $4439 21500 $954455 Local Fixed Route $4439 14000 $621505 Supplemental Service $7018 7500 $526350 Fiscal Year 1718 July 1 2017 to June 30 2018 43000 $3239674
1 Includes the addition of one Road Supervisor position and one Level A Mechanic Contractor shall credit Marin Transit $5900 per month for the wage benefit and tax cost of the Level A Mechanic from July 1 2017 until the date of hire of this position
Item 10
404
asmith
Typewritten Text
MV Transportation
171830
EXHIBIT ldquoBrdquo
FEES AND PAYMENT SCHEDULE (revised)
Cost per Revenue Hour Community Shuttle Service
Base Years Option Years FY1314 FY1415 FY1516 FY1617 FY1718
Rate $7078 $6866 $7072 $7284 $7614 Maximum Revenue Hours 40000 40000 40000 60000 60000
In addition to payment of a cost per revenue hour District will directly reimburse Contractor for lease payments associated with storage of heavy duty transit buses beginning June 2016 Contractor must substantiate lease expense by providing District with a copy of the lease agreement In no event will lease payments exceed $1800 per month without written approval of District
Contractor to provide proof of wage increase (eg month over month payroll comparisons)
Item 11
410
asmith
Typewritten Text
Marin Airporter
asmith
Typewritten Text
asmith
Typewritten Text
1
System Performance Summary for FY 201617
This report summarizes the unaudited operational performance of Marin Transit local transit services for FY 201617 and compares these results to the Districtrsquos route level performance goals identified in the Short-Range Transit Plan The report provides a detailed route level assessment of all Marin Transit services operating in FY 201617 On June 12 2016 Marin Transit implemented a major service change with a 19 increase in local fixed-route service levels and a restructuring of routes throughout the County This FY 201617 report includes data from a full year of the new service plan There were a few additional changes to transit services during FY 201617 including the following In July 2016 the District launched a new general public dial-a-ride service between Point Reyes Station and Novato
The service provides curb-to-curb pick-up and drop-off and only operates on the second Monday of each month The closure of Hwy 1 in early 2017 delayed the start of the Muir Woods Shuttle season which typically begins in April
The Shuttle season began on May 13 resulting in 12 fewer days of service A number of recent changes to Marin Transitrsquos contracts and agreements have had an impact on the Districtrsquos financials These include the following The District completed a procurement for paratransit services in 2015 The new contract went into effect on January 1
2016 and provides significantly lower rates for paratransit and dial-a-ride services This report provides data from the first full year of the new contract
Effective February 1 2017 the District increased the subsidy paid to Catch-A-Ride service providers for operating wheelchair accessible vehicles to further incentivize the availability of accessible vehicles for Catch-A-Ride trips
For FY 201617 Marin Transit updated the methodology for calculating revenue hours for demand response services to be more consistent with the National Transit Database definitions These include local paratransit and the Novato Dial-A-Ride This change has reduced the amount of time that is considered as part of revenue hours Overall Marin Transit provided over 32 million unlinked passenger trips in FY 201617 with over 235000 revenue hours of service Compared to FY 201516 these numbers represent a decrease in unlinked passenger trips (-35) and an increase in revenue hours (+82) Growth in service was primarily on local fixed-route services due to the June 2016 changes Some of this growth was partially offset by decreases in hours on local paratransit and Route 122 The system-wide productivity rate was 136 riders per hour about 108 lower than FY 201617 Passenger revenues increased slightly (+06) Due to higher operating costs passenger subsidy increased by 127 to a system-wide average of $678 per passenger Fixed Route Fixed Route operations carried over 29 million unlinked passenger trips in FY 201617 with 178052 revenue hours These totals represent 91 of the Districtrsquos total trips and 76 of revenue hours Compared to FY 201516 unlinked passenger trips on fixed route services decreased by 35 and revenue hours increased by 136 Overall productivity was 164 passengers per hour approximately 150 lower than the 193 mark last fiscal year Compared to FY 201516 almost all fixed-route typologies experienced a decrease in overall ridership These include Local Basic (-120) Local Connector (-127) Supplemental (-32) and Partnership (-25) However some services experienced a modest increase in ridership compared to last year including Local Trunkline (+77) the Muir Woods Shuttle (+44) and Rural (+48)
2
Total passenger revenue decreased slightly (-11) in FY 201617 compared to last year Increases in operating costs resulted in a decrease in overall farebox recovery from 199 last year to 176 in FY 201617 Only the Local Trunkline and Recreational (Muir Woods Shuttle) typologies experienced an overall increase in both passenger revenue and farebox recovery Yellow Bus In FY 201617 yellow bus service for the Ross Valley School District carried over 136000 unlinked passenger trips a decrease of 13 compared to last year and operated 1245 revenue hours These totals represent 4 of the Districtrsquos total ridership and 1 of revenue hours Passenger revenues increased 150 due to higher pass prices This boost in revenues did not keep pace with the rise in operating costs and overall farebox recovery decreased from 571 last year to 548 in FY 201617 Demand Response Demand Response programs carried 124325 unlinked passenger trips in FY 201617 and provided 55191 revenue hours of service These totals represent 4 of the Districtrsquos total trips and 24 of revenue hours Compared to FY 201516 unlinked passenger trips on demand response services decreased by 39 (-5096 trips) and revenue hours decreased by 61 The more significant reduction in revenue hours compared to passengers is likely due to the new method for calculating those hours Overall productivity was 23 passengers per hour slightly higher than last fiscal year Ridership on local paratransit and the Novato Dial-A-Ride decreased in FY 201617 compared to the prior year Rural Dial-A-Ride experienced growth in ridership mainly because these services were only recently introduced These include the Dillon BeachTomales and Point Reyes Station Dial-A-Ride Passenger revenues for demand response services dropped slightly (-15) compared to last year However lower operating costs due to the new contract rate resulted in reductions in subsidies and an increase in farebox recovery Other Services Other Marin Access Mobility Management services include the Volunteer Driver and Catch-A-Ride programs In FY 201617 these programs provided 30547 unlinked passenger trips about 1 of the Districtrsquos total trips Compared to the prior fiscal year ridership decreased by 77 mostly due to the Catch-A-Ride program However passenger revenues increased by 90 primarily on the Catch-A-Ride program This increase may have been due to riders taking longer trips Performance Goals
The 2016-2025 Short-Range Transit Plan identifies fifteen different goals and associated metrics that staff use to evaluate system performance Performance goals at the route level are measured in both productivity (unlinked passengers per hour and per trip) and cost effectiveness (subsidy per unlinked passenger trip) These measures follow the service typologies updated in the most recent Short Range Transit Plan Table 1 below summarizes route level performance goals by typology Marin Transit has not identified productivity or cost-effectiveness goals for the Yellow Bus or Partnership service typologies Table 2 provides a detailed summary of annual FY 201617 performance data by program route and service typology
3
Table 1 Productivity and Subsidy Goals by Service Typology
Service Typology Routes Unlinked Passenger
Trips per Hour (at or above)
Subsidy per Passenger Trip
(at or below)
Local Trunkline 35 36 71X 25 $300
Regular Local 17 22 23 23X 29 49 20 $500
Local Connector 219 228 233 245 251 257 8 $800
Supplemental 113 115 117 119 125 139 145 151 154 20 per trip $300
Rural 61 68 4 $1200
Recreational 66 (Muir Woods Shuttle) 25 $300
Demand Response Local DAR Novato DAR Dillon BeachTomales DAR Point Reyes DAR
2 $3000
Using the productivity goals identified in Table 1 all the service typology groups except for Local Basic met their unlinked passengers per hour goal overall Twelve individual routes and two demand response services did not meet their productivity targets These include Routes 17 22 23 23X 29 49 71X 115 125 139 219 228 the Dillon BeachTomales Dial-A-Ride and the Point Reyes Dial-A-Ride In the previous fiscal year ten routes did not meet this target Figure 1 provides FY 201617 productivity levels and respective productivity goals by service typology and at the route level Route 35 was the most productive fixed-route service carrying an average of 286 passengers per hour Route 151 (Hamilton ndash San Jose MS ndash Novato HS - San Marin HS) was the best performing supplemental school route with 428 passengers per trip and met its subsidy target at $150 per passenger Route 228 had the highest growth in productivity (+291) due to the addition of weekday service in June 2016 In terms of cost effectiveness the Supplemental School Rural and Recreational services collectively met their goals In total 17 individual routes and two demand response services did not meet their subsidy target (Routes 17 22 23 23X 29 35 36 49 71X 219 228 233 251 257 115 125 139 Local Paratransit and Novato Dial-A-Ride) This is an increase from the 13 routes and three demand response services reported for FY 201516 Figure 2 provides a breakdown of FY 201617 subsidy levels and respective subsidy goals by service typology and at the individual route level Ridership Trends
In FY 201617 there was an overall 35 decline in fixed-route ridership compared to the previous year despite increases to service levels One of the major contributors to this decline was the delayed start of the 2017 Muir Woods Shuttle season that reduced the amount of service provided by 76 The overall decrease in ridership is relatively consistent with trends among bus operators nationwide and in the Bay Area According to the National Transit Database bus ridership declined 66 nationwide during FY 201617 compared to the prior year Within in the Bay Area peer agencies experienced ridership declines between 6 and 12 These include Golden Gate Transit Sonoma County Transit SamTrans and Napa VINE One of the biggest external factors that may have contributed to this trend is weather Rainfall in FY 201617 almost doubled over the prior year Weather can have a significant impact on travel decisions affecting whether a person makes a trip as well as how that person ultimately makes the trip It can also impact operations and cause detours major delays and canceled trips
4
In FY 201617 there was a 34 increase in the number of canceled trips Almost half of these canceled trips occurred in February due to heavy rains that caused flooding and school closures In June 2016 Marin Transit implemented a major service change One of the main goals of the service restructuring was to reduce the need to transfer by providing faster and more direct connections While this approach improves the system for riders it has implications in terms of how ridership is counted and on performance metrics The number of passengers is measured in terms of unlinked passenger trips Each time a person boards a bus is counted as a separate trip regardless of whether that person is transferring from another bus Reducing the amount of transfers needed to complete a riderrsquos journey reduces the number of unlinked trips Replacing trips that require a transfer with direct trips to destinations does not change the number of individual riders using the system which is defined as linked passenger trips In FY 201617 there was a 75 overall decrease in the number of transfers for passengers using cash to pay their original fare Some of this decline reflects the systemwide decrease in ridership The transfer ratio is defined as the number of boarding trips (unlinked passenger trips) divided by the number of originating trips (linked passenger trips) This ratio can be used to evaluate the impact of transfers on ridership independent of other factors In FY 201617 the overall transfer ratio dropped 38 from 136 to 131 When estimating linked passenger trips based on these ratios the number of individual Marin Transit passengers in FY 201617 remained relatively constant compared to last year Demand for Marin Access mobility management programs declined overall 47 from FY 201516 to FY 201617 Changes in ridership varied from program to program The largest decline was on Catch-A-Ride which experienced a 129 decrease in ridership Local paratransit and Novato Dial-A-Ride ridership may have been affected by many of the same external factors as fixed route transit particularly weather It is also possible that paratransit clients have started to shift some or all their trips to services that are not provided by Marin Transit These may include Non-Emergency Medical Transportation services arranged by managed care organizations Private transportation
providers hired under contract to institutions typically served by paratransit (such as adult day care centers) Trips taken on Uber or Lyft and Volunteer transportation services that may be supported by Marin Transit in some way but whose ridership is not
reported in the Districtrsquos performance statistics Furthermore staff attributed much of the previous growth in the Marin Access program to the Catch-A-Ride program This program experienced a 473 increase in ridership between FY 201314 and FY 201415 Towards the end of FY 201415 On the Move one of the largest taxi companies in Marin went out of business To this day service is limited during hours of peak demand and in certain service areas especially Novato Therefore FY 201617 ridership on Catch-A-Ride may reflect two factors These include a slowdown in attracting new customers and a reduction in service availability following On the Moversquos closure Table 2 summarizes the factors that can influence ridership numbers year-over-year and qualitatively evaluates their impact
5
Table 2 Factors Impacting Ridership Comparison
Factor FY 201516 FY 201617 Impact
Calendar
School Days 181 183 --
Weekdays 256 253
Weekends amp Holidays 110 111 --
Muir Woods Shuttle 113 104
Transfer Ratio (ratio of unlinked to linked trips) 136 131
Service Disruptions Canceled service (trips) 200 268
Major detourclosure (days) (1) 18 29
Rainfall (inches) 2928 5653
Gas Prices $298 $291 --
Unemployment Rate 32 32 -- Notes (1) Data on major detours and closure collected starting January 2016 Comparison includes the months of January through June FY 201718 Performance Outlook
In June 2016 Marin Transit implemented a major service change aimed in part to help underperforming routes meet established performance standards Staff has continued to monitor service performance and has made minor adjustments to improve on-time performance and cancel low-ridership trips In early 2018 staff is planning a comprehensive assessment of service performance since the June 2016 service changes This effort will include data from a recently completed onboard survey from April 2017 on passenger origins and destinations and a 100 passenger ridecheck The ridecheck will provide data on stop-level ridership activity for each route The assessment will use this analysis to recommend service changes to improve underperforming routes There are several unknowns that may also affect route performance primarily in terms of operating costs The District relies on its contractors to either lease or own property to store and maintain the vehicles needed to operate service For contractors that do not own suitable property finding and leasing these types of facilities in Marin County is challenging and expensive Recent surveys of current and potential service providers identified securing a facility as the most significant factor in determining their interest in bidding on Marin Transit services ability to provide the service and proposed pricing Marin Transit has been actively working to secure and develop its own operations and maintenance facility A District-owned facility will eliminate the need for potential service providers to lease property and lower operating costs It may also improve efficiency by reducing deadhead or non-revenue time when vehicles are traveling to and from the yard and further lower the Districtrsquos contract rates In late 2017 Marin Transit will release for bid over half of its fixed-route service and there are many uncertainties that may affect the outcome The tight labor market in Marin County and the greater Bay Area has made it difficult for service providers to hire and retain employees Potential contractors are required to secure property in a County with limited real estate opportunities If the District provides its own facility there will be more interest among potential bidders and more competitive rates
6
Table 3 System-wide Performance Statistics FY 201617 (unaudited)
Route Passengers Revenue
Hours Operating
Costs Passenger
Revenue Pass Trips Per
Rev Hr (Trip) Subsidy Per
Passenger Farebox
Recovery Fixed Route 2925522 178052 $20173419 $3550259 164 $568 176 Local Trunkline 1122188 44393 $6252940 $1263870 253 $445 202
35 658869 23052 $3234308 $729775 286 $380 226 36 342178 13636 $1901678 $369132 251 $448 194
71X 121141 7705 $1116954 $164963 157 $786 148 Local Basic 989500 65117 $7451946 $1221298 152 $630 164
17 247998 14757 $2076786 $319761 168 $708 154 22 215758 17553 $1619319 $273059 123 $624 169 23 199150 11065 $1508659 $246908 180 $634 164
23X 49255 3445 $473413 $57438 143 $845 121 29 40103 3707 $509475 $49634 108 $1147 97 49 237236 14590 $1264294 $274498 163 $417 217
Local Connector 378985 42396 $3873801 $461426 89 $900 119 219 50449 6392 $591224 $64101 79 $1045 108 228 71340 10042 $904806 $103912 71 $1123 115 233 42798 4363 $399203 $52001 98 $811 130 245 49766 4349 $391596 $56968 114 $672 145 251 95506 9607 $889019 $101823 99 $824 115 257 69126 7643 $697953 $82621 90 $890 118
Supplemental 179947 3963 $514380 $110503 454 (286) $224 215 113 16829 317 $42180 $12227 530 (315) $178 290 115 14021 637 $87534 $9504 220 (185) $557 109 117 34820 640 $81509 $17140 544 (284) $185 210 119 27161 374 $56273 $18859 727 (313) $138 335 125 13757 600 $72469 $11570 229 (193) $443 160 139 6414 253 $33182 $6635 253 (179) $414 200 145 16406 191 $25426 $7258 861 (372) $111 285 151 36801 594 $73842 $18463 620 (428) $150 250 154 13738 358 $41965 $8847 384 (255) $241 211
Recreational 122116 4316 $473726 $249748 283 $183 527 66 122116 4316 $473726 $249748 283 $183 527
Rural 112926 16172 $1422683 $122407 70 $1151 86 61 36328 5492 $475778 $39959 66 $1200 84 68 76598 10680 $946905 $82448 72 $1129 87
Partnership 19860 1696 $183943 $121007 117 $317 658 122 19860 1696 $183943 $121007 117 $317 658
Yellow Bus 136500 1245 $863348 $473066 1096 (448) $286 548 Hidden Valley 9281 180 $124763 $32170 516 (265) $998 258
White Hill 127219 1065 $738585 $440896 1194 (471) $234 597 Demand Response 124325 55191 $4571296 $236980 23 $3486 52
Local Paratransit 119673 53011 $4404928 $226387 23 $3492 51 Novato DAR 4057 1856 $150815 $8815 22 $3487 58
Dillon Beach DAR 488 260 $12511 $1356 19 $2285 108 Pt Reyes DAR 107 64 $3042 $422 17 $2447 139
Other Services 30547 - $511316 $41956 - $1537 82 Volunteer Driver(1) 16162 - $152714 - - $945 -
Catch-A-Ride(1) 14385 - $358602 $41956 - $2201 117 Total 3216894 234489 $26118572 $4302085 136 $678 165
Notes Values in red indicate performance that does not meet District
7
Figure 1 FY 201617 Passengers per Revenue Hour by Route
0
5
10
15
20
25
30
35
40
45
50Lo
cal T
runk
line T
otals 35 36 71
X
Loca
l Bas
ic To
tals 17 22 23 23X 29 49
Loca
l Con
necto
r Tot
als 219
228
233
245
251
257
Supp
lemen
tal T
otals 11
311
511
711
912
513
914
515
115
4
Recre
ation
al To
tals 66
Rura
l Tot
als 61 68
Dem
and R
espo
nse T
otals
Loca
l Par
atra
nsit
Nova
to D
ARDi
llon D
ARPt
Reye
s DAR
Pass
enge
rs p
er R
even
ue H
our
meets goalservice standard
does not meet goal
school routes show passengers per trip
8
Figure 2 FY 201617 Subsidy per Passenger by Route
$0
$5
$10
$15
$20
$25
$30
$35
$40
Loca
l Tru
nklin
e Tot
als 35 36 71X
Loca
l Bas
ic To
tals 17 22 23 23X 29 49
Loca
l Con
necto
r Tot
als 219
228
233
245
251
257
Supp
lemen
tal T
otals 11
311
511
711
912
513
914
515
115
4
Recre
ation
al To
tals 66
Rura
l Tot
als 61 68
Dem
and R
espo
nse T
otals
Loca
l Par
atra
nsit
Nova
to D
ARDi
llon D
ARPt
Reye
s DAR
Subs
idy p
er P
asse
nger
does not meet goal
service standard
meets goal
9
Attachment A Route Profiles 17 Sausalito ndash Marin City ndash Mill Valley ndash San Rafael 22 San Rafael Transit Center ndash San Anselmo ndash Marin City 23 Fairfax ndash San Anselmo ndash San Rafael ndash Canal 23X Manor ndash Fairfax ndash San Anselmo ndash San Rafael ndash Canal 29 Canal ndash San Rafael Transit Center ndash Larkspur ndash College of Marin ndash Marin General 35 Canal ndash San Rafael Transit Center ndash Marin Civic Center ndash Northgate Mall ndash Novato 36 Canal ndash San Rafael Transit Center ndash Marin City 49 Novato ndash Ignacio ndash Hamilton ndash Marin Civic Center ndash San Rafael Transit Center 61 West Marin Stagecoach (Sausalito ndash Marin City ndash Mill Valley ndash Stinson Beach ndash Bolinas) 66 Muir Woods Shuttle 68 West Marin Stagecoach (San Rafael Transit Center ndash San Anselmo ndash Pt Reyes Station ndash Inverness) 71X Novato ndash San Rafael Transit Center ndash Marin City ndash Sausalito 113 Redwood High School ndash Paradise Cay 115 Sausalito ndash Willow Creek ndash Marin City ndash Mill Valley ndash St Hilary 117 Neil Cummins Hall Middle School ndash E Corte Madera ndash Cove School 119 Tiburon ndash Belvedere ndash Redwood High School 122 San Rafael Transit Center ndash San Anselmo ndash College of Marin 125 Lagunitas ndash Sir Francis Drake HS ndash San Anselmo ndash San Rafael 139 Terra Linda High School ndash Lucas Valley 145 Terra Linda High School ndash San Rafael 151 Hamilton ndash Ignacio ndash San Jose Middle School ndash Novato High School ndash San Marin High School 154 Olive ndash San Marin High School ndash Sinaloa Middle School ndash Novato 219 Tiburon ndash Strawberry 228 San Rafael Transit Center ndash Larkspur ndash San Anselmo ndash Fairfax 233 Santa Venetia ndash Marin Civic Center ndash San Rafael Transit Center 245 San Rafael Transit Center ndash Northgate Mall ndash Kaiser ndash Smith Ranch Road 251 San Marin ndash Novato ndash Vintage Oaks ndash IVC ndash Ignacio ndash Hamilton 257 San Rafael ndash Northgate Mall ndash Kaiser ndash Marinwood ndash Hamilton ndash Ignacio ndash IVC Hdn Valley Ross Valley Yellow Bus (Fairfax ndash San Anselmo ndash Hidden Valley ES) White Hill Ross Valley Yellow Bus (San Anselmo ndash Sleepy Hollow ndash Fairfax ndash White Hill MS)
17Local Basic
Days of Service Wkdy Sa SuAvg Freq (Wkdy Peak) 30 min
Avg Freq (Wkdy Non-Peak) 60 minAvg Freq (Wked) 60 min
FY 2017 Farebox Recovery 15 transfer (to route) 25
Clipper usage 16
Annual Avg Monthly Avg Daily Annual Avg Monthly Avg Daily Annual Avg Monthly Avg DailyWeekday 194263 16189 768 11496 958 45 177386 14782 701 Saturday 27564 2297 530 1541 128 30 24621 2052 473 Sunday 26171 2181 436 1720 143 29 27378 2282 456
Total 247998 20667 679 14757 1230 40 229385 19115 628
Annual Avg Monthly Avg Daily Annual Avg Monthly Avg Daily Annual Avg Monthly Avg DailyWeekday $1617108 $134759 $6392 $247041 $20587 $976 $1370067 $114172 $5415Saturday $217536 $18128 $4183 $36894 $3075 $710 $180642 $15054 $3474Sunday $242142 $20179 $4036 $35826 $2986 $597 $206316 $17193 $3439
Total $2076786 $173066 $5690 $319761 $26647 $876 $1757025 $146419 $4814
Passengers per Revenue Hour
Subsidy per Passenger
Cost per Revenue Hour
Farebox Recovery
Weekday 169 $705 $14067 153Saturday 179 $655 $14117 170Sunday 152 $788 $14078 148
Total 168 $708 $14073 154
Passengers Revenue Hours Operating CostsPassenger
RevenueOperating Subsidy
Passengers per Revenue Hour
Subsidy per Passenger
Cost per Revenue Hour
Farebox Recovery
FY 2015 301136 15167 $2108822 $340410 $1768412 199 $587 $13904 161FY 2016 280486 15330 $2041616 $302337 $1739279 183 $620 $13317 148FY 2017 247998 14757 $2076786 $319761 $1757025 168 $708 $14073 154
Histo
ric Tr
ends
FY 20
161
7 DAT
A
Passengers Revenue Hours Revenue Miles
Operating Costs Passenger Revenue Operating Subsidy
277892 322826
301136 280486
247998
0
50000
100000
150000
200000
250000
300000
350000
FY 2013 FY 2014 FY 2015 FY 2016 FY 2017
Passengers
12402 14818 15167 15330 14757
0
5000
10000
15000
20000
FY 2013 FY 2014 FY 2015 FY 2016 FY 2017
Revenue Hours
$1717002
$2179526 $2108822 $2041616 $2076786
$0
$500000
$1000000
$1500000
$2000000
$2500000
FY 2013 FY 2014 FY 2015 FY 2016 FY 2017
Operating Costs
224 218 199 183 168
00
50
100
150
200
250
300
FY 2013 FY 2014 FY 2015 FY 2016 FY 2017
Passengers per Revenue Hour
$504 $558 $587 $620 $708
$000$200$400$600$800
$1000$1200$1400
FY 2013 FY 2014 FY 2015 FY 2016 FY 2017
Subsidy per Passenger
$13845 $14709 $13904 $13317 $14073
$0
$50
$100
$150
$200
FY 2013 FY 2014 FY 2015 FY 2016 FY 2017
Cost per Revenue Hour
22Local Basic
Days of Service Wkdy Sa SuAvg Freq (Wkdy Peak) 30 min
Avg Freq (Wkdy Non-Peak) 60 minAvg Freq (Wked) 60 min
FY 2017 Farebox Recovery 17 transfer (to route) 10
Clipper usage 11
Annual Avg Monthly Avg Daily Annual Avg Monthly Avg Daily Annual Avg Monthly Avg DailyWeekday 184918 15410 731 14244 1187 56 126319 10527 499 Saturday 16752 1396 322 1537 128 30 16232 1353 312 Sunday 14088 1174 235 1773 148 30 18729 1561 312
Total 215758 17980 591 17553 1463 48 161280 13440 442
Annual Avg Monthly Avg Daily Annual Avg Monthly Avg Daily Annual Avg Monthly Avg DailyWeekday $1312992 $109416 $5190 $232926 $19411 $921 $1080066 $90006 $4269Saturday $142334 $11861 $2737 $21235 $1770 $408 $121099 $10092 $2329Sunday $163993 $13666 $2733 $18898 $1575 $315 $145095 $12091 $2418
Total $1619319 $134943 $4436 $273059 $22755 $748 $1346260 $112188 $3688
Passengers per Revenue Hour
Subsidy per Passenger
Cost per Revenue Hour
Farebox Recovery
Weekday 130 $584 $9218 177Saturday 109 $723 $9263 149Sunday 79 $1030 $9251 115
Total 123 $624 $9225 169
Passengers Revenue Hours Operating CostsPassenger
RevenueOperating Subsidy
Passengers per Revenue Hour
Subsidy per Passenger
Cost per Revenue Hour
Farebox Recovery
FY 2015 249148 14777 $2054433 $292215 $1762218 169 $707 $13903 142FY 2016 243635 14872 $1971172 $259453 $1711719 164 $703 $13255 132FY 2017 215758 17553 $1619319 $273059 $1346260 123 $624 $9225 169
Histo
ric Tr
ends
FY 20
161
7 DAT
A
Passengers Revenue Hours Revenue Miles
Operating Costs Passenger Revenue Operating Subsidy
366301
281761 249148 243635
215758
050000
100000150000200000250000300000350000400000
FY 2013 FY 2014 FY 2015 FY 2016 FY 2017
Passengers18061
15083 14777 14872 17553
0
5000
10000
15000
20000
FY 2013 FY 2014 FY 2015 FY 2016 FY 2017
Revenue Hours$2498169
$2220145 $2054433 $1971172
$1619319
$0
$500000
$1000000
$1500000
$2000000
$2500000
$3000000
FY 2013 FY 2014 FY 2015 FY 2016 FY 2017
Operating Costs
203 187 169 164
123
00
50
100
150
200
250
300
FY 2013 FY 2014 FY 2015 FY 2016 FY 2017
Passengers per Revenue Hour
$567 $667 $707 $703 $624
$000$200$400$600$800
$1000$1200$1400
FY 2013 FY 2014 FY 2015 FY 2016 FY 2017
Subsidy per Passenger
$13832 $14720 $13903 $13255
$9225
$0
$50
$100
$150
$200
FY 2013 FY 2014 FY 2015 FY 2016 FY 2017
Cost per Revenue Hour
23Local Basic
Days of Service Wkdy Sa SuAvg Freq (Wkdy Peak) 60 min
Avg Freq (Wkdy Non-Peak) 60 minAvg Freq (Wked) 60 min
FY 2017 Farebox Recovery 16 transfer (to route) 24
Clipper usage 12
Annual Avg Monthly Avg Daily Annual Avg Monthly Avg Daily Annual Avg Monthly Avg DailyWeekday 145707 12142 576 8042 670 32 64277 5356 254 Saturday 28305 2359 544 1434 120 28 11466 956 221 Sunday 25138 2095 419 1589 132 26 12750 1062 212
Total 199150 16596 546 11065 922 30 88492 7374 242
Annual Avg Monthly Avg Daily Annual Avg Monthly Avg Daily Annual Avg Monthly Avg DailyWeekday $1096892 $91408 $4336 $179427 $14952 $709 $917465 $76455 $3626Saturday $195468 $16289 $3759 $35226 $2936 $677 $160242 $13354 $3082Sunday $216299 $18025 $3605 $32255 $2688 $538 $184044 $15337 $3067
Total $1508659 $125722 $4133 $246908 $20576 $676 $1261751 $105146 $3457
Passengers per Revenue Hour
Subsidy per Passenger
Cost per Revenue Hour
Farebox Recovery
Weekday 181 $630 $13640 164Saturday 197 $566 $13629 180Sunday 158 $732 $13612 149
Total 180 $634 $13635 164
Passengers Revenue Hours Operating CostsPassenger
RevenueOperating Subsidy
Passengers per Revenue Hour
Subsidy per Passenger
Cost per Revenue Hour
Farebox Recovery
FY 2015 354706 14168 $1969650 $381111 $1588539 250 $448 $13902 193FY 2016 268218 13154 $1703216 $308138 $1395078 204 $520 $12948 181FY 2017 199150 11065 $1508659 $246908 $1261751 180 $634 $13635 164
Histo
ric Tr
ends
FY 20
161
7 DAT
A
Passengers Revenue Hours Revenue Miles
Operating Costs Passenger Revenue Operating Subsidy
212064
339118 354706
268218
199150
050000
100000150000200000250000300000350000400000
FY 2013 FY 2014 FY 2015 FY 2016 FY 2017
Passengers
8716
14034 14168 13154
11065
02000400060008000
10000120001400016000
FY 2013 FY 2014 FY 2015 FY 2016 FY 2017
Revenue Hours
$1202564
$2061985 $1969650 $1703216
$1508659
$0
$500000
$1000000
$1500000
$2000000
$2500000
FY 2013 FY 2014 FY 2015 FY 2016 FY 2017
Operating Costs
243 242 250
204 180
00
50
100
150
200
250
300
FY 2013 FY 2014 FY 2015 FY 2016 FY 2017
Passengers per Revenue Hour
$455 $494 $448 $520 $634
$000$200$400$600$800
$1000$1200$1400
FY 2013 FY 2014 FY 2015 FY 2016 FY 2017
Subsidy per Passenger
$13797 $14692 $13902 $12948 $13635
$0
$50
$100
$150
$200
FY 2013 FY 2014 FY 2015 FY 2016 FY 2017
Cost per Revenue Hour
23XLocal Basic
Days of Service WkdyAvg Freq (Wkdy Peak) 60 min
Avg Freq (Wkdy Non-Peak) -Avg Freq (Wked) -
FY 2017 Farebox Recovery 12 transfer (to route) 31
Clipper usage 12
Annual Avg Monthly Avg Daily Annual Avg Monthly Avg Daily Annual Avg Monthly Avg DailyWeekday 49255 4105 195 3445 287 14 32408 2701 128 Saturday - - - - - - - - - Sunday - - - - - - - - -
Total 49255 4105 195 3445 287 14 32408 2701 128
Annual Avg Monthly Avg Daily Annual Avg Monthly Avg Daily Annual Avg Monthly Avg DailyWeekday $473413 $39451 $1871 $57438 $4787 $227 $415975 $34665 $1644Saturday $ - $ - $ - $ - $ - $ - $ - $ - $ -Sunday $ - $ - $ - $ - $ - $ - $ - $ - $ -
Total $473413 $39451 $1871 $57438 $4787 $227 $415975 $34665 $1644
Passengers per Revenue Hour
Subsidy per Passenger
Cost per Revenue Hour
Farebox Recovery
Weekday 143 $845 $13744 121Saturday - $ - $ - - Sunday - $ - $ - -
Total 143 $845 $13744 121
Passengers Revenue Hours Operating CostsPassenger
RevenueOperating Subsidy
Passengers per Revenue Hour
Subsidy per Passenger
Cost per Revenue Hour
Farebox Recovery
FY 2015FY 2016 2548 189 $23303 $2272 $21031 135 $825 $12330 97FY 2017 49255 3445 $473413 $57438 $415975 143 $845 $13744 121
Histo
ric Tr
ends
FY 20
161
7 DAT
A
Passengers Revenue Hours Revenue Miles
Operating Costs Passenger Revenue Operating Subsidy
2548
49255
0
10000
20000
30000
40000
50000
60000
FY 2013 FY 2014 FY 2015 FY 2016 FY 2017
Passengers
189
3445
0500
1000150020002500300035004000
FY 2013 FY 2014 FY 2015 FY 2016 FY 2017
Revenue Hours
$23303
$473413
$0
$100000
$200000
$300000
$400000
$500000
FY 2013 FY 2014 FY 2015 FY 2016 FY 2017
Operating Costs
135 143
00
50
100
150
200
250
300
FY 2013 FY 2014 FY 2015 FY 2016 FY 2017
Passengers per Revenue Hour
$825 $845
$000$200$400$600$800
$1000$1200$1400
FY 2013 FY 2014 FY 2015 FY 2016 FY 2017
Subsidy per Passenger
$12330 $13744
$0
$50
$100
$150
$200
FY 2013 FY 2014 FY 2015 FY 2016 FY 2017
Cost per Revenue Hour
29Local Basic
Days of Service WkdyAvg Freq (Wkdy Peak) 60 min
Avg Freq (Wkdy Non-Peak) -Avg Freq (Wked) -
FY 2017 Farebox Recovery 10 transfer (to route) 26
Clipper usage 12
Annual Avg Monthly Avg Daily Annual Avg Monthly Avg Daily Annual Avg Monthly Avg DailyWeekday 40103 3342 159 3707 309 15 37048 3087 146 Saturday - - - - - - - - - Sunday - - - - - - - - -
Total 40103 3342 159 3707 309 15 37048 3087 146
Annual Avg Monthly Avg Daily Annual Avg Monthly Avg Daily Annual Avg Monthly Avg DailyWeekday $509475 $42456 $2014 $49634 $4136 $196 $459841 $38320 $1818Saturday $ - $ - $ - $ - $ - $ - $ - $ - $ -Sunday $ - $ - $ - $ - $ - $ - $ - $ - $ -
Total $509475 $42456 $2014 $49634 $4136 $196 $459841 $38320 $1818
Passengers per Revenue Hour
Subsidy per Passenger
Cost per Revenue Hour
Farebox Recovery
Weekday 108 $1147 $13745 97Saturday - $ - $ - - Sunday - $ - $ - -
Total 108 $1147 $13745 97
Passengers Revenue Hours Operating CostsPassenger
RevenueOperating Subsidy
Passengers per Revenue Hour
Subsidy per Passenger
Cost per Revenue Hour
Farebox Recovery
FY 2015 203632 10795 $1500887 $232286 $1268601 189 $623 $13904 155FY 2016 181786 10502 $1378760 $219997 $1158763 173 $637 $13129 160FY 2017 40103 3707 $509475 $49634 $459841 108 $1147 $13745 97
Histo
ric Tr
ends
FY 20
161
7 DAT
A
Passengers Revenue Hours Revenue Miles
Operating Costs Passenger Revenue Operating Subsidy
238310 225998 203632
181786
40103
0
50000
100000
150000
200000
250000
300000
FY 2013 FY 2014 FY 2015 FY 2016 FY 2017
Passengers12248
10927 10795 10502
3707
0
2000
4000
6000
8000
10000
12000
14000
FY 2013 FY 2014 FY 2015 FY 2016 FY 2017
Revenue Hours$1692980 $1607795 $1500887
$1378760
$509475
$0
$500000
$1000000
$1500000
$2000000
FY 2013 FY 2014 FY 2015 FY 2016 FY 2017
Operating Costs
195 207 189 173
108
00
50
100
150
200
250
300
FY 2013 FY 2014 FY 2015 FY 2016 FY 2017
Passengers per Revenue Hour
$595 $593 $623 $637
$1147
$000$200$400$600$800
$1000$1200$1400
FY 2013 FY 2014 FY 2015 FY 2016 FY 2017
Subsidy per Passenger
$13822 $14714 $13904 $13129 $13745
$0
$50
$100
$150
$200
FY 2013 FY 2014 FY 2015 FY 2016 FY 2017
Cost per Revenue Hour
35Local Trunkline
Days of Service Wkdy Sa SuAvg Freq (Wkdy Peak) 30 min
Avg Freq (Wkdy Non-Peak) 30 minAvg Freq (Wked) 30 min
FY 2017 Farebox Recovery 23 transfer (to route) 17
Clipper usage 8
Annual Avg Monthly Avg Daily Annual Avg Monthly Avg Daily Annual Avg Monthly Avg DailyWeekday 492328 41027 1946 16909 1409 67 224421 18702 887 Saturday 84453 7038 1624 2860 238 55 43336 3611 833 Sunday 82088 6841 1368 3284 274 55 50021 4168 834
Total 658869 54906 1805 23052 1921 63 317778 26482 871
Annual Avg Monthly Avg Daily Annual Avg Monthly Avg Daily Annual Avg Monthly Avg DailyWeekday $2367217 $197268 $9357 $533190 $44433 $2107 $1834027 $152836 $7249Saturday $403729 $33644 $7764 $97853 $8154 $1882 $305876 $25490 $5882Sunday $463362 $38614 $7723 $98732 $8228 $1646 $364630 $30386 $6077
Total $3234308 $269526 $8861 $729775 $60815 $1999 $2504533 $208711 $6862
Passengers per Revenue Hour
Subsidy per Passenger
Cost per Revenue Hour
Farebox Recovery
Weekday 291 $373 $14000 225Saturday 295 $362 $14118 242Sunday 250 $444 $14111 213
Total 286 $380 $14030 226
Passengers Revenue Hours Operating CostsPassenger
RevenueOperating Subsidy
Passengers per Revenue Hour
Subsidy per Passenger
Cost per Revenue Hour
Farebox Recovery
FY 2015 476489 8544 $1187694 $462204 $725490 558 $152 $13901 389FY 2016 472718 9300 $1202986 $544109 $658877 508 $139 $12935 452FY 2017 658869 23052 $3234308 $729775 $2504533 286 $380 $14030 226
Histo
ric Tr
ends
FY 20
161
7 DAT
A
Passengers Revenue Hours Revenue Miles
Operating Costs Passenger Revenue Operating Subsidy
669860 574669
476489 472718
658869
0100000200000300000400000500000600000700000800000
FY 2013 FY 2014 FY 2015 FY 2016 FY 2017
Passengers
9755 8644 8544 9300
23052
0
5000
10000
15000
20000
25000
FY 2013 FY 2014 FY 2015 FY 2016 FY 2017
Revenue Hours
$1345711 $1271601 $1187694 $1202986
$3234308
$0
$500000
$1000000
$1500000
$2000000
$2500000
$3000000
$3500000
FY 2013 FY 2014 FY 2015 FY 2016 FY 2017
Operating Costs
687 665 558
508
286
00100200300400500600700800
FY 2013 FY 2014 FY 2015 FY 2016 FY 2017
Passengers per Revenue Hour
$097 $120 $152 $139
$380
$000
$200
$400
$600
$800
$1000
FY 2013 FY 2014 FY 2015 FY 2016 FY 2017
Subsidy per Passenger
$13796 $14710 $13901 $12935 $14030
$0
$50
$100
$150
$200
FY 2013 FY 2014 FY 2015 FY 2016 FY 2017
Cost per Revenue Hour
36Local Trunkline
Days of Service Wkdy Sa SuAvg Freq (Wkdy Peak) 30 min
Avg Freq (Wkdy Non-Peak) 30 minAvg Freq (Wked) 30 min
FY 2017 Farebox Recovery 19 transfer (to route) 18
Clipper usage 6
Annual Avg Monthly Avg Daily Annual Avg Monthly Avg Daily Annual Avg Monthly Avg DailyWeekday 278217 23185 1100 9938 828 39 133318 11110 527 Saturday 33779 2815 650 1715 143 33 24259 2022 467 Sunday 30182 2515 503 1983 165 33 28002 2334 467
Total 342178 28515 937 13636 1136 37 185579 15465 508
Annual Avg Monthly Avg Daily Annual Avg Monthly Avg Daily Annual Avg Monthly Avg DailyWeekday $1384291 $115358 $5472 $290481 $24207 $1148 $1093810 $91151 $4323Saturday $240062 $20005 $4617 $40774 $3398 $784 $199288 $16607 $3832Sunday $277325 $23110 $4622 $37877 $3156 $631 $239448 $19954 $3991
Total $1901678 $158473 $5210 $369132 $30761 $1011 $1532546 $127712 $4199
Passengers per Revenue Hour
Subsidy per Passenger
Cost per Revenue Hour
Farebox Recovery
Weekday 280 $393 $13930 210Saturday 197 $590 $13999 170Sunday 152 $793 $13984 137
Total 251 $448 $13946 194
Passengers Revenue Hours Operating CostsPassenger
RevenueOperating Subsidy
Passengers per Revenue Hour
Subsidy per Passenger
Cost per Revenue Hour
Farebox Recovery
FY 2015 109347 2894 $402355 $110471 $291884 378 $267 $13905 275FY 2016 119593 3462 $457211 $129715 $327496 345 $274 $13205 284FY 2017 342178 13636 $1901678 $369132 $1532546 251 $448 $13946 194
Histo
ric Tr
ends
FY 20
161
7 DAT
A
Passengers Revenue Hours Revenue Miles
Operating Costs Passenger Revenue Operating Subsidy
106988 103673 109347 119593
342178
050000
100000150000200000250000300000350000400000
FY 2013 FY 2014 FY 2015 FY 2016 FY 2017
Passengers
2878 2822 2894 3462
13636
02000400060008000
10000120001400016000
FY 2013 FY 2014 FY 2015 FY 2016 FY 2017
Revenue Hours
$398410 $415238 $402355 $457211
$1901678
$0
$500000
$1000000
$1500000
$2000000
FY 2013 FY 2014 FY 2015 FY 2016 FY 2017
Operating Costs
372 367 378 345 251
00100200300400500600700800
FY 2013 FY 2014 FY 2015 FY 2016 FY 2017
Passengers per Revenue Hour
$265 $293 $267 $274
$448
$000
$200
$400
$600
$800
$1000
FY 2013 FY 2014 FY 2015 FY 2016 FY 2017
Subsidy per Passenger
$13842 $14713 $13905 $13205 $13946
$0
$50
$100
$150
$200
FY 2013 FY 2014 FY 2015 FY 2016 FY 2017
Cost per Revenue Hour
49Local Basic
Days of Service Wkdy Sa SuAvg Freq (Wkdy Peak) 30 min
Avg Freq (Wkdy Non-Peak) 60 minAvg Freq (Wked) 60 min
FY 2017 Farebox Recovery 22 transfer (to route) 9
Clipper usage 11
Annual Avg Monthly Avg Daily Annual Avg Monthly Avg Daily Annual Avg Monthly Avg DailyWeekday 201564 16797 797 11313 943 45 139528 11627 551 Saturday 18489 1541 356 1517 126 29 18370 1531 353 Sunday 17183 1432 286 1761 147 29 21402 1784 357
Total 237236 19770 650 14590 1216 40 179300 14942 491
Annual Avg Monthly Avg Daily Annual Avg Monthly Avg Daily Annual Avg Monthly Avg DailyWeekday $978903 $81575 $3869 $230134 $19178 $910 $748769 $62397 $2960Saturday $131907 $10992 $2537 $22520 $1877 $433 $109387 $9116 $2104Sunday $153484 $12790 $2558 $21844 $1820 $364 $131640 $10970 $2194
Total $1264294 $105358 $3464 $274498 $22875 $752 $989796 $82483 $2712
Passengers per Revenue Hour
Subsidy per Passenger
Cost per Revenue Hour
Farebox Recovery
Weekday 178 $371 $8653 235Saturday 122 $592 $8698 171Sunday 98 $766 $8718 142
Total 163 $417 $8665 217
Passengers Revenue Hours Operating CostsPassenger
RevenueOperating Subsidy
Passengers per Revenue Hour
Subsidy per Passenger
Cost per Revenue Hour
Farebox Recovery
FY 2015 144262 6349 $882801 $158088 $724713 227 $502 $13905 179FY 2016 147480 6795 $900804 $146345 $754459 217 $512 $13257 162FY 2017 237236 14590 $1264294 $274498 $989796 163 $417 $8665 217
Histo
ric Tr
ends
FY 20
161
7 DAT
A
Passengers Revenue Hours Revenue Miles
Operating Costs Passenger Revenue Operating Subsidy
230943
152259 144262 147480
237236
0
50000
100000
150000
200000
250000
FY 2013 FY 2014 FY 2015 FY 2016 FY 2017
Passengers
9814
6440 6349 6795
14590
02000400060008000
10000120001400016000
FY 2013 FY 2014 FY 2015 FY 2016 FY 2017
Revenue Hours$1362499
$948702 $882801 $900804
$1264294
$0$200000$400000$600000$800000
$1000000$1200000$1400000$1600000
FY 2013 FY 2014 FY 2015 FY 2016 FY 2017
Operating Costs
235 236 227 217
163
00
50
100
150
200
250
300
FY 2013 FY 2014 FY 2015 FY 2016 FY 2017
Passengers per Revenue Hour
$477 $507 $502 $512 $417
$000$200$400$600$800
$1000$1200$1400
FY 2013 FY 2014 FY 2015 FY 2016 FY 2017
Subsidy per Passenger
$13884 $14732 $13905 $13257
$8665
$0
$50
$100
$150
$200
FY 2013 FY 2014 FY 2015 FY 2016 FY 2017
Cost per Revenue Hour
61Rural
Days of Service Wkdy Sa SuAvg Freq (Wkdy Peak) 8 trips
Avg Freq (Wkdy Non-Peak) -Avg Freq (Wked) 16 trips
FY 2017 Farebox Recovery 8 transfer (to route) 7
Clipper usage 11
Annual Avg Monthly Avg Daily Annual Avg Monthly Avg Daily Annual Avg Monthly Avg DailyWeekday 17166 1431 68 2631 219 10 45398 3783 181 Saturday 9922 827 198 1319 110 26 20810 1734 416 Sunday 9240 770 144 1542 129 24 24457 2038 382
Total 36328 3027 100 5492 458 15 90665 7555 248
Annual Avg Monthly Avg Daily Annual Avg Monthly Avg Daily Annual Avg Monthly Avg DailyWeekday $229650 $19138 $915 $17691 $1474 $70 $211959 $17663 $844Saturday $113378 $9448 $2268 $11622 $969 $232 $101756 $8480 $2035Sunday $132750 $11063 $2074 $10646 $887 $166 $122104 $10175 $1908
Total $475778 $39648 $1304 $39959 $3330 $109 $435819 $36318 $1194
Passengers per Revenue Hour
Subsidy per Passenger
Cost per Revenue Hour
Farebox Recovery
Weekday 65 $1235 $8730 77Saturday 75 $1026 $8598 103Sunday 60 $1321 $8607 80
Total 66 $1200 $8663 84
Passengers Revenue Hours Operating CostsPassenger
RevenueOperating Subsidy
Passengers per Revenue Hour
Subsidy per Passenger
Cost per Revenue Hour
Farebox Recovery
FY 2015 39478 5379 $417539 $46324 $371215 73 $940 $7762 111FY 2016 37276 5475 $408987 $48421 $360566 68 $967 $7470 118FY 2017 36328 5492 $475778 $39959 $435819 66 $1200 $8663 84
Histo
ric Tr
ends
FY 20
161
7 DAT
A
Passengers Revenue Hours Revenue Miles
Operating Costs Passenger Revenue Operating Subsidy
30642 33386
39478 37276 36328
0
10000
20000
30000
40000
50000
FY 2013 FY 2014 FY 2015 FY 2016 FY 2017
Passengers
5388
5056
5379 5475 5492
480049005000510052005300540055005600
FY 2013 FY 2014 FY 2015 FY 2016 FY 2017
Revenue Hours
$388827 $390358 $417539 $408987 $475778
$0
$100000
$200000
$300000
$400000
$500000
FY 2013 FY 2014 FY 2015 FY 2016 FY 2017
Operating Costs
57 66
73 68 66
00
20
40
60
80
100
FY 2013 FY 2014 FY 2015 FY 2016 FY 2017
Passengers per Revenue Hour
$1136 $1045
$940 $967
$1200
$000$200$400$600$800
$1000$1200$1400
FY 2013 FY 2014 FY 2015 FY 2016 FY 2017
Subsidy per Passenger
$7216 $7721 $7762 $7470 $8663
$0
$50
$100
$150
$200
FY 2013 FY 2014 FY 2015 FY 2016 FY 2017
Cost per Revenue Hour
66Recreational
Days of Service Wkdy Sa SuAvg Freq (Wkdy Peak) 30 min
Avg Freq (Wkdy Non-Peak) 30 minAvg Freq (Wked) 10-20 min
FY 2017 Farebox Recovery 53 transfer (to route) 0
Clipper usage 0
Annual Avg Monthly Avg Daily Annual Avg Monthly Avg Daily Annual Avg Monthly Avg DailyWeekday 21940 7313 549 804 268 20 10735 3578 268 Saturday 43799 7300 1752 1473 245 59 20480 3413 819 Sunday 56377 6264 1446 2040 227 52 28212 3135 723
Total 122116 13568 1174 4316 480 42 59428 6603 571
Annual Avg Monthly Avg Daily Annual Avg Monthly Avg Daily Annual Avg Monthly Avg DailyWeekday $104033 $34678 $2601 $37751 $12584 $944 $66282 $22094 $1657Saturday $152661 $25444 $6106 $79948 $13325 $3198 $72713 $12119 $2909Sunday $217032 $24115 $5565 $132049 $14672 $3386 $84983 $9443 $2179
Total $473726 $52636 $4555 $249748 $27750 $2401 $223978 $24886 $2154
Passengers per Revenue Hour
Subsidy per Passenger
Cost per Revenue Hour
Farebox Recovery
Weekday 273 $302 $12944 363Saturday 297 $166 $10367 524Sunday 276 $151 $10638 608
Total 283 $183 $10975 527
Passengers Revenue Hours Operating CostsPassenger
RevenueOperating Subsidy
Passengers per Revenue Hour
Subsidy per Passenger
Cost per Revenue Hour
Farebox Recovery
FY 2015 103930 3866 $477523 $209514 $268009 269 $258 $12352 439FY 2016 116942 4673 $531384 $245779 $285605 250 $244 $11373 463FY 2017 122116 4316 $473726 $249748 $223978 283 $183 $10975 527
Histo
ric Tr
ends
FY 20
161
7 DAT
A
Passengers Revenue Hours Revenue Miles
Operating Costs Passenger Revenue Operating Subsidy
62624
103052 103930 116942 122116
0
20000
40000
60000
80000
100000
120000
140000
FY 2013 FY 2014 FY 2015 FY 2016 FY 2017
Passengers
2941
3841 3866
4673 4316
0
1000
2000
3000
4000
5000
FY 2013 FY 2014 FY 2015 FY 2016 FY 2017
Revenue Hours
$330076
$538014 $477523
$531384 $473726
$0
$100000
$200000
$300000
$400000
$500000
$600000
FY 2013 FY 2014 FY 2015 FY 2016 FY 2017
Operating Costs
213
268 269 250
283
00
50
100
150
200
250
300
FY 2013 FY 2014 FY 2015 FY 2016 FY 2017
Passengers per Revenue Hour
$360 $322
$258 $244 $183
$000
$100
$200
$300
$400
$500
FY 2013 FY 2014 FY 2015 FY 2016 FY 2017
Subsidy per Passenger
$11223
$14007 $12352 $11373 $10975
$0
$50
$100
$150
$200
FY 2013 FY 2014 FY 2015 FY 2016 FY 2017
Cost per Revenue Hour
68Rural
Days of Service Wkdy Sa SuAvg Freq (Wkdy Peak) 60 min
Avg Freq (Wkdy Non-Peak) 120 minAvg Freq (Wked) 60-120 min
FY 2017 Farebox Recovery 9 transfer (to route) 13
Clipper usage 12
Annual Avg Monthly Avg Daily Annual Avg Monthly Avg Daily Annual Avg Monthly Avg DailyWeekday 59903 4992 239 7282 607 29 133167 11097 531 Saturday 8410 701 168 1492 124 30 27123 2260 542 Sunday 8285 690 129 1907 159 30 34638 2887 541
Total 76598 6383 210 10680 890 29 194928 16244 534
Annual Avg Monthly Avg Daily Annual Avg Monthly Avg Daily Annual Avg Monthly Avg DailyWeekday $645737 $53811 $2573 $64332 $5361 $256 $581405 $48450 $2316Saturday $131882 $10990 $2638 $9260 $772 $185 $122622 $10219 $2452Sunday $169286 $14107 $2645 $8856 $738 $138 $160430 $13369 $2507
Total $946905 $78909 $2594 $82448 $6871 $226 $864457 $72038 $2368
Passengers per Revenue Hour
Subsidy per Passenger
Cost per Revenue Hour
Farebox Recovery
Weekday 82 $971 $8868 100Saturday 56 $1458 $8841 70Sunday 43 $1936 $8879 52
Total 72 $1129 $8866 87
Passengers Revenue Hours Operating CostsPassenger
RevenueOperating Subsidy
Passengers per Revenue Hour
Subsidy per Passenger
Cost per Revenue Hour
Farebox Recovery
FY 2015 65866 10589 $848305 $80846 $767459 62 $1165 $8011 95FY 2016 70292 10611 $811978 $88808 $723170 66 $1029 $7652 109FY 2017 76598 10680 $946905 $82448 $864457 72 $1129 $8866 87
Histo
ric Tr
ends
FY 20
161
7 DAT
A
Passengers Revenue Hours Revenue Miles
Operating Costs Passenger Revenue Operating Subsidy
48113 56988
65866 70292 76598
0
20000
40000
60000
80000
100000
FY 2013 FY 2014 FY 2015 FY 2016 FY 2017
Passengers
7140 7185
10589 10611 10680
0
2000
4000
6000
8000
10000
12000
FY 2013 FY 2014 FY 2015 FY 2016 FY 2017
Revenue Hours
$532879 $571618
$848305 $811978 $946905
$0
$200000
$400000
$600000
$800000
$1000000
FY 2013 FY 2014 FY 2015 FY 2016 FY 2017
Operating Costs
67 79
62 66 72
00
20
40
60
80
100
FY 2013 FY 2014 FY 2015 FY 2016 FY 2017
Passengers per Revenue Hour
$979 $885
$1165 $1029
$1129
$000$200$400$600$800
$1000$1200$1400
FY 2013 FY 2014 FY 2015 FY 2016 FY 2017
Subsidy per Passenger
$7464 $7955 $8011 $7652 $8866
$0
$50
$100
$150
$200
FY 2013 FY 2014 FY 2015 FY 2016 FY 2017
Cost per Revenue Hour
71XLocal Trunkline
Days of Service WkdyAvg Freq (Wkdy Peak) 30 min
Avg Freq (Wkdy Non-Peak) 60 minAvg Freq (Wked) -
FY 2017 Farebox Recovery 15 transfer (to route) 26
Clipper usage 16
Annual Avg Monthly Avg Daily Annual Avg Monthly Avg Daily Annual Avg Monthly Avg DailyWeekday 121141 10095 479 7705 642 30 174624 14552 690 Saturday - - - - - - - - - Sunday - - - - - - - - -
Total 121141 10095 479 7705 642 30 174624 14552 690
Annual Avg Monthly Avg Daily Annual Avg Monthly Avg Daily Annual Avg Monthly Avg DailyWeekday $1116954 $93080 $4415 $164963 $13747 $652 $951991 $79333 $3763Saturday $ - $ - $ - $ - $ - $ - $ - $ - $ -Sunday $ - $ - $ - $ - $ - $ - $ - $ - $ -
Total $1116954 $93080 $4415 $164963 $13747 $652 $951991 $79333 $3763
Passengers per Revenue Hour
Subsidy per Passenger
Cost per Revenue Hour
Farebox Recovery
Weekday 157 $786 $14496 148Saturday - $ - $ - - Sunday - $ - $ - -
Total 157 $786 $14496 148
Passengers Revenue Hours Operating CostsPassenger
RevenueOperating Subsidy
Passengers per Revenue Hour
Subsidy per Passenger
Cost per Revenue Hour
Farebox Recovery
FY 2015 305440 7666 $1066058 $307659 $758399 398 $248 $13906 289FY 2016 259678 7717 $1075263 $300186 $775077 337 $298 $13934 279FY 2017 121141 7705 $1116954 $164963 $951991 157 $786 $14496 148
Histo
ric Tr
ends
FY 20
161
7 DAT
A
Passengers Revenue Hours Revenue Miles
Operating Costs Passenger Revenue Operating Subsidy
347560 341105 305440
259678
121141
050000
100000150000200000250000300000350000400000
FY 2013 FY 2014 FY 2015 FY 2016 FY 2017
Passengers9038
7578 7666 7717 7705
0
2000
4000
6000
8000
10000
FY 2013 FY 2014 FY 2015 FY 2016 FY 2017
Revenue Hours$1254262
$1116004 $1066058 $1075263 $1116954
$0
$200000
$400000
$600000
$800000
$1000000
$1200000
$1400000
FY 2013 FY 2014 FY 2015 FY 2016 FY 2017
Operating Costs
385 450
398 337
157
00100200300400500600700800
FY 2013 FY 2014 FY 2015 FY 2016 FY 2017
Passengers per Revenue Hour
$253 $222 $248 $298
$786
$000
$200
$400
$600
$800
$1000
FY 2013 FY 2014 FY 2015 FY 2016 FY 2017
Subsidy per Passenger
$13877 $14728 $13906 $13934 $14496
$0
$50
$100
$150
$200
FY 2013 FY 2014 FY 2015 FY 2016 FY 2017
Cost per Revenue Hour
113Supplemental
Days of Service School DaysAvg Freq (Wkdy Peak) 3 trips
Avg Freq (Wkdy Non-Peak) -Avg Freq (Wked) -
FY 2017 Farebox Recovery 29 transfer (to route) 0
Clipper usage 4
Annual Avg Monthly Avg Daily Annual Avg Monthly Avg Daily Annual Avg Monthly Avg DailyWeekday 16829 1530 92 317 29 2 2404 219 13 Saturday - - - - - - - - - Sunday - - - - - - - - -
Total 16829 1530 92 317 29 2 2404 219 13
Annual Avg Monthly Avg Daily Annual Avg Monthly Avg Daily Annual Avg Monthly Avg DailyWeekday $42180 $3835 $230 $12227 $1112 $67 $29953 $2723 $164Saturday $ - $ - $ - $ - $ - $ - $ - $ - $ -Sunday $ - $ - $ - $ - $ - $ - $ - $ - $ -
Total $42180 $3835 $230 $12227 $1112 $67 $29953 $2723 $164
Passengers per TripSubsidy per
PassengerCost per Revenue
HourFarebox Recovery
Weekday 315 $178 $13289 290Saturday - $ - $ - - Sunday - $ - $ - -
Total 315 $178 $13289 290
Passengers Revenue Hours Operating CostsPassenger
RevenueOperating Subsidy Passengers per Trip
Subsidy per Passenger
Cost per Revenue Hour
Farebox Recovery
FY 2015 12241 161 $28599 $10703 $17896 342 $146 $17752 374FY 2016 14601 263 $36924 $12809 $24115 317 $165 $14050 347FY 2017 16829 317 $42180 $12227 $29953 315 $178 $13289 290
Histo
ric Tr
ends
FY 20
161
7 DAT
A
Passengers Revenue Hours Revenue Miles
Operating Costs Passenger Revenue Operating Subsidy
15232 13521
12241 14601
16829
0
5000
10000
15000
20000
FY 2013 FY 2014 FY 2015 FY 2016 FY 2017
Passengers
229
165 161
263
317
0
50
100
150
200
250
300
350
FY 2013 FY 2014 FY 2015 FY 2016 FY 2017
Revenue Hours
$31562
$20182
$28599
$36924 $42180
$0
$10000
$20000
$30000
$40000
$50000
FY 2013 FY 2014 FY 2015 FY 2016 FY 2017
Operating Costs
220
365 342 317 315
00
100
200
300
400
500
FY 2013 FY 2014 FY 2015 FY 2016 FY 2017
Passengers per Trip
$051 $095
$146 $165 $178
$000$100$200$300$400$500$600$700$800
FY 2013 FY 2014 FY 2015 FY 2016 FY 2017
Subsidy per Passenger
$13795 $12261
$17752
$14050 $13289
$0
$50
$100
$150
$200
FY 2013 FY 2014 FY 2015 FY 2016 FY 2017
Cost per Revenue Hour
115Supplemental
Days of Service School DaysAvg Freq (Wkdy Peak) 5 trips
Avg Freq (Wkdy Non-Peak) -Avg Freq (Wked) -
FY 2017 Farebox Recovery 11 transfer (to route) 0
Clipper usage 7
Annual Avg Monthly Avg Daily Annual Avg Monthly Avg Daily Annual Avg Monthly Avg DailyWeekday 14021 1275 71 637 58 3 6963 633 35 Saturday - - - - - - - - - Sunday - - - - - - - - -
Total 14021 1275 71 637 58 3 6963 633 35
Annual Avg Monthly Avg Daily Annual Avg Monthly Avg Daily Annual Avg Monthly Avg DailyWeekday $87534 $7958 $444 $9504 $864 $48 $78030 $7094 $396Saturday $ - $ - $ - $ - $ - $ - $ - $ - $ -Sunday $ - $ - $ - $ - $ - $ - $ - $ - $ -
Total $87534 $7958 $444 $9504 $864 $48 $78030 $7094 $396
Passengers per TripSubsidy per
PassengerCost per Revenue
HourFarebox Recovery
Weekday 185 $557 $13744 109Saturday - $ - $ - - Sunday - $ - $ - -
Total 185 $557 $13744 109
Passengers Revenue Hours Operating CostsPassenger
RevenueOperating Subsidy Passengers per Trip
Subsidy per Passenger
Cost per Revenue Hour
Farebox Recovery
FY 2015 21488 775 $131168 $18863 $112305 221 $523 $16918 144FY 2016 16366 559 $82403 $12638 $69765 168 $426 $14754 153FY 2017 14021 637 $87534 $9504 $78030 185 $557 $13744 109
Histo
ric Tr
ends
FY 20
161
7 DAT
A
Passengers Revenue Hours Revenue Miles
Operating Costs Passenger Revenue Operating Subsidy
13524
21488
16366 14021
0
5000
10000
15000
20000
25000
FY 2013 FY 2014 FY 2015 FY 2016 FY 2017
Passengers
463
775
559 637
0
200
400
600
800
1000
FY 2013 FY 2014 FY 2015 FY 2016 FY 2017
Revenue Hours
$56706
$131168
$82403 $87534
$0
$20000
$40000
$60000
$80000
$100000
$120000
$140000
FY 2013 FY 2014 FY 2015 FY 2016 FY 2017
Operating Costs
232 221 168 185
00
100
200
300
400
500
FY 2013 FY 2014 FY 2015 FY 2016 FY 2017
Passengers per Trip
$362
$523 $426
$557
$000$100$200$300$400$500$600$700$800
FY 2013 FY 2014 FY 2015 FY 2016 FY 2017
Subsidy per Passenger
$12250
$16918 $14754 $13744
$0
$50
$100
$150
$200
FY 2013 FY 2014 FY 2015 FY 2016 FY 2017
Cost per Revenue Hour
117Supplemental
Days of Service School DaysAvg Freq (Wkdy Peak) 6 trips
Avg Freq (Wkdy Non-Peak) -Avg Freq (Wked) -
FY 2017 Farebox Recovery 21 transfer (to route) 0
Clipper usage 2
Annual Avg Monthly Avg Daily Annual Avg Monthly Avg Daily Annual Avg Monthly Avg DailyWeekday 34820 3165 193 640 58 4 4753 432 26 Saturday - - - - - - - - - Sunday - - - - - - - - -
Total 34820 3165 193 640 58 4 4753 432 26
Annual Avg Monthly Avg Daily Annual Avg Monthly Avg Daily Annual Avg Monthly Avg DailyWeekday $81509 $7410 $453 $17140 $1558 $95 $64369 $5852 $358Saturday $ - $ - $ - $ - $ - $ - $ - $ - $ -Sunday $ - $ - $ - $ - $ - $ - $ - $ - $ -
Total $81509 $7410 $453 $17140 $1558 $95 $64369 $5852 $358
Passengers per TripSubsidy per
PassengerCost per Revenue
HourFarebox Recovery
Weekday 284 $185 $12732 210Saturday - $ - $ - - Sunday - $ - $ - -
Total 284 $185 $12732 210
Passengers Revenue Hours Operating CostsPassenger
RevenueOperating Subsidy Passengers per Trip
Subsidy per Passenger
Cost per Revenue Hour
Farebox Recovery
FY 2015 50008 509 $77168 $77528 ($360) 399 ($001) $15158 1005FY 2016 33705 552 $77694 $23478 $54216 269 $161 $14075 302FY 2017 34820 640 $81509 $17140 $64369 284 $185 $12732 210
Histo
ric Tr
ends
FY 20
161
7 DAT
A
Passengers Revenue Hours Revenue Miles
Operating Costs Passenger Revenue Operating Subsidy
35174 34496
50008
33705 34820
0
10000
20000
30000
40000
50000
60000
FY 2013 FY 2014 FY 2015 FY 2016 FY 2017
Passengers
299 341
509 552
640
0
100
200
300
400
500
600
700
FY 2013 FY 2014 FY 2015 FY 2016 FY 2017
Revenue Hours
$41176 $41796
$77168 $77694 $81509
$0
$20000
$40000
$60000
$80000
$100000
FY 2013 FY 2014 FY 2015 FY 2016 FY 2017
Operating Costs
436 406 399
269 284
00
100
200
300
400
500
FY 2013 FY 2014 FY 2015 FY 2016 FY 2017
Passengers per Trip
($012) ($028) ($001)
$161 $185
-$200
-$100
$000
$100
$200
$300
$400
$500
$600
FY 2013 FY 2014 FY 2015 FY 2016 FY 2017
Subsidy per Passenger$13790
$12253
$15158 $14075
$12732
$0$20$40$60$80
$100$120$140$160
FY 2013 FY 2014 FY 2015 FY 2016 FY 2017
Cost per Revenue Hour
119Supplemental
Days of Service School DaysAvg Freq (Wkdy Peak) 5 trips
Avg Freq (Wkdy Non-Peak) -Avg Freq (Wked) -
FY 2017 Farebox Recovery 34 transfer (to route) 0
Clipper usage 5
Annual Avg Monthly Avg Daily Annual Avg Monthly Avg Daily Annual Avg Monthly Avg DailyWeekday 27161 2469 151 374 34 2 6893 627 38 Saturday - - - - - - - - - Sunday - - - - - - - - -
Total 27161 2469 151 374 34 2 6893 627 38
Annual Avg Monthly Avg Daily Annual Avg Monthly Avg Daily Annual Avg Monthly Avg DailyWeekday $56273 $5116 $313 $18859 $1714 $105 $37414 $3401 $208Saturday $ - $ - $ - $ - $ - $ - $ - $ - $ -Sunday $ - $ - $ - $ - $ - $ - $ - $ - $ -
Total $56273 $5116 $313 $18859 $1714 $105 $37414 $3401 $208
Passengers per TripSubsidy per
PassengerCost per Revenue
HourFarebox Recovery
Weekday 313 $138 $15058 335Saturday - $ - $ - - Sunday - $ - $ - -
Total 313 $138 $15058 335
Passengers Revenue Hours Operating CostsPassenger
RevenueOperating Subsidy Passengers per Trip
Subsidy per Passenger
Cost per Revenue Hour
Farebox Recovery
FY 2015 28376 466 $85243 $24699 $60544 319 $213 $18292 290FY 2016 30906 431 $68366 $28456 $39910 317 $129 $15877 416FY 2017 27161 374 $56273 $18859 $37414 313 $138 $15058 335
Histo
ric Tr
ends
FY 20
161
7 DAT
A
Passengers Revenue Hours Revenue Miles
Operating Costs Passenger Revenue Operating Subsidy
27987 28376
30906
27161
25000
26000
27000
28000
29000
30000
31000
32000
FY 2013 FY 2014 FY 2015 FY 2016 FY 2017
Passengers526
466 431
374
0
100
200
300
400
500
600
FY 2013 FY 2014 FY 2015 FY 2016 FY 2017
Revenue Hours
$64440
$85243
$68366 $56273
$0
$20000
$40000
$60000
$80000
$100000
FY 2013 FY 2014 FY 2015 FY 2016 FY 2017
Operating Costs
272 319 317 313
00
100
200
300
400
500
FY 2013 FY 2014 FY 2015 FY 2016 FY 2017
Passengers per Trip
$175 $213 $129 $138
$000$100$200$300$400$500$600$700$800
FY 2013 FY 2014 FY 2015 FY 2016 FY 2017
Subsidy per Passenger
$12251
$18292 $15877 $15058
$0
$50
$100
$150
$200
FY 2013 FY 2014 FY 2015 FY 2016 FY 2017
Cost per Revenue Hour
122Partnership
Days of Service WkdyAvg Freq (Wkdy Peak) -
Avg Freq (Wkdy Non-Peak) 30 minAvg Freq (Wked) -
FY 2017 Farebox Recovery 66 transfer (to route) 9
Clipper usage 6
Annual Avg Monthly Avg Daily Annual Avg Monthly Avg Daily Annual Avg Monthly Avg DailyWeekday 19860 1986 113 1696 170 10 15480 1548 88 Saturday - - - - - - - - - Sunday - - - - - - - - -
Total 19860 1986 113 1696 170 10 15480 1548 88
Annual Avg Monthly Avg Daily Annual Avg Monthly Avg Daily Annual Avg Monthly Avg DailyWeekday $183943 $18394 $1045 $121007 $12101 $688 $62936 $6294 $358Saturday $ - $ - $ - $ - $ - $ - $ - $ - $ -Sunday $ - $ - $ - $ - $ - $ - $ - $ - $ -
Total $183943 $18394 $1045 $121007 $12101 $688 $62936 $6294 $358
Passengers per Revenue Hour
Subsidy per Passenger
Cost per Revenue Hour
Farebox Recovery
Weekday 117 $317 $10844 658Saturday - $ - $ - - Sunday - $ - $ - -
Total 117 $317 $10844 658
Passengers Revenue Hours Operating CostsPassenger
RevenueOperating Subsidy
Passengers per Revenue Hour
Subsidy per Passenger
Cost per Revenue Hour
Farebox Recovery
FY 2015FY 2016 20360 2932 $325230 $149686 $175544 69 $862 $11094 460FY 2017 19860 1696 $183943 $121007 $62936 117 $317 $10844 658
Histo
ric Tr
ends
FY 20
161
7 DAT
A
Passengers Revenue Hours Revenue Miles
Operating Costs Passenger Revenue Operating Subsidy
20360 19860
0
5000
10000
15000
20000
25000
FY 2013 FY 2014 FY 2015 FY 2016 FY 2017
Passengers2932
1696
0
500
1000
1500
2000
2500
3000
3500
FY 2013 FY 2014 FY 2015 FY 2016 FY 2017
Revenue Hours$325230
$183943
$0
$50000
$100000
$150000
$200000
$250000
$300000
$350000
FY 2013 FY 2014 FY 2015 FY 2016 FY 2017
Operating Costs
69
117
00
20
40
60
80
100
120
140
FY 2013 FY 2014 FY 2015 FY 2016 FY 2017
Passengers per Revenue Hour$862
$317
$000
$200
$400
$600
$800
$1000
FY 2013 FY 2014 FY 2015 FY 2016 FY 2017
Subsidy per Passenger
$11094 $10844
$0
$50
$100
$150
$200
FY 2013 FY 2014 FY 2015 FY 2016 FY 2017
Cost per Revenue Hour
125Supplemental
Days of Service School DaysAvg Freq (Wkdy Peak) 4 trips
Avg Freq (Wkdy Non-Peak) -Avg Freq (Wked) -
FY 2017 Farebox Recovery 16 transfer (to route) 1
Clipper usage 8
Annual Avg Monthly Avg Daily Annual Avg Monthly Avg Daily Annual Avg Monthly Avg DailyWeekday 13757 1251 76 600 55 3 8580 780 48 Saturday - - - - - - - - - Sunday - - - - - - - - -
Total 13757 1251 76 600 55 3 8580 780 48
Annual Avg Monthly Avg Daily Annual Avg Monthly Avg Daily Annual Avg Monthly Avg DailyWeekday $72469 $6588 $403 $11570 $1052 $64 $60899 $5536 $338Saturday $ - $ - $ - $ - $ - $ - $ - $ - $ -Sunday $ - $ - $ - $ - $ - $ - $ - $ - $ -
Total $72469 $6588 $403 $11570 $1052 $64 $60899 $5536 $338
Passengers per TripSubsidy per
PassengerCost per Revenue
HourFarebox Recovery
Weekday 193 $443 $12086 160Saturday - $ - $ - - Sunday - $ - $ - -
Total 193 $443 $12086 160
Passengers Revenue Hours Operating CostsPassenger
RevenueOperating Subsidy Passengers per Trip
Subsidy per Passenger
Cost per Revenue Hour
Farebox Recovery
FY 2015 13298 578 $87015 $11914 $75101 186 $565 $15054 137FY 2016 13197 595 $77991 $12684 $65307 182 $495 $13117 163FY 2017 13757 600 $72469 $11570 $60899 193 $443 $12086 160
Histo
ric Tr
ends
FY 20
161
7 DAT
A
Passengers Revenue Hours Revenue Miles
Operating Costs Passenger Revenue Operating Subsidy
8798 7189
13298 13197 13757
02000400060008000
10000120001400016000
FY 2013 FY 2014 FY 2015 FY 2016 FY 2017
Passengers
100 90
578 595 600
0
100
200
300
400
500
600
700
FY 2013 FY 2014 FY 2015 FY 2016 FY 2017
Revenue Hours
$13752 $10979
$87015 $77991
$72469
$0
$20000
$40000
$60000
$80000
$100000
FY 2013 FY 2014 FY 2015 FY 2016 FY 2017
Operating Costs
492
402
186 182 193
00
100
200
300
400
500
FY 2013 FY 2014 FY 2015 FY 2016 FY 2017
Passengers per Trip
$015 $002
$565 $495
$443
$000$100$200$300$400$500$600$700$800
FY 2013 FY 2014 FY 2015 FY 2016 FY 2017
Subsidy per Passenger$13821
$12267
$15054 $13117
$12086
$0$20$40$60$80
$100$120$140$160
FY 2013 FY 2014 FY 2015 FY 2016 FY 2017
Cost per Revenue Hour
139Supplemental
Days of Service School DaysAvg Freq (Wkdy Peak) 2 trips
Avg Freq (Wkdy Non-Peak) -Avg Freq (Wked) -
FY 2017 Farebox Recovery 20 transfer (to route) 0
Clipper usage 24
Annual Avg Monthly Avg Daily Annual Avg Monthly Avg Daily Annual Avg Monthly Avg DailyWeekday 6414 583 36 253 23 1 4127 375 23 Saturday - - - - - - - - - Sunday - - - - - - - - -
Total 6414 583 36 253 23 1 4127 375 23
Annual Avg Monthly Avg Daily Annual Avg Monthly Avg Daily Annual Avg Monthly Avg DailyWeekday $33182 $3017 $184 $6635 $603 $37 $26547 $2413 $147Saturday $ - $ - $ - $ - $ - $ - $ - $ - $ -Sunday $ - $ - $ - $ - $ - $ - $ - $ - $ -
Total $33182 $3017 $184 $6635 $603 $37 $26547 $2413 $147
Passengers per TripSubsidy per
PassengerCost per Revenue
HourFarebox Recovery
Weekday 179 $414 $13110 200Saturday - $ - $ - - Sunday - $ - $ - -
Total 179 $414 $13110 200
Passengers Revenue Hours Operating CostsPassenger
RevenueOperating Subsidy Passengers per Trip
Subsidy per Passenger
Cost per Revenue Hour
Farebox Recovery
FY 2015 5906 225 $36437 $5258 $31179 164 $528 $16173 144FY 2016 6391 315 $43776 $6241 $37535 160 $587 $13880 143FY 2017 6414 253 $33182 $6635 $26547 179 $414 $13110 200
Histo
ric Tr
ends
FY 20
161
7 DAT
A
Passengers Revenue Hours Revenue Miles
Operating Costs Passenger Revenue Operating Subsidy
4232 4026
5906 6391 6414
0
1000
2000
3000
4000
5000
6000
7000
FY 2013 FY 2014 FY 2015 FY 2016 FY 2017
Passengers
226 227 225
315
253
0
50
100
150
200
250
300
350
FY 2013 FY 2014 FY 2015 FY 2016 FY 2017
Revenue Hours
$31306 $27734
$36437
$43776
$33182
$0
$10000
$20000
$30000
$40000
$50000
FY 2013 FY 2014 FY 2015 FY 2016 FY 2017
Operating Costs
120 111 164 160 179
00
100
200
300
400
500
FY 2013 FY 2014 FY 2015 FY 2016 FY 2017
Passengers per Trip
$427
$628 $528
$587
$414
$000$100$200$300$400$500$600$700$800
FY 2013 FY 2014 FY 2015 FY 2016 FY 2017
Subsidy per Passenger
$13834 $12239
$16173 $13880 $13110
$0
$50
$100
$150
$200
FY 2013 FY 2014 FY 2015 FY 2016 FY 2017
Cost per Revenue Hour
145Supplemental
Days of Service School DaysAvg Freq (Wkdy Peak) 2-3 trips
Avg Freq (Wkdy Non-Peak) -Avg Freq (Wked) -
FY 2017 Farebox Recovery 29 transfer (to route) 5
Clipper usage 2
Annual Avg Monthly Avg Daily Annual Avg Monthly Avg Daily Annual Avg Monthly Avg DailyWeekday 16406 1491 90 191 17 1 2175 198 12 Saturday - - - - - - - - - Sunday - - - - - - - - -
Total 16406 1491 90 191 17 1 2175 198 12
Annual Avg Monthly Avg Daily Annual Avg Monthly Avg Daily Annual Avg Monthly Avg DailyWeekday $25426 $2311 $139 $7258 $660 $40 $18168 $1652 $99Saturday $ - $ - $ - $ - $ - $ - $ - $ - $ -Sunday $ - $ - $ - $ - $ - $ - $ - $ - $ -
Total $25426 $2311 $139 $7258 $660 $40 $18168 $1652 $99
Passengers per TripSubsidy per
PassengerCost per Revenue
HourFarebox Recovery
Weekday 372 $111 $13347 285Saturday - $ - $ - - Sunday - $ - $ - -
Total 372 $111 $13347 285
Passengers Revenue Hours Operating CostsPassenger
RevenueOperating Subsidy Passengers per Trip
Subsidy per Passenger
Cost per Revenue Hour
Farebox Recovery
FY 2015 6911 87 $13373 $5858 $7515 337 $109 $15442 438FY 2016 10268 167 $21672 $6341 $15331 396 $149 $12993 293FY 2017 16406 191 $25426 $7258 $18168 372 $111 $13347 285
Histo
ric Tr
ends
FY 20
161
7 DAT
A
Passengers Revenue Hours Revenue Miles
Operating Costs Passenger Revenue Operating Subsidy
6911
10268
16406
0
5000
10000
15000
20000
FY 2013 FY 2014 FY 2015 FY 2016 FY 2017
Passengers
87
167 191
0
50
100
150
200
250
FY 2013 FY 2014 FY 2015 FY 2016 FY 2017
Revenue Hours
$13373
$21672 $25426
$0
$5000
$10000
$15000
$20000
$25000
$30000
FY 2013 FY 2014 FY 2015 FY 2016 FY 2017
Operating Costs
337 396 372
00
100
200
300
400
500
FY 2013 FY 2014 FY 2015 FY 2016 FY 2017
Passengers per Trip
$109 $149 $111
$000$100$200$300$400$500$600$700$800
FY 2013 FY 2014 FY 2015 FY 2016 FY 2017
Subsidy per Passenger
$15442 $12993 $13347
$0
$50
$100
$150
$200
FY 2013 FY 2014 FY 2015 FY 2016 FY 2017
Cost per Revenue Hour
151Supplemental
Days of Service School DaysAvg Freq (Wkdy Peak) 4-5 trips
Avg Freq (Wkdy Non-Peak) -Avg Freq (Wked) -
FY 2017 Farebox Recovery 25 transfer (to route) 1
Clipper usage 4
Annual Avg Monthly Avg Daily Annual Avg Monthly Avg Daily Annual Avg Monthly Avg DailyWeekday 36801 3346 204 594 54 3 10649 968 59 Saturday - - - - - - - - - Sunday - - - - - - - - -
Total 36801 3346 204 594 54 3 10649 968 59
Annual Avg Monthly Avg Daily Annual Avg Monthly Avg Daily Annual Avg Monthly Avg DailyWeekday $73842 $6713 $410 $18463 $1678 $103 $55379 $5034 $308Saturday $ - $ - $ - $ - $ - $ - $ - $ - $ -Sunday $ - $ - $ - $ - $ - $ - $ - $ - $ -
Total $73842 $6713 $410 $18463 $1678 $103 $55379 $5034 $308
Passengers per TripSubsidy per
PassengerCost per Revenue
HourFarebox Recovery
Weekday 428 $150 $12442 250Saturday - $ - $ - - Sunday - $ - $ - -
Total 428 $150 $12442 250
Passengers Revenue Hours Operating CostsPassenger
RevenueOperating Subsidy Passengers per Trip
Subsidy per Passenger
Cost per Revenue Hour
Farebox Recovery
FY 2015 39309 911 $134174 $34376 $99798 315 $254 $14722 256FY 2016 42643 759 $100712 $25851 $74861 456 $176 $13267 257FY 2017 36801 594 $73842 $18463 $55379 428 $150 $12442 250
Histo
ric Tr
ends
FY 20
161
7 DAT
A
Passengers Revenue Hours Revenue Miles
Operating Costs Passenger Revenue Operating Subsidy
39537 39309
42643
36801
32000
34000
36000
38000
40000
42000
44000
FY 2013 FY 2014 FY 2015 FY 2016 FY 2017
Passengers
784 911
759
594
0
200
400
600
800
1000
FY 2013 FY 2014 FY 2015 FY 2016 FY 2017
Revenue Hours
$95932
$134174
$100712
$73842
$0$20000$40000$60000$80000
$100000$120000$140000$160000
FY 2013 FY 2014 FY 2015 FY 2016 FY 2017
Operating Costs
368 315
456 428
00
100
200
300
400
500
FY 2013 FY 2014 FY 2015 FY 2016 FY 2017
Passengers per Trip
$188 $254
$176 $150
$000$100$200$300$400$500$600$700$800
FY 2013 FY 2014 FY 2015 FY 2016 FY 2017
Subsidy per Passenger
$12233
$14722 $13267 $12442
$0$20$40$60$80
$100$120$140$160
FY 2013 FY 2014 FY 2015 FY 2016 FY 2017
Cost per Revenue Hour
154Supplemental
Days of Service School DaysAvg Freq (Wkdy Peak) 3 trips
Avg Freq (Wkdy Non-Peak) -Avg Freq (Wked) -
FY 2017 Farebox Recovery 21 transfer (to route) 0
Clipper usage 5
Annual Avg Monthly Avg Daily Annual Avg Monthly Avg Daily Annual Avg Monthly Avg DailyWeekday 13738 1249 76 358 33 2 4342 395 24 Saturday - - - - - - - - - Sunday - - - - - - - - -
Total 13738 1249 76 358 33 2 4342 395 24
Annual Avg Monthly Avg Daily Annual Avg Monthly Avg Daily Annual Avg Monthly Avg DailyWeekday $41965 $3815 $233 $8847 $804 $49 $33118 $3011 $184Saturday $ - $ - $ - $ - $ - $ - $ - $ - $ -Sunday $ - $ - $ - $ - $ - $ - $ - $ - $ -
Total $41965 $3815 $233 $8847 $804 $49 $33118 $3011 $184
Passengers per TripSubsidy per
PassengerCost per Revenue
HourFarebox Recovery
Weekday 255 $241 $11729 211Saturday - $ - $ - - Sunday - $ - $ - -
Total 255 $241 $11729 211
Passengers Revenue Hours Operating CostsPassenger
RevenueOperating Subsidy Passengers per Trip
Subsidy per Passenger
Cost per Revenue Hour
Farebox Recovery
FY 2015 15376 293 $42604 $13174 $29430 388 $191 $14541 309FY 2016 17858 360 $46133 $14660 $31473 311 $176 $12808 318FY 2017 13738 358 $41965 $8847 $33118 255 $241 $11729 211
Histo
ric Tr
ends
FY 20
161
7 DAT
A
Passengers Revenue Hours Revenue Miles
Operating Costs Passenger Revenue Operating Subsidy
12138
15376 17858
13738
0
5000
10000
15000
20000
FY 2013 FY 2014 FY 2015 FY 2016 FY 2017
Passengers
310 293
360 358
050
100150200250300350400
FY 2013 FY 2014 FY 2015 FY 2016 FY 2017
Revenue Hours
$37913 $42604
$46133 $41965
$0
$10000
$20000
$30000
$40000
$50000
FY 2013 FY 2014 FY 2015 FY 2016 FY 2017
Operating Costs
291
388
311 255
00
100
200
300
400
500
FY 2013 FY 2014 FY 2015 FY 2016 FY 2017
Passengers per Trip
$256 $191 $176
$241
$000$100$200$300$400$500$600$700$800
FY 2013 FY 2014 FY 2015 FY 2016 FY 2017
Subsidy per Passenger
$12246
$14541 $12808
$11729
$0$20$40$60$80
$100$120$140$160
FY 2013 FY 2014 FY 2015 FY 2016 FY 2017
Cost per Revenue Hour
219Local Connector
Days of Service Wkdy Sa SuAvg Freq (Wkdy Peak) 30 min
Avg Freq (Wkdy Non-Peak) 30 minAvg Freq (Wked) 30 min
FY 2017 Farebox Recovery 11 transfer (to route) 20
Clipper usage 11
Annual Avg Monthly Avg Daily Annual Avg Monthly Avg Daily Annual Avg Monthly Avg DailyWeekday 40817 3401 161 5020 418 20 58766 4897 232 Saturday 4888 407 94 637 53 12 10931 911 210 Sunday 4744 395 79 735 61 12 12607 1051 210
Total 50449 4204 138 6392 533 18 82304 6859 225
Annual Avg Monthly Avg Daily Annual Avg Monthly Avg Daily Annual Avg Monthly Avg DailyWeekday $462388 $38532 $1828 $51411 $4284 $203 $410977 $34248 $1624Saturday $59904 $4992 $1152 $6230 $519 $120 $53674 $4473 $1032Sunday $68932 $5744 $1149 $6460 $538 $108 $62472 $5206 $1041
Total $591224 $49269 $1620 $64101 $5342 $176 $527123 $43927 $1444
Passengers per Revenue Hour
Subsidy per Passenger
Cost per Revenue Hour
Farebox Recovery
Weekday 81 $1007 $9212 111Saturday 77 $1098 $9401 104Sunday 65 $1317 $9381 94
Total 79 $1045 $9250 108
Passengers Revenue Hours Operating CostsPassenger
RevenueOperating Subsidy
Passengers per Revenue Hour
Subsidy per Passenger
Cost per Revenue Hour
Farebox Recovery
FY 2015 60906 6585 $569962 $65747 $504215 92 $828 $8656 115FY 2016 55610 6591 $590663 $73164 $517499 84 $931 $8961 124FY 2017 50449 6392 $591224 $64101 $527123 79 $1045 $9250 108
Histo
ric Tr
ends
FY 20
161
7 DAT
A
Passengers Revenue Hours Revenue Miles
Operating Costs Passenger Revenue Operating Subsidy
55543 60906
55610 50449
0
10000
20000
30000
40000
50000
60000
70000
FY 2013 FY 2014 FY 2015 FY 2016 FY 2017
Passengers
5734
6585 6591 6392
520054005600580060006200640066006800
FY 2013 FY 2014 FY 2015 FY 2016 FY 2017
Revenue Hours
$522978
$569962
$590663 $591224
$480000
$500000
$520000
$540000
$560000
$580000
$600000
FY 2013 FY 2014 FY 2015 FY 2016 FY 2017
Operating Costs
97 92 84 79
00
20
40
60
80
100
120
140
FY 2013 FY 2014 FY 2015 FY 2016 FY 2017
Passengers per Revenue Hour
$851 $828 $931
$1045
$000$200$400$600$800
$1000$1200$1400
FY 2013 FY 2014 FY 2015 FY 2016 FY 2017
Subsidy per Passenger
$9121 $8656 $8961 $9250
$0
$50
$100
$150
$200
FY 2013 FY 2014 FY 2015 FY 2016 FY 2017
Cost per Revenue Hour
228Local Connector
Days of Service Wkdy Sa SuAvg Freq (Wkdy Peak) 60 min
Avg Freq (Wkdy Non-Peak) 60 minAvg Freq (Wked) 60 min
FY 2017 Farebox Recovery 11 transfer (to route) 17
Clipper usage 15
Annual Avg Monthly Avg Daily Annual Avg Monthly Avg Daily Annual Avg Monthly Avg DailyWeekday 57316 4776 227 7175 598 28 65884 5490 260 Saturday 8218 685 158 1331 111 26 13020 1085 250 Sunday 5806 484 97 1536 128 26 15023 1252 250
Total 71340 5945 195 10042 837 28 93926 7827 257
Annual Avg Monthly Avg Daily Annual Avg Monthly Avg Daily Annual Avg Monthly Avg DailyWeekday $646194 $53850 $2554 $80857 $6738 $320 $565337 $47111 $2235Saturday $120205 $10017 $2312 $12568 $1047 $242 $107637 $8970 $2070Sunday $138407 $11534 $2307 $10487 $874 $175 $127920 $10660 $2132
Total $904806 $75401 $2479 $103912 $8659 $285 $800894 $66741 $2194
Passengers per Revenue Hour
Subsidy per Passenger
Cost per Revenue Hour
Farebox Recovery
Weekday 80 $986 $9006 125Saturday 62 $1310 $9030 105Sunday 38 $2203 $9011 76
Total 71 $1123 $9010 115
Passengers Revenue Hours Operating CostsPassenger
RevenueOperating Subsidy
Passengers per Revenue Hour
Subsidy per Passenger
Cost per Revenue Hour
Farebox Recovery
FY 2015 15287 2828 $239879 $18274 $221605 54 $1450 $8482 76FY 2016 17522 3185 $280634 $28092 $252542 55 $1441 $8812 100FY 2017 71340 10042 $904806 $103912 $800894 71 $1123 $9010 115
Histo
ric Tr
ends
FY 20
161
7 DAT
A
Passengers Revenue Hours Revenue Miles
Operating Costs Passenger Revenue Operating Subsidy
5854 15287 17522
71340
01000020000300004000050000600007000080000
FY 2013 FY 2014 FY 2015 FY 2016 FY 2017
Passengers
970
2828 3185
10042
0
2000
4000
6000
8000
10000
12000
FY 2013 FY 2014 FY 2015 FY 2016 FY 2017
Revenue Hours
$85183
$239879 $280634
$904806
$0
$200000
$400000
$600000
$800000
$1000000
FY 2013 FY 2014 FY 2015 FY 2016 FY 2017
Operating Costs
60 54 55 71
00
20
40
60
80
100
120
140
FY 2013 FY 2014 FY 2015 FY 2016 FY 2017
Passengers per Revenue Hour$1358
$1450 $1441
$1123
$000$200$400$600$800
$1000$1200$1400
FY 2013 FY 2014 FY 2015 FY 2016 FY 2017
Subsidy per Passenger
$8779 $8482 $8812 $9010
$0
$50
$100
$150
$200
FY 2013 FY 2014 FY 2015 FY 2016 FY 2017
Cost per Revenue Hour
233Local Connector
Days of Service Wkdy Sa SuAvg Freq (Wkdy Peak) 60 min
Avg Freq (Wkdy Non-Peak) 60 minAvg Freq (Wked) 60 min
FY 2017 Farebox Recovery 13 transfer (to route) 16
Clipper usage 10
Annual Avg Monthly Avg Daily Annual Avg Monthly Avg Daily Annual Avg Monthly Avg DailyWeekday 35589 2966 141 3306 276 13 38809 3234 153 Saturday 3911 326 75 490 41 9 5829 486 112 Sunday 3298 275 55 566 47 9 6726 561 112
Total 42798 3567 117 4363 364 12 51364 4280 141
Annual Avg Monthly Avg Daily Annual Avg Monthly Avg Daily Annual Avg Monthly Avg DailyWeekday $302758 $25230 $1197 $42450 $3538 $168 $260308 $21692 $1029Saturday $44829 $3736 $862 $5018 $418 $97 $39811 $3318 $766Sunday $51616 $4301 $860 $4533 $378 $76 $47083 $3924 $785
Total $399203 $33267 $1094 $52001 $4333 $142 $347202 $28934 $951
Passengers per Revenue Hour
Subsidy per Passenger
Cost per Revenue Hour
Farebox Recovery
Weekday 108 $731 $9158 140Saturday 80 $1018 $9141 112Sunday 58 $1428 $9118 88
Total 98 $811 $9151 130
Passengers Revenue Hours Operating CostsPassenger
RevenueOperating Subsidy
Passengers per Revenue Hour
Subsidy per Passenger
Cost per Revenue Hour
Farebox Recovery
FY 2015 50342 4366 $371602 $52526 $319076 115 $634 $8512 141FY 2016 49494 4384 $388005 $59296 $328709 113 $664 $8851 153FY 2017 42798 4363 $399203 $52001 $347202 98 $811 $9151 130
Histo
ric Tr
ends
FY 20
161
7 DAT
A
Passengers Revenue Hours Revenue Miles
Operating Costs Passenger Revenue Operating Subsidy
39956
50422 50342 49494 42798
0
10000
20000
30000
40000
50000
60000
FY 2013 FY 2014 FY 2015 FY 2016 FY 2017
Passengers
3981
4144
4366 4384 4363
370038003900400041004200430044004500
FY 2013 FY 2014 FY 2015 FY 2016 FY 2017
Revenue Hours
$350499
$378792 $371602
$388005 $399203
$320000$330000$340000$350000$360000$370000$380000$390000$400000$410000
FY 2013 FY 2014 FY 2015 FY 2016 FY 2017
Operating Costs
100
122 115 113 98
00
20
40
60
80
100
120
140
FY 2013 FY 2014 FY 2015 FY 2016 FY 2017
Passengers per Revenue Hour
$760 $661 $634 $664
$811
$000$200$400$600$800
$1000$1200$1400
FY 2013 FY 2014 FY 2015 FY 2016 FY 2017
Subsidy per Passenger
$8805 $9142 $8512 $8851 $9151
$0
$50
$100
$150
$200
FY 2013 FY 2014 FY 2015 FY 2016 FY 2017
Cost per Revenue Hour
245Local Connector
Days of Service Wkdy Sa SuAvg Freq (Wkdy Peak) 60 min
Avg Freq (Wkdy Non-Peak) 60 minAvg Freq (Wked) 60 min
FY 2017 Farebox Recovery 15 transfer (to route) 13
Clipper usage 13
Annual Avg Monthly Avg Daily Annual Avg Monthly Avg Daily Annual Avg Monthly Avg DailyWeekday 41761 3480 165 3014 251 12 28706 2392 113 Saturday 4220 352 81 620 52 12 5778 482 111 Sunday 3785 315 63 715 60 12 6667 556 111
Total 49766 4147 136 4349 362 12 41152 3429 113
Annual Avg Monthly Avg Daily Annual Avg Monthly Avg Daily Annual Avg Monthly Avg DailyWeekday $271762 $22647 $1074 $44873 $3739 $177 $226889 $18907 $897Saturday $55697 $4641 $1071 $6217 $518 $120 $49480 $4123 $952Sunday $64137 $5345 $1069 $5878 $490 $98 $58259 $4855 $971
Total $391596 $32633 $1073 $56968 $4747 $156 $334628 $27886 $917
Passengers per Revenue Hour
Subsidy per Passenger
Cost per Revenue Hour
Farebox Recovery
Weekday 139 $543 $9016 165Saturday 68 $1173 $8988 112Sunday 53 $1539 $8970 92
Total 114 $672 $9004 145
Passengers Revenue Hours Operating CostsPassenger
RevenueOperating Subsidy
Passengers per Revenue Hour
Subsidy per Passenger
Cost per Revenue Hour
Farebox Recovery
FY 2015FY 2016 2184 227 $19695 $3137 $16558 96 $758 $8695 159FY 2017 49766 4349 $391596 $56968 $334628 114 $672 $9004 145
Histo
ric Tr
ends
FY 20
161
7 DAT
A
Passengers Revenue Hours Revenue Miles
Operating Costs Passenger Revenue Operating Subsidy
2184
49766
0
10000
20000
30000
40000
50000
60000
FY 2013 FY 2014 FY 2015 FY 2016 FY 2017
Passengers
227
4349
0
1000
2000
3000
4000
5000
FY 2013 FY 2014 FY 2015 FY 2016 FY 2017
Revenue Hours
$19695
$391596
$0
$100000
$200000
$300000
$400000
$500000
FY 2013 FY 2014 FY 2015 FY 2016 FY 2017
Operating Costs
96 114
00
20
40
60
80
100
120
140
FY 2013 FY 2014 FY 2015 FY 2016 FY 2017
Passengers per Revenue Hour
$758 $672
$000$200$400$600$800
$1000$1200$1400
FY 2013 FY 2014 FY 2015 FY 2016 FY 2017
Subsidy per Passenger
$8695 $9004
$0
$50
$100
$150
$200
FY 2013 FY 2014 FY 2015 FY 2016 FY 2017
Cost per Revenue Hour
251Local Connector
Days of Service Wkdy Sa SuAvg Freq (Wkdy Peak) 60 min
Avg Freq (Wkdy Non-Peak) 60 minAvg Freq (Wked) 60 min
FY 2017 Farebox Recovery 11 transfer (to route) 8
Clipper usage 8
Annual Avg Monthly Avg Daily Annual Avg Monthly Avg Daily Annual Avg Monthly Avg DailyWeekday 76675 6390 303 6754 563 27 95654 7971 378 Saturday 9952 829 191 1325 110 25 18630 1553 358 Sunday 8879 740 148 1528 127 25 21497 1791 358
Total 95506 7959 262 9607 801 26 135781 11315 372
Annual Avg Monthly Avg Daily Annual Avg Monthly Avg Daily Annual Avg Monthly Avg DailyWeekday $625542 $52129 $2472 $78006 $6501 $308 $547536 $45628 $2164Saturday $122485 $10207 $2355 $12104 $1009 $233 $110381 $9198 $2123Sunday $140992 $11749 $2350 $11713 $976 $195 $129279 $10773 $2155
Total $889019 $74085 $2436 $101823 $8485 $279 $787196 $65600 $2157
Passengers per Revenue Hour
Subsidy per Passenger
Cost per Revenue Hour
Farebox Recovery
Weekday 114 $714 $9262 125Saturday 75 $1109 $9246 99Sunday 58 $1456 $9225 83
Total 99 $824 $9254 115
Passengers Revenue Hours Operating CostsPassenger
RevenueOperating Subsidy
Passengers per Revenue Hour
Subsidy per Passenger
Cost per Revenue Hour
Farebox Recovery
FY 2015 97647 9172 $800242 $103081 $697161 106 $714 $8725 129FY 2016 98886 9226 $831623 $120959 $710664 107 $719 $9014 145FY 2017 95506 9607 $889019 $101823 $787196 99 $824 $9254 115
Histo
ric Tr
ends
FY 20
161
7 DAT
A
Passengers Revenue Hours Revenue Miles
Operating Costs Passenger Revenue Operating Subsidy
87073
97647 98886
95506
80000
85000
90000
95000
100000
FY 2013 FY 2014 FY 2015 FY 2016 FY 2017
Passengers
8322
9172 9226
9607
7500
8000
8500
9000
9500
10000
FY 2013 FY 2014 FY 2015 FY 2016 FY 2017
Revenue Hours
$772570
$800242
$831623
$889019
$700000
$750000
$800000
$850000
$900000
FY 2013 FY 2014 FY 2015 FY 2016 FY 2017
Operating Costs
105 106 107 99
00
20
40
60
80
100
120
140
FY 2013 FY 2014 FY 2015 FY 2016 FY 2017
Passengers per Revenue Hour
$797 $714 $719
$824
$000$200$400$600$800
$1000$1200$1400
FY 2013 FY 2014 FY 2015 FY 2016 FY 2017
Subsidy per Passenger
$9284 $8725 $9014 $9254
$0
$50
$100
$150
$200
FY 2013 FY 2014 FY 2015 FY 2016 FY 2017
Cost per Revenue Hour
257Local Connector
Days of Service WkdyAvg Freq (Wkdy Peak) 60 min
Avg Freq (Wkdy Non-Peak) 60 minAvg Freq (Wked) -
FY 2017 Farebox Recovery 12 transfer (to route) 6
Clipper usage 13
Annual Avg Monthly Avg Daily Annual Avg Monthly Avg Daily Annual Avg Monthly Avg DailyWeekday 69126 5761 273 7643 637 30 85748 7146 339 Saturday - - - - - - - - - Sunday - - - - - - - - -
Total 69126 5761 273 7643 637 30 85748 7146 339
Annual Avg Monthly Avg Daily Annual Avg Monthly Avg Daily Annual Avg Monthly Avg DailyWeekday $697953 $58163 $2759 $82621 $6885 $327 $615332 $51278 $2432Saturday $ - $ - $ - $ - $ - $ - $ - $ - $ -Sunday $ - $ - $ - $ - $ - $ - $ - $ - $ -
Total $697953 $58163 $2759 $82621 $6885 $327 $615332 $51278 $2432
Passengers per Revenue Hour
Subsidy per Passenger
Cost per Revenue Hour
Farebox Recovery
Weekday 90 $890 $9132 118Saturday - $ - $ - - Sunday - $ - $ - -
Total 90 $890 $9132 118
Passengers Revenue Hours Operating CostsPassenger
RevenueOperating Subsidy
Passengers per Revenue Hour
Subsidy per Passenger
Cost per Revenue Hour
Farebox Recovery
FY 2015 69984 6289 $546363 $73402 $472961 111 $676 $8687 134FY 2016 71429 6414 $575805 $83288 $492517 111 $690 $8977 145FY 2017 69126 7643 $697953 $82621 $615332 90 $890 $9132 118
Histo
ric Tr
ends
FY 20
161
7 DAT
A
Passengers Revenue Hours Revenue Miles
Operating Costs Passenger Revenue Operating Subsidy
35511
68515 69984 71429 69126
01000020000300004000050000600007000080000
FY 2013 FY 2014 FY 2015 FY 2016 FY 2017
Passengers
2909
5965 6289 6414 7643
0
2000
4000
6000
8000
10000
FY 2013 FY 2014 FY 2015 FY 2016 FY 2017
Revenue Hours
$263500
$555608 $546363 $575805
$697953
$0$100000$200000$300000$400000$500000$600000$700000$800000
FY 2013 FY 2014 FY 2015 FY 2016 FY 2017
Operating Costs
122 115 111 111
90
00
20
40
60
80
100
120
140
FY 2013 FY 2014 FY 2015 FY 2016 FY 2017
Passengers per Revenue Hour
$625 $721 $676 $690
$890
$000$200$400$600$800
$1000$1200$1400
FY 2013 FY 2014 FY 2015 FY 2016 FY 2017
Subsidy per Passenger
$9057 $9315 $8687 $8977 $9132
$0
$50
$100
$150
$200
FY 2013 FY 2014 FY 2015 FY 2016 FY 2017
Cost per Revenue Hour
Hdn ValleyYellow Bus
Days of Service School DaysAvg Freq (Wkdy Peak) 2 trips
Avg Freq (Wkdy Non-Peak) -Avg Freq (Wked) -
FY 2017 Farebox Recovery 26 transfer (to route) -
Clipper usage -
Annual Avg Monthly Avg Daily Annual Avg Monthly Avg Daily Annual Avg Monthly Avg DailyWeekday 9281 844 52 180 16 1 1638 149 9 Saturday - - - - - - - - - Sunday - - - - - - - - -
Total 9281 844 52 180 16 1 1638 149 9
Annual Avg Monthly Avg Daily Annual Avg Monthly Avg Daily Annual Avg Monthly Avg DailyWeekday $124763 $11342 $693 $32170 $2925 $179 $92593 $8418 $514Saturday $ - $ - $ - $ - $ - $ - $ - $ - $ -Sunday $ - $ - $ - $ - $ - $ - $ - $ - $ -
Total $124763 $11342 $693 $32170 $2925 $179 $92593 $8418 $514
Passengers per Revenue Hour
Subsidy per Passenger
Cost per Revenue Hour
Farebox Recovery
Weekday 516 $998 $69313 258Saturday - $ - $ - - Sunday - $ - $ - -
Total 516 $998 $69313 258
Passengers Revenue Hours Operating CostsPassenger
RevenueOperating Subsidy
Passengers per Revenue Hour
Subsidy per Passenger
Cost per Revenue Hour
Farebox Recovery
FY 2015FY 2016 8669 211 $140482 $25658 $114824 412 $1325 $66706 183FY 2017 9281 180 $124763 $32170 $92593 516 $998 $69313 258
Histo
ric Tr
ends
FY 20
161
7 DAT
A
Passengers Revenue Hours Revenue Miles
Operating Costs Passenger Revenue Operating Subsidy
8669 9281
0
2000
4000
6000
8000
10000
FY 2013 FY 2014 FY 2015 FY 2016 FY 2017
Passengers211
180
0
50
100
150
200
250
FY 2013 FY 2014 FY 2015 FY 2016 FY 2017
Revenue Hours$140482
$124763
$0$20000$40000$60000$80000
$100000$120000$140000$160000
FY 2013 FY 2014 FY 2015 FY 2016 FY 2017
Operating Costs
412 516
00
500
1000
1500
2000
FY 2013 FY 2014 FY 2015 FY 2016 FY 2017
Passengers per Revenue Hour
$1325
$998
$000
$200
$400
$600
$800
$1000
$1200
$1400
FY 2013 FY 2014 FY 2015 FY 2016 FY 2017
Subsidy per Passenger
$66706 $69313
$0$100$200$300$400$500$600$700$800
FY 2013 FY 2014 FY 2015 FY 2016 FY 2017
Cost per Revenue Hour
White HillYellow Bus
Days of Service School DaysAvg Freq (Wkdy Peak) 17 trips
Avg Freq (Wkdy Non-Peak) -Avg Freq (Wked) -
FY 2017 Farebox Recovery 60 transfer (to route) -
Clipper usage -
Annual Avg Monthly Avg Daily Annual Avg Monthly Avg Daily Annual Avg Monthly Avg DailyWeekday 127219 11565 707 1065 97 6 12096 1100 67 Saturday - - - - - - - - - Sunday - - - - - - - - -
Total 127219 11565 707 1065 97 6 12096 1100 67
Annual Avg Monthly Avg Daily Annual Avg Monthly Avg Daily Annual Avg Monthly Avg DailyWeekday $738585 $67144 $4103 $440896 $40081 $2449 $297689 $27063 $1654Saturday $ - $ - $ - $ - $ - $ - $ - $ - $ -Sunday $ - $ - $ - $ - $ - $ - $ - $ - $ -
Total $738585 $67144 $4103 $440896 $40081 $2449 $297689 $27063 $1654
Passengers per Revenue Hour
Subsidy per Passenger
Cost per Revenue Hour
Farebox Recovery
Weekday 1194 $234 $69325 597Saturday - $ - $ - - Sunday - $ - $ - -
Total 1194 $234 $69325 597
Passengers Revenue Hours Operating CostsPassenger
RevenueOperating Subsidy
Passengers per Revenue Hour
Subsidy per Passenger
Cost per Revenue Hour
Farebox Recovery
FY 2015FY 2016 129635 870 $579937 $385753 $194184 1491 $150 $66698 665FY 2017 127219 1065 $738585 $440896 $297689 1194 $234 $69325 597
Histo
ric Tr
ends
FY 20
161
7 DAT
A
Passengers Revenue Hours Revenue Miles
Operating Costs Passenger Revenue Operating Subsidy
129635 127219
0
20000
40000
60000
80000
100000
120000
140000
FY 2013 FY 2014 FY 2015 FY 2016 FY 2017
Passengers
870
1065
0
200
400
600
800
1000
1200
FY 2013 FY 2014 FY 2015 FY 2016 FY 2017
Revenue Hours
$579937
$738585
$0$100000$200000$300000$400000$500000$600000$700000$800000
FY 2013 FY 2014 FY 2015 FY 2016 FY 2017
Operating Costs
1491
1194
00200400600800
1000120014001600
FY 2013 FY 2014 FY 2015 FY 2016 FY 2017
Passengers per Revenue Hour
$150 $234
$000
$200
$400
$600
$800
$1000
$1200
$1400
FY 2013 FY 2014 FY 2015 FY 2016 FY 2017
Subsidy per Passenger$66698 $69325
$0$100$200$300$400$500$600$700$800
FY 2013 FY 2014 FY 2015 FY 2016 FY 2017
Cost per Revenue Hour
MARIN TRANSIT | 2018ndash2027 SHORT RANGE TRANSIT PLAN Chapter 4 Capital Plan
DRAFT 4-9
Table 4-7 Local Transit Bus Replacement Schedule
Fiscal Year (In-service)
Replacements
Total Cost
Local Share Vehicle Type Seating
Capacity Service(1)
FY 201718 10 $7710000 $1387800 40ft hybrid 39 LB
2 $1662000 $332404 35ft Electric 32 LB
FY 201819
1 $125000 $22500 24ft 20 SH
4 $1600000 $1094880 29ft XHF
(upgrade) 22 SG
FY 201920 10 $8940000 $1609200 60ft 63 LB
FY 202021 8 $1032000 $185760 24ft 20 SH
2 $850000 $153000 35ft XHF 37 MW
FY 202223
7 $5584578 $1005224 35ft hybrid 32 LB
2 $874182 $599281 29ft XHF
(upgrade) 22 SG
FY 202425 3 $1393227 $250781 35ft XHF 37 MW
FY 202526 2 $299093 $53837 24ft 20 SH
5 $2391706 $430507 35ft XHF 37 MW
FY 202627 - - - - - -
Notes (1) Service Types LB ndash Big Bus SH- Shuttle SG- Rural Stagecoach MW- Seasonal Muir Woods and School
Expansion Needs When considering service expansion vehicles are often a constraint on the amount of service that can be added Expansion vehicles are a lower priority in the regional capital plan and typically do not receive federal funds Local state or discretionary grants are required to expand fleets The capital plan does not include any expansion vehicles for the local fixed route program consistent with the current service plan
Marin Transit relies on three retired active vehicles to support operations Retired active vehicles are vehicles that are beyond their FTA-determined useful life that remain in service while their replacements are added the fleet The District intends to replace these as expansion vehicles if funding becomes available
Demand Response Vehicles
Marin Transit has 58 vehicles available for local and regional paratransit service To provide an adequate number of spare vehicles a maximum of about 46 vehicles in service Marin Transit owns 32 vehicles GGBHTD owns 14 and the contractor provides another 13 vehicles to support the operations Eleven of the 13 contractor vehicles will be replaced in early 2018 - five by the District and six by GGBHTD Two of the five replaced by the District will be replaced with smaller accessible vans These will be used for same day
Fixed-Route Passengers (incl Yellow Bus) by Month
July August September October November December January February March April May June
Prior Fiscal Year Passengers Current Fiscal Year PassengersPrior Fiscal Year Passengers Current Fiscal Year Passengers
0
80000
160000
240000
320000
244439
271284484271284
296637296637
2768532276853
252829252829
238010238010
219681219681
2097050505209705
277644277644
240773240773240773240773
284816284816
24935149492493512444392444392442 43999244439244244439439244439244244439999999244200
2600562602600 0000000260056
FISCAL YEAR
2018
Demand Response Passengers by Month
July August September October November December January February March April May June
Prior Fiscal Year Passengers Current Fiscal Year PassengersPrior Fiscal Year Passengers Current Fiscal Year Passengers
0
4000
8000
12000
16000
12 77312773
13631 1362813628 1356413564
1247712477
1206712067 1212412124118100011810
1364613646
1260912609
1359313593
12950129501277312 77312 77312 77312613131612 6133312 6133312613331277312773127731277312613
13 6311363113 631135641363113 613631311363113 6136313113564
Year-to-Date Ridership Trends
Item 3b
2
Average Systemwide Daily Passengers
Weekday Saturday Sunday
Prior Fiscal Year Average Daily Passengers Current Fiscal Year Average Daily PassengersPrior Fiscal Year Average Daily Passengers Current Fiscal Year Average Daily Passengers
0
3000
6000
9000
12000
11370113701109811098
7726772674407440
66576657
60556055
Productivity (paxhr) by Typology
1 Local T
runklin
e
2 Local B
asic
3 Local C
onnecto
r
5 R
ura
l
8 R
ecre
ational
9 D
em
and R
esponse
Prior Fiscal Year Productivity Current Fiscal Year ProductivityPrior Fiscal Year Productivity Current Fiscal Year Productivity
00
80
160
240
320
249249 252252
163163
14814 8148
9292 91918181
757 575
320320
275275
2323 2121
Monthly StatisticsMONTH
August
1 Local Trunkline Routes 35 36 71X
2 Local Basic Routes 17 22 23 23X 29 49
3 Local Connector Routes 219 228 233 245 251 257
5 Rural Routes 61 68
8 Recreational Routes 6666F
9 Demand Response Local Paratransit Novato Dial-A-Ride Rural Dial-A-Ride
Route Typologies
Item 3b
3
Fixed-Route Passengers (incl Yellow Bus) by Month
July August September October November December January February March April May June
Prior Fiscal Year Passengers Current Fiscal Year Passengers
0
80000
160000
240000
320000
244439244439
271284271284
296637296637
276853276853
252829252829
238010238010
219681219681209705209705
277644277644
240773240773
284816284816
249351249351244200244200
260056260056
282441282441
FISCAL YEAR
2018
Demand Response Passengers by Month
July August September October November December January February March April May June
Prior Fiscal Year Passengers Current Fiscal Year Passengers
0
4000
8000
12000
16000
1277312773
1363113631 1362813628 1356413564
12477124771206712067 1212412124
1181011810
1364613646
1260912609
1359313593
12950129501261312613
1356413564 1342713427
Year-to-Date Ridership Trends
Monthly Monitoring Report 11022017
Page 12Item 3b
2
Average Systemwide Daily Passengers
Weekday Saturday Sunday
Prior Fiscal Year Average Daily Passengers Current Fiscal Year Average Daily Passengers
0
3000
6000
9000
12000 11848118481161311613
73637363
67876787
6126612657395739
Productivity (paxhr) by Typology
1 L
ocal
Tru
nklin
e
2 L
ocal
Bas
ic
3 L
ocal
Con
nect
or
5 R
ural
8 R
ecre
atio
nal
9 D
eman
d R
espo
nse
Prior Fiscal Year Productivity Current Fiscal Year Productivity
00
80
160
240
320
278278 274274
174174 168168
9898 9797
7676 7676
304304
222222
2323 2222
Monthly StatisticsMONTH
September
1 Local Trunkline Routes 35 36 71X
2 Local Basic Routes 17 22 23 23X 29 49
3 Local Connector Routes 219 228 233 245 251 257
5 Rural Routes 61 68
8 Recreational Routes 6666F
9 Demand Response Local Paratransit Novato Dial-A-Ride Rural Dial-A-Ride
Route Typologies
Page 22Item 3b
3
Fixed-Route Passengers (incl Yellow Bus) by Month
July August September October November December January February March April May June
Prior Fiscal Year Passengers Current Fiscal Year Passengers
0
80000
160000
240000
320000
244439244439
271284271284
296637296637
276853276853
252829252829
238010238010
219681219681209705209705
277644277644
240773240773
284816284816
249351249351244200244200
260056260056
282441282441 282922282922
FISCAL YEAR
2018
Demand Response Passengers by Month
July August September October November December January February March April May June
Prior Fiscal Year Passengers Current Fiscal Year Passengers
0
4000
8000
12000
16000
1277312773
1363113631 1362813628 1356413564
12477124771206712067 1212412124
1181011810
1364613646
1260912609
1359313593
12950129501261312613
1356413564 13427134271373413734
Year-to-Date Ridership Trends
Monthly Monitoring Report 12082017
Page 12Item 3b
2
Average Systemwide Daily Passengers
Weekday Saturday Sunday
Prior Fiscal Year Average Daily Passengers Current Fiscal Year Average Daily Passengers
0
3000
6000
9000
120001125811258 1115111151
6043604364326432
4717471750675067
Productivity (paxhr) by Typology
1 L
ocal
Tru
nklin
e
2 L
ocal
Bas
ic
3 L
ocal
Con
nect
or
5 R
ural
8 R
ecre
atio
nal
9 D
eman
d R
espo
nse
Prior Fiscal Year Productivity Current Fiscal Year Productivity
00
70
140
210
280258258
270270
163163 161161
9696 9595
6363 7070
202202190190
2323 2121
Monthly StatisticsMONTH
October
1 Local Trunkline Routes 35 36 71X
2 Local Basic Routes 17 22 23 23X 29 49
3 Local Connector Routes 219 228 233 245 251 257
5 Rural Routes 61 68
8 Recreational Routes 6666F
9 Demand Response Local Paratransit Novato Dial-A-Ride Rural Dial-A-Ride
Route Typologies
Page 22Item 3b
3
- RFP - OampM for Fixed Route Service - Addendum 3 12-18-2017
- MV Fee Schedule
- Airporter Fee Schedule
- FY2017Performance
-
- System Performance Summary for FY 201617
-
- Fixed Route
- Yellow Bus
- Demand Response
- Other Services
-
- Performance Goals
- Ridership Trends
- FY 201718 Performance Outlook
-
- Attachment A Route Profiles
-
- Local Transit Bus Replacement Schedule
- August 2017 Monthly Monitoring Report
- September 2017 Monthly Monitoring Report
- October 2017 Monthly Monitoring Report
-
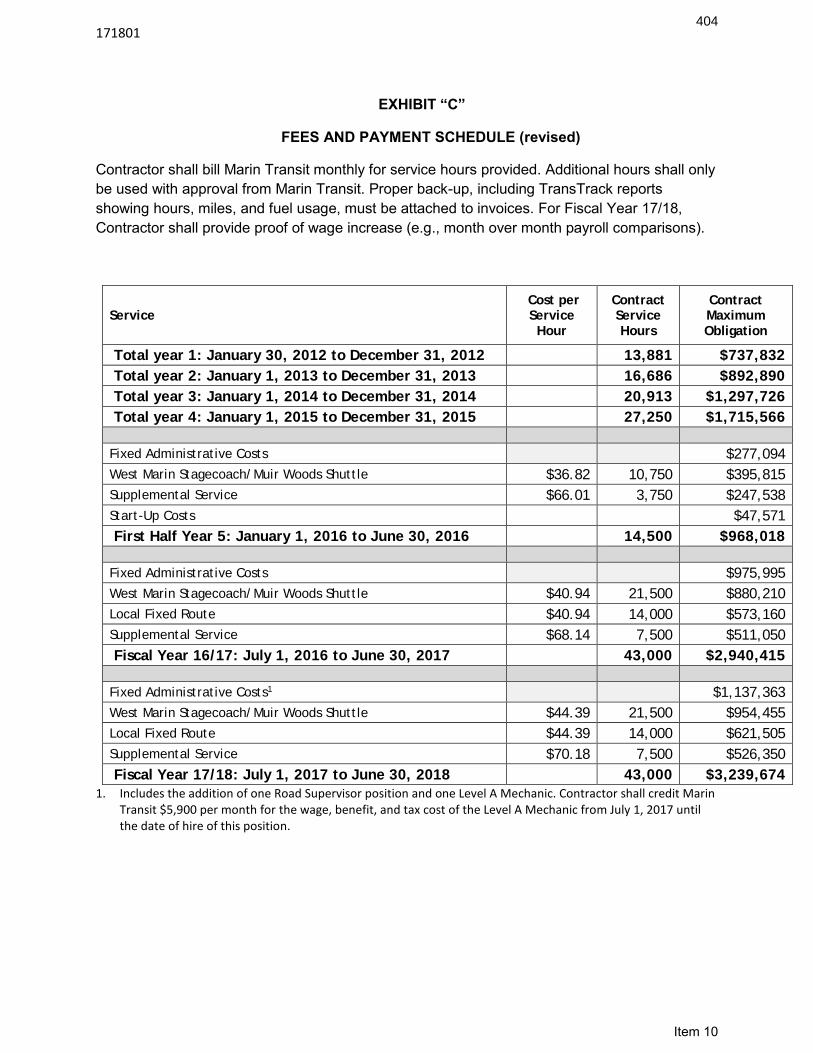
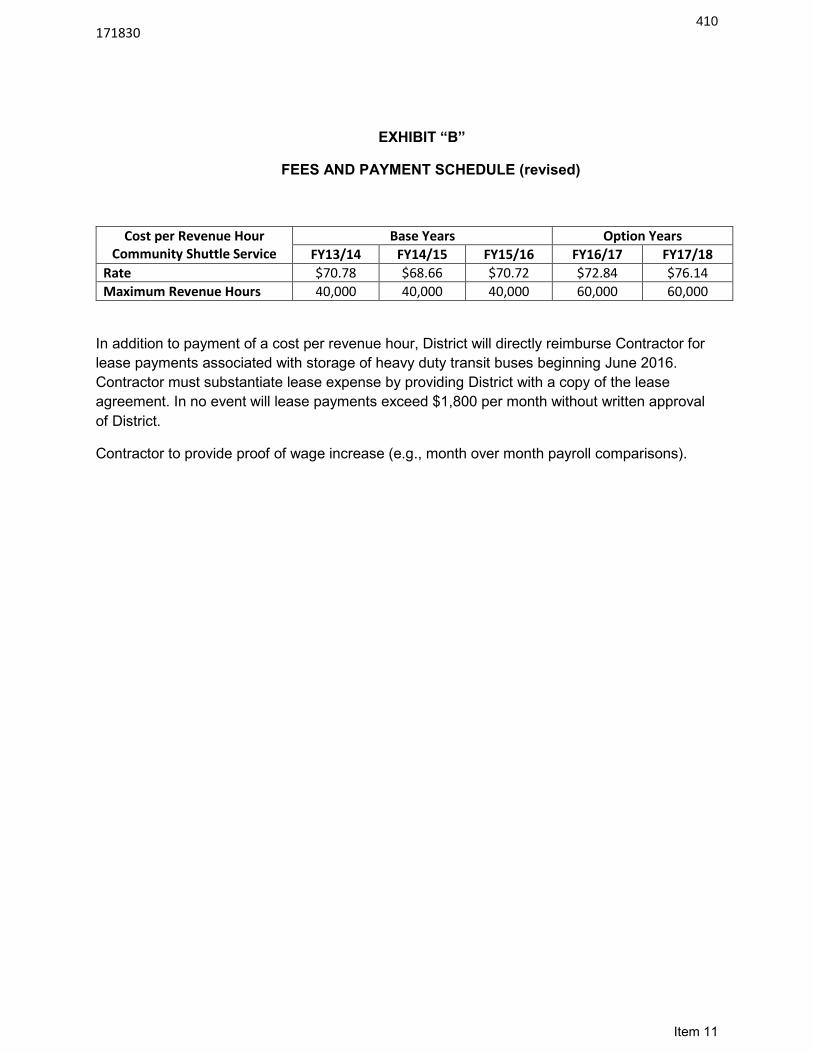
2
Total passenger revenue decreased slightly (-11) in FY 201617 compared to last year Increases in operating costs resulted in a decrease in overall farebox recovery from 199 last year to 176 in FY 201617 Only the Local Trunkline and Recreational (Muir Woods Shuttle) typologies experienced an overall increase in both passenger revenue and farebox recovery Yellow Bus In FY 201617 yellow bus service for the Ross Valley School District carried over 136000 unlinked passenger trips a decrease of 13 compared to last year and operated 1245 revenue hours These totals represent 4 of the Districtrsquos total ridership and 1 of revenue hours Passenger revenues increased 150 due to higher pass prices This boost in revenues did not keep pace with the rise in operating costs and overall farebox recovery decreased from 571 last year to 548 in FY 201617 Demand Response Demand Response programs carried 124325 unlinked passenger trips in FY 201617 and provided 55191 revenue hours of service These totals represent 4 of the Districtrsquos total trips and 24 of revenue hours Compared to FY 201516 unlinked passenger trips on demand response services decreased by 39 (-5096 trips) and revenue hours decreased by 61 The more significant reduction in revenue hours compared to passengers is likely due to the new method for calculating those hours Overall productivity was 23 passengers per hour slightly higher than last fiscal year Ridership on local paratransit and the Novato Dial-A-Ride decreased in FY 201617 compared to the prior year Rural Dial-A-Ride experienced growth in ridership mainly because these services were only recently introduced These include the Dillon BeachTomales and Point Reyes Station Dial-A-Ride Passenger revenues for demand response services dropped slightly (-15) compared to last year However lower operating costs due to the new contract rate resulted in reductions in subsidies and an increase in farebox recovery Other Services Other Marin Access Mobility Management services include the Volunteer Driver and Catch-A-Ride programs In FY 201617 these programs provided 30547 unlinked passenger trips about 1 of the Districtrsquos total trips Compared to the prior fiscal year ridership decreased by 77 mostly due to the Catch-A-Ride program However passenger revenues increased by 90 primarily on the Catch-A-Ride program This increase may have been due to riders taking longer trips Performance Goals
The 2016-2025 Short-Range Transit Plan identifies fifteen different goals and associated metrics that staff use to evaluate system performance Performance goals at the route level are measured in both productivity (unlinked passengers per hour and per trip) and cost effectiveness (subsidy per unlinked passenger trip) These measures follow the service typologies updated in the most recent Short Range Transit Plan Table 1 below summarizes route level performance goals by typology Marin Transit has not identified productivity or cost-effectiveness goals for the Yellow Bus or Partnership service typologies Table 2 provides a detailed summary of annual FY 201617 performance data by program route and service typology
3
Table 1 Productivity and Subsidy Goals by Service Typology
Service Typology Routes Unlinked Passenger
Trips per Hour (at or above)
Subsidy per Passenger Trip
(at or below)
Local Trunkline 35 36 71X 25 $300
Regular Local 17 22 23 23X 29 49 20 $500
Local Connector 219 228 233 245 251 257 8 $800
Supplemental 113 115 117 119 125 139 145 151 154 20 per trip $300
Rural 61 68 4 $1200
Recreational 66 (Muir Woods Shuttle) 25 $300
Demand Response Local DAR Novato DAR Dillon BeachTomales DAR Point Reyes DAR
2 $3000
Using the productivity goals identified in Table 1 all the service typology groups except for Local Basic met their unlinked passengers per hour goal overall Twelve individual routes and two demand response services did not meet their productivity targets These include Routes 17 22 23 23X 29 49 71X 115 125 139 219 228 the Dillon BeachTomales Dial-A-Ride and the Point Reyes Dial-A-Ride In the previous fiscal year ten routes did not meet this target Figure 1 provides FY 201617 productivity levels and respective productivity goals by service typology and at the route level Route 35 was the most productive fixed-route service carrying an average of 286 passengers per hour Route 151 (Hamilton ndash San Jose MS ndash Novato HS - San Marin HS) was the best performing supplemental school route with 428 passengers per trip and met its subsidy target at $150 per passenger Route 228 had the highest growth in productivity (+291) due to the addition of weekday service in June 2016 In terms of cost effectiveness the Supplemental School Rural and Recreational services collectively met their goals In total 17 individual routes and two demand response services did not meet their subsidy target (Routes 17 22 23 23X 29 35 36 49 71X 219 228 233 251 257 115 125 139 Local Paratransit and Novato Dial-A-Ride) This is an increase from the 13 routes and three demand response services reported for FY 201516 Figure 2 provides a breakdown of FY 201617 subsidy levels and respective subsidy goals by service typology and at the individual route level Ridership Trends
In FY 201617 there was an overall 35 decline in fixed-route ridership compared to the previous year despite increases to service levels One of the major contributors to this decline was the delayed start of the 2017 Muir Woods Shuttle season that reduced the amount of service provided by 76 The overall decrease in ridership is relatively consistent with trends among bus operators nationwide and in the Bay Area According to the National Transit Database bus ridership declined 66 nationwide during FY 201617 compared to the prior year Within in the Bay Area peer agencies experienced ridership declines between 6 and 12 These include Golden Gate Transit Sonoma County Transit SamTrans and Napa VINE One of the biggest external factors that may have contributed to this trend is weather Rainfall in FY 201617 almost doubled over the prior year Weather can have a significant impact on travel decisions affecting whether a person makes a trip as well as how that person ultimately makes the trip It can also impact operations and cause detours major delays and canceled trips
4
In FY 201617 there was a 34 increase in the number of canceled trips Almost half of these canceled trips occurred in February due to heavy rains that caused flooding and school closures In June 2016 Marin Transit implemented a major service change One of the main goals of the service restructuring was to reduce the need to transfer by providing faster and more direct connections While this approach improves the system for riders it has implications in terms of how ridership is counted and on performance metrics The number of passengers is measured in terms of unlinked passenger trips Each time a person boards a bus is counted as a separate trip regardless of whether that person is transferring from another bus Reducing the amount of transfers needed to complete a riderrsquos journey reduces the number of unlinked trips Replacing trips that require a transfer with direct trips to destinations does not change the number of individual riders using the system which is defined as linked passenger trips In FY 201617 there was a 75 overall decrease in the number of transfers for passengers using cash to pay their original fare Some of this decline reflects the systemwide decrease in ridership The transfer ratio is defined as the number of boarding trips (unlinked passenger trips) divided by the number of originating trips (linked passenger trips) This ratio can be used to evaluate the impact of transfers on ridership independent of other factors In FY 201617 the overall transfer ratio dropped 38 from 136 to 131 When estimating linked passenger trips based on these ratios the number of individual Marin Transit passengers in FY 201617 remained relatively constant compared to last year Demand for Marin Access mobility management programs declined overall 47 from FY 201516 to FY 201617 Changes in ridership varied from program to program The largest decline was on Catch-A-Ride which experienced a 129 decrease in ridership Local paratransit and Novato Dial-A-Ride ridership may have been affected by many of the same external factors as fixed route transit particularly weather It is also possible that paratransit clients have started to shift some or all their trips to services that are not provided by Marin Transit These may include Non-Emergency Medical Transportation services arranged by managed care organizations Private transportation
providers hired under contract to institutions typically served by paratransit (such as adult day care centers) Trips taken on Uber or Lyft and Volunteer transportation services that may be supported by Marin Transit in some way but whose ridership is not
reported in the Districtrsquos performance statistics Furthermore staff attributed much of the previous growth in the Marin Access program to the Catch-A-Ride program This program experienced a 473 increase in ridership between FY 201314 and FY 201415 Towards the end of FY 201415 On the Move one of the largest taxi companies in Marin went out of business To this day service is limited during hours of peak demand and in certain service areas especially Novato Therefore FY 201617 ridership on Catch-A-Ride may reflect two factors These include a slowdown in attracting new customers and a reduction in service availability following On the Moversquos closure Table 2 summarizes the factors that can influence ridership numbers year-over-year and qualitatively evaluates their impact
5
Table 2 Factors Impacting Ridership Comparison
Factor FY 201516 FY 201617 Impact
Calendar
School Days 181 183 --
Weekdays 256 253
Weekends amp Holidays 110 111 --
Muir Woods Shuttle 113 104
Transfer Ratio (ratio of unlinked to linked trips) 136 131
Service Disruptions Canceled service (trips) 200 268
Major detourclosure (days) (1) 18 29
Rainfall (inches) 2928 5653
Gas Prices $298 $291 --
Unemployment Rate 32 32 -- Notes (1) Data on major detours and closure collected starting January 2016 Comparison includes the months of January through June FY 201718 Performance Outlook
In June 2016 Marin Transit implemented a major service change aimed in part to help underperforming routes meet established performance standards Staff has continued to monitor service performance and has made minor adjustments to improve on-time performance and cancel low-ridership trips In early 2018 staff is planning a comprehensive assessment of service performance since the June 2016 service changes This effort will include data from a recently completed onboard survey from April 2017 on passenger origins and destinations and a 100 passenger ridecheck The ridecheck will provide data on stop-level ridership activity for each route The assessment will use this analysis to recommend service changes to improve underperforming routes There are several unknowns that may also affect route performance primarily in terms of operating costs The District relies on its contractors to either lease or own property to store and maintain the vehicles needed to operate service For contractors that do not own suitable property finding and leasing these types of facilities in Marin County is challenging and expensive Recent surveys of current and potential service providers identified securing a facility as the most significant factor in determining their interest in bidding on Marin Transit services ability to provide the service and proposed pricing Marin Transit has been actively working to secure and develop its own operations and maintenance facility A District-owned facility will eliminate the need for potential service providers to lease property and lower operating costs It may also improve efficiency by reducing deadhead or non-revenue time when vehicles are traveling to and from the yard and further lower the Districtrsquos contract rates In late 2017 Marin Transit will release for bid over half of its fixed-route service and there are many uncertainties that may affect the outcome The tight labor market in Marin County and the greater Bay Area has made it difficult for service providers to hire and retain employees Potential contractors are required to secure property in a County with limited real estate opportunities If the District provides its own facility there will be more interest among potential bidders and more competitive rates
6
Table 3 System-wide Performance Statistics FY 201617 (unaudited)
Route Passengers Revenue
Hours Operating
Costs Passenger
Revenue Pass Trips Per
Rev Hr (Trip) Subsidy Per
Passenger Farebox
Recovery Fixed Route 2925522 178052 $20173419 $3550259 164 $568 176 Local Trunkline 1122188 44393 $6252940 $1263870 253 $445 202
35 658869 23052 $3234308 $729775 286 $380 226 36 342178 13636 $1901678 $369132 251 $448 194
71X 121141 7705 $1116954 $164963 157 $786 148 Local Basic 989500 65117 $7451946 $1221298 152 $630 164
17 247998 14757 $2076786 $319761 168 $708 154 22 215758 17553 $1619319 $273059 123 $624 169 23 199150 11065 $1508659 $246908 180 $634 164
23X 49255 3445 $473413 $57438 143 $845 121 29 40103 3707 $509475 $49634 108 $1147 97 49 237236 14590 $1264294 $274498 163 $417 217
Local Connector 378985 42396 $3873801 $461426 89 $900 119 219 50449 6392 $591224 $64101 79 $1045 108 228 71340 10042 $904806 $103912 71 $1123 115 233 42798 4363 $399203 $52001 98 $811 130 245 49766 4349 $391596 $56968 114 $672 145 251 95506 9607 $889019 $101823 99 $824 115 257 69126 7643 $697953 $82621 90 $890 118
Supplemental 179947 3963 $514380 $110503 454 (286) $224 215 113 16829 317 $42180 $12227 530 (315) $178 290 115 14021 637 $87534 $9504 220 (185) $557 109 117 34820 640 $81509 $17140 544 (284) $185 210 119 27161 374 $56273 $18859 727 (313) $138 335 125 13757 600 $72469 $11570 229 (193) $443 160 139 6414 253 $33182 $6635 253 (179) $414 200 145 16406 191 $25426 $7258 861 (372) $111 285 151 36801 594 $73842 $18463 620 (428) $150 250 154 13738 358 $41965 $8847 384 (255) $241 211
Recreational 122116 4316 $473726 $249748 283 $183 527 66 122116 4316 $473726 $249748 283 $183 527
Rural 112926 16172 $1422683 $122407 70 $1151 86 61 36328 5492 $475778 $39959 66 $1200 84 68 76598 10680 $946905 $82448 72 $1129 87
Partnership 19860 1696 $183943 $121007 117 $317 658 122 19860 1696 $183943 $121007 117 $317 658
Yellow Bus 136500 1245 $863348 $473066 1096 (448) $286 548 Hidden Valley 9281 180 $124763 $32170 516 (265) $998 258
White Hill 127219 1065 $738585 $440896 1194 (471) $234 597 Demand Response 124325 55191 $4571296 $236980 23 $3486 52
Local Paratransit 119673 53011 $4404928 $226387 23 $3492 51 Novato DAR 4057 1856 $150815 $8815 22 $3487 58
Dillon Beach DAR 488 260 $12511 $1356 19 $2285 108 Pt Reyes DAR 107 64 $3042 $422 17 $2447 139
Other Services 30547 - $511316 $41956 - $1537 82 Volunteer Driver(1) 16162 - $152714 - - $945 -
Catch-A-Ride(1) 14385 - $358602 $41956 - $2201 117 Total 3216894 234489 $26118572 $4302085 136 $678 165
Notes Values in red indicate performance that does not meet District
7
Figure 1 FY 201617 Passengers per Revenue Hour by Route
0
5
10
15
20
25
30
35
40
45
50Lo
cal T
runk
line T
otals 35 36 71
X
Loca
l Bas
ic To
tals 17 22 23 23X 29 49
Loca
l Con
necto
r Tot
als 219
228
233
245
251
257
Supp
lemen
tal T
otals 11
311
511
711
912
513
914
515
115
4
Recre
ation
al To
tals 66
Rura
l Tot
als 61 68
Dem
and R
espo
nse T
otals
Loca
l Par
atra
nsit
Nova
to D
ARDi
llon D
ARPt
Reye
s DAR
Pass
enge
rs p
er R
even
ue H
our
meets goalservice standard
does not meet goal
school routes show passengers per trip
8
Figure 2 FY 201617 Subsidy per Passenger by Route
$0
$5
$10
$15
$20
$25
$30
$35
$40
Loca
l Tru
nklin
e Tot
als 35 36 71X
Loca
l Bas
ic To
tals 17 22 23 23X 29 49
Loca
l Con
necto
r Tot
als 219
228
233
245
251
257
Supp
lemen
tal T
otals 11
311
511
711
912
513
914
515
115
4
Recre
ation
al To
tals 66
Rura
l Tot
als 61 68
Dem
and R
espo
nse T
otals
Loca
l Par
atra
nsit
Nova
to D
ARDi
llon D
ARPt
Reye
s DAR
Subs
idy p
er P
asse
nger
does not meet goal
service standard
meets goal
9
Attachment A Route Profiles 17 Sausalito ndash Marin City ndash Mill Valley ndash San Rafael 22 San Rafael Transit Center ndash San Anselmo ndash Marin City 23 Fairfax ndash San Anselmo ndash San Rafael ndash Canal 23X Manor ndash Fairfax ndash San Anselmo ndash San Rafael ndash Canal 29 Canal ndash San Rafael Transit Center ndash Larkspur ndash College of Marin ndash Marin General 35 Canal ndash San Rafael Transit Center ndash Marin Civic Center ndash Northgate Mall ndash Novato 36 Canal ndash San Rafael Transit Center ndash Marin City 49 Novato ndash Ignacio ndash Hamilton ndash Marin Civic Center ndash San Rafael Transit Center 61 West Marin Stagecoach (Sausalito ndash Marin City ndash Mill Valley ndash Stinson Beach ndash Bolinas) 66 Muir Woods Shuttle 68 West Marin Stagecoach (San Rafael Transit Center ndash San Anselmo ndash Pt Reyes Station ndash Inverness) 71X Novato ndash San Rafael Transit Center ndash Marin City ndash Sausalito 113 Redwood High School ndash Paradise Cay 115 Sausalito ndash Willow Creek ndash Marin City ndash Mill Valley ndash St Hilary 117 Neil Cummins Hall Middle School ndash E Corte Madera ndash Cove School 119 Tiburon ndash Belvedere ndash Redwood High School 122 San Rafael Transit Center ndash San Anselmo ndash College of Marin 125 Lagunitas ndash Sir Francis Drake HS ndash San Anselmo ndash San Rafael 139 Terra Linda High School ndash Lucas Valley 145 Terra Linda High School ndash San Rafael 151 Hamilton ndash Ignacio ndash San Jose Middle School ndash Novato High School ndash San Marin High School 154 Olive ndash San Marin High School ndash Sinaloa Middle School ndash Novato 219 Tiburon ndash Strawberry 228 San Rafael Transit Center ndash Larkspur ndash San Anselmo ndash Fairfax 233 Santa Venetia ndash Marin Civic Center ndash San Rafael Transit Center 245 San Rafael Transit Center ndash Northgate Mall ndash Kaiser ndash Smith Ranch Road 251 San Marin ndash Novato ndash Vintage Oaks ndash IVC ndash Ignacio ndash Hamilton 257 San Rafael ndash Northgate Mall ndash Kaiser ndash Marinwood ndash Hamilton ndash Ignacio ndash IVC Hdn Valley Ross Valley Yellow Bus (Fairfax ndash San Anselmo ndash Hidden Valley ES) White Hill Ross Valley Yellow Bus (San Anselmo ndash Sleepy Hollow ndash Fairfax ndash White Hill MS)
17Local Basic
Days of Service Wkdy Sa SuAvg Freq (Wkdy Peak) 30 min
Avg Freq (Wkdy Non-Peak) 60 minAvg Freq (Wked) 60 min
FY 2017 Farebox Recovery 15 transfer (to route) 25
Clipper usage 16
Annual Avg Monthly Avg Daily Annual Avg Monthly Avg Daily Annual Avg Monthly Avg DailyWeekday 194263 16189 768 11496 958 45 177386 14782 701 Saturday 27564 2297 530 1541 128 30 24621 2052 473 Sunday 26171 2181 436 1720 143 29 27378 2282 456
Total 247998 20667 679 14757 1230 40 229385 19115 628
Annual Avg Monthly Avg Daily Annual Avg Monthly Avg Daily Annual Avg Monthly Avg DailyWeekday $1617108 $134759 $6392 $247041 $20587 $976 $1370067 $114172 $5415Saturday $217536 $18128 $4183 $36894 $3075 $710 $180642 $15054 $3474Sunday $242142 $20179 $4036 $35826 $2986 $597 $206316 $17193 $3439
Total $2076786 $173066 $5690 $319761 $26647 $876 $1757025 $146419 $4814
Passengers per Revenue Hour
Subsidy per Passenger
Cost per Revenue Hour
Farebox Recovery
Weekday 169 $705 $14067 153Saturday 179 $655 $14117 170Sunday 152 $788 $14078 148
Total 168 $708 $14073 154
Passengers Revenue Hours Operating CostsPassenger
RevenueOperating Subsidy
Passengers per Revenue Hour
Subsidy per Passenger
Cost per Revenue Hour
Farebox Recovery
FY 2015 301136 15167 $2108822 $340410 $1768412 199 $587 $13904 161FY 2016 280486 15330 $2041616 $302337 $1739279 183 $620 $13317 148FY 2017 247998 14757 $2076786 $319761 $1757025 168 $708 $14073 154
Histo
ric Tr
ends
FY 20
161
7 DAT
A
Passengers Revenue Hours Revenue Miles
Operating Costs Passenger Revenue Operating Subsidy
277892 322826
301136 280486
247998
0
50000
100000
150000
200000
250000
300000
350000
FY 2013 FY 2014 FY 2015 FY 2016 FY 2017
Passengers
12402 14818 15167 15330 14757
0
5000
10000
15000
20000
FY 2013 FY 2014 FY 2015 FY 2016 FY 2017
Revenue Hours
$1717002
$2179526 $2108822 $2041616 $2076786
$0
$500000
$1000000
$1500000
$2000000
$2500000
FY 2013 FY 2014 FY 2015 FY 2016 FY 2017
Operating Costs
224 218 199 183 168
00
50
100
150
200
250
300
FY 2013 FY 2014 FY 2015 FY 2016 FY 2017
Passengers per Revenue Hour
$504 $558 $587 $620 $708
$000$200$400$600$800
$1000$1200$1400
FY 2013 FY 2014 FY 2015 FY 2016 FY 2017
Subsidy per Passenger
$13845 $14709 $13904 $13317 $14073
$0
$50
$100
$150
$200
FY 2013 FY 2014 FY 2015 FY 2016 FY 2017
Cost per Revenue Hour
22Local Basic
Days of Service Wkdy Sa SuAvg Freq (Wkdy Peak) 30 min
Avg Freq (Wkdy Non-Peak) 60 minAvg Freq (Wked) 60 min
FY 2017 Farebox Recovery 17 transfer (to route) 10
Clipper usage 11
Annual Avg Monthly Avg Daily Annual Avg Monthly Avg Daily Annual Avg Monthly Avg DailyWeekday 184918 15410 731 14244 1187 56 126319 10527 499 Saturday 16752 1396 322 1537 128 30 16232 1353 312 Sunday 14088 1174 235 1773 148 30 18729 1561 312
Total 215758 17980 591 17553 1463 48 161280 13440 442
Annual Avg Monthly Avg Daily Annual Avg Monthly Avg Daily Annual Avg Monthly Avg DailyWeekday $1312992 $109416 $5190 $232926 $19411 $921 $1080066 $90006 $4269Saturday $142334 $11861 $2737 $21235 $1770 $408 $121099 $10092 $2329Sunday $163993 $13666 $2733 $18898 $1575 $315 $145095 $12091 $2418
Total $1619319 $134943 $4436 $273059 $22755 $748 $1346260 $112188 $3688
Passengers per Revenue Hour
Subsidy per Passenger
Cost per Revenue Hour
Farebox Recovery
Weekday 130 $584 $9218 177Saturday 109 $723 $9263 149Sunday 79 $1030 $9251 115
Total 123 $624 $9225 169
Passengers Revenue Hours Operating CostsPassenger
RevenueOperating Subsidy
Passengers per Revenue Hour
Subsidy per Passenger
Cost per Revenue Hour
Farebox Recovery
FY 2015 249148 14777 $2054433 $292215 $1762218 169 $707 $13903 142FY 2016 243635 14872 $1971172 $259453 $1711719 164 $703 $13255 132FY 2017 215758 17553 $1619319 $273059 $1346260 123 $624 $9225 169
Histo
ric Tr
ends
FY 20
161
7 DAT
A
Passengers Revenue Hours Revenue Miles
Operating Costs Passenger Revenue Operating Subsidy
366301
281761 249148 243635
215758
050000
100000150000200000250000300000350000400000
FY 2013 FY 2014 FY 2015 FY 2016 FY 2017
Passengers18061
15083 14777 14872 17553
0
5000
10000
15000
20000
FY 2013 FY 2014 FY 2015 FY 2016 FY 2017
Revenue Hours$2498169
$2220145 $2054433 $1971172
$1619319
$0
$500000
$1000000
$1500000
$2000000
$2500000
$3000000
FY 2013 FY 2014 FY 2015 FY 2016 FY 2017
Operating Costs
203 187 169 164
123
00
50
100
150
200
250
300
FY 2013 FY 2014 FY 2015 FY 2016 FY 2017
Passengers per Revenue Hour
$567 $667 $707 $703 $624
$000$200$400$600$800
$1000$1200$1400
FY 2013 FY 2014 FY 2015 FY 2016 FY 2017
Subsidy per Passenger
$13832 $14720 $13903 $13255
$9225
$0
$50
$100
$150
$200
FY 2013 FY 2014 FY 2015 FY 2016 FY 2017
Cost per Revenue Hour
23Local Basic
Days of Service Wkdy Sa SuAvg Freq (Wkdy Peak) 60 min
Avg Freq (Wkdy Non-Peak) 60 minAvg Freq (Wked) 60 min
FY 2017 Farebox Recovery 16 transfer (to route) 24
Clipper usage 12
Annual Avg Monthly Avg Daily Annual Avg Monthly Avg Daily Annual Avg Monthly Avg DailyWeekday 145707 12142 576 8042 670 32 64277 5356 254 Saturday 28305 2359 544 1434 120 28 11466 956 221 Sunday 25138 2095 419 1589 132 26 12750 1062 212
Total 199150 16596 546 11065 922 30 88492 7374 242
Annual Avg Monthly Avg Daily Annual Avg Monthly Avg Daily Annual Avg Monthly Avg DailyWeekday $1096892 $91408 $4336 $179427 $14952 $709 $917465 $76455 $3626Saturday $195468 $16289 $3759 $35226 $2936 $677 $160242 $13354 $3082Sunday $216299 $18025 $3605 $32255 $2688 $538 $184044 $15337 $3067
Total $1508659 $125722 $4133 $246908 $20576 $676 $1261751 $105146 $3457
Passengers per Revenue Hour
Subsidy per Passenger
Cost per Revenue Hour
Farebox Recovery
Weekday 181 $630 $13640 164Saturday 197 $566 $13629 180Sunday 158 $732 $13612 149
Total 180 $634 $13635 164
Passengers Revenue Hours Operating CostsPassenger
RevenueOperating Subsidy
Passengers per Revenue Hour
Subsidy per Passenger
Cost per Revenue Hour
Farebox Recovery
FY 2015 354706 14168 $1969650 $381111 $1588539 250 $448 $13902 193FY 2016 268218 13154 $1703216 $308138 $1395078 204 $520 $12948 181FY 2017 199150 11065 $1508659 $246908 $1261751 180 $634 $13635 164
Histo
ric Tr
ends
FY 20
161
7 DAT
A
Passengers Revenue Hours Revenue Miles
Operating Costs Passenger Revenue Operating Subsidy
212064
339118 354706
268218
199150
050000
100000150000200000250000300000350000400000
FY 2013 FY 2014 FY 2015 FY 2016 FY 2017
Passengers
8716
14034 14168 13154
11065
02000400060008000
10000120001400016000
FY 2013 FY 2014 FY 2015 FY 2016 FY 2017
Revenue Hours
$1202564
$2061985 $1969650 $1703216
$1508659
$0
$500000
$1000000
$1500000
$2000000
$2500000
FY 2013 FY 2014 FY 2015 FY 2016 FY 2017
Operating Costs
243 242 250
204 180
00
50
100
150
200
250
300
FY 2013 FY 2014 FY 2015 FY 2016 FY 2017
Passengers per Revenue Hour
$455 $494 $448 $520 $634
$000$200$400$600$800
$1000$1200$1400
FY 2013 FY 2014 FY 2015 FY 2016 FY 2017
Subsidy per Passenger
$13797 $14692 $13902 $12948 $13635
$0
$50
$100
$150
$200
FY 2013 FY 2014 FY 2015 FY 2016 FY 2017
Cost per Revenue Hour
23XLocal Basic
Days of Service WkdyAvg Freq (Wkdy Peak) 60 min
Avg Freq (Wkdy Non-Peak) -Avg Freq (Wked) -
FY 2017 Farebox Recovery 12 transfer (to route) 31
Clipper usage 12
Annual Avg Monthly Avg Daily Annual Avg Monthly Avg Daily Annual Avg Monthly Avg DailyWeekday 49255 4105 195 3445 287 14 32408 2701 128 Saturday - - - - - - - - - Sunday - - - - - - - - -
Total 49255 4105 195 3445 287 14 32408 2701 128
Annual Avg Monthly Avg Daily Annual Avg Monthly Avg Daily Annual Avg Monthly Avg DailyWeekday $473413 $39451 $1871 $57438 $4787 $227 $415975 $34665 $1644Saturday $ - $ - $ - $ - $ - $ - $ - $ - $ -Sunday $ - $ - $ - $ - $ - $ - $ - $ - $ -
Total $473413 $39451 $1871 $57438 $4787 $227 $415975 $34665 $1644
Passengers per Revenue Hour
Subsidy per Passenger
Cost per Revenue Hour
Farebox Recovery
Weekday 143 $845 $13744 121Saturday - $ - $ - - Sunday - $ - $ - -
Total 143 $845 $13744 121
Passengers Revenue Hours Operating CostsPassenger
RevenueOperating Subsidy
Passengers per Revenue Hour
Subsidy per Passenger
Cost per Revenue Hour
Farebox Recovery
FY 2015FY 2016 2548 189 $23303 $2272 $21031 135 $825 $12330 97FY 2017 49255 3445 $473413 $57438 $415975 143 $845 $13744 121
Histo
ric Tr
ends
FY 20
161
7 DAT
A
Passengers Revenue Hours Revenue Miles
Operating Costs Passenger Revenue Operating Subsidy
2548
49255
0
10000
20000
30000
40000
50000
60000
FY 2013 FY 2014 FY 2015 FY 2016 FY 2017
Passengers
189
3445
0500
1000150020002500300035004000
FY 2013 FY 2014 FY 2015 FY 2016 FY 2017
Revenue Hours
$23303
$473413
$0
$100000
$200000
$300000
$400000
$500000
FY 2013 FY 2014 FY 2015 FY 2016 FY 2017
Operating Costs
135 143
00
50
100
150
200
250
300
FY 2013 FY 2014 FY 2015 FY 2016 FY 2017
Passengers per Revenue Hour
$825 $845
$000$200$400$600$800
$1000$1200$1400
FY 2013 FY 2014 FY 2015 FY 2016 FY 2017
Subsidy per Passenger
$12330 $13744
$0
$50
$100
$150
$200
FY 2013 FY 2014 FY 2015 FY 2016 FY 2017
Cost per Revenue Hour
29Local Basic
Days of Service WkdyAvg Freq (Wkdy Peak) 60 min
Avg Freq (Wkdy Non-Peak) -Avg Freq (Wked) -
FY 2017 Farebox Recovery 10 transfer (to route) 26
Clipper usage 12
Annual Avg Monthly Avg Daily Annual Avg Monthly Avg Daily Annual Avg Monthly Avg DailyWeekday 40103 3342 159 3707 309 15 37048 3087 146 Saturday - - - - - - - - - Sunday - - - - - - - - -
Total 40103 3342 159 3707 309 15 37048 3087 146
Annual Avg Monthly Avg Daily Annual Avg Monthly Avg Daily Annual Avg Monthly Avg DailyWeekday $509475 $42456 $2014 $49634 $4136 $196 $459841 $38320 $1818Saturday $ - $ - $ - $ - $ - $ - $ - $ - $ -Sunday $ - $ - $ - $ - $ - $ - $ - $ - $ -
Total $509475 $42456 $2014 $49634 $4136 $196 $459841 $38320 $1818
Passengers per Revenue Hour
Subsidy per Passenger
Cost per Revenue Hour
Farebox Recovery
Weekday 108 $1147 $13745 97Saturday - $ - $ - - Sunday - $ - $ - -
Total 108 $1147 $13745 97
Passengers Revenue Hours Operating CostsPassenger
RevenueOperating Subsidy
Passengers per Revenue Hour
Subsidy per Passenger
Cost per Revenue Hour
Farebox Recovery
FY 2015 203632 10795 $1500887 $232286 $1268601 189 $623 $13904 155FY 2016 181786 10502 $1378760 $219997 $1158763 173 $637 $13129 160FY 2017 40103 3707 $509475 $49634 $459841 108 $1147 $13745 97
Histo
ric Tr
ends
FY 20
161
7 DAT
A
Passengers Revenue Hours Revenue Miles
Operating Costs Passenger Revenue Operating Subsidy
238310 225998 203632
181786
40103
0
50000
100000
150000
200000
250000
300000
FY 2013 FY 2014 FY 2015 FY 2016 FY 2017
Passengers12248
10927 10795 10502
3707
0
2000
4000
6000
8000
10000
12000
14000
FY 2013 FY 2014 FY 2015 FY 2016 FY 2017
Revenue Hours$1692980 $1607795 $1500887
$1378760
$509475
$0
$500000
$1000000
$1500000
$2000000
FY 2013 FY 2014 FY 2015 FY 2016 FY 2017
Operating Costs
195 207 189 173
108
00
50
100
150
200
250
300
FY 2013 FY 2014 FY 2015 FY 2016 FY 2017
Passengers per Revenue Hour
$595 $593 $623 $637
$1147
$000$200$400$600$800
$1000$1200$1400
FY 2013 FY 2014 FY 2015 FY 2016 FY 2017
Subsidy per Passenger
$13822 $14714 $13904 $13129 $13745
$0
$50
$100
$150
$200
FY 2013 FY 2014 FY 2015 FY 2016 FY 2017
Cost per Revenue Hour
35Local Trunkline
Days of Service Wkdy Sa SuAvg Freq (Wkdy Peak) 30 min
Avg Freq (Wkdy Non-Peak) 30 minAvg Freq (Wked) 30 min
FY 2017 Farebox Recovery 23 transfer (to route) 17
Clipper usage 8
Annual Avg Monthly Avg Daily Annual Avg Monthly Avg Daily Annual Avg Monthly Avg DailyWeekday 492328 41027 1946 16909 1409 67 224421 18702 887 Saturday 84453 7038 1624 2860 238 55 43336 3611 833 Sunday 82088 6841 1368 3284 274 55 50021 4168 834
Total 658869 54906 1805 23052 1921 63 317778 26482 871
Annual Avg Monthly Avg Daily Annual Avg Monthly Avg Daily Annual Avg Monthly Avg DailyWeekday $2367217 $197268 $9357 $533190 $44433 $2107 $1834027 $152836 $7249Saturday $403729 $33644 $7764 $97853 $8154 $1882 $305876 $25490 $5882Sunday $463362 $38614 $7723 $98732 $8228 $1646 $364630 $30386 $6077
Total $3234308 $269526 $8861 $729775 $60815 $1999 $2504533 $208711 $6862
Passengers per Revenue Hour
Subsidy per Passenger
Cost per Revenue Hour
Farebox Recovery
Weekday 291 $373 $14000 225Saturday 295 $362 $14118 242Sunday 250 $444 $14111 213
Total 286 $380 $14030 226
Passengers Revenue Hours Operating CostsPassenger
RevenueOperating Subsidy
Passengers per Revenue Hour
Subsidy per Passenger
Cost per Revenue Hour
Farebox Recovery
FY 2015 476489 8544 $1187694 $462204 $725490 558 $152 $13901 389FY 2016 472718 9300 $1202986 $544109 $658877 508 $139 $12935 452FY 2017 658869 23052 $3234308 $729775 $2504533 286 $380 $14030 226
Histo
ric Tr
ends
FY 20
161
7 DAT
A
Passengers Revenue Hours Revenue Miles
Operating Costs Passenger Revenue Operating Subsidy
669860 574669
476489 472718
658869
0100000200000300000400000500000600000700000800000
FY 2013 FY 2014 FY 2015 FY 2016 FY 2017
Passengers
9755 8644 8544 9300
23052
0
5000
10000
15000
20000
25000
FY 2013 FY 2014 FY 2015 FY 2016 FY 2017
Revenue Hours
$1345711 $1271601 $1187694 $1202986
$3234308
$0
$500000
$1000000
$1500000
$2000000
$2500000
$3000000
$3500000
FY 2013 FY 2014 FY 2015 FY 2016 FY 2017
Operating Costs
687 665 558
508
286
00100200300400500600700800
FY 2013 FY 2014 FY 2015 FY 2016 FY 2017
Passengers per Revenue Hour
$097 $120 $152 $139
$380
$000
$200
$400
$600
$800
$1000
FY 2013 FY 2014 FY 2015 FY 2016 FY 2017
Subsidy per Passenger
$13796 $14710 $13901 $12935 $14030
$0
$50
$100
$150
$200
FY 2013 FY 2014 FY 2015 FY 2016 FY 2017
Cost per Revenue Hour
36Local Trunkline
Days of Service Wkdy Sa SuAvg Freq (Wkdy Peak) 30 min
Avg Freq (Wkdy Non-Peak) 30 minAvg Freq (Wked) 30 min
FY 2017 Farebox Recovery 19 transfer (to route) 18
Clipper usage 6
Annual Avg Monthly Avg Daily Annual Avg Monthly Avg Daily Annual Avg Monthly Avg DailyWeekday 278217 23185 1100 9938 828 39 133318 11110 527 Saturday 33779 2815 650 1715 143 33 24259 2022 467 Sunday 30182 2515 503 1983 165 33 28002 2334 467
Total 342178 28515 937 13636 1136 37 185579 15465 508
Annual Avg Monthly Avg Daily Annual Avg Monthly Avg Daily Annual Avg Monthly Avg DailyWeekday $1384291 $115358 $5472 $290481 $24207 $1148 $1093810 $91151 $4323Saturday $240062 $20005 $4617 $40774 $3398 $784 $199288 $16607 $3832Sunday $277325 $23110 $4622 $37877 $3156 $631 $239448 $19954 $3991
Total $1901678 $158473 $5210 $369132 $30761 $1011 $1532546 $127712 $4199
Passengers per Revenue Hour
Subsidy per Passenger
Cost per Revenue Hour
Farebox Recovery
Weekday 280 $393 $13930 210Saturday 197 $590 $13999 170Sunday 152 $793 $13984 137
Total 251 $448 $13946 194
Passengers Revenue Hours Operating CostsPassenger
RevenueOperating Subsidy
Passengers per Revenue Hour
Subsidy per Passenger
Cost per Revenue Hour
Farebox Recovery
FY 2015 109347 2894 $402355 $110471 $291884 378 $267 $13905 275FY 2016 119593 3462 $457211 $129715 $327496 345 $274 $13205 284FY 2017 342178 13636 $1901678 $369132 $1532546 251 $448 $13946 194
Histo
ric Tr
ends
FY 20
161
7 DAT
A
Passengers Revenue Hours Revenue Miles
Operating Costs Passenger Revenue Operating Subsidy
106988 103673 109347 119593
342178
050000
100000150000200000250000300000350000400000
FY 2013 FY 2014 FY 2015 FY 2016 FY 2017
Passengers
2878 2822 2894 3462
13636
02000400060008000
10000120001400016000
FY 2013 FY 2014 FY 2015 FY 2016 FY 2017
Revenue Hours
$398410 $415238 $402355 $457211
$1901678
$0
$500000
$1000000
$1500000
$2000000
FY 2013 FY 2014 FY 2015 FY 2016 FY 2017
Operating Costs
372 367 378 345 251
00100200300400500600700800
FY 2013 FY 2014 FY 2015 FY 2016 FY 2017
Passengers per Revenue Hour
$265 $293 $267 $274
$448
$000
$200
$400
$600
$800
$1000
FY 2013 FY 2014 FY 2015 FY 2016 FY 2017
Subsidy per Passenger
$13842 $14713 $13905 $13205 $13946
$0
$50
$100
$150
$200
FY 2013 FY 2014 FY 2015 FY 2016 FY 2017
Cost per Revenue Hour
49Local Basic
Days of Service Wkdy Sa SuAvg Freq (Wkdy Peak) 30 min
Avg Freq (Wkdy Non-Peak) 60 minAvg Freq (Wked) 60 min
FY 2017 Farebox Recovery 22 transfer (to route) 9
Clipper usage 11
Annual Avg Monthly Avg Daily Annual Avg Monthly Avg Daily Annual Avg Monthly Avg DailyWeekday 201564 16797 797 11313 943 45 139528 11627 551 Saturday 18489 1541 356 1517 126 29 18370 1531 353 Sunday 17183 1432 286 1761 147 29 21402 1784 357
Total 237236 19770 650 14590 1216 40 179300 14942 491
Annual Avg Monthly Avg Daily Annual Avg Monthly Avg Daily Annual Avg Monthly Avg DailyWeekday $978903 $81575 $3869 $230134 $19178 $910 $748769 $62397 $2960Saturday $131907 $10992 $2537 $22520 $1877 $433 $109387 $9116 $2104Sunday $153484 $12790 $2558 $21844 $1820 $364 $131640 $10970 $2194
Total $1264294 $105358 $3464 $274498 $22875 $752 $989796 $82483 $2712
Passengers per Revenue Hour
Subsidy per Passenger
Cost per Revenue Hour
Farebox Recovery
Weekday 178 $371 $8653 235Saturday 122 $592 $8698 171Sunday 98 $766 $8718 142
Total 163 $417 $8665 217
Passengers Revenue Hours Operating CostsPassenger
RevenueOperating Subsidy
Passengers per Revenue Hour
Subsidy per Passenger
Cost per Revenue Hour
Farebox Recovery
FY 2015 144262 6349 $882801 $158088 $724713 227 $502 $13905 179FY 2016 147480 6795 $900804 $146345 $754459 217 $512 $13257 162FY 2017 237236 14590 $1264294 $274498 $989796 163 $417 $8665 217
Histo
ric Tr
ends
FY 20
161
7 DAT
A
Passengers Revenue Hours Revenue Miles
Operating Costs Passenger Revenue Operating Subsidy
230943
152259 144262 147480
237236
0
50000
100000
150000
200000
250000
FY 2013 FY 2014 FY 2015 FY 2016 FY 2017
Passengers
9814
6440 6349 6795
14590
02000400060008000
10000120001400016000
FY 2013 FY 2014 FY 2015 FY 2016 FY 2017
Revenue Hours$1362499
$948702 $882801 $900804
$1264294
$0$200000$400000$600000$800000
$1000000$1200000$1400000$1600000
FY 2013 FY 2014 FY 2015 FY 2016 FY 2017
Operating Costs
235 236 227 217
163
00
50
100
150
200
250
300
FY 2013 FY 2014 FY 2015 FY 2016 FY 2017
Passengers per Revenue Hour
$477 $507 $502 $512 $417
$000$200$400$600$800
$1000$1200$1400
FY 2013 FY 2014 FY 2015 FY 2016 FY 2017
Subsidy per Passenger
$13884 $14732 $13905 $13257
$8665
$0
$50
$100
$150
$200
FY 2013 FY 2014 FY 2015 FY 2016 FY 2017
Cost per Revenue Hour
61Rural
Days of Service Wkdy Sa SuAvg Freq (Wkdy Peak) 8 trips
Avg Freq (Wkdy Non-Peak) -Avg Freq (Wked) 16 trips
FY 2017 Farebox Recovery 8 transfer (to route) 7
Clipper usage 11
Annual Avg Monthly Avg Daily Annual Avg Monthly Avg Daily Annual Avg Monthly Avg DailyWeekday 17166 1431 68 2631 219 10 45398 3783 181 Saturday 9922 827 198 1319 110 26 20810 1734 416 Sunday 9240 770 144 1542 129 24 24457 2038 382
Total 36328 3027 100 5492 458 15 90665 7555 248
Annual Avg Monthly Avg Daily Annual Avg Monthly Avg Daily Annual Avg Monthly Avg DailyWeekday $229650 $19138 $915 $17691 $1474 $70 $211959 $17663 $844Saturday $113378 $9448 $2268 $11622 $969 $232 $101756 $8480 $2035Sunday $132750 $11063 $2074 $10646 $887 $166 $122104 $10175 $1908
Total $475778 $39648 $1304 $39959 $3330 $109 $435819 $36318 $1194
Passengers per Revenue Hour
Subsidy per Passenger
Cost per Revenue Hour
Farebox Recovery
Weekday 65 $1235 $8730 77Saturday 75 $1026 $8598 103Sunday 60 $1321 $8607 80
Total 66 $1200 $8663 84
Passengers Revenue Hours Operating CostsPassenger
RevenueOperating Subsidy
Passengers per Revenue Hour
Subsidy per Passenger
Cost per Revenue Hour
Farebox Recovery
FY 2015 39478 5379 $417539 $46324 $371215 73 $940 $7762 111FY 2016 37276 5475 $408987 $48421 $360566 68 $967 $7470 118FY 2017 36328 5492 $475778 $39959 $435819 66 $1200 $8663 84
Histo
ric Tr
ends
FY 20
161
7 DAT
A
Passengers Revenue Hours Revenue Miles
Operating Costs Passenger Revenue Operating Subsidy
30642 33386
39478 37276 36328
0
10000
20000
30000
40000
50000
FY 2013 FY 2014 FY 2015 FY 2016 FY 2017
Passengers
5388
5056
5379 5475 5492
480049005000510052005300540055005600
FY 2013 FY 2014 FY 2015 FY 2016 FY 2017
Revenue Hours
$388827 $390358 $417539 $408987 $475778
$0
$100000
$200000
$300000
$400000
$500000
FY 2013 FY 2014 FY 2015 FY 2016 FY 2017
Operating Costs
57 66
73 68 66
00
20
40
60
80
100
FY 2013 FY 2014 FY 2015 FY 2016 FY 2017
Passengers per Revenue Hour
$1136 $1045
$940 $967
$1200
$000$200$400$600$800
$1000$1200$1400
FY 2013 FY 2014 FY 2015 FY 2016 FY 2017
Subsidy per Passenger
$7216 $7721 $7762 $7470 $8663
$0
$50
$100
$150
$200
FY 2013 FY 2014 FY 2015 FY 2016 FY 2017
Cost per Revenue Hour
66Recreational
Days of Service Wkdy Sa SuAvg Freq (Wkdy Peak) 30 min
Avg Freq (Wkdy Non-Peak) 30 minAvg Freq (Wked) 10-20 min
FY 2017 Farebox Recovery 53 transfer (to route) 0
Clipper usage 0
Annual Avg Monthly Avg Daily Annual Avg Monthly Avg Daily Annual Avg Monthly Avg DailyWeekday 21940 7313 549 804 268 20 10735 3578 268 Saturday 43799 7300 1752 1473 245 59 20480 3413 819 Sunday 56377 6264 1446 2040 227 52 28212 3135 723
Total 122116 13568 1174 4316 480 42 59428 6603 571
Annual Avg Monthly Avg Daily Annual Avg Monthly Avg Daily Annual Avg Monthly Avg DailyWeekday $104033 $34678 $2601 $37751 $12584 $944 $66282 $22094 $1657Saturday $152661 $25444 $6106 $79948 $13325 $3198 $72713 $12119 $2909Sunday $217032 $24115 $5565 $132049 $14672 $3386 $84983 $9443 $2179
Total $473726 $52636 $4555 $249748 $27750 $2401 $223978 $24886 $2154
Passengers per Revenue Hour
Subsidy per Passenger
Cost per Revenue Hour
Farebox Recovery
Weekday 273 $302 $12944 363Saturday 297 $166 $10367 524Sunday 276 $151 $10638 608
Total 283 $183 $10975 527
Passengers Revenue Hours Operating CostsPassenger
RevenueOperating Subsidy
Passengers per Revenue Hour
Subsidy per Passenger
Cost per Revenue Hour
Farebox Recovery
FY 2015 103930 3866 $477523 $209514 $268009 269 $258 $12352 439FY 2016 116942 4673 $531384 $245779 $285605 250 $244 $11373 463FY 2017 122116 4316 $473726 $249748 $223978 283 $183 $10975 527
Histo
ric Tr
ends
FY 20
161
7 DAT
A
Passengers Revenue Hours Revenue Miles
Operating Costs Passenger Revenue Operating Subsidy
62624
103052 103930 116942 122116
0
20000
40000
60000
80000
100000
120000
140000
FY 2013 FY 2014 FY 2015 FY 2016 FY 2017
Passengers
2941
3841 3866
4673 4316
0
1000
2000
3000
4000
5000
FY 2013 FY 2014 FY 2015 FY 2016 FY 2017
Revenue Hours
$330076
$538014 $477523
$531384 $473726
$0
$100000
$200000
$300000
$400000
$500000
$600000
FY 2013 FY 2014 FY 2015 FY 2016 FY 2017
Operating Costs
213
268 269 250
283
00
50
100
150
200
250
300
FY 2013 FY 2014 FY 2015 FY 2016 FY 2017
Passengers per Revenue Hour
$360 $322
$258 $244 $183
$000
$100
$200
$300
$400
$500
FY 2013 FY 2014 FY 2015 FY 2016 FY 2017
Subsidy per Passenger
$11223
$14007 $12352 $11373 $10975
$0
$50
$100
$150
$200
FY 2013 FY 2014 FY 2015 FY 2016 FY 2017
Cost per Revenue Hour
68Rural
Days of Service Wkdy Sa SuAvg Freq (Wkdy Peak) 60 min
Avg Freq (Wkdy Non-Peak) 120 minAvg Freq (Wked) 60-120 min
FY 2017 Farebox Recovery 9 transfer (to route) 13
Clipper usage 12
Annual Avg Monthly Avg Daily Annual Avg Monthly Avg Daily Annual Avg Monthly Avg DailyWeekday 59903 4992 239 7282 607 29 133167 11097 531 Saturday 8410 701 168 1492 124 30 27123 2260 542 Sunday 8285 690 129 1907 159 30 34638 2887 541
Total 76598 6383 210 10680 890 29 194928 16244 534
Annual Avg Monthly Avg Daily Annual Avg Monthly Avg Daily Annual Avg Monthly Avg DailyWeekday $645737 $53811 $2573 $64332 $5361 $256 $581405 $48450 $2316Saturday $131882 $10990 $2638 $9260 $772 $185 $122622 $10219 $2452Sunday $169286 $14107 $2645 $8856 $738 $138 $160430 $13369 $2507
Total $946905 $78909 $2594 $82448 $6871 $226 $864457 $72038 $2368
Passengers per Revenue Hour
Subsidy per Passenger
Cost per Revenue Hour
Farebox Recovery
Weekday 82 $971 $8868 100Saturday 56 $1458 $8841 70Sunday 43 $1936 $8879 52
Total 72 $1129 $8866 87
Passengers Revenue Hours Operating CostsPassenger
RevenueOperating Subsidy
Passengers per Revenue Hour
Subsidy per Passenger
Cost per Revenue Hour
Farebox Recovery
FY 2015 65866 10589 $848305 $80846 $767459 62 $1165 $8011 95FY 2016 70292 10611 $811978 $88808 $723170 66 $1029 $7652 109FY 2017 76598 10680 $946905 $82448 $864457 72 $1129 $8866 87
Histo
ric Tr
ends
FY 20
161
7 DAT
A
Passengers Revenue Hours Revenue Miles
Operating Costs Passenger Revenue Operating Subsidy
48113 56988
65866 70292 76598
0
20000
40000
60000
80000
100000
FY 2013 FY 2014 FY 2015 FY 2016 FY 2017
Passengers
7140 7185
10589 10611 10680
0
2000
4000
6000
8000
10000
12000
FY 2013 FY 2014 FY 2015 FY 2016 FY 2017
Revenue Hours
$532879 $571618
$848305 $811978 $946905
$0
$200000
$400000
$600000
$800000
$1000000
FY 2013 FY 2014 FY 2015 FY 2016 FY 2017
Operating Costs
67 79
62 66 72
00
20
40
60
80
100
FY 2013 FY 2014 FY 2015 FY 2016 FY 2017
Passengers per Revenue Hour
$979 $885
$1165 $1029
$1129
$000$200$400$600$800
$1000$1200$1400
FY 2013 FY 2014 FY 2015 FY 2016 FY 2017
Subsidy per Passenger
$7464 $7955 $8011 $7652 $8866
$0
$50
$100
$150
$200
FY 2013 FY 2014 FY 2015 FY 2016 FY 2017
Cost per Revenue Hour
71XLocal Trunkline
Days of Service WkdyAvg Freq (Wkdy Peak) 30 min
Avg Freq (Wkdy Non-Peak) 60 minAvg Freq (Wked) -
FY 2017 Farebox Recovery 15 transfer (to route) 26
Clipper usage 16
Annual Avg Monthly Avg Daily Annual Avg Monthly Avg Daily Annual Avg Monthly Avg DailyWeekday 121141 10095 479 7705 642 30 174624 14552 690 Saturday - - - - - - - - - Sunday - - - - - - - - -
Total 121141 10095 479 7705 642 30 174624 14552 690
Annual Avg Monthly Avg Daily Annual Avg Monthly Avg Daily Annual Avg Monthly Avg DailyWeekday $1116954 $93080 $4415 $164963 $13747 $652 $951991 $79333 $3763Saturday $ - $ - $ - $ - $ - $ - $ - $ - $ -Sunday $ - $ - $ - $ - $ - $ - $ - $ - $ -
Total $1116954 $93080 $4415 $164963 $13747 $652 $951991 $79333 $3763
Passengers per Revenue Hour
Subsidy per Passenger
Cost per Revenue Hour
Farebox Recovery
Weekday 157 $786 $14496 148Saturday - $ - $ - - Sunday - $ - $ - -
Total 157 $786 $14496 148
Passengers Revenue Hours Operating CostsPassenger
RevenueOperating Subsidy
Passengers per Revenue Hour
Subsidy per Passenger
Cost per Revenue Hour
Farebox Recovery
FY 2015 305440 7666 $1066058 $307659 $758399 398 $248 $13906 289FY 2016 259678 7717 $1075263 $300186 $775077 337 $298 $13934 279FY 2017 121141 7705 $1116954 $164963 $951991 157 $786 $14496 148
Histo
ric Tr
ends
FY 20
161
7 DAT
A
Passengers Revenue Hours Revenue Miles
Operating Costs Passenger Revenue Operating Subsidy
347560 341105 305440
259678
121141
050000
100000150000200000250000300000350000400000
FY 2013 FY 2014 FY 2015 FY 2016 FY 2017
Passengers9038
7578 7666 7717 7705
0
2000
4000
6000
8000
10000
FY 2013 FY 2014 FY 2015 FY 2016 FY 2017
Revenue Hours$1254262
$1116004 $1066058 $1075263 $1116954
$0
$200000
$400000
$600000
$800000
$1000000
$1200000
$1400000
FY 2013 FY 2014 FY 2015 FY 2016 FY 2017
Operating Costs
385 450
398 337
157
00100200300400500600700800
FY 2013 FY 2014 FY 2015 FY 2016 FY 2017
Passengers per Revenue Hour
$253 $222 $248 $298
$786
$000
$200
$400
$600
$800
$1000
FY 2013 FY 2014 FY 2015 FY 2016 FY 2017
Subsidy per Passenger
$13877 $14728 $13906 $13934 $14496
$0
$50
$100
$150
$200
FY 2013 FY 2014 FY 2015 FY 2016 FY 2017
Cost per Revenue Hour
113Supplemental
Days of Service School DaysAvg Freq (Wkdy Peak) 3 trips
Avg Freq (Wkdy Non-Peak) -Avg Freq (Wked) -
FY 2017 Farebox Recovery 29 transfer (to route) 0
Clipper usage 4
Annual Avg Monthly Avg Daily Annual Avg Monthly Avg Daily Annual Avg Monthly Avg DailyWeekday 16829 1530 92 317 29 2 2404 219 13 Saturday - - - - - - - - - Sunday - - - - - - - - -
Total 16829 1530 92 317 29 2 2404 219 13
Annual Avg Monthly Avg Daily Annual Avg Monthly Avg Daily Annual Avg Monthly Avg DailyWeekday $42180 $3835 $230 $12227 $1112 $67 $29953 $2723 $164Saturday $ - $ - $ - $ - $ - $ - $ - $ - $ -Sunday $ - $ - $ - $ - $ - $ - $ - $ - $ -
Total $42180 $3835 $230 $12227 $1112 $67 $29953 $2723 $164
Passengers per TripSubsidy per
PassengerCost per Revenue
HourFarebox Recovery
Weekday 315 $178 $13289 290Saturday - $ - $ - - Sunday - $ - $ - -
Total 315 $178 $13289 290
Passengers Revenue Hours Operating CostsPassenger
RevenueOperating Subsidy Passengers per Trip
Subsidy per Passenger
Cost per Revenue Hour
Farebox Recovery
FY 2015 12241 161 $28599 $10703 $17896 342 $146 $17752 374FY 2016 14601 263 $36924 $12809 $24115 317 $165 $14050 347FY 2017 16829 317 $42180 $12227 $29953 315 $178 $13289 290
Histo
ric Tr
ends
FY 20
161
7 DAT
A
Passengers Revenue Hours Revenue Miles
Operating Costs Passenger Revenue Operating Subsidy
15232 13521
12241 14601
16829
0
5000
10000
15000
20000
FY 2013 FY 2014 FY 2015 FY 2016 FY 2017
Passengers
229
165 161
263
317
0
50
100
150
200
250
300
350
FY 2013 FY 2014 FY 2015 FY 2016 FY 2017
Revenue Hours
$31562
$20182
$28599
$36924 $42180
$0
$10000
$20000
$30000
$40000
$50000
FY 2013 FY 2014 FY 2015 FY 2016 FY 2017
Operating Costs
220
365 342 317 315
00
100
200
300
400
500
FY 2013 FY 2014 FY 2015 FY 2016 FY 2017
Passengers per Trip
$051 $095
$146 $165 $178
$000$100$200$300$400$500$600$700$800
FY 2013 FY 2014 FY 2015 FY 2016 FY 2017
Subsidy per Passenger
$13795 $12261
$17752
$14050 $13289
$0
$50
$100
$150
$200
FY 2013 FY 2014 FY 2015 FY 2016 FY 2017
Cost per Revenue Hour
115Supplemental
Days of Service School DaysAvg Freq (Wkdy Peak) 5 trips
Avg Freq (Wkdy Non-Peak) -Avg Freq (Wked) -
FY 2017 Farebox Recovery 11 transfer (to route) 0
Clipper usage 7
Annual Avg Monthly Avg Daily Annual Avg Monthly Avg Daily Annual Avg Monthly Avg DailyWeekday 14021 1275 71 637 58 3 6963 633 35 Saturday - - - - - - - - - Sunday - - - - - - - - -
Total 14021 1275 71 637 58 3 6963 633 35
Annual Avg Monthly Avg Daily Annual Avg Monthly Avg Daily Annual Avg Monthly Avg DailyWeekday $87534 $7958 $444 $9504 $864 $48 $78030 $7094 $396Saturday $ - $ - $ - $ - $ - $ - $ - $ - $ -Sunday $ - $ - $ - $ - $ - $ - $ - $ - $ -
Total $87534 $7958 $444 $9504 $864 $48 $78030 $7094 $396
Passengers per TripSubsidy per
PassengerCost per Revenue
HourFarebox Recovery
Weekday 185 $557 $13744 109Saturday - $ - $ - - Sunday - $ - $ - -
Total 185 $557 $13744 109
Passengers Revenue Hours Operating CostsPassenger
RevenueOperating Subsidy Passengers per Trip
Subsidy per Passenger
Cost per Revenue Hour
Farebox Recovery
FY 2015 21488 775 $131168 $18863 $112305 221 $523 $16918 144FY 2016 16366 559 $82403 $12638 $69765 168 $426 $14754 153FY 2017 14021 637 $87534 $9504 $78030 185 $557 $13744 109
Histo
ric Tr
ends
FY 20
161
7 DAT
A
Passengers Revenue Hours Revenue Miles
Operating Costs Passenger Revenue Operating Subsidy
13524
21488
16366 14021
0
5000
10000
15000
20000
25000
FY 2013 FY 2014 FY 2015 FY 2016 FY 2017
Passengers
463
775
559 637
0
200
400
600
800
1000
FY 2013 FY 2014 FY 2015 FY 2016 FY 2017
Revenue Hours
$56706
$131168
$82403 $87534
$0
$20000
$40000
$60000
$80000
$100000
$120000
$140000
FY 2013 FY 2014 FY 2015 FY 2016 FY 2017
Operating Costs
232 221 168 185
00
100
200
300
400
500
FY 2013 FY 2014 FY 2015 FY 2016 FY 2017
Passengers per Trip
$362
$523 $426
$557
$000$100$200$300$400$500$600$700$800
FY 2013 FY 2014 FY 2015 FY 2016 FY 2017
Subsidy per Passenger
$12250
$16918 $14754 $13744
$0
$50
$100
$150
$200
FY 2013 FY 2014 FY 2015 FY 2016 FY 2017
Cost per Revenue Hour
117Supplemental
Days of Service School DaysAvg Freq (Wkdy Peak) 6 trips
Avg Freq (Wkdy Non-Peak) -Avg Freq (Wked) -
FY 2017 Farebox Recovery 21 transfer (to route) 0
Clipper usage 2
Annual Avg Monthly Avg Daily Annual Avg Monthly Avg Daily Annual Avg Monthly Avg DailyWeekday 34820 3165 193 640 58 4 4753 432 26 Saturday - - - - - - - - - Sunday - - - - - - - - -
Total 34820 3165 193 640 58 4 4753 432 26
Annual Avg Monthly Avg Daily Annual Avg Monthly Avg Daily Annual Avg Monthly Avg DailyWeekday $81509 $7410 $453 $17140 $1558 $95 $64369 $5852 $358Saturday $ - $ - $ - $ - $ - $ - $ - $ - $ -Sunday $ - $ - $ - $ - $ - $ - $ - $ - $ -
Total $81509 $7410 $453 $17140 $1558 $95 $64369 $5852 $358
Passengers per TripSubsidy per
PassengerCost per Revenue
HourFarebox Recovery
Weekday 284 $185 $12732 210Saturday - $ - $ - - Sunday - $ - $ - -
Total 284 $185 $12732 210
Passengers Revenue Hours Operating CostsPassenger
RevenueOperating Subsidy Passengers per Trip
Subsidy per Passenger
Cost per Revenue Hour
Farebox Recovery
FY 2015 50008 509 $77168 $77528 ($360) 399 ($001) $15158 1005FY 2016 33705 552 $77694 $23478 $54216 269 $161 $14075 302FY 2017 34820 640 $81509 $17140 $64369 284 $185 $12732 210
Histo
ric Tr
ends
FY 20
161
7 DAT
A
Passengers Revenue Hours Revenue Miles
Operating Costs Passenger Revenue Operating Subsidy
35174 34496
50008
33705 34820
0
10000
20000
30000
40000
50000
60000
FY 2013 FY 2014 FY 2015 FY 2016 FY 2017
Passengers
299 341
509 552
640
0
100
200
300
400
500
600
700
FY 2013 FY 2014 FY 2015 FY 2016 FY 2017
Revenue Hours
$41176 $41796
$77168 $77694 $81509
$0
$20000
$40000
$60000
$80000
$100000
FY 2013 FY 2014 FY 2015 FY 2016 FY 2017
Operating Costs
436 406 399
269 284
00
100
200
300
400
500
FY 2013 FY 2014 FY 2015 FY 2016 FY 2017
Passengers per Trip
($012) ($028) ($001)
$161 $185
-$200
-$100
$000
$100
$200
$300
$400
$500
$600
FY 2013 FY 2014 FY 2015 FY 2016 FY 2017
Subsidy per Passenger$13790
$12253
$15158 $14075
$12732
$0$20$40$60$80
$100$120$140$160
FY 2013 FY 2014 FY 2015 FY 2016 FY 2017
Cost per Revenue Hour
119Supplemental
Days of Service School DaysAvg Freq (Wkdy Peak) 5 trips
Avg Freq (Wkdy Non-Peak) -Avg Freq (Wked) -
FY 2017 Farebox Recovery 34 transfer (to route) 0
Clipper usage 5
Annual Avg Monthly Avg Daily Annual Avg Monthly Avg Daily Annual Avg Monthly Avg DailyWeekday 27161 2469 151 374 34 2 6893 627 38 Saturday - - - - - - - - - Sunday - - - - - - - - -
Total 27161 2469 151 374 34 2 6893 627 38
Annual Avg Monthly Avg Daily Annual Avg Monthly Avg Daily Annual Avg Monthly Avg DailyWeekday $56273 $5116 $313 $18859 $1714 $105 $37414 $3401 $208Saturday $ - $ - $ - $ - $ - $ - $ - $ - $ -Sunday $ - $ - $ - $ - $ - $ - $ - $ - $ -
Total $56273 $5116 $313 $18859 $1714 $105 $37414 $3401 $208
Passengers per TripSubsidy per
PassengerCost per Revenue
HourFarebox Recovery
Weekday 313 $138 $15058 335Saturday - $ - $ - - Sunday - $ - $ - -
Total 313 $138 $15058 335
Passengers Revenue Hours Operating CostsPassenger
RevenueOperating Subsidy Passengers per Trip
Subsidy per Passenger
Cost per Revenue Hour
Farebox Recovery
FY 2015 28376 466 $85243 $24699 $60544 319 $213 $18292 290FY 2016 30906 431 $68366 $28456 $39910 317 $129 $15877 416FY 2017 27161 374 $56273 $18859 $37414 313 $138 $15058 335
Histo
ric Tr
ends
FY 20
161
7 DAT
A
Passengers Revenue Hours Revenue Miles
Operating Costs Passenger Revenue Operating Subsidy
27987 28376
30906
27161
25000
26000
27000
28000
29000
30000
31000
32000
FY 2013 FY 2014 FY 2015 FY 2016 FY 2017
Passengers526
466 431
374
0
100
200
300
400
500
600
FY 2013 FY 2014 FY 2015 FY 2016 FY 2017
Revenue Hours
$64440
$85243
$68366 $56273
$0
$20000
$40000
$60000
$80000
$100000
FY 2013 FY 2014 FY 2015 FY 2016 FY 2017
Operating Costs
272 319 317 313
00
100
200
300
400
500
FY 2013 FY 2014 FY 2015 FY 2016 FY 2017
Passengers per Trip
$175 $213 $129 $138
$000$100$200$300$400$500$600$700$800
FY 2013 FY 2014 FY 2015 FY 2016 FY 2017
Subsidy per Passenger
$12251
$18292 $15877 $15058
$0
$50
$100
$150
$200
FY 2013 FY 2014 FY 2015 FY 2016 FY 2017
Cost per Revenue Hour
122Partnership
Days of Service WkdyAvg Freq (Wkdy Peak) -
Avg Freq (Wkdy Non-Peak) 30 minAvg Freq (Wked) -
FY 2017 Farebox Recovery 66 transfer (to route) 9
Clipper usage 6
Annual Avg Monthly Avg Daily Annual Avg Monthly Avg Daily Annual Avg Monthly Avg DailyWeekday 19860 1986 113 1696 170 10 15480 1548 88 Saturday - - - - - - - - - Sunday - - - - - - - - -
Total 19860 1986 113 1696 170 10 15480 1548 88
Annual Avg Monthly Avg Daily Annual Avg Monthly Avg Daily Annual Avg Monthly Avg DailyWeekday $183943 $18394 $1045 $121007 $12101 $688 $62936 $6294 $358Saturday $ - $ - $ - $ - $ - $ - $ - $ - $ -Sunday $ - $ - $ - $ - $ - $ - $ - $ - $ -
Total $183943 $18394 $1045 $121007 $12101 $688 $62936 $6294 $358
Passengers per Revenue Hour
Subsidy per Passenger
Cost per Revenue Hour
Farebox Recovery
Weekday 117 $317 $10844 658Saturday - $ - $ - - Sunday - $ - $ - -
Total 117 $317 $10844 658
Passengers Revenue Hours Operating CostsPassenger
RevenueOperating Subsidy
Passengers per Revenue Hour
Subsidy per Passenger
Cost per Revenue Hour
Farebox Recovery
FY 2015FY 2016 20360 2932 $325230 $149686 $175544 69 $862 $11094 460FY 2017 19860 1696 $183943 $121007 $62936 117 $317 $10844 658
Histo
ric Tr
ends
FY 20
161
7 DAT
A
Passengers Revenue Hours Revenue Miles
Operating Costs Passenger Revenue Operating Subsidy
20360 19860
0
5000
10000
15000
20000
25000
FY 2013 FY 2014 FY 2015 FY 2016 FY 2017
Passengers2932
1696
0
500
1000
1500
2000
2500
3000
3500
FY 2013 FY 2014 FY 2015 FY 2016 FY 2017
Revenue Hours$325230
$183943
$0
$50000
$100000
$150000
$200000
$250000
$300000
$350000
FY 2013 FY 2014 FY 2015 FY 2016 FY 2017
Operating Costs
69
117
00
20
40
60
80
100
120
140
FY 2013 FY 2014 FY 2015 FY 2016 FY 2017
Passengers per Revenue Hour$862
$317
$000
$200
$400
$600
$800
$1000
FY 2013 FY 2014 FY 2015 FY 2016 FY 2017
Subsidy per Passenger
$11094 $10844
$0
$50
$100
$150
$200
FY 2013 FY 2014 FY 2015 FY 2016 FY 2017
Cost per Revenue Hour
125Supplemental
Days of Service School DaysAvg Freq (Wkdy Peak) 4 trips
Avg Freq (Wkdy Non-Peak) -Avg Freq (Wked) -
FY 2017 Farebox Recovery 16 transfer (to route) 1
Clipper usage 8
Annual Avg Monthly Avg Daily Annual Avg Monthly Avg Daily Annual Avg Monthly Avg DailyWeekday 13757 1251 76 600 55 3 8580 780 48 Saturday - - - - - - - - - Sunday - - - - - - - - -
Total 13757 1251 76 600 55 3 8580 780 48
Annual Avg Monthly Avg Daily Annual Avg Monthly Avg Daily Annual Avg Monthly Avg DailyWeekday $72469 $6588 $403 $11570 $1052 $64 $60899 $5536 $338Saturday $ - $ - $ - $ - $ - $ - $ - $ - $ -Sunday $ - $ - $ - $ - $ - $ - $ - $ - $ -
Total $72469 $6588 $403 $11570 $1052 $64 $60899 $5536 $338
Passengers per TripSubsidy per
PassengerCost per Revenue
HourFarebox Recovery
Weekday 193 $443 $12086 160Saturday - $ - $ - - Sunday - $ - $ - -
Total 193 $443 $12086 160
Passengers Revenue Hours Operating CostsPassenger
RevenueOperating Subsidy Passengers per Trip
Subsidy per Passenger
Cost per Revenue Hour
Farebox Recovery
FY 2015 13298 578 $87015 $11914 $75101 186 $565 $15054 137FY 2016 13197 595 $77991 $12684 $65307 182 $495 $13117 163FY 2017 13757 600 $72469 $11570 $60899 193 $443 $12086 160
Histo
ric Tr
ends
FY 20
161
7 DAT
A
Passengers Revenue Hours Revenue Miles
Operating Costs Passenger Revenue Operating Subsidy
8798 7189
13298 13197 13757
02000400060008000
10000120001400016000
FY 2013 FY 2014 FY 2015 FY 2016 FY 2017
Passengers
100 90
578 595 600
0
100
200
300
400
500
600
700
FY 2013 FY 2014 FY 2015 FY 2016 FY 2017
Revenue Hours
$13752 $10979
$87015 $77991
$72469
$0
$20000
$40000
$60000
$80000
$100000
FY 2013 FY 2014 FY 2015 FY 2016 FY 2017
Operating Costs
492
402
186 182 193
00
100
200
300
400
500
FY 2013 FY 2014 FY 2015 FY 2016 FY 2017
Passengers per Trip
$015 $002
$565 $495
$443
$000$100$200$300$400$500$600$700$800
FY 2013 FY 2014 FY 2015 FY 2016 FY 2017
Subsidy per Passenger$13821
$12267
$15054 $13117
$12086
$0$20$40$60$80
$100$120$140$160
FY 2013 FY 2014 FY 2015 FY 2016 FY 2017
Cost per Revenue Hour
139Supplemental
Days of Service School DaysAvg Freq (Wkdy Peak) 2 trips
Avg Freq (Wkdy Non-Peak) -Avg Freq (Wked) -
FY 2017 Farebox Recovery 20 transfer (to route) 0
Clipper usage 24
Annual Avg Monthly Avg Daily Annual Avg Monthly Avg Daily Annual Avg Monthly Avg DailyWeekday 6414 583 36 253 23 1 4127 375 23 Saturday - - - - - - - - - Sunday - - - - - - - - -
Total 6414 583 36 253 23 1 4127 375 23
Annual Avg Monthly Avg Daily Annual Avg Monthly Avg Daily Annual Avg Monthly Avg DailyWeekday $33182 $3017 $184 $6635 $603 $37 $26547 $2413 $147Saturday $ - $ - $ - $ - $ - $ - $ - $ - $ -Sunday $ - $ - $ - $ - $ - $ - $ - $ - $ -
Total $33182 $3017 $184 $6635 $603 $37 $26547 $2413 $147
Passengers per TripSubsidy per
PassengerCost per Revenue
HourFarebox Recovery
Weekday 179 $414 $13110 200Saturday - $ - $ - - Sunday - $ - $ - -
Total 179 $414 $13110 200
Passengers Revenue Hours Operating CostsPassenger
RevenueOperating Subsidy Passengers per Trip
Subsidy per Passenger
Cost per Revenue Hour
Farebox Recovery
FY 2015 5906 225 $36437 $5258 $31179 164 $528 $16173 144FY 2016 6391 315 $43776 $6241 $37535 160 $587 $13880 143FY 2017 6414 253 $33182 $6635 $26547 179 $414 $13110 200
Histo
ric Tr
ends
FY 20
161
7 DAT
A
Passengers Revenue Hours Revenue Miles
Operating Costs Passenger Revenue Operating Subsidy
4232 4026
5906 6391 6414
0
1000
2000
3000
4000
5000
6000
7000
FY 2013 FY 2014 FY 2015 FY 2016 FY 2017
Passengers
226 227 225
315
253
0
50
100
150
200
250
300
350
FY 2013 FY 2014 FY 2015 FY 2016 FY 2017
Revenue Hours
$31306 $27734
$36437
$43776
$33182
$0
$10000
$20000
$30000
$40000
$50000
FY 2013 FY 2014 FY 2015 FY 2016 FY 2017
Operating Costs
120 111 164 160 179
00
100
200
300
400
500
FY 2013 FY 2014 FY 2015 FY 2016 FY 2017
Passengers per Trip
$427
$628 $528
$587
$414
$000$100$200$300$400$500$600$700$800
FY 2013 FY 2014 FY 2015 FY 2016 FY 2017
Subsidy per Passenger
$13834 $12239
$16173 $13880 $13110
$0
$50
$100
$150
$200
FY 2013 FY 2014 FY 2015 FY 2016 FY 2017
Cost per Revenue Hour
145Supplemental
Days of Service School DaysAvg Freq (Wkdy Peak) 2-3 trips
Avg Freq (Wkdy Non-Peak) -Avg Freq (Wked) -
FY 2017 Farebox Recovery 29 transfer (to route) 5
Clipper usage 2
Annual Avg Monthly Avg Daily Annual Avg Monthly Avg Daily Annual Avg Monthly Avg DailyWeekday 16406 1491 90 191 17 1 2175 198 12 Saturday - - - - - - - - - Sunday - - - - - - - - -
Total 16406 1491 90 191 17 1 2175 198 12
Annual Avg Monthly Avg Daily Annual Avg Monthly Avg Daily Annual Avg Monthly Avg DailyWeekday $25426 $2311 $139 $7258 $660 $40 $18168 $1652 $99Saturday $ - $ - $ - $ - $ - $ - $ - $ - $ -Sunday $ - $ - $ - $ - $ - $ - $ - $ - $ -
Total $25426 $2311 $139 $7258 $660 $40 $18168 $1652 $99
Passengers per TripSubsidy per
PassengerCost per Revenue
HourFarebox Recovery
Weekday 372 $111 $13347 285Saturday - $ - $ - - Sunday - $ - $ - -
Total 372 $111 $13347 285
Passengers Revenue Hours Operating CostsPassenger
RevenueOperating Subsidy Passengers per Trip
Subsidy per Passenger
Cost per Revenue Hour
Farebox Recovery
FY 2015 6911 87 $13373 $5858 $7515 337 $109 $15442 438FY 2016 10268 167 $21672 $6341 $15331 396 $149 $12993 293FY 2017 16406 191 $25426 $7258 $18168 372 $111 $13347 285
Histo
ric Tr
ends
FY 20
161
7 DAT
A
Passengers Revenue Hours Revenue Miles
Operating Costs Passenger Revenue Operating Subsidy
6911
10268
16406
0
5000
10000
15000
20000
FY 2013 FY 2014 FY 2015 FY 2016 FY 2017
Passengers
87
167 191
0
50
100
150
200
250
FY 2013 FY 2014 FY 2015 FY 2016 FY 2017
Revenue Hours
$13373
$21672 $25426
$0
$5000
$10000
$15000
$20000
$25000
$30000
FY 2013 FY 2014 FY 2015 FY 2016 FY 2017
Operating Costs
337 396 372
00
100
200
300
400
500
FY 2013 FY 2014 FY 2015 FY 2016 FY 2017
Passengers per Trip
$109 $149 $111
$000$100$200$300$400$500$600$700$800
FY 2013 FY 2014 FY 2015 FY 2016 FY 2017
Subsidy per Passenger
$15442 $12993 $13347
$0
$50
$100
$150
$200
FY 2013 FY 2014 FY 2015 FY 2016 FY 2017
Cost per Revenue Hour
151Supplemental
Days of Service School DaysAvg Freq (Wkdy Peak) 4-5 trips
Avg Freq (Wkdy Non-Peak) -Avg Freq (Wked) -
FY 2017 Farebox Recovery 25 transfer (to route) 1
Clipper usage 4
Annual Avg Monthly Avg Daily Annual Avg Monthly Avg Daily Annual Avg Monthly Avg DailyWeekday 36801 3346 204 594 54 3 10649 968 59 Saturday - - - - - - - - - Sunday - - - - - - - - -
Total 36801 3346 204 594 54 3 10649 968 59
Annual Avg Monthly Avg Daily Annual Avg Monthly Avg Daily Annual Avg Monthly Avg DailyWeekday $73842 $6713 $410 $18463 $1678 $103 $55379 $5034 $308Saturday $ - $ - $ - $ - $ - $ - $ - $ - $ -Sunday $ - $ - $ - $ - $ - $ - $ - $ - $ -
Total $73842 $6713 $410 $18463 $1678 $103 $55379 $5034 $308
Passengers per TripSubsidy per
PassengerCost per Revenue
HourFarebox Recovery
Weekday 428 $150 $12442 250Saturday - $ - $ - - Sunday - $ - $ - -
Total 428 $150 $12442 250
Passengers Revenue Hours Operating CostsPassenger
RevenueOperating Subsidy Passengers per Trip
Subsidy per Passenger
Cost per Revenue Hour
Farebox Recovery
FY 2015 39309 911 $134174 $34376 $99798 315 $254 $14722 256FY 2016 42643 759 $100712 $25851 $74861 456 $176 $13267 257FY 2017 36801 594 $73842 $18463 $55379 428 $150 $12442 250
Histo
ric Tr
ends
FY 20
161
7 DAT
A
Passengers Revenue Hours Revenue Miles
Operating Costs Passenger Revenue Operating Subsidy
39537 39309
42643
36801
32000
34000
36000
38000
40000
42000
44000
FY 2013 FY 2014 FY 2015 FY 2016 FY 2017
Passengers
784 911
759
594
0
200
400
600
800
1000
FY 2013 FY 2014 FY 2015 FY 2016 FY 2017
Revenue Hours
$95932
$134174
$100712
$73842
$0$20000$40000$60000$80000
$100000$120000$140000$160000
FY 2013 FY 2014 FY 2015 FY 2016 FY 2017
Operating Costs
368 315
456 428
00
100
200
300
400
500
FY 2013 FY 2014 FY 2015 FY 2016 FY 2017
Passengers per Trip
$188 $254
$176 $150
$000$100$200$300$400$500$600$700$800
FY 2013 FY 2014 FY 2015 FY 2016 FY 2017
Subsidy per Passenger
$12233
$14722 $13267 $12442
$0$20$40$60$80
$100$120$140$160
FY 2013 FY 2014 FY 2015 FY 2016 FY 2017
Cost per Revenue Hour
154Supplemental
Days of Service School DaysAvg Freq (Wkdy Peak) 3 trips
Avg Freq (Wkdy Non-Peak) -Avg Freq (Wked) -
FY 2017 Farebox Recovery 21 transfer (to route) 0
Clipper usage 5
Annual Avg Monthly Avg Daily Annual Avg Monthly Avg Daily Annual Avg Monthly Avg DailyWeekday 13738 1249 76 358 33 2 4342 395 24 Saturday - - - - - - - - - Sunday - - - - - - - - -
Total 13738 1249 76 358 33 2 4342 395 24
Annual Avg Monthly Avg Daily Annual Avg Monthly Avg Daily Annual Avg Monthly Avg DailyWeekday $41965 $3815 $233 $8847 $804 $49 $33118 $3011 $184Saturday $ - $ - $ - $ - $ - $ - $ - $ - $ -Sunday $ - $ - $ - $ - $ - $ - $ - $ - $ -
Total $41965 $3815 $233 $8847 $804 $49 $33118 $3011 $184
Passengers per TripSubsidy per
PassengerCost per Revenue
HourFarebox Recovery
Weekday 255 $241 $11729 211Saturday - $ - $ - - Sunday - $ - $ - -
Total 255 $241 $11729 211
Passengers Revenue Hours Operating CostsPassenger
RevenueOperating Subsidy Passengers per Trip
Subsidy per Passenger
Cost per Revenue Hour
Farebox Recovery
FY 2015 15376 293 $42604 $13174 $29430 388 $191 $14541 309FY 2016 17858 360 $46133 $14660 $31473 311 $176 $12808 318FY 2017 13738 358 $41965 $8847 $33118 255 $241 $11729 211
Histo
ric Tr
ends
FY 20
161
7 DAT
A
Passengers Revenue Hours Revenue Miles
Operating Costs Passenger Revenue Operating Subsidy
12138
15376 17858
13738
0
5000
10000
15000
20000
FY 2013 FY 2014 FY 2015 FY 2016 FY 2017
Passengers
310 293
360 358
050
100150200250300350400
FY 2013 FY 2014 FY 2015 FY 2016 FY 2017
Revenue Hours
$37913 $42604
$46133 $41965
$0
$10000
$20000
$30000
$40000
$50000
FY 2013 FY 2014 FY 2015 FY 2016 FY 2017
Operating Costs
291
388
311 255
00
100
200
300
400
500
FY 2013 FY 2014 FY 2015 FY 2016 FY 2017
Passengers per Trip
$256 $191 $176
$241
$000$100$200$300$400$500$600$700$800
FY 2013 FY 2014 FY 2015 FY 2016 FY 2017
Subsidy per Passenger
$12246
$14541 $12808
$11729
$0$20$40$60$80
$100$120$140$160
FY 2013 FY 2014 FY 2015 FY 2016 FY 2017
Cost per Revenue Hour
219Local Connector
Days of Service Wkdy Sa SuAvg Freq (Wkdy Peak) 30 min
Avg Freq (Wkdy Non-Peak) 30 minAvg Freq (Wked) 30 min
FY 2017 Farebox Recovery 11 transfer (to route) 20
Clipper usage 11
Annual Avg Monthly Avg Daily Annual Avg Monthly Avg Daily Annual Avg Monthly Avg DailyWeekday 40817 3401 161 5020 418 20 58766 4897 232 Saturday 4888 407 94 637 53 12 10931 911 210 Sunday 4744 395 79 735 61 12 12607 1051 210
Total 50449 4204 138 6392 533 18 82304 6859 225
Annual Avg Monthly Avg Daily Annual Avg Monthly Avg Daily Annual Avg Monthly Avg DailyWeekday $462388 $38532 $1828 $51411 $4284 $203 $410977 $34248 $1624Saturday $59904 $4992 $1152 $6230 $519 $120 $53674 $4473 $1032Sunday $68932 $5744 $1149 $6460 $538 $108 $62472 $5206 $1041
Total $591224 $49269 $1620 $64101 $5342 $176 $527123 $43927 $1444
Passengers per Revenue Hour
Subsidy per Passenger
Cost per Revenue Hour
Farebox Recovery
Weekday 81 $1007 $9212 111Saturday 77 $1098 $9401 104Sunday 65 $1317 $9381 94
Total 79 $1045 $9250 108
Passengers Revenue Hours Operating CostsPassenger
RevenueOperating Subsidy
Passengers per Revenue Hour
Subsidy per Passenger
Cost per Revenue Hour
Farebox Recovery
FY 2015 60906 6585 $569962 $65747 $504215 92 $828 $8656 115FY 2016 55610 6591 $590663 $73164 $517499 84 $931 $8961 124FY 2017 50449 6392 $591224 $64101 $527123 79 $1045 $9250 108
Histo
ric Tr
ends
FY 20
161
7 DAT
A
Passengers Revenue Hours Revenue Miles
Operating Costs Passenger Revenue Operating Subsidy
55543 60906
55610 50449
0
10000
20000
30000
40000
50000
60000
70000
FY 2013 FY 2014 FY 2015 FY 2016 FY 2017
Passengers
5734
6585 6591 6392
520054005600580060006200640066006800
FY 2013 FY 2014 FY 2015 FY 2016 FY 2017
Revenue Hours
$522978
$569962
$590663 $591224
$480000
$500000
$520000
$540000
$560000
$580000
$600000
FY 2013 FY 2014 FY 2015 FY 2016 FY 2017
Operating Costs
97 92 84 79
00
20
40
60
80
100
120
140
FY 2013 FY 2014 FY 2015 FY 2016 FY 2017
Passengers per Revenue Hour
$851 $828 $931
$1045
$000$200$400$600$800
$1000$1200$1400
FY 2013 FY 2014 FY 2015 FY 2016 FY 2017
Subsidy per Passenger
$9121 $8656 $8961 $9250
$0
$50
$100
$150
$200
FY 2013 FY 2014 FY 2015 FY 2016 FY 2017
Cost per Revenue Hour
228Local Connector
Days of Service Wkdy Sa SuAvg Freq (Wkdy Peak) 60 min
Avg Freq (Wkdy Non-Peak) 60 minAvg Freq (Wked) 60 min
FY 2017 Farebox Recovery 11 transfer (to route) 17
Clipper usage 15
Annual Avg Monthly Avg Daily Annual Avg Monthly Avg Daily Annual Avg Monthly Avg DailyWeekday 57316 4776 227 7175 598 28 65884 5490 260 Saturday 8218 685 158 1331 111 26 13020 1085 250 Sunday 5806 484 97 1536 128 26 15023 1252 250
Total 71340 5945 195 10042 837 28 93926 7827 257
Annual Avg Monthly Avg Daily Annual Avg Monthly Avg Daily Annual Avg Monthly Avg DailyWeekday $646194 $53850 $2554 $80857 $6738 $320 $565337 $47111 $2235Saturday $120205 $10017 $2312 $12568 $1047 $242 $107637 $8970 $2070Sunday $138407 $11534 $2307 $10487 $874 $175 $127920 $10660 $2132
Total $904806 $75401 $2479 $103912 $8659 $285 $800894 $66741 $2194
Passengers per Revenue Hour
Subsidy per Passenger
Cost per Revenue Hour
Farebox Recovery
Weekday 80 $986 $9006 125Saturday 62 $1310 $9030 105Sunday 38 $2203 $9011 76
Total 71 $1123 $9010 115
Passengers Revenue Hours Operating CostsPassenger
RevenueOperating Subsidy
Passengers per Revenue Hour
Subsidy per Passenger
Cost per Revenue Hour
Farebox Recovery
FY 2015 15287 2828 $239879 $18274 $221605 54 $1450 $8482 76FY 2016 17522 3185 $280634 $28092 $252542 55 $1441 $8812 100FY 2017 71340 10042 $904806 $103912 $800894 71 $1123 $9010 115
Histo
ric Tr
ends
FY 20
161
7 DAT
A
Passengers Revenue Hours Revenue Miles
Operating Costs Passenger Revenue Operating Subsidy
5854 15287 17522
71340
01000020000300004000050000600007000080000
FY 2013 FY 2014 FY 2015 FY 2016 FY 2017
Passengers
970
2828 3185
10042
0
2000
4000
6000
8000
10000
12000
FY 2013 FY 2014 FY 2015 FY 2016 FY 2017
Revenue Hours
$85183
$239879 $280634
$904806
$0
$200000
$400000
$600000
$800000
$1000000
FY 2013 FY 2014 FY 2015 FY 2016 FY 2017
Operating Costs
60 54 55 71
00
20
40
60
80
100
120
140
FY 2013 FY 2014 FY 2015 FY 2016 FY 2017
Passengers per Revenue Hour$1358
$1450 $1441
$1123
$000$200$400$600$800
$1000$1200$1400
FY 2013 FY 2014 FY 2015 FY 2016 FY 2017
Subsidy per Passenger
$8779 $8482 $8812 $9010
$0
$50
$100
$150
$200
FY 2013 FY 2014 FY 2015 FY 2016 FY 2017
Cost per Revenue Hour
233Local Connector
Days of Service Wkdy Sa SuAvg Freq (Wkdy Peak) 60 min
Avg Freq (Wkdy Non-Peak) 60 minAvg Freq (Wked) 60 min
FY 2017 Farebox Recovery 13 transfer (to route) 16
Clipper usage 10
Annual Avg Monthly Avg Daily Annual Avg Monthly Avg Daily Annual Avg Monthly Avg DailyWeekday 35589 2966 141 3306 276 13 38809 3234 153 Saturday 3911 326 75 490 41 9 5829 486 112 Sunday 3298 275 55 566 47 9 6726 561 112
Total 42798 3567 117 4363 364 12 51364 4280 141
Annual Avg Monthly Avg Daily Annual Avg Monthly Avg Daily Annual Avg Monthly Avg DailyWeekday $302758 $25230 $1197 $42450 $3538 $168 $260308 $21692 $1029Saturday $44829 $3736 $862 $5018 $418 $97 $39811 $3318 $766Sunday $51616 $4301 $860 $4533 $378 $76 $47083 $3924 $785
Total $399203 $33267 $1094 $52001 $4333 $142 $347202 $28934 $951
Passengers per Revenue Hour
Subsidy per Passenger
Cost per Revenue Hour
Farebox Recovery
Weekday 108 $731 $9158 140Saturday 80 $1018 $9141 112Sunday 58 $1428 $9118 88
Total 98 $811 $9151 130
Passengers Revenue Hours Operating CostsPassenger
RevenueOperating Subsidy
Passengers per Revenue Hour
Subsidy per Passenger
Cost per Revenue Hour
Farebox Recovery
FY 2015 50342 4366 $371602 $52526 $319076 115 $634 $8512 141FY 2016 49494 4384 $388005 $59296 $328709 113 $664 $8851 153FY 2017 42798 4363 $399203 $52001 $347202 98 $811 $9151 130
Histo
ric Tr
ends
FY 20
161
7 DAT
A
Passengers Revenue Hours Revenue Miles
Operating Costs Passenger Revenue Operating Subsidy
39956
50422 50342 49494 42798
0
10000
20000
30000
40000
50000
60000
FY 2013 FY 2014 FY 2015 FY 2016 FY 2017
Passengers
3981
4144
4366 4384 4363
370038003900400041004200430044004500
FY 2013 FY 2014 FY 2015 FY 2016 FY 2017
Revenue Hours
$350499
$378792 $371602
$388005 $399203
$320000$330000$340000$350000$360000$370000$380000$390000$400000$410000
FY 2013 FY 2014 FY 2015 FY 2016 FY 2017
Operating Costs
100
122 115 113 98
00
20
40
60
80
100
120
140
FY 2013 FY 2014 FY 2015 FY 2016 FY 2017
Passengers per Revenue Hour
$760 $661 $634 $664
$811
$000$200$400$600$800
$1000$1200$1400
FY 2013 FY 2014 FY 2015 FY 2016 FY 2017
Subsidy per Passenger
$8805 $9142 $8512 $8851 $9151
$0
$50
$100
$150
$200
FY 2013 FY 2014 FY 2015 FY 2016 FY 2017
Cost per Revenue Hour
245Local Connector
Days of Service Wkdy Sa SuAvg Freq (Wkdy Peak) 60 min
Avg Freq (Wkdy Non-Peak) 60 minAvg Freq (Wked) 60 min
FY 2017 Farebox Recovery 15 transfer (to route) 13
Clipper usage 13
Annual Avg Monthly Avg Daily Annual Avg Monthly Avg Daily Annual Avg Monthly Avg DailyWeekday 41761 3480 165 3014 251 12 28706 2392 113 Saturday 4220 352 81 620 52 12 5778 482 111 Sunday 3785 315 63 715 60 12 6667 556 111
Total 49766 4147 136 4349 362 12 41152 3429 113
Annual Avg Monthly Avg Daily Annual Avg Monthly Avg Daily Annual Avg Monthly Avg DailyWeekday $271762 $22647 $1074 $44873 $3739 $177 $226889 $18907 $897Saturday $55697 $4641 $1071 $6217 $518 $120 $49480 $4123 $952Sunday $64137 $5345 $1069 $5878 $490 $98 $58259 $4855 $971
Total $391596 $32633 $1073 $56968 $4747 $156 $334628 $27886 $917
Passengers per Revenue Hour
Subsidy per Passenger
Cost per Revenue Hour
Farebox Recovery
Weekday 139 $543 $9016 165Saturday 68 $1173 $8988 112Sunday 53 $1539 $8970 92
Total 114 $672 $9004 145
Passengers Revenue Hours Operating CostsPassenger
RevenueOperating Subsidy
Passengers per Revenue Hour
Subsidy per Passenger
Cost per Revenue Hour
Farebox Recovery
FY 2015FY 2016 2184 227 $19695 $3137 $16558 96 $758 $8695 159FY 2017 49766 4349 $391596 $56968 $334628 114 $672 $9004 145
Histo
ric Tr
ends
FY 20
161
7 DAT
A
Passengers Revenue Hours Revenue Miles
Operating Costs Passenger Revenue Operating Subsidy
2184
49766
0
10000
20000
30000
40000
50000
60000
FY 2013 FY 2014 FY 2015 FY 2016 FY 2017
Passengers
227
4349
0
1000
2000
3000
4000
5000
FY 2013 FY 2014 FY 2015 FY 2016 FY 2017
Revenue Hours
$19695
$391596
$0
$100000
$200000
$300000
$400000
$500000
FY 2013 FY 2014 FY 2015 FY 2016 FY 2017
Operating Costs
96 114
00
20
40
60
80
100
120
140
FY 2013 FY 2014 FY 2015 FY 2016 FY 2017
Passengers per Revenue Hour
$758 $672
$000$200$400$600$800
$1000$1200$1400
FY 2013 FY 2014 FY 2015 FY 2016 FY 2017
Subsidy per Passenger
$8695 $9004
$0
$50
$100
$150
$200
FY 2013 FY 2014 FY 2015 FY 2016 FY 2017
Cost per Revenue Hour
251Local Connector
Days of Service Wkdy Sa SuAvg Freq (Wkdy Peak) 60 min
Avg Freq (Wkdy Non-Peak) 60 minAvg Freq (Wked) 60 min
FY 2017 Farebox Recovery 11 transfer (to route) 8
Clipper usage 8
Annual Avg Monthly Avg Daily Annual Avg Monthly Avg Daily Annual Avg Monthly Avg DailyWeekday 76675 6390 303 6754 563 27 95654 7971 378 Saturday 9952 829 191 1325 110 25 18630 1553 358 Sunday 8879 740 148 1528 127 25 21497 1791 358
Total 95506 7959 262 9607 801 26 135781 11315 372
Annual Avg Monthly Avg Daily Annual Avg Monthly Avg Daily Annual Avg Monthly Avg DailyWeekday $625542 $52129 $2472 $78006 $6501 $308 $547536 $45628 $2164Saturday $122485 $10207 $2355 $12104 $1009 $233 $110381 $9198 $2123Sunday $140992 $11749 $2350 $11713 $976 $195 $129279 $10773 $2155
Total $889019 $74085 $2436 $101823 $8485 $279 $787196 $65600 $2157
Passengers per Revenue Hour
Subsidy per Passenger
Cost per Revenue Hour
Farebox Recovery
Weekday 114 $714 $9262 125Saturday 75 $1109 $9246 99Sunday 58 $1456 $9225 83
Total 99 $824 $9254 115
Passengers Revenue Hours Operating CostsPassenger
RevenueOperating Subsidy
Passengers per Revenue Hour
Subsidy per Passenger
Cost per Revenue Hour
Farebox Recovery
FY 2015 97647 9172 $800242 $103081 $697161 106 $714 $8725 129FY 2016 98886 9226 $831623 $120959 $710664 107 $719 $9014 145FY 2017 95506 9607 $889019 $101823 $787196 99 $824 $9254 115
Histo
ric Tr
ends
FY 20
161
7 DAT
A
Passengers Revenue Hours Revenue Miles
Operating Costs Passenger Revenue Operating Subsidy
87073
97647 98886
95506
80000
85000
90000
95000
100000
FY 2013 FY 2014 FY 2015 FY 2016 FY 2017
Passengers
8322
9172 9226
9607
7500
8000
8500
9000
9500
10000
FY 2013 FY 2014 FY 2015 FY 2016 FY 2017
Revenue Hours
$772570
$800242
$831623
$889019
$700000
$750000
$800000
$850000
$900000
FY 2013 FY 2014 FY 2015 FY 2016 FY 2017
Operating Costs
105 106 107 99
00
20
40
60
80
100
120
140
FY 2013 FY 2014 FY 2015 FY 2016 FY 2017
Passengers per Revenue Hour
$797 $714 $719
$824
$000$200$400$600$800
$1000$1200$1400
FY 2013 FY 2014 FY 2015 FY 2016 FY 2017
Subsidy per Passenger
$9284 $8725 $9014 $9254
$0
$50
$100
$150
$200
FY 2013 FY 2014 FY 2015 FY 2016 FY 2017
Cost per Revenue Hour
257Local Connector
Days of Service WkdyAvg Freq (Wkdy Peak) 60 min
Avg Freq (Wkdy Non-Peak) 60 minAvg Freq (Wked) -
FY 2017 Farebox Recovery 12 transfer (to route) 6
Clipper usage 13
Annual Avg Monthly Avg Daily Annual Avg Monthly Avg Daily Annual Avg Monthly Avg DailyWeekday 69126 5761 273 7643 637 30 85748 7146 339 Saturday - - - - - - - - - Sunday - - - - - - - - -
Total 69126 5761 273 7643 637 30 85748 7146 339
Annual Avg Monthly Avg Daily Annual Avg Monthly Avg Daily Annual Avg Monthly Avg DailyWeekday $697953 $58163 $2759 $82621 $6885 $327 $615332 $51278 $2432Saturday $ - $ - $ - $ - $ - $ - $ - $ - $ -Sunday $ - $ - $ - $ - $ - $ - $ - $ - $ -
Total $697953 $58163 $2759 $82621 $6885 $327 $615332 $51278 $2432
Passengers per Revenue Hour
Subsidy per Passenger
Cost per Revenue Hour
Farebox Recovery
Weekday 90 $890 $9132 118Saturday - $ - $ - - Sunday - $ - $ - -
Total 90 $890 $9132 118
Passengers Revenue Hours Operating CostsPassenger
RevenueOperating Subsidy
Passengers per Revenue Hour
Subsidy per Passenger
Cost per Revenue Hour
Farebox Recovery
FY 2015 69984 6289 $546363 $73402 $472961 111 $676 $8687 134FY 2016 71429 6414 $575805 $83288 $492517 111 $690 $8977 145FY 2017 69126 7643 $697953 $82621 $615332 90 $890 $9132 118
Histo
ric Tr
ends
FY 20
161
7 DAT
A
Passengers Revenue Hours Revenue Miles
Operating Costs Passenger Revenue Operating Subsidy
35511
68515 69984 71429 69126
01000020000300004000050000600007000080000
FY 2013 FY 2014 FY 2015 FY 2016 FY 2017
Passengers
2909
5965 6289 6414 7643
0
2000
4000
6000
8000
10000
FY 2013 FY 2014 FY 2015 FY 2016 FY 2017
Revenue Hours
$263500
$555608 $546363 $575805
$697953
$0$100000$200000$300000$400000$500000$600000$700000$800000
FY 2013 FY 2014 FY 2015 FY 2016 FY 2017
Operating Costs
122 115 111 111
90
00
20
40
60
80
100
120
140
FY 2013 FY 2014 FY 2015 FY 2016 FY 2017
Passengers per Revenue Hour
$625 $721 $676 $690
$890
$000$200$400$600$800
$1000$1200$1400
FY 2013 FY 2014 FY 2015 FY 2016 FY 2017
Subsidy per Passenger
$9057 $9315 $8687 $8977 $9132
$0
$50
$100
$150
$200
FY 2013 FY 2014 FY 2015 FY 2016 FY 2017
Cost per Revenue Hour
Hdn ValleyYellow Bus
Days of Service School DaysAvg Freq (Wkdy Peak) 2 trips
Avg Freq (Wkdy Non-Peak) -Avg Freq (Wked) -
FY 2017 Farebox Recovery 26 transfer (to route) -
Clipper usage -
Annual Avg Monthly Avg Daily Annual Avg Monthly Avg Daily Annual Avg Monthly Avg DailyWeekday 9281 844 52 180 16 1 1638 149 9 Saturday - - - - - - - - - Sunday - - - - - - - - -
Total 9281 844 52 180 16 1 1638 149 9
Annual Avg Monthly Avg Daily Annual Avg Monthly Avg Daily Annual Avg Monthly Avg DailyWeekday $124763 $11342 $693 $32170 $2925 $179 $92593 $8418 $514Saturday $ - $ - $ - $ - $ - $ - $ - $ - $ -Sunday $ - $ - $ - $ - $ - $ - $ - $ - $ -
Total $124763 $11342 $693 $32170 $2925 $179 $92593 $8418 $514
Passengers per Revenue Hour
Subsidy per Passenger
Cost per Revenue Hour
Farebox Recovery
Weekday 516 $998 $69313 258Saturday - $ - $ - - Sunday - $ - $ - -
Total 516 $998 $69313 258
Passengers Revenue Hours Operating CostsPassenger
RevenueOperating Subsidy
Passengers per Revenue Hour
Subsidy per Passenger
Cost per Revenue Hour
Farebox Recovery
FY 2015FY 2016 8669 211 $140482 $25658 $114824 412 $1325 $66706 183FY 2017 9281 180 $124763 $32170 $92593 516 $998 $69313 258
Histo
ric Tr
ends
FY 20
161
7 DAT
A
Passengers Revenue Hours Revenue Miles
Operating Costs Passenger Revenue Operating Subsidy
8669 9281
0
2000
4000
6000
8000
10000
FY 2013 FY 2014 FY 2015 FY 2016 FY 2017
Passengers211
180
0
50
100
150
200
250
FY 2013 FY 2014 FY 2015 FY 2016 FY 2017
Revenue Hours$140482
$124763
$0$20000$40000$60000$80000
$100000$120000$140000$160000
FY 2013 FY 2014 FY 2015 FY 2016 FY 2017
Operating Costs
412 516
00
500
1000
1500
2000
FY 2013 FY 2014 FY 2015 FY 2016 FY 2017
Passengers per Revenue Hour
$1325
$998
$000
$200
$400
$600
$800
$1000
$1200
$1400
FY 2013 FY 2014 FY 2015 FY 2016 FY 2017
Subsidy per Passenger
$66706 $69313
$0$100$200$300$400$500$600$700$800
FY 2013 FY 2014 FY 2015 FY 2016 FY 2017
Cost per Revenue Hour
White HillYellow Bus
Days of Service School DaysAvg Freq (Wkdy Peak) 17 trips
Avg Freq (Wkdy Non-Peak) -Avg Freq (Wked) -
FY 2017 Farebox Recovery 60 transfer (to route) -
Clipper usage -
Annual Avg Monthly Avg Daily Annual Avg Monthly Avg Daily Annual Avg Monthly Avg DailyWeekday 127219 11565 707 1065 97 6 12096 1100 67 Saturday - - - - - - - - - Sunday - - - - - - - - -
Total 127219 11565 707 1065 97 6 12096 1100 67
Annual Avg Monthly Avg Daily Annual Avg Monthly Avg Daily Annual Avg Monthly Avg DailyWeekday $738585 $67144 $4103 $440896 $40081 $2449 $297689 $27063 $1654Saturday $ - $ - $ - $ - $ - $ - $ - $ - $ -Sunday $ - $ - $ - $ - $ - $ - $ - $ - $ -
Total $738585 $67144 $4103 $440896 $40081 $2449 $297689 $27063 $1654
Passengers per Revenue Hour
Subsidy per Passenger
Cost per Revenue Hour
Farebox Recovery
Weekday 1194 $234 $69325 597Saturday - $ - $ - - Sunday - $ - $ - -
Total 1194 $234 $69325 597
Passengers Revenue Hours Operating CostsPassenger
RevenueOperating Subsidy
Passengers per Revenue Hour
Subsidy per Passenger
Cost per Revenue Hour
Farebox Recovery
FY 2015FY 2016 129635 870 $579937 $385753 $194184 1491 $150 $66698 665FY 2017 127219 1065 $738585 $440896 $297689 1194 $234 $69325 597
Histo
ric Tr
ends
FY 20
161
7 DAT
A
Passengers Revenue Hours Revenue Miles
Operating Costs Passenger Revenue Operating Subsidy
129635 127219
0
20000
40000
60000
80000
100000
120000
140000
FY 2013 FY 2014 FY 2015 FY 2016 FY 2017
Passengers
870
1065
0
200
400
600
800
1000
1200
FY 2013 FY 2014 FY 2015 FY 2016 FY 2017
Revenue Hours
$579937
$738585
$0$100000$200000$300000$400000$500000$600000$700000$800000
FY 2013 FY 2014 FY 2015 FY 2016 FY 2017
Operating Costs
1491
1194
00200400600800
1000120014001600
FY 2013 FY 2014 FY 2015 FY 2016 FY 2017
Passengers per Revenue Hour
$150 $234
$000
$200
$400
$600
$800
$1000
$1200
$1400
FY 2013 FY 2014 FY 2015 FY 2016 FY 2017
Subsidy per Passenger$66698 $69325
$0$100$200$300$400$500$600$700$800
FY 2013 FY 2014 FY 2015 FY 2016 FY 2017
Cost per Revenue Hour
MARIN TRANSIT | 2018ndash2027 SHORT RANGE TRANSIT PLAN Chapter 4 Capital Plan
DRAFT 4-9
Table 4-7 Local Transit Bus Replacement Schedule
Fiscal Year (In-service)
Replacements
Total Cost
Local Share Vehicle Type Seating
Capacity Service(1)
FY 201718 10 $7710000 $1387800 40ft hybrid 39 LB
2 $1662000 $332404 35ft Electric 32 LB
FY 201819
1 $125000 $22500 24ft 20 SH
4 $1600000 $1094880 29ft XHF
(upgrade) 22 SG
FY 201920 10 $8940000 $1609200 60ft 63 LB
FY 202021 8 $1032000 $185760 24ft 20 SH
2 $850000 $153000 35ft XHF 37 MW
FY 202223
7 $5584578 $1005224 35ft hybrid 32 LB
2 $874182 $599281 29ft XHF
(upgrade) 22 SG
FY 202425 3 $1393227 $250781 35ft XHF 37 MW
FY 202526 2 $299093 $53837 24ft 20 SH
5 $2391706 $430507 35ft XHF 37 MW
FY 202627 - - - - - -
Notes (1) Service Types LB ndash Big Bus SH- Shuttle SG- Rural Stagecoach MW- Seasonal Muir Woods and School
Expansion Needs When considering service expansion vehicles are often a constraint on the amount of service that can be added Expansion vehicles are a lower priority in the regional capital plan and typically do not receive federal funds Local state or discretionary grants are required to expand fleets The capital plan does not include any expansion vehicles for the local fixed route program consistent with the current service plan
Marin Transit relies on three retired active vehicles to support operations Retired active vehicles are vehicles that are beyond their FTA-determined useful life that remain in service while their replacements are added the fleet The District intends to replace these as expansion vehicles if funding becomes available
Demand Response Vehicles
Marin Transit has 58 vehicles available for local and regional paratransit service To provide an adequate number of spare vehicles a maximum of about 46 vehicles in service Marin Transit owns 32 vehicles GGBHTD owns 14 and the contractor provides another 13 vehicles to support the operations Eleven of the 13 contractor vehicles will be replaced in early 2018 - five by the District and six by GGBHTD Two of the five replaced by the District will be replaced with smaller accessible vans These will be used for same day
Fixed-Route Passengers (incl Yellow Bus) by Month
July August September October November December January February March April May June
Prior Fiscal Year Passengers Current Fiscal Year PassengersPrior Fiscal Year Passengers Current Fiscal Year Passengers
0
80000
160000
240000
320000
244439
271284484271284
296637296637
2768532276853
252829252829
238010238010
219681219681
2097050505209705
277644277644
240773240773240773240773
284816284816
24935149492493512444392444392442 43999244439244244439439244439244244439999999244200
2600562602600 0000000260056
FISCAL YEAR
2018
Demand Response Passengers by Month
July August September October November December January February March April May June
Prior Fiscal Year Passengers Current Fiscal Year PassengersPrior Fiscal Year Passengers Current Fiscal Year Passengers
0
4000
8000
12000
16000
12 77312773
13631 1362813628 1356413564
1247712477
1206712067 1212412124118100011810
1364613646
1260912609
1359313593
12950129501277312 77312 77312 77312613131612 6133312 6133312613331277312773127731277312613
13 6311363113 631135641363113 613631311363113 6136313113564
Year-to-Date Ridership Trends
Item 3b
2
Average Systemwide Daily Passengers
Weekday Saturday Sunday
Prior Fiscal Year Average Daily Passengers Current Fiscal Year Average Daily PassengersPrior Fiscal Year Average Daily Passengers Current Fiscal Year Average Daily Passengers
0
3000
6000
9000
12000
11370113701109811098
7726772674407440
66576657
60556055
Productivity (paxhr) by Typology
1 Local T
runklin
e
2 Local B
asic
3 Local C
onnecto
r
5 R
ura
l
8 R
ecre
ational
9 D
em
and R
esponse
Prior Fiscal Year Productivity Current Fiscal Year ProductivityPrior Fiscal Year Productivity Current Fiscal Year Productivity
00
80
160
240
320
249249 252252
163163
14814 8148
9292 91918181
757 575
320320
275275
2323 2121
Monthly StatisticsMONTH
August
1 Local Trunkline Routes 35 36 71X
2 Local Basic Routes 17 22 23 23X 29 49
3 Local Connector Routes 219 228 233 245 251 257
5 Rural Routes 61 68
8 Recreational Routes 6666F
9 Demand Response Local Paratransit Novato Dial-A-Ride Rural Dial-A-Ride
Route Typologies
Item 3b
3
Fixed-Route Passengers (incl Yellow Bus) by Month
July August September October November December January February March April May June
Prior Fiscal Year Passengers Current Fiscal Year Passengers
0
80000
160000
240000
320000
244439244439
271284271284
296637296637
276853276853
252829252829
238010238010
219681219681209705209705
277644277644
240773240773
284816284816
249351249351244200244200
260056260056
282441282441
FISCAL YEAR
2018
Demand Response Passengers by Month
July August September October November December January February March April May June
Prior Fiscal Year Passengers Current Fiscal Year Passengers
0
4000
8000
12000
16000
1277312773
1363113631 1362813628 1356413564
12477124771206712067 1212412124
1181011810
1364613646
1260912609
1359313593
12950129501261312613
1356413564 1342713427
Year-to-Date Ridership Trends
Monthly Monitoring Report 11022017
Page 12Item 3b
2
Average Systemwide Daily Passengers
Weekday Saturday Sunday
Prior Fiscal Year Average Daily Passengers Current Fiscal Year Average Daily Passengers
0
3000
6000
9000
12000 11848118481161311613
73637363
67876787
6126612657395739
Productivity (paxhr) by Typology
1 L
ocal
Tru
nklin
e
2 L
ocal
Bas
ic
3 L
ocal
Con
nect
or
5 R
ural
8 R
ecre
atio
nal
9 D
eman
d R
espo
nse
Prior Fiscal Year Productivity Current Fiscal Year Productivity
00
80
160
240
320
278278 274274
174174 168168
9898 9797
7676 7676
304304
222222
2323 2222
Monthly StatisticsMONTH
September
1 Local Trunkline Routes 35 36 71X
2 Local Basic Routes 17 22 23 23X 29 49
3 Local Connector Routes 219 228 233 245 251 257
5 Rural Routes 61 68
8 Recreational Routes 6666F
9 Demand Response Local Paratransit Novato Dial-A-Ride Rural Dial-A-Ride
Route Typologies
Page 22Item 3b
3
Fixed-Route Passengers (incl Yellow Bus) by Month
July August September October November December January February March April May June
Prior Fiscal Year Passengers Current Fiscal Year Passengers
0
80000
160000
240000
320000
244439244439
271284271284
296637296637
276853276853
252829252829
238010238010
219681219681209705209705
277644277644
240773240773
284816284816
249351249351244200244200
260056260056
282441282441 282922282922
FISCAL YEAR
2018
Demand Response Passengers by Month
July August September October November December January February March April May June
Prior Fiscal Year Passengers Current Fiscal Year Passengers
0
4000
8000
12000
16000
1277312773
1363113631 1362813628 1356413564
12477124771206712067 1212412124
1181011810
1364613646
1260912609
1359313593
12950129501261312613
1356413564 13427134271373413734
Year-to-Date Ridership Trends
Monthly Monitoring Report 12082017
Page 12Item 3b
2
Average Systemwide Daily Passengers
Weekday Saturday Sunday
Prior Fiscal Year Average Daily Passengers Current Fiscal Year Average Daily Passengers
0
3000
6000
9000
120001125811258 1115111151
6043604364326432
4717471750675067
Productivity (paxhr) by Typology
1 L
ocal
Tru
nklin
e
2 L
ocal
Bas
ic
3 L
ocal
Con
nect
or
5 R
ural
8 R
ecre
atio
nal
9 D
eman
d R
espo
nse
Prior Fiscal Year Productivity Current Fiscal Year Productivity
00
70
140
210
280258258
270270
163163 161161
9696 9595
6363 7070
202202190190
2323 2121
Monthly StatisticsMONTH
October
1 Local Trunkline Routes 35 36 71X
2 Local Basic Routes 17 22 23 23X 29 49
3 Local Connector Routes 219 228 233 245 251 257
5 Rural Routes 61 68
8 Recreational Routes 6666F
9 Demand Response Local Paratransit Novato Dial-A-Ride Rural Dial-A-Ride
Route Typologies
Page 22Item 3b
3
- RFP - OampM for Fixed Route Service - Addendum 3 12-18-2017
- MV Fee Schedule
- Airporter Fee Schedule
- FY2017Performance
-
- System Performance Summary for FY 201617
-
- Fixed Route
- Yellow Bus
- Demand Response
- Other Services
-
- Performance Goals
- Ridership Trends
- FY 201718 Performance Outlook
-
- Attachment A Route Profiles
-
- Local Transit Bus Replacement Schedule
- August 2017 Monthly Monitoring Report
- September 2017 Monthly Monitoring Report
- October 2017 Monthly Monitoring Report
-
3
Table 1 Productivity and Subsidy Goals by Service Typology
Service Typology Routes Unlinked Passenger
Trips per Hour (at or above)
Subsidy per Passenger Trip
(at or below)
Local Trunkline 35 36 71X 25 $300
Regular Local 17 22 23 23X 29 49 20 $500
Local Connector 219 228 233 245 251 257 8 $800
Supplemental 113 115 117 119 125 139 145 151 154 20 per trip $300
Rural 61 68 4 $1200
Recreational 66 (Muir Woods Shuttle) 25 $300
Demand Response Local DAR Novato DAR Dillon BeachTomales DAR Point Reyes DAR
2 $3000
Using the productivity goals identified in Table 1 all the service typology groups except for Local Basic met their unlinked passengers per hour goal overall Twelve individual routes and two demand response services did not meet their productivity targets These include Routes 17 22 23 23X 29 49 71X 115 125 139 219 228 the Dillon BeachTomales Dial-A-Ride and the Point Reyes Dial-A-Ride In the previous fiscal year ten routes did not meet this target Figure 1 provides FY 201617 productivity levels and respective productivity goals by service typology and at the route level Route 35 was the most productive fixed-route service carrying an average of 286 passengers per hour Route 151 (Hamilton ndash San Jose MS ndash Novato HS - San Marin HS) was the best performing supplemental school route with 428 passengers per trip and met its subsidy target at $150 per passenger Route 228 had the highest growth in productivity (+291) due to the addition of weekday service in June 2016 In terms of cost effectiveness the Supplemental School Rural and Recreational services collectively met their goals In total 17 individual routes and two demand response services did not meet their subsidy target (Routes 17 22 23 23X 29 35 36 49 71X 219 228 233 251 257 115 125 139 Local Paratransit and Novato Dial-A-Ride) This is an increase from the 13 routes and three demand response services reported for FY 201516 Figure 2 provides a breakdown of FY 201617 subsidy levels and respective subsidy goals by service typology and at the individual route level Ridership Trends
In FY 201617 there was an overall 35 decline in fixed-route ridership compared to the previous year despite increases to service levels One of the major contributors to this decline was the delayed start of the 2017 Muir Woods Shuttle season that reduced the amount of service provided by 76 The overall decrease in ridership is relatively consistent with trends among bus operators nationwide and in the Bay Area According to the National Transit Database bus ridership declined 66 nationwide during FY 201617 compared to the prior year Within in the Bay Area peer agencies experienced ridership declines between 6 and 12 These include Golden Gate Transit Sonoma County Transit SamTrans and Napa VINE One of the biggest external factors that may have contributed to this trend is weather Rainfall in FY 201617 almost doubled over the prior year Weather can have a significant impact on travel decisions affecting whether a person makes a trip as well as how that person ultimately makes the trip It can also impact operations and cause detours major delays and canceled trips
4
In FY 201617 there was a 34 increase in the number of canceled trips Almost half of these canceled trips occurred in February due to heavy rains that caused flooding and school closures In June 2016 Marin Transit implemented a major service change One of the main goals of the service restructuring was to reduce the need to transfer by providing faster and more direct connections While this approach improves the system for riders it has implications in terms of how ridership is counted and on performance metrics The number of passengers is measured in terms of unlinked passenger trips Each time a person boards a bus is counted as a separate trip regardless of whether that person is transferring from another bus Reducing the amount of transfers needed to complete a riderrsquos journey reduces the number of unlinked trips Replacing trips that require a transfer with direct trips to destinations does not change the number of individual riders using the system which is defined as linked passenger trips In FY 201617 there was a 75 overall decrease in the number of transfers for passengers using cash to pay their original fare Some of this decline reflects the systemwide decrease in ridership The transfer ratio is defined as the number of boarding trips (unlinked passenger trips) divided by the number of originating trips (linked passenger trips) This ratio can be used to evaluate the impact of transfers on ridership independent of other factors In FY 201617 the overall transfer ratio dropped 38 from 136 to 131 When estimating linked passenger trips based on these ratios the number of individual Marin Transit passengers in FY 201617 remained relatively constant compared to last year Demand for Marin Access mobility management programs declined overall 47 from FY 201516 to FY 201617 Changes in ridership varied from program to program The largest decline was on Catch-A-Ride which experienced a 129 decrease in ridership Local paratransit and Novato Dial-A-Ride ridership may have been affected by many of the same external factors as fixed route transit particularly weather It is also possible that paratransit clients have started to shift some or all their trips to services that are not provided by Marin Transit These may include Non-Emergency Medical Transportation services arranged by managed care organizations Private transportation
providers hired under contract to institutions typically served by paratransit (such as adult day care centers) Trips taken on Uber or Lyft and Volunteer transportation services that may be supported by Marin Transit in some way but whose ridership is not
reported in the Districtrsquos performance statistics Furthermore staff attributed much of the previous growth in the Marin Access program to the Catch-A-Ride program This program experienced a 473 increase in ridership between FY 201314 and FY 201415 Towards the end of FY 201415 On the Move one of the largest taxi companies in Marin went out of business To this day service is limited during hours of peak demand and in certain service areas especially Novato Therefore FY 201617 ridership on Catch-A-Ride may reflect two factors These include a slowdown in attracting new customers and a reduction in service availability following On the Moversquos closure Table 2 summarizes the factors that can influence ridership numbers year-over-year and qualitatively evaluates their impact
5
Table 2 Factors Impacting Ridership Comparison
Factor FY 201516 FY 201617 Impact
Calendar
School Days 181 183 --
Weekdays 256 253
Weekends amp Holidays 110 111 --
Muir Woods Shuttle 113 104
Transfer Ratio (ratio of unlinked to linked trips) 136 131
Service Disruptions Canceled service (trips) 200 268
Major detourclosure (days) (1) 18 29
Rainfall (inches) 2928 5653
Gas Prices $298 $291 --
Unemployment Rate 32 32 -- Notes (1) Data on major detours and closure collected starting January 2016 Comparison includes the months of January through June FY 201718 Performance Outlook
In June 2016 Marin Transit implemented a major service change aimed in part to help underperforming routes meet established performance standards Staff has continued to monitor service performance and has made minor adjustments to improve on-time performance and cancel low-ridership trips In early 2018 staff is planning a comprehensive assessment of service performance since the June 2016 service changes This effort will include data from a recently completed onboard survey from April 2017 on passenger origins and destinations and a 100 passenger ridecheck The ridecheck will provide data on stop-level ridership activity for each route The assessment will use this analysis to recommend service changes to improve underperforming routes There are several unknowns that may also affect route performance primarily in terms of operating costs The District relies on its contractors to either lease or own property to store and maintain the vehicles needed to operate service For contractors that do not own suitable property finding and leasing these types of facilities in Marin County is challenging and expensive Recent surveys of current and potential service providers identified securing a facility as the most significant factor in determining their interest in bidding on Marin Transit services ability to provide the service and proposed pricing Marin Transit has been actively working to secure and develop its own operations and maintenance facility A District-owned facility will eliminate the need for potential service providers to lease property and lower operating costs It may also improve efficiency by reducing deadhead or non-revenue time when vehicles are traveling to and from the yard and further lower the Districtrsquos contract rates In late 2017 Marin Transit will release for bid over half of its fixed-route service and there are many uncertainties that may affect the outcome The tight labor market in Marin County and the greater Bay Area has made it difficult for service providers to hire and retain employees Potential contractors are required to secure property in a County with limited real estate opportunities If the District provides its own facility there will be more interest among potential bidders and more competitive rates
6
Table 3 System-wide Performance Statistics FY 201617 (unaudited)
Route Passengers Revenue
Hours Operating
Costs Passenger
Revenue Pass Trips Per
Rev Hr (Trip) Subsidy Per
Passenger Farebox
Recovery Fixed Route 2925522 178052 $20173419 $3550259 164 $568 176 Local Trunkline 1122188 44393 $6252940 $1263870 253 $445 202
35 658869 23052 $3234308 $729775 286 $380 226 36 342178 13636 $1901678 $369132 251 $448 194
71X 121141 7705 $1116954 $164963 157 $786 148 Local Basic 989500 65117 $7451946 $1221298 152 $630 164
17 247998 14757 $2076786 $319761 168 $708 154 22 215758 17553 $1619319 $273059 123 $624 169 23 199150 11065 $1508659 $246908 180 $634 164
23X 49255 3445 $473413 $57438 143 $845 121 29 40103 3707 $509475 $49634 108 $1147 97 49 237236 14590 $1264294 $274498 163 $417 217
Local Connector 378985 42396 $3873801 $461426 89 $900 119 219 50449 6392 $591224 $64101 79 $1045 108 228 71340 10042 $904806 $103912 71 $1123 115 233 42798 4363 $399203 $52001 98 $811 130 245 49766 4349 $391596 $56968 114 $672 145 251 95506 9607 $889019 $101823 99 $824 115 257 69126 7643 $697953 $82621 90 $890 118
Supplemental 179947 3963 $514380 $110503 454 (286) $224 215 113 16829 317 $42180 $12227 530 (315) $178 290 115 14021 637 $87534 $9504 220 (185) $557 109 117 34820 640 $81509 $17140 544 (284) $185 210 119 27161 374 $56273 $18859 727 (313) $138 335 125 13757 600 $72469 $11570 229 (193) $443 160 139 6414 253 $33182 $6635 253 (179) $414 200 145 16406 191 $25426 $7258 861 (372) $111 285 151 36801 594 $73842 $18463 620 (428) $150 250 154 13738 358 $41965 $8847 384 (255) $241 211
Recreational 122116 4316 $473726 $249748 283 $183 527 66 122116 4316 $473726 $249748 283 $183 527
Rural 112926 16172 $1422683 $122407 70 $1151 86 61 36328 5492 $475778 $39959 66 $1200 84 68 76598 10680 $946905 $82448 72 $1129 87
Partnership 19860 1696 $183943 $121007 117 $317 658 122 19860 1696 $183943 $121007 117 $317 658
Yellow Bus 136500 1245 $863348 $473066 1096 (448) $286 548 Hidden Valley 9281 180 $124763 $32170 516 (265) $998 258
White Hill 127219 1065 $738585 $440896 1194 (471) $234 597 Demand Response 124325 55191 $4571296 $236980 23 $3486 52
Local Paratransit 119673 53011 $4404928 $226387 23 $3492 51 Novato DAR 4057 1856 $150815 $8815 22 $3487 58
Dillon Beach DAR 488 260 $12511 $1356 19 $2285 108 Pt Reyes DAR 107 64 $3042 $422 17 $2447 139
Other Services 30547 - $511316 $41956 - $1537 82 Volunteer Driver(1) 16162 - $152714 - - $945 -
Catch-A-Ride(1) 14385 - $358602 $41956 - $2201 117 Total 3216894 234489 $26118572 $4302085 136 $678 165
Notes Values in red indicate performance that does not meet District
7
Figure 1 FY 201617 Passengers per Revenue Hour by Route
0
5
10
15
20
25
30
35
40
45
50Lo
cal T
runk
line T
otals 35 36 71
X
Loca
l Bas
ic To
tals 17 22 23 23X 29 49
Loca
l Con
necto
r Tot
als 219
228
233
245
251
257
Supp
lemen
tal T
otals 11
311
511
711
912
513
914
515
115
4
Recre
ation
al To
tals 66
Rura
l Tot
als 61 68
Dem
and R
espo
nse T
otals
Loca
l Par
atra
nsit
Nova
to D
ARDi
llon D
ARPt
Reye
s DAR
Pass
enge
rs p
er R
even
ue H
our
meets goalservice standard
does not meet goal
school routes show passengers per trip
8
Figure 2 FY 201617 Subsidy per Passenger by Route
$0
$5
$10
$15
$20
$25
$30
$35
$40
Loca
l Tru
nklin
e Tot
als 35 36 71X
Loca
l Bas
ic To
tals 17 22 23 23X 29 49
Loca
l Con
necto
r Tot
als 219
228
233
245
251
257
Supp
lemen
tal T
otals 11
311
511
711
912
513
914
515
115
4
Recre
ation
al To
tals 66
Rura
l Tot
als 61 68
Dem
and R
espo
nse T
otals
Loca
l Par
atra
nsit
Nova
to D
ARDi
llon D
ARPt
Reye
s DAR
Subs
idy p
er P
asse
nger
does not meet goal
service standard
meets goal
9
Attachment A Route Profiles 17 Sausalito ndash Marin City ndash Mill Valley ndash San Rafael 22 San Rafael Transit Center ndash San Anselmo ndash Marin City 23 Fairfax ndash San Anselmo ndash San Rafael ndash Canal 23X Manor ndash Fairfax ndash San Anselmo ndash San Rafael ndash Canal 29 Canal ndash San Rafael Transit Center ndash Larkspur ndash College of Marin ndash Marin General 35 Canal ndash San Rafael Transit Center ndash Marin Civic Center ndash Northgate Mall ndash Novato 36 Canal ndash San Rafael Transit Center ndash Marin City 49 Novato ndash Ignacio ndash Hamilton ndash Marin Civic Center ndash San Rafael Transit Center 61 West Marin Stagecoach (Sausalito ndash Marin City ndash Mill Valley ndash Stinson Beach ndash Bolinas) 66 Muir Woods Shuttle 68 West Marin Stagecoach (San Rafael Transit Center ndash San Anselmo ndash Pt Reyes Station ndash Inverness) 71X Novato ndash San Rafael Transit Center ndash Marin City ndash Sausalito 113 Redwood High School ndash Paradise Cay 115 Sausalito ndash Willow Creek ndash Marin City ndash Mill Valley ndash St Hilary 117 Neil Cummins Hall Middle School ndash E Corte Madera ndash Cove School 119 Tiburon ndash Belvedere ndash Redwood High School 122 San Rafael Transit Center ndash San Anselmo ndash College of Marin 125 Lagunitas ndash Sir Francis Drake HS ndash San Anselmo ndash San Rafael 139 Terra Linda High School ndash Lucas Valley 145 Terra Linda High School ndash San Rafael 151 Hamilton ndash Ignacio ndash San Jose Middle School ndash Novato High School ndash San Marin High School 154 Olive ndash San Marin High School ndash Sinaloa Middle School ndash Novato 219 Tiburon ndash Strawberry 228 San Rafael Transit Center ndash Larkspur ndash San Anselmo ndash Fairfax 233 Santa Venetia ndash Marin Civic Center ndash San Rafael Transit Center 245 San Rafael Transit Center ndash Northgate Mall ndash Kaiser ndash Smith Ranch Road 251 San Marin ndash Novato ndash Vintage Oaks ndash IVC ndash Ignacio ndash Hamilton 257 San Rafael ndash Northgate Mall ndash Kaiser ndash Marinwood ndash Hamilton ndash Ignacio ndash IVC Hdn Valley Ross Valley Yellow Bus (Fairfax ndash San Anselmo ndash Hidden Valley ES) White Hill Ross Valley Yellow Bus (San Anselmo ndash Sleepy Hollow ndash Fairfax ndash White Hill MS)
17Local Basic
Days of Service Wkdy Sa SuAvg Freq (Wkdy Peak) 30 min
Avg Freq (Wkdy Non-Peak) 60 minAvg Freq (Wked) 60 min
FY 2017 Farebox Recovery 15 transfer (to route) 25
Clipper usage 16
Annual Avg Monthly Avg Daily Annual Avg Monthly Avg Daily Annual Avg Monthly Avg DailyWeekday 194263 16189 768 11496 958 45 177386 14782 701 Saturday 27564 2297 530 1541 128 30 24621 2052 473 Sunday 26171 2181 436 1720 143 29 27378 2282 456
Total 247998 20667 679 14757 1230 40 229385 19115 628
Annual Avg Monthly Avg Daily Annual Avg Monthly Avg Daily Annual Avg Monthly Avg DailyWeekday $1617108 $134759 $6392 $247041 $20587 $976 $1370067 $114172 $5415Saturday $217536 $18128 $4183 $36894 $3075 $710 $180642 $15054 $3474Sunday $242142 $20179 $4036 $35826 $2986 $597 $206316 $17193 $3439
Total $2076786 $173066 $5690 $319761 $26647 $876 $1757025 $146419 $4814
Passengers per Revenue Hour
Subsidy per Passenger
Cost per Revenue Hour
Farebox Recovery
Weekday 169 $705 $14067 153Saturday 179 $655 $14117 170Sunday 152 $788 $14078 148
Total 168 $708 $14073 154
Passengers Revenue Hours Operating CostsPassenger
RevenueOperating Subsidy
Passengers per Revenue Hour
Subsidy per Passenger
Cost per Revenue Hour
Farebox Recovery
FY 2015 301136 15167 $2108822 $340410 $1768412 199 $587 $13904 161FY 2016 280486 15330 $2041616 $302337 $1739279 183 $620 $13317 148FY 2017 247998 14757 $2076786 $319761 $1757025 168 $708 $14073 154
Histo
ric Tr
ends
FY 20
161
7 DAT
A
Passengers Revenue Hours Revenue Miles
Operating Costs Passenger Revenue Operating Subsidy
277892 322826
301136 280486
247998
0
50000
100000
150000
200000
250000
300000
350000
FY 2013 FY 2014 FY 2015 FY 2016 FY 2017
Passengers
12402 14818 15167 15330 14757
0
5000
10000
15000
20000
FY 2013 FY 2014 FY 2015 FY 2016 FY 2017
Revenue Hours
$1717002
$2179526 $2108822 $2041616 $2076786
$0
$500000
$1000000
$1500000
$2000000
$2500000
FY 2013 FY 2014 FY 2015 FY 2016 FY 2017
Operating Costs
224 218 199 183 168
00
50
100
150
200
250
300
FY 2013 FY 2014 FY 2015 FY 2016 FY 2017
Passengers per Revenue Hour
$504 $558 $587 $620 $708
$000$200$400$600$800
$1000$1200$1400
FY 2013 FY 2014 FY 2015 FY 2016 FY 2017
Subsidy per Passenger
$13845 $14709 $13904 $13317 $14073
$0
$50
$100
$150
$200
FY 2013 FY 2014 FY 2015 FY 2016 FY 2017
Cost per Revenue Hour
22Local Basic
Days of Service Wkdy Sa SuAvg Freq (Wkdy Peak) 30 min
Avg Freq (Wkdy Non-Peak) 60 minAvg Freq (Wked) 60 min
FY 2017 Farebox Recovery 17 transfer (to route) 10
Clipper usage 11
Annual Avg Monthly Avg Daily Annual Avg Monthly Avg Daily Annual Avg Monthly Avg DailyWeekday 184918 15410 731 14244 1187 56 126319 10527 499 Saturday 16752 1396 322 1537 128 30 16232 1353 312 Sunday 14088 1174 235 1773 148 30 18729 1561 312
Total 215758 17980 591 17553 1463 48 161280 13440 442
Annual Avg Monthly Avg Daily Annual Avg Monthly Avg Daily Annual Avg Monthly Avg DailyWeekday $1312992 $109416 $5190 $232926 $19411 $921 $1080066 $90006 $4269Saturday $142334 $11861 $2737 $21235 $1770 $408 $121099 $10092 $2329Sunday $163993 $13666 $2733 $18898 $1575 $315 $145095 $12091 $2418
Total $1619319 $134943 $4436 $273059 $22755 $748 $1346260 $112188 $3688
Passengers per Revenue Hour
Subsidy per Passenger
Cost per Revenue Hour
Farebox Recovery
Weekday 130 $584 $9218 177Saturday 109 $723 $9263 149Sunday 79 $1030 $9251 115
Total 123 $624 $9225 169
Passengers Revenue Hours Operating CostsPassenger
RevenueOperating Subsidy
Passengers per Revenue Hour
Subsidy per Passenger
Cost per Revenue Hour
Farebox Recovery
FY 2015 249148 14777 $2054433 $292215 $1762218 169 $707 $13903 142FY 2016 243635 14872 $1971172 $259453 $1711719 164 $703 $13255 132FY 2017 215758 17553 $1619319 $273059 $1346260 123 $624 $9225 169
Histo
ric Tr
ends
FY 20
161
7 DAT
A
Passengers Revenue Hours Revenue Miles
Operating Costs Passenger Revenue Operating Subsidy
366301
281761 249148 243635
215758
050000
100000150000200000250000300000350000400000
FY 2013 FY 2014 FY 2015 FY 2016 FY 2017
Passengers18061
15083 14777 14872 17553
0
5000
10000
15000
20000
FY 2013 FY 2014 FY 2015 FY 2016 FY 2017
Revenue Hours$2498169
$2220145 $2054433 $1971172
$1619319
$0
$500000
$1000000
$1500000
$2000000
$2500000
$3000000
FY 2013 FY 2014 FY 2015 FY 2016 FY 2017
Operating Costs
203 187 169 164
123
00
50
100
150
200
250
300
FY 2013 FY 2014 FY 2015 FY 2016 FY 2017
Passengers per Revenue Hour
$567 $667 $707 $703 $624
$000$200$400$600$800
$1000$1200$1400
FY 2013 FY 2014 FY 2015 FY 2016 FY 2017
Subsidy per Passenger
$13832 $14720 $13903 $13255
$9225
$0
$50
$100
$150
$200
FY 2013 FY 2014 FY 2015 FY 2016 FY 2017
Cost per Revenue Hour
23Local Basic
Days of Service Wkdy Sa SuAvg Freq (Wkdy Peak) 60 min
Avg Freq (Wkdy Non-Peak) 60 minAvg Freq (Wked) 60 min
FY 2017 Farebox Recovery 16 transfer (to route) 24
Clipper usage 12
Annual Avg Monthly Avg Daily Annual Avg Monthly Avg Daily Annual Avg Monthly Avg DailyWeekday 145707 12142 576 8042 670 32 64277 5356 254 Saturday 28305 2359 544 1434 120 28 11466 956 221 Sunday 25138 2095 419 1589 132 26 12750 1062 212
Total 199150 16596 546 11065 922 30 88492 7374 242
Annual Avg Monthly Avg Daily Annual Avg Monthly Avg Daily Annual Avg Monthly Avg DailyWeekday $1096892 $91408 $4336 $179427 $14952 $709 $917465 $76455 $3626Saturday $195468 $16289 $3759 $35226 $2936 $677 $160242 $13354 $3082Sunday $216299 $18025 $3605 $32255 $2688 $538 $184044 $15337 $3067
Total $1508659 $125722 $4133 $246908 $20576 $676 $1261751 $105146 $3457
Passengers per Revenue Hour
Subsidy per Passenger
Cost per Revenue Hour
Farebox Recovery
Weekday 181 $630 $13640 164Saturday 197 $566 $13629 180Sunday 158 $732 $13612 149
Total 180 $634 $13635 164
Passengers Revenue Hours Operating CostsPassenger
RevenueOperating Subsidy
Passengers per Revenue Hour
Subsidy per Passenger
Cost per Revenue Hour
Farebox Recovery
FY 2015 354706 14168 $1969650 $381111 $1588539 250 $448 $13902 193FY 2016 268218 13154 $1703216 $308138 $1395078 204 $520 $12948 181FY 2017 199150 11065 $1508659 $246908 $1261751 180 $634 $13635 164
Histo
ric Tr
ends
FY 20
161
7 DAT
A
Passengers Revenue Hours Revenue Miles
Operating Costs Passenger Revenue Operating Subsidy
212064
339118 354706
268218
199150
050000
100000150000200000250000300000350000400000
FY 2013 FY 2014 FY 2015 FY 2016 FY 2017
Passengers
8716
14034 14168 13154
11065
02000400060008000
10000120001400016000
FY 2013 FY 2014 FY 2015 FY 2016 FY 2017
Revenue Hours
$1202564
$2061985 $1969650 $1703216
$1508659
$0
$500000
$1000000
$1500000
$2000000
$2500000
FY 2013 FY 2014 FY 2015 FY 2016 FY 2017
Operating Costs
243 242 250
204 180
00
50
100
150
200
250
300
FY 2013 FY 2014 FY 2015 FY 2016 FY 2017
Passengers per Revenue Hour
$455 $494 $448 $520 $634
$000$200$400$600$800
$1000$1200$1400
FY 2013 FY 2014 FY 2015 FY 2016 FY 2017
Subsidy per Passenger
$13797 $14692 $13902 $12948 $13635
$0
$50
$100
$150
$200
FY 2013 FY 2014 FY 2015 FY 2016 FY 2017
Cost per Revenue Hour
23XLocal Basic
Days of Service WkdyAvg Freq (Wkdy Peak) 60 min
Avg Freq (Wkdy Non-Peak) -Avg Freq (Wked) -
FY 2017 Farebox Recovery 12 transfer (to route) 31
Clipper usage 12
Annual Avg Monthly Avg Daily Annual Avg Monthly Avg Daily Annual Avg Monthly Avg DailyWeekday 49255 4105 195 3445 287 14 32408 2701 128 Saturday - - - - - - - - - Sunday - - - - - - - - -
Total 49255 4105 195 3445 287 14 32408 2701 128
Annual Avg Monthly Avg Daily Annual Avg Monthly Avg Daily Annual Avg Monthly Avg DailyWeekday $473413 $39451 $1871 $57438 $4787 $227 $415975 $34665 $1644Saturday $ - $ - $ - $ - $ - $ - $ - $ - $ -Sunday $ - $ - $ - $ - $ - $ - $ - $ - $ -
Total $473413 $39451 $1871 $57438 $4787 $227 $415975 $34665 $1644
Passengers per Revenue Hour
Subsidy per Passenger
Cost per Revenue Hour
Farebox Recovery
Weekday 143 $845 $13744 121Saturday - $ - $ - - Sunday - $ - $ - -
Total 143 $845 $13744 121
Passengers Revenue Hours Operating CostsPassenger
RevenueOperating Subsidy
Passengers per Revenue Hour
Subsidy per Passenger
Cost per Revenue Hour
Farebox Recovery
FY 2015FY 2016 2548 189 $23303 $2272 $21031 135 $825 $12330 97FY 2017 49255 3445 $473413 $57438 $415975 143 $845 $13744 121
Histo
ric Tr
ends
FY 20
161
7 DAT
A
Passengers Revenue Hours Revenue Miles
Operating Costs Passenger Revenue Operating Subsidy
2548
49255
0
10000
20000
30000
40000
50000
60000
FY 2013 FY 2014 FY 2015 FY 2016 FY 2017
Passengers
189
3445
0500
1000150020002500300035004000
FY 2013 FY 2014 FY 2015 FY 2016 FY 2017
Revenue Hours
$23303
$473413
$0
$100000
$200000
$300000
$400000
$500000
FY 2013 FY 2014 FY 2015 FY 2016 FY 2017
Operating Costs
135 143
00
50
100
150
200
250
300
FY 2013 FY 2014 FY 2015 FY 2016 FY 2017
Passengers per Revenue Hour
$825 $845
$000$200$400$600$800
$1000$1200$1400
FY 2013 FY 2014 FY 2015 FY 2016 FY 2017
Subsidy per Passenger
$12330 $13744
$0
$50
$100
$150
$200
FY 2013 FY 2014 FY 2015 FY 2016 FY 2017
Cost per Revenue Hour
29Local Basic
Days of Service WkdyAvg Freq (Wkdy Peak) 60 min
Avg Freq (Wkdy Non-Peak) -Avg Freq (Wked) -
FY 2017 Farebox Recovery 10 transfer (to route) 26
Clipper usage 12
Annual Avg Monthly Avg Daily Annual Avg Monthly Avg Daily Annual Avg Monthly Avg DailyWeekday 40103 3342 159 3707 309 15 37048 3087 146 Saturday - - - - - - - - - Sunday - - - - - - - - -
Total 40103 3342 159 3707 309 15 37048 3087 146
Annual Avg Monthly Avg Daily Annual Avg Monthly Avg Daily Annual Avg Monthly Avg DailyWeekday $509475 $42456 $2014 $49634 $4136 $196 $459841 $38320 $1818Saturday $ - $ - $ - $ - $ - $ - $ - $ - $ -Sunday $ - $ - $ - $ - $ - $ - $ - $ - $ -
Total $509475 $42456 $2014 $49634 $4136 $196 $459841 $38320 $1818
Passengers per Revenue Hour
Subsidy per Passenger
Cost per Revenue Hour
Farebox Recovery
Weekday 108 $1147 $13745 97Saturday - $ - $ - - Sunday - $ - $ - -
Total 108 $1147 $13745 97
Passengers Revenue Hours Operating CostsPassenger
RevenueOperating Subsidy
Passengers per Revenue Hour
Subsidy per Passenger
Cost per Revenue Hour
Farebox Recovery
FY 2015 203632 10795 $1500887 $232286 $1268601 189 $623 $13904 155FY 2016 181786 10502 $1378760 $219997 $1158763 173 $637 $13129 160FY 2017 40103 3707 $509475 $49634 $459841 108 $1147 $13745 97
Histo
ric Tr
ends
FY 20
161
7 DAT
A
Passengers Revenue Hours Revenue Miles
Operating Costs Passenger Revenue Operating Subsidy
238310 225998 203632
181786
40103
0
50000
100000
150000
200000
250000
300000
FY 2013 FY 2014 FY 2015 FY 2016 FY 2017
Passengers12248
10927 10795 10502
3707
0
2000
4000
6000
8000
10000
12000
14000
FY 2013 FY 2014 FY 2015 FY 2016 FY 2017
Revenue Hours$1692980 $1607795 $1500887
$1378760
$509475
$0
$500000
$1000000
$1500000
$2000000
FY 2013 FY 2014 FY 2015 FY 2016 FY 2017
Operating Costs
195 207 189 173
108
00
50
100
150
200
250
300
FY 2013 FY 2014 FY 2015 FY 2016 FY 2017
Passengers per Revenue Hour
$595 $593 $623 $637
$1147
$000$200$400$600$800
$1000$1200$1400
FY 2013 FY 2014 FY 2015 FY 2016 FY 2017
Subsidy per Passenger
$13822 $14714 $13904 $13129 $13745
$0
$50
$100
$150
$200
FY 2013 FY 2014 FY 2015 FY 2016 FY 2017
Cost per Revenue Hour
35Local Trunkline
Days of Service Wkdy Sa SuAvg Freq (Wkdy Peak) 30 min
Avg Freq (Wkdy Non-Peak) 30 minAvg Freq (Wked) 30 min
FY 2017 Farebox Recovery 23 transfer (to route) 17
Clipper usage 8
Annual Avg Monthly Avg Daily Annual Avg Monthly Avg Daily Annual Avg Monthly Avg DailyWeekday 492328 41027 1946 16909 1409 67 224421 18702 887 Saturday 84453 7038 1624 2860 238 55 43336 3611 833 Sunday 82088 6841 1368 3284 274 55 50021 4168 834
Total 658869 54906 1805 23052 1921 63 317778 26482 871
Annual Avg Monthly Avg Daily Annual Avg Monthly Avg Daily Annual Avg Monthly Avg DailyWeekday $2367217 $197268 $9357 $533190 $44433 $2107 $1834027 $152836 $7249Saturday $403729 $33644 $7764 $97853 $8154 $1882 $305876 $25490 $5882Sunday $463362 $38614 $7723 $98732 $8228 $1646 $364630 $30386 $6077
Total $3234308 $269526 $8861 $729775 $60815 $1999 $2504533 $208711 $6862
Passengers per Revenue Hour
Subsidy per Passenger
Cost per Revenue Hour
Farebox Recovery
Weekday 291 $373 $14000 225Saturday 295 $362 $14118 242Sunday 250 $444 $14111 213
Total 286 $380 $14030 226
Passengers Revenue Hours Operating CostsPassenger
RevenueOperating Subsidy
Passengers per Revenue Hour
Subsidy per Passenger
Cost per Revenue Hour
Farebox Recovery
FY 2015 476489 8544 $1187694 $462204 $725490 558 $152 $13901 389FY 2016 472718 9300 $1202986 $544109 $658877 508 $139 $12935 452FY 2017 658869 23052 $3234308 $729775 $2504533 286 $380 $14030 226
Histo
ric Tr
ends
FY 20
161
7 DAT
A
Passengers Revenue Hours Revenue Miles
Operating Costs Passenger Revenue Operating Subsidy
669860 574669
476489 472718
658869
0100000200000300000400000500000600000700000800000
FY 2013 FY 2014 FY 2015 FY 2016 FY 2017
Passengers
9755 8644 8544 9300
23052
0
5000
10000
15000
20000
25000
FY 2013 FY 2014 FY 2015 FY 2016 FY 2017
Revenue Hours
$1345711 $1271601 $1187694 $1202986
$3234308
$0
$500000
$1000000
$1500000
$2000000
$2500000
$3000000
$3500000
FY 2013 FY 2014 FY 2015 FY 2016 FY 2017
Operating Costs
687 665 558
508
286
00100200300400500600700800
FY 2013 FY 2014 FY 2015 FY 2016 FY 2017
Passengers per Revenue Hour
$097 $120 $152 $139
$380
$000
$200
$400
$600
$800
$1000
FY 2013 FY 2014 FY 2015 FY 2016 FY 2017
Subsidy per Passenger
$13796 $14710 $13901 $12935 $14030
$0
$50
$100
$150
$200
FY 2013 FY 2014 FY 2015 FY 2016 FY 2017
Cost per Revenue Hour
36Local Trunkline
Days of Service Wkdy Sa SuAvg Freq (Wkdy Peak) 30 min
Avg Freq (Wkdy Non-Peak) 30 minAvg Freq (Wked) 30 min
FY 2017 Farebox Recovery 19 transfer (to route) 18
Clipper usage 6
Annual Avg Monthly Avg Daily Annual Avg Monthly Avg Daily Annual Avg Monthly Avg DailyWeekday 278217 23185 1100 9938 828 39 133318 11110 527 Saturday 33779 2815 650 1715 143 33 24259 2022 467 Sunday 30182 2515 503 1983 165 33 28002 2334 467
Total 342178 28515 937 13636 1136 37 185579 15465 508
Annual Avg Monthly Avg Daily Annual Avg Monthly Avg Daily Annual Avg Monthly Avg DailyWeekday $1384291 $115358 $5472 $290481 $24207 $1148 $1093810 $91151 $4323Saturday $240062 $20005 $4617 $40774 $3398 $784 $199288 $16607 $3832Sunday $277325 $23110 $4622 $37877 $3156 $631 $239448 $19954 $3991
Total $1901678 $158473 $5210 $369132 $30761 $1011 $1532546 $127712 $4199
Passengers per Revenue Hour
Subsidy per Passenger
Cost per Revenue Hour
Farebox Recovery
Weekday 280 $393 $13930 210Saturday 197 $590 $13999 170Sunday 152 $793 $13984 137
Total 251 $448 $13946 194
Passengers Revenue Hours Operating CostsPassenger
RevenueOperating Subsidy
Passengers per Revenue Hour
Subsidy per Passenger
Cost per Revenue Hour
Farebox Recovery
FY 2015 109347 2894 $402355 $110471 $291884 378 $267 $13905 275FY 2016 119593 3462 $457211 $129715 $327496 345 $274 $13205 284FY 2017 342178 13636 $1901678 $369132 $1532546 251 $448 $13946 194
Histo
ric Tr
ends
FY 20
161
7 DAT
A
Passengers Revenue Hours Revenue Miles
Operating Costs Passenger Revenue Operating Subsidy
106988 103673 109347 119593
342178
050000
100000150000200000250000300000350000400000
FY 2013 FY 2014 FY 2015 FY 2016 FY 2017
Passengers
2878 2822 2894 3462
13636
02000400060008000
10000120001400016000
FY 2013 FY 2014 FY 2015 FY 2016 FY 2017
Revenue Hours
$398410 $415238 $402355 $457211
$1901678
$0
$500000
$1000000
$1500000
$2000000
FY 2013 FY 2014 FY 2015 FY 2016 FY 2017
Operating Costs
372 367 378 345 251
00100200300400500600700800
FY 2013 FY 2014 FY 2015 FY 2016 FY 2017
Passengers per Revenue Hour
$265 $293 $267 $274
$448
$000
$200
$400
$600
$800
$1000
FY 2013 FY 2014 FY 2015 FY 2016 FY 2017
Subsidy per Passenger
$13842 $14713 $13905 $13205 $13946
$0
$50
$100
$150
$200
FY 2013 FY 2014 FY 2015 FY 2016 FY 2017
Cost per Revenue Hour
49Local Basic
Days of Service Wkdy Sa SuAvg Freq (Wkdy Peak) 30 min
Avg Freq (Wkdy Non-Peak) 60 minAvg Freq (Wked) 60 min
FY 2017 Farebox Recovery 22 transfer (to route) 9
Clipper usage 11
Annual Avg Monthly Avg Daily Annual Avg Monthly Avg Daily Annual Avg Monthly Avg DailyWeekday 201564 16797 797 11313 943 45 139528 11627 551 Saturday 18489 1541 356 1517 126 29 18370 1531 353 Sunday 17183 1432 286 1761 147 29 21402 1784 357
Total 237236 19770 650 14590 1216 40 179300 14942 491
Annual Avg Monthly Avg Daily Annual Avg Monthly Avg Daily Annual Avg Monthly Avg DailyWeekday $978903 $81575 $3869 $230134 $19178 $910 $748769 $62397 $2960Saturday $131907 $10992 $2537 $22520 $1877 $433 $109387 $9116 $2104Sunday $153484 $12790 $2558 $21844 $1820 $364 $131640 $10970 $2194
Total $1264294 $105358 $3464 $274498 $22875 $752 $989796 $82483 $2712
Passengers per Revenue Hour
Subsidy per Passenger
Cost per Revenue Hour
Farebox Recovery
Weekday 178 $371 $8653 235Saturday 122 $592 $8698 171Sunday 98 $766 $8718 142
Total 163 $417 $8665 217
Passengers Revenue Hours Operating CostsPassenger
RevenueOperating Subsidy
Passengers per Revenue Hour
Subsidy per Passenger
Cost per Revenue Hour
Farebox Recovery
FY 2015 144262 6349 $882801 $158088 $724713 227 $502 $13905 179FY 2016 147480 6795 $900804 $146345 $754459 217 $512 $13257 162FY 2017 237236 14590 $1264294 $274498 $989796 163 $417 $8665 217
Histo
ric Tr
ends
FY 20
161
7 DAT
A
Passengers Revenue Hours Revenue Miles
Operating Costs Passenger Revenue Operating Subsidy
230943
152259 144262 147480
237236
0
50000
100000
150000
200000
250000
FY 2013 FY 2014 FY 2015 FY 2016 FY 2017
Passengers
9814
6440 6349 6795
14590
02000400060008000
10000120001400016000
FY 2013 FY 2014 FY 2015 FY 2016 FY 2017
Revenue Hours$1362499
$948702 $882801 $900804
$1264294
$0$200000$400000$600000$800000
$1000000$1200000$1400000$1600000
FY 2013 FY 2014 FY 2015 FY 2016 FY 2017
Operating Costs
235 236 227 217
163
00
50
100
150
200
250
300
FY 2013 FY 2014 FY 2015 FY 2016 FY 2017
Passengers per Revenue Hour
$477 $507 $502 $512 $417
$000$200$400$600$800
$1000$1200$1400
FY 2013 FY 2014 FY 2015 FY 2016 FY 2017
Subsidy per Passenger
$13884 $14732 $13905 $13257
$8665
$0
$50
$100
$150
$200
FY 2013 FY 2014 FY 2015 FY 2016 FY 2017
Cost per Revenue Hour
61Rural
Days of Service Wkdy Sa SuAvg Freq (Wkdy Peak) 8 trips
Avg Freq (Wkdy Non-Peak) -Avg Freq (Wked) 16 trips
FY 2017 Farebox Recovery 8 transfer (to route) 7
Clipper usage 11
Annual Avg Monthly Avg Daily Annual Avg Monthly Avg Daily Annual Avg Monthly Avg DailyWeekday 17166 1431 68 2631 219 10 45398 3783 181 Saturday 9922 827 198 1319 110 26 20810 1734 416 Sunday 9240 770 144 1542 129 24 24457 2038 382
Total 36328 3027 100 5492 458 15 90665 7555 248
Annual Avg Monthly Avg Daily Annual Avg Monthly Avg Daily Annual Avg Monthly Avg DailyWeekday $229650 $19138 $915 $17691 $1474 $70 $211959 $17663 $844Saturday $113378 $9448 $2268 $11622 $969 $232 $101756 $8480 $2035Sunday $132750 $11063 $2074 $10646 $887 $166 $122104 $10175 $1908
Total $475778 $39648 $1304 $39959 $3330 $109 $435819 $36318 $1194
Passengers per Revenue Hour
Subsidy per Passenger
Cost per Revenue Hour
Farebox Recovery
Weekday 65 $1235 $8730 77Saturday 75 $1026 $8598 103Sunday 60 $1321 $8607 80
Total 66 $1200 $8663 84
Passengers Revenue Hours Operating CostsPassenger
RevenueOperating Subsidy
Passengers per Revenue Hour
Subsidy per Passenger
Cost per Revenue Hour
Farebox Recovery
FY 2015 39478 5379 $417539 $46324 $371215 73 $940 $7762 111FY 2016 37276 5475 $408987 $48421 $360566 68 $967 $7470 118FY 2017 36328 5492 $475778 $39959 $435819 66 $1200 $8663 84
Histo
ric Tr
ends
FY 20
161
7 DAT
A
Passengers Revenue Hours Revenue Miles
Operating Costs Passenger Revenue Operating Subsidy
30642 33386
39478 37276 36328
0
10000
20000
30000
40000
50000
FY 2013 FY 2014 FY 2015 FY 2016 FY 2017
Passengers
5388
5056
5379 5475 5492
480049005000510052005300540055005600
FY 2013 FY 2014 FY 2015 FY 2016 FY 2017
Revenue Hours
$388827 $390358 $417539 $408987 $475778
$0
$100000
$200000
$300000
$400000
$500000
FY 2013 FY 2014 FY 2015 FY 2016 FY 2017
Operating Costs
57 66
73 68 66
00
20
40
60
80
100
FY 2013 FY 2014 FY 2015 FY 2016 FY 2017
Passengers per Revenue Hour
$1136 $1045
$940 $967
$1200
$000$200$400$600$800
$1000$1200$1400
FY 2013 FY 2014 FY 2015 FY 2016 FY 2017
Subsidy per Passenger
$7216 $7721 $7762 $7470 $8663
$0
$50
$100
$150
$200
FY 2013 FY 2014 FY 2015 FY 2016 FY 2017
Cost per Revenue Hour
66Recreational
Days of Service Wkdy Sa SuAvg Freq (Wkdy Peak) 30 min
Avg Freq (Wkdy Non-Peak) 30 minAvg Freq (Wked) 10-20 min
FY 2017 Farebox Recovery 53 transfer (to route) 0
Clipper usage 0
Annual Avg Monthly Avg Daily Annual Avg Monthly Avg Daily Annual Avg Monthly Avg DailyWeekday 21940 7313 549 804 268 20 10735 3578 268 Saturday 43799 7300 1752 1473 245 59 20480 3413 819 Sunday 56377 6264 1446 2040 227 52 28212 3135 723
Total 122116 13568 1174 4316 480 42 59428 6603 571
Annual Avg Monthly Avg Daily Annual Avg Monthly Avg Daily Annual Avg Monthly Avg DailyWeekday $104033 $34678 $2601 $37751 $12584 $944 $66282 $22094 $1657Saturday $152661 $25444 $6106 $79948 $13325 $3198 $72713 $12119 $2909Sunday $217032 $24115 $5565 $132049 $14672 $3386 $84983 $9443 $2179
Total $473726 $52636 $4555 $249748 $27750 $2401 $223978 $24886 $2154
Passengers per Revenue Hour
Subsidy per Passenger
Cost per Revenue Hour
Farebox Recovery
Weekday 273 $302 $12944 363Saturday 297 $166 $10367 524Sunday 276 $151 $10638 608
Total 283 $183 $10975 527
Passengers Revenue Hours Operating CostsPassenger
RevenueOperating Subsidy
Passengers per Revenue Hour
Subsidy per Passenger
Cost per Revenue Hour
Farebox Recovery
FY 2015 103930 3866 $477523 $209514 $268009 269 $258 $12352 439FY 2016 116942 4673 $531384 $245779 $285605 250 $244 $11373 463FY 2017 122116 4316 $473726 $249748 $223978 283 $183 $10975 527
Histo
ric Tr
ends
FY 20
161
7 DAT
A
Passengers Revenue Hours Revenue Miles
Operating Costs Passenger Revenue Operating Subsidy
62624
103052 103930 116942 122116
0
20000
40000
60000
80000
100000
120000
140000
FY 2013 FY 2014 FY 2015 FY 2016 FY 2017
Passengers
2941
3841 3866
4673 4316
0
1000
2000
3000
4000
5000
FY 2013 FY 2014 FY 2015 FY 2016 FY 2017
Revenue Hours
$330076
$538014 $477523
$531384 $473726
$0
$100000
$200000
$300000
$400000
$500000
$600000
FY 2013 FY 2014 FY 2015 FY 2016 FY 2017
Operating Costs
213
268 269 250
283
00
50
100
150
200
250
300
FY 2013 FY 2014 FY 2015 FY 2016 FY 2017
Passengers per Revenue Hour
$360 $322
$258 $244 $183
$000
$100
$200
$300
$400
$500
FY 2013 FY 2014 FY 2015 FY 2016 FY 2017
Subsidy per Passenger
$11223
$14007 $12352 $11373 $10975
$0
$50
$100
$150
$200
FY 2013 FY 2014 FY 2015 FY 2016 FY 2017
Cost per Revenue Hour
68Rural
Days of Service Wkdy Sa SuAvg Freq (Wkdy Peak) 60 min
Avg Freq (Wkdy Non-Peak) 120 minAvg Freq (Wked) 60-120 min
FY 2017 Farebox Recovery 9 transfer (to route) 13
Clipper usage 12
Annual Avg Monthly Avg Daily Annual Avg Monthly Avg Daily Annual Avg Monthly Avg DailyWeekday 59903 4992 239 7282 607 29 133167 11097 531 Saturday 8410 701 168 1492 124 30 27123 2260 542 Sunday 8285 690 129 1907 159 30 34638 2887 541
Total 76598 6383 210 10680 890 29 194928 16244 534
Annual Avg Monthly Avg Daily Annual Avg Monthly Avg Daily Annual Avg Monthly Avg DailyWeekday $645737 $53811 $2573 $64332 $5361 $256 $581405 $48450 $2316Saturday $131882 $10990 $2638 $9260 $772 $185 $122622 $10219 $2452Sunday $169286 $14107 $2645 $8856 $738 $138 $160430 $13369 $2507
Total $946905 $78909 $2594 $82448 $6871 $226 $864457 $72038 $2368
Passengers per Revenue Hour
Subsidy per Passenger
Cost per Revenue Hour
Farebox Recovery
Weekday 82 $971 $8868 100Saturday 56 $1458 $8841 70Sunday 43 $1936 $8879 52
Total 72 $1129 $8866 87
Passengers Revenue Hours Operating CostsPassenger
RevenueOperating Subsidy
Passengers per Revenue Hour
Subsidy per Passenger
Cost per Revenue Hour
Farebox Recovery
FY 2015 65866 10589 $848305 $80846 $767459 62 $1165 $8011 95FY 2016 70292 10611 $811978 $88808 $723170 66 $1029 $7652 109FY 2017 76598 10680 $946905 $82448 $864457 72 $1129 $8866 87
Histo
ric Tr
ends
FY 20
161
7 DAT
A
Passengers Revenue Hours Revenue Miles
Operating Costs Passenger Revenue Operating Subsidy
48113 56988
65866 70292 76598
0
20000
40000
60000
80000
100000
FY 2013 FY 2014 FY 2015 FY 2016 FY 2017
Passengers
7140 7185
10589 10611 10680
0
2000
4000
6000
8000
10000
12000
FY 2013 FY 2014 FY 2015 FY 2016 FY 2017
Revenue Hours
$532879 $571618
$848305 $811978 $946905
$0
$200000
$400000
$600000
$800000
$1000000
FY 2013 FY 2014 FY 2015 FY 2016 FY 2017
Operating Costs
67 79
62 66 72
00
20
40
60
80
100
FY 2013 FY 2014 FY 2015 FY 2016 FY 2017
Passengers per Revenue Hour
$979 $885
$1165 $1029
$1129
$000$200$400$600$800
$1000$1200$1400
FY 2013 FY 2014 FY 2015 FY 2016 FY 2017
Subsidy per Passenger
$7464 $7955 $8011 $7652 $8866
$0
$50
$100
$150
$200
FY 2013 FY 2014 FY 2015 FY 2016 FY 2017
Cost per Revenue Hour
71XLocal Trunkline
Days of Service WkdyAvg Freq (Wkdy Peak) 30 min
Avg Freq (Wkdy Non-Peak) 60 minAvg Freq (Wked) -
FY 2017 Farebox Recovery 15 transfer (to route) 26
Clipper usage 16
Annual Avg Monthly Avg Daily Annual Avg Monthly Avg Daily Annual Avg Monthly Avg DailyWeekday 121141 10095 479 7705 642 30 174624 14552 690 Saturday - - - - - - - - - Sunday - - - - - - - - -
Total 121141 10095 479 7705 642 30 174624 14552 690
Annual Avg Monthly Avg Daily Annual Avg Monthly Avg Daily Annual Avg Monthly Avg DailyWeekday $1116954 $93080 $4415 $164963 $13747 $652 $951991 $79333 $3763Saturday $ - $ - $ - $ - $ - $ - $ - $ - $ -Sunday $ - $ - $ - $ - $ - $ - $ - $ - $ -
Total $1116954 $93080 $4415 $164963 $13747 $652 $951991 $79333 $3763
Passengers per Revenue Hour
Subsidy per Passenger
Cost per Revenue Hour
Farebox Recovery
Weekday 157 $786 $14496 148Saturday - $ - $ - - Sunday - $ - $ - -
Total 157 $786 $14496 148
Passengers Revenue Hours Operating CostsPassenger
RevenueOperating Subsidy
Passengers per Revenue Hour
Subsidy per Passenger
Cost per Revenue Hour
Farebox Recovery
FY 2015 305440 7666 $1066058 $307659 $758399 398 $248 $13906 289FY 2016 259678 7717 $1075263 $300186 $775077 337 $298 $13934 279FY 2017 121141 7705 $1116954 $164963 $951991 157 $786 $14496 148
Histo
ric Tr
ends
FY 20
161
7 DAT
A
Passengers Revenue Hours Revenue Miles
Operating Costs Passenger Revenue Operating Subsidy
347560 341105 305440
259678
121141
050000
100000150000200000250000300000350000400000
FY 2013 FY 2014 FY 2015 FY 2016 FY 2017
Passengers9038
7578 7666 7717 7705
0
2000
4000
6000
8000
10000
FY 2013 FY 2014 FY 2015 FY 2016 FY 2017
Revenue Hours$1254262
$1116004 $1066058 $1075263 $1116954
$0
$200000
$400000
$600000
$800000
$1000000
$1200000
$1400000
FY 2013 FY 2014 FY 2015 FY 2016 FY 2017
Operating Costs
385 450
398 337
157
00100200300400500600700800
FY 2013 FY 2014 FY 2015 FY 2016 FY 2017
Passengers per Revenue Hour
$253 $222 $248 $298
$786
$000
$200
$400
$600
$800
$1000
FY 2013 FY 2014 FY 2015 FY 2016 FY 2017
Subsidy per Passenger
$13877 $14728 $13906 $13934 $14496
$0
$50
$100
$150
$200
FY 2013 FY 2014 FY 2015 FY 2016 FY 2017
Cost per Revenue Hour
113Supplemental
Days of Service School DaysAvg Freq (Wkdy Peak) 3 trips
Avg Freq (Wkdy Non-Peak) -Avg Freq (Wked) -
FY 2017 Farebox Recovery 29 transfer (to route) 0
Clipper usage 4
Annual Avg Monthly Avg Daily Annual Avg Monthly Avg Daily Annual Avg Monthly Avg DailyWeekday 16829 1530 92 317 29 2 2404 219 13 Saturday - - - - - - - - - Sunday - - - - - - - - -
Total 16829 1530 92 317 29 2 2404 219 13
Annual Avg Monthly Avg Daily Annual Avg Monthly Avg Daily Annual Avg Monthly Avg DailyWeekday $42180 $3835 $230 $12227 $1112 $67 $29953 $2723 $164Saturday $ - $ - $ - $ - $ - $ - $ - $ - $ -Sunday $ - $ - $ - $ - $ - $ - $ - $ - $ -
Total $42180 $3835 $230 $12227 $1112 $67 $29953 $2723 $164
Passengers per TripSubsidy per
PassengerCost per Revenue
HourFarebox Recovery
Weekday 315 $178 $13289 290Saturday - $ - $ - - Sunday - $ - $ - -
Total 315 $178 $13289 290
Passengers Revenue Hours Operating CostsPassenger
RevenueOperating Subsidy Passengers per Trip
Subsidy per Passenger
Cost per Revenue Hour
Farebox Recovery
FY 2015 12241 161 $28599 $10703 $17896 342 $146 $17752 374FY 2016 14601 263 $36924 $12809 $24115 317 $165 $14050 347FY 2017 16829 317 $42180 $12227 $29953 315 $178 $13289 290
Histo
ric Tr
ends
FY 20
161
7 DAT
A
Passengers Revenue Hours Revenue Miles
Operating Costs Passenger Revenue Operating Subsidy
15232 13521
12241 14601
16829
0
5000
10000
15000
20000
FY 2013 FY 2014 FY 2015 FY 2016 FY 2017
Passengers
229
165 161
263
317
0
50
100
150
200
250
300
350
FY 2013 FY 2014 FY 2015 FY 2016 FY 2017
Revenue Hours
$31562
$20182
$28599
$36924 $42180
$0
$10000
$20000
$30000
$40000
$50000
FY 2013 FY 2014 FY 2015 FY 2016 FY 2017
Operating Costs
220
365 342 317 315
00
100
200
300
400
500
FY 2013 FY 2014 FY 2015 FY 2016 FY 2017
Passengers per Trip
$051 $095
$146 $165 $178
$000$100$200$300$400$500$600$700$800
FY 2013 FY 2014 FY 2015 FY 2016 FY 2017
Subsidy per Passenger
$13795 $12261
$17752
$14050 $13289
$0
$50
$100
$150
$200
FY 2013 FY 2014 FY 2015 FY 2016 FY 2017
Cost per Revenue Hour
115Supplemental
Days of Service School DaysAvg Freq (Wkdy Peak) 5 trips
Avg Freq (Wkdy Non-Peak) -Avg Freq (Wked) -
FY 2017 Farebox Recovery 11 transfer (to route) 0
Clipper usage 7
Annual Avg Monthly Avg Daily Annual Avg Monthly Avg Daily Annual Avg Monthly Avg DailyWeekday 14021 1275 71 637 58 3 6963 633 35 Saturday - - - - - - - - - Sunday - - - - - - - - -
Total 14021 1275 71 637 58 3 6963 633 35
Annual Avg Monthly Avg Daily Annual Avg Monthly Avg Daily Annual Avg Monthly Avg DailyWeekday $87534 $7958 $444 $9504 $864 $48 $78030 $7094 $396Saturday $ - $ - $ - $ - $ - $ - $ - $ - $ -Sunday $ - $ - $ - $ - $ - $ - $ - $ - $ -
Total $87534 $7958 $444 $9504 $864 $48 $78030 $7094 $396
Passengers per TripSubsidy per
PassengerCost per Revenue
HourFarebox Recovery
Weekday 185 $557 $13744 109Saturday - $ - $ - - Sunday - $ - $ - -
Total 185 $557 $13744 109
Passengers Revenue Hours Operating CostsPassenger
RevenueOperating Subsidy Passengers per Trip
Subsidy per Passenger
Cost per Revenue Hour
Farebox Recovery
FY 2015 21488 775 $131168 $18863 $112305 221 $523 $16918 144FY 2016 16366 559 $82403 $12638 $69765 168 $426 $14754 153FY 2017 14021 637 $87534 $9504 $78030 185 $557 $13744 109
Histo
ric Tr
ends
FY 20
161
7 DAT
A
Passengers Revenue Hours Revenue Miles
Operating Costs Passenger Revenue Operating Subsidy
13524
21488
16366 14021
0
5000
10000
15000
20000
25000
FY 2013 FY 2014 FY 2015 FY 2016 FY 2017
Passengers
463
775
559 637
0
200
400
600
800
1000
FY 2013 FY 2014 FY 2015 FY 2016 FY 2017
Revenue Hours
$56706
$131168
$82403 $87534
$0
$20000
$40000
$60000
$80000
$100000
$120000
$140000
FY 2013 FY 2014 FY 2015 FY 2016 FY 2017
Operating Costs
232 221 168 185
00
100
200
300
400
500
FY 2013 FY 2014 FY 2015 FY 2016 FY 2017
Passengers per Trip
$362
$523 $426
$557
$000$100$200$300$400$500$600$700$800
FY 2013 FY 2014 FY 2015 FY 2016 FY 2017
Subsidy per Passenger
$12250
$16918 $14754 $13744
$0
$50
$100
$150
$200
FY 2013 FY 2014 FY 2015 FY 2016 FY 2017
Cost per Revenue Hour
117Supplemental
Days of Service School DaysAvg Freq (Wkdy Peak) 6 trips
Avg Freq (Wkdy Non-Peak) -Avg Freq (Wked) -
FY 2017 Farebox Recovery 21 transfer (to route) 0
Clipper usage 2
Annual Avg Monthly Avg Daily Annual Avg Monthly Avg Daily Annual Avg Monthly Avg DailyWeekday 34820 3165 193 640 58 4 4753 432 26 Saturday - - - - - - - - - Sunday - - - - - - - - -
Total 34820 3165 193 640 58 4 4753 432 26
Annual Avg Monthly Avg Daily Annual Avg Monthly Avg Daily Annual Avg Monthly Avg DailyWeekday $81509 $7410 $453 $17140 $1558 $95 $64369 $5852 $358Saturday $ - $ - $ - $ - $ - $ - $ - $ - $ -Sunday $ - $ - $ - $ - $ - $ - $ - $ - $ -
Total $81509 $7410 $453 $17140 $1558 $95 $64369 $5852 $358
Passengers per TripSubsidy per
PassengerCost per Revenue
HourFarebox Recovery
Weekday 284 $185 $12732 210Saturday - $ - $ - - Sunday - $ - $ - -
Total 284 $185 $12732 210
Passengers Revenue Hours Operating CostsPassenger
RevenueOperating Subsidy Passengers per Trip
Subsidy per Passenger
Cost per Revenue Hour
Farebox Recovery
FY 2015 50008 509 $77168 $77528 ($360) 399 ($001) $15158 1005FY 2016 33705 552 $77694 $23478 $54216 269 $161 $14075 302FY 2017 34820 640 $81509 $17140 $64369 284 $185 $12732 210
Histo
ric Tr
ends
FY 20
161
7 DAT
A
Passengers Revenue Hours Revenue Miles
Operating Costs Passenger Revenue Operating Subsidy
35174 34496
50008
33705 34820
0
10000
20000
30000
40000
50000
60000
FY 2013 FY 2014 FY 2015 FY 2016 FY 2017
Passengers
299 341
509 552
640
0
100
200
300
400
500
600
700
FY 2013 FY 2014 FY 2015 FY 2016 FY 2017
Revenue Hours
$41176 $41796
$77168 $77694 $81509
$0
$20000
$40000
$60000
$80000
$100000
FY 2013 FY 2014 FY 2015 FY 2016 FY 2017
Operating Costs
436 406 399
269 284
00
100
200
300
400
500
FY 2013 FY 2014 FY 2015 FY 2016 FY 2017
Passengers per Trip
($012) ($028) ($001)
$161 $185
-$200
-$100
$000
$100
$200
$300
$400
$500
$600
FY 2013 FY 2014 FY 2015 FY 2016 FY 2017
Subsidy per Passenger$13790
$12253
$15158 $14075
$12732
$0$20$40$60$80
$100$120$140$160
FY 2013 FY 2014 FY 2015 FY 2016 FY 2017
Cost per Revenue Hour
119Supplemental
Days of Service School DaysAvg Freq (Wkdy Peak) 5 trips
Avg Freq (Wkdy Non-Peak) -Avg Freq (Wked) -
FY 2017 Farebox Recovery 34 transfer (to route) 0
Clipper usage 5
Annual Avg Monthly Avg Daily Annual Avg Monthly Avg Daily Annual Avg Monthly Avg DailyWeekday 27161 2469 151 374 34 2 6893 627 38 Saturday - - - - - - - - - Sunday - - - - - - - - -
Total 27161 2469 151 374 34 2 6893 627 38
Annual Avg Monthly Avg Daily Annual Avg Monthly Avg Daily Annual Avg Monthly Avg DailyWeekday $56273 $5116 $313 $18859 $1714 $105 $37414 $3401 $208Saturday $ - $ - $ - $ - $ - $ - $ - $ - $ -Sunday $ - $ - $ - $ - $ - $ - $ - $ - $ -
Total $56273 $5116 $313 $18859 $1714 $105 $37414 $3401 $208
Passengers per TripSubsidy per
PassengerCost per Revenue
HourFarebox Recovery
Weekday 313 $138 $15058 335Saturday - $ - $ - - Sunday - $ - $ - -
Total 313 $138 $15058 335
Passengers Revenue Hours Operating CostsPassenger
RevenueOperating Subsidy Passengers per Trip
Subsidy per Passenger
Cost per Revenue Hour
Farebox Recovery
FY 2015 28376 466 $85243 $24699 $60544 319 $213 $18292 290FY 2016 30906 431 $68366 $28456 $39910 317 $129 $15877 416FY 2017 27161 374 $56273 $18859 $37414 313 $138 $15058 335
Histo
ric Tr
ends
FY 20
161
7 DAT
A
Passengers Revenue Hours Revenue Miles
Operating Costs Passenger Revenue Operating Subsidy
27987 28376
30906
27161
25000
26000
27000
28000
29000
30000
31000
32000
FY 2013 FY 2014 FY 2015 FY 2016 FY 2017
Passengers526
466 431
374
0
100
200
300
400
500
600
FY 2013 FY 2014 FY 2015 FY 2016 FY 2017
Revenue Hours
$64440
$85243
$68366 $56273
$0
$20000
$40000
$60000
$80000
$100000
FY 2013 FY 2014 FY 2015 FY 2016 FY 2017
Operating Costs
272 319 317 313
00
100
200
300
400
500
FY 2013 FY 2014 FY 2015 FY 2016 FY 2017
Passengers per Trip
$175 $213 $129 $138
$000$100$200$300$400$500$600$700$800
FY 2013 FY 2014 FY 2015 FY 2016 FY 2017
Subsidy per Passenger
$12251
$18292 $15877 $15058
$0
$50
$100
$150
$200
FY 2013 FY 2014 FY 2015 FY 2016 FY 2017
Cost per Revenue Hour
122Partnership
Days of Service WkdyAvg Freq (Wkdy Peak) -
Avg Freq (Wkdy Non-Peak) 30 minAvg Freq (Wked) -
FY 2017 Farebox Recovery 66 transfer (to route) 9
Clipper usage 6
Annual Avg Monthly Avg Daily Annual Avg Monthly Avg Daily Annual Avg Monthly Avg DailyWeekday 19860 1986 113 1696 170 10 15480 1548 88 Saturday - - - - - - - - - Sunday - - - - - - - - -
Total 19860 1986 113 1696 170 10 15480 1548 88
Annual Avg Monthly Avg Daily Annual Avg Monthly Avg Daily Annual Avg Monthly Avg DailyWeekday $183943 $18394 $1045 $121007 $12101 $688 $62936 $6294 $358Saturday $ - $ - $ - $ - $ - $ - $ - $ - $ -Sunday $ - $ - $ - $ - $ - $ - $ - $ - $ -
Total $183943 $18394 $1045 $121007 $12101 $688 $62936 $6294 $358
Passengers per Revenue Hour
Subsidy per Passenger
Cost per Revenue Hour
Farebox Recovery
Weekday 117 $317 $10844 658Saturday - $ - $ - - Sunday - $ - $ - -
Total 117 $317 $10844 658
Passengers Revenue Hours Operating CostsPassenger
RevenueOperating Subsidy
Passengers per Revenue Hour
Subsidy per Passenger
Cost per Revenue Hour
Farebox Recovery
FY 2015FY 2016 20360 2932 $325230 $149686 $175544 69 $862 $11094 460FY 2017 19860 1696 $183943 $121007 $62936 117 $317 $10844 658
Histo
ric Tr
ends
FY 20
161
7 DAT
A
Passengers Revenue Hours Revenue Miles
Operating Costs Passenger Revenue Operating Subsidy
20360 19860
0
5000
10000
15000
20000
25000
FY 2013 FY 2014 FY 2015 FY 2016 FY 2017
Passengers2932
1696
0
500
1000
1500
2000
2500
3000
3500
FY 2013 FY 2014 FY 2015 FY 2016 FY 2017
Revenue Hours$325230
$183943
$0
$50000
$100000
$150000
$200000
$250000
$300000
$350000
FY 2013 FY 2014 FY 2015 FY 2016 FY 2017
Operating Costs
69
117
00
20
40
60
80
100
120
140
FY 2013 FY 2014 FY 2015 FY 2016 FY 2017
Passengers per Revenue Hour$862
$317
$000
$200
$400
$600
$800
$1000
FY 2013 FY 2014 FY 2015 FY 2016 FY 2017
Subsidy per Passenger
$11094 $10844
$0
$50
$100
$150
$200
FY 2013 FY 2014 FY 2015 FY 2016 FY 2017
Cost per Revenue Hour
125Supplemental
Days of Service School DaysAvg Freq (Wkdy Peak) 4 trips
Avg Freq (Wkdy Non-Peak) -Avg Freq (Wked) -
FY 2017 Farebox Recovery 16 transfer (to route) 1
Clipper usage 8
Annual Avg Monthly Avg Daily Annual Avg Monthly Avg Daily Annual Avg Monthly Avg DailyWeekday 13757 1251 76 600 55 3 8580 780 48 Saturday - - - - - - - - - Sunday - - - - - - - - -
Total 13757 1251 76 600 55 3 8580 780 48
Annual Avg Monthly Avg Daily Annual Avg Monthly Avg Daily Annual Avg Monthly Avg DailyWeekday $72469 $6588 $403 $11570 $1052 $64 $60899 $5536 $338Saturday $ - $ - $ - $ - $ - $ - $ - $ - $ -Sunday $ - $ - $ - $ - $ - $ - $ - $ - $ -
Total $72469 $6588 $403 $11570 $1052 $64 $60899 $5536 $338
Passengers per TripSubsidy per
PassengerCost per Revenue
HourFarebox Recovery
Weekday 193 $443 $12086 160Saturday - $ - $ - - Sunday - $ - $ - -
Total 193 $443 $12086 160
Passengers Revenue Hours Operating CostsPassenger
RevenueOperating Subsidy Passengers per Trip
Subsidy per Passenger
Cost per Revenue Hour
Farebox Recovery
FY 2015 13298 578 $87015 $11914 $75101 186 $565 $15054 137FY 2016 13197 595 $77991 $12684 $65307 182 $495 $13117 163FY 2017 13757 600 $72469 $11570 $60899 193 $443 $12086 160
Histo
ric Tr
ends
FY 20
161
7 DAT
A
Passengers Revenue Hours Revenue Miles
Operating Costs Passenger Revenue Operating Subsidy
8798 7189
13298 13197 13757
02000400060008000
10000120001400016000
FY 2013 FY 2014 FY 2015 FY 2016 FY 2017
Passengers
100 90
578 595 600
0
100
200
300
400
500
600
700
FY 2013 FY 2014 FY 2015 FY 2016 FY 2017
Revenue Hours
$13752 $10979
$87015 $77991
$72469
$0
$20000
$40000
$60000
$80000
$100000
FY 2013 FY 2014 FY 2015 FY 2016 FY 2017
Operating Costs
492
402
186 182 193
00
100
200
300
400
500
FY 2013 FY 2014 FY 2015 FY 2016 FY 2017
Passengers per Trip
$015 $002
$565 $495
$443
$000$100$200$300$400$500$600$700$800
FY 2013 FY 2014 FY 2015 FY 2016 FY 2017
Subsidy per Passenger$13821
$12267
$15054 $13117
$12086
$0$20$40$60$80
$100$120$140$160
FY 2013 FY 2014 FY 2015 FY 2016 FY 2017
Cost per Revenue Hour
139Supplemental
Days of Service School DaysAvg Freq (Wkdy Peak) 2 trips
Avg Freq (Wkdy Non-Peak) -Avg Freq (Wked) -
FY 2017 Farebox Recovery 20 transfer (to route) 0
Clipper usage 24
Annual Avg Monthly Avg Daily Annual Avg Monthly Avg Daily Annual Avg Monthly Avg DailyWeekday 6414 583 36 253 23 1 4127 375 23 Saturday - - - - - - - - - Sunday - - - - - - - - -
Total 6414 583 36 253 23 1 4127 375 23
Annual Avg Monthly Avg Daily Annual Avg Monthly Avg Daily Annual Avg Monthly Avg DailyWeekday $33182 $3017 $184 $6635 $603 $37 $26547 $2413 $147Saturday $ - $ - $ - $ - $ - $ - $ - $ - $ -Sunday $ - $ - $ - $ - $ - $ - $ - $ - $ -
Total $33182 $3017 $184 $6635 $603 $37 $26547 $2413 $147
Passengers per TripSubsidy per
PassengerCost per Revenue
HourFarebox Recovery
Weekday 179 $414 $13110 200Saturday - $ - $ - - Sunday - $ - $ - -
Total 179 $414 $13110 200
Passengers Revenue Hours Operating CostsPassenger
RevenueOperating Subsidy Passengers per Trip
Subsidy per Passenger
Cost per Revenue Hour
Farebox Recovery
FY 2015 5906 225 $36437 $5258 $31179 164 $528 $16173 144FY 2016 6391 315 $43776 $6241 $37535 160 $587 $13880 143FY 2017 6414 253 $33182 $6635 $26547 179 $414 $13110 200
Histo
ric Tr
ends
FY 20
161
7 DAT
A
Passengers Revenue Hours Revenue Miles
Operating Costs Passenger Revenue Operating Subsidy
4232 4026
5906 6391 6414
0
1000
2000
3000
4000
5000
6000
7000
FY 2013 FY 2014 FY 2015 FY 2016 FY 2017
Passengers
226 227 225
315
253
0
50
100
150
200
250
300
350
FY 2013 FY 2014 FY 2015 FY 2016 FY 2017
Revenue Hours
$31306 $27734
$36437
$43776
$33182
$0
$10000
$20000
$30000
$40000
$50000
FY 2013 FY 2014 FY 2015 FY 2016 FY 2017
Operating Costs
120 111 164 160 179
00
100
200
300
400
500
FY 2013 FY 2014 FY 2015 FY 2016 FY 2017
Passengers per Trip
$427
$628 $528
$587
$414
$000$100$200$300$400$500$600$700$800
FY 2013 FY 2014 FY 2015 FY 2016 FY 2017
Subsidy per Passenger
$13834 $12239
$16173 $13880 $13110
$0
$50
$100
$150
$200
FY 2013 FY 2014 FY 2015 FY 2016 FY 2017
Cost per Revenue Hour
145Supplemental
Days of Service School DaysAvg Freq (Wkdy Peak) 2-3 trips
Avg Freq (Wkdy Non-Peak) -Avg Freq (Wked) -
FY 2017 Farebox Recovery 29 transfer (to route) 5
Clipper usage 2
Annual Avg Monthly Avg Daily Annual Avg Monthly Avg Daily Annual Avg Monthly Avg DailyWeekday 16406 1491 90 191 17 1 2175 198 12 Saturday - - - - - - - - - Sunday - - - - - - - - -
Total 16406 1491 90 191 17 1 2175 198 12
Annual Avg Monthly Avg Daily Annual Avg Monthly Avg Daily Annual Avg Monthly Avg DailyWeekday $25426 $2311 $139 $7258 $660 $40 $18168 $1652 $99Saturday $ - $ - $ - $ - $ - $ - $ - $ - $ -Sunday $ - $ - $ - $ - $ - $ - $ - $ - $ -
Total $25426 $2311 $139 $7258 $660 $40 $18168 $1652 $99
Passengers per TripSubsidy per
PassengerCost per Revenue
HourFarebox Recovery
Weekday 372 $111 $13347 285Saturday - $ - $ - - Sunday - $ - $ - -
Total 372 $111 $13347 285
Passengers Revenue Hours Operating CostsPassenger
RevenueOperating Subsidy Passengers per Trip
Subsidy per Passenger
Cost per Revenue Hour
Farebox Recovery
FY 2015 6911 87 $13373 $5858 $7515 337 $109 $15442 438FY 2016 10268 167 $21672 $6341 $15331 396 $149 $12993 293FY 2017 16406 191 $25426 $7258 $18168 372 $111 $13347 285
Histo
ric Tr
ends
FY 20
161
7 DAT
A
Passengers Revenue Hours Revenue Miles
Operating Costs Passenger Revenue Operating Subsidy
6911
10268
16406
0
5000
10000
15000
20000
FY 2013 FY 2014 FY 2015 FY 2016 FY 2017
Passengers
87
167 191
0
50
100
150
200
250
FY 2013 FY 2014 FY 2015 FY 2016 FY 2017
Revenue Hours
$13373
$21672 $25426
$0
$5000
$10000
$15000
$20000
$25000
$30000
FY 2013 FY 2014 FY 2015 FY 2016 FY 2017
Operating Costs
337 396 372
00
100
200
300
400
500
FY 2013 FY 2014 FY 2015 FY 2016 FY 2017
Passengers per Trip
$109 $149 $111
$000$100$200$300$400$500$600$700$800
FY 2013 FY 2014 FY 2015 FY 2016 FY 2017
Subsidy per Passenger
$15442 $12993 $13347
$0
$50
$100
$150
$200
FY 2013 FY 2014 FY 2015 FY 2016 FY 2017
Cost per Revenue Hour
151Supplemental
Days of Service School DaysAvg Freq (Wkdy Peak) 4-5 trips
Avg Freq (Wkdy Non-Peak) -Avg Freq (Wked) -
FY 2017 Farebox Recovery 25 transfer (to route) 1
Clipper usage 4
Annual Avg Monthly Avg Daily Annual Avg Monthly Avg Daily Annual Avg Monthly Avg DailyWeekday 36801 3346 204 594 54 3 10649 968 59 Saturday - - - - - - - - - Sunday - - - - - - - - -
Total 36801 3346 204 594 54 3 10649 968 59
Annual Avg Monthly Avg Daily Annual Avg Monthly Avg Daily Annual Avg Monthly Avg DailyWeekday $73842 $6713 $410 $18463 $1678 $103 $55379 $5034 $308Saturday $ - $ - $ - $ - $ - $ - $ - $ - $ -Sunday $ - $ - $ - $ - $ - $ - $ - $ - $ -
Total $73842 $6713 $410 $18463 $1678 $103 $55379 $5034 $308
Passengers per TripSubsidy per
PassengerCost per Revenue
HourFarebox Recovery
Weekday 428 $150 $12442 250Saturday - $ - $ - - Sunday - $ - $ - -
Total 428 $150 $12442 250
Passengers Revenue Hours Operating CostsPassenger
RevenueOperating Subsidy Passengers per Trip
Subsidy per Passenger
Cost per Revenue Hour
Farebox Recovery
FY 2015 39309 911 $134174 $34376 $99798 315 $254 $14722 256FY 2016 42643 759 $100712 $25851 $74861 456 $176 $13267 257FY 2017 36801 594 $73842 $18463 $55379 428 $150 $12442 250
Histo
ric Tr
ends
FY 20
161
7 DAT
A
Passengers Revenue Hours Revenue Miles
Operating Costs Passenger Revenue Operating Subsidy
39537 39309
42643
36801
32000
34000
36000
38000
40000
42000
44000
FY 2013 FY 2014 FY 2015 FY 2016 FY 2017
Passengers
784 911
759
594
0
200
400
600
800
1000
FY 2013 FY 2014 FY 2015 FY 2016 FY 2017
Revenue Hours
$95932
$134174
$100712
$73842
$0$20000$40000$60000$80000
$100000$120000$140000$160000
FY 2013 FY 2014 FY 2015 FY 2016 FY 2017
Operating Costs
368 315
456 428
00
100
200
300
400
500
FY 2013 FY 2014 FY 2015 FY 2016 FY 2017
Passengers per Trip
$188 $254
$176 $150
$000$100$200$300$400$500$600$700$800
FY 2013 FY 2014 FY 2015 FY 2016 FY 2017
Subsidy per Passenger
$12233
$14722 $13267 $12442
$0$20$40$60$80
$100$120$140$160
FY 2013 FY 2014 FY 2015 FY 2016 FY 2017
Cost per Revenue Hour
154Supplemental
Days of Service School DaysAvg Freq (Wkdy Peak) 3 trips
Avg Freq (Wkdy Non-Peak) -Avg Freq (Wked) -
FY 2017 Farebox Recovery 21 transfer (to route) 0
Clipper usage 5
Annual Avg Monthly Avg Daily Annual Avg Monthly Avg Daily Annual Avg Monthly Avg DailyWeekday 13738 1249 76 358 33 2 4342 395 24 Saturday - - - - - - - - - Sunday - - - - - - - - -
Total 13738 1249 76 358 33 2 4342 395 24
Annual Avg Monthly Avg Daily Annual Avg Monthly Avg Daily Annual Avg Monthly Avg DailyWeekday $41965 $3815 $233 $8847 $804 $49 $33118 $3011 $184Saturday $ - $ - $ - $ - $ - $ - $ - $ - $ -Sunday $ - $ - $ - $ - $ - $ - $ - $ - $ -
Total $41965 $3815 $233 $8847 $804 $49 $33118 $3011 $184
Passengers per TripSubsidy per
PassengerCost per Revenue
HourFarebox Recovery
Weekday 255 $241 $11729 211Saturday - $ - $ - - Sunday - $ - $ - -
Total 255 $241 $11729 211
Passengers Revenue Hours Operating CostsPassenger
RevenueOperating Subsidy Passengers per Trip
Subsidy per Passenger
Cost per Revenue Hour
Farebox Recovery
FY 2015 15376 293 $42604 $13174 $29430 388 $191 $14541 309FY 2016 17858 360 $46133 $14660 $31473 311 $176 $12808 318FY 2017 13738 358 $41965 $8847 $33118 255 $241 $11729 211
Histo
ric Tr
ends
FY 20
161
7 DAT
A
Passengers Revenue Hours Revenue Miles
Operating Costs Passenger Revenue Operating Subsidy
12138
15376 17858
13738
0
5000
10000
15000
20000
FY 2013 FY 2014 FY 2015 FY 2016 FY 2017
Passengers
310 293
360 358
050
100150200250300350400
FY 2013 FY 2014 FY 2015 FY 2016 FY 2017
Revenue Hours
$37913 $42604
$46133 $41965
$0
$10000
$20000
$30000
$40000
$50000
FY 2013 FY 2014 FY 2015 FY 2016 FY 2017
Operating Costs
291
388
311 255
00
100
200
300
400
500
FY 2013 FY 2014 FY 2015 FY 2016 FY 2017
Passengers per Trip
$256 $191 $176
$241
$000$100$200$300$400$500$600$700$800
FY 2013 FY 2014 FY 2015 FY 2016 FY 2017
Subsidy per Passenger
$12246
$14541 $12808
$11729
$0$20$40$60$80
$100$120$140$160
FY 2013 FY 2014 FY 2015 FY 2016 FY 2017
Cost per Revenue Hour
219Local Connector
Days of Service Wkdy Sa SuAvg Freq (Wkdy Peak) 30 min
Avg Freq (Wkdy Non-Peak) 30 minAvg Freq (Wked) 30 min
FY 2017 Farebox Recovery 11 transfer (to route) 20
Clipper usage 11
Annual Avg Monthly Avg Daily Annual Avg Monthly Avg Daily Annual Avg Monthly Avg DailyWeekday 40817 3401 161 5020 418 20 58766 4897 232 Saturday 4888 407 94 637 53 12 10931 911 210 Sunday 4744 395 79 735 61 12 12607 1051 210
Total 50449 4204 138 6392 533 18 82304 6859 225
Annual Avg Monthly Avg Daily Annual Avg Monthly Avg Daily Annual Avg Monthly Avg DailyWeekday $462388 $38532 $1828 $51411 $4284 $203 $410977 $34248 $1624Saturday $59904 $4992 $1152 $6230 $519 $120 $53674 $4473 $1032Sunday $68932 $5744 $1149 $6460 $538 $108 $62472 $5206 $1041
Total $591224 $49269 $1620 $64101 $5342 $176 $527123 $43927 $1444
Passengers per Revenue Hour
Subsidy per Passenger
Cost per Revenue Hour
Farebox Recovery
Weekday 81 $1007 $9212 111Saturday 77 $1098 $9401 104Sunday 65 $1317 $9381 94
Total 79 $1045 $9250 108
Passengers Revenue Hours Operating CostsPassenger
RevenueOperating Subsidy
Passengers per Revenue Hour
Subsidy per Passenger
Cost per Revenue Hour
Farebox Recovery
FY 2015 60906 6585 $569962 $65747 $504215 92 $828 $8656 115FY 2016 55610 6591 $590663 $73164 $517499 84 $931 $8961 124FY 2017 50449 6392 $591224 $64101 $527123 79 $1045 $9250 108
Histo
ric Tr
ends
FY 20
161
7 DAT
A
Passengers Revenue Hours Revenue Miles
Operating Costs Passenger Revenue Operating Subsidy
55543 60906
55610 50449
0
10000
20000
30000
40000
50000
60000
70000
FY 2013 FY 2014 FY 2015 FY 2016 FY 2017
Passengers
5734
6585 6591 6392
520054005600580060006200640066006800
FY 2013 FY 2014 FY 2015 FY 2016 FY 2017
Revenue Hours
$522978
$569962
$590663 $591224
$480000
$500000
$520000
$540000
$560000
$580000
$600000
FY 2013 FY 2014 FY 2015 FY 2016 FY 2017
Operating Costs
97 92 84 79
00
20
40
60
80
100
120
140
FY 2013 FY 2014 FY 2015 FY 2016 FY 2017
Passengers per Revenue Hour
$851 $828 $931
$1045
$000$200$400$600$800
$1000$1200$1400
FY 2013 FY 2014 FY 2015 FY 2016 FY 2017
Subsidy per Passenger
$9121 $8656 $8961 $9250
$0
$50
$100
$150
$200
FY 2013 FY 2014 FY 2015 FY 2016 FY 2017
Cost per Revenue Hour
228Local Connector
Days of Service Wkdy Sa SuAvg Freq (Wkdy Peak) 60 min
Avg Freq (Wkdy Non-Peak) 60 minAvg Freq (Wked) 60 min
FY 2017 Farebox Recovery 11 transfer (to route) 17
Clipper usage 15
Annual Avg Monthly Avg Daily Annual Avg Monthly Avg Daily Annual Avg Monthly Avg DailyWeekday 57316 4776 227 7175 598 28 65884 5490 260 Saturday 8218 685 158 1331 111 26 13020 1085 250 Sunday 5806 484 97 1536 128 26 15023 1252 250
Total 71340 5945 195 10042 837 28 93926 7827 257
Annual Avg Monthly Avg Daily Annual Avg Monthly Avg Daily Annual Avg Monthly Avg DailyWeekday $646194 $53850 $2554 $80857 $6738 $320 $565337 $47111 $2235Saturday $120205 $10017 $2312 $12568 $1047 $242 $107637 $8970 $2070Sunday $138407 $11534 $2307 $10487 $874 $175 $127920 $10660 $2132
Total $904806 $75401 $2479 $103912 $8659 $285 $800894 $66741 $2194
Passengers per Revenue Hour
Subsidy per Passenger
Cost per Revenue Hour
Farebox Recovery
Weekday 80 $986 $9006 125Saturday 62 $1310 $9030 105Sunday 38 $2203 $9011 76
Total 71 $1123 $9010 115
Passengers Revenue Hours Operating CostsPassenger
RevenueOperating Subsidy
Passengers per Revenue Hour
Subsidy per Passenger
Cost per Revenue Hour
Farebox Recovery
FY 2015 15287 2828 $239879 $18274 $221605 54 $1450 $8482 76FY 2016 17522 3185 $280634 $28092 $252542 55 $1441 $8812 100FY 2017 71340 10042 $904806 $103912 $800894 71 $1123 $9010 115
Histo
ric Tr
ends
FY 20
161
7 DAT
A
Passengers Revenue Hours Revenue Miles
Operating Costs Passenger Revenue Operating Subsidy
5854 15287 17522
71340
01000020000300004000050000600007000080000
FY 2013 FY 2014 FY 2015 FY 2016 FY 2017
Passengers
970
2828 3185
10042
0
2000
4000
6000
8000
10000
12000
FY 2013 FY 2014 FY 2015 FY 2016 FY 2017
Revenue Hours
$85183
$239879 $280634
$904806
$0
$200000
$400000
$600000
$800000
$1000000
FY 2013 FY 2014 FY 2015 FY 2016 FY 2017
Operating Costs
60 54 55 71
00
20
40
60
80
100
120
140
FY 2013 FY 2014 FY 2015 FY 2016 FY 2017
Passengers per Revenue Hour$1358
$1450 $1441
$1123
$000$200$400$600$800
$1000$1200$1400
FY 2013 FY 2014 FY 2015 FY 2016 FY 2017
Subsidy per Passenger
$8779 $8482 $8812 $9010
$0
$50
$100
$150
$200
FY 2013 FY 2014 FY 2015 FY 2016 FY 2017
Cost per Revenue Hour
233Local Connector
Days of Service Wkdy Sa SuAvg Freq (Wkdy Peak) 60 min
Avg Freq (Wkdy Non-Peak) 60 minAvg Freq (Wked) 60 min
FY 2017 Farebox Recovery 13 transfer (to route) 16
Clipper usage 10
Annual Avg Monthly Avg Daily Annual Avg Monthly Avg Daily Annual Avg Monthly Avg DailyWeekday 35589 2966 141 3306 276 13 38809 3234 153 Saturday 3911 326 75 490 41 9 5829 486 112 Sunday 3298 275 55 566 47 9 6726 561 112
Total 42798 3567 117 4363 364 12 51364 4280 141
Annual Avg Monthly Avg Daily Annual Avg Monthly Avg Daily Annual Avg Monthly Avg DailyWeekday $302758 $25230 $1197 $42450 $3538 $168 $260308 $21692 $1029Saturday $44829 $3736 $862 $5018 $418 $97 $39811 $3318 $766Sunday $51616 $4301 $860 $4533 $378 $76 $47083 $3924 $785
Total $399203 $33267 $1094 $52001 $4333 $142 $347202 $28934 $951
Passengers per Revenue Hour
Subsidy per Passenger
Cost per Revenue Hour
Farebox Recovery
Weekday 108 $731 $9158 140Saturday 80 $1018 $9141 112Sunday 58 $1428 $9118 88
Total 98 $811 $9151 130
Passengers Revenue Hours Operating CostsPassenger
RevenueOperating Subsidy
Passengers per Revenue Hour
Subsidy per Passenger
Cost per Revenue Hour
Farebox Recovery
FY 2015 50342 4366 $371602 $52526 $319076 115 $634 $8512 141FY 2016 49494 4384 $388005 $59296 $328709 113 $664 $8851 153FY 2017 42798 4363 $399203 $52001 $347202 98 $811 $9151 130
Histo
ric Tr
ends
FY 20
161
7 DAT
A
Passengers Revenue Hours Revenue Miles
Operating Costs Passenger Revenue Operating Subsidy
39956
50422 50342 49494 42798
0
10000
20000
30000
40000
50000
60000
FY 2013 FY 2014 FY 2015 FY 2016 FY 2017
Passengers
3981
4144
4366 4384 4363
370038003900400041004200430044004500
FY 2013 FY 2014 FY 2015 FY 2016 FY 2017
Revenue Hours
$350499
$378792 $371602
$388005 $399203
$320000$330000$340000$350000$360000$370000$380000$390000$400000$410000
FY 2013 FY 2014 FY 2015 FY 2016 FY 2017
Operating Costs
100
122 115 113 98
00
20
40
60
80
100
120
140
FY 2013 FY 2014 FY 2015 FY 2016 FY 2017
Passengers per Revenue Hour
$760 $661 $634 $664
$811
$000$200$400$600$800
$1000$1200$1400
FY 2013 FY 2014 FY 2015 FY 2016 FY 2017
Subsidy per Passenger
$8805 $9142 $8512 $8851 $9151
$0
$50
$100
$150
$200
FY 2013 FY 2014 FY 2015 FY 2016 FY 2017
Cost per Revenue Hour
245Local Connector
Days of Service Wkdy Sa SuAvg Freq (Wkdy Peak) 60 min
Avg Freq (Wkdy Non-Peak) 60 minAvg Freq (Wked) 60 min
FY 2017 Farebox Recovery 15 transfer (to route) 13
Clipper usage 13
Annual Avg Monthly Avg Daily Annual Avg Monthly Avg Daily Annual Avg Monthly Avg DailyWeekday 41761 3480 165 3014 251 12 28706 2392 113 Saturday 4220 352 81 620 52 12 5778 482 111 Sunday 3785 315 63 715 60 12 6667 556 111
Total 49766 4147 136 4349 362 12 41152 3429 113
Annual Avg Monthly Avg Daily Annual Avg Monthly Avg Daily Annual Avg Monthly Avg DailyWeekday $271762 $22647 $1074 $44873 $3739 $177 $226889 $18907 $897Saturday $55697 $4641 $1071 $6217 $518 $120 $49480 $4123 $952Sunday $64137 $5345 $1069 $5878 $490 $98 $58259 $4855 $971
Total $391596 $32633 $1073 $56968 $4747 $156 $334628 $27886 $917
Passengers per Revenue Hour
Subsidy per Passenger
Cost per Revenue Hour
Farebox Recovery
Weekday 139 $543 $9016 165Saturday 68 $1173 $8988 112Sunday 53 $1539 $8970 92
Total 114 $672 $9004 145
Passengers Revenue Hours Operating CostsPassenger
RevenueOperating Subsidy
Passengers per Revenue Hour
Subsidy per Passenger
Cost per Revenue Hour
Farebox Recovery
FY 2015FY 2016 2184 227 $19695 $3137 $16558 96 $758 $8695 159FY 2017 49766 4349 $391596 $56968 $334628 114 $672 $9004 145
Histo
ric Tr
ends
FY 20
161
7 DAT
A
Passengers Revenue Hours Revenue Miles
Operating Costs Passenger Revenue Operating Subsidy
2184
49766
0
10000
20000
30000
40000
50000
60000
FY 2013 FY 2014 FY 2015 FY 2016 FY 2017
Passengers
227
4349
0
1000
2000
3000
4000
5000
FY 2013 FY 2014 FY 2015 FY 2016 FY 2017
Revenue Hours
$19695
$391596
$0
$100000
$200000
$300000
$400000
$500000
FY 2013 FY 2014 FY 2015 FY 2016 FY 2017
Operating Costs
96 114
00
20
40
60
80
100
120
140
FY 2013 FY 2014 FY 2015 FY 2016 FY 2017
Passengers per Revenue Hour
$758 $672
$000$200$400$600$800
$1000$1200$1400
FY 2013 FY 2014 FY 2015 FY 2016 FY 2017
Subsidy per Passenger
$8695 $9004
$0
$50
$100
$150
$200
FY 2013 FY 2014 FY 2015 FY 2016 FY 2017
Cost per Revenue Hour
251Local Connector
Days of Service Wkdy Sa SuAvg Freq (Wkdy Peak) 60 min
Avg Freq (Wkdy Non-Peak) 60 minAvg Freq (Wked) 60 min
FY 2017 Farebox Recovery 11 transfer (to route) 8
Clipper usage 8
Annual Avg Monthly Avg Daily Annual Avg Monthly Avg Daily Annual Avg Monthly Avg DailyWeekday 76675 6390 303 6754 563 27 95654 7971 378 Saturday 9952 829 191 1325 110 25 18630 1553 358 Sunday 8879 740 148 1528 127 25 21497 1791 358
Total 95506 7959 262 9607 801 26 135781 11315 372
Annual Avg Monthly Avg Daily Annual Avg Monthly Avg Daily Annual Avg Monthly Avg DailyWeekday $625542 $52129 $2472 $78006 $6501 $308 $547536 $45628 $2164Saturday $122485 $10207 $2355 $12104 $1009 $233 $110381 $9198 $2123Sunday $140992 $11749 $2350 $11713 $976 $195 $129279 $10773 $2155
Total $889019 $74085 $2436 $101823 $8485 $279 $787196 $65600 $2157
Passengers per Revenue Hour
Subsidy per Passenger
Cost per Revenue Hour
Farebox Recovery
Weekday 114 $714 $9262 125Saturday 75 $1109 $9246 99Sunday 58 $1456 $9225 83
Total 99 $824 $9254 115
Passengers Revenue Hours Operating CostsPassenger
RevenueOperating Subsidy
Passengers per Revenue Hour
Subsidy per Passenger
Cost per Revenue Hour
Farebox Recovery
FY 2015 97647 9172 $800242 $103081 $697161 106 $714 $8725 129FY 2016 98886 9226 $831623 $120959 $710664 107 $719 $9014 145FY 2017 95506 9607 $889019 $101823 $787196 99 $824 $9254 115
Histo
ric Tr
ends
FY 20
161
7 DAT
A
Passengers Revenue Hours Revenue Miles
Operating Costs Passenger Revenue Operating Subsidy
87073
97647 98886
95506
80000
85000
90000
95000
100000
FY 2013 FY 2014 FY 2015 FY 2016 FY 2017
Passengers
8322
9172 9226
9607
7500
8000
8500
9000
9500
10000
FY 2013 FY 2014 FY 2015 FY 2016 FY 2017
Revenue Hours
$772570
$800242
$831623
$889019
$700000
$750000
$800000
$850000
$900000
FY 2013 FY 2014 FY 2015 FY 2016 FY 2017
Operating Costs
105 106 107 99
00
20
40
60
80
100
120
140
FY 2013 FY 2014 FY 2015 FY 2016 FY 2017
Passengers per Revenue Hour
$797 $714 $719
$824
$000$200$400$600$800
$1000$1200$1400
FY 2013 FY 2014 FY 2015 FY 2016 FY 2017
Subsidy per Passenger
$9284 $8725 $9014 $9254
$0
$50
$100
$150
$200
FY 2013 FY 2014 FY 2015 FY 2016 FY 2017
Cost per Revenue Hour
257Local Connector
Days of Service WkdyAvg Freq (Wkdy Peak) 60 min
Avg Freq (Wkdy Non-Peak) 60 minAvg Freq (Wked) -
FY 2017 Farebox Recovery 12 transfer (to route) 6
Clipper usage 13
Annual Avg Monthly Avg Daily Annual Avg Monthly Avg Daily Annual Avg Monthly Avg DailyWeekday 69126 5761 273 7643 637 30 85748 7146 339 Saturday - - - - - - - - - Sunday - - - - - - - - -
Total 69126 5761 273 7643 637 30 85748 7146 339
Annual Avg Monthly Avg Daily Annual Avg Monthly Avg Daily Annual Avg Monthly Avg DailyWeekday $697953 $58163 $2759 $82621 $6885 $327 $615332 $51278 $2432Saturday $ - $ - $ - $ - $ - $ - $ - $ - $ -Sunday $ - $ - $ - $ - $ - $ - $ - $ - $ -
Total $697953 $58163 $2759 $82621 $6885 $327 $615332 $51278 $2432
Passengers per Revenue Hour
Subsidy per Passenger
Cost per Revenue Hour
Farebox Recovery
Weekday 90 $890 $9132 118Saturday - $ - $ - - Sunday - $ - $ - -
Total 90 $890 $9132 118
Passengers Revenue Hours Operating CostsPassenger
RevenueOperating Subsidy
Passengers per Revenue Hour
Subsidy per Passenger
Cost per Revenue Hour
Farebox Recovery
FY 2015 69984 6289 $546363 $73402 $472961 111 $676 $8687 134FY 2016 71429 6414 $575805 $83288 $492517 111 $690 $8977 145FY 2017 69126 7643 $697953 $82621 $615332 90 $890 $9132 118
Histo
ric Tr
ends
FY 20
161
7 DAT
A
Passengers Revenue Hours Revenue Miles
Operating Costs Passenger Revenue Operating Subsidy
35511
68515 69984 71429 69126
01000020000300004000050000600007000080000
FY 2013 FY 2014 FY 2015 FY 2016 FY 2017
Passengers
2909
5965 6289 6414 7643
0
2000
4000
6000
8000
10000
FY 2013 FY 2014 FY 2015 FY 2016 FY 2017
Revenue Hours
$263500
$555608 $546363 $575805
$697953
$0$100000$200000$300000$400000$500000$600000$700000$800000
FY 2013 FY 2014 FY 2015 FY 2016 FY 2017
Operating Costs
122 115 111 111
90
00
20
40
60
80
100
120
140
FY 2013 FY 2014 FY 2015 FY 2016 FY 2017
Passengers per Revenue Hour
$625 $721 $676 $690
$890
$000$200$400$600$800
$1000$1200$1400
FY 2013 FY 2014 FY 2015 FY 2016 FY 2017
Subsidy per Passenger
$9057 $9315 $8687 $8977 $9132
$0
$50
$100
$150
$200
FY 2013 FY 2014 FY 2015 FY 2016 FY 2017
Cost per Revenue Hour
Hdn ValleyYellow Bus
Days of Service School DaysAvg Freq (Wkdy Peak) 2 trips
Avg Freq (Wkdy Non-Peak) -Avg Freq (Wked) -
FY 2017 Farebox Recovery 26 transfer (to route) -
Clipper usage -
Annual Avg Monthly Avg Daily Annual Avg Monthly Avg Daily Annual Avg Monthly Avg DailyWeekday 9281 844 52 180 16 1 1638 149 9 Saturday - - - - - - - - - Sunday - - - - - - - - -
Total 9281 844 52 180 16 1 1638 149 9
Annual Avg Monthly Avg Daily Annual Avg Monthly Avg Daily Annual Avg Monthly Avg DailyWeekday $124763 $11342 $693 $32170 $2925 $179 $92593 $8418 $514Saturday $ - $ - $ - $ - $ - $ - $ - $ - $ -Sunday $ - $ - $ - $ - $ - $ - $ - $ - $ -
Total $124763 $11342 $693 $32170 $2925 $179 $92593 $8418 $514
Passengers per Revenue Hour
Subsidy per Passenger
Cost per Revenue Hour
Farebox Recovery
Weekday 516 $998 $69313 258Saturday - $ - $ - - Sunday - $ - $ - -
Total 516 $998 $69313 258
Passengers Revenue Hours Operating CostsPassenger
RevenueOperating Subsidy
Passengers per Revenue Hour
Subsidy per Passenger
Cost per Revenue Hour
Farebox Recovery
FY 2015FY 2016 8669 211 $140482 $25658 $114824 412 $1325 $66706 183FY 2017 9281 180 $124763 $32170 $92593 516 $998 $69313 258
Histo
ric Tr
ends
FY 20
161
7 DAT
A
Passengers Revenue Hours Revenue Miles
Operating Costs Passenger Revenue Operating Subsidy
8669 9281
0
2000
4000
6000
8000
10000
FY 2013 FY 2014 FY 2015 FY 2016 FY 2017
Passengers211
180
0
50
100
150
200
250
FY 2013 FY 2014 FY 2015 FY 2016 FY 2017
Revenue Hours$140482
$124763
$0$20000$40000$60000$80000
$100000$120000$140000$160000
FY 2013 FY 2014 FY 2015 FY 2016 FY 2017
Operating Costs
412 516
00
500
1000
1500
2000
FY 2013 FY 2014 FY 2015 FY 2016 FY 2017
Passengers per Revenue Hour
$1325
$998
$000
$200
$400
$600
$800
$1000
$1200
$1400
FY 2013 FY 2014 FY 2015 FY 2016 FY 2017
Subsidy per Passenger
$66706 $69313
$0$100$200$300$400$500$600$700$800
FY 2013 FY 2014 FY 2015 FY 2016 FY 2017
Cost per Revenue Hour
White HillYellow Bus
Days of Service School DaysAvg Freq (Wkdy Peak) 17 trips
Avg Freq (Wkdy Non-Peak) -Avg Freq (Wked) -
FY 2017 Farebox Recovery 60 transfer (to route) -
Clipper usage -
Annual Avg Monthly Avg Daily Annual Avg Monthly Avg Daily Annual Avg Monthly Avg DailyWeekday 127219 11565 707 1065 97 6 12096 1100 67 Saturday - - - - - - - - - Sunday - - - - - - - - -
Total 127219 11565 707 1065 97 6 12096 1100 67
Annual Avg Monthly Avg Daily Annual Avg Monthly Avg Daily Annual Avg Monthly Avg DailyWeekday $738585 $67144 $4103 $440896 $40081 $2449 $297689 $27063 $1654Saturday $ - $ - $ - $ - $ - $ - $ - $ - $ -Sunday $ - $ - $ - $ - $ - $ - $ - $ - $ -
Total $738585 $67144 $4103 $440896 $40081 $2449 $297689 $27063 $1654
Passengers per Revenue Hour
Subsidy per Passenger
Cost per Revenue Hour
Farebox Recovery
Weekday 1194 $234 $69325 597Saturday - $ - $ - - Sunday - $ - $ - -
Total 1194 $234 $69325 597
Passengers Revenue Hours Operating CostsPassenger
RevenueOperating Subsidy
Passengers per Revenue Hour
Subsidy per Passenger
Cost per Revenue Hour
Farebox Recovery
FY 2015FY 2016 129635 870 $579937 $385753 $194184 1491 $150 $66698 665FY 2017 127219 1065 $738585 $440896 $297689 1194 $234 $69325 597
Histo
ric Tr
ends
FY 20
161
7 DAT
A
Passengers Revenue Hours Revenue Miles
Operating Costs Passenger Revenue Operating Subsidy
129635 127219
0
20000
40000
60000
80000
100000
120000
140000
FY 2013 FY 2014 FY 2015 FY 2016 FY 2017
Passengers
870
1065
0
200
400
600
800
1000
1200
FY 2013 FY 2014 FY 2015 FY 2016 FY 2017
Revenue Hours
$579937
$738585
$0$100000$200000$300000$400000$500000$600000$700000$800000
FY 2013 FY 2014 FY 2015 FY 2016 FY 2017
Operating Costs
1491
1194
00200400600800
1000120014001600
FY 2013 FY 2014 FY 2015 FY 2016 FY 2017
Passengers per Revenue Hour
$150 $234
$000
$200
$400
$600
$800
$1000
$1200
$1400
FY 2013 FY 2014 FY 2015 FY 2016 FY 2017
Subsidy per Passenger$66698 $69325
$0$100$200$300$400$500$600$700$800
FY 2013 FY 2014 FY 2015 FY 2016 FY 2017
Cost per Revenue Hour
MARIN TRANSIT | 2018ndash2027 SHORT RANGE TRANSIT PLAN Chapter 4 Capital Plan
DRAFT 4-9
Table 4-7 Local Transit Bus Replacement Schedule
Fiscal Year (In-service)
Replacements
Total Cost
Local Share Vehicle Type Seating
Capacity Service(1)
FY 201718 10 $7710000 $1387800 40ft hybrid 39 LB
2 $1662000 $332404 35ft Electric 32 LB
FY 201819
1 $125000 $22500 24ft 20 SH
4 $1600000 $1094880 29ft XHF
(upgrade) 22 SG
FY 201920 10 $8940000 $1609200 60ft 63 LB
FY 202021 8 $1032000 $185760 24ft 20 SH
2 $850000 $153000 35ft XHF 37 MW
FY 202223
7 $5584578 $1005224 35ft hybrid 32 LB
2 $874182 $599281 29ft XHF
(upgrade) 22 SG
FY 202425 3 $1393227 $250781 35ft XHF 37 MW
FY 202526 2 $299093 $53837 24ft 20 SH
5 $2391706 $430507 35ft XHF 37 MW
FY 202627 - - - - - -
Notes (1) Service Types LB ndash Big Bus SH- Shuttle SG- Rural Stagecoach MW- Seasonal Muir Woods and School
Expansion Needs When considering service expansion vehicles are often a constraint on the amount of service that can be added Expansion vehicles are a lower priority in the regional capital plan and typically do not receive federal funds Local state or discretionary grants are required to expand fleets The capital plan does not include any expansion vehicles for the local fixed route program consistent with the current service plan
Marin Transit relies on three retired active vehicles to support operations Retired active vehicles are vehicles that are beyond their FTA-determined useful life that remain in service while their replacements are added the fleet The District intends to replace these as expansion vehicles if funding becomes available
Demand Response Vehicles
Marin Transit has 58 vehicles available for local and regional paratransit service To provide an adequate number of spare vehicles a maximum of about 46 vehicles in service Marin Transit owns 32 vehicles GGBHTD owns 14 and the contractor provides another 13 vehicles to support the operations Eleven of the 13 contractor vehicles will be replaced in early 2018 - five by the District and six by GGBHTD Two of the five replaced by the District will be replaced with smaller accessible vans These will be used for same day
Fixed-Route Passengers (incl Yellow Bus) by Month
July August September October November December January February March April May June
Prior Fiscal Year Passengers Current Fiscal Year PassengersPrior Fiscal Year Passengers Current Fiscal Year Passengers
0
80000
160000
240000
320000
244439
271284484271284
296637296637
2768532276853
252829252829
238010238010
219681219681
2097050505209705
277644277644
240773240773240773240773
284816284816
24935149492493512444392444392442 43999244439244244439439244439244244439999999244200
2600562602600 0000000260056
FISCAL YEAR
2018
Demand Response Passengers by Month
July August September October November December January February March April May June
Prior Fiscal Year Passengers Current Fiscal Year PassengersPrior Fiscal Year Passengers Current Fiscal Year Passengers
0
4000
8000
12000
16000
12 77312773
13631 1362813628 1356413564
1247712477
1206712067 1212412124118100011810
1364613646
1260912609
1359313593
12950129501277312 77312 77312 77312613131612 6133312 6133312613331277312773127731277312613
13 6311363113 631135641363113 613631311363113 6136313113564
Year-to-Date Ridership Trends
Item 3b
2
Average Systemwide Daily Passengers
Weekday Saturday Sunday
Prior Fiscal Year Average Daily Passengers Current Fiscal Year Average Daily PassengersPrior Fiscal Year Average Daily Passengers Current Fiscal Year Average Daily Passengers
0
3000
6000
9000
12000
11370113701109811098
7726772674407440
66576657
60556055
Productivity (paxhr) by Typology
1 Local T
runklin
e
2 Local B
asic
3 Local C
onnecto
r
5 R
ura
l
8 R
ecre
ational
9 D
em
and R
esponse
Prior Fiscal Year Productivity Current Fiscal Year ProductivityPrior Fiscal Year Productivity Current Fiscal Year Productivity
00
80
160
240
320
249249 252252
163163
14814 8148
9292 91918181
757 575
320320
275275
2323 2121
Monthly StatisticsMONTH
August
1 Local Trunkline Routes 35 36 71X
2 Local Basic Routes 17 22 23 23X 29 49
3 Local Connector Routes 219 228 233 245 251 257
5 Rural Routes 61 68
8 Recreational Routes 6666F
9 Demand Response Local Paratransit Novato Dial-A-Ride Rural Dial-A-Ride
Route Typologies
Item 3b
3
Fixed-Route Passengers (incl Yellow Bus) by Month
July August September October November December January February March April May June
Prior Fiscal Year Passengers Current Fiscal Year Passengers
0
80000
160000
240000
320000
244439244439
271284271284
296637296637
276853276853
252829252829
238010238010
219681219681209705209705
277644277644
240773240773
284816284816
249351249351244200244200
260056260056
282441282441
FISCAL YEAR
2018
Demand Response Passengers by Month
July August September October November December January February March April May June
Prior Fiscal Year Passengers Current Fiscal Year Passengers
0
4000
8000
12000
16000
1277312773
1363113631 1362813628 1356413564
12477124771206712067 1212412124
1181011810
1364613646
1260912609
1359313593
12950129501261312613
1356413564 1342713427
Year-to-Date Ridership Trends
Monthly Monitoring Report 11022017
Page 12Item 3b
2
Average Systemwide Daily Passengers
Weekday Saturday Sunday
Prior Fiscal Year Average Daily Passengers Current Fiscal Year Average Daily Passengers
0
3000
6000
9000
12000 11848118481161311613
73637363
67876787
6126612657395739
Productivity (paxhr) by Typology
1 L
ocal
Tru
nklin
e
2 L
ocal
Bas
ic
3 L
ocal
Con
nect
or
5 R
ural
8 R
ecre
atio
nal
9 D
eman
d R
espo
nse
Prior Fiscal Year Productivity Current Fiscal Year Productivity
00
80
160
240
320
278278 274274
174174 168168
9898 9797
7676 7676
304304
222222
2323 2222
Monthly StatisticsMONTH
September
1 Local Trunkline Routes 35 36 71X
2 Local Basic Routes 17 22 23 23X 29 49
3 Local Connector Routes 219 228 233 245 251 257
5 Rural Routes 61 68
8 Recreational Routes 6666F
9 Demand Response Local Paratransit Novato Dial-A-Ride Rural Dial-A-Ride
Route Typologies
Page 22Item 3b
3
Fixed-Route Passengers (incl Yellow Bus) by Month
July August September October November December January February March April May June
Prior Fiscal Year Passengers Current Fiscal Year Passengers
0
80000
160000
240000
320000
244439244439
271284271284
296637296637
276853276853
252829252829
238010238010
219681219681209705209705
277644277644
240773240773
284816284816
249351249351244200244200
260056260056
282441282441 282922282922
FISCAL YEAR
2018
Demand Response Passengers by Month
July August September October November December January February March April May June
Prior Fiscal Year Passengers Current Fiscal Year Passengers
0
4000
8000
12000
16000
1277312773
1363113631 1362813628 1356413564
12477124771206712067 1212412124
1181011810
1364613646
1260912609
1359313593
12950129501261312613
1356413564 13427134271373413734
Year-to-Date Ridership Trends
Monthly Monitoring Report 12082017
Page 12Item 3b
2
Average Systemwide Daily Passengers
Weekday Saturday Sunday
Prior Fiscal Year Average Daily Passengers Current Fiscal Year Average Daily Passengers
0
3000
6000
9000
120001125811258 1115111151
6043604364326432
4717471750675067
Productivity (paxhr) by Typology
1 L
ocal
Tru
nklin
e
2 L
ocal
Bas
ic
3 L
ocal
Con
nect
or
5 R
ural
8 R
ecre
atio
nal
9 D
eman
d R
espo
nse
Prior Fiscal Year Productivity Current Fiscal Year Productivity
00
70
140
210
280258258
270270
163163 161161
9696 9595
6363 7070
202202190190
2323 2121
Monthly StatisticsMONTH
October
1 Local Trunkline Routes 35 36 71X
2 Local Basic Routes 17 22 23 23X 29 49
3 Local Connector Routes 219 228 233 245 251 257
5 Rural Routes 61 68
8 Recreational Routes 6666F
9 Demand Response Local Paratransit Novato Dial-A-Ride Rural Dial-A-Ride
Route Typologies
Page 22Item 3b
3
- RFP - OampM for Fixed Route Service - Addendum 3 12-18-2017
- MV Fee Schedule
- Airporter Fee Schedule
- FY2017Performance
-
- System Performance Summary for FY 201617
-
- Fixed Route
- Yellow Bus
- Demand Response
- Other Services
-
- Performance Goals
- Ridership Trends
- FY 201718 Performance Outlook
-
- Attachment A Route Profiles
-
- Local Transit Bus Replacement Schedule
- August 2017 Monthly Monitoring Report
- September 2017 Monthly Monitoring Report
- October 2017 Monthly Monitoring Report
-
4
In FY 201617 there was a 34 increase in the number of canceled trips Almost half of these canceled trips occurred in February due to heavy rains that caused flooding and school closures In June 2016 Marin Transit implemented a major service change One of the main goals of the service restructuring was to reduce the need to transfer by providing faster and more direct connections While this approach improves the system for riders it has implications in terms of how ridership is counted and on performance metrics The number of passengers is measured in terms of unlinked passenger trips Each time a person boards a bus is counted as a separate trip regardless of whether that person is transferring from another bus Reducing the amount of transfers needed to complete a riderrsquos journey reduces the number of unlinked trips Replacing trips that require a transfer with direct trips to destinations does not change the number of individual riders using the system which is defined as linked passenger trips In FY 201617 there was a 75 overall decrease in the number of transfers for passengers using cash to pay their original fare Some of this decline reflects the systemwide decrease in ridership The transfer ratio is defined as the number of boarding trips (unlinked passenger trips) divided by the number of originating trips (linked passenger trips) This ratio can be used to evaluate the impact of transfers on ridership independent of other factors In FY 201617 the overall transfer ratio dropped 38 from 136 to 131 When estimating linked passenger trips based on these ratios the number of individual Marin Transit passengers in FY 201617 remained relatively constant compared to last year Demand for Marin Access mobility management programs declined overall 47 from FY 201516 to FY 201617 Changes in ridership varied from program to program The largest decline was on Catch-A-Ride which experienced a 129 decrease in ridership Local paratransit and Novato Dial-A-Ride ridership may have been affected by many of the same external factors as fixed route transit particularly weather It is also possible that paratransit clients have started to shift some or all their trips to services that are not provided by Marin Transit These may include Non-Emergency Medical Transportation services arranged by managed care organizations Private transportation
providers hired under contract to institutions typically served by paratransit (such as adult day care centers) Trips taken on Uber or Lyft and Volunteer transportation services that may be supported by Marin Transit in some way but whose ridership is not
reported in the Districtrsquos performance statistics Furthermore staff attributed much of the previous growth in the Marin Access program to the Catch-A-Ride program This program experienced a 473 increase in ridership between FY 201314 and FY 201415 Towards the end of FY 201415 On the Move one of the largest taxi companies in Marin went out of business To this day service is limited during hours of peak demand and in certain service areas especially Novato Therefore FY 201617 ridership on Catch-A-Ride may reflect two factors These include a slowdown in attracting new customers and a reduction in service availability following On the Moversquos closure Table 2 summarizes the factors that can influence ridership numbers year-over-year and qualitatively evaluates their impact
5
Table 2 Factors Impacting Ridership Comparison
Factor FY 201516 FY 201617 Impact
Calendar
School Days 181 183 --
Weekdays 256 253
Weekends amp Holidays 110 111 --
Muir Woods Shuttle 113 104
Transfer Ratio (ratio of unlinked to linked trips) 136 131
Service Disruptions Canceled service (trips) 200 268
Major detourclosure (days) (1) 18 29
Rainfall (inches) 2928 5653
Gas Prices $298 $291 --
Unemployment Rate 32 32 -- Notes (1) Data on major detours and closure collected starting January 2016 Comparison includes the months of January through June FY 201718 Performance Outlook
In June 2016 Marin Transit implemented a major service change aimed in part to help underperforming routes meet established performance standards Staff has continued to monitor service performance and has made minor adjustments to improve on-time performance and cancel low-ridership trips In early 2018 staff is planning a comprehensive assessment of service performance since the June 2016 service changes This effort will include data from a recently completed onboard survey from April 2017 on passenger origins and destinations and a 100 passenger ridecheck The ridecheck will provide data on stop-level ridership activity for each route The assessment will use this analysis to recommend service changes to improve underperforming routes There are several unknowns that may also affect route performance primarily in terms of operating costs The District relies on its contractors to either lease or own property to store and maintain the vehicles needed to operate service For contractors that do not own suitable property finding and leasing these types of facilities in Marin County is challenging and expensive Recent surveys of current and potential service providers identified securing a facility as the most significant factor in determining their interest in bidding on Marin Transit services ability to provide the service and proposed pricing Marin Transit has been actively working to secure and develop its own operations and maintenance facility A District-owned facility will eliminate the need for potential service providers to lease property and lower operating costs It may also improve efficiency by reducing deadhead or non-revenue time when vehicles are traveling to and from the yard and further lower the Districtrsquos contract rates In late 2017 Marin Transit will release for bid over half of its fixed-route service and there are many uncertainties that may affect the outcome The tight labor market in Marin County and the greater Bay Area has made it difficult for service providers to hire and retain employees Potential contractors are required to secure property in a County with limited real estate opportunities If the District provides its own facility there will be more interest among potential bidders and more competitive rates
6
Table 3 System-wide Performance Statistics FY 201617 (unaudited)
Route Passengers Revenue
Hours Operating
Costs Passenger
Revenue Pass Trips Per
Rev Hr (Trip) Subsidy Per
Passenger Farebox
Recovery Fixed Route 2925522 178052 $20173419 $3550259 164 $568 176 Local Trunkline 1122188 44393 $6252940 $1263870 253 $445 202
35 658869 23052 $3234308 $729775 286 $380 226 36 342178 13636 $1901678 $369132 251 $448 194
71X 121141 7705 $1116954 $164963 157 $786 148 Local Basic 989500 65117 $7451946 $1221298 152 $630 164
17 247998 14757 $2076786 $319761 168 $708 154 22 215758 17553 $1619319 $273059 123 $624 169 23 199150 11065 $1508659 $246908 180 $634 164
23X 49255 3445 $473413 $57438 143 $845 121 29 40103 3707 $509475 $49634 108 $1147 97 49 237236 14590 $1264294 $274498 163 $417 217
Local Connector 378985 42396 $3873801 $461426 89 $900 119 219 50449 6392 $591224 $64101 79 $1045 108 228 71340 10042 $904806 $103912 71 $1123 115 233 42798 4363 $399203 $52001 98 $811 130 245 49766 4349 $391596 $56968 114 $672 145 251 95506 9607 $889019 $101823 99 $824 115 257 69126 7643 $697953 $82621 90 $890 118
Supplemental 179947 3963 $514380 $110503 454 (286) $224 215 113 16829 317 $42180 $12227 530 (315) $178 290 115 14021 637 $87534 $9504 220 (185) $557 109 117 34820 640 $81509 $17140 544 (284) $185 210 119 27161 374 $56273 $18859 727 (313) $138 335 125 13757 600 $72469 $11570 229 (193) $443 160 139 6414 253 $33182 $6635 253 (179) $414 200 145 16406 191 $25426 $7258 861 (372) $111 285 151 36801 594 $73842 $18463 620 (428) $150 250 154 13738 358 $41965 $8847 384 (255) $241 211
Recreational 122116 4316 $473726 $249748 283 $183 527 66 122116 4316 $473726 $249748 283 $183 527
Rural 112926 16172 $1422683 $122407 70 $1151 86 61 36328 5492 $475778 $39959 66 $1200 84 68 76598 10680 $946905 $82448 72 $1129 87
Partnership 19860 1696 $183943 $121007 117 $317 658 122 19860 1696 $183943 $121007 117 $317 658
Yellow Bus 136500 1245 $863348 $473066 1096 (448) $286 548 Hidden Valley 9281 180 $124763 $32170 516 (265) $998 258
White Hill 127219 1065 $738585 $440896 1194 (471) $234 597 Demand Response 124325 55191 $4571296 $236980 23 $3486 52
Local Paratransit 119673 53011 $4404928 $226387 23 $3492 51 Novato DAR 4057 1856 $150815 $8815 22 $3487 58
Dillon Beach DAR 488 260 $12511 $1356 19 $2285 108 Pt Reyes DAR 107 64 $3042 $422 17 $2447 139
Other Services 30547 - $511316 $41956 - $1537 82 Volunteer Driver(1) 16162 - $152714 - - $945 -
Catch-A-Ride(1) 14385 - $358602 $41956 - $2201 117 Total 3216894 234489 $26118572 $4302085 136 $678 165
Notes Values in red indicate performance that does not meet District
7
Figure 1 FY 201617 Passengers per Revenue Hour by Route
0
5
10
15
20
25
30
35
40
45
50Lo
cal T
runk
line T
otals 35 36 71
X
Loca
l Bas
ic To
tals 17 22 23 23X 29 49
Loca
l Con
necto
r Tot
als 219
228
233
245
251
257
Supp
lemen
tal T
otals 11
311
511
711
912
513
914
515
115
4
Recre
ation
al To
tals 66
Rura
l Tot
als 61 68
Dem
and R
espo
nse T
otals
Loca
l Par
atra
nsit
Nova
to D
ARDi
llon D
ARPt
Reye
s DAR
Pass
enge
rs p
er R
even
ue H
our
meets goalservice standard
does not meet goal
school routes show passengers per trip
8
Figure 2 FY 201617 Subsidy per Passenger by Route
$0
$5
$10
$15
$20
$25
$30
$35
$40
Loca
l Tru
nklin
e Tot
als 35 36 71X
Loca
l Bas
ic To
tals 17 22 23 23X 29 49
Loca
l Con
necto
r Tot
als 219
228
233
245
251
257
Supp
lemen
tal T
otals 11
311
511
711
912
513
914
515
115
4
Recre
ation
al To
tals 66
Rura
l Tot
als 61 68
Dem
and R
espo
nse T
otals
Loca
l Par
atra
nsit
Nova
to D
ARDi
llon D
ARPt
Reye
s DAR
Subs
idy p
er P
asse
nger
does not meet goal
service standard
meets goal
9
Attachment A Route Profiles 17 Sausalito ndash Marin City ndash Mill Valley ndash San Rafael 22 San Rafael Transit Center ndash San Anselmo ndash Marin City 23 Fairfax ndash San Anselmo ndash San Rafael ndash Canal 23X Manor ndash Fairfax ndash San Anselmo ndash San Rafael ndash Canal 29 Canal ndash San Rafael Transit Center ndash Larkspur ndash College of Marin ndash Marin General 35 Canal ndash San Rafael Transit Center ndash Marin Civic Center ndash Northgate Mall ndash Novato 36 Canal ndash San Rafael Transit Center ndash Marin City 49 Novato ndash Ignacio ndash Hamilton ndash Marin Civic Center ndash San Rafael Transit Center 61 West Marin Stagecoach (Sausalito ndash Marin City ndash Mill Valley ndash Stinson Beach ndash Bolinas) 66 Muir Woods Shuttle 68 West Marin Stagecoach (San Rafael Transit Center ndash San Anselmo ndash Pt Reyes Station ndash Inverness) 71X Novato ndash San Rafael Transit Center ndash Marin City ndash Sausalito 113 Redwood High School ndash Paradise Cay 115 Sausalito ndash Willow Creek ndash Marin City ndash Mill Valley ndash St Hilary 117 Neil Cummins Hall Middle School ndash E Corte Madera ndash Cove School 119 Tiburon ndash Belvedere ndash Redwood High School 122 San Rafael Transit Center ndash San Anselmo ndash College of Marin 125 Lagunitas ndash Sir Francis Drake HS ndash San Anselmo ndash San Rafael 139 Terra Linda High School ndash Lucas Valley 145 Terra Linda High School ndash San Rafael 151 Hamilton ndash Ignacio ndash San Jose Middle School ndash Novato High School ndash San Marin High School 154 Olive ndash San Marin High School ndash Sinaloa Middle School ndash Novato 219 Tiburon ndash Strawberry 228 San Rafael Transit Center ndash Larkspur ndash San Anselmo ndash Fairfax 233 Santa Venetia ndash Marin Civic Center ndash San Rafael Transit Center 245 San Rafael Transit Center ndash Northgate Mall ndash Kaiser ndash Smith Ranch Road 251 San Marin ndash Novato ndash Vintage Oaks ndash IVC ndash Ignacio ndash Hamilton 257 San Rafael ndash Northgate Mall ndash Kaiser ndash Marinwood ndash Hamilton ndash Ignacio ndash IVC Hdn Valley Ross Valley Yellow Bus (Fairfax ndash San Anselmo ndash Hidden Valley ES) White Hill Ross Valley Yellow Bus (San Anselmo ndash Sleepy Hollow ndash Fairfax ndash White Hill MS)
17Local Basic
Days of Service Wkdy Sa SuAvg Freq (Wkdy Peak) 30 min
Avg Freq (Wkdy Non-Peak) 60 minAvg Freq (Wked) 60 min
FY 2017 Farebox Recovery 15 transfer (to route) 25
Clipper usage 16
Annual Avg Monthly Avg Daily Annual Avg Monthly Avg Daily Annual Avg Monthly Avg DailyWeekday 194263 16189 768 11496 958 45 177386 14782 701 Saturday 27564 2297 530 1541 128 30 24621 2052 473 Sunday 26171 2181 436 1720 143 29 27378 2282 456
Total 247998 20667 679 14757 1230 40 229385 19115 628
Annual Avg Monthly Avg Daily Annual Avg Monthly Avg Daily Annual Avg Monthly Avg DailyWeekday $1617108 $134759 $6392 $247041 $20587 $976 $1370067 $114172 $5415Saturday $217536 $18128 $4183 $36894 $3075 $710 $180642 $15054 $3474Sunday $242142 $20179 $4036 $35826 $2986 $597 $206316 $17193 $3439
Total $2076786 $173066 $5690 $319761 $26647 $876 $1757025 $146419 $4814
Passengers per Revenue Hour
Subsidy per Passenger
Cost per Revenue Hour
Farebox Recovery
Weekday 169 $705 $14067 153Saturday 179 $655 $14117 170Sunday 152 $788 $14078 148
Total 168 $708 $14073 154
Passengers Revenue Hours Operating CostsPassenger
RevenueOperating Subsidy
Passengers per Revenue Hour
Subsidy per Passenger
Cost per Revenue Hour
Farebox Recovery
FY 2015 301136 15167 $2108822 $340410 $1768412 199 $587 $13904 161FY 2016 280486 15330 $2041616 $302337 $1739279 183 $620 $13317 148FY 2017 247998 14757 $2076786 $319761 $1757025 168 $708 $14073 154
Histo
ric Tr
ends
FY 20
161
7 DAT
A
Passengers Revenue Hours Revenue Miles
Operating Costs Passenger Revenue Operating Subsidy
277892 322826
301136 280486
247998
0
50000
100000
150000
200000
250000
300000
350000
FY 2013 FY 2014 FY 2015 FY 2016 FY 2017
Passengers
12402 14818 15167 15330 14757
0
5000
10000
15000
20000
FY 2013 FY 2014 FY 2015 FY 2016 FY 2017
Revenue Hours
$1717002
$2179526 $2108822 $2041616 $2076786
$0
$500000
$1000000
$1500000
$2000000
$2500000
FY 2013 FY 2014 FY 2015 FY 2016 FY 2017
Operating Costs
224 218 199 183 168
00
50
100
150
200
250
300
FY 2013 FY 2014 FY 2015 FY 2016 FY 2017
Passengers per Revenue Hour
$504 $558 $587 $620 $708
$000$200$400$600$800
$1000$1200$1400
FY 2013 FY 2014 FY 2015 FY 2016 FY 2017
Subsidy per Passenger
$13845 $14709 $13904 $13317 $14073
$0
$50
$100
$150
$200
FY 2013 FY 2014 FY 2015 FY 2016 FY 2017
Cost per Revenue Hour
22Local Basic
Days of Service Wkdy Sa SuAvg Freq (Wkdy Peak) 30 min
Avg Freq (Wkdy Non-Peak) 60 minAvg Freq (Wked) 60 min
FY 2017 Farebox Recovery 17 transfer (to route) 10
Clipper usage 11
Annual Avg Monthly Avg Daily Annual Avg Monthly Avg Daily Annual Avg Monthly Avg DailyWeekday 184918 15410 731 14244 1187 56 126319 10527 499 Saturday 16752 1396 322 1537 128 30 16232 1353 312 Sunday 14088 1174 235 1773 148 30 18729 1561 312
Total 215758 17980 591 17553 1463 48 161280 13440 442
Annual Avg Monthly Avg Daily Annual Avg Monthly Avg Daily Annual Avg Monthly Avg DailyWeekday $1312992 $109416 $5190 $232926 $19411 $921 $1080066 $90006 $4269Saturday $142334 $11861 $2737 $21235 $1770 $408 $121099 $10092 $2329Sunday $163993 $13666 $2733 $18898 $1575 $315 $145095 $12091 $2418
Total $1619319 $134943 $4436 $273059 $22755 $748 $1346260 $112188 $3688
Passengers per Revenue Hour
Subsidy per Passenger
Cost per Revenue Hour
Farebox Recovery
Weekday 130 $584 $9218 177Saturday 109 $723 $9263 149Sunday 79 $1030 $9251 115
Total 123 $624 $9225 169
Passengers Revenue Hours Operating CostsPassenger
RevenueOperating Subsidy
Passengers per Revenue Hour
Subsidy per Passenger
Cost per Revenue Hour
Farebox Recovery
FY 2015 249148 14777 $2054433 $292215 $1762218 169 $707 $13903 142FY 2016 243635 14872 $1971172 $259453 $1711719 164 $703 $13255 132FY 2017 215758 17553 $1619319 $273059 $1346260 123 $624 $9225 169
Histo
ric Tr
ends
FY 20
161
7 DAT
A
Passengers Revenue Hours Revenue Miles
Operating Costs Passenger Revenue Operating Subsidy
366301
281761 249148 243635
215758
050000
100000150000200000250000300000350000400000
FY 2013 FY 2014 FY 2015 FY 2016 FY 2017
Passengers18061
15083 14777 14872 17553
0
5000
10000
15000
20000
FY 2013 FY 2014 FY 2015 FY 2016 FY 2017
Revenue Hours$2498169
$2220145 $2054433 $1971172
$1619319
$0
$500000
$1000000
$1500000
$2000000
$2500000
$3000000
FY 2013 FY 2014 FY 2015 FY 2016 FY 2017
Operating Costs
203 187 169 164
123
00
50
100
150
200
250
300
FY 2013 FY 2014 FY 2015 FY 2016 FY 2017
Passengers per Revenue Hour
$567 $667 $707 $703 $624
$000$200$400$600$800
$1000$1200$1400
FY 2013 FY 2014 FY 2015 FY 2016 FY 2017
Subsidy per Passenger
$13832 $14720 $13903 $13255
$9225
$0
$50
$100
$150
$200
FY 2013 FY 2014 FY 2015 FY 2016 FY 2017
Cost per Revenue Hour
23Local Basic
Days of Service Wkdy Sa SuAvg Freq (Wkdy Peak) 60 min
Avg Freq (Wkdy Non-Peak) 60 minAvg Freq (Wked) 60 min
FY 2017 Farebox Recovery 16 transfer (to route) 24
Clipper usage 12
Annual Avg Monthly Avg Daily Annual Avg Monthly Avg Daily Annual Avg Monthly Avg DailyWeekday 145707 12142 576 8042 670 32 64277 5356 254 Saturday 28305 2359 544 1434 120 28 11466 956 221 Sunday 25138 2095 419 1589 132 26 12750 1062 212
Total 199150 16596 546 11065 922 30 88492 7374 242
Annual Avg Monthly Avg Daily Annual Avg Monthly Avg Daily Annual Avg Monthly Avg DailyWeekday $1096892 $91408 $4336 $179427 $14952 $709 $917465 $76455 $3626Saturday $195468 $16289 $3759 $35226 $2936 $677 $160242 $13354 $3082Sunday $216299 $18025 $3605 $32255 $2688 $538 $184044 $15337 $3067
Total $1508659 $125722 $4133 $246908 $20576 $676 $1261751 $105146 $3457
Passengers per Revenue Hour
Subsidy per Passenger
Cost per Revenue Hour
Farebox Recovery
Weekday 181 $630 $13640 164Saturday 197 $566 $13629 180Sunday 158 $732 $13612 149
Total 180 $634 $13635 164
Passengers Revenue Hours Operating CostsPassenger
RevenueOperating Subsidy
Passengers per Revenue Hour
Subsidy per Passenger
Cost per Revenue Hour
Farebox Recovery
FY 2015 354706 14168 $1969650 $381111 $1588539 250 $448 $13902 193FY 2016 268218 13154 $1703216 $308138 $1395078 204 $520 $12948 181FY 2017 199150 11065 $1508659 $246908 $1261751 180 $634 $13635 164
Histo
ric Tr
ends
FY 20
161
7 DAT
A
Passengers Revenue Hours Revenue Miles
Operating Costs Passenger Revenue Operating Subsidy
212064
339118 354706
268218
199150
050000
100000150000200000250000300000350000400000
FY 2013 FY 2014 FY 2015 FY 2016 FY 2017
Passengers
8716
14034 14168 13154
11065
02000400060008000
10000120001400016000
FY 2013 FY 2014 FY 2015 FY 2016 FY 2017
Revenue Hours
$1202564
$2061985 $1969650 $1703216
$1508659
$0
$500000
$1000000
$1500000
$2000000
$2500000
FY 2013 FY 2014 FY 2015 FY 2016 FY 2017
Operating Costs
243 242 250
204 180
00
50
100
150
200
250
300
FY 2013 FY 2014 FY 2015 FY 2016 FY 2017
Passengers per Revenue Hour
$455 $494 $448 $520 $634
$000$200$400$600$800
$1000$1200$1400
FY 2013 FY 2014 FY 2015 FY 2016 FY 2017
Subsidy per Passenger
$13797 $14692 $13902 $12948 $13635
$0
$50
$100
$150
$200
FY 2013 FY 2014 FY 2015 FY 2016 FY 2017
Cost per Revenue Hour
23XLocal Basic
Days of Service WkdyAvg Freq (Wkdy Peak) 60 min
Avg Freq (Wkdy Non-Peak) -Avg Freq (Wked) -
FY 2017 Farebox Recovery 12 transfer (to route) 31
Clipper usage 12
Annual Avg Monthly Avg Daily Annual Avg Monthly Avg Daily Annual Avg Monthly Avg DailyWeekday 49255 4105 195 3445 287 14 32408 2701 128 Saturday - - - - - - - - - Sunday - - - - - - - - -
Total 49255 4105 195 3445 287 14 32408 2701 128
Annual Avg Monthly Avg Daily Annual Avg Monthly Avg Daily Annual Avg Monthly Avg DailyWeekday $473413 $39451 $1871 $57438 $4787 $227 $415975 $34665 $1644Saturday $ - $ - $ - $ - $ - $ - $ - $ - $ -Sunday $ - $ - $ - $ - $ - $ - $ - $ - $ -
Total $473413 $39451 $1871 $57438 $4787 $227 $415975 $34665 $1644
Passengers per Revenue Hour
Subsidy per Passenger
Cost per Revenue Hour
Farebox Recovery
Weekday 143 $845 $13744 121Saturday - $ - $ - - Sunday - $ - $ - -
Total 143 $845 $13744 121
Passengers Revenue Hours Operating CostsPassenger
RevenueOperating Subsidy
Passengers per Revenue Hour
Subsidy per Passenger
Cost per Revenue Hour
Farebox Recovery
FY 2015FY 2016 2548 189 $23303 $2272 $21031 135 $825 $12330 97FY 2017 49255 3445 $473413 $57438 $415975 143 $845 $13744 121
Histo
ric Tr
ends
FY 20
161
7 DAT
A
Passengers Revenue Hours Revenue Miles
Operating Costs Passenger Revenue Operating Subsidy
2548
49255
0
10000
20000
30000
40000
50000
60000
FY 2013 FY 2014 FY 2015 FY 2016 FY 2017
Passengers
189
3445
0500
1000150020002500300035004000
FY 2013 FY 2014 FY 2015 FY 2016 FY 2017
Revenue Hours
$23303
$473413
$0
$100000
$200000
$300000
$400000
$500000
FY 2013 FY 2014 FY 2015 FY 2016 FY 2017
Operating Costs
135 143
00
50
100
150
200
250
300
FY 2013 FY 2014 FY 2015 FY 2016 FY 2017
Passengers per Revenue Hour
$825 $845
$000$200$400$600$800
$1000$1200$1400
FY 2013 FY 2014 FY 2015 FY 2016 FY 2017
Subsidy per Passenger
$12330 $13744
$0
$50
$100
$150
$200
FY 2013 FY 2014 FY 2015 FY 2016 FY 2017
Cost per Revenue Hour
29Local Basic
Days of Service WkdyAvg Freq (Wkdy Peak) 60 min
Avg Freq (Wkdy Non-Peak) -Avg Freq (Wked) -
FY 2017 Farebox Recovery 10 transfer (to route) 26
Clipper usage 12
Annual Avg Monthly Avg Daily Annual Avg Monthly Avg Daily Annual Avg Monthly Avg DailyWeekday 40103 3342 159 3707 309 15 37048 3087 146 Saturday - - - - - - - - - Sunday - - - - - - - - -
Total 40103 3342 159 3707 309 15 37048 3087 146
Annual Avg Monthly Avg Daily Annual Avg Monthly Avg Daily Annual Avg Monthly Avg DailyWeekday $509475 $42456 $2014 $49634 $4136 $196 $459841 $38320 $1818Saturday $ - $ - $ - $ - $ - $ - $ - $ - $ -Sunday $ - $ - $ - $ - $ - $ - $ - $ - $ -
Total $509475 $42456 $2014 $49634 $4136 $196 $459841 $38320 $1818
Passengers per Revenue Hour
Subsidy per Passenger
Cost per Revenue Hour
Farebox Recovery
Weekday 108 $1147 $13745 97Saturday - $ - $ - - Sunday - $ - $ - -
Total 108 $1147 $13745 97
Passengers Revenue Hours Operating CostsPassenger
RevenueOperating Subsidy
Passengers per Revenue Hour
Subsidy per Passenger
Cost per Revenue Hour
Farebox Recovery
FY 2015 203632 10795 $1500887 $232286 $1268601 189 $623 $13904 155FY 2016 181786 10502 $1378760 $219997 $1158763 173 $637 $13129 160FY 2017 40103 3707 $509475 $49634 $459841 108 $1147 $13745 97
Histo
ric Tr
ends
FY 20
161
7 DAT
A
Passengers Revenue Hours Revenue Miles
Operating Costs Passenger Revenue Operating Subsidy
238310 225998 203632
181786
40103
0
50000
100000
150000
200000
250000
300000
FY 2013 FY 2014 FY 2015 FY 2016 FY 2017
Passengers12248
10927 10795 10502
3707
0
2000
4000
6000
8000
10000
12000
14000
FY 2013 FY 2014 FY 2015 FY 2016 FY 2017
Revenue Hours$1692980 $1607795 $1500887
$1378760
$509475
$0
$500000
$1000000
$1500000
$2000000
FY 2013 FY 2014 FY 2015 FY 2016 FY 2017
Operating Costs
195 207 189 173
108
00
50
100
150
200
250
300
FY 2013 FY 2014 FY 2015 FY 2016 FY 2017
Passengers per Revenue Hour
$595 $593 $623 $637
$1147
$000$200$400$600$800
$1000$1200$1400
FY 2013 FY 2014 FY 2015 FY 2016 FY 2017
Subsidy per Passenger
$13822 $14714 $13904 $13129 $13745
$0
$50
$100
$150
$200
FY 2013 FY 2014 FY 2015 FY 2016 FY 2017
Cost per Revenue Hour
35Local Trunkline
Days of Service Wkdy Sa SuAvg Freq (Wkdy Peak) 30 min
Avg Freq (Wkdy Non-Peak) 30 minAvg Freq (Wked) 30 min
FY 2017 Farebox Recovery 23 transfer (to route) 17
Clipper usage 8
Annual Avg Monthly Avg Daily Annual Avg Monthly Avg Daily Annual Avg Monthly Avg DailyWeekday 492328 41027 1946 16909 1409 67 224421 18702 887 Saturday 84453 7038 1624 2860 238 55 43336 3611 833 Sunday 82088 6841 1368 3284 274 55 50021 4168 834
Total 658869 54906 1805 23052 1921 63 317778 26482 871
Annual Avg Monthly Avg Daily Annual Avg Monthly Avg Daily Annual Avg Monthly Avg DailyWeekday $2367217 $197268 $9357 $533190 $44433 $2107 $1834027 $152836 $7249Saturday $403729 $33644 $7764 $97853 $8154 $1882 $305876 $25490 $5882Sunday $463362 $38614 $7723 $98732 $8228 $1646 $364630 $30386 $6077
Total $3234308 $269526 $8861 $729775 $60815 $1999 $2504533 $208711 $6862
Passengers per Revenue Hour
Subsidy per Passenger
Cost per Revenue Hour
Farebox Recovery
Weekday 291 $373 $14000 225Saturday 295 $362 $14118 242Sunday 250 $444 $14111 213
Total 286 $380 $14030 226
Passengers Revenue Hours Operating CostsPassenger
RevenueOperating Subsidy
Passengers per Revenue Hour
Subsidy per Passenger
Cost per Revenue Hour
Farebox Recovery
FY 2015 476489 8544 $1187694 $462204 $725490 558 $152 $13901 389FY 2016 472718 9300 $1202986 $544109 $658877 508 $139 $12935 452FY 2017 658869 23052 $3234308 $729775 $2504533 286 $380 $14030 226
Histo
ric Tr
ends
FY 20
161
7 DAT
A
Passengers Revenue Hours Revenue Miles
Operating Costs Passenger Revenue Operating Subsidy
669860 574669
476489 472718
658869
0100000200000300000400000500000600000700000800000
FY 2013 FY 2014 FY 2015 FY 2016 FY 2017
Passengers
9755 8644 8544 9300
23052
0
5000
10000
15000
20000
25000
FY 2013 FY 2014 FY 2015 FY 2016 FY 2017
Revenue Hours
$1345711 $1271601 $1187694 $1202986
$3234308
$0
$500000
$1000000
$1500000
$2000000
$2500000
$3000000
$3500000
FY 2013 FY 2014 FY 2015 FY 2016 FY 2017
Operating Costs
687 665 558
508
286
00100200300400500600700800
FY 2013 FY 2014 FY 2015 FY 2016 FY 2017
Passengers per Revenue Hour
$097 $120 $152 $139
$380
$000
$200
$400
$600
$800
$1000
FY 2013 FY 2014 FY 2015 FY 2016 FY 2017
Subsidy per Passenger
$13796 $14710 $13901 $12935 $14030
$0
$50
$100
$150
$200
FY 2013 FY 2014 FY 2015 FY 2016 FY 2017
Cost per Revenue Hour
36Local Trunkline
Days of Service Wkdy Sa SuAvg Freq (Wkdy Peak) 30 min
Avg Freq (Wkdy Non-Peak) 30 minAvg Freq (Wked) 30 min
FY 2017 Farebox Recovery 19 transfer (to route) 18
Clipper usage 6
Annual Avg Monthly Avg Daily Annual Avg Monthly Avg Daily Annual Avg Monthly Avg DailyWeekday 278217 23185 1100 9938 828 39 133318 11110 527 Saturday 33779 2815 650 1715 143 33 24259 2022 467 Sunday 30182 2515 503 1983 165 33 28002 2334 467
Total 342178 28515 937 13636 1136 37 185579 15465 508
Annual Avg Monthly Avg Daily Annual Avg Monthly Avg Daily Annual Avg Monthly Avg DailyWeekday $1384291 $115358 $5472 $290481 $24207 $1148 $1093810 $91151 $4323Saturday $240062 $20005 $4617 $40774 $3398 $784 $199288 $16607 $3832Sunday $277325 $23110 $4622 $37877 $3156 $631 $239448 $19954 $3991
Total $1901678 $158473 $5210 $369132 $30761 $1011 $1532546 $127712 $4199
Passengers per Revenue Hour
Subsidy per Passenger
Cost per Revenue Hour
Farebox Recovery
Weekday 280 $393 $13930 210Saturday 197 $590 $13999 170Sunday 152 $793 $13984 137
Total 251 $448 $13946 194
Passengers Revenue Hours Operating CostsPassenger
RevenueOperating Subsidy
Passengers per Revenue Hour
Subsidy per Passenger
Cost per Revenue Hour
Farebox Recovery
FY 2015 109347 2894 $402355 $110471 $291884 378 $267 $13905 275FY 2016 119593 3462 $457211 $129715 $327496 345 $274 $13205 284FY 2017 342178 13636 $1901678 $369132 $1532546 251 $448 $13946 194
Histo
ric Tr
ends
FY 20
161
7 DAT
A
Passengers Revenue Hours Revenue Miles
Operating Costs Passenger Revenue Operating Subsidy
106988 103673 109347 119593
342178
050000
100000150000200000250000300000350000400000
FY 2013 FY 2014 FY 2015 FY 2016 FY 2017
Passengers
2878 2822 2894 3462
13636
02000400060008000
10000120001400016000
FY 2013 FY 2014 FY 2015 FY 2016 FY 2017
Revenue Hours
$398410 $415238 $402355 $457211
$1901678
$0
$500000
$1000000
$1500000
$2000000
FY 2013 FY 2014 FY 2015 FY 2016 FY 2017
Operating Costs
372 367 378 345 251
00100200300400500600700800
FY 2013 FY 2014 FY 2015 FY 2016 FY 2017
Passengers per Revenue Hour
$265 $293 $267 $274
$448
$000
$200
$400
$600
$800
$1000
FY 2013 FY 2014 FY 2015 FY 2016 FY 2017
Subsidy per Passenger
$13842 $14713 $13905 $13205 $13946
$0
$50
$100
$150
$200
FY 2013 FY 2014 FY 2015 FY 2016 FY 2017
Cost per Revenue Hour
49Local Basic
Days of Service Wkdy Sa SuAvg Freq (Wkdy Peak) 30 min
Avg Freq (Wkdy Non-Peak) 60 minAvg Freq (Wked) 60 min
FY 2017 Farebox Recovery 22 transfer (to route) 9
Clipper usage 11
Annual Avg Monthly Avg Daily Annual Avg Monthly Avg Daily Annual Avg Monthly Avg DailyWeekday 201564 16797 797 11313 943 45 139528 11627 551 Saturday 18489 1541 356 1517 126 29 18370 1531 353 Sunday 17183 1432 286 1761 147 29 21402 1784 357
Total 237236 19770 650 14590 1216 40 179300 14942 491
Annual Avg Monthly Avg Daily Annual Avg Monthly Avg Daily Annual Avg Monthly Avg DailyWeekday $978903 $81575 $3869 $230134 $19178 $910 $748769 $62397 $2960Saturday $131907 $10992 $2537 $22520 $1877 $433 $109387 $9116 $2104Sunday $153484 $12790 $2558 $21844 $1820 $364 $131640 $10970 $2194
Total $1264294 $105358 $3464 $274498 $22875 $752 $989796 $82483 $2712
Passengers per Revenue Hour
Subsidy per Passenger
Cost per Revenue Hour
Farebox Recovery
Weekday 178 $371 $8653 235Saturday 122 $592 $8698 171Sunday 98 $766 $8718 142
Total 163 $417 $8665 217
Passengers Revenue Hours Operating CostsPassenger
RevenueOperating Subsidy
Passengers per Revenue Hour
Subsidy per Passenger
Cost per Revenue Hour
Farebox Recovery
FY 2015 144262 6349 $882801 $158088 $724713 227 $502 $13905 179FY 2016 147480 6795 $900804 $146345 $754459 217 $512 $13257 162FY 2017 237236 14590 $1264294 $274498 $989796 163 $417 $8665 217
Histo
ric Tr
ends
FY 20
161
7 DAT
A
Passengers Revenue Hours Revenue Miles
Operating Costs Passenger Revenue Operating Subsidy
230943
152259 144262 147480
237236
0
50000
100000
150000
200000
250000
FY 2013 FY 2014 FY 2015 FY 2016 FY 2017
Passengers
9814
6440 6349 6795
14590
02000400060008000
10000120001400016000
FY 2013 FY 2014 FY 2015 FY 2016 FY 2017
Revenue Hours$1362499
$948702 $882801 $900804
$1264294
$0$200000$400000$600000$800000
$1000000$1200000$1400000$1600000
FY 2013 FY 2014 FY 2015 FY 2016 FY 2017
Operating Costs
235 236 227 217
163
00
50
100
150
200
250
300
FY 2013 FY 2014 FY 2015 FY 2016 FY 2017
Passengers per Revenue Hour
$477 $507 $502 $512 $417
$000$200$400$600$800
$1000$1200$1400
FY 2013 FY 2014 FY 2015 FY 2016 FY 2017
Subsidy per Passenger
$13884 $14732 $13905 $13257
$8665
$0
$50
$100
$150
$200
FY 2013 FY 2014 FY 2015 FY 2016 FY 2017
Cost per Revenue Hour
61Rural
Days of Service Wkdy Sa SuAvg Freq (Wkdy Peak) 8 trips
Avg Freq (Wkdy Non-Peak) -Avg Freq (Wked) 16 trips
FY 2017 Farebox Recovery 8 transfer (to route) 7
Clipper usage 11
Annual Avg Monthly Avg Daily Annual Avg Monthly Avg Daily Annual Avg Monthly Avg DailyWeekday 17166 1431 68 2631 219 10 45398 3783 181 Saturday 9922 827 198 1319 110 26 20810 1734 416 Sunday 9240 770 144 1542 129 24 24457 2038 382
Total 36328 3027 100 5492 458 15 90665 7555 248
Annual Avg Monthly Avg Daily Annual Avg Monthly Avg Daily Annual Avg Monthly Avg DailyWeekday $229650 $19138 $915 $17691 $1474 $70 $211959 $17663 $844Saturday $113378 $9448 $2268 $11622 $969 $232 $101756 $8480 $2035Sunday $132750 $11063 $2074 $10646 $887 $166 $122104 $10175 $1908
Total $475778 $39648 $1304 $39959 $3330 $109 $435819 $36318 $1194
Passengers per Revenue Hour
Subsidy per Passenger
Cost per Revenue Hour
Farebox Recovery
Weekday 65 $1235 $8730 77Saturday 75 $1026 $8598 103Sunday 60 $1321 $8607 80
Total 66 $1200 $8663 84
Passengers Revenue Hours Operating CostsPassenger
RevenueOperating Subsidy
Passengers per Revenue Hour
Subsidy per Passenger
Cost per Revenue Hour
Farebox Recovery
FY 2015 39478 5379 $417539 $46324 $371215 73 $940 $7762 111FY 2016 37276 5475 $408987 $48421 $360566 68 $967 $7470 118FY 2017 36328 5492 $475778 $39959 $435819 66 $1200 $8663 84
Histo
ric Tr
ends
FY 20
161
7 DAT
A
Passengers Revenue Hours Revenue Miles
Operating Costs Passenger Revenue Operating Subsidy
30642 33386
39478 37276 36328
0
10000
20000
30000
40000
50000
FY 2013 FY 2014 FY 2015 FY 2016 FY 2017
Passengers
5388
5056
5379 5475 5492
480049005000510052005300540055005600
FY 2013 FY 2014 FY 2015 FY 2016 FY 2017
Revenue Hours
$388827 $390358 $417539 $408987 $475778
$0
$100000
$200000
$300000
$400000
$500000
FY 2013 FY 2014 FY 2015 FY 2016 FY 2017
Operating Costs
57 66
73 68 66
00
20
40
60
80
100
FY 2013 FY 2014 FY 2015 FY 2016 FY 2017
Passengers per Revenue Hour
$1136 $1045
$940 $967
$1200
$000$200$400$600$800
$1000$1200$1400
FY 2013 FY 2014 FY 2015 FY 2016 FY 2017
Subsidy per Passenger
$7216 $7721 $7762 $7470 $8663
$0
$50
$100
$150
$200
FY 2013 FY 2014 FY 2015 FY 2016 FY 2017
Cost per Revenue Hour
66Recreational
Days of Service Wkdy Sa SuAvg Freq (Wkdy Peak) 30 min
Avg Freq (Wkdy Non-Peak) 30 minAvg Freq (Wked) 10-20 min
FY 2017 Farebox Recovery 53 transfer (to route) 0
Clipper usage 0
Annual Avg Monthly Avg Daily Annual Avg Monthly Avg Daily Annual Avg Monthly Avg DailyWeekday 21940 7313 549 804 268 20 10735 3578 268 Saturday 43799 7300 1752 1473 245 59 20480 3413 819 Sunday 56377 6264 1446 2040 227 52 28212 3135 723
Total 122116 13568 1174 4316 480 42 59428 6603 571
Annual Avg Monthly Avg Daily Annual Avg Monthly Avg Daily Annual Avg Monthly Avg DailyWeekday $104033 $34678 $2601 $37751 $12584 $944 $66282 $22094 $1657Saturday $152661 $25444 $6106 $79948 $13325 $3198 $72713 $12119 $2909Sunday $217032 $24115 $5565 $132049 $14672 $3386 $84983 $9443 $2179
Total $473726 $52636 $4555 $249748 $27750 $2401 $223978 $24886 $2154
Passengers per Revenue Hour
Subsidy per Passenger
Cost per Revenue Hour
Farebox Recovery
Weekday 273 $302 $12944 363Saturday 297 $166 $10367 524Sunday 276 $151 $10638 608
Total 283 $183 $10975 527
Passengers Revenue Hours Operating CostsPassenger
RevenueOperating Subsidy
Passengers per Revenue Hour
Subsidy per Passenger
Cost per Revenue Hour
Farebox Recovery
FY 2015 103930 3866 $477523 $209514 $268009 269 $258 $12352 439FY 2016 116942 4673 $531384 $245779 $285605 250 $244 $11373 463FY 2017 122116 4316 $473726 $249748 $223978 283 $183 $10975 527
Histo
ric Tr
ends
FY 20
161
7 DAT
A
Passengers Revenue Hours Revenue Miles
Operating Costs Passenger Revenue Operating Subsidy
62624
103052 103930 116942 122116
0
20000
40000
60000
80000
100000
120000
140000
FY 2013 FY 2014 FY 2015 FY 2016 FY 2017
Passengers
2941
3841 3866
4673 4316
0
1000
2000
3000
4000
5000
FY 2013 FY 2014 FY 2015 FY 2016 FY 2017
Revenue Hours
$330076
$538014 $477523
$531384 $473726
$0
$100000
$200000
$300000
$400000
$500000
$600000
FY 2013 FY 2014 FY 2015 FY 2016 FY 2017
Operating Costs
213
268 269 250
283
00
50
100
150
200
250
300
FY 2013 FY 2014 FY 2015 FY 2016 FY 2017
Passengers per Revenue Hour
$360 $322
$258 $244 $183
$000
$100
$200
$300
$400
$500
FY 2013 FY 2014 FY 2015 FY 2016 FY 2017
Subsidy per Passenger
$11223
$14007 $12352 $11373 $10975
$0
$50
$100
$150
$200
FY 2013 FY 2014 FY 2015 FY 2016 FY 2017
Cost per Revenue Hour
68Rural
Days of Service Wkdy Sa SuAvg Freq (Wkdy Peak) 60 min
Avg Freq (Wkdy Non-Peak) 120 minAvg Freq (Wked) 60-120 min
FY 2017 Farebox Recovery 9 transfer (to route) 13
Clipper usage 12
Annual Avg Monthly Avg Daily Annual Avg Monthly Avg Daily Annual Avg Monthly Avg DailyWeekday 59903 4992 239 7282 607 29 133167 11097 531 Saturday 8410 701 168 1492 124 30 27123 2260 542 Sunday 8285 690 129 1907 159 30 34638 2887 541
Total 76598 6383 210 10680 890 29 194928 16244 534
Annual Avg Monthly Avg Daily Annual Avg Monthly Avg Daily Annual Avg Monthly Avg DailyWeekday $645737 $53811 $2573 $64332 $5361 $256 $581405 $48450 $2316Saturday $131882 $10990 $2638 $9260 $772 $185 $122622 $10219 $2452Sunday $169286 $14107 $2645 $8856 $738 $138 $160430 $13369 $2507
Total $946905 $78909 $2594 $82448 $6871 $226 $864457 $72038 $2368
Passengers per Revenue Hour
Subsidy per Passenger
Cost per Revenue Hour
Farebox Recovery
Weekday 82 $971 $8868 100Saturday 56 $1458 $8841 70Sunday 43 $1936 $8879 52
Total 72 $1129 $8866 87
Passengers Revenue Hours Operating CostsPassenger
RevenueOperating Subsidy
Passengers per Revenue Hour
Subsidy per Passenger
Cost per Revenue Hour
Farebox Recovery
FY 2015 65866 10589 $848305 $80846 $767459 62 $1165 $8011 95FY 2016 70292 10611 $811978 $88808 $723170 66 $1029 $7652 109FY 2017 76598 10680 $946905 $82448 $864457 72 $1129 $8866 87
Histo
ric Tr
ends
FY 20
161
7 DAT
A
Passengers Revenue Hours Revenue Miles
Operating Costs Passenger Revenue Operating Subsidy
48113 56988
65866 70292 76598
0
20000
40000
60000
80000
100000
FY 2013 FY 2014 FY 2015 FY 2016 FY 2017
Passengers
7140 7185
10589 10611 10680
0
2000
4000
6000
8000
10000
12000
FY 2013 FY 2014 FY 2015 FY 2016 FY 2017
Revenue Hours
$532879 $571618
$848305 $811978 $946905
$0
$200000
$400000
$600000
$800000
$1000000
FY 2013 FY 2014 FY 2015 FY 2016 FY 2017
Operating Costs
67 79
62 66 72
00
20
40
60
80
100
FY 2013 FY 2014 FY 2015 FY 2016 FY 2017
Passengers per Revenue Hour
$979 $885
$1165 $1029
$1129
$000$200$400$600$800
$1000$1200$1400
FY 2013 FY 2014 FY 2015 FY 2016 FY 2017
Subsidy per Passenger
$7464 $7955 $8011 $7652 $8866
$0
$50
$100
$150
$200
FY 2013 FY 2014 FY 2015 FY 2016 FY 2017
Cost per Revenue Hour
71XLocal Trunkline
Days of Service WkdyAvg Freq (Wkdy Peak) 30 min
Avg Freq (Wkdy Non-Peak) 60 minAvg Freq (Wked) -
FY 2017 Farebox Recovery 15 transfer (to route) 26
Clipper usage 16
Annual Avg Monthly Avg Daily Annual Avg Monthly Avg Daily Annual Avg Monthly Avg DailyWeekday 121141 10095 479 7705 642 30 174624 14552 690 Saturday - - - - - - - - - Sunday - - - - - - - - -
Total 121141 10095 479 7705 642 30 174624 14552 690
Annual Avg Monthly Avg Daily Annual Avg Monthly Avg Daily Annual Avg Monthly Avg DailyWeekday $1116954 $93080 $4415 $164963 $13747 $652 $951991 $79333 $3763Saturday $ - $ - $ - $ - $ - $ - $ - $ - $ -Sunday $ - $ - $ - $ - $ - $ - $ - $ - $ -
Total $1116954 $93080 $4415 $164963 $13747 $652 $951991 $79333 $3763
Passengers per Revenue Hour
Subsidy per Passenger
Cost per Revenue Hour
Farebox Recovery
Weekday 157 $786 $14496 148Saturday - $ - $ - - Sunday - $ - $ - -
Total 157 $786 $14496 148
Passengers Revenue Hours Operating CostsPassenger
RevenueOperating Subsidy
Passengers per Revenue Hour
Subsidy per Passenger
Cost per Revenue Hour
Farebox Recovery
FY 2015 305440 7666 $1066058 $307659 $758399 398 $248 $13906 289FY 2016 259678 7717 $1075263 $300186 $775077 337 $298 $13934 279FY 2017 121141 7705 $1116954 $164963 $951991 157 $786 $14496 148
Histo
ric Tr
ends
FY 20
161
7 DAT
A
Passengers Revenue Hours Revenue Miles
Operating Costs Passenger Revenue Operating Subsidy
347560 341105 305440
259678
121141
050000
100000150000200000250000300000350000400000
FY 2013 FY 2014 FY 2015 FY 2016 FY 2017
Passengers9038
7578 7666 7717 7705
0
2000
4000
6000
8000
10000
FY 2013 FY 2014 FY 2015 FY 2016 FY 2017
Revenue Hours$1254262
$1116004 $1066058 $1075263 $1116954
$0
$200000
$400000
$600000
$800000
$1000000
$1200000
$1400000
FY 2013 FY 2014 FY 2015 FY 2016 FY 2017
Operating Costs
385 450
398 337
157
00100200300400500600700800
FY 2013 FY 2014 FY 2015 FY 2016 FY 2017
Passengers per Revenue Hour
$253 $222 $248 $298
$786
$000
$200
$400
$600
$800
$1000
FY 2013 FY 2014 FY 2015 FY 2016 FY 2017
Subsidy per Passenger
$13877 $14728 $13906 $13934 $14496
$0
$50
$100
$150
$200
FY 2013 FY 2014 FY 2015 FY 2016 FY 2017
Cost per Revenue Hour
113Supplemental
Days of Service School DaysAvg Freq (Wkdy Peak) 3 trips
Avg Freq (Wkdy Non-Peak) -Avg Freq (Wked) -
FY 2017 Farebox Recovery 29 transfer (to route) 0
Clipper usage 4
Annual Avg Monthly Avg Daily Annual Avg Monthly Avg Daily Annual Avg Monthly Avg DailyWeekday 16829 1530 92 317 29 2 2404 219 13 Saturday - - - - - - - - - Sunday - - - - - - - - -
Total 16829 1530 92 317 29 2 2404 219 13
Annual Avg Monthly Avg Daily Annual Avg Monthly Avg Daily Annual Avg Monthly Avg DailyWeekday $42180 $3835 $230 $12227 $1112 $67 $29953 $2723 $164Saturday $ - $ - $ - $ - $ - $ - $ - $ - $ -Sunday $ - $ - $ - $ - $ - $ - $ - $ - $ -
Total $42180 $3835 $230 $12227 $1112 $67 $29953 $2723 $164
Passengers per TripSubsidy per
PassengerCost per Revenue
HourFarebox Recovery
Weekday 315 $178 $13289 290Saturday - $ - $ - - Sunday - $ - $ - -
Total 315 $178 $13289 290
Passengers Revenue Hours Operating CostsPassenger
RevenueOperating Subsidy Passengers per Trip
Subsidy per Passenger
Cost per Revenue Hour
Farebox Recovery
FY 2015 12241 161 $28599 $10703 $17896 342 $146 $17752 374FY 2016 14601 263 $36924 $12809 $24115 317 $165 $14050 347FY 2017 16829 317 $42180 $12227 $29953 315 $178 $13289 290
Histo
ric Tr
ends
FY 20
161
7 DAT
A
Passengers Revenue Hours Revenue Miles
Operating Costs Passenger Revenue Operating Subsidy
15232 13521
12241 14601
16829
0
5000
10000
15000
20000
FY 2013 FY 2014 FY 2015 FY 2016 FY 2017
Passengers
229
165 161
263
317
0
50
100
150
200
250
300
350
FY 2013 FY 2014 FY 2015 FY 2016 FY 2017
Revenue Hours
$31562
$20182
$28599
$36924 $42180
$0
$10000
$20000
$30000
$40000
$50000
FY 2013 FY 2014 FY 2015 FY 2016 FY 2017
Operating Costs
220
365 342 317 315
00
100
200
300
400
500
FY 2013 FY 2014 FY 2015 FY 2016 FY 2017
Passengers per Trip
$051 $095
$146 $165 $178
$000$100$200$300$400$500$600$700$800
FY 2013 FY 2014 FY 2015 FY 2016 FY 2017
Subsidy per Passenger
$13795 $12261
$17752
$14050 $13289
$0
$50
$100
$150
$200
FY 2013 FY 2014 FY 2015 FY 2016 FY 2017
Cost per Revenue Hour
115Supplemental
Days of Service School DaysAvg Freq (Wkdy Peak) 5 trips
Avg Freq (Wkdy Non-Peak) -Avg Freq (Wked) -
FY 2017 Farebox Recovery 11 transfer (to route) 0
Clipper usage 7
Annual Avg Monthly Avg Daily Annual Avg Monthly Avg Daily Annual Avg Monthly Avg DailyWeekday 14021 1275 71 637 58 3 6963 633 35 Saturday - - - - - - - - - Sunday - - - - - - - - -
Total 14021 1275 71 637 58 3 6963 633 35
Annual Avg Monthly Avg Daily Annual Avg Monthly Avg Daily Annual Avg Monthly Avg DailyWeekday $87534 $7958 $444 $9504 $864 $48 $78030 $7094 $396Saturday $ - $ - $ - $ - $ - $ - $ - $ - $ -Sunday $ - $ - $ - $ - $ - $ - $ - $ - $ -
Total $87534 $7958 $444 $9504 $864 $48 $78030 $7094 $396
Passengers per TripSubsidy per
PassengerCost per Revenue
HourFarebox Recovery
Weekday 185 $557 $13744 109Saturday - $ - $ - - Sunday - $ - $ - -
Total 185 $557 $13744 109
Passengers Revenue Hours Operating CostsPassenger
RevenueOperating Subsidy Passengers per Trip
Subsidy per Passenger
Cost per Revenue Hour
Farebox Recovery
FY 2015 21488 775 $131168 $18863 $112305 221 $523 $16918 144FY 2016 16366 559 $82403 $12638 $69765 168 $426 $14754 153FY 2017 14021 637 $87534 $9504 $78030 185 $557 $13744 109
Histo
ric Tr
ends
FY 20
161
7 DAT
A
Passengers Revenue Hours Revenue Miles
Operating Costs Passenger Revenue Operating Subsidy
13524
21488
16366 14021
0
5000
10000
15000
20000
25000
FY 2013 FY 2014 FY 2015 FY 2016 FY 2017
Passengers
463
775
559 637
0
200
400
600
800
1000
FY 2013 FY 2014 FY 2015 FY 2016 FY 2017
Revenue Hours
$56706
$131168
$82403 $87534
$0
$20000
$40000
$60000
$80000
$100000
$120000
$140000
FY 2013 FY 2014 FY 2015 FY 2016 FY 2017
Operating Costs
232 221 168 185
00
100
200
300
400
500
FY 2013 FY 2014 FY 2015 FY 2016 FY 2017
Passengers per Trip
$362
$523 $426
$557
$000$100$200$300$400$500$600$700$800
FY 2013 FY 2014 FY 2015 FY 2016 FY 2017
Subsidy per Passenger
$12250
$16918 $14754 $13744
$0
$50
$100
$150
$200
FY 2013 FY 2014 FY 2015 FY 2016 FY 2017
Cost per Revenue Hour
117Supplemental
Days of Service School DaysAvg Freq (Wkdy Peak) 6 trips
Avg Freq (Wkdy Non-Peak) -Avg Freq (Wked) -
FY 2017 Farebox Recovery 21 transfer (to route) 0
Clipper usage 2
Annual Avg Monthly Avg Daily Annual Avg Monthly Avg Daily Annual Avg Monthly Avg DailyWeekday 34820 3165 193 640 58 4 4753 432 26 Saturday - - - - - - - - - Sunday - - - - - - - - -
Total 34820 3165 193 640 58 4 4753 432 26
Annual Avg Monthly Avg Daily Annual Avg Monthly Avg Daily Annual Avg Monthly Avg DailyWeekday $81509 $7410 $453 $17140 $1558 $95 $64369 $5852 $358Saturday $ - $ - $ - $ - $ - $ - $ - $ - $ -Sunday $ - $ - $ - $ - $ - $ - $ - $ - $ -
Total $81509 $7410 $453 $17140 $1558 $95 $64369 $5852 $358
Passengers per TripSubsidy per
PassengerCost per Revenue
HourFarebox Recovery
Weekday 284 $185 $12732 210Saturday - $ - $ - - Sunday - $ - $ - -
Total 284 $185 $12732 210
Passengers Revenue Hours Operating CostsPassenger
RevenueOperating Subsidy Passengers per Trip
Subsidy per Passenger
Cost per Revenue Hour
Farebox Recovery
FY 2015 50008 509 $77168 $77528 ($360) 399 ($001) $15158 1005FY 2016 33705 552 $77694 $23478 $54216 269 $161 $14075 302FY 2017 34820 640 $81509 $17140 $64369 284 $185 $12732 210
Histo
ric Tr
ends
FY 20
161
7 DAT
A
Passengers Revenue Hours Revenue Miles
Operating Costs Passenger Revenue Operating Subsidy
35174 34496
50008
33705 34820
0
10000
20000
30000
40000
50000
60000
FY 2013 FY 2014 FY 2015 FY 2016 FY 2017
Passengers
299 341
509 552
640
0
100
200
300
400
500
600
700
FY 2013 FY 2014 FY 2015 FY 2016 FY 2017
Revenue Hours
$41176 $41796
$77168 $77694 $81509
$0
$20000
$40000
$60000
$80000
$100000
FY 2013 FY 2014 FY 2015 FY 2016 FY 2017
Operating Costs
436 406 399
269 284
00
100
200
300
400
500
FY 2013 FY 2014 FY 2015 FY 2016 FY 2017
Passengers per Trip
($012) ($028) ($001)
$161 $185
-$200
-$100
$000
$100
$200
$300
$400
$500
$600
FY 2013 FY 2014 FY 2015 FY 2016 FY 2017
Subsidy per Passenger$13790
$12253
$15158 $14075
$12732
$0$20$40$60$80
$100$120$140$160
FY 2013 FY 2014 FY 2015 FY 2016 FY 2017
Cost per Revenue Hour
119Supplemental
Days of Service School DaysAvg Freq (Wkdy Peak) 5 trips
Avg Freq (Wkdy Non-Peak) -Avg Freq (Wked) -
FY 2017 Farebox Recovery 34 transfer (to route) 0
Clipper usage 5
Annual Avg Monthly Avg Daily Annual Avg Monthly Avg Daily Annual Avg Monthly Avg DailyWeekday 27161 2469 151 374 34 2 6893 627 38 Saturday - - - - - - - - - Sunday - - - - - - - - -
Total 27161 2469 151 374 34 2 6893 627 38
Annual Avg Monthly Avg Daily Annual Avg Monthly Avg Daily Annual Avg Monthly Avg DailyWeekday $56273 $5116 $313 $18859 $1714 $105 $37414 $3401 $208Saturday $ - $ - $ - $ - $ - $ - $ - $ - $ -Sunday $ - $ - $ - $ - $ - $ - $ - $ - $ -
Total $56273 $5116 $313 $18859 $1714 $105 $37414 $3401 $208
Passengers per TripSubsidy per
PassengerCost per Revenue
HourFarebox Recovery
Weekday 313 $138 $15058 335Saturday - $ - $ - - Sunday - $ - $ - -
Total 313 $138 $15058 335
Passengers Revenue Hours Operating CostsPassenger
RevenueOperating Subsidy Passengers per Trip
Subsidy per Passenger
Cost per Revenue Hour
Farebox Recovery
FY 2015 28376 466 $85243 $24699 $60544 319 $213 $18292 290FY 2016 30906 431 $68366 $28456 $39910 317 $129 $15877 416FY 2017 27161 374 $56273 $18859 $37414 313 $138 $15058 335
Histo
ric Tr
ends
FY 20
161
7 DAT
A
Passengers Revenue Hours Revenue Miles
Operating Costs Passenger Revenue Operating Subsidy
27987 28376
30906
27161
25000
26000
27000
28000
29000
30000
31000
32000
FY 2013 FY 2014 FY 2015 FY 2016 FY 2017
Passengers526
466 431
374
0
100
200
300
400
500
600
FY 2013 FY 2014 FY 2015 FY 2016 FY 2017
Revenue Hours
$64440
$85243
$68366 $56273
$0
$20000
$40000
$60000
$80000
$100000
FY 2013 FY 2014 FY 2015 FY 2016 FY 2017
Operating Costs
272 319 317 313
00
100
200
300
400
500
FY 2013 FY 2014 FY 2015 FY 2016 FY 2017
Passengers per Trip
$175 $213 $129 $138
$000$100$200$300$400$500$600$700$800
FY 2013 FY 2014 FY 2015 FY 2016 FY 2017
Subsidy per Passenger
$12251
$18292 $15877 $15058
$0
$50
$100
$150
$200
FY 2013 FY 2014 FY 2015 FY 2016 FY 2017
Cost per Revenue Hour
122Partnership
Days of Service WkdyAvg Freq (Wkdy Peak) -
Avg Freq (Wkdy Non-Peak) 30 minAvg Freq (Wked) -
FY 2017 Farebox Recovery 66 transfer (to route) 9
Clipper usage 6
Annual Avg Monthly Avg Daily Annual Avg Monthly Avg Daily Annual Avg Monthly Avg DailyWeekday 19860 1986 113 1696 170 10 15480 1548 88 Saturday - - - - - - - - - Sunday - - - - - - - - -
Total 19860 1986 113 1696 170 10 15480 1548 88
Annual Avg Monthly Avg Daily Annual Avg Monthly Avg Daily Annual Avg Monthly Avg DailyWeekday $183943 $18394 $1045 $121007 $12101 $688 $62936 $6294 $358Saturday $ - $ - $ - $ - $ - $ - $ - $ - $ -Sunday $ - $ - $ - $ - $ - $ - $ - $ - $ -
Total $183943 $18394 $1045 $121007 $12101 $688 $62936 $6294 $358
Passengers per Revenue Hour
Subsidy per Passenger
Cost per Revenue Hour
Farebox Recovery
Weekday 117 $317 $10844 658Saturday - $ - $ - - Sunday - $ - $ - -
Total 117 $317 $10844 658
Passengers Revenue Hours Operating CostsPassenger
RevenueOperating Subsidy
Passengers per Revenue Hour
Subsidy per Passenger
Cost per Revenue Hour
Farebox Recovery
FY 2015FY 2016 20360 2932 $325230 $149686 $175544 69 $862 $11094 460FY 2017 19860 1696 $183943 $121007 $62936 117 $317 $10844 658
Histo
ric Tr
ends
FY 20
161
7 DAT
A
Passengers Revenue Hours Revenue Miles
Operating Costs Passenger Revenue Operating Subsidy
20360 19860
0
5000
10000
15000
20000
25000
FY 2013 FY 2014 FY 2015 FY 2016 FY 2017
Passengers2932
1696
0
500
1000
1500
2000
2500
3000
3500
FY 2013 FY 2014 FY 2015 FY 2016 FY 2017
Revenue Hours$325230
$183943
$0
$50000
$100000
$150000
$200000
$250000
$300000
$350000
FY 2013 FY 2014 FY 2015 FY 2016 FY 2017
Operating Costs
69
117
00
20
40
60
80
100
120
140
FY 2013 FY 2014 FY 2015 FY 2016 FY 2017
Passengers per Revenue Hour$862
$317
$000
$200
$400
$600
$800
$1000
FY 2013 FY 2014 FY 2015 FY 2016 FY 2017
Subsidy per Passenger
$11094 $10844
$0
$50
$100
$150
$200
FY 2013 FY 2014 FY 2015 FY 2016 FY 2017
Cost per Revenue Hour
125Supplemental
Days of Service School DaysAvg Freq (Wkdy Peak) 4 trips
Avg Freq (Wkdy Non-Peak) -Avg Freq (Wked) -
FY 2017 Farebox Recovery 16 transfer (to route) 1
Clipper usage 8
Annual Avg Monthly Avg Daily Annual Avg Monthly Avg Daily Annual Avg Monthly Avg DailyWeekday 13757 1251 76 600 55 3 8580 780 48 Saturday - - - - - - - - - Sunday - - - - - - - - -
Total 13757 1251 76 600 55 3 8580 780 48
Annual Avg Monthly Avg Daily Annual Avg Monthly Avg Daily Annual Avg Monthly Avg DailyWeekday $72469 $6588 $403 $11570 $1052 $64 $60899 $5536 $338Saturday $ - $ - $ - $ - $ - $ - $ - $ - $ -Sunday $ - $ - $ - $ - $ - $ - $ - $ - $ -
Total $72469 $6588 $403 $11570 $1052 $64 $60899 $5536 $338
Passengers per TripSubsidy per
PassengerCost per Revenue
HourFarebox Recovery
Weekday 193 $443 $12086 160Saturday - $ - $ - - Sunday - $ - $ - -
Total 193 $443 $12086 160
Passengers Revenue Hours Operating CostsPassenger
RevenueOperating Subsidy Passengers per Trip
Subsidy per Passenger
Cost per Revenue Hour
Farebox Recovery
FY 2015 13298 578 $87015 $11914 $75101 186 $565 $15054 137FY 2016 13197 595 $77991 $12684 $65307 182 $495 $13117 163FY 2017 13757 600 $72469 $11570 $60899 193 $443 $12086 160
Histo
ric Tr
ends
FY 20
161
7 DAT
A
Passengers Revenue Hours Revenue Miles
Operating Costs Passenger Revenue Operating Subsidy
8798 7189
13298 13197 13757
02000400060008000
10000120001400016000
FY 2013 FY 2014 FY 2015 FY 2016 FY 2017
Passengers
100 90
578 595 600
0
100
200
300
400
500
600
700
FY 2013 FY 2014 FY 2015 FY 2016 FY 2017
Revenue Hours
$13752 $10979
$87015 $77991
$72469
$0
$20000
$40000
$60000
$80000
$100000
FY 2013 FY 2014 FY 2015 FY 2016 FY 2017
Operating Costs
492
402
186 182 193
00
100
200
300
400
500
FY 2013 FY 2014 FY 2015 FY 2016 FY 2017
Passengers per Trip
$015 $002
$565 $495
$443
$000$100$200$300$400$500$600$700$800
FY 2013 FY 2014 FY 2015 FY 2016 FY 2017
Subsidy per Passenger$13821
$12267
$15054 $13117
$12086
$0$20$40$60$80
$100$120$140$160
FY 2013 FY 2014 FY 2015 FY 2016 FY 2017
Cost per Revenue Hour
139Supplemental
Days of Service School DaysAvg Freq (Wkdy Peak) 2 trips
Avg Freq (Wkdy Non-Peak) -Avg Freq (Wked) -
FY 2017 Farebox Recovery 20 transfer (to route) 0
Clipper usage 24
Annual Avg Monthly Avg Daily Annual Avg Monthly Avg Daily Annual Avg Monthly Avg DailyWeekday 6414 583 36 253 23 1 4127 375 23 Saturday - - - - - - - - - Sunday - - - - - - - - -
Total 6414 583 36 253 23 1 4127 375 23
Annual Avg Monthly Avg Daily Annual Avg Monthly Avg Daily Annual Avg Monthly Avg DailyWeekday $33182 $3017 $184 $6635 $603 $37 $26547 $2413 $147Saturday $ - $ - $ - $ - $ - $ - $ - $ - $ -Sunday $ - $ - $ - $ - $ - $ - $ - $ - $ -
Total $33182 $3017 $184 $6635 $603 $37 $26547 $2413 $147
Passengers per TripSubsidy per
PassengerCost per Revenue
HourFarebox Recovery
Weekday 179 $414 $13110 200Saturday - $ - $ - - Sunday - $ - $ - -
Total 179 $414 $13110 200
Passengers Revenue Hours Operating CostsPassenger
RevenueOperating Subsidy Passengers per Trip
Subsidy per Passenger
Cost per Revenue Hour
Farebox Recovery
FY 2015 5906 225 $36437 $5258 $31179 164 $528 $16173 144FY 2016 6391 315 $43776 $6241 $37535 160 $587 $13880 143FY 2017 6414 253 $33182 $6635 $26547 179 $414 $13110 200
Histo
ric Tr
ends
FY 20
161
7 DAT
A
Passengers Revenue Hours Revenue Miles
Operating Costs Passenger Revenue Operating Subsidy
4232 4026
5906 6391 6414
0
1000
2000
3000
4000
5000
6000
7000
FY 2013 FY 2014 FY 2015 FY 2016 FY 2017
Passengers
226 227 225
315
253
0
50
100
150
200
250
300
350
FY 2013 FY 2014 FY 2015 FY 2016 FY 2017
Revenue Hours
$31306 $27734
$36437
$43776
$33182
$0
$10000
$20000
$30000
$40000
$50000
FY 2013 FY 2014 FY 2015 FY 2016 FY 2017
Operating Costs
120 111 164 160 179
00
100
200
300
400
500
FY 2013 FY 2014 FY 2015 FY 2016 FY 2017
Passengers per Trip
$427
$628 $528
$587
$414
$000$100$200$300$400$500$600$700$800
FY 2013 FY 2014 FY 2015 FY 2016 FY 2017
Subsidy per Passenger
$13834 $12239
$16173 $13880 $13110
$0
$50
$100
$150
$200
FY 2013 FY 2014 FY 2015 FY 2016 FY 2017
Cost per Revenue Hour
145Supplemental
Days of Service School DaysAvg Freq (Wkdy Peak) 2-3 trips
Avg Freq (Wkdy Non-Peak) -Avg Freq (Wked) -
FY 2017 Farebox Recovery 29 transfer (to route) 5
Clipper usage 2
Annual Avg Monthly Avg Daily Annual Avg Monthly Avg Daily Annual Avg Monthly Avg DailyWeekday 16406 1491 90 191 17 1 2175 198 12 Saturday - - - - - - - - - Sunday - - - - - - - - -
Total 16406 1491 90 191 17 1 2175 198 12
Annual Avg Monthly Avg Daily Annual Avg Monthly Avg Daily Annual Avg Monthly Avg DailyWeekday $25426 $2311 $139 $7258 $660 $40 $18168 $1652 $99Saturday $ - $ - $ - $ - $ - $ - $ - $ - $ -Sunday $ - $ - $ - $ - $ - $ - $ - $ - $ -
Total $25426 $2311 $139 $7258 $660 $40 $18168 $1652 $99
Passengers per TripSubsidy per
PassengerCost per Revenue
HourFarebox Recovery
Weekday 372 $111 $13347 285Saturday - $ - $ - - Sunday - $ - $ - -
Total 372 $111 $13347 285
Passengers Revenue Hours Operating CostsPassenger
RevenueOperating Subsidy Passengers per Trip
Subsidy per Passenger
Cost per Revenue Hour
Farebox Recovery
FY 2015 6911 87 $13373 $5858 $7515 337 $109 $15442 438FY 2016 10268 167 $21672 $6341 $15331 396 $149 $12993 293FY 2017 16406 191 $25426 $7258 $18168 372 $111 $13347 285
Histo
ric Tr
ends
FY 20
161
7 DAT
A
Passengers Revenue Hours Revenue Miles
Operating Costs Passenger Revenue Operating Subsidy
6911
10268
16406
0
5000
10000
15000
20000
FY 2013 FY 2014 FY 2015 FY 2016 FY 2017
Passengers
87
167 191
0
50
100
150
200
250
FY 2013 FY 2014 FY 2015 FY 2016 FY 2017
Revenue Hours
$13373
$21672 $25426
$0
$5000
$10000
$15000
$20000
$25000
$30000
FY 2013 FY 2014 FY 2015 FY 2016 FY 2017
Operating Costs
337 396 372
00
100
200
300
400
500
FY 2013 FY 2014 FY 2015 FY 2016 FY 2017
Passengers per Trip
$109 $149 $111
$000$100$200$300$400$500$600$700$800
FY 2013 FY 2014 FY 2015 FY 2016 FY 2017
Subsidy per Passenger
$15442 $12993 $13347
$0
$50
$100
$150
$200
FY 2013 FY 2014 FY 2015 FY 2016 FY 2017
Cost per Revenue Hour
151Supplemental
Days of Service School DaysAvg Freq (Wkdy Peak) 4-5 trips
Avg Freq (Wkdy Non-Peak) -Avg Freq (Wked) -
FY 2017 Farebox Recovery 25 transfer (to route) 1
Clipper usage 4
Annual Avg Monthly Avg Daily Annual Avg Monthly Avg Daily Annual Avg Monthly Avg DailyWeekday 36801 3346 204 594 54 3 10649 968 59 Saturday - - - - - - - - - Sunday - - - - - - - - -
Total 36801 3346 204 594 54 3 10649 968 59
Annual Avg Monthly Avg Daily Annual Avg Monthly Avg Daily Annual Avg Monthly Avg DailyWeekday $73842 $6713 $410 $18463 $1678 $103 $55379 $5034 $308Saturday $ - $ - $ - $ - $ - $ - $ - $ - $ -Sunday $ - $ - $ - $ - $ - $ - $ - $ - $ -
Total $73842 $6713 $410 $18463 $1678 $103 $55379 $5034 $308
Passengers per TripSubsidy per
PassengerCost per Revenue
HourFarebox Recovery
Weekday 428 $150 $12442 250Saturday - $ - $ - - Sunday - $ - $ - -
Total 428 $150 $12442 250
Passengers Revenue Hours Operating CostsPassenger
RevenueOperating Subsidy Passengers per Trip
Subsidy per Passenger
Cost per Revenue Hour
Farebox Recovery
FY 2015 39309 911 $134174 $34376 $99798 315 $254 $14722 256FY 2016 42643 759 $100712 $25851 $74861 456 $176 $13267 257FY 2017 36801 594 $73842 $18463 $55379 428 $150 $12442 250
Histo
ric Tr
ends
FY 20
161
7 DAT
A
Passengers Revenue Hours Revenue Miles
Operating Costs Passenger Revenue Operating Subsidy
39537 39309
42643
36801
32000
34000
36000
38000
40000
42000
44000
FY 2013 FY 2014 FY 2015 FY 2016 FY 2017
Passengers
784 911
759
594
0
200
400
600
800
1000
FY 2013 FY 2014 FY 2015 FY 2016 FY 2017
Revenue Hours
$95932
$134174
$100712
$73842
$0$20000$40000$60000$80000
$100000$120000$140000$160000
FY 2013 FY 2014 FY 2015 FY 2016 FY 2017
Operating Costs
368 315
456 428
00
100
200
300
400
500
FY 2013 FY 2014 FY 2015 FY 2016 FY 2017
Passengers per Trip
$188 $254
$176 $150
$000$100$200$300$400$500$600$700$800
FY 2013 FY 2014 FY 2015 FY 2016 FY 2017
Subsidy per Passenger
$12233
$14722 $13267 $12442
$0$20$40$60$80
$100$120$140$160
FY 2013 FY 2014 FY 2015 FY 2016 FY 2017
Cost per Revenue Hour
154Supplemental
Days of Service School DaysAvg Freq (Wkdy Peak) 3 trips
Avg Freq (Wkdy Non-Peak) -Avg Freq (Wked) -
FY 2017 Farebox Recovery 21 transfer (to route) 0
Clipper usage 5
Annual Avg Monthly Avg Daily Annual Avg Monthly Avg Daily Annual Avg Monthly Avg DailyWeekday 13738 1249 76 358 33 2 4342 395 24 Saturday - - - - - - - - - Sunday - - - - - - - - -
Total 13738 1249 76 358 33 2 4342 395 24
Annual Avg Monthly Avg Daily Annual Avg Monthly Avg Daily Annual Avg Monthly Avg DailyWeekday $41965 $3815 $233 $8847 $804 $49 $33118 $3011 $184Saturday $ - $ - $ - $ - $ - $ - $ - $ - $ -Sunday $ - $ - $ - $ - $ - $ - $ - $ - $ -
Total $41965 $3815 $233 $8847 $804 $49 $33118 $3011 $184
Passengers per TripSubsidy per
PassengerCost per Revenue
HourFarebox Recovery
Weekday 255 $241 $11729 211Saturday - $ - $ - - Sunday - $ - $ - -
Total 255 $241 $11729 211
Passengers Revenue Hours Operating CostsPassenger
RevenueOperating Subsidy Passengers per Trip
Subsidy per Passenger
Cost per Revenue Hour
Farebox Recovery
FY 2015 15376 293 $42604 $13174 $29430 388 $191 $14541 309FY 2016 17858 360 $46133 $14660 $31473 311 $176 $12808 318FY 2017 13738 358 $41965 $8847 $33118 255 $241 $11729 211
Histo
ric Tr
ends
FY 20
161
7 DAT
A
Passengers Revenue Hours Revenue Miles
Operating Costs Passenger Revenue Operating Subsidy
12138
15376 17858
13738
0
5000
10000
15000
20000
FY 2013 FY 2014 FY 2015 FY 2016 FY 2017
Passengers
310 293
360 358
050
100150200250300350400
FY 2013 FY 2014 FY 2015 FY 2016 FY 2017
Revenue Hours
$37913 $42604
$46133 $41965
$0
$10000
$20000
$30000
$40000
$50000
FY 2013 FY 2014 FY 2015 FY 2016 FY 2017
Operating Costs
291
388
311 255
00
100
200
300
400
500
FY 2013 FY 2014 FY 2015 FY 2016 FY 2017
Passengers per Trip
$256 $191 $176
$241
$000$100$200$300$400$500$600$700$800
FY 2013 FY 2014 FY 2015 FY 2016 FY 2017
Subsidy per Passenger
$12246
$14541 $12808
$11729
$0$20$40$60$80
$100$120$140$160
FY 2013 FY 2014 FY 2015 FY 2016 FY 2017
Cost per Revenue Hour
219Local Connector
Days of Service Wkdy Sa SuAvg Freq (Wkdy Peak) 30 min
Avg Freq (Wkdy Non-Peak) 30 minAvg Freq (Wked) 30 min
FY 2017 Farebox Recovery 11 transfer (to route) 20
Clipper usage 11
Annual Avg Monthly Avg Daily Annual Avg Monthly Avg Daily Annual Avg Monthly Avg DailyWeekday 40817 3401 161 5020 418 20 58766 4897 232 Saturday 4888 407 94 637 53 12 10931 911 210 Sunday 4744 395 79 735 61 12 12607 1051 210
Total 50449 4204 138 6392 533 18 82304 6859 225
Annual Avg Monthly Avg Daily Annual Avg Monthly Avg Daily Annual Avg Monthly Avg DailyWeekday $462388 $38532 $1828 $51411 $4284 $203 $410977 $34248 $1624Saturday $59904 $4992 $1152 $6230 $519 $120 $53674 $4473 $1032Sunday $68932 $5744 $1149 $6460 $538 $108 $62472 $5206 $1041
Total $591224 $49269 $1620 $64101 $5342 $176 $527123 $43927 $1444
Passengers per Revenue Hour
Subsidy per Passenger
Cost per Revenue Hour
Farebox Recovery
Weekday 81 $1007 $9212 111Saturday 77 $1098 $9401 104Sunday 65 $1317 $9381 94
Total 79 $1045 $9250 108
Passengers Revenue Hours Operating CostsPassenger
RevenueOperating Subsidy
Passengers per Revenue Hour
Subsidy per Passenger
Cost per Revenue Hour
Farebox Recovery
FY 2015 60906 6585 $569962 $65747 $504215 92 $828 $8656 115FY 2016 55610 6591 $590663 $73164 $517499 84 $931 $8961 124FY 2017 50449 6392 $591224 $64101 $527123 79 $1045 $9250 108
Histo
ric Tr
ends
FY 20
161
7 DAT
A
Passengers Revenue Hours Revenue Miles
Operating Costs Passenger Revenue Operating Subsidy
55543 60906
55610 50449
0
10000
20000
30000
40000
50000
60000
70000
FY 2013 FY 2014 FY 2015 FY 2016 FY 2017
Passengers
5734
6585 6591 6392
520054005600580060006200640066006800
FY 2013 FY 2014 FY 2015 FY 2016 FY 2017
Revenue Hours
$522978
$569962
$590663 $591224
$480000
$500000
$520000
$540000
$560000
$580000
$600000
FY 2013 FY 2014 FY 2015 FY 2016 FY 2017
Operating Costs
97 92 84 79
00
20
40
60
80
100
120
140
FY 2013 FY 2014 FY 2015 FY 2016 FY 2017
Passengers per Revenue Hour
$851 $828 $931
$1045
$000$200$400$600$800
$1000$1200$1400
FY 2013 FY 2014 FY 2015 FY 2016 FY 2017
Subsidy per Passenger
$9121 $8656 $8961 $9250
$0
$50
$100
$150
$200
FY 2013 FY 2014 FY 2015 FY 2016 FY 2017
Cost per Revenue Hour
228Local Connector
Days of Service Wkdy Sa SuAvg Freq (Wkdy Peak) 60 min
Avg Freq (Wkdy Non-Peak) 60 minAvg Freq (Wked) 60 min
FY 2017 Farebox Recovery 11 transfer (to route) 17
Clipper usage 15
Annual Avg Monthly Avg Daily Annual Avg Monthly Avg Daily Annual Avg Monthly Avg DailyWeekday 57316 4776 227 7175 598 28 65884 5490 260 Saturday 8218 685 158 1331 111 26 13020 1085 250 Sunday 5806 484 97 1536 128 26 15023 1252 250
Total 71340 5945 195 10042 837 28 93926 7827 257
Annual Avg Monthly Avg Daily Annual Avg Monthly Avg Daily Annual Avg Monthly Avg DailyWeekday $646194 $53850 $2554 $80857 $6738 $320 $565337 $47111 $2235Saturday $120205 $10017 $2312 $12568 $1047 $242 $107637 $8970 $2070Sunday $138407 $11534 $2307 $10487 $874 $175 $127920 $10660 $2132
Total $904806 $75401 $2479 $103912 $8659 $285 $800894 $66741 $2194
Passengers per Revenue Hour
Subsidy per Passenger
Cost per Revenue Hour
Farebox Recovery
Weekday 80 $986 $9006 125Saturday 62 $1310 $9030 105Sunday 38 $2203 $9011 76
Total 71 $1123 $9010 115
Passengers Revenue Hours Operating CostsPassenger
RevenueOperating Subsidy
Passengers per Revenue Hour
Subsidy per Passenger
Cost per Revenue Hour
Farebox Recovery
FY 2015 15287 2828 $239879 $18274 $221605 54 $1450 $8482 76FY 2016 17522 3185 $280634 $28092 $252542 55 $1441 $8812 100FY 2017 71340 10042 $904806 $103912 $800894 71 $1123 $9010 115
Histo
ric Tr
ends
FY 20
161
7 DAT
A
Passengers Revenue Hours Revenue Miles
Operating Costs Passenger Revenue Operating Subsidy
5854 15287 17522
71340
01000020000300004000050000600007000080000
FY 2013 FY 2014 FY 2015 FY 2016 FY 2017
Passengers
970
2828 3185
10042
0
2000
4000
6000
8000
10000
12000
FY 2013 FY 2014 FY 2015 FY 2016 FY 2017
Revenue Hours
$85183
$239879 $280634
$904806
$0
$200000
$400000
$600000
$800000
$1000000
FY 2013 FY 2014 FY 2015 FY 2016 FY 2017
Operating Costs
60 54 55 71
00
20
40
60
80
100
120
140
FY 2013 FY 2014 FY 2015 FY 2016 FY 2017
Passengers per Revenue Hour$1358
$1450 $1441
$1123
$000$200$400$600$800
$1000$1200$1400
FY 2013 FY 2014 FY 2015 FY 2016 FY 2017
Subsidy per Passenger
$8779 $8482 $8812 $9010
$0
$50
$100
$150
$200
FY 2013 FY 2014 FY 2015 FY 2016 FY 2017
Cost per Revenue Hour
233Local Connector
Days of Service Wkdy Sa SuAvg Freq (Wkdy Peak) 60 min
Avg Freq (Wkdy Non-Peak) 60 minAvg Freq (Wked) 60 min
FY 2017 Farebox Recovery 13 transfer (to route) 16
Clipper usage 10
Annual Avg Monthly Avg Daily Annual Avg Monthly Avg Daily Annual Avg Monthly Avg DailyWeekday 35589 2966 141 3306 276 13 38809 3234 153 Saturday 3911 326 75 490 41 9 5829 486 112 Sunday 3298 275 55 566 47 9 6726 561 112
Total 42798 3567 117 4363 364 12 51364 4280 141
Annual Avg Monthly Avg Daily Annual Avg Monthly Avg Daily Annual Avg Monthly Avg DailyWeekday $302758 $25230 $1197 $42450 $3538 $168 $260308 $21692 $1029Saturday $44829 $3736 $862 $5018 $418 $97 $39811 $3318 $766Sunday $51616 $4301 $860 $4533 $378 $76 $47083 $3924 $785
Total $399203 $33267 $1094 $52001 $4333 $142 $347202 $28934 $951
Passengers per Revenue Hour
Subsidy per Passenger
Cost per Revenue Hour
Farebox Recovery
Weekday 108 $731 $9158 140Saturday 80 $1018 $9141 112Sunday 58 $1428 $9118 88
Total 98 $811 $9151 130
Passengers Revenue Hours Operating CostsPassenger
RevenueOperating Subsidy
Passengers per Revenue Hour
Subsidy per Passenger
Cost per Revenue Hour
Farebox Recovery
FY 2015 50342 4366 $371602 $52526 $319076 115 $634 $8512 141FY 2016 49494 4384 $388005 $59296 $328709 113 $664 $8851 153FY 2017 42798 4363 $399203 $52001 $347202 98 $811 $9151 130
Histo
ric Tr
ends
FY 20
161
7 DAT
A
Passengers Revenue Hours Revenue Miles
Operating Costs Passenger Revenue Operating Subsidy
39956
50422 50342 49494 42798
0
10000
20000
30000
40000
50000
60000
FY 2013 FY 2014 FY 2015 FY 2016 FY 2017
Passengers
3981
4144
4366 4384 4363
370038003900400041004200430044004500
FY 2013 FY 2014 FY 2015 FY 2016 FY 2017
Revenue Hours
$350499
$378792 $371602
$388005 $399203
$320000$330000$340000$350000$360000$370000$380000$390000$400000$410000
FY 2013 FY 2014 FY 2015 FY 2016 FY 2017
Operating Costs
100
122 115 113 98
00
20
40
60
80
100
120
140
FY 2013 FY 2014 FY 2015 FY 2016 FY 2017
Passengers per Revenue Hour
$760 $661 $634 $664
$811
$000$200$400$600$800
$1000$1200$1400
FY 2013 FY 2014 FY 2015 FY 2016 FY 2017
Subsidy per Passenger
$8805 $9142 $8512 $8851 $9151
$0
$50
$100
$150
$200
FY 2013 FY 2014 FY 2015 FY 2016 FY 2017
Cost per Revenue Hour
245Local Connector
Days of Service Wkdy Sa SuAvg Freq (Wkdy Peak) 60 min
Avg Freq (Wkdy Non-Peak) 60 minAvg Freq (Wked) 60 min
FY 2017 Farebox Recovery 15 transfer (to route) 13
Clipper usage 13
Annual Avg Monthly Avg Daily Annual Avg Monthly Avg Daily Annual Avg Monthly Avg DailyWeekday 41761 3480 165 3014 251 12 28706 2392 113 Saturday 4220 352 81 620 52 12 5778 482 111 Sunday 3785 315 63 715 60 12 6667 556 111
Total 49766 4147 136 4349 362 12 41152 3429 113
Annual Avg Monthly Avg Daily Annual Avg Monthly Avg Daily Annual Avg Monthly Avg DailyWeekday $271762 $22647 $1074 $44873 $3739 $177 $226889 $18907 $897Saturday $55697 $4641 $1071 $6217 $518 $120 $49480 $4123 $952Sunday $64137 $5345 $1069 $5878 $490 $98 $58259 $4855 $971
Total $391596 $32633 $1073 $56968 $4747 $156 $334628 $27886 $917
Passengers per Revenue Hour
Subsidy per Passenger
Cost per Revenue Hour
Farebox Recovery
Weekday 139 $543 $9016 165Saturday 68 $1173 $8988 112Sunday 53 $1539 $8970 92
Total 114 $672 $9004 145
Passengers Revenue Hours Operating CostsPassenger
RevenueOperating Subsidy
Passengers per Revenue Hour
Subsidy per Passenger
Cost per Revenue Hour
Farebox Recovery
FY 2015FY 2016 2184 227 $19695 $3137 $16558 96 $758 $8695 159FY 2017 49766 4349 $391596 $56968 $334628 114 $672 $9004 145
Histo
ric Tr
ends
FY 20
161
7 DAT
A
Passengers Revenue Hours Revenue Miles
Operating Costs Passenger Revenue Operating Subsidy
2184
49766
0
10000
20000
30000
40000
50000
60000
FY 2013 FY 2014 FY 2015 FY 2016 FY 2017
Passengers
227
4349
0
1000
2000
3000
4000
5000
FY 2013 FY 2014 FY 2015 FY 2016 FY 2017
Revenue Hours
$19695
$391596
$0
$100000
$200000
$300000
$400000
$500000
FY 2013 FY 2014 FY 2015 FY 2016 FY 2017
Operating Costs
96 114
00
20
40
60
80
100
120
140
FY 2013 FY 2014 FY 2015 FY 2016 FY 2017
Passengers per Revenue Hour
$758 $672
$000$200$400$600$800
$1000$1200$1400
FY 2013 FY 2014 FY 2015 FY 2016 FY 2017
Subsidy per Passenger
$8695 $9004
$0
$50
$100
$150
$200
FY 2013 FY 2014 FY 2015 FY 2016 FY 2017
Cost per Revenue Hour
251Local Connector
Days of Service Wkdy Sa SuAvg Freq (Wkdy Peak) 60 min
Avg Freq (Wkdy Non-Peak) 60 minAvg Freq (Wked) 60 min
FY 2017 Farebox Recovery 11 transfer (to route) 8
Clipper usage 8
Annual Avg Monthly Avg Daily Annual Avg Monthly Avg Daily Annual Avg Monthly Avg DailyWeekday 76675 6390 303 6754 563 27 95654 7971 378 Saturday 9952 829 191 1325 110 25 18630 1553 358 Sunday 8879 740 148 1528 127 25 21497 1791 358
Total 95506 7959 262 9607 801 26 135781 11315 372
Annual Avg Monthly Avg Daily Annual Avg Monthly Avg Daily Annual Avg Monthly Avg DailyWeekday $625542 $52129 $2472 $78006 $6501 $308 $547536 $45628 $2164Saturday $122485 $10207 $2355 $12104 $1009 $233 $110381 $9198 $2123Sunday $140992 $11749 $2350 $11713 $976 $195 $129279 $10773 $2155
Total $889019 $74085 $2436 $101823 $8485 $279 $787196 $65600 $2157
Passengers per Revenue Hour
Subsidy per Passenger
Cost per Revenue Hour
Farebox Recovery
Weekday 114 $714 $9262 125Saturday 75 $1109 $9246 99Sunday 58 $1456 $9225 83
Total 99 $824 $9254 115
Passengers Revenue Hours Operating CostsPassenger
RevenueOperating Subsidy
Passengers per Revenue Hour
Subsidy per Passenger
Cost per Revenue Hour
Farebox Recovery
FY 2015 97647 9172 $800242 $103081 $697161 106 $714 $8725 129FY 2016 98886 9226 $831623 $120959 $710664 107 $719 $9014 145FY 2017 95506 9607 $889019 $101823 $787196 99 $824 $9254 115
Histo
ric Tr
ends
FY 20
161
7 DAT
A
Passengers Revenue Hours Revenue Miles
Operating Costs Passenger Revenue Operating Subsidy
87073
97647 98886
95506
80000
85000
90000
95000
100000
FY 2013 FY 2014 FY 2015 FY 2016 FY 2017
Passengers
8322
9172 9226
9607
7500
8000
8500
9000
9500
10000
FY 2013 FY 2014 FY 2015 FY 2016 FY 2017
Revenue Hours
$772570
$800242
$831623
$889019
$700000
$750000
$800000
$850000
$900000
FY 2013 FY 2014 FY 2015 FY 2016 FY 2017
Operating Costs
105 106 107 99
00
20
40
60
80
100
120
140
FY 2013 FY 2014 FY 2015 FY 2016 FY 2017
Passengers per Revenue Hour
$797 $714 $719
$824
$000$200$400$600$800
$1000$1200$1400
FY 2013 FY 2014 FY 2015 FY 2016 FY 2017
Subsidy per Passenger
$9284 $8725 $9014 $9254
$0
$50
$100
$150
$200
FY 2013 FY 2014 FY 2015 FY 2016 FY 2017
Cost per Revenue Hour
257Local Connector
Days of Service WkdyAvg Freq (Wkdy Peak) 60 min
Avg Freq (Wkdy Non-Peak) 60 minAvg Freq (Wked) -
FY 2017 Farebox Recovery 12 transfer (to route) 6
Clipper usage 13
Annual Avg Monthly Avg Daily Annual Avg Monthly Avg Daily Annual Avg Monthly Avg DailyWeekday 69126 5761 273 7643 637 30 85748 7146 339 Saturday - - - - - - - - - Sunday - - - - - - - - -
Total 69126 5761 273 7643 637 30 85748 7146 339
Annual Avg Monthly Avg Daily Annual Avg Monthly Avg Daily Annual Avg Monthly Avg DailyWeekday $697953 $58163 $2759 $82621 $6885 $327 $615332 $51278 $2432Saturday $ - $ - $ - $ - $ - $ - $ - $ - $ -Sunday $ - $ - $ - $ - $ - $ - $ - $ - $ -
Total $697953 $58163 $2759 $82621 $6885 $327 $615332 $51278 $2432
Passengers per Revenue Hour
Subsidy per Passenger
Cost per Revenue Hour
Farebox Recovery
Weekday 90 $890 $9132 118Saturday - $ - $ - - Sunday - $ - $ - -
Total 90 $890 $9132 118
Passengers Revenue Hours Operating CostsPassenger
RevenueOperating Subsidy
Passengers per Revenue Hour
Subsidy per Passenger
Cost per Revenue Hour
Farebox Recovery
FY 2015 69984 6289 $546363 $73402 $472961 111 $676 $8687 134FY 2016 71429 6414 $575805 $83288 $492517 111 $690 $8977 145FY 2017 69126 7643 $697953 $82621 $615332 90 $890 $9132 118
Histo
ric Tr
ends
FY 20
161
7 DAT
A
Passengers Revenue Hours Revenue Miles
Operating Costs Passenger Revenue Operating Subsidy
35511
68515 69984 71429 69126
01000020000300004000050000600007000080000
FY 2013 FY 2014 FY 2015 FY 2016 FY 2017
Passengers
2909
5965 6289 6414 7643
0
2000
4000
6000
8000
10000
FY 2013 FY 2014 FY 2015 FY 2016 FY 2017
Revenue Hours
$263500
$555608 $546363 $575805
$697953
$0$100000$200000$300000$400000$500000$600000$700000$800000
FY 2013 FY 2014 FY 2015 FY 2016 FY 2017
Operating Costs
122 115 111 111
90
00
20
40
60
80
100
120
140
FY 2013 FY 2014 FY 2015 FY 2016 FY 2017
Passengers per Revenue Hour
$625 $721 $676 $690
$890
$000$200$400$600$800
$1000$1200$1400
FY 2013 FY 2014 FY 2015 FY 2016 FY 2017
Subsidy per Passenger
$9057 $9315 $8687 $8977 $9132
$0
$50
$100
$150
$200
FY 2013 FY 2014 FY 2015 FY 2016 FY 2017
Cost per Revenue Hour
Hdn ValleyYellow Bus
Days of Service School DaysAvg Freq (Wkdy Peak) 2 trips
Avg Freq (Wkdy Non-Peak) -Avg Freq (Wked) -
FY 2017 Farebox Recovery 26 transfer (to route) -
Clipper usage -
Annual Avg Monthly Avg Daily Annual Avg Monthly Avg Daily Annual Avg Monthly Avg DailyWeekday 9281 844 52 180 16 1 1638 149 9 Saturday - - - - - - - - - Sunday - - - - - - - - -
Total 9281 844 52 180 16 1 1638 149 9
Annual Avg Monthly Avg Daily Annual Avg Monthly Avg Daily Annual Avg Monthly Avg DailyWeekday $124763 $11342 $693 $32170 $2925 $179 $92593 $8418 $514Saturday $ - $ - $ - $ - $ - $ - $ - $ - $ -Sunday $ - $ - $ - $ - $ - $ - $ - $ - $ -
Total $124763 $11342 $693 $32170 $2925 $179 $92593 $8418 $514
Passengers per Revenue Hour
Subsidy per Passenger
Cost per Revenue Hour
Farebox Recovery
Weekday 516 $998 $69313 258Saturday - $ - $ - - Sunday - $ - $ - -
Total 516 $998 $69313 258
Passengers Revenue Hours Operating CostsPassenger
RevenueOperating Subsidy
Passengers per Revenue Hour
Subsidy per Passenger
Cost per Revenue Hour
Farebox Recovery
FY 2015FY 2016 8669 211 $140482 $25658 $114824 412 $1325 $66706 183FY 2017 9281 180 $124763 $32170 $92593 516 $998 $69313 258
Histo
ric Tr
ends
FY 20
161
7 DAT
A
Passengers Revenue Hours Revenue Miles
Operating Costs Passenger Revenue Operating Subsidy
8669 9281
0
2000
4000
6000
8000
10000
FY 2013 FY 2014 FY 2015 FY 2016 FY 2017
Passengers211
180
0
50
100
150
200
250
FY 2013 FY 2014 FY 2015 FY 2016 FY 2017
Revenue Hours$140482
$124763
$0$20000$40000$60000$80000
$100000$120000$140000$160000
FY 2013 FY 2014 FY 2015 FY 2016 FY 2017
Operating Costs
412 516
00
500
1000
1500
2000
FY 2013 FY 2014 FY 2015 FY 2016 FY 2017
Passengers per Revenue Hour
$1325
$998
$000
$200
$400
$600
$800
$1000
$1200
$1400
FY 2013 FY 2014 FY 2015 FY 2016 FY 2017
Subsidy per Passenger
$66706 $69313
$0$100$200$300$400$500$600$700$800
FY 2013 FY 2014 FY 2015 FY 2016 FY 2017
Cost per Revenue Hour
White HillYellow Bus
Days of Service School DaysAvg Freq (Wkdy Peak) 17 trips
Avg Freq (Wkdy Non-Peak) -Avg Freq (Wked) -
FY 2017 Farebox Recovery 60 transfer (to route) -
Clipper usage -
Annual Avg Monthly Avg Daily Annual Avg Monthly Avg Daily Annual Avg Monthly Avg DailyWeekday 127219 11565 707 1065 97 6 12096 1100 67 Saturday - - - - - - - - - Sunday - - - - - - - - -
Total 127219 11565 707 1065 97 6 12096 1100 67
Annual Avg Monthly Avg Daily Annual Avg Monthly Avg Daily Annual Avg Monthly Avg DailyWeekday $738585 $67144 $4103 $440896 $40081 $2449 $297689 $27063 $1654Saturday $ - $ - $ - $ - $ - $ - $ - $ - $ -Sunday $ - $ - $ - $ - $ - $ - $ - $ - $ -
Total $738585 $67144 $4103 $440896 $40081 $2449 $297689 $27063 $1654
Passengers per Revenue Hour
Subsidy per Passenger
Cost per Revenue Hour
Farebox Recovery
Weekday 1194 $234 $69325 597Saturday - $ - $ - - Sunday - $ - $ - -
Total 1194 $234 $69325 597
Passengers Revenue Hours Operating CostsPassenger
RevenueOperating Subsidy
Passengers per Revenue Hour
Subsidy per Passenger
Cost per Revenue Hour
Farebox Recovery
FY 2015FY 2016 129635 870 $579937 $385753 $194184 1491 $150 $66698 665FY 2017 127219 1065 $738585 $440896 $297689 1194 $234 $69325 597
Histo
ric Tr
ends
FY 20
161
7 DAT
A
Passengers Revenue Hours Revenue Miles
Operating Costs Passenger Revenue Operating Subsidy
129635 127219
0
20000
40000
60000
80000
100000
120000
140000
FY 2013 FY 2014 FY 2015 FY 2016 FY 2017
Passengers
870
1065
0
200
400
600
800
1000
1200
FY 2013 FY 2014 FY 2015 FY 2016 FY 2017
Revenue Hours
$579937
$738585
$0$100000$200000$300000$400000$500000$600000$700000$800000
FY 2013 FY 2014 FY 2015 FY 2016 FY 2017
Operating Costs
1491
1194
00200400600800
1000120014001600
FY 2013 FY 2014 FY 2015 FY 2016 FY 2017
Passengers per Revenue Hour
$150 $234
$000
$200
$400
$600
$800
$1000
$1200
$1400
FY 2013 FY 2014 FY 2015 FY 2016 FY 2017
Subsidy per Passenger$66698 $69325
$0$100$200$300$400$500$600$700$800
FY 2013 FY 2014 FY 2015 FY 2016 FY 2017
Cost per Revenue Hour
MARIN TRANSIT | 2018ndash2027 SHORT RANGE TRANSIT PLAN Chapter 4 Capital Plan
DRAFT 4-9
Table 4-7 Local Transit Bus Replacement Schedule
Fiscal Year (In-service)
Replacements
Total Cost
Local Share Vehicle Type Seating
Capacity Service(1)
FY 201718 10 $7710000 $1387800 40ft hybrid 39 LB
2 $1662000 $332404 35ft Electric 32 LB
FY 201819
1 $125000 $22500 24ft 20 SH
4 $1600000 $1094880 29ft XHF
(upgrade) 22 SG
FY 201920 10 $8940000 $1609200 60ft 63 LB
FY 202021 8 $1032000 $185760 24ft 20 SH
2 $850000 $153000 35ft XHF 37 MW
FY 202223
7 $5584578 $1005224 35ft hybrid 32 LB
2 $874182 $599281 29ft XHF
(upgrade) 22 SG
FY 202425 3 $1393227 $250781 35ft XHF 37 MW
FY 202526 2 $299093 $53837 24ft 20 SH
5 $2391706 $430507 35ft XHF 37 MW
FY 202627 - - - - - -
Notes (1) Service Types LB ndash Big Bus SH- Shuttle SG- Rural Stagecoach MW- Seasonal Muir Woods and School
Expansion Needs When considering service expansion vehicles are often a constraint on the amount of service that can be added Expansion vehicles are a lower priority in the regional capital plan and typically do not receive federal funds Local state or discretionary grants are required to expand fleets The capital plan does not include any expansion vehicles for the local fixed route program consistent with the current service plan
Marin Transit relies on three retired active vehicles to support operations Retired active vehicles are vehicles that are beyond their FTA-determined useful life that remain in service while their replacements are added the fleet The District intends to replace these as expansion vehicles if funding becomes available
Demand Response Vehicles
Marin Transit has 58 vehicles available for local and regional paratransit service To provide an adequate number of spare vehicles a maximum of about 46 vehicles in service Marin Transit owns 32 vehicles GGBHTD owns 14 and the contractor provides another 13 vehicles to support the operations Eleven of the 13 contractor vehicles will be replaced in early 2018 - five by the District and six by GGBHTD Two of the five replaced by the District will be replaced with smaller accessible vans These will be used for same day
Fixed-Route Passengers (incl Yellow Bus) by Month
July August September October November December January February March April May June
Prior Fiscal Year Passengers Current Fiscal Year PassengersPrior Fiscal Year Passengers Current Fiscal Year Passengers
0
80000
160000
240000
320000
244439
271284484271284
296637296637
2768532276853
252829252829
238010238010
219681219681
2097050505209705
277644277644
240773240773240773240773
284816284816
24935149492493512444392444392442 43999244439244244439439244439244244439999999244200
2600562602600 0000000260056
FISCAL YEAR
2018
Demand Response Passengers by Month
July August September October November December January February March April May June
Prior Fiscal Year Passengers Current Fiscal Year PassengersPrior Fiscal Year Passengers Current Fiscal Year Passengers
0
4000
8000
12000
16000
12 77312773
13631 1362813628 1356413564
1247712477
1206712067 1212412124118100011810
1364613646
1260912609
1359313593
12950129501277312 77312 77312 77312613131612 6133312 6133312613331277312773127731277312613
13 6311363113 631135641363113 613631311363113 6136313113564
Year-to-Date Ridership Trends
Item 3b
2
Average Systemwide Daily Passengers
Weekday Saturday Sunday
Prior Fiscal Year Average Daily Passengers Current Fiscal Year Average Daily PassengersPrior Fiscal Year Average Daily Passengers Current Fiscal Year Average Daily Passengers
0
3000
6000
9000
12000
11370113701109811098
7726772674407440
66576657
60556055
Productivity (paxhr) by Typology
1 Local T
runklin
e
2 Local B
asic
3 Local C
onnecto
r
5 R
ura
l
8 R
ecre
ational
9 D
em
and R
esponse
Prior Fiscal Year Productivity Current Fiscal Year ProductivityPrior Fiscal Year Productivity Current Fiscal Year Productivity
00
80
160
240
320
249249 252252
163163
14814 8148
9292 91918181
757 575
320320
275275
2323 2121
Monthly StatisticsMONTH
August
1 Local Trunkline Routes 35 36 71X
2 Local Basic Routes 17 22 23 23X 29 49
3 Local Connector Routes 219 228 233 245 251 257
5 Rural Routes 61 68
8 Recreational Routes 6666F
9 Demand Response Local Paratransit Novato Dial-A-Ride Rural Dial-A-Ride
Route Typologies
Item 3b
3
Fixed-Route Passengers (incl Yellow Bus) by Month
July August September October November December January February March April May June
Prior Fiscal Year Passengers Current Fiscal Year Passengers
0
80000
160000
240000
320000
244439244439
271284271284
296637296637
276853276853
252829252829
238010238010
219681219681209705209705
277644277644
240773240773
284816284816
249351249351244200244200
260056260056
282441282441
FISCAL YEAR
2018
Demand Response Passengers by Month
July August September October November December January February March April May June
Prior Fiscal Year Passengers Current Fiscal Year Passengers
0
4000
8000
12000
16000
1277312773
1363113631 1362813628 1356413564
12477124771206712067 1212412124
1181011810
1364613646
1260912609
1359313593
12950129501261312613
1356413564 1342713427
Year-to-Date Ridership Trends
Monthly Monitoring Report 11022017
Page 12Item 3b
2
Average Systemwide Daily Passengers
Weekday Saturday Sunday
Prior Fiscal Year Average Daily Passengers Current Fiscal Year Average Daily Passengers
0
3000
6000
9000
12000 11848118481161311613
73637363
67876787
6126612657395739
Productivity (paxhr) by Typology
1 L
ocal
Tru
nklin
e
2 L
ocal
Bas
ic
3 L
ocal
Con
nect
or
5 R
ural
8 R
ecre
atio
nal
9 D
eman
d R
espo
nse
Prior Fiscal Year Productivity Current Fiscal Year Productivity
00
80
160
240
320
278278 274274
174174 168168
9898 9797
7676 7676
304304
222222
2323 2222
Monthly StatisticsMONTH
September
1 Local Trunkline Routes 35 36 71X
2 Local Basic Routes 17 22 23 23X 29 49
3 Local Connector Routes 219 228 233 245 251 257
5 Rural Routes 61 68
8 Recreational Routes 6666F
9 Demand Response Local Paratransit Novato Dial-A-Ride Rural Dial-A-Ride
Route Typologies
Page 22Item 3b
3
Fixed-Route Passengers (incl Yellow Bus) by Month
July August September October November December January February March April May June
Prior Fiscal Year Passengers Current Fiscal Year Passengers
0
80000
160000
240000
320000
244439244439
271284271284
296637296637
276853276853
252829252829
238010238010
219681219681209705209705
277644277644
240773240773
284816284816
249351249351244200244200
260056260056
282441282441 282922282922
FISCAL YEAR
2018
Demand Response Passengers by Month
July August September October November December January February March April May June
Prior Fiscal Year Passengers Current Fiscal Year Passengers
0
4000
8000
12000
16000
1277312773
1363113631 1362813628 1356413564
12477124771206712067 1212412124
1181011810
1364613646
1260912609
1359313593
12950129501261312613
1356413564 13427134271373413734
Year-to-Date Ridership Trends
Monthly Monitoring Report 12082017
Page 12Item 3b
2
Average Systemwide Daily Passengers
Weekday Saturday Sunday
Prior Fiscal Year Average Daily Passengers Current Fiscal Year Average Daily Passengers
0
3000
6000
9000
120001125811258 1115111151
6043604364326432
4717471750675067
Productivity (paxhr) by Typology
1 L
ocal
Tru
nklin
e
2 L
ocal
Bas
ic
3 L
ocal
Con
nect
or
5 R
ural
8 R
ecre
atio
nal
9 D
eman
d R
espo
nse
Prior Fiscal Year Productivity Current Fiscal Year Productivity
00
70
140
210
280258258
270270
163163 161161
9696 9595
6363 7070
202202190190
2323 2121
Monthly StatisticsMONTH
October
1 Local Trunkline Routes 35 36 71X
2 Local Basic Routes 17 22 23 23X 29 49
3 Local Connector Routes 219 228 233 245 251 257
5 Rural Routes 61 68
8 Recreational Routes 6666F
9 Demand Response Local Paratransit Novato Dial-A-Ride Rural Dial-A-Ride
Route Typologies
Page 22Item 3b
3
- RFP - OampM for Fixed Route Service - Addendum 3 12-18-2017
- MV Fee Schedule
- Airporter Fee Schedule
- FY2017Performance
-
- System Performance Summary for FY 201617
-
- Fixed Route
- Yellow Bus
- Demand Response
- Other Services
-
- Performance Goals
- Ridership Trends
- FY 201718 Performance Outlook
-
- Attachment A Route Profiles
-
- Local Transit Bus Replacement Schedule
- August 2017 Monthly Monitoring Report
- September 2017 Monthly Monitoring Report
- October 2017 Monthly Monitoring Report
-
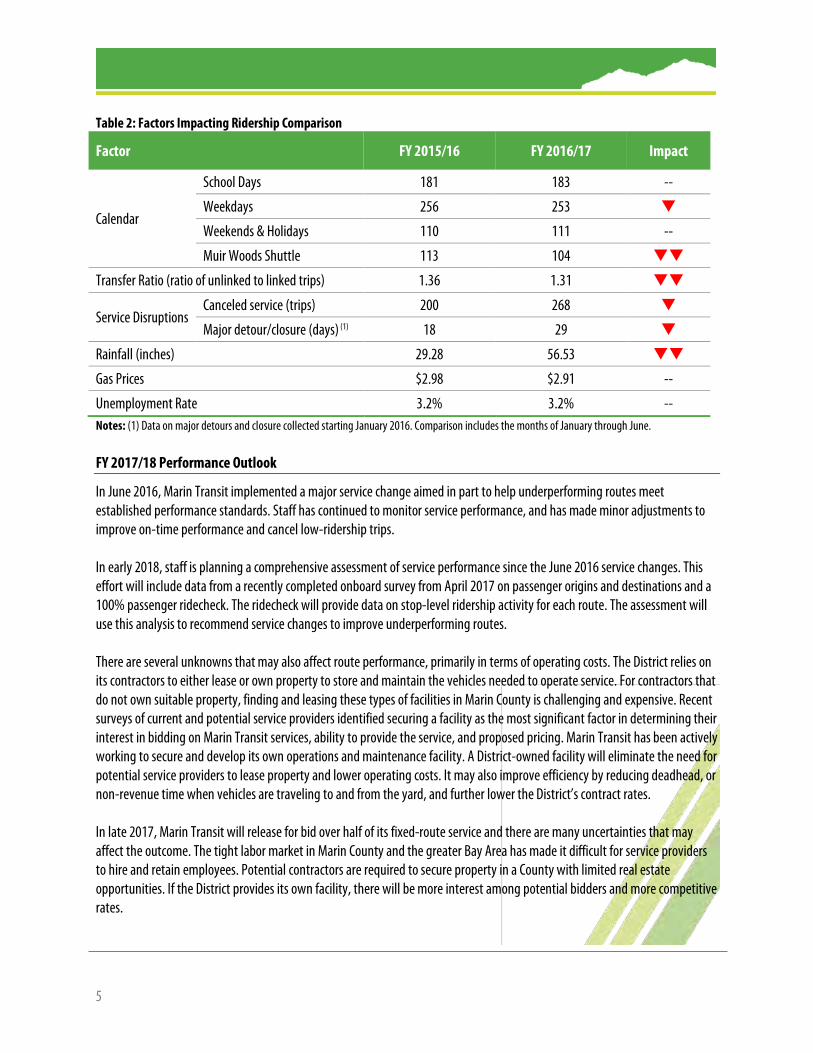
5
Table 2 Factors Impacting Ridership Comparison
Factor FY 201516 FY 201617 Impact
Calendar
School Days 181 183 --
Weekdays 256 253
Weekends amp Holidays 110 111 --
Muir Woods Shuttle 113 104
Transfer Ratio (ratio of unlinked to linked trips) 136 131
Service Disruptions Canceled service (trips) 200 268
Major detourclosure (days) (1) 18 29
Rainfall (inches) 2928 5653
Gas Prices $298 $291 --
Unemployment Rate 32 32 -- Notes (1) Data on major detours and closure collected starting January 2016 Comparison includes the months of January through June FY 201718 Performance Outlook
In June 2016 Marin Transit implemented a major service change aimed in part to help underperforming routes meet established performance standards Staff has continued to monitor service performance and has made minor adjustments to improve on-time performance and cancel low-ridership trips In early 2018 staff is planning a comprehensive assessment of service performance since the June 2016 service changes This effort will include data from a recently completed onboard survey from April 2017 on passenger origins and destinations and a 100 passenger ridecheck The ridecheck will provide data on stop-level ridership activity for each route The assessment will use this analysis to recommend service changes to improve underperforming routes There are several unknowns that may also affect route performance primarily in terms of operating costs The District relies on its contractors to either lease or own property to store and maintain the vehicles needed to operate service For contractors that do not own suitable property finding and leasing these types of facilities in Marin County is challenging and expensive Recent surveys of current and potential service providers identified securing a facility as the most significant factor in determining their interest in bidding on Marin Transit services ability to provide the service and proposed pricing Marin Transit has been actively working to secure and develop its own operations and maintenance facility A District-owned facility will eliminate the need for potential service providers to lease property and lower operating costs It may also improve efficiency by reducing deadhead or non-revenue time when vehicles are traveling to and from the yard and further lower the Districtrsquos contract rates In late 2017 Marin Transit will release for bid over half of its fixed-route service and there are many uncertainties that may affect the outcome The tight labor market in Marin County and the greater Bay Area has made it difficult for service providers to hire and retain employees Potential contractors are required to secure property in a County with limited real estate opportunities If the District provides its own facility there will be more interest among potential bidders and more competitive rates
6
Table 3 System-wide Performance Statistics FY 201617 (unaudited)
Route Passengers Revenue
Hours Operating
Costs Passenger
Revenue Pass Trips Per
Rev Hr (Trip) Subsidy Per
Passenger Farebox
Recovery Fixed Route 2925522 178052 $20173419 $3550259 164 $568 176 Local Trunkline 1122188 44393 $6252940 $1263870 253 $445 202
35 658869 23052 $3234308 $729775 286 $380 226 36 342178 13636 $1901678 $369132 251 $448 194
71X 121141 7705 $1116954 $164963 157 $786 148 Local Basic 989500 65117 $7451946 $1221298 152 $630 164
17 247998 14757 $2076786 $319761 168 $708 154 22 215758 17553 $1619319 $273059 123 $624 169 23 199150 11065 $1508659 $246908 180 $634 164
23X 49255 3445 $473413 $57438 143 $845 121 29 40103 3707 $509475 $49634 108 $1147 97 49 237236 14590 $1264294 $274498 163 $417 217
Local Connector 378985 42396 $3873801 $461426 89 $900 119 219 50449 6392 $591224 $64101 79 $1045 108 228 71340 10042 $904806 $103912 71 $1123 115 233 42798 4363 $399203 $52001 98 $811 130 245 49766 4349 $391596 $56968 114 $672 145 251 95506 9607 $889019 $101823 99 $824 115 257 69126 7643 $697953 $82621 90 $890 118
Supplemental 179947 3963 $514380 $110503 454 (286) $224 215 113 16829 317 $42180 $12227 530 (315) $178 290 115 14021 637 $87534 $9504 220 (185) $557 109 117 34820 640 $81509 $17140 544 (284) $185 210 119 27161 374 $56273 $18859 727 (313) $138 335 125 13757 600 $72469 $11570 229 (193) $443 160 139 6414 253 $33182 $6635 253 (179) $414 200 145 16406 191 $25426 $7258 861 (372) $111 285 151 36801 594 $73842 $18463 620 (428) $150 250 154 13738 358 $41965 $8847 384 (255) $241 211
Recreational 122116 4316 $473726 $249748 283 $183 527 66 122116 4316 $473726 $249748 283 $183 527
Rural 112926 16172 $1422683 $122407 70 $1151 86 61 36328 5492 $475778 $39959 66 $1200 84 68 76598 10680 $946905 $82448 72 $1129 87
Partnership 19860 1696 $183943 $121007 117 $317 658 122 19860 1696 $183943 $121007 117 $317 658
Yellow Bus 136500 1245 $863348 $473066 1096 (448) $286 548 Hidden Valley 9281 180 $124763 $32170 516 (265) $998 258
White Hill 127219 1065 $738585 $440896 1194 (471) $234 597 Demand Response 124325 55191 $4571296 $236980 23 $3486 52
Local Paratransit 119673 53011 $4404928 $226387 23 $3492 51 Novato DAR 4057 1856 $150815 $8815 22 $3487 58
Dillon Beach DAR 488 260 $12511 $1356 19 $2285 108 Pt Reyes DAR 107 64 $3042 $422 17 $2447 139
Other Services 30547 - $511316 $41956 - $1537 82 Volunteer Driver(1) 16162 - $152714 - - $945 -
Catch-A-Ride(1) 14385 - $358602 $41956 - $2201 117 Total 3216894 234489 $26118572 $4302085 136 $678 165
Notes Values in red indicate performance that does not meet District
7
Figure 1 FY 201617 Passengers per Revenue Hour by Route
0
5
10
15
20
25
30
35
40
45
50Lo
cal T
runk
line T
otals 35 36 71
X
Loca
l Bas
ic To
tals 17 22 23 23X 29 49
Loca
l Con
necto
r Tot
als 219
228
233
245
251
257
Supp
lemen
tal T
otals 11
311
511
711
912
513
914
515
115
4
Recre
ation
al To
tals 66
Rura
l Tot
als 61 68
Dem
and R
espo
nse T
otals
Loca
l Par
atra
nsit
Nova
to D
ARDi
llon D
ARPt
Reye
s DAR
Pass
enge
rs p
er R
even
ue H
our
meets goalservice standard
does not meet goal
school routes show passengers per trip
8
Figure 2 FY 201617 Subsidy per Passenger by Route
$0
$5
$10
$15
$20
$25
$30
$35
$40
Loca
l Tru
nklin
e Tot
als 35 36 71X
Loca
l Bas
ic To
tals 17 22 23 23X 29 49
Loca
l Con
necto
r Tot
als 219
228
233
245
251
257
Supp
lemen
tal T
otals 11
311
511
711
912
513
914
515
115
4
Recre
ation
al To
tals 66
Rura
l Tot
als 61 68
Dem
and R
espo
nse T
otals
Loca
l Par
atra
nsit
Nova
to D
ARDi
llon D
ARPt
Reye
s DAR
Subs
idy p
er P
asse
nger
does not meet goal
service standard
meets goal
9
Attachment A Route Profiles 17 Sausalito ndash Marin City ndash Mill Valley ndash San Rafael 22 San Rafael Transit Center ndash San Anselmo ndash Marin City 23 Fairfax ndash San Anselmo ndash San Rafael ndash Canal 23X Manor ndash Fairfax ndash San Anselmo ndash San Rafael ndash Canal 29 Canal ndash San Rafael Transit Center ndash Larkspur ndash College of Marin ndash Marin General 35 Canal ndash San Rafael Transit Center ndash Marin Civic Center ndash Northgate Mall ndash Novato 36 Canal ndash San Rafael Transit Center ndash Marin City 49 Novato ndash Ignacio ndash Hamilton ndash Marin Civic Center ndash San Rafael Transit Center 61 West Marin Stagecoach (Sausalito ndash Marin City ndash Mill Valley ndash Stinson Beach ndash Bolinas) 66 Muir Woods Shuttle 68 West Marin Stagecoach (San Rafael Transit Center ndash San Anselmo ndash Pt Reyes Station ndash Inverness) 71X Novato ndash San Rafael Transit Center ndash Marin City ndash Sausalito 113 Redwood High School ndash Paradise Cay 115 Sausalito ndash Willow Creek ndash Marin City ndash Mill Valley ndash St Hilary 117 Neil Cummins Hall Middle School ndash E Corte Madera ndash Cove School 119 Tiburon ndash Belvedere ndash Redwood High School 122 San Rafael Transit Center ndash San Anselmo ndash College of Marin 125 Lagunitas ndash Sir Francis Drake HS ndash San Anselmo ndash San Rafael 139 Terra Linda High School ndash Lucas Valley 145 Terra Linda High School ndash San Rafael 151 Hamilton ndash Ignacio ndash San Jose Middle School ndash Novato High School ndash San Marin High School 154 Olive ndash San Marin High School ndash Sinaloa Middle School ndash Novato 219 Tiburon ndash Strawberry 228 San Rafael Transit Center ndash Larkspur ndash San Anselmo ndash Fairfax 233 Santa Venetia ndash Marin Civic Center ndash San Rafael Transit Center 245 San Rafael Transit Center ndash Northgate Mall ndash Kaiser ndash Smith Ranch Road 251 San Marin ndash Novato ndash Vintage Oaks ndash IVC ndash Ignacio ndash Hamilton 257 San Rafael ndash Northgate Mall ndash Kaiser ndash Marinwood ndash Hamilton ndash Ignacio ndash IVC Hdn Valley Ross Valley Yellow Bus (Fairfax ndash San Anselmo ndash Hidden Valley ES) White Hill Ross Valley Yellow Bus (San Anselmo ndash Sleepy Hollow ndash Fairfax ndash White Hill MS)
17Local Basic
Days of Service Wkdy Sa SuAvg Freq (Wkdy Peak) 30 min
Avg Freq (Wkdy Non-Peak) 60 minAvg Freq (Wked) 60 min
FY 2017 Farebox Recovery 15 transfer (to route) 25
Clipper usage 16
Annual Avg Monthly Avg Daily Annual Avg Monthly Avg Daily Annual Avg Monthly Avg DailyWeekday 194263 16189 768 11496 958 45 177386 14782 701 Saturday 27564 2297 530 1541 128 30 24621 2052 473 Sunday 26171 2181 436 1720 143 29 27378 2282 456
Total 247998 20667 679 14757 1230 40 229385 19115 628
Annual Avg Monthly Avg Daily Annual Avg Monthly Avg Daily Annual Avg Monthly Avg DailyWeekday $1617108 $134759 $6392 $247041 $20587 $976 $1370067 $114172 $5415Saturday $217536 $18128 $4183 $36894 $3075 $710 $180642 $15054 $3474Sunday $242142 $20179 $4036 $35826 $2986 $597 $206316 $17193 $3439
Total $2076786 $173066 $5690 $319761 $26647 $876 $1757025 $146419 $4814
Passengers per Revenue Hour
Subsidy per Passenger
Cost per Revenue Hour
Farebox Recovery
Weekday 169 $705 $14067 153Saturday 179 $655 $14117 170Sunday 152 $788 $14078 148
Total 168 $708 $14073 154
Passengers Revenue Hours Operating CostsPassenger
RevenueOperating Subsidy
Passengers per Revenue Hour
Subsidy per Passenger
Cost per Revenue Hour
Farebox Recovery
FY 2015 301136 15167 $2108822 $340410 $1768412 199 $587 $13904 161FY 2016 280486 15330 $2041616 $302337 $1739279 183 $620 $13317 148FY 2017 247998 14757 $2076786 $319761 $1757025 168 $708 $14073 154
Histo
ric Tr
ends
FY 20
161
7 DAT
A
Passengers Revenue Hours Revenue Miles
Operating Costs Passenger Revenue Operating Subsidy
277892 322826
301136 280486
247998
0
50000
100000
150000
200000
250000
300000
350000
FY 2013 FY 2014 FY 2015 FY 2016 FY 2017
Passengers
12402 14818 15167 15330 14757
0
5000
10000
15000
20000
FY 2013 FY 2014 FY 2015 FY 2016 FY 2017
Revenue Hours
$1717002
$2179526 $2108822 $2041616 $2076786
$0
$500000
$1000000
$1500000
$2000000
$2500000
FY 2013 FY 2014 FY 2015 FY 2016 FY 2017
Operating Costs
224 218 199 183 168
00
50
100
150
200
250
300
FY 2013 FY 2014 FY 2015 FY 2016 FY 2017
Passengers per Revenue Hour
$504 $558 $587 $620 $708
$000$200$400$600$800
$1000$1200$1400
FY 2013 FY 2014 FY 2015 FY 2016 FY 2017
Subsidy per Passenger
$13845 $14709 $13904 $13317 $14073
$0
$50
$100
$150
$200
FY 2013 FY 2014 FY 2015 FY 2016 FY 2017
Cost per Revenue Hour
22Local Basic
Days of Service Wkdy Sa SuAvg Freq (Wkdy Peak) 30 min
Avg Freq (Wkdy Non-Peak) 60 minAvg Freq (Wked) 60 min
FY 2017 Farebox Recovery 17 transfer (to route) 10
Clipper usage 11
Annual Avg Monthly Avg Daily Annual Avg Monthly Avg Daily Annual Avg Monthly Avg DailyWeekday 184918 15410 731 14244 1187 56 126319 10527 499 Saturday 16752 1396 322 1537 128 30 16232 1353 312 Sunday 14088 1174 235 1773 148 30 18729 1561 312
Total 215758 17980 591 17553 1463 48 161280 13440 442
Annual Avg Monthly Avg Daily Annual Avg Monthly Avg Daily Annual Avg Monthly Avg DailyWeekday $1312992 $109416 $5190 $232926 $19411 $921 $1080066 $90006 $4269Saturday $142334 $11861 $2737 $21235 $1770 $408 $121099 $10092 $2329Sunday $163993 $13666 $2733 $18898 $1575 $315 $145095 $12091 $2418
Total $1619319 $134943 $4436 $273059 $22755 $748 $1346260 $112188 $3688
Passengers per Revenue Hour
Subsidy per Passenger
Cost per Revenue Hour
Farebox Recovery
Weekday 130 $584 $9218 177Saturday 109 $723 $9263 149Sunday 79 $1030 $9251 115
Total 123 $624 $9225 169
Passengers Revenue Hours Operating CostsPassenger
RevenueOperating Subsidy
Passengers per Revenue Hour
Subsidy per Passenger
Cost per Revenue Hour
Farebox Recovery
FY 2015 249148 14777 $2054433 $292215 $1762218 169 $707 $13903 142FY 2016 243635 14872 $1971172 $259453 $1711719 164 $703 $13255 132FY 2017 215758 17553 $1619319 $273059 $1346260 123 $624 $9225 169
Histo
ric Tr
ends
FY 20
161
7 DAT
A
Passengers Revenue Hours Revenue Miles
Operating Costs Passenger Revenue Operating Subsidy
366301
281761 249148 243635
215758
050000
100000150000200000250000300000350000400000
FY 2013 FY 2014 FY 2015 FY 2016 FY 2017
Passengers18061
15083 14777 14872 17553
0
5000
10000
15000
20000
FY 2013 FY 2014 FY 2015 FY 2016 FY 2017
Revenue Hours$2498169
$2220145 $2054433 $1971172
$1619319
$0
$500000
$1000000
$1500000
$2000000
$2500000
$3000000
FY 2013 FY 2014 FY 2015 FY 2016 FY 2017
Operating Costs
203 187 169 164
123
00
50
100
150
200
250
300
FY 2013 FY 2014 FY 2015 FY 2016 FY 2017
Passengers per Revenue Hour
$567 $667 $707 $703 $624
$000$200$400$600$800
$1000$1200$1400
FY 2013 FY 2014 FY 2015 FY 2016 FY 2017
Subsidy per Passenger
$13832 $14720 $13903 $13255
$9225
$0
$50
$100
$150
$200
FY 2013 FY 2014 FY 2015 FY 2016 FY 2017
Cost per Revenue Hour
23Local Basic
Days of Service Wkdy Sa SuAvg Freq (Wkdy Peak) 60 min
Avg Freq (Wkdy Non-Peak) 60 minAvg Freq (Wked) 60 min
FY 2017 Farebox Recovery 16 transfer (to route) 24
Clipper usage 12
Annual Avg Monthly Avg Daily Annual Avg Monthly Avg Daily Annual Avg Monthly Avg DailyWeekday 145707 12142 576 8042 670 32 64277 5356 254 Saturday 28305 2359 544 1434 120 28 11466 956 221 Sunday 25138 2095 419 1589 132 26 12750 1062 212
Total 199150 16596 546 11065 922 30 88492 7374 242
Annual Avg Monthly Avg Daily Annual Avg Monthly Avg Daily Annual Avg Monthly Avg DailyWeekday $1096892 $91408 $4336 $179427 $14952 $709 $917465 $76455 $3626Saturday $195468 $16289 $3759 $35226 $2936 $677 $160242 $13354 $3082Sunday $216299 $18025 $3605 $32255 $2688 $538 $184044 $15337 $3067
Total $1508659 $125722 $4133 $246908 $20576 $676 $1261751 $105146 $3457
Passengers per Revenue Hour
Subsidy per Passenger
Cost per Revenue Hour
Farebox Recovery
Weekday 181 $630 $13640 164Saturday 197 $566 $13629 180Sunday 158 $732 $13612 149
Total 180 $634 $13635 164
Passengers Revenue Hours Operating CostsPassenger
RevenueOperating Subsidy
Passengers per Revenue Hour
Subsidy per Passenger
Cost per Revenue Hour
Farebox Recovery
FY 2015 354706 14168 $1969650 $381111 $1588539 250 $448 $13902 193FY 2016 268218 13154 $1703216 $308138 $1395078 204 $520 $12948 181FY 2017 199150 11065 $1508659 $246908 $1261751 180 $634 $13635 164
Histo
ric Tr
ends
FY 20
161
7 DAT
A
Passengers Revenue Hours Revenue Miles
Operating Costs Passenger Revenue Operating Subsidy
212064
339118 354706
268218
199150
050000
100000150000200000250000300000350000400000
FY 2013 FY 2014 FY 2015 FY 2016 FY 2017
Passengers
8716
14034 14168 13154
11065
02000400060008000
10000120001400016000
FY 2013 FY 2014 FY 2015 FY 2016 FY 2017
Revenue Hours
$1202564
$2061985 $1969650 $1703216
$1508659
$0
$500000
$1000000
$1500000
$2000000
$2500000
FY 2013 FY 2014 FY 2015 FY 2016 FY 2017
Operating Costs
243 242 250
204 180
00
50
100
150
200
250
300
FY 2013 FY 2014 FY 2015 FY 2016 FY 2017
Passengers per Revenue Hour
$455 $494 $448 $520 $634
$000$200$400$600$800
$1000$1200$1400
FY 2013 FY 2014 FY 2015 FY 2016 FY 2017
Subsidy per Passenger
$13797 $14692 $13902 $12948 $13635
$0
$50
$100
$150
$200
FY 2013 FY 2014 FY 2015 FY 2016 FY 2017
Cost per Revenue Hour
23XLocal Basic
Days of Service WkdyAvg Freq (Wkdy Peak) 60 min
Avg Freq (Wkdy Non-Peak) -Avg Freq (Wked) -
FY 2017 Farebox Recovery 12 transfer (to route) 31
Clipper usage 12
Annual Avg Monthly Avg Daily Annual Avg Monthly Avg Daily Annual Avg Monthly Avg DailyWeekday 49255 4105 195 3445 287 14 32408 2701 128 Saturday - - - - - - - - - Sunday - - - - - - - - -
Total 49255 4105 195 3445 287 14 32408 2701 128
Annual Avg Monthly Avg Daily Annual Avg Monthly Avg Daily Annual Avg Monthly Avg DailyWeekday $473413 $39451 $1871 $57438 $4787 $227 $415975 $34665 $1644Saturday $ - $ - $ - $ - $ - $ - $ - $ - $ -Sunday $ - $ - $ - $ - $ - $ - $ - $ - $ -
Total $473413 $39451 $1871 $57438 $4787 $227 $415975 $34665 $1644
Passengers per Revenue Hour
Subsidy per Passenger
Cost per Revenue Hour
Farebox Recovery
Weekday 143 $845 $13744 121Saturday - $ - $ - - Sunday - $ - $ - -
Total 143 $845 $13744 121
Passengers Revenue Hours Operating CostsPassenger
RevenueOperating Subsidy
Passengers per Revenue Hour
Subsidy per Passenger
Cost per Revenue Hour
Farebox Recovery
FY 2015FY 2016 2548 189 $23303 $2272 $21031 135 $825 $12330 97FY 2017 49255 3445 $473413 $57438 $415975 143 $845 $13744 121
Histo
ric Tr
ends
FY 20
161
7 DAT
A
Passengers Revenue Hours Revenue Miles
Operating Costs Passenger Revenue Operating Subsidy
2548
49255
0
10000
20000
30000
40000
50000
60000
FY 2013 FY 2014 FY 2015 FY 2016 FY 2017
Passengers
189
3445
0500
1000150020002500300035004000
FY 2013 FY 2014 FY 2015 FY 2016 FY 2017
Revenue Hours
$23303
$473413
$0
$100000
$200000
$300000
$400000
$500000
FY 2013 FY 2014 FY 2015 FY 2016 FY 2017
Operating Costs
135 143
00
50
100
150
200
250
300
FY 2013 FY 2014 FY 2015 FY 2016 FY 2017
Passengers per Revenue Hour
$825 $845
$000$200$400$600$800
$1000$1200$1400
FY 2013 FY 2014 FY 2015 FY 2016 FY 2017
Subsidy per Passenger
$12330 $13744
$0
$50
$100
$150
$200
FY 2013 FY 2014 FY 2015 FY 2016 FY 2017
Cost per Revenue Hour
29Local Basic
Days of Service WkdyAvg Freq (Wkdy Peak) 60 min
Avg Freq (Wkdy Non-Peak) -Avg Freq (Wked) -
FY 2017 Farebox Recovery 10 transfer (to route) 26
Clipper usage 12
Annual Avg Monthly Avg Daily Annual Avg Monthly Avg Daily Annual Avg Monthly Avg DailyWeekday 40103 3342 159 3707 309 15 37048 3087 146 Saturday - - - - - - - - - Sunday - - - - - - - - -
Total 40103 3342 159 3707 309 15 37048 3087 146
Annual Avg Monthly Avg Daily Annual Avg Monthly Avg Daily Annual Avg Monthly Avg DailyWeekday $509475 $42456 $2014 $49634 $4136 $196 $459841 $38320 $1818Saturday $ - $ - $ - $ - $ - $ - $ - $ - $ -Sunday $ - $ - $ - $ - $ - $ - $ - $ - $ -
Total $509475 $42456 $2014 $49634 $4136 $196 $459841 $38320 $1818
Passengers per Revenue Hour
Subsidy per Passenger
Cost per Revenue Hour
Farebox Recovery
Weekday 108 $1147 $13745 97Saturday - $ - $ - - Sunday - $ - $ - -
Total 108 $1147 $13745 97
Passengers Revenue Hours Operating CostsPassenger
RevenueOperating Subsidy
Passengers per Revenue Hour
Subsidy per Passenger
Cost per Revenue Hour
Farebox Recovery
FY 2015 203632 10795 $1500887 $232286 $1268601 189 $623 $13904 155FY 2016 181786 10502 $1378760 $219997 $1158763 173 $637 $13129 160FY 2017 40103 3707 $509475 $49634 $459841 108 $1147 $13745 97
Histo
ric Tr
ends
FY 20
161
7 DAT
A
Passengers Revenue Hours Revenue Miles
Operating Costs Passenger Revenue Operating Subsidy
238310 225998 203632
181786
40103
0
50000
100000
150000
200000
250000
300000
FY 2013 FY 2014 FY 2015 FY 2016 FY 2017
Passengers12248
10927 10795 10502
3707
0
2000
4000
6000
8000
10000
12000
14000
FY 2013 FY 2014 FY 2015 FY 2016 FY 2017
Revenue Hours$1692980 $1607795 $1500887
$1378760
$509475
$0
$500000
$1000000
$1500000
$2000000
FY 2013 FY 2014 FY 2015 FY 2016 FY 2017
Operating Costs
195 207 189 173
108
00
50
100
150
200
250
300
FY 2013 FY 2014 FY 2015 FY 2016 FY 2017
Passengers per Revenue Hour
$595 $593 $623 $637
$1147
$000$200$400$600$800
$1000$1200$1400
FY 2013 FY 2014 FY 2015 FY 2016 FY 2017
Subsidy per Passenger
$13822 $14714 $13904 $13129 $13745
$0
$50
$100
$150
$200
FY 2013 FY 2014 FY 2015 FY 2016 FY 2017
Cost per Revenue Hour
35Local Trunkline
Days of Service Wkdy Sa SuAvg Freq (Wkdy Peak) 30 min
Avg Freq (Wkdy Non-Peak) 30 minAvg Freq (Wked) 30 min
FY 2017 Farebox Recovery 23 transfer (to route) 17
Clipper usage 8
Annual Avg Monthly Avg Daily Annual Avg Monthly Avg Daily Annual Avg Monthly Avg DailyWeekday 492328 41027 1946 16909 1409 67 224421 18702 887 Saturday 84453 7038 1624 2860 238 55 43336 3611 833 Sunday 82088 6841 1368 3284 274 55 50021 4168 834
Total 658869 54906 1805 23052 1921 63 317778 26482 871
Annual Avg Monthly Avg Daily Annual Avg Monthly Avg Daily Annual Avg Monthly Avg DailyWeekday $2367217 $197268 $9357 $533190 $44433 $2107 $1834027 $152836 $7249Saturday $403729 $33644 $7764 $97853 $8154 $1882 $305876 $25490 $5882Sunday $463362 $38614 $7723 $98732 $8228 $1646 $364630 $30386 $6077
Total $3234308 $269526 $8861 $729775 $60815 $1999 $2504533 $208711 $6862
Passengers per Revenue Hour
Subsidy per Passenger
Cost per Revenue Hour
Farebox Recovery
Weekday 291 $373 $14000 225Saturday 295 $362 $14118 242Sunday 250 $444 $14111 213
Total 286 $380 $14030 226
Passengers Revenue Hours Operating CostsPassenger
RevenueOperating Subsidy
Passengers per Revenue Hour
Subsidy per Passenger
Cost per Revenue Hour
Farebox Recovery
FY 2015 476489 8544 $1187694 $462204 $725490 558 $152 $13901 389FY 2016 472718 9300 $1202986 $544109 $658877 508 $139 $12935 452FY 2017 658869 23052 $3234308 $729775 $2504533 286 $380 $14030 226
Histo
ric Tr
ends
FY 20
161
7 DAT
A
Passengers Revenue Hours Revenue Miles
Operating Costs Passenger Revenue Operating Subsidy
669860 574669
476489 472718
658869
0100000200000300000400000500000600000700000800000
FY 2013 FY 2014 FY 2015 FY 2016 FY 2017
Passengers
9755 8644 8544 9300
23052
0
5000
10000
15000
20000
25000
FY 2013 FY 2014 FY 2015 FY 2016 FY 2017
Revenue Hours
$1345711 $1271601 $1187694 $1202986
$3234308
$0
$500000
$1000000
$1500000
$2000000
$2500000
$3000000
$3500000
FY 2013 FY 2014 FY 2015 FY 2016 FY 2017
Operating Costs
687 665 558
508
286
00100200300400500600700800
FY 2013 FY 2014 FY 2015 FY 2016 FY 2017
Passengers per Revenue Hour
$097 $120 $152 $139
$380
$000
$200
$400
$600
$800
$1000
FY 2013 FY 2014 FY 2015 FY 2016 FY 2017
Subsidy per Passenger
$13796 $14710 $13901 $12935 $14030
$0
$50
$100
$150
$200
FY 2013 FY 2014 FY 2015 FY 2016 FY 2017
Cost per Revenue Hour
36Local Trunkline
Days of Service Wkdy Sa SuAvg Freq (Wkdy Peak) 30 min
Avg Freq (Wkdy Non-Peak) 30 minAvg Freq (Wked) 30 min
FY 2017 Farebox Recovery 19 transfer (to route) 18
Clipper usage 6
Annual Avg Monthly Avg Daily Annual Avg Monthly Avg Daily Annual Avg Monthly Avg DailyWeekday 278217 23185 1100 9938 828 39 133318 11110 527 Saturday 33779 2815 650 1715 143 33 24259 2022 467 Sunday 30182 2515 503 1983 165 33 28002 2334 467
Total 342178 28515 937 13636 1136 37 185579 15465 508
Annual Avg Monthly Avg Daily Annual Avg Monthly Avg Daily Annual Avg Monthly Avg DailyWeekday $1384291 $115358 $5472 $290481 $24207 $1148 $1093810 $91151 $4323Saturday $240062 $20005 $4617 $40774 $3398 $784 $199288 $16607 $3832Sunday $277325 $23110 $4622 $37877 $3156 $631 $239448 $19954 $3991
Total $1901678 $158473 $5210 $369132 $30761 $1011 $1532546 $127712 $4199
Passengers per Revenue Hour
Subsidy per Passenger
Cost per Revenue Hour
Farebox Recovery
Weekday 280 $393 $13930 210Saturday 197 $590 $13999 170Sunday 152 $793 $13984 137
Total 251 $448 $13946 194
Passengers Revenue Hours Operating CostsPassenger
RevenueOperating Subsidy
Passengers per Revenue Hour
Subsidy per Passenger
Cost per Revenue Hour
Farebox Recovery
FY 2015 109347 2894 $402355 $110471 $291884 378 $267 $13905 275FY 2016 119593 3462 $457211 $129715 $327496 345 $274 $13205 284FY 2017 342178 13636 $1901678 $369132 $1532546 251 $448 $13946 194
Histo
ric Tr
ends
FY 20
161
7 DAT
A
Passengers Revenue Hours Revenue Miles
Operating Costs Passenger Revenue Operating Subsidy
106988 103673 109347 119593
342178
050000
100000150000200000250000300000350000400000
FY 2013 FY 2014 FY 2015 FY 2016 FY 2017
Passengers
2878 2822 2894 3462
13636
02000400060008000
10000120001400016000
FY 2013 FY 2014 FY 2015 FY 2016 FY 2017
Revenue Hours
$398410 $415238 $402355 $457211
$1901678
$0
$500000
$1000000
$1500000
$2000000
FY 2013 FY 2014 FY 2015 FY 2016 FY 2017
Operating Costs
372 367 378 345 251
00100200300400500600700800
FY 2013 FY 2014 FY 2015 FY 2016 FY 2017
Passengers per Revenue Hour
$265 $293 $267 $274
$448
$000
$200
$400
$600
$800
$1000
FY 2013 FY 2014 FY 2015 FY 2016 FY 2017
Subsidy per Passenger
$13842 $14713 $13905 $13205 $13946
$0
$50
$100
$150
$200
FY 2013 FY 2014 FY 2015 FY 2016 FY 2017
Cost per Revenue Hour
49Local Basic
Days of Service Wkdy Sa SuAvg Freq (Wkdy Peak) 30 min
Avg Freq (Wkdy Non-Peak) 60 minAvg Freq (Wked) 60 min
FY 2017 Farebox Recovery 22 transfer (to route) 9
Clipper usage 11
Annual Avg Monthly Avg Daily Annual Avg Monthly Avg Daily Annual Avg Monthly Avg DailyWeekday 201564 16797 797 11313 943 45 139528 11627 551 Saturday 18489 1541 356 1517 126 29 18370 1531 353 Sunday 17183 1432 286 1761 147 29 21402 1784 357
Total 237236 19770 650 14590 1216 40 179300 14942 491
Annual Avg Monthly Avg Daily Annual Avg Monthly Avg Daily Annual Avg Monthly Avg DailyWeekday $978903 $81575 $3869 $230134 $19178 $910 $748769 $62397 $2960Saturday $131907 $10992 $2537 $22520 $1877 $433 $109387 $9116 $2104Sunday $153484 $12790 $2558 $21844 $1820 $364 $131640 $10970 $2194
Total $1264294 $105358 $3464 $274498 $22875 $752 $989796 $82483 $2712
Passengers per Revenue Hour
Subsidy per Passenger
Cost per Revenue Hour
Farebox Recovery
Weekday 178 $371 $8653 235Saturday 122 $592 $8698 171Sunday 98 $766 $8718 142
Total 163 $417 $8665 217
Passengers Revenue Hours Operating CostsPassenger
RevenueOperating Subsidy
Passengers per Revenue Hour
Subsidy per Passenger
Cost per Revenue Hour
Farebox Recovery
FY 2015 144262 6349 $882801 $158088 $724713 227 $502 $13905 179FY 2016 147480 6795 $900804 $146345 $754459 217 $512 $13257 162FY 2017 237236 14590 $1264294 $274498 $989796 163 $417 $8665 217
Histo
ric Tr
ends
FY 20
161
7 DAT
A
Passengers Revenue Hours Revenue Miles
Operating Costs Passenger Revenue Operating Subsidy
230943
152259 144262 147480
237236
0
50000
100000
150000
200000
250000
FY 2013 FY 2014 FY 2015 FY 2016 FY 2017
Passengers
9814
6440 6349 6795
14590
02000400060008000
10000120001400016000
FY 2013 FY 2014 FY 2015 FY 2016 FY 2017
Revenue Hours$1362499
$948702 $882801 $900804
$1264294
$0$200000$400000$600000$800000
$1000000$1200000$1400000$1600000
FY 2013 FY 2014 FY 2015 FY 2016 FY 2017
Operating Costs
235 236 227 217
163
00
50
100
150
200
250
300
FY 2013 FY 2014 FY 2015 FY 2016 FY 2017
Passengers per Revenue Hour
$477 $507 $502 $512 $417
$000$200$400$600$800
$1000$1200$1400
FY 2013 FY 2014 FY 2015 FY 2016 FY 2017
Subsidy per Passenger
$13884 $14732 $13905 $13257
$8665
$0
$50
$100
$150
$200
FY 2013 FY 2014 FY 2015 FY 2016 FY 2017
Cost per Revenue Hour
61Rural
Days of Service Wkdy Sa SuAvg Freq (Wkdy Peak) 8 trips
Avg Freq (Wkdy Non-Peak) -Avg Freq (Wked) 16 trips
FY 2017 Farebox Recovery 8 transfer (to route) 7
Clipper usage 11
Annual Avg Monthly Avg Daily Annual Avg Monthly Avg Daily Annual Avg Monthly Avg DailyWeekday 17166 1431 68 2631 219 10 45398 3783 181 Saturday 9922 827 198 1319 110 26 20810 1734 416 Sunday 9240 770 144 1542 129 24 24457 2038 382
Total 36328 3027 100 5492 458 15 90665 7555 248
Annual Avg Monthly Avg Daily Annual Avg Monthly Avg Daily Annual Avg Monthly Avg DailyWeekday $229650 $19138 $915 $17691 $1474 $70 $211959 $17663 $844Saturday $113378 $9448 $2268 $11622 $969 $232 $101756 $8480 $2035Sunday $132750 $11063 $2074 $10646 $887 $166 $122104 $10175 $1908
Total $475778 $39648 $1304 $39959 $3330 $109 $435819 $36318 $1194
Passengers per Revenue Hour
Subsidy per Passenger
Cost per Revenue Hour
Farebox Recovery
Weekday 65 $1235 $8730 77Saturday 75 $1026 $8598 103Sunday 60 $1321 $8607 80
Total 66 $1200 $8663 84
Passengers Revenue Hours Operating CostsPassenger
RevenueOperating Subsidy
Passengers per Revenue Hour
Subsidy per Passenger
Cost per Revenue Hour
Farebox Recovery
FY 2015 39478 5379 $417539 $46324 $371215 73 $940 $7762 111FY 2016 37276 5475 $408987 $48421 $360566 68 $967 $7470 118FY 2017 36328 5492 $475778 $39959 $435819 66 $1200 $8663 84
Histo
ric Tr
ends
FY 20
161
7 DAT
A
Passengers Revenue Hours Revenue Miles
Operating Costs Passenger Revenue Operating Subsidy
30642 33386
39478 37276 36328
0
10000
20000
30000
40000
50000
FY 2013 FY 2014 FY 2015 FY 2016 FY 2017
Passengers
5388
5056
5379 5475 5492
480049005000510052005300540055005600
FY 2013 FY 2014 FY 2015 FY 2016 FY 2017
Revenue Hours
$388827 $390358 $417539 $408987 $475778
$0
$100000
$200000
$300000
$400000
$500000
FY 2013 FY 2014 FY 2015 FY 2016 FY 2017
Operating Costs
57 66
73 68 66
00
20
40
60
80
100
FY 2013 FY 2014 FY 2015 FY 2016 FY 2017
Passengers per Revenue Hour
$1136 $1045
$940 $967
$1200
$000$200$400$600$800
$1000$1200$1400
FY 2013 FY 2014 FY 2015 FY 2016 FY 2017
Subsidy per Passenger
$7216 $7721 $7762 $7470 $8663
$0
$50
$100
$150
$200
FY 2013 FY 2014 FY 2015 FY 2016 FY 2017
Cost per Revenue Hour
66Recreational
Days of Service Wkdy Sa SuAvg Freq (Wkdy Peak) 30 min
Avg Freq (Wkdy Non-Peak) 30 minAvg Freq (Wked) 10-20 min
FY 2017 Farebox Recovery 53 transfer (to route) 0
Clipper usage 0
Annual Avg Monthly Avg Daily Annual Avg Monthly Avg Daily Annual Avg Monthly Avg DailyWeekday 21940 7313 549 804 268 20 10735 3578 268 Saturday 43799 7300 1752 1473 245 59 20480 3413 819 Sunday 56377 6264 1446 2040 227 52 28212 3135 723
Total 122116 13568 1174 4316 480 42 59428 6603 571
Annual Avg Monthly Avg Daily Annual Avg Monthly Avg Daily Annual Avg Monthly Avg DailyWeekday $104033 $34678 $2601 $37751 $12584 $944 $66282 $22094 $1657Saturday $152661 $25444 $6106 $79948 $13325 $3198 $72713 $12119 $2909Sunday $217032 $24115 $5565 $132049 $14672 $3386 $84983 $9443 $2179
Total $473726 $52636 $4555 $249748 $27750 $2401 $223978 $24886 $2154
Passengers per Revenue Hour
Subsidy per Passenger
Cost per Revenue Hour
Farebox Recovery
Weekday 273 $302 $12944 363Saturday 297 $166 $10367 524Sunday 276 $151 $10638 608
Total 283 $183 $10975 527
Passengers Revenue Hours Operating CostsPassenger
RevenueOperating Subsidy
Passengers per Revenue Hour
Subsidy per Passenger
Cost per Revenue Hour
Farebox Recovery
FY 2015 103930 3866 $477523 $209514 $268009 269 $258 $12352 439FY 2016 116942 4673 $531384 $245779 $285605 250 $244 $11373 463FY 2017 122116 4316 $473726 $249748 $223978 283 $183 $10975 527
Histo
ric Tr
ends
FY 20
161
7 DAT
A
Passengers Revenue Hours Revenue Miles
Operating Costs Passenger Revenue Operating Subsidy
62624
103052 103930 116942 122116
0
20000
40000
60000
80000
100000
120000
140000
FY 2013 FY 2014 FY 2015 FY 2016 FY 2017
Passengers
2941
3841 3866
4673 4316
0
1000
2000
3000
4000
5000
FY 2013 FY 2014 FY 2015 FY 2016 FY 2017
Revenue Hours
$330076
$538014 $477523
$531384 $473726
$0
$100000
$200000
$300000
$400000
$500000
$600000
FY 2013 FY 2014 FY 2015 FY 2016 FY 2017
Operating Costs
213
268 269 250
283
00
50
100
150
200
250
300
FY 2013 FY 2014 FY 2015 FY 2016 FY 2017
Passengers per Revenue Hour
$360 $322
$258 $244 $183
$000
$100
$200
$300
$400
$500
FY 2013 FY 2014 FY 2015 FY 2016 FY 2017
Subsidy per Passenger
$11223
$14007 $12352 $11373 $10975
$0
$50
$100
$150
$200
FY 2013 FY 2014 FY 2015 FY 2016 FY 2017
Cost per Revenue Hour
68Rural
Days of Service Wkdy Sa SuAvg Freq (Wkdy Peak) 60 min
Avg Freq (Wkdy Non-Peak) 120 minAvg Freq (Wked) 60-120 min
FY 2017 Farebox Recovery 9 transfer (to route) 13
Clipper usage 12
Annual Avg Monthly Avg Daily Annual Avg Monthly Avg Daily Annual Avg Monthly Avg DailyWeekday 59903 4992 239 7282 607 29 133167 11097 531 Saturday 8410 701 168 1492 124 30 27123 2260 542 Sunday 8285 690 129 1907 159 30 34638 2887 541
Total 76598 6383 210 10680 890 29 194928 16244 534
Annual Avg Monthly Avg Daily Annual Avg Monthly Avg Daily Annual Avg Monthly Avg DailyWeekday $645737 $53811 $2573 $64332 $5361 $256 $581405 $48450 $2316Saturday $131882 $10990 $2638 $9260 $772 $185 $122622 $10219 $2452Sunday $169286 $14107 $2645 $8856 $738 $138 $160430 $13369 $2507
Total $946905 $78909 $2594 $82448 $6871 $226 $864457 $72038 $2368
Passengers per Revenue Hour
Subsidy per Passenger
Cost per Revenue Hour
Farebox Recovery
Weekday 82 $971 $8868 100Saturday 56 $1458 $8841 70Sunday 43 $1936 $8879 52
Total 72 $1129 $8866 87
Passengers Revenue Hours Operating CostsPassenger
RevenueOperating Subsidy
Passengers per Revenue Hour
Subsidy per Passenger
Cost per Revenue Hour
Farebox Recovery
FY 2015 65866 10589 $848305 $80846 $767459 62 $1165 $8011 95FY 2016 70292 10611 $811978 $88808 $723170 66 $1029 $7652 109FY 2017 76598 10680 $946905 $82448 $864457 72 $1129 $8866 87
Histo
ric Tr
ends
FY 20
161
7 DAT
A
Passengers Revenue Hours Revenue Miles
Operating Costs Passenger Revenue Operating Subsidy
48113 56988
65866 70292 76598
0
20000
40000
60000
80000
100000
FY 2013 FY 2014 FY 2015 FY 2016 FY 2017
Passengers
7140 7185
10589 10611 10680
0
2000
4000
6000
8000
10000
12000
FY 2013 FY 2014 FY 2015 FY 2016 FY 2017
Revenue Hours
$532879 $571618
$848305 $811978 $946905
$0
$200000
$400000
$600000
$800000
$1000000
FY 2013 FY 2014 FY 2015 FY 2016 FY 2017
Operating Costs
67 79
62 66 72
00
20
40
60
80
100
FY 2013 FY 2014 FY 2015 FY 2016 FY 2017
Passengers per Revenue Hour
$979 $885
$1165 $1029
$1129
$000$200$400$600$800
$1000$1200$1400
FY 2013 FY 2014 FY 2015 FY 2016 FY 2017
Subsidy per Passenger
$7464 $7955 $8011 $7652 $8866
$0
$50
$100
$150
$200
FY 2013 FY 2014 FY 2015 FY 2016 FY 2017
Cost per Revenue Hour
71XLocal Trunkline
Days of Service WkdyAvg Freq (Wkdy Peak) 30 min
Avg Freq (Wkdy Non-Peak) 60 minAvg Freq (Wked) -
FY 2017 Farebox Recovery 15 transfer (to route) 26
Clipper usage 16
Annual Avg Monthly Avg Daily Annual Avg Monthly Avg Daily Annual Avg Monthly Avg DailyWeekday 121141 10095 479 7705 642 30 174624 14552 690 Saturday - - - - - - - - - Sunday - - - - - - - - -
Total 121141 10095 479 7705 642 30 174624 14552 690
Annual Avg Monthly Avg Daily Annual Avg Monthly Avg Daily Annual Avg Monthly Avg DailyWeekday $1116954 $93080 $4415 $164963 $13747 $652 $951991 $79333 $3763Saturday $ - $ - $ - $ - $ - $ - $ - $ - $ -Sunday $ - $ - $ - $ - $ - $ - $ - $ - $ -
Total $1116954 $93080 $4415 $164963 $13747 $652 $951991 $79333 $3763
Passengers per Revenue Hour
Subsidy per Passenger
Cost per Revenue Hour
Farebox Recovery
Weekday 157 $786 $14496 148Saturday - $ - $ - - Sunday - $ - $ - -
Total 157 $786 $14496 148
Passengers Revenue Hours Operating CostsPassenger
RevenueOperating Subsidy
Passengers per Revenue Hour
Subsidy per Passenger
Cost per Revenue Hour
Farebox Recovery
FY 2015 305440 7666 $1066058 $307659 $758399 398 $248 $13906 289FY 2016 259678 7717 $1075263 $300186 $775077 337 $298 $13934 279FY 2017 121141 7705 $1116954 $164963 $951991 157 $786 $14496 148
Histo
ric Tr
ends
FY 20
161
7 DAT
A
Passengers Revenue Hours Revenue Miles
Operating Costs Passenger Revenue Operating Subsidy
347560 341105 305440
259678
121141
050000
100000150000200000250000300000350000400000
FY 2013 FY 2014 FY 2015 FY 2016 FY 2017
Passengers9038
7578 7666 7717 7705
0
2000
4000
6000
8000
10000
FY 2013 FY 2014 FY 2015 FY 2016 FY 2017
Revenue Hours$1254262
$1116004 $1066058 $1075263 $1116954
$0
$200000
$400000
$600000
$800000
$1000000
$1200000
$1400000
FY 2013 FY 2014 FY 2015 FY 2016 FY 2017
Operating Costs
385 450
398 337
157
00100200300400500600700800
FY 2013 FY 2014 FY 2015 FY 2016 FY 2017
Passengers per Revenue Hour
$253 $222 $248 $298
$786
$000
$200
$400
$600
$800
$1000
FY 2013 FY 2014 FY 2015 FY 2016 FY 2017
Subsidy per Passenger
$13877 $14728 $13906 $13934 $14496
$0
$50
$100
$150
$200
FY 2013 FY 2014 FY 2015 FY 2016 FY 2017
Cost per Revenue Hour
113Supplemental
Days of Service School DaysAvg Freq (Wkdy Peak) 3 trips
Avg Freq (Wkdy Non-Peak) -Avg Freq (Wked) -
FY 2017 Farebox Recovery 29 transfer (to route) 0
Clipper usage 4
Annual Avg Monthly Avg Daily Annual Avg Monthly Avg Daily Annual Avg Monthly Avg DailyWeekday 16829 1530 92 317 29 2 2404 219 13 Saturday - - - - - - - - - Sunday - - - - - - - - -
Total 16829 1530 92 317 29 2 2404 219 13
Annual Avg Monthly Avg Daily Annual Avg Monthly Avg Daily Annual Avg Monthly Avg DailyWeekday $42180 $3835 $230 $12227 $1112 $67 $29953 $2723 $164Saturday $ - $ - $ - $ - $ - $ - $ - $ - $ -Sunday $ - $ - $ - $ - $ - $ - $ - $ - $ -
Total $42180 $3835 $230 $12227 $1112 $67 $29953 $2723 $164
Passengers per TripSubsidy per
PassengerCost per Revenue
HourFarebox Recovery
Weekday 315 $178 $13289 290Saturday - $ - $ - - Sunday - $ - $ - -
Total 315 $178 $13289 290
Passengers Revenue Hours Operating CostsPassenger
RevenueOperating Subsidy Passengers per Trip
Subsidy per Passenger
Cost per Revenue Hour
Farebox Recovery
FY 2015 12241 161 $28599 $10703 $17896 342 $146 $17752 374FY 2016 14601 263 $36924 $12809 $24115 317 $165 $14050 347FY 2017 16829 317 $42180 $12227 $29953 315 $178 $13289 290
Histo
ric Tr
ends
FY 20
161
7 DAT
A
Passengers Revenue Hours Revenue Miles
Operating Costs Passenger Revenue Operating Subsidy
15232 13521
12241 14601
16829
0
5000
10000
15000
20000
FY 2013 FY 2014 FY 2015 FY 2016 FY 2017
Passengers
229
165 161
263
317
0
50
100
150
200
250
300
350
FY 2013 FY 2014 FY 2015 FY 2016 FY 2017
Revenue Hours
$31562
$20182
$28599
$36924 $42180
$0
$10000
$20000
$30000
$40000
$50000
FY 2013 FY 2014 FY 2015 FY 2016 FY 2017
Operating Costs
220
365 342 317 315
00
100
200
300
400
500
FY 2013 FY 2014 FY 2015 FY 2016 FY 2017
Passengers per Trip
$051 $095
$146 $165 $178
$000$100$200$300$400$500$600$700$800
FY 2013 FY 2014 FY 2015 FY 2016 FY 2017
Subsidy per Passenger
$13795 $12261
$17752
$14050 $13289
$0
$50
$100
$150
$200
FY 2013 FY 2014 FY 2015 FY 2016 FY 2017
Cost per Revenue Hour
115Supplemental
Days of Service School DaysAvg Freq (Wkdy Peak) 5 trips
Avg Freq (Wkdy Non-Peak) -Avg Freq (Wked) -
FY 2017 Farebox Recovery 11 transfer (to route) 0
Clipper usage 7
Annual Avg Monthly Avg Daily Annual Avg Monthly Avg Daily Annual Avg Monthly Avg DailyWeekday 14021 1275 71 637 58 3 6963 633 35 Saturday - - - - - - - - - Sunday - - - - - - - - -
Total 14021 1275 71 637 58 3 6963 633 35
Annual Avg Monthly Avg Daily Annual Avg Monthly Avg Daily Annual Avg Monthly Avg DailyWeekday $87534 $7958 $444 $9504 $864 $48 $78030 $7094 $396Saturday $ - $ - $ - $ - $ - $ - $ - $ - $ -Sunday $ - $ - $ - $ - $ - $ - $ - $ - $ -
Total $87534 $7958 $444 $9504 $864 $48 $78030 $7094 $396
Passengers per TripSubsidy per
PassengerCost per Revenue
HourFarebox Recovery
Weekday 185 $557 $13744 109Saturday - $ - $ - - Sunday - $ - $ - -
Total 185 $557 $13744 109
Passengers Revenue Hours Operating CostsPassenger
RevenueOperating Subsidy Passengers per Trip
Subsidy per Passenger
Cost per Revenue Hour
Farebox Recovery
FY 2015 21488 775 $131168 $18863 $112305 221 $523 $16918 144FY 2016 16366 559 $82403 $12638 $69765 168 $426 $14754 153FY 2017 14021 637 $87534 $9504 $78030 185 $557 $13744 109
Histo
ric Tr
ends
FY 20
161
7 DAT
A
Passengers Revenue Hours Revenue Miles
Operating Costs Passenger Revenue Operating Subsidy
13524
21488
16366 14021
0
5000
10000
15000
20000
25000
FY 2013 FY 2014 FY 2015 FY 2016 FY 2017
Passengers
463
775
559 637
0
200
400
600
800
1000
FY 2013 FY 2014 FY 2015 FY 2016 FY 2017
Revenue Hours
$56706
$131168
$82403 $87534
$0
$20000
$40000
$60000
$80000
$100000
$120000
$140000
FY 2013 FY 2014 FY 2015 FY 2016 FY 2017
Operating Costs
232 221 168 185
00
100
200
300
400
500
FY 2013 FY 2014 FY 2015 FY 2016 FY 2017
Passengers per Trip
$362
$523 $426
$557
$000$100$200$300$400$500$600$700$800
FY 2013 FY 2014 FY 2015 FY 2016 FY 2017
Subsidy per Passenger
$12250
$16918 $14754 $13744
$0
$50
$100
$150
$200
FY 2013 FY 2014 FY 2015 FY 2016 FY 2017
Cost per Revenue Hour
117Supplemental
Days of Service School DaysAvg Freq (Wkdy Peak) 6 trips
Avg Freq (Wkdy Non-Peak) -Avg Freq (Wked) -
FY 2017 Farebox Recovery 21 transfer (to route) 0
Clipper usage 2
Annual Avg Monthly Avg Daily Annual Avg Monthly Avg Daily Annual Avg Monthly Avg DailyWeekday 34820 3165 193 640 58 4 4753 432 26 Saturday - - - - - - - - - Sunday - - - - - - - - -
Total 34820 3165 193 640 58 4 4753 432 26
Annual Avg Monthly Avg Daily Annual Avg Monthly Avg Daily Annual Avg Monthly Avg DailyWeekday $81509 $7410 $453 $17140 $1558 $95 $64369 $5852 $358Saturday $ - $ - $ - $ - $ - $ - $ - $ - $ -Sunday $ - $ - $ - $ - $ - $ - $ - $ - $ -
Total $81509 $7410 $453 $17140 $1558 $95 $64369 $5852 $358
Passengers per TripSubsidy per
PassengerCost per Revenue
HourFarebox Recovery
Weekday 284 $185 $12732 210Saturday - $ - $ - - Sunday - $ - $ - -
Total 284 $185 $12732 210
Passengers Revenue Hours Operating CostsPassenger
RevenueOperating Subsidy Passengers per Trip
Subsidy per Passenger
Cost per Revenue Hour
Farebox Recovery
FY 2015 50008 509 $77168 $77528 ($360) 399 ($001) $15158 1005FY 2016 33705 552 $77694 $23478 $54216 269 $161 $14075 302FY 2017 34820 640 $81509 $17140 $64369 284 $185 $12732 210
Histo
ric Tr
ends
FY 20
161
7 DAT
A
Passengers Revenue Hours Revenue Miles
Operating Costs Passenger Revenue Operating Subsidy
35174 34496
50008
33705 34820
0
10000
20000
30000
40000
50000
60000
FY 2013 FY 2014 FY 2015 FY 2016 FY 2017
Passengers
299 341
509 552
640
0
100
200
300
400
500
600
700
FY 2013 FY 2014 FY 2015 FY 2016 FY 2017
Revenue Hours
$41176 $41796
$77168 $77694 $81509
$0
$20000
$40000
$60000
$80000
$100000
FY 2013 FY 2014 FY 2015 FY 2016 FY 2017
Operating Costs
436 406 399
269 284
00
100
200
300
400
500
FY 2013 FY 2014 FY 2015 FY 2016 FY 2017
Passengers per Trip
($012) ($028) ($001)
$161 $185
-$200
-$100
$000
$100
$200
$300
$400
$500
$600
FY 2013 FY 2014 FY 2015 FY 2016 FY 2017
Subsidy per Passenger$13790
$12253
$15158 $14075
$12732
$0$20$40$60$80
$100$120$140$160
FY 2013 FY 2014 FY 2015 FY 2016 FY 2017
Cost per Revenue Hour
119Supplemental
Days of Service School DaysAvg Freq (Wkdy Peak) 5 trips
Avg Freq (Wkdy Non-Peak) -Avg Freq (Wked) -
FY 2017 Farebox Recovery 34 transfer (to route) 0
Clipper usage 5
Annual Avg Monthly Avg Daily Annual Avg Monthly Avg Daily Annual Avg Monthly Avg DailyWeekday 27161 2469 151 374 34 2 6893 627 38 Saturday - - - - - - - - - Sunday - - - - - - - - -
Total 27161 2469 151 374 34 2 6893 627 38
Annual Avg Monthly Avg Daily Annual Avg Monthly Avg Daily Annual Avg Monthly Avg DailyWeekday $56273 $5116 $313 $18859 $1714 $105 $37414 $3401 $208Saturday $ - $ - $ - $ - $ - $ - $ - $ - $ -Sunday $ - $ - $ - $ - $ - $ - $ - $ - $ -
Total $56273 $5116 $313 $18859 $1714 $105 $37414 $3401 $208
Passengers per TripSubsidy per
PassengerCost per Revenue
HourFarebox Recovery
Weekday 313 $138 $15058 335Saturday - $ - $ - - Sunday - $ - $ - -
Total 313 $138 $15058 335
Passengers Revenue Hours Operating CostsPassenger
RevenueOperating Subsidy Passengers per Trip
Subsidy per Passenger
Cost per Revenue Hour
Farebox Recovery
FY 2015 28376 466 $85243 $24699 $60544 319 $213 $18292 290FY 2016 30906 431 $68366 $28456 $39910 317 $129 $15877 416FY 2017 27161 374 $56273 $18859 $37414 313 $138 $15058 335
Histo
ric Tr
ends
FY 20
161
7 DAT
A
Passengers Revenue Hours Revenue Miles
Operating Costs Passenger Revenue Operating Subsidy
27987 28376
30906
27161
25000
26000
27000
28000
29000
30000
31000
32000
FY 2013 FY 2014 FY 2015 FY 2016 FY 2017
Passengers526
466 431
374
0
100
200
300
400
500
600
FY 2013 FY 2014 FY 2015 FY 2016 FY 2017
Revenue Hours
$64440
$85243
$68366 $56273
$0
$20000
$40000
$60000
$80000
$100000
FY 2013 FY 2014 FY 2015 FY 2016 FY 2017
Operating Costs
272 319 317 313
00
100
200
300
400
500
FY 2013 FY 2014 FY 2015 FY 2016 FY 2017
Passengers per Trip
$175 $213 $129 $138
$000$100$200$300$400$500$600$700$800
FY 2013 FY 2014 FY 2015 FY 2016 FY 2017
Subsidy per Passenger
$12251
$18292 $15877 $15058
$0
$50
$100
$150
$200
FY 2013 FY 2014 FY 2015 FY 2016 FY 2017
Cost per Revenue Hour
122Partnership
Days of Service WkdyAvg Freq (Wkdy Peak) -
Avg Freq (Wkdy Non-Peak) 30 minAvg Freq (Wked) -
FY 2017 Farebox Recovery 66 transfer (to route) 9
Clipper usage 6
Annual Avg Monthly Avg Daily Annual Avg Monthly Avg Daily Annual Avg Monthly Avg DailyWeekday 19860 1986 113 1696 170 10 15480 1548 88 Saturday - - - - - - - - - Sunday - - - - - - - - -
Total 19860 1986 113 1696 170 10 15480 1548 88
Annual Avg Monthly Avg Daily Annual Avg Monthly Avg Daily Annual Avg Monthly Avg DailyWeekday $183943 $18394 $1045 $121007 $12101 $688 $62936 $6294 $358Saturday $ - $ - $ - $ - $ - $ - $ - $ - $ -Sunday $ - $ - $ - $ - $ - $ - $ - $ - $ -
Total $183943 $18394 $1045 $121007 $12101 $688 $62936 $6294 $358
Passengers per Revenue Hour
Subsidy per Passenger
Cost per Revenue Hour
Farebox Recovery
Weekday 117 $317 $10844 658Saturday - $ - $ - - Sunday - $ - $ - -
Total 117 $317 $10844 658
Passengers Revenue Hours Operating CostsPassenger
RevenueOperating Subsidy
Passengers per Revenue Hour
Subsidy per Passenger
Cost per Revenue Hour
Farebox Recovery
FY 2015FY 2016 20360 2932 $325230 $149686 $175544 69 $862 $11094 460FY 2017 19860 1696 $183943 $121007 $62936 117 $317 $10844 658
Histo
ric Tr
ends
FY 20
161
7 DAT
A
Passengers Revenue Hours Revenue Miles
Operating Costs Passenger Revenue Operating Subsidy
20360 19860
0
5000
10000
15000
20000
25000
FY 2013 FY 2014 FY 2015 FY 2016 FY 2017
Passengers2932
1696
0
500
1000
1500
2000
2500
3000
3500
FY 2013 FY 2014 FY 2015 FY 2016 FY 2017
Revenue Hours$325230
$183943
$0
$50000
$100000
$150000
$200000
$250000
$300000
$350000
FY 2013 FY 2014 FY 2015 FY 2016 FY 2017
Operating Costs
69
117
00
20
40
60
80
100
120
140
FY 2013 FY 2014 FY 2015 FY 2016 FY 2017
Passengers per Revenue Hour$862
$317
$000
$200
$400
$600
$800
$1000
FY 2013 FY 2014 FY 2015 FY 2016 FY 2017
Subsidy per Passenger
$11094 $10844
$0
$50
$100
$150
$200
FY 2013 FY 2014 FY 2015 FY 2016 FY 2017
Cost per Revenue Hour
125Supplemental
Days of Service School DaysAvg Freq (Wkdy Peak) 4 trips
Avg Freq (Wkdy Non-Peak) -Avg Freq (Wked) -
FY 2017 Farebox Recovery 16 transfer (to route) 1
Clipper usage 8
Annual Avg Monthly Avg Daily Annual Avg Monthly Avg Daily Annual Avg Monthly Avg DailyWeekday 13757 1251 76 600 55 3 8580 780 48 Saturday - - - - - - - - - Sunday - - - - - - - - -
Total 13757 1251 76 600 55 3 8580 780 48
Annual Avg Monthly Avg Daily Annual Avg Monthly Avg Daily Annual Avg Monthly Avg DailyWeekday $72469 $6588 $403 $11570 $1052 $64 $60899 $5536 $338Saturday $ - $ - $ - $ - $ - $ - $ - $ - $ -Sunday $ - $ - $ - $ - $ - $ - $ - $ - $ -
Total $72469 $6588 $403 $11570 $1052 $64 $60899 $5536 $338
Passengers per TripSubsidy per
PassengerCost per Revenue
HourFarebox Recovery
Weekday 193 $443 $12086 160Saturday - $ - $ - - Sunday - $ - $ - -
Total 193 $443 $12086 160
Passengers Revenue Hours Operating CostsPassenger
RevenueOperating Subsidy Passengers per Trip
Subsidy per Passenger
Cost per Revenue Hour
Farebox Recovery
FY 2015 13298 578 $87015 $11914 $75101 186 $565 $15054 137FY 2016 13197 595 $77991 $12684 $65307 182 $495 $13117 163FY 2017 13757 600 $72469 $11570 $60899 193 $443 $12086 160
Histo
ric Tr
ends
FY 20
161
7 DAT
A
Passengers Revenue Hours Revenue Miles
Operating Costs Passenger Revenue Operating Subsidy
8798 7189
13298 13197 13757
02000400060008000
10000120001400016000
FY 2013 FY 2014 FY 2015 FY 2016 FY 2017
Passengers
100 90
578 595 600
0
100
200
300
400
500
600
700
FY 2013 FY 2014 FY 2015 FY 2016 FY 2017
Revenue Hours
$13752 $10979
$87015 $77991
$72469
$0
$20000
$40000
$60000
$80000
$100000
FY 2013 FY 2014 FY 2015 FY 2016 FY 2017
Operating Costs
492
402
186 182 193
00
100
200
300
400
500
FY 2013 FY 2014 FY 2015 FY 2016 FY 2017
Passengers per Trip
$015 $002
$565 $495
$443
$000$100$200$300$400$500$600$700$800
FY 2013 FY 2014 FY 2015 FY 2016 FY 2017
Subsidy per Passenger$13821
$12267
$15054 $13117
$12086
$0$20$40$60$80
$100$120$140$160
FY 2013 FY 2014 FY 2015 FY 2016 FY 2017
Cost per Revenue Hour
139Supplemental
Days of Service School DaysAvg Freq (Wkdy Peak) 2 trips
Avg Freq (Wkdy Non-Peak) -Avg Freq (Wked) -
FY 2017 Farebox Recovery 20 transfer (to route) 0
Clipper usage 24
Annual Avg Monthly Avg Daily Annual Avg Monthly Avg Daily Annual Avg Monthly Avg DailyWeekday 6414 583 36 253 23 1 4127 375 23 Saturday - - - - - - - - - Sunday - - - - - - - - -
Total 6414 583 36 253 23 1 4127 375 23
Annual Avg Monthly Avg Daily Annual Avg Monthly Avg Daily Annual Avg Monthly Avg DailyWeekday $33182 $3017 $184 $6635 $603 $37 $26547 $2413 $147Saturday $ - $ - $ - $ - $ - $ - $ - $ - $ -Sunday $ - $ - $ - $ - $ - $ - $ - $ - $ -
Total $33182 $3017 $184 $6635 $603 $37 $26547 $2413 $147
Passengers per TripSubsidy per
PassengerCost per Revenue
HourFarebox Recovery
Weekday 179 $414 $13110 200Saturday - $ - $ - - Sunday - $ - $ - -
Total 179 $414 $13110 200
Passengers Revenue Hours Operating CostsPassenger
RevenueOperating Subsidy Passengers per Trip
Subsidy per Passenger
Cost per Revenue Hour
Farebox Recovery
FY 2015 5906 225 $36437 $5258 $31179 164 $528 $16173 144FY 2016 6391 315 $43776 $6241 $37535 160 $587 $13880 143FY 2017 6414 253 $33182 $6635 $26547 179 $414 $13110 200
Histo
ric Tr
ends
FY 20
161
7 DAT
A
Passengers Revenue Hours Revenue Miles
Operating Costs Passenger Revenue Operating Subsidy
4232 4026
5906 6391 6414
0
1000
2000
3000
4000
5000
6000
7000
FY 2013 FY 2014 FY 2015 FY 2016 FY 2017
Passengers
226 227 225
315
253
0
50
100
150
200
250
300
350
FY 2013 FY 2014 FY 2015 FY 2016 FY 2017
Revenue Hours
$31306 $27734
$36437
$43776
$33182
$0
$10000
$20000
$30000
$40000
$50000
FY 2013 FY 2014 FY 2015 FY 2016 FY 2017
Operating Costs
120 111 164 160 179
00
100
200
300
400
500
FY 2013 FY 2014 FY 2015 FY 2016 FY 2017
Passengers per Trip
$427
$628 $528
$587
$414
$000$100$200$300$400$500$600$700$800
FY 2013 FY 2014 FY 2015 FY 2016 FY 2017
Subsidy per Passenger
$13834 $12239
$16173 $13880 $13110
$0
$50
$100
$150
$200
FY 2013 FY 2014 FY 2015 FY 2016 FY 2017
Cost per Revenue Hour
145Supplemental
Days of Service School DaysAvg Freq (Wkdy Peak) 2-3 trips
Avg Freq (Wkdy Non-Peak) -Avg Freq (Wked) -
FY 2017 Farebox Recovery 29 transfer (to route) 5
Clipper usage 2
Annual Avg Monthly Avg Daily Annual Avg Monthly Avg Daily Annual Avg Monthly Avg DailyWeekday 16406 1491 90 191 17 1 2175 198 12 Saturday - - - - - - - - - Sunday - - - - - - - - -
Total 16406 1491 90 191 17 1 2175 198 12
Annual Avg Monthly Avg Daily Annual Avg Monthly Avg Daily Annual Avg Monthly Avg DailyWeekday $25426 $2311 $139 $7258 $660 $40 $18168 $1652 $99Saturday $ - $ - $ - $ - $ - $ - $ - $ - $ -Sunday $ - $ - $ - $ - $ - $ - $ - $ - $ -
Total $25426 $2311 $139 $7258 $660 $40 $18168 $1652 $99
Passengers per TripSubsidy per
PassengerCost per Revenue
HourFarebox Recovery
Weekday 372 $111 $13347 285Saturday - $ - $ - - Sunday - $ - $ - -
Total 372 $111 $13347 285
Passengers Revenue Hours Operating CostsPassenger
RevenueOperating Subsidy Passengers per Trip
Subsidy per Passenger
Cost per Revenue Hour
Farebox Recovery
FY 2015 6911 87 $13373 $5858 $7515 337 $109 $15442 438FY 2016 10268 167 $21672 $6341 $15331 396 $149 $12993 293FY 2017 16406 191 $25426 $7258 $18168 372 $111 $13347 285
Histo
ric Tr
ends
FY 20
161
7 DAT
A
Passengers Revenue Hours Revenue Miles
Operating Costs Passenger Revenue Operating Subsidy
6911
10268
16406
0
5000
10000
15000
20000
FY 2013 FY 2014 FY 2015 FY 2016 FY 2017
Passengers
87
167 191
0
50
100
150
200
250
FY 2013 FY 2014 FY 2015 FY 2016 FY 2017
Revenue Hours
$13373
$21672 $25426
$0
$5000
$10000
$15000
$20000
$25000
$30000
FY 2013 FY 2014 FY 2015 FY 2016 FY 2017
Operating Costs
337 396 372
00
100
200
300
400
500
FY 2013 FY 2014 FY 2015 FY 2016 FY 2017
Passengers per Trip
$109 $149 $111
$000$100$200$300$400$500$600$700$800
FY 2013 FY 2014 FY 2015 FY 2016 FY 2017
Subsidy per Passenger
$15442 $12993 $13347
$0
$50
$100
$150
$200
FY 2013 FY 2014 FY 2015 FY 2016 FY 2017
Cost per Revenue Hour
151Supplemental
Days of Service School DaysAvg Freq (Wkdy Peak) 4-5 trips
Avg Freq (Wkdy Non-Peak) -Avg Freq (Wked) -
FY 2017 Farebox Recovery 25 transfer (to route) 1
Clipper usage 4
Annual Avg Monthly Avg Daily Annual Avg Monthly Avg Daily Annual Avg Monthly Avg DailyWeekday 36801 3346 204 594 54 3 10649 968 59 Saturday - - - - - - - - - Sunday - - - - - - - - -
Total 36801 3346 204 594 54 3 10649 968 59
Annual Avg Monthly Avg Daily Annual Avg Monthly Avg Daily Annual Avg Monthly Avg DailyWeekday $73842 $6713 $410 $18463 $1678 $103 $55379 $5034 $308Saturday $ - $ - $ - $ - $ - $ - $ - $ - $ -Sunday $ - $ - $ - $ - $ - $ - $ - $ - $ -
Total $73842 $6713 $410 $18463 $1678 $103 $55379 $5034 $308
Passengers per TripSubsidy per
PassengerCost per Revenue
HourFarebox Recovery
Weekday 428 $150 $12442 250Saturday - $ - $ - - Sunday - $ - $ - -
Total 428 $150 $12442 250
Passengers Revenue Hours Operating CostsPassenger
RevenueOperating Subsidy Passengers per Trip
Subsidy per Passenger
Cost per Revenue Hour
Farebox Recovery
FY 2015 39309 911 $134174 $34376 $99798 315 $254 $14722 256FY 2016 42643 759 $100712 $25851 $74861 456 $176 $13267 257FY 2017 36801 594 $73842 $18463 $55379 428 $150 $12442 250
Histo
ric Tr
ends
FY 20
161
7 DAT
A
Passengers Revenue Hours Revenue Miles
Operating Costs Passenger Revenue Operating Subsidy
39537 39309
42643
36801
32000
34000
36000
38000
40000
42000
44000
FY 2013 FY 2014 FY 2015 FY 2016 FY 2017
Passengers
784 911
759
594
0
200
400
600
800
1000
FY 2013 FY 2014 FY 2015 FY 2016 FY 2017
Revenue Hours
$95932
$134174
$100712
$73842
$0$20000$40000$60000$80000
$100000$120000$140000$160000
FY 2013 FY 2014 FY 2015 FY 2016 FY 2017
Operating Costs
368 315
456 428
00
100
200
300
400
500
FY 2013 FY 2014 FY 2015 FY 2016 FY 2017
Passengers per Trip
$188 $254
$176 $150
$000$100$200$300$400$500$600$700$800
FY 2013 FY 2014 FY 2015 FY 2016 FY 2017
Subsidy per Passenger
$12233
$14722 $13267 $12442
$0$20$40$60$80
$100$120$140$160
FY 2013 FY 2014 FY 2015 FY 2016 FY 2017
Cost per Revenue Hour
154Supplemental
Days of Service School DaysAvg Freq (Wkdy Peak) 3 trips
Avg Freq (Wkdy Non-Peak) -Avg Freq (Wked) -
FY 2017 Farebox Recovery 21 transfer (to route) 0
Clipper usage 5
Annual Avg Monthly Avg Daily Annual Avg Monthly Avg Daily Annual Avg Monthly Avg DailyWeekday 13738 1249 76 358 33 2 4342 395 24 Saturday - - - - - - - - - Sunday - - - - - - - - -
Total 13738 1249 76 358 33 2 4342 395 24
Annual Avg Monthly Avg Daily Annual Avg Monthly Avg Daily Annual Avg Monthly Avg DailyWeekday $41965 $3815 $233 $8847 $804 $49 $33118 $3011 $184Saturday $ - $ - $ - $ - $ - $ - $ - $ - $ -Sunday $ - $ - $ - $ - $ - $ - $ - $ - $ -
Total $41965 $3815 $233 $8847 $804 $49 $33118 $3011 $184
Passengers per TripSubsidy per
PassengerCost per Revenue
HourFarebox Recovery
Weekday 255 $241 $11729 211Saturday - $ - $ - - Sunday - $ - $ - -
Total 255 $241 $11729 211
Passengers Revenue Hours Operating CostsPassenger
RevenueOperating Subsidy Passengers per Trip
Subsidy per Passenger
Cost per Revenue Hour
Farebox Recovery
FY 2015 15376 293 $42604 $13174 $29430 388 $191 $14541 309FY 2016 17858 360 $46133 $14660 $31473 311 $176 $12808 318FY 2017 13738 358 $41965 $8847 $33118 255 $241 $11729 211
Histo
ric Tr
ends
FY 20
161
7 DAT
A
Passengers Revenue Hours Revenue Miles
Operating Costs Passenger Revenue Operating Subsidy
12138
15376 17858
13738
0
5000
10000
15000
20000
FY 2013 FY 2014 FY 2015 FY 2016 FY 2017
Passengers
310 293
360 358
050
100150200250300350400
FY 2013 FY 2014 FY 2015 FY 2016 FY 2017
Revenue Hours
$37913 $42604
$46133 $41965
$0
$10000
$20000
$30000
$40000
$50000
FY 2013 FY 2014 FY 2015 FY 2016 FY 2017
Operating Costs
291
388
311 255
00
100
200
300
400
500
FY 2013 FY 2014 FY 2015 FY 2016 FY 2017
Passengers per Trip
$256 $191 $176
$241
$000$100$200$300$400$500$600$700$800
FY 2013 FY 2014 FY 2015 FY 2016 FY 2017
Subsidy per Passenger
$12246
$14541 $12808
$11729
$0$20$40$60$80
$100$120$140$160
FY 2013 FY 2014 FY 2015 FY 2016 FY 2017
Cost per Revenue Hour
219Local Connector
Days of Service Wkdy Sa SuAvg Freq (Wkdy Peak) 30 min
Avg Freq (Wkdy Non-Peak) 30 minAvg Freq (Wked) 30 min
FY 2017 Farebox Recovery 11 transfer (to route) 20
Clipper usage 11
Annual Avg Monthly Avg Daily Annual Avg Monthly Avg Daily Annual Avg Monthly Avg DailyWeekday 40817 3401 161 5020 418 20 58766 4897 232 Saturday 4888 407 94 637 53 12 10931 911 210 Sunday 4744 395 79 735 61 12 12607 1051 210
Total 50449 4204 138 6392 533 18 82304 6859 225
Annual Avg Monthly Avg Daily Annual Avg Monthly Avg Daily Annual Avg Monthly Avg DailyWeekday $462388 $38532 $1828 $51411 $4284 $203 $410977 $34248 $1624Saturday $59904 $4992 $1152 $6230 $519 $120 $53674 $4473 $1032Sunday $68932 $5744 $1149 $6460 $538 $108 $62472 $5206 $1041
Total $591224 $49269 $1620 $64101 $5342 $176 $527123 $43927 $1444
Passengers per Revenue Hour
Subsidy per Passenger
Cost per Revenue Hour
Farebox Recovery
Weekday 81 $1007 $9212 111Saturday 77 $1098 $9401 104Sunday 65 $1317 $9381 94
Total 79 $1045 $9250 108
Passengers Revenue Hours Operating CostsPassenger
RevenueOperating Subsidy
Passengers per Revenue Hour
Subsidy per Passenger
Cost per Revenue Hour
Farebox Recovery
FY 2015 60906 6585 $569962 $65747 $504215 92 $828 $8656 115FY 2016 55610 6591 $590663 $73164 $517499 84 $931 $8961 124FY 2017 50449 6392 $591224 $64101 $527123 79 $1045 $9250 108
Histo
ric Tr
ends
FY 20
161
7 DAT
A
Passengers Revenue Hours Revenue Miles
Operating Costs Passenger Revenue Operating Subsidy
55543 60906
55610 50449
0
10000
20000
30000
40000
50000
60000
70000
FY 2013 FY 2014 FY 2015 FY 2016 FY 2017
Passengers
5734
6585 6591 6392
520054005600580060006200640066006800
FY 2013 FY 2014 FY 2015 FY 2016 FY 2017
Revenue Hours
$522978
$569962
$590663 $591224
$480000
$500000
$520000
$540000
$560000
$580000
$600000
FY 2013 FY 2014 FY 2015 FY 2016 FY 2017
Operating Costs
97 92 84 79
00
20
40
60
80
100
120
140
FY 2013 FY 2014 FY 2015 FY 2016 FY 2017
Passengers per Revenue Hour
$851 $828 $931
$1045
$000$200$400$600$800
$1000$1200$1400
FY 2013 FY 2014 FY 2015 FY 2016 FY 2017
Subsidy per Passenger
$9121 $8656 $8961 $9250
$0
$50
$100
$150
$200
FY 2013 FY 2014 FY 2015 FY 2016 FY 2017
Cost per Revenue Hour
228Local Connector
Days of Service Wkdy Sa SuAvg Freq (Wkdy Peak) 60 min
Avg Freq (Wkdy Non-Peak) 60 minAvg Freq (Wked) 60 min
FY 2017 Farebox Recovery 11 transfer (to route) 17
Clipper usage 15
Annual Avg Monthly Avg Daily Annual Avg Monthly Avg Daily Annual Avg Monthly Avg DailyWeekday 57316 4776 227 7175 598 28 65884 5490 260 Saturday 8218 685 158 1331 111 26 13020 1085 250 Sunday 5806 484 97 1536 128 26 15023 1252 250
Total 71340 5945 195 10042 837 28 93926 7827 257
Annual Avg Monthly Avg Daily Annual Avg Monthly Avg Daily Annual Avg Monthly Avg DailyWeekday $646194 $53850 $2554 $80857 $6738 $320 $565337 $47111 $2235Saturday $120205 $10017 $2312 $12568 $1047 $242 $107637 $8970 $2070Sunday $138407 $11534 $2307 $10487 $874 $175 $127920 $10660 $2132
Total $904806 $75401 $2479 $103912 $8659 $285 $800894 $66741 $2194
Passengers per Revenue Hour
Subsidy per Passenger
Cost per Revenue Hour
Farebox Recovery
Weekday 80 $986 $9006 125Saturday 62 $1310 $9030 105Sunday 38 $2203 $9011 76
Total 71 $1123 $9010 115
Passengers Revenue Hours Operating CostsPassenger
RevenueOperating Subsidy
Passengers per Revenue Hour
Subsidy per Passenger
Cost per Revenue Hour
Farebox Recovery
FY 2015 15287 2828 $239879 $18274 $221605 54 $1450 $8482 76FY 2016 17522 3185 $280634 $28092 $252542 55 $1441 $8812 100FY 2017 71340 10042 $904806 $103912 $800894 71 $1123 $9010 115
Histo
ric Tr
ends
FY 20
161
7 DAT
A
Passengers Revenue Hours Revenue Miles
Operating Costs Passenger Revenue Operating Subsidy
5854 15287 17522
71340
01000020000300004000050000600007000080000
FY 2013 FY 2014 FY 2015 FY 2016 FY 2017
Passengers
970
2828 3185
10042
0
2000
4000
6000
8000
10000
12000
FY 2013 FY 2014 FY 2015 FY 2016 FY 2017
Revenue Hours
$85183
$239879 $280634
$904806
$0
$200000
$400000
$600000
$800000
$1000000
FY 2013 FY 2014 FY 2015 FY 2016 FY 2017
Operating Costs
60 54 55 71
00
20
40
60
80
100
120
140
FY 2013 FY 2014 FY 2015 FY 2016 FY 2017
Passengers per Revenue Hour$1358
$1450 $1441
$1123
$000$200$400$600$800
$1000$1200$1400
FY 2013 FY 2014 FY 2015 FY 2016 FY 2017
Subsidy per Passenger
$8779 $8482 $8812 $9010
$0
$50
$100
$150
$200
FY 2013 FY 2014 FY 2015 FY 2016 FY 2017
Cost per Revenue Hour
233Local Connector
Days of Service Wkdy Sa SuAvg Freq (Wkdy Peak) 60 min
Avg Freq (Wkdy Non-Peak) 60 minAvg Freq (Wked) 60 min
FY 2017 Farebox Recovery 13 transfer (to route) 16
Clipper usage 10
Annual Avg Monthly Avg Daily Annual Avg Monthly Avg Daily Annual Avg Monthly Avg DailyWeekday 35589 2966 141 3306 276 13 38809 3234 153 Saturday 3911 326 75 490 41 9 5829 486 112 Sunday 3298 275 55 566 47 9 6726 561 112
Total 42798 3567 117 4363 364 12 51364 4280 141
Annual Avg Monthly Avg Daily Annual Avg Monthly Avg Daily Annual Avg Monthly Avg DailyWeekday $302758 $25230 $1197 $42450 $3538 $168 $260308 $21692 $1029Saturday $44829 $3736 $862 $5018 $418 $97 $39811 $3318 $766Sunday $51616 $4301 $860 $4533 $378 $76 $47083 $3924 $785
Total $399203 $33267 $1094 $52001 $4333 $142 $347202 $28934 $951
Passengers per Revenue Hour
Subsidy per Passenger
Cost per Revenue Hour
Farebox Recovery
Weekday 108 $731 $9158 140Saturday 80 $1018 $9141 112Sunday 58 $1428 $9118 88
Total 98 $811 $9151 130
Passengers Revenue Hours Operating CostsPassenger
RevenueOperating Subsidy
Passengers per Revenue Hour
Subsidy per Passenger
Cost per Revenue Hour
Farebox Recovery
FY 2015 50342 4366 $371602 $52526 $319076 115 $634 $8512 141FY 2016 49494 4384 $388005 $59296 $328709 113 $664 $8851 153FY 2017 42798 4363 $399203 $52001 $347202 98 $811 $9151 130
Histo
ric Tr
ends
FY 20
161
7 DAT
A
Passengers Revenue Hours Revenue Miles
Operating Costs Passenger Revenue Operating Subsidy
39956
50422 50342 49494 42798
0
10000
20000
30000
40000
50000
60000
FY 2013 FY 2014 FY 2015 FY 2016 FY 2017
Passengers
3981
4144
4366 4384 4363
370038003900400041004200430044004500
FY 2013 FY 2014 FY 2015 FY 2016 FY 2017
Revenue Hours
$350499
$378792 $371602
$388005 $399203
$320000$330000$340000$350000$360000$370000$380000$390000$400000$410000
FY 2013 FY 2014 FY 2015 FY 2016 FY 2017
Operating Costs
100
122 115 113 98
00
20
40
60
80
100
120
140
FY 2013 FY 2014 FY 2015 FY 2016 FY 2017
Passengers per Revenue Hour
$760 $661 $634 $664
$811
$000$200$400$600$800
$1000$1200$1400
FY 2013 FY 2014 FY 2015 FY 2016 FY 2017
Subsidy per Passenger
$8805 $9142 $8512 $8851 $9151
$0
$50
$100
$150
$200
FY 2013 FY 2014 FY 2015 FY 2016 FY 2017
Cost per Revenue Hour
245Local Connector
Days of Service Wkdy Sa SuAvg Freq (Wkdy Peak) 60 min
Avg Freq (Wkdy Non-Peak) 60 minAvg Freq (Wked) 60 min
FY 2017 Farebox Recovery 15 transfer (to route) 13
Clipper usage 13
Annual Avg Monthly Avg Daily Annual Avg Monthly Avg Daily Annual Avg Monthly Avg DailyWeekday 41761 3480 165 3014 251 12 28706 2392 113 Saturday 4220 352 81 620 52 12 5778 482 111 Sunday 3785 315 63 715 60 12 6667 556 111
Total 49766 4147 136 4349 362 12 41152 3429 113
Annual Avg Monthly Avg Daily Annual Avg Monthly Avg Daily Annual Avg Monthly Avg DailyWeekday $271762 $22647 $1074 $44873 $3739 $177 $226889 $18907 $897Saturday $55697 $4641 $1071 $6217 $518 $120 $49480 $4123 $952Sunday $64137 $5345 $1069 $5878 $490 $98 $58259 $4855 $971
Total $391596 $32633 $1073 $56968 $4747 $156 $334628 $27886 $917
Passengers per Revenue Hour
Subsidy per Passenger
Cost per Revenue Hour
Farebox Recovery
Weekday 139 $543 $9016 165Saturday 68 $1173 $8988 112Sunday 53 $1539 $8970 92
Total 114 $672 $9004 145
Passengers Revenue Hours Operating CostsPassenger
RevenueOperating Subsidy
Passengers per Revenue Hour
Subsidy per Passenger
Cost per Revenue Hour
Farebox Recovery
FY 2015FY 2016 2184 227 $19695 $3137 $16558 96 $758 $8695 159FY 2017 49766 4349 $391596 $56968 $334628 114 $672 $9004 145
Histo
ric Tr
ends
FY 20
161
7 DAT
A
Passengers Revenue Hours Revenue Miles
Operating Costs Passenger Revenue Operating Subsidy
2184
49766
0
10000
20000
30000
40000
50000
60000
FY 2013 FY 2014 FY 2015 FY 2016 FY 2017
Passengers
227
4349
0
1000
2000
3000
4000
5000
FY 2013 FY 2014 FY 2015 FY 2016 FY 2017
Revenue Hours
$19695
$391596
$0
$100000
$200000
$300000
$400000
$500000
FY 2013 FY 2014 FY 2015 FY 2016 FY 2017
Operating Costs
96 114
00
20
40
60
80
100
120
140
FY 2013 FY 2014 FY 2015 FY 2016 FY 2017
Passengers per Revenue Hour
$758 $672
$000$200$400$600$800
$1000$1200$1400
FY 2013 FY 2014 FY 2015 FY 2016 FY 2017
Subsidy per Passenger
$8695 $9004
$0
$50
$100
$150
$200
FY 2013 FY 2014 FY 2015 FY 2016 FY 2017
Cost per Revenue Hour
251Local Connector
Days of Service Wkdy Sa SuAvg Freq (Wkdy Peak) 60 min
Avg Freq (Wkdy Non-Peak) 60 minAvg Freq (Wked) 60 min
FY 2017 Farebox Recovery 11 transfer (to route) 8
Clipper usage 8
Annual Avg Monthly Avg Daily Annual Avg Monthly Avg Daily Annual Avg Monthly Avg DailyWeekday 76675 6390 303 6754 563 27 95654 7971 378 Saturday 9952 829 191 1325 110 25 18630 1553 358 Sunday 8879 740 148 1528 127 25 21497 1791 358
Total 95506 7959 262 9607 801 26 135781 11315 372
Annual Avg Monthly Avg Daily Annual Avg Monthly Avg Daily Annual Avg Monthly Avg DailyWeekday $625542 $52129 $2472 $78006 $6501 $308 $547536 $45628 $2164Saturday $122485 $10207 $2355 $12104 $1009 $233 $110381 $9198 $2123Sunday $140992 $11749 $2350 $11713 $976 $195 $129279 $10773 $2155
Total $889019 $74085 $2436 $101823 $8485 $279 $787196 $65600 $2157
Passengers per Revenue Hour
Subsidy per Passenger
Cost per Revenue Hour
Farebox Recovery
Weekday 114 $714 $9262 125Saturday 75 $1109 $9246 99Sunday 58 $1456 $9225 83
Total 99 $824 $9254 115
Passengers Revenue Hours Operating CostsPassenger
RevenueOperating Subsidy
Passengers per Revenue Hour
Subsidy per Passenger
Cost per Revenue Hour
Farebox Recovery
FY 2015 97647 9172 $800242 $103081 $697161 106 $714 $8725 129FY 2016 98886 9226 $831623 $120959 $710664 107 $719 $9014 145FY 2017 95506 9607 $889019 $101823 $787196 99 $824 $9254 115
Histo
ric Tr
ends
FY 20
161
7 DAT
A
Passengers Revenue Hours Revenue Miles
Operating Costs Passenger Revenue Operating Subsidy
87073
97647 98886
95506
80000
85000
90000
95000
100000
FY 2013 FY 2014 FY 2015 FY 2016 FY 2017
Passengers
8322
9172 9226
9607
7500
8000
8500
9000
9500
10000
FY 2013 FY 2014 FY 2015 FY 2016 FY 2017
Revenue Hours
$772570
$800242
$831623
$889019
$700000
$750000
$800000
$850000
$900000
FY 2013 FY 2014 FY 2015 FY 2016 FY 2017
Operating Costs
105 106 107 99
00
20
40
60
80
100
120
140
FY 2013 FY 2014 FY 2015 FY 2016 FY 2017
Passengers per Revenue Hour
$797 $714 $719
$824
$000$200$400$600$800
$1000$1200$1400
FY 2013 FY 2014 FY 2015 FY 2016 FY 2017
Subsidy per Passenger
$9284 $8725 $9014 $9254
$0
$50
$100
$150
$200
FY 2013 FY 2014 FY 2015 FY 2016 FY 2017
Cost per Revenue Hour
257Local Connector
Days of Service WkdyAvg Freq (Wkdy Peak) 60 min
Avg Freq (Wkdy Non-Peak) 60 minAvg Freq (Wked) -
FY 2017 Farebox Recovery 12 transfer (to route) 6
Clipper usage 13
Annual Avg Monthly Avg Daily Annual Avg Monthly Avg Daily Annual Avg Monthly Avg DailyWeekday 69126 5761 273 7643 637 30 85748 7146 339 Saturday - - - - - - - - - Sunday - - - - - - - - -
Total 69126 5761 273 7643 637 30 85748 7146 339
Annual Avg Monthly Avg Daily Annual Avg Monthly Avg Daily Annual Avg Monthly Avg DailyWeekday $697953 $58163 $2759 $82621 $6885 $327 $615332 $51278 $2432Saturday $ - $ - $ - $ - $ - $ - $ - $ - $ -Sunday $ - $ - $ - $ - $ - $ - $ - $ - $ -
Total $697953 $58163 $2759 $82621 $6885 $327 $615332 $51278 $2432
Passengers per Revenue Hour
Subsidy per Passenger
Cost per Revenue Hour
Farebox Recovery
Weekday 90 $890 $9132 118Saturday - $ - $ - - Sunday - $ - $ - -
Total 90 $890 $9132 118
Passengers Revenue Hours Operating CostsPassenger
RevenueOperating Subsidy
Passengers per Revenue Hour
Subsidy per Passenger
Cost per Revenue Hour
Farebox Recovery
FY 2015 69984 6289 $546363 $73402 $472961 111 $676 $8687 134FY 2016 71429 6414 $575805 $83288 $492517 111 $690 $8977 145FY 2017 69126 7643 $697953 $82621 $615332 90 $890 $9132 118
Histo
ric Tr
ends
FY 20
161
7 DAT
A
Passengers Revenue Hours Revenue Miles
Operating Costs Passenger Revenue Operating Subsidy
35511
68515 69984 71429 69126
01000020000300004000050000600007000080000
FY 2013 FY 2014 FY 2015 FY 2016 FY 2017
Passengers
2909
5965 6289 6414 7643
0
2000
4000
6000
8000
10000
FY 2013 FY 2014 FY 2015 FY 2016 FY 2017
Revenue Hours
$263500
$555608 $546363 $575805
$697953
$0$100000$200000$300000$400000$500000$600000$700000$800000
FY 2013 FY 2014 FY 2015 FY 2016 FY 2017
Operating Costs
122 115 111 111
90
00
20
40
60
80
100
120
140
FY 2013 FY 2014 FY 2015 FY 2016 FY 2017
Passengers per Revenue Hour
$625 $721 $676 $690
$890
$000$200$400$600$800
$1000$1200$1400
FY 2013 FY 2014 FY 2015 FY 2016 FY 2017
Subsidy per Passenger
$9057 $9315 $8687 $8977 $9132
$0
$50
$100
$150
$200
FY 2013 FY 2014 FY 2015 FY 2016 FY 2017
Cost per Revenue Hour
Hdn ValleyYellow Bus
Days of Service School DaysAvg Freq (Wkdy Peak) 2 trips
Avg Freq (Wkdy Non-Peak) -Avg Freq (Wked) -
FY 2017 Farebox Recovery 26 transfer (to route) -
Clipper usage -
Annual Avg Monthly Avg Daily Annual Avg Monthly Avg Daily Annual Avg Monthly Avg DailyWeekday 9281 844 52 180 16 1 1638 149 9 Saturday - - - - - - - - - Sunday - - - - - - - - -
Total 9281 844 52 180 16 1 1638 149 9
Annual Avg Monthly Avg Daily Annual Avg Monthly Avg Daily Annual Avg Monthly Avg DailyWeekday $124763 $11342 $693 $32170 $2925 $179 $92593 $8418 $514Saturday $ - $ - $ - $ - $ - $ - $ - $ - $ -Sunday $ - $ - $ - $ - $ - $ - $ - $ - $ -
Total $124763 $11342 $693 $32170 $2925 $179 $92593 $8418 $514
Passengers per Revenue Hour
Subsidy per Passenger
Cost per Revenue Hour
Farebox Recovery
Weekday 516 $998 $69313 258Saturday - $ - $ - - Sunday - $ - $ - -
Total 516 $998 $69313 258
Passengers Revenue Hours Operating CostsPassenger
RevenueOperating Subsidy
Passengers per Revenue Hour
Subsidy per Passenger
Cost per Revenue Hour
Farebox Recovery
FY 2015FY 2016 8669 211 $140482 $25658 $114824 412 $1325 $66706 183FY 2017 9281 180 $124763 $32170 $92593 516 $998 $69313 258
Histo
ric Tr
ends
FY 20
161
7 DAT
A
Passengers Revenue Hours Revenue Miles
Operating Costs Passenger Revenue Operating Subsidy
8669 9281
0
2000
4000
6000
8000
10000
FY 2013 FY 2014 FY 2015 FY 2016 FY 2017
Passengers211
180
0
50
100
150
200
250
FY 2013 FY 2014 FY 2015 FY 2016 FY 2017
Revenue Hours$140482
$124763
$0$20000$40000$60000$80000
$100000$120000$140000$160000
FY 2013 FY 2014 FY 2015 FY 2016 FY 2017
Operating Costs
412 516
00
500
1000
1500
2000
FY 2013 FY 2014 FY 2015 FY 2016 FY 2017
Passengers per Revenue Hour
$1325
$998
$000
$200
$400
$600
$800
$1000
$1200
$1400
FY 2013 FY 2014 FY 2015 FY 2016 FY 2017
Subsidy per Passenger
$66706 $69313
$0$100$200$300$400$500$600$700$800
FY 2013 FY 2014 FY 2015 FY 2016 FY 2017
Cost per Revenue Hour
White HillYellow Bus
Days of Service School DaysAvg Freq (Wkdy Peak) 17 trips
Avg Freq (Wkdy Non-Peak) -Avg Freq (Wked) -
FY 2017 Farebox Recovery 60 transfer (to route) -
Clipper usage -
Annual Avg Monthly Avg Daily Annual Avg Monthly Avg Daily Annual Avg Monthly Avg DailyWeekday 127219 11565 707 1065 97 6 12096 1100 67 Saturday - - - - - - - - - Sunday - - - - - - - - -
Total 127219 11565 707 1065 97 6 12096 1100 67
Annual Avg Monthly Avg Daily Annual Avg Monthly Avg Daily Annual Avg Monthly Avg DailyWeekday $738585 $67144 $4103 $440896 $40081 $2449 $297689 $27063 $1654Saturday $ - $ - $ - $ - $ - $ - $ - $ - $ -Sunday $ - $ - $ - $ - $ - $ - $ - $ - $ -
Total $738585 $67144 $4103 $440896 $40081 $2449 $297689 $27063 $1654
Passengers per Revenue Hour
Subsidy per Passenger
Cost per Revenue Hour
Farebox Recovery
Weekday 1194 $234 $69325 597Saturday - $ - $ - - Sunday - $ - $ - -
Total 1194 $234 $69325 597
Passengers Revenue Hours Operating CostsPassenger
RevenueOperating Subsidy
Passengers per Revenue Hour
Subsidy per Passenger
Cost per Revenue Hour
Farebox Recovery
FY 2015FY 2016 129635 870 $579937 $385753 $194184 1491 $150 $66698 665FY 2017 127219 1065 $738585 $440896 $297689 1194 $234 $69325 597
Histo
ric Tr
ends
FY 20
161
7 DAT
A
Passengers Revenue Hours Revenue Miles
Operating Costs Passenger Revenue Operating Subsidy
129635 127219
0
20000
40000
60000
80000
100000
120000
140000
FY 2013 FY 2014 FY 2015 FY 2016 FY 2017
Passengers
870
1065
0
200
400
600
800
1000
1200
FY 2013 FY 2014 FY 2015 FY 2016 FY 2017
Revenue Hours
$579937
$738585
$0$100000$200000$300000$400000$500000$600000$700000$800000
FY 2013 FY 2014 FY 2015 FY 2016 FY 2017
Operating Costs
1491
1194
00200400600800
1000120014001600
FY 2013 FY 2014 FY 2015 FY 2016 FY 2017
Passengers per Revenue Hour
$150 $234
$000
$200
$400
$600
$800
$1000
$1200
$1400
FY 2013 FY 2014 FY 2015 FY 2016 FY 2017
Subsidy per Passenger$66698 $69325
$0$100$200$300$400$500$600$700$800
FY 2013 FY 2014 FY 2015 FY 2016 FY 2017
Cost per Revenue Hour
MARIN TRANSIT | 2018ndash2027 SHORT RANGE TRANSIT PLAN Chapter 4 Capital Plan
DRAFT 4-9
Table 4-7 Local Transit Bus Replacement Schedule
Fiscal Year (In-service)
Replacements
Total Cost
Local Share Vehicle Type Seating
Capacity Service(1)
FY 201718 10 $7710000 $1387800 40ft hybrid 39 LB
2 $1662000 $332404 35ft Electric 32 LB
FY 201819
1 $125000 $22500 24ft 20 SH
4 $1600000 $1094880 29ft XHF
(upgrade) 22 SG
FY 201920 10 $8940000 $1609200 60ft 63 LB
FY 202021 8 $1032000 $185760 24ft 20 SH
2 $850000 $153000 35ft XHF 37 MW
FY 202223
7 $5584578 $1005224 35ft hybrid 32 LB
2 $874182 $599281 29ft XHF
(upgrade) 22 SG
FY 202425 3 $1393227 $250781 35ft XHF 37 MW
FY 202526 2 $299093 $53837 24ft 20 SH
5 $2391706 $430507 35ft XHF 37 MW
FY 202627 - - - - - -
Notes (1) Service Types LB ndash Big Bus SH- Shuttle SG- Rural Stagecoach MW- Seasonal Muir Woods and School
Expansion Needs When considering service expansion vehicles are often a constraint on the amount of service that can be added Expansion vehicles are a lower priority in the regional capital plan and typically do not receive federal funds Local state or discretionary grants are required to expand fleets The capital plan does not include any expansion vehicles for the local fixed route program consistent with the current service plan
Marin Transit relies on three retired active vehicles to support operations Retired active vehicles are vehicles that are beyond their FTA-determined useful life that remain in service while their replacements are added the fleet The District intends to replace these as expansion vehicles if funding becomes available
Demand Response Vehicles
Marin Transit has 58 vehicles available for local and regional paratransit service To provide an adequate number of spare vehicles a maximum of about 46 vehicles in service Marin Transit owns 32 vehicles GGBHTD owns 14 and the contractor provides another 13 vehicles to support the operations Eleven of the 13 contractor vehicles will be replaced in early 2018 - five by the District and six by GGBHTD Two of the five replaced by the District will be replaced with smaller accessible vans These will be used for same day
Fixed-Route Passengers (incl Yellow Bus) by Month
July August September October November December January February March April May June
Prior Fiscal Year Passengers Current Fiscal Year PassengersPrior Fiscal Year Passengers Current Fiscal Year Passengers
0
80000
160000
240000
320000
244439
271284484271284
296637296637
2768532276853
252829252829
238010238010
219681219681
2097050505209705
277644277644
240773240773240773240773
284816284816
24935149492493512444392444392442 43999244439244244439439244439244244439999999244200
2600562602600 0000000260056
FISCAL YEAR
2018
Demand Response Passengers by Month
July August September October November December January February March April May June
Prior Fiscal Year Passengers Current Fiscal Year PassengersPrior Fiscal Year Passengers Current Fiscal Year Passengers
0
4000
8000
12000
16000
12 77312773
13631 1362813628 1356413564
1247712477
1206712067 1212412124118100011810
1364613646
1260912609
1359313593
12950129501277312 77312 77312 77312613131612 6133312 6133312613331277312773127731277312613
13 6311363113 631135641363113 613631311363113 6136313113564
Year-to-Date Ridership Trends
Item 3b
2
Average Systemwide Daily Passengers
Weekday Saturday Sunday
Prior Fiscal Year Average Daily Passengers Current Fiscal Year Average Daily PassengersPrior Fiscal Year Average Daily Passengers Current Fiscal Year Average Daily Passengers
0
3000
6000
9000
12000
11370113701109811098
7726772674407440
66576657
60556055
Productivity (paxhr) by Typology
1 Local T
runklin
e
2 Local B
asic
3 Local C
onnecto
r
5 R
ura
l
8 R
ecre
ational
9 D
em
and R
esponse
Prior Fiscal Year Productivity Current Fiscal Year ProductivityPrior Fiscal Year Productivity Current Fiscal Year Productivity
00
80
160
240
320
249249 252252
163163
14814 8148
9292 91918181
757 575
320320
275275
2323 2121
Monthly StatisticsMONTH
August
1 Local Trunkline Routes 35 36 71X
2 Local Basic Routes 17 22 23 23X 29 49
3 Local Connector Routes 219 228 233 245 251 257
5 Rural Routes 61 68
8 Recreational Routes 6666F
9 Demand Response Local Paratransit Novato Dial-A-Ride Rural Dial-A-Ride
Route Typologies
Item 3b
3
Fixed-Route Passengers (incl Yellow Bus) by Month
July August September October November December January February March April May June
Prior Fiscal Year Passengers Current Fiscal Year Passengers
0
80000
160000
240000
320000
244439244439
271284271284
296637296637
276853276853
252829252829
238010238010
219681219681209705209705
277644277644
240773240773
284816284816
249351249351244200244200
260056260056
282441282441
FISCAL YEAR
2018
Demand Response Passengers by Month
July August September October November December January February March April May June
Prior Fiscal Year Passengers Current Fiscal Year Passengers
0
4000
8000
12000
16000
1277312773
1363113631 1362813628 1356413564
12477124771206712067 1212412124
1181011810
1364613646
1260912609
1359313593
12950129501261312613
1356413564 1342713427
Year-to-Date Ridership Trends
Monthly Monitoring Report 11022017
Page 12Item 3b
2
Average Systemwide Daily Passengers
Weekday Saturday Sunday
Prior Fiscal Year Average Daily Passengers Current Fiscal Year Average Daily Passengers
0
3000
6000
9000
12000 11848118481161311613
73637363
67876787
6126612657395739
Productivity (paxhr) by Typology
1 L
ocal
Tru
nklin
e
2 L
ocal
Bas
ic
3 L
ocal
Con
nect
or
5 R
ural
8 R
ecre
atio
nal
9 D
eman
d R
espo
nse
Prior Fiscal Year Productivity Current Fiscal Year Productivity
00
80
160
240
320
278278 274274
174174 168168
9898 9797
7676 7676
304304
222222
2323 2222
Monthly StatisticsMONTH
September
1 Local Trunkline Routes 35 36 71X
2 Local Basic Routes 17 22 23 23X 29 49
3 Local Connector Routes 219 228 233 245 251 257
5 Rural Routes 61 68
8 Recreational Routes 6666F
9 Demand Response Local Paratransit Novato Dial-A-Ride Rural Dial-A-Ride
Route Typologies
Page 22Item 3b
3
Fixed-Route Passengers (incl Yellow Bus) by Month
July August September October November December January February March April May June
Prior Fiscal Year Passengers Current Fiscal Year Passengers
0
80000
160000
240000
320000
244439244439
271284271284
296637296637
276853276853
252829252829
238010238010
219681219681209705209705
277644277644
240773240773
284816284816
249351249351244200244200
260056260056
282441282441 282922282922
FISCAL YEAR
2018
Demand Response Passengers by Month
July August September October November December January February March April May June
Prior Fiscal Year Passengers Current Fiscal Year Passengers
0
4000
8000
12000
16000
1277312773
1363113631 1362813628 1356413564
12477124771206712067 1212412124
1181011810
1364613646
1260912609
1359313593
12950129501261312613
1356413564 13427134271373413734
Year-to-Date Ridership Trends
Monthly Monitoring Report 12082017
Page 12Item 3b
2
Average Systemwide Daily Passengers
Weekday Saturday Sunday
Prior Fiscal Year Average Daily Passengers Current Fiscal Year Average Daily Passengers
0
3000
6000
9000
120001125811258 1115111151
6043604364326432
4717471750675067
Productivity (paxhr) by Typology
1 L
ocal
Tru
nklin
e
2 L
ocal
Bas
ic
3 L
ocal
Con
nect
or
5 R
ural
8 R
ecre
atio
nal
9 D
eman
d R
espo
nse
Prior Fiscal Year Productivity Current Fiscal Year Productivity
00
70
140
210
280258258
270270
163163 161161
9696 9595
6363 7070
202202190190
2323 2121
Monthly StatisticsMONTH
October
1 Local Trunkline Routes 35 36 71X
2 Local Basic Routes 17 22 23 23X 29 49
3 Local Connector Routes 219 228 233 245 251 257
5 Rural Routes 61 68
8 Recreational Routes 6666F
9 Demand Response Local Paratransit Novato Dial-A-Ride Rural Dial-A-Ride
Route Typologies
Page 22Item 3b
3
- RFP - OampM for Fixed Route Service - Addendum 3 12-18-2017
- MV Fee Schedule
- Airporter Fee Schedule
- FY2017Performance
-
- System Performance Summary for FY 201617
-
- Fixed Route
- Yellow Bus
- Demand Response
- Other Services
-
- Performance Goals
- Ridership Trends
- FY 201718 Performance Outlook
-
- Attachment A Route Profiles
-
- Local Transit Bus Replacement Schedule
- August 2017 Monthly Monitoring Report
- September 2017 Monthly Monitoring Report
- October 2017 Monthly Monitoring Report
-