Predicting User Interaction on Social Media using Machine ...

Machine Learning Approach for Predicting the Discharging Capacities of Doped lithium Nickel-
Cobalt-Manganese Cathode Materials in Li-ion Batteries
Guanyu Wang1, Tom Fearn2, Tengyao Wang2*, Kwang-Leong Choy1*
1- Institute for Materials Discovery, Faculty of Maths and Physical Sciences, University College London
Roberts Building, London WC1E 7JE, United Kingdom
2- Department of Statistical Science, University College London, 1-19 Torrington Place, London WC1R 7HB,
United Kingdom
Author information(ORCID )
Guanyu Wang : https://orcid.org/0000-0003-1736-5797
Tom Fearn: https://orcid.org/0000-0003-2222-6601
Tengyao Wang: https://orcid.org/0000-0003-2072-6645
Kwang-Leong Choy: https://orcid.org/0000-0002-5596-4427
All inquires should be addressed to the corresponding authors (*) listed below:
Dr. T. Y. Wang : Room 133, 1-19 Torrington Place, London WC1R 7HB, United Kingdom,
E-mail: [email protected]
Prof. K.L. Choy: Faculty of Maths and Physical Sciences, University College London , Room 1.07 Roberts
Building, London WC1E 7JE, United Kingdom
E-email: [email protected]
Keywords: Machine-learning, Lithium-ion Batteries, Doped Cathode Materials

1. Abstract
Understanding the governing dopant feature for cyclic discharge capacity is vital for the design and
discovery of new doped lithium Nickel-Cobalt-Manganese (NCM) oxide cathodes for lithium-ion battery
applications. We herein apply six machine learning regression algorithms to study the correlations of the
structural, elemental features of 168 distinct doped NCM systems with their respective initial discharge
capacity (IC) and 50th cycle discharge capacity (EC). First, Pearson’s correlation coefficient study
suggests that the lithium content ratio is highly correlated to both discharge capacity variables. Among
all six regression algorithms, gradient boosting models have demonstrated the best prediction power for
both IC and EC, with the root-mean-square error calculated to be 16.66 mAhg-1 and 18.59 mAhg-1
respectively against a hold-out test set. Furthermore, a game-theory based variable importance analysis
reveals that the doped NCM materials with higher lithium content, smaller dopant content and doped
with lower electronegativity atoms, are more likely to possess higher IC and EC. This study has
demonstrated the exciting potentials of applying cutting-edge machine learning techniques to accurately
capture the complex structure-property relationship of doped NCM systems and the models can be used
as fast screening tools for new doping NCM structures with more superior electrochemical discharging
properties.
2. Introduction
The unprecedented increase in the demand for clean energy has accelerated the research for discovering
new lithium-ion batteries with higher energy density, higher power density and more steady cyclic
performance. Cathodes, in particular, have received a considerable amount of attention due to their
current high cost, arising from the use of expensive cobalt metals, and the limited capacity that cannot
fulfil the current demand.1

Among the various cathode candidates, layered cathodes have received tremendous market success
owing to their high practical capacity and the wide operating voltage window. Quinary oxides (e.g.
LiNixCoyMnzO2) is currently the state-of-art layered cathode material as it integrates the superior
properties of all three fundamental layered materials: LiCoO2 (high kinetics), LiNiO2 (high capacity),
LiMnO2 (high safety). The nature of its broad compositional space has enabled scientists to discover new
and robust electrochemical compounds such as LiNi0.33Co0.33Mn0.33O2 (NCM333),
LiNi0.50Co0.20Mn0.30O2 (NCM523), LiNi0.60Co0.20Mn0.20O2 (NCM622) and LiNi0.80Co0.10Mn0.10O2
(NCM811).2–4 It is important to note that the different transition metals in these compounds play different
roles during electrochemical reactions: nickel ion acts as the main active component during redox
reactions, as it has the most diverse range of oxidation states among all. Manganese helps to stabilize the
overall structure while cobalt can effectively prohibit the cation mixing effect between Li-ion and Ni-
ion. Furthermore, the mixing ratio of each transition metal (TM) in the material can bring different
benefits to the cathode’s properties. A higher concentration of nickel can greatly improve the overall
capacity as opposed to the benefits of higher kinetics and better safety from increasing the respective
concentration of cobalt and manganese.4
A common bottleneck issue is encountered during the selection of the optimal mixing ratio of these TMs
to reach all desirable cathode properties (i.e. high kinetics, high stability, high capacity). The underlying
reasons are the compositional space being too broad to be explored experimentally and the unavoidable
benefits trade-offs from TM substitution. A wide range of studies has been conducted in doping the
quinary oxide system with a trace amount of cation atoms to enhance the cathode’s electrochemical
capability with minimal disturbance to the properties of the original crystal structure. Several successful
cases have been made using various doping elements such as Al5, Fe5, Cu6, Cr78, Mg9, Mo10, K11, Pb12,
Ti13, Si14, Sn15. In general, two major benefits can be attained through the doping method. The first
benefit can be seen from the hindering of the migration of Ni2+ into the Li+ layer to reduce the anionic

mixing during the intercalation reactions. The second benefit is to increase the strength of TM-O bond
to improve the overall structural stability and reduce the oxygen release during charge-discharge cycling.
Nevertheless, the diverse available doping sites (Li, Ni, Co, Mn) along with the large compositional space
have inevitably increased the difficulty of identifying the most suitable dopant for each NCM -derived
cathode material. The conventional approach to characterize the electrochemical properties of a new
doped system is through conducting repetitive experiments which is costly and time-consuming. Another
approach based on the first-principle computational modelling is also hindered by the expensive
computing cost for studying very large supercell systems. To conquer these shortcomings, this paper
reports the use of the robust data learning and analyzing features of machine learning to investigate the
linkages among various doping factors and the experimental cyclic performance of doped NCM
cathodes.
Machine learning (ML) methods have become increasingly popular across different fields of research
nowadays. Min et al 16 implemented seven different algorithms to predict the cycling properties of Ni-
rich NCM cathode from the corresponding synthesis parameters and reached an average prediction score
of R2 = 0.833. Houchins et al 17 implemented DFT-based neural network models to predict the structure
energy and forces of various forms of NCM materials (e.g. 111,532,811,622) and achieved a promising
prediction accuracy of 3.7meV/atom and 0.13 eV/ Å, respectively. Allam et al 18 constructed a deep
learning model and attained a prediction error of 3.54% for predicting the redox potential of organic
materials. From these works, data quality is frequently reported as an influential factor for model
performance. Although databases like Inorganic Crystal Structure Database (ICSD)19 and Material
project20 are widely accessible for ML training, there is still a lack of established large database in
experimentally measured material properties, in particular, the measured discharging properties of
various cathode materials in Li-ion batteries. From our previous work 21, we had successfully curated a
dataset of 102 doped spinel cathodes containing the elemental, structural information and discharge

performance. In addition, small prediction errors of 11.90mAhg-1 and 11.77mAhg-1 were achieved by
the gradient boosting machine models for the prediction of the initial and 20th cycle discharge capacity.
These promising results had further encouraged us to curate a more high-quality discharge performance
dataset for the layered NCM cathode and implement ML to reveal their complex structure-property
relationship.
In this work, 168 distinctive NCM doped systems are collected carefully with strict selection rules as
described in Figure 1. The dataset contains 3696 data entries which cover 20 variations of dopants for
all doped NCM -derivate material classes (NCM -333, NCM -523, NCM -622, NCM -811). Firstly,
Pearson’s correlation coefficient study was performed to investigate the co-linearity of every variable
pair. Furthermore, six non-linear algorithms, including gradient boosting machine, random forest, kernel
ridge regression, feedforward deep learning, k-nearest neighbors and support vector machine was
implemented with the design given in Table 1 to predict the initial discharge capacities and 50th cycle
discharge capacities of the doped NCMs based on twenty covariates (e.g. material characterization
results, experimental parameters, elemental properties). By comparing their electrochemical performance
against a held-out test set, the best models can be identified for each discharge capacity prediction task.
Furthermore, a variable importance study was performed with the best performing model to reveal the
key doping features that governed the accurate predictions of discharging performance of the doped
NCM systems. These insights would greatly enhance the current understanding of the doping effects and
facilitating the design of future experimental work (e.g. independent variable selection, the doping
concentrations).

Figure 1. An overview of the data collection process with the demonstration of every filter applied in
each publication selection stage.

Table 1. The proposed ML model architecture of this study including the name and abbreviations of
the covariate variables, response variables.
Covariate Variables
Publication Results Elemental Properties
Name Abbreviation Name Abbreviation
The ratio of lithium, nickel, cobalt,
manganese, dopant in the material
formula
Li, Ni, Co,
Mn, M -
dopant
Material molar mass Mr
Crystal lattice constants “a” and “c” LC_a, LC_c Dopant’s molar mass Mr_dopant
Crystal Volume CV Dopant’s number of
electrons No_electron_dopant
Experimental current density CD Dopant’s
electronegativity EN_dopant
Minimum and maximum cyclic
voltage
V_min,
V_max
Dopant’s number of
isotopes No_iso_dopant
Dopant’s first
ionization energy E_ionisation_dopant
Dopant’s electron
affinity EA_dopant
Dopant’s atomic
radius AR_dopant
Dopant’s ionic radius IR_dopant
Response Variables
Name Abbreviation Name Abbreviation
Initial discharge capacity IC 50th cycle end
discharge capacity EC
3. Methods
3.1 Data Collection of the doped NCM layered materials
The dataset consists of 168 different doped spinel systems with 20 dopant variations (e.g. Al, Ce, Cr,
Cu, Cs, Eu, Fe, La, Mo, Mg, Nd, Na, Nb, Ru, Rb, Sn, Ti, V, Y, Zr) and was curated from over 59 reliable
journals published from 1998 and 2020 (given as Table S3 in Supporting Information). During the
journal selection, strict rules were applied to ensure a high consistent standard of the collected data: NCM
materials should be i) single-doped with cation ions since the multi-doped systems are hard to fabricate

and more costly, ii) be single-phase iii) have a space group of R-3m; and iv) have no surface coating.
Furthermore, the electrochemical testing should also fulfil the following criteria to meet the data
collection requirements: i) performed at least 50 cycles of charging/discharging cyclic test, ii) used
lithium foil as anode and non-aqueous LiPF6 as electrolyte iii) applied constant current density for
charging and discharging the battery; iv) the cyclic tests are carried out under the atmospheric conditions
(i.e. Temperature = 25±5 ℃, Pressure = 1atm). It is also important to note that the 50th cycle discharge
capacity has been chosen as it is the most performed test cycle among all studies.
Electrolyte plays a significant role in bridging the two contrasting electrodes and in facilitating the
formation of a solid-electrolyte interface layer to protect the electrode from any unwanted side reactions.
Electrolytes are often a mixture system with solvent and additives of which could lead to different
performances if not standardised. The types of electrolyte systems from our collected studies are
summarized in Figure S3. In our dataset, nearly 71% of the investigating electrochemical test were
performed from either the mixture of ethylene carbonate/dimethyl carbonate (vol % 1:1) or the ethylene
carbonate/dimethyl carbonate/ethyl methyl carbonate (vol% 1:1:1). These systems have similar dielectric
constants (Table S2) which should result in similar electrochemical performance. Only seven of the
material systems have been tested with the addition of fluoroethylene carbonates and these are used to
improve the battery operation safety and hence should not influence the overall data quality by a
considerate amount.
3.2 Model Training
The ML models used in this work were trained using Python programming language and with its relevant
ML libraries (Sciki-learn, Pandas). Within the model, 20 covariate variables are selected to predict the
initial and 50th cycle discharge capacities of each material. These cover the experimental results such as
the crystal lattice constants (“a” and “c”), the formula ratio of lithium, nickel, manganese, cobalt, dopant
in the material formula (Li, Ni, Mn, Co, M), material molar mass, volume of the unit cell (CV) and cyclic

parameters such as the charge/discharge current density (CD) as well as the upper and lower operating
voltage limit (V_min, V_max). In addition, seven dopant elemental properties are chosen as covariate
variables to reveal their correlations with the discharging properties. These include: dopant’s molar mass;
the number of electrons; electronegativity; electron affinity; first ionization energy; atomic radius and
ionic radius. In this work, six non-linear algorithms were implemented including artificial neural network
(ANN), random forest (RF), gradient boosting machine (GBM), support vector machine (SVM), kernel
ridge regression (KRR), k-nearest neighbors (KNN). The whole data space was randomly split into the
ratio of 4:1 correspond to the model training set and test set, respectively. Model hyperparameters were
optimised using 5-fold cross-validation during model training as there are 134 sets in the training set and
the optimized hyperparameters are given in Table S1.
Model Evaluation Metrics: The model performance was evaluated through the calculation of the root
mean square error (RMSE) and the coefficient of determination (R2) from the predictions against the
training and test set. The calculation methods are given as equation (1) and (2) below:
𝑅𝑀𝑆𝐸 = √1
𝑛∑ (𝑦𝑖 − �̂�𝑖)2𝑛
𝑖=1 (1)
𝑅2 = 1 −∑ (𝑦𝑖−�̂�𝑖)2𝑛
𝑖=1
∑ (𝑦𝑖−�̅�)2𝑛𝑖=1
(2)
Where n is the number of values, 𝑦𝑖 is the observed variable, �̂�𝑖 is the predicted values and �̅� is the
average of the observed values.
The SHAP summary plots for the variable correlation and importance ranking are generated using the
SHAP python package 22 and the further instruction are available in https://github.com/slundberg/shap.
3.3 Safety Statement
This work is performed wholly on the machine learning computational indicated and hence no
unexpected or unusually high safety hazards were encountered

4. Results and Discussion
4.1 Pearson Coefficient Correlation Study
To gain initial insight into the underlying variable correlations, a Pearson’s correlation coefficient study
was performed for every pair of variables retrieved in the dataset. Figure 2 shows the matrix of
correlation values (R) calculated for the twenty covariates and the two response variables. The extent of
correlation between every pair is color-coded with darker orange indicating a strong positive correlation
and dark green strong negative correlations.
From the computed R values, it can be seen that there are more strong correlations (R > 0.75) being
observed in-between covariates variables than for the covariate variables with either of the two response
variables. However, some of these strong correlations observed between covariates might be misleading
and do not provide any intuitive insights. For instance, the high correlations of lithium content ratio with
minimum operating voltage (R = -0.77) and maximum operating voltage (R = 0.68) do not imply that
any change in lithium content would influence the value of operating voltages. These voltage values are
often preset for the experiments based on the specifications of the testing machine. In addition, a decrease
in the lithium ratio seems to increase the molar mass of the material (R = -0.93) and this is because there
are more available crystal lattice sites for the occupancies of heavier weighted TM and dopant elements.
Similarly, the manganese molar ratio appears to have a correlation value of -0.95 with the nickel molar
ratio in the formula, which is potentially due to the direct TM crystal site substitution. In addition, a high
correlation (R = 0.79) is also identified for the pair of ionic radius of the dopant ion(IR_dopant) and the
atomic radius of the dopant atom (AR_dopant). Both radii are the measurement of the distance away
from the central nucleus despite one is under the neural state and the other is for the charged state and
therefore their values might have a high linearity correlation with each other.For the model construction,
it is important to find the linkage of covariate variables to the electrochemical properties. First, no strong
correlations are being observed between covariate variable and response variables which might be due

to the presence of non-linear correlations. The maximum cyclic voltage is found to have a relatively high
correlation with both IC and EC at 0.65 and 0.62, respectively. In addition, an increase in the Li content
ratio in the formula seems to suggest a partial increase in both IC and EC as their correlation values are
calculated to be positive 0.5 and 0.49 respectively. This seems to agree with the latest results on higher
discharging performance are obtained from the lithium-rich layered cathode (~200mAhg-1) than from the
normal NCM-111 compounds (~165mAhg-1).23,24

Figure 2. Results matrix of Pearson coefficient correlations for every pair of variables in the dataset,
including covariate variables: Li, Ni, Co, Mn, M, LC_a, LC_c, CV, V_min, V_max, CD, Mr,
Mr_dopant, No_electron_M, EA_dopant, No_iso_dopant, AR_dopant, IR_dopant,
E_ionisation_dopant, EN_M and two response variables: IC, EC. The estimated correlation values
are distributed within the range of -1 to 1, with the number reaching either end value implying a more
perfect negative correlation and positive correlation, respectively.
1 −0.61
1
−0.45
−0.22
1
0.54
−0.95
0.07
1
0.01
−0.28
−0.01
0.23
1
−0.77
0.66
0.11
−0.54
−0.2
1
−0.3
0.04
0.31
−0.03
−0.12
0.56
1
−0.69
0.52
0.19
−0.42
−0.19
0.96
0.77
1
−0.01
0.15
−0.12
−0.11
−0.24
0.14
0.11
0.14
1
−0.77
0.58
0.24
−0.47
−0.23
0.69
0.23
0.61
0.24
1
0.68
−0.51
−0.28
0.47
0.02
−0.53
−0.22
−0.48
−0.15
−0.55
1
−0.01
0.14
−0.05
−0.13
−0.31
0.17
0
0.13
0.1
0.2
0.01
1
−0.93
0.72
0.4
−0.64
−0.33
0.78
0.29
0.7
0.09
0.8
−0.67
0.1
1
0
0.14
−0.05
−0.13
−0.32
0.17
0
0.13
0.11
0.2
0.01
1
0.1
1
0.01
0.1
0.15
−0.19
−0.12
0.11
0.03
0.1
0.23
0.06
−0.04
0.1
0.08
0.12
1
0
0.11
−0.01
−0.11
−0.31
0.21
0.1
0.2
0.07
0.22
0.01
0.86
0.08
0.88
0.17
1
0.01
0.11
0.11
−0.17
−0.18
0.04
−0.11
0
0.08
0.1
−0.08
−0.17
0.11
−0.15
0.63
−0.06
1
0.09
−0.06
0
0.03
−0.02
−0.01
−0.07
−0.03
0.09
0.05
0.02
0.43
−0.08
0.45
0.39
0.51
−0.21
1
0.17
−0.11
−0.12
0.14
−0.23
−0.03
0.06
−0.01
0.06
0
0.25
0.64
−0.14
0.64
−0.41
0.6
−0.51
0.21
1
0.13
−0.16
−0.15
0.2
0
−0.14
−0.04
−0.12
−0.1
−0.18
0.16
0.41
−0.2
0.39
−0.72
0.28
−0.68
−0.04
0.79
1
0.5
−0.23
−0.3
0.22
−0.18
−0.38
−0.19
−0.36
−0.25
−0.46
0.65
−0.05
−0.42
−0.05
−0.19
−0.01
−0.01
−0.22
0.18
0.24
1
0.49
−0.16
−0.33
0.15
−0.26
−0.33
−0.15
−0.31
−0.16
−0.42
0.62
0.02
−0.38
0.02
−0.18
0.04
−0.08
−0.13
0.24
0.27
0.93
1
Li
Ni
Co
Mn
M
LC_a
LC_c
CV
CD
V_min
V_max
Mr_dopant
Mr
no_electron_M
EN_M
No_iso_dopant
E_ion_dopant
EA_dopant
AR_dopant
IR_dopant
IC
EC
LiNi
Co
Mn M
LC_a
LC_c C
VCD
V_m
in
V_m
ax
Mr_
dopant
Mr
no_ele
ctro
n_M
EN_M
No_i
so_d
opant
E_i
on_dopan
t
EA_d
opant
AR_d
opant
IR_d
opant
IC EC
−1.0−0.5 0.0 0.5 1.0
PearsonCorrelation
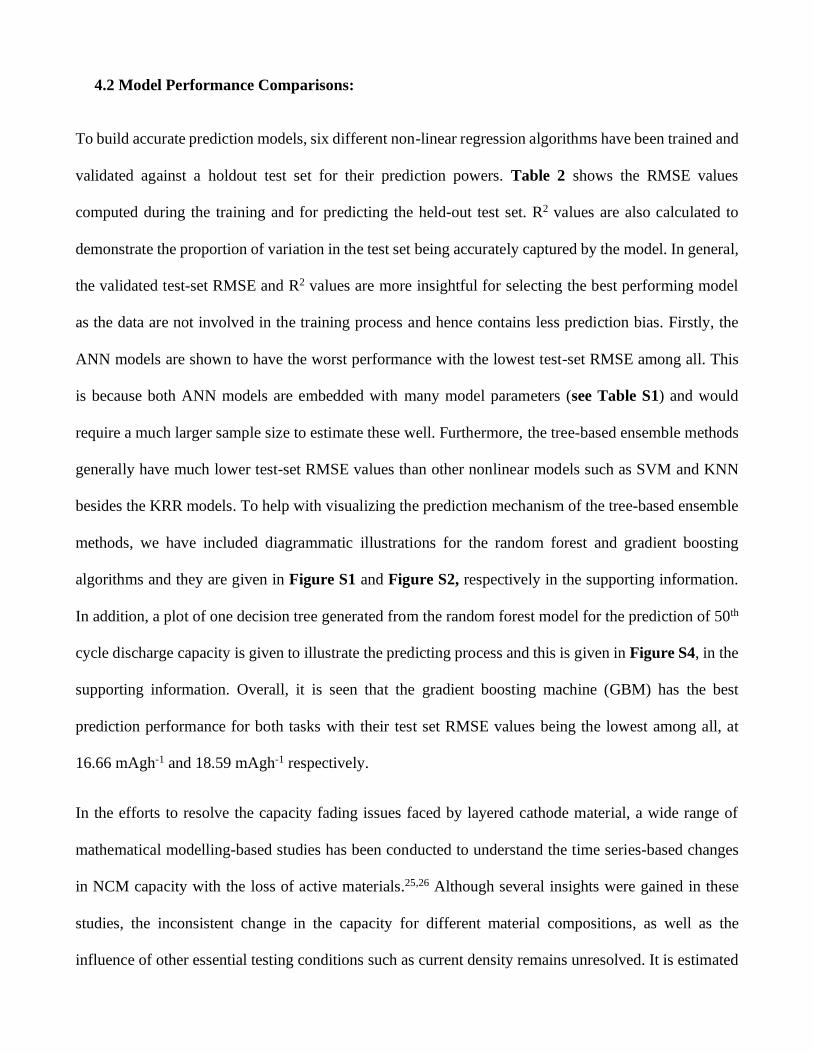
4.2 Model Performance Comparisons:
To build accurate prediction models, six different non-linear regression algorithms have been trained and
validated against a holdout test set for their prediction powers. Table 2 shows the RMSE values
computed during the training and for predicting the held-out test set. R2 values are also calculated to
demonstrate the proportion of variation in the test set being accurately captured by the model. In general,
the validated test-set RMSE and R2 values are more insightful for selecting the best performing model
as the data are not involved in the training process and hence contains less prediction bias. Firstly, the
ANN models are shown to have the worst performance with the lowest test-set RMSE among all. This
is because both ANN models are embedded with many model parameters (see Table S1) and would
require a much larger sample size to estimate these well. Furthermore, the tree-based ensemble methods
generally have much lower test-set RMSE values than other nonlinear models such as SVM and KNN
besides the KRR models. To help with visualizing the prediction mechanism of the tree-based ensemble
methods, we have included diagrammatic illustrations for the random forest and gradient boosting
algorithms and they are given in Figure S1 and Figure S2, respectively in the supporting information.
In addition, a plot of one decision tree generated from the random forest model for the prediction of 50th
cycle discharge capacity is given to illustrate the predicting process and this is given in Figure S4, in the
supporting information. Overall, it is seen that the gradient boosting machine (GBM) has the best
prediction performance for both tasks with their test set RMSE values being the lowest among all, at
16.66 mAgh-1 and 18.59 mAgh-1 respectively.
In the efforts to resolve the capacity fading issues faced by layered cathode material, a wide range of
mathematical modelling-based studies has been conducted to understand the time series-based changes
in NCM capacity with the loss of active materials.25,26 Although several insights were gained in these
studies, the inconsistent change in the capacity for different material compositions, as well as the
influence of other essential testing conditions such as current density remains unresolved. It is estimated
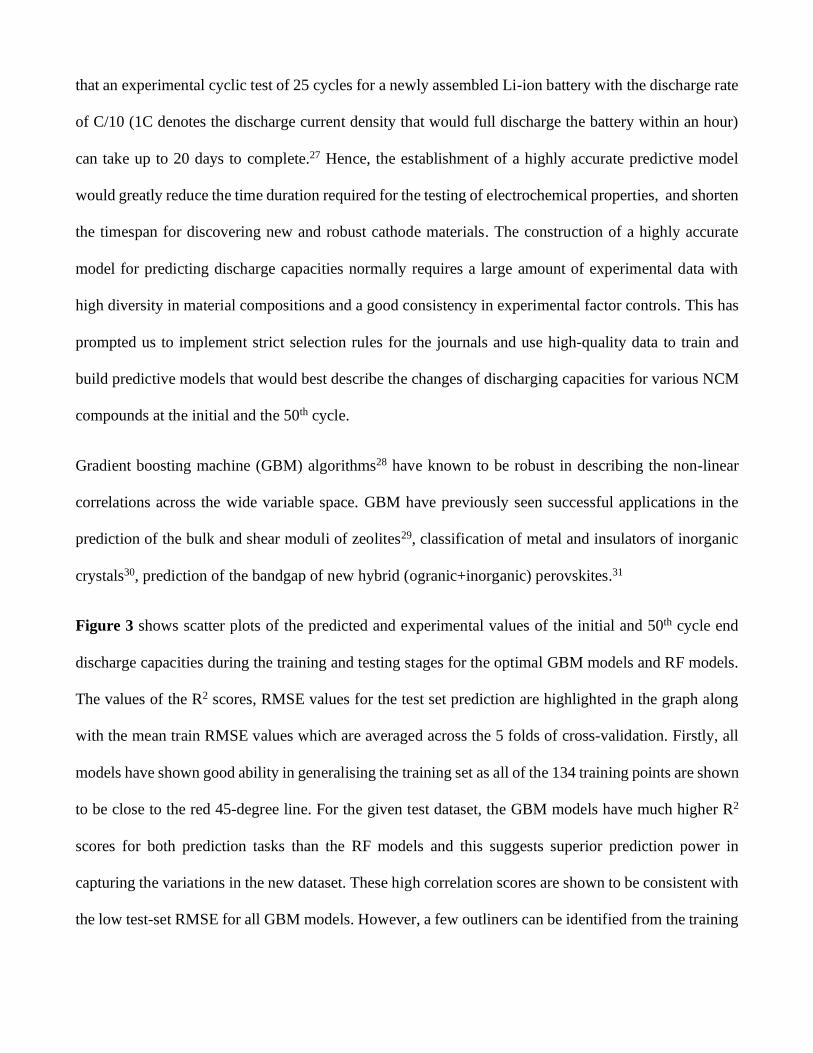
that an experimental cyclic test of 25 cycles for a newly assembled Li-ion battery with the discharge rate
of C/10 (1C denotes the discharge current density that would full discharge the battery within an hour)
can take up to 20 days to complete.27 Hence, the establishment of a highly accurate predictive model
would greatly reduce the time duration required for the testing of electrochemical properties, and shorten
the timespan for discovering new and robust cathode materials. The construction of a highly accurate
model for predicting discharge capacities normally requires a large amount of experimental data with
high diversity in material compositions and a good consistency in experimental factor controls. This has
prompted us to implement strict selection rules for the journals and use high-quality data to train and
build predictive models that would best describe the changes of discharging capacities for various NCM
compounds at the initial and the 50th cycle.
Gradient boosting machine (GBM) algorithms28 have known to be robust in describing the non-linear
correlations across the wide variable space. GBM have previously seen successful applications in the
prediction of the bulk and shear moduli of zeolites29, classification of metal and insulators of inorganic
crystals30, prediction of the bandgap of new hybrid (ogranic+inorganic) perovskites.31
Figure 3 shows scatter plots of the predicted and experimental values of the initial and 50th cycle end
discharge capacities during the training and testing stages for the optimal GBM models and RF models.
The values of the R2 scores, RMSE values for the test set prediction are highlighted in the graph along
with the mean train RMSE values which are averaged across the 5 folds of cross-validation. Firstly, all
models have shown good ability in generalising the training set as all of the 134 training points are shown
to be close to the red 45-degree line. For the given test dataset, the GBM models have much higher R2
scores for both prediction tasks than the RF models and this suggests superior prediction power in
capturing the variations in the new dataset. These high correlation scores are shown to be consistent with
the low test-set RMSE for all GBM models. However, a few outliners can be identified from the training

and test sets at circa. near 225 mAhg-1 and 250 mAhg-1, respectively from the GBM-EC graph and this
would potentially affect the R2 scores.
Nevertheless, the correlation scores from both GBM-IC (R2 = 0.76) and GBM-EC (R2 = 0.64) model
have exceeded the benchmark value of R2 >0.6 for a model to be considered as predictive.32 These high
correlation values have indicated that structural and elemental parameters such as the crystal lattice
dimension and dopant’s ionic radius can predict the discharge capacity of layered doped NCM cathode
as accurately as the synthesis parameters variables used in Min et al’s work.16 Based on the above results,
both GBM models for the IC and EC predictions are chosen for further analysis.
Table 2. Comparisons of the mean RMSE values during the 5-fold cross-validation and for testing
against holdout test and the R2 test score computed by six non-linear models, for the prediction of
initial discharge capacity and end discharge capacity.
ML techniques
Initial Discharge Capacity (mAhg-1) 50th Cycle End Discharge Capacity
(mAhg-1)
Cross-
validated
RMSE mean
RMSE on
the test
set
R2 scores
on the
Test Set
Cross-
validated
RMSE mean
RMSE on
the test
set
R2 scores
on the
Test Set
GBM 20.26 16.66 0.76 21.53 18.59 0.64
RF 21.98
17.00 0.59 21.86 19.25 0.42
SVM 22.94 21.11 0.37 22.00 19.38 0.41
KRR 20.65 17.28 0.58 21.77 19.13 0.43
KNN 23.57 18.98 0.49 25.03 21.51 0.28
ANN 34.15 22.39 0.29 33.93 24.58 0.05
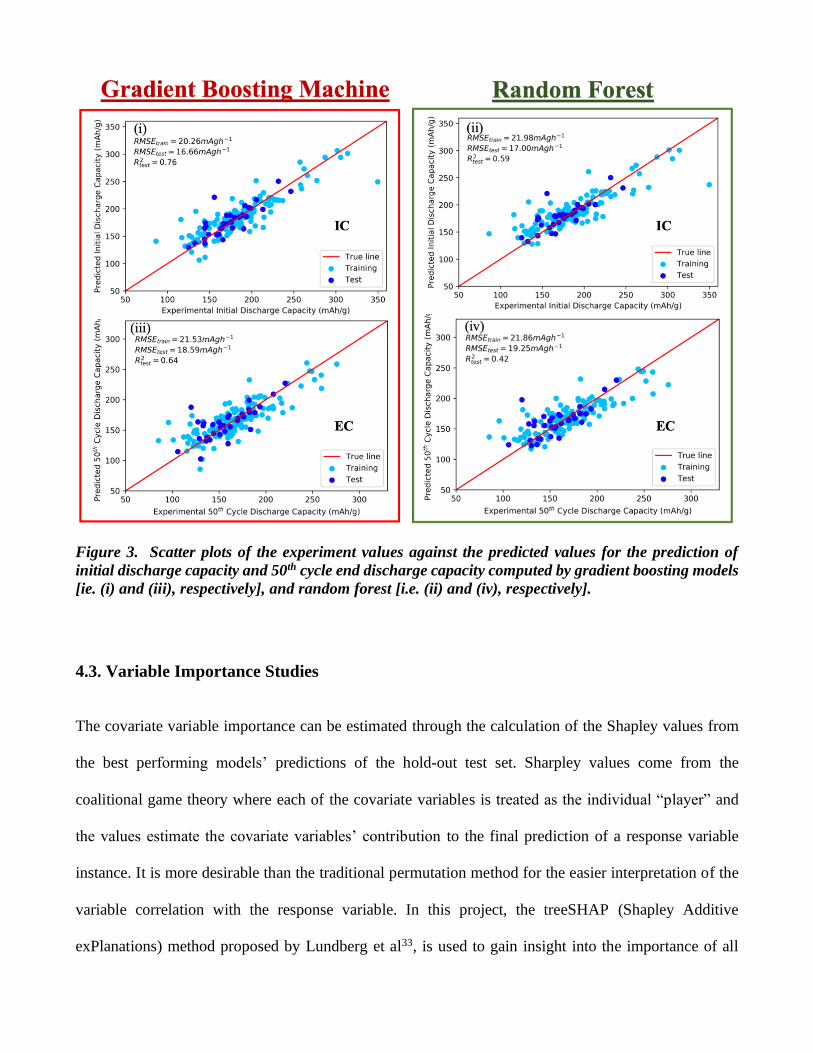
Figure 3. Scatter plots of the experiment values against the predicted values for the prediction of
initial discharge capacity and 50th cycle end discharge capacity computed by gradient boosting models
[ie. (i) and (iii), respectively], and random forest [i.e. (ii) and (iv), respectively].
4.3. Variable Importance Studies
The covariate variable importance can be estimated through the calculation of the Shapley values from
the best performing models’ predictions of the hold-out test set. Sharpley values come from the
coalitional game theory where each of the covariate variables is treated as the individual “player” and
the values estimate the covariate variables’ contribution to the final prediction of a response variable
instance. It is more desirable than the traditional permutation method for the easier interpretation of the
variable correlation with the response variable. In this project, the treeSHAP (Shapley Additive
exPlanations) method proposed by Lundberg et al33, is used to gain insight into the importance of all

covariate variables and their feature effect on the prediction. Figure 4-a and b show the summarized
Sharpley values for all 20 covariate variables during the predictions of IC and EC in the test-set through
the GBM-IC model and the GBM-EC model, respectively. The Sharpley values measure the impact of
that covariate variable on the model prediction with the more positive or negative value implying a larger
overall influence. The y-axis of each graph gives the list of covariates in the order of their contribution
to the overall prediction with the most important one being at the top and less important ones at the lower
ranks.
To begin with, the minimum cut-off voltage, maximum cut-off voltage and the current density are ranked
within the top 10 important variables. These covariate variables are all the experimental conditions for
cycling and thereby are expected to have great influences on the material’s discharging performance as
a cathode.34 After excluding these experimental setting variables, one can see that the dopant content
ratio and the lithium content ratio are being ranked as the third and the fifth most important features,
respectively for the IC test-set prediction from Figure 4-a.
A negative correlation is identified for the dopant content ratio and the IC as an increase in the
corresponding Shapley values lead to the decrease in the IC feature values (shown in the sequence of red
to blue). On the contrary, the Shapley values of lithium content ratio are shown to be positively correlated
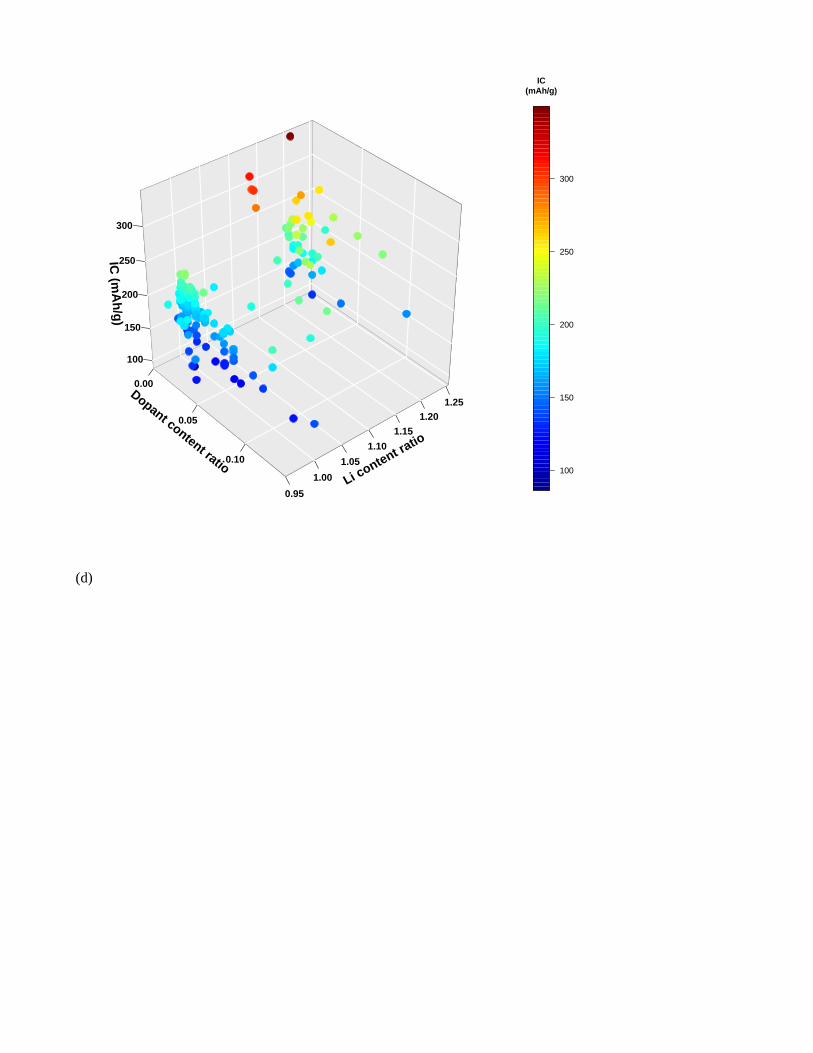
to the IC value, with the colour of the data plot shown to be blue to red. Figure 4-c shows the 3D plot of
the dopant content ratio, Li content ratio correlating to the respective IC values for the entire dataset
(train+ test). Firstly, two clusters of data can be identified with one characterized for having a lower Li
content ratio with different dopant content ratios and the other having a higher Li content ratio and lower
dopant content ratio. Observations can be made such that the IC values increase (Change from blue to
green) as the dopant content ratio reduces in the first cluster. Moreover, the latter cluster has much higher
average IC values than the first one which implies that a higher Li content is generally more desirable
for obtaining a high IC value. This concludes that a higher Li content ratio (x > 1.20) coupled with a

lower dopant content ratio (y < 0.02) can reach a higher IC. Further key insights can be also gained from
Figure 4-a on that a doped NCM cathode material formula with lower dopant’s electronegativity
(EN_M), the shorter lattice constant “a” (LC_a) and “c”(LC_c), smaller formula molar mass, less
manganese content and more cobalt content, can lead to higher IC values.
Figure 4-b shows that the dopant content ratio and its electronegativity value are ranked as the second
and the fourth important for the predictions of EC. Electronegativity measures the dopant element’s
ability to attract electron pairs toward itself. Dopant’s EN controls the bonding strength with the
surrounding TMs and oxygen atoms and influences structural stability as well as the overall crystal
structure density. During long cyclic charging and discharging performance, the overall crystal structure
often becomes unstable which then triggers significant lattice collapses and leads to severe capacity
fading.35 The involvement of dopant content can greatly improve the structure stability by forming
stronger bonds whilst the strategy with doping with a small amount can ensure that no second material
phase is formed and also the whole crystal structure is not modified significantly to disturb the Li-ion
intercalation/deintercalation mechanisms. Both the content ratio and the electronegativity of dopant are
demonstrated to be negatively correlated to the EC feature value as the colour of the trend are changing
blue to red (left to right). Figure 4-d displays the 3D intercorrelation of the two dopant-related covariate
variables with the respective EC in the whole dataset. A clear trend is observed for EC decreasing with
the decrease in the dopant content ratio (from blue to red). In addition, high EC data are observed to be
at the lower range between 1.25 and 1.5 for the dopant’s electronegativity for when the dopant content
ratio is kept low (x > 0.02) and this corresponds to the magnesium(1.31) and zirconium (1.33) dopant in
the collected dataset. From these phenomena, it is suggested that doping the atom with the
electronegativity closer to 1.5 and with less amount can lead to higher EC values. Other observations can
be made from Figure 4-b that a smaller material molar mass with lower manganese and higher nickel
content can lead to a higher EC value for using doped NCM materials as the cathode, which shares a lot

of similarities with the previous findings in the IC variable correlations. Interestingly, the dopant ratio
in the material formulas has shown to be the most influential factor as it is ranked the third and the second
for IC and EC, respectively and this is much higher than other material properties such as the dopant’s
electronegativity value and the lithium content ratio in the material formula. This suggests that the doping
amount might play a much more important role in influencing the discharge capacities than other material
systematic properties.
To conclude, our results have demonstrated that the materials that both constitute high IC and EC share
the common characteristics of high Li content ratio, small dopant ratio, small manganese ratio and being
doped with atoms of low to middle range electronegativity and low electron affinity. In addition, it is
also encouraged to design a doped NCM material with low formula molar mass as it is inversely related
to both discharge capacities.
(a)

(b)

(c)
(d)
Dopant content ratio
0.00
0.05
0.10
Li content r
atio
0.95
1.00
1.05
1.10
1.15
1.20
1.25
IC (m
Ah
/g)
100
150
200
250
300
100
150
200
250
300
IC
(mAh/g)

Figure 4. The summary plots for the feature contribution of twenty covariate variables in the test-set
prediction of (a) IC generated based on GBM-IC model and (b) EC generated based on GBM-EC
model. The y-axis indicates the feature importance of variables ranked in descending order. The x-
axis shows the scale of the Shapley values for every feature and indicates their contribution to the
prediction. The figure legends are given as heat-map showing the values of the respective response
feature variable. The 3D plots give insights into the intercorrelations of (c) IC with two most important
variables (Li content ratio, dopant content ratio) and (d) EC with the two most important variables
(Dopant content ratio and dopant’s electronegativity) in the whole dataset.
4.4 .Overall Discussions
Although some of the obtained correlations were known qualitatively, our model gives new insights by
providing a quantitative prediction of IC and EC using these features for any new cathode materials that
practitioners want to experiment on. These quantitative correlations were identified through the use of
the Shapley value method developed from the coalitional game theory, of which based on the author’s
Dopant content ratio
0.00
0.05
0.10
Dopant's electro
negativity
1.0
1.5
2.0
EC
(mA
h/g
)
50
100
150
200
250
50
100
150
200
250
EC
(mAh/g)

knowledge, our study was the first in the field to implement this theory into analysing the contribution
of the doping features for the predictions of the LIB discharge capacities.
In addition, the results of our research are novel in that it gives an estimation of the importance of each
of the material property related features for each capacity property. For instance, despite that the higher
lithium content is more favourable for achieving higher IC and EC as identified in the manuscript, its
importance as given in Figure 4-a and Figure 4-b are shown to be much less than than the dopant
content feature. This could of a suggestion for the experimentalist to consider the factor of optimal dopant
ratio first before considering the lithium content ratio in the formula in the design of experiments.
During the selection of covariate variables (input variables) for the machine learning model, two major
criteria have been used to guide this process: i) the relevance of the feature towards reflecting on the
material properties and the performance properties ii) whether such data is widely reported or collectable.
We selected the variables that can best describe the properties of synthesised materials to reflect wholly
on the differences in synthesis methods, raw materials used across different research groups. For
example, these properties include the crystal volume, crystal structure lattice constant of the materials
can reflect on the conditions of the cathode materials as the host for the Li-ions. These properties are
completely dependent on what the authors have reported in the publication and therefore we have not
introduced any bias in the selection of these. In addition, we included the elemental properties related to
the dopant atoms used in the studies from the NCM material dataset. As indicated in the initial results of
the Pearson correlation coefficient matrix, no strong linear correlations have been identified for the pair
of covariate and response variables of which indicate that the correlations between the selected covariates
variables are not possibly explained by a simple linear model. This suggests that the selection process of
the covariate variables in our project contain little bias.
Simple correlations of the structure and property for NCM material could be observed if the investigating
material system is fixed. For example, the researcher could be investigating the effects of one dopant

with a different concentration on the discharge performance of the NCM material. On the other hand,
The interpretation of a large dataset containing different doped NCM material systems is extremely hard
to be achieved through simple human intuition. The novelty of our work focus on investigating a much
wider range of doped NCM materials with 168 different compositions and 20 different dopant elements.
We introduce this machine learning method to gain much broader insights into the overall variable
correlations of different types of doped NCM materials to promote a much broader understanding of the
doping effects on the NCM materials’ electrochemical performance and the relevant governing variables
in each case.
4.5. Remaining Challenges and Future Improvements
Data quality is essential for building highly predictive ML models. In this section, the data collection
challenges for this work are highlighted and discussed along with the recommendation made for future
potential research. Firstly, the doped NCM materials involved in this project all composite materials with
the variations seen in the mixing ratio of the remaining two components, namely, conductive additive
and binder. The lack of standardization in which conductive additive and binder to be used has led to a
large variation in material usage across different research teams. The roles of these materials are to
stabilize the overall cathode structure and to promote the Li-ion mobility within the structure which are
considered essential for long cycle discharging. Furthermore, considering that the active material is the
major component (75% ~ 90%) of this composite, the information of conductive additives and binder are
assumed to be standardized for all collected data and further research could be done in investigating their
effects. Secondly, the effects of materials’ microstructural properties (etc. particle sizes) and the
morphological features on the material discharging properties have been extensively studied.36–40 Such
information, however, is very difficult to collect owing to the reporting in various particle reporting scales
(e.g. D10, D50, D90) as well as the general lack of conducting cathode surface study. For the
electrochemical test, information such as the surface area of the cathode material and volume of the

electrolyte is often misreported and since the elemental composition might be unevenly distributed in the
whole of the cathode composite system, this could lead to unreasonable fluctuations in the capacity
loading.
Despite a great amount of efforts being devoted to establishing strict journal filters and selecting suitable
journals (Figure 1) in this work, there are still rooms for improvement to be made as discussed above.
To fully unleash the power of ML for the application of predicting the futuristic discharge performances
of NCM cathode, the following points are worthy of considerations for future experimental and
modelling research in NCM cathode:
1. Fully report the cathode material information such as the surface compositions, primary and
secondary particle size, pore size.
2. For the full cell electrochemical test, report key information such as the surface area of cathode
and anode materials.
3. Conduct comparative studies on the changes in microstructure and crystal structures for the
cathode material after long cycle discharging.
4. For a small dataset (less than 500 rows), implement tree-based algorithms such as random forest
and gradient boosting first before constructing an artificial neural network as it is shown to be
time-consuming and less efficient in predicting capacities.
5. Conclusions
Analyzing the past experimental results is a crucial step to better understand the complex correlations of
the NCM system properties and their discharging performance and additionally, the outcome of this
project demonstrated the feasibility of using machine learning techniques in doing so. Six various non-
linear machine learning algorithms have been trained and validated with the manually curated 2197
experimental results of 168 doped NCM materials. The models are built on using thirteen material

physical properties and seven dopant’s elemental properties as covariate variables to predict the initial
(IC) and 50th cycle (EC) discharge capacities of each material structure. First, the Pearson coefficient
correlation study has indicated that no strong linear correlations are captured for any pairs of covariate
variables and two response variables. In addition, gradient boosting models are proven to hold the best
prediction power against the holdout test set for having the lowest root-mean-square error at 16.66 mAhg-
1, 18.59 mAhg-1 and highest R2 scores at 0.76, 0.64 during IC and EC prediction respectively. Further
insights are gained into the governing material features for each discharging property. NCM materials
with higher lithium content, smaller dopant content and doped with the lower electronegativity value
atom seem to bring higher values in both IC and EC. From these promising results, we expect that these
machine learning models can be used as a guide tool to estimate the discharging properties of any single
doped NCM material and potentially discover new cathode materials with more advanced
electrochemical properties.
Keywords
Machine-learning, Lithium-ion Batteries, Doped Cathodes, lithium Nickel-Cobalt-Manganese (NCM)
oxides
Supporting Information
Supporting Information is available from the Wiley Online Library or from the author. The dataset used
for constructing these machine learning algorithms is available on the GitHub page
(https://github.com/thepowerligand/NCM-ML/blob/main/NMC_numerical_new.csv) and the references for
these selected journals are given as Table-S4 in supporting information. The codes used for creating the
machine learning models in this manuscript are given in https://github.com/thepowerligand/NCM-ML.
Conflict of Interest
The authors declare no conflict of interest.
Acknowledgements
All authors contributed equally to this work. This research received no grants from any funding
agencies.
References:
1. Manthiram, A. A reflection on lithium-ion battery cathode chemistry. Nature Communications
11, 1–9 (2020).
2. Xu, J., Lin, F., Doeff, M. M. & Tong, W. A review of Ni-based layered oxides for rechargeable
Li-ion batteries. J. Mater. Chem. A 5, 874–901 (2017).
3. Schipper, F. et al. Review—Recent Advances and Remaining Challenges for Lithium Ion
Battery Cathodes. J. Electrochem. Soc. 164, A6220–A6228 (2017).
4. Chakraborty, A. et al. Layered Cathode Materials for Lithium-Ion Batteries: Review of
Computational Studies on LiNi1- x- yCoxMnyO2 and LiNi1- x- yCoxAlyO2. Chem. Mater. 32,
915–952 (2020).
5. Lee, K. K., Yoon, W. S., Kim, K. B., Lee, K. Y. & Hong, S. T. Characterization of
LiNi0.85Co0.10M0.05O2 (M = Al, Fe) as a cathode material for lithium secondary batteries. in
Journal of Power Sources 97–98, 308–312 (2001).
6. Sa, Q., Heelan, J. A., Lu, Y., Apelian, D. & Wang, Y. Copper Impurity Effects on
LiNi1/3Mn1/3Co1/3O2 Cathode Material. ACS Appl. Mater. Interfaces 7, 20585–20590 (2015).
7. Nisar, U. et al. Synthesis and electrochemical characterization of Cr-doped lithium-rich

Li1.2Ni0.16Mn0.56Co0.08-xCrxO2 cathodes. Emergent Mater. 1, 155–164 (2018).
8. Sun, Y., Xia, Y. & Noguchi, H. The improved physical and electrochemical performance of
LiNi0.35Co0.3-xCrxMn0.35 O2 cathode materials by the Cr doping for lithium ion batteries. J.
Power Sources 159, 1377–1382 (2006).
9. Jin, Y., Xu, Y., Ren, F. & Ren, P. Mg-doped Li 1.133 Ni 0.2 Co 0.2 Mn 0.467 O 2 in Li site as
high-performance cathode material for Li-ion batteries. Solid State Ionics 336, 87–94 (2019).
10. Breuer, O. et al. Understanding the Role of Minor Molybdenum Doping in LiNi 0.5 Co 0.2 Mn 0.3
O 2 Electrodes: from Structural and Surface Analyses and Theoretical Modeling to Practical
Electrochemical Cells. ACS Appl. Mater. Interfaces 10, 29608–29621 (2018).
11. Yang, Z. et al. K-doped layered LiNi0.5Co0.2Mn0.3O2 cathode material: Towards the superior
rate capability and cycling performance. J. Alloys Compd. 699, 358–365 (2017).
12. Zhang, X., Xiong, Y., Dong, M. & Hou, Z. Pb-Doped Lithium-Rich Cathode Material for High
Energy Density Lithium-Ion Full Batteries. J. Electrochem. Soc. 166, A2960–A2965 (2019).
13. Markus, I. M., Lin, F., Kam, K. C., Asta, M. & Doeff, M. M. Computational and experimental
investigation of Ti substitution in Li1(NixMnxCo1-2x-yTiy)O2 for lithium ion batteries. J. Phys.
Chem. Lett. 5, 3649–3655 (2014).
14. Na, S. H., Kim, H. S. & Moon, S. I. The effect of Si doping on the electrochemical
characteristics of LiNi xMnyCO(1-x-y)O2. Solid State Ionics 176, 313–317 (2005).
15. Qiao, Q. Q., Qin, L., Li, G. R., Wang, Y. L. & Gao, X. P. Sn-stabilized Li-rich layered
Li(Li0.17Ni0.25Mn0.58)O2 oxide as a cathode for advanced lithium-ion batteries. J. Mater.
Chem. A 3, 17627–17634 (2015).

16. Min, K., Choi, B., Park, K. & Cho, E. Machine learning assisted optimization of electrochemical
properties for Ni-rich cathode materials. Sci. Rep. 8, 1–7 (2018).
17. Houchins, G. & Viswanathan, V. An accurate machine-learning calculator for optimization of
Li-ion battery cathodes. J. Chem. Phys. 153, 054124 (2020).
18. Allam, O., Cho, B. W., Kim, K. C. & Jang, S. S. Application of DFT-based machine learning for
developing molecular electrode materials in Li-ion batteries. RSC Adv. 8, 39414–39420 (2018).
19. Zagorac, D., Muller, H., Ruehl, S., Zagorac, J. & Rehme, S. Recent developments in the
Inorganic Crystal Structure Database: Theoretical crystal structure data and related features. J.
Appl. Crystallogr. 52, 918–925 (2019).
20. Jain, A. et al. Commentary: The materials project: A materials genome approach to accelerating
materials innovation. APL Materials 1, (2013).
21. Wang, G., Fearn, T., Wang, T. & Choy, K.-L. Insight Gained from Using Machine Learning
Techniques to Predict the Discharge Capacities of Doped Spinel Cathode Materials for Lithium‐
Ion Batteries Applications. Energy Technol. 2100053 (2021). doi:10.1002/ente.202100053
22. Lundberg, S. & Lee, S.-I. A Unified Approach to Interpreting Model Predictions. Adv. Neural
Inf. Process. Syst. 2017-December, 4766–4775 (2017).
23. Toney, M. F. Li gradients for Li-rich cathodes. Nature Energy 4, 1014–1015 (2019).
24. Xu, L. et al. A Li-rich layered-spinel cathode material for high capacity and high rate lithium-ion
batteries fabricated via a gas-solid reaction. Sci. China Mater. 63, 2435–2442 (2020).
25. Carnovale, A. & Li, X. A modeling and experimental study of capacity fade for lithium-ion
batteries. Energy AI 2, 100032 (2020).

26. Plattard, T., Barnel, N., Assaud, L., Franger, S. & Duffault, J.-M. Combining a Fatigue Model
and an Incremental Capacity Analysis on a Commercial NMC/Graphite Cell under Constant
Current Cycling with and without Calendar Aging. Batteries 5, 36 (2019).
27. Kauwe, S., Rhone, T. & Sparks, T. Data-Driven Studies of Li-Ion-Battery Materials. Crystals 9,
54 (2019).
28. Friedman, J. H. Greedy function approximation: A gradient boosting machine. Ann. Stat. 29,
1189–1232 (2001).
29. Evans, J. D. & Coudert, F. X. Predicting the Mechanical Properties of Zeolite Frameworks by
Machine Learning. Chem. Mater. 29, 7833–7839 (2017).
30. Isayev, O. et al. Universal fragment descriptors for predicting properties of inorganic crystals.
Nature Communications 8, (2017).
31. Lu, S. et al. Accelerated discovery of stable lead-free hybrid organic-inorganic perovskites via
machine learning. Nat. Commun. 9, 1–8 (2018).
32. Tropsha, A., Gramatica, P. & Gombar, V. K. The importance of being earnest: Validation is the
absolute essential for successful application and interpretation of QSPR models. in QSAR and
Combinatorial Science 22, 69–77 (Wiley-VCH Verlag, 2003).
33. Lundberg, S. M., Erion, G. G. & Lee, S.-I. Consistent Individualized Feature Attribution for
Tree Ensembles. arXiv (2018).
34. Wu, Y., Keil, P., Schuster, S. F. & Jossen, A. Impact of Temperature and Discharge Rate on the
Aging of a LiCoO 2 /LiNi 0.8 Co 0.15 Al 0.05 O 2 Lithium-Ion Pouch Cell . J. Electrochem.
Soc. 164, A1438–A1445 (2017).

35. Li, W., Asl, H. Y., Xie, Q. & Manthiram, A. Collapse of LiNi1- x- yCoxMnyO2 Lattice at Deep
Charge Irrespective of Nickel Content in Lithium-Ion Batteries. J. Am. Chem. Soc. 141, 5097–
5101 (2019).
36. Tang, T. & Zhang, H. L. Synthesis and electrochemical performance of lithium-rich cathode
material Li[Li0.2Ni0.15Mn0.55Co0.1-xAlx]O2. Electrochim. Acta 191, 263–269 (2016).
37. Gao, S., Zhan, X. & Cheng, Y.-T. Structural, electrochemical and Li-ion transport properties of
Zr-modified LiNi0.8Co0.1Mn0.1O2 positive electrode materials for Li-ion batteries. J. Power
Sources 410–411, 45–52 (2019).
38. Xue, L. et al. Effect of Mo doping on the structure and electrochemical performances of
LiNi0.6Co0.2Mn0.2O2 cathode material at high cut-off voltage. J. Alloys Compd. 748, 561–568
(2018).
39. Lim, S. N. et al. Rate capability for Na-doped Li1.167Ni0.18Mn0.548Co0.105O2 cathode
material and characterization of Li-ion diffusion using galvanostatic intermittent titration
technique. J. Alloys Compd. 623, 55–61 (2015).
40. Kim, U. H., Myung, S. T., Yoon, C. S. & Sun, Y. K. Extending the Battery Life Using an Al-
Doped Li[Ni0.76Co0.09Mn0.15]O2 Cathode with Concentration Gradients for Lithium Ion
Batteries. ACS Energy Lett. 2, 1848–1854 (2017).

Table of Content (TOC) Figure:
Synopsis:
Six machine learning methods are used to predict the initial and the 50th cycle discharge capacities (EC)
for 168 doped lithium-nickel-manganese-cobalt-oxide systems based on the material structural and
element properties. Among all models, gradient boosting machine has demonstrated the best prediction
power in both tasks and the additional contributions of each input material variables for the capacity
prediction are estimated.