
M5.0 Cushing, Oklahoma, USA Earthquake on November …€¦ · Cushing earthquake with Atkinson’s...
25
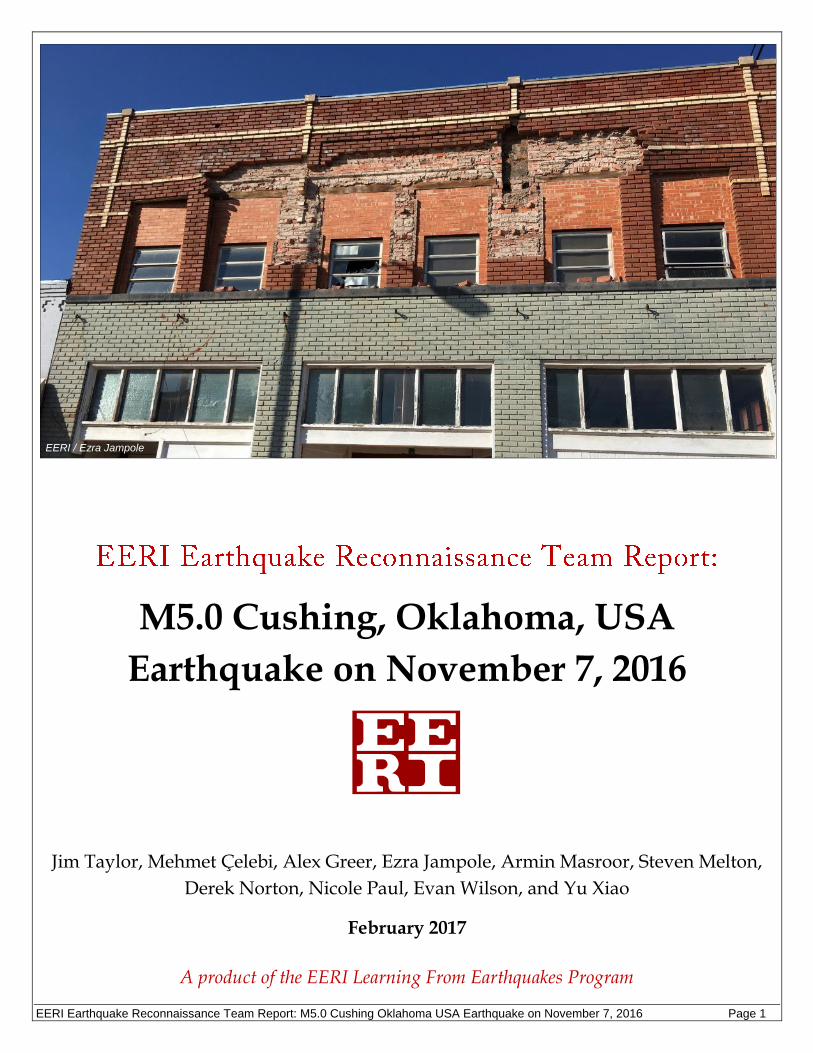
EERI Earthquake Reconnaissance Team Report: M5.0 Cushing Oklahoma USA Earthquake on November 7, 2016 Page 1 M5.0 Cushing, Oklahoma, USA Earthquake on November 7, 2016 Jim Taylor, Mehmet Çelebi, Alex Greer, Ezra Jampole, Armin Masroor, Steven Melton, Derek Norton, Nicole Paul, Evan Wilson, and Yu Xiao February 2017 A product of the EERI Learning From Earthquakes Program EERI / Ezra Jampole
Transcript of M5.0 Cushing, Oklahoma, USA Earthquake on November …€¦ · Cushing earthquake with Atkinson’s...
EERI Earthquake Reconnaissance Team Report: M5.0 Cushing Oklahoma USA Earthquake on November 7, 2016 Page 1
M5.0 Cushing, Oklahoma, USA
Earthquake on November 7, 2016
Jim Taylor, Mehmet Çelebi, Alex Greer, Ezra Jampole, Armin Masroor, Steven Melton,
Derek Norton, Nicole Paul, Evan Wilson, and Yu Xiao
February 2017
A product of the EERI Learning From Earthquakes Program
EERI / Ezra Jampole

EERI Earthquake Reconnaissance Team Report: M5.0 Cushing Oklahoma USA Earthquake on November 7, 2016 Page 2
1 RECONNAISSANCE TEAM OVERVIEW
The Earthquake Engineering Research Institute (EERI) sent a multidisciplinary reconnaissance team to study impacts of
the M5.0 earthquake near Cushing, Oklahoma on November 7, 2016. The team conducted field reconnaissance for three
days from Monday November 14, 2016 to Wednesday November 16, 2016. This report summarizes the reconnaissance
team’s observations during their reconnaissance trip. It is part of a growing collection of information that the EERI staff,
reconnaissance team, and community have stored on a detailed virtual clearinghouse website (EERI, 2016a, 2016b, and
2016c). The clearinghouse combines observations from both the M5.8 earthquake near Pawnee, Oklahoma on September
3, 2016 and M5.0 Cushing earthquake. It contains a captioned, geo-located photo gallery and data map shown in Figure
1.
Figure 1. The online Oklahoma Earthquakes Field Observations map contains over 1,400 observational data points overlaid on the USGS ShakeMap and several other data layers (source: EERI, 2016c, USGS, 2016a & 2016b).
The EERI reconnaissance team members included:
Jim Taylor, EERI Team Leader, Technical Manager at ABS Consulting
Mehmet Çelebi, Sr. Research Civil Engineer at United States Geological Survey
Alex Greer, Assistant Professor in the Dept. of Political Science at Oklahoma State University
Ezra Jampole, Associate at Exponent
Armin Masroor, Senior Analyst at Arup
Steven Melton, Graduate Research Assistant at Oklahoma State University
Derek Norton, Graduate Research Assistant at Oklahoma State University
Nicole Paul Structural Analyst / Risk Consultant at Arup
Evan Wilson, Engineer II at ABS Consulting
Yu Xiao, Associate Professor in the Dept. of Landscape Architecture & Urban Planning at Texas A&M University

EERI Earthquake Reconnaissance Team Report: M5.0 Cushing Oklahoma USA Earthquake on November 7, 2016 Page 3
The team’s technical objectives for this reconnaissance effort included:
1. Document ephemeral damage to the built environment as well as relevant examples of pre-event mitigation
success.
2. Observe business resilience by implementing a business survey that was initially developed for and deployed
following the South Napa earthquake.
3. Identify any school damage and explore earthquake response strategies, risk understanding, and mitigation
plans for schools.
4. Document how induced seismicity in the region has led to changes in mitigation, response, and recovery
approaches.
In addition to the technical objectives listed above, the team was designed to provide training and mentorship opportunities
for several EERI young members – while partnering with local colleagues to understand the unique regional perspective.
2 SEISMICITY AND GEOTECHNICAL EFFECTS
2.1 Seismicity
The Mw5.0 Cushing, Oklahoma Earthquake of 07 Nov 2016 (01:44:25 UTC) was located at a depth of 5 km. with
epicentral coordinates 35.984N, 96.798W–approximately 2 km. west of Cushing (population ~8000), the major hub of the
U.S. oil and gas pipeline transportation system (National Pipeline Mapping System, 2016; McNamara, 2015; and USGS,
2016c). The earthquake is the largest of six M>4 induced earthquakes in the region that began with the 7 October 2014
Mw4.3 and Mw4.0 events that occurred south of Cushing below the largest crude oil storage facility in the world
(McNamara et al., 2015). It also is the third ≥M5 earthquake in 2016.
A comprehensive fault map of Oklahoma is available from the Oklahoma Geological Survey, and is not repeated herein
(Marsh and Holland, 2016). Almost all of the faults in Oklahoma were inactive until recently. Beginning in 2009, deep
injection of wastewater dramatically increased, which led to a subsequent increase in seismicity. Increased seismicity in
Oklahoma and other Central US regions is depicted in Figure 2 (pers. comm. Justin Rubinstein, 2016). Between 1973-
2008, 855 earthquakes with M≥3 occurred, increasing to 2845 earthquakes between 2009 and November 2016.
Figure 2. Annual Central US earthquakes >M3.0 since 1973 to current date, showing a significant increase in earthquakes beginning in 2009. The location of Cushing is shown (source: Justin Rubinstein, USGS, Menlo Park, CA).

EERI Earthquake Reconnaissance Team Report: M5.0 Cushing Oklahoma USA Earthquake on November 7, 2016 Page 4
Figure 3 shows a modified Google Earth map showing the epicenter of the Cushing earthquake and locations of five
strong motion stations that recorded the earthquake, four of which are at distances less than 10 km. from the epicenter.
Since the earthquake USGS installed station NP 2478 within Cushing. The ground motion data recorded at these sites will
be useful for developing ground motion prediction equations (GMPEs) suitable for fluid-injection induced earthquakes in
the central United States.
Figure 3. Modified Google Earth map, showing the relative locations of the epicenter, the town of Cushing, and the five near-source strong motion stations during the earthquake. A new station, USGS NP2478 (35.98491N, 96.77471W) was installed by USGS on December 16, 2016 (source: M. Çelebi, USGS, 2016e).
The coordinates of these five stations closest to the epicenter are summarized in Table 1 (Center for Engineering Strong
Motion Data 2016). In addition, at 63 km. epicentral distance a structural array at the VA Hospital (USGS Station 7413
[35.483N, 97.496W]) in Oklahoma City recorded a peak ground motion acceleration of 0.006 g and the largest structural
response acceleration was 0.023 g.
Table 1. Coordinates, epicentral distances and largest peak accelerations recorded by the 5 stations closest to the epicenter at 35.984N. 96.798W (source: USGS 2016e).
USGS Station ID
N. Latitude, W Longitude
Epicentral Distance (km.)
Largest Horizontal Peak acc. (g.)
OK914 35.971, 96.805 1.6 0.577 OK915 35.954, 96.773 4.1 0.461 OK031 35.953, 96.839 5.1 0.350 Ok034 36.010, 96.713 8.2 0.440 OK033 36.044, 96.938 14.3 0.049
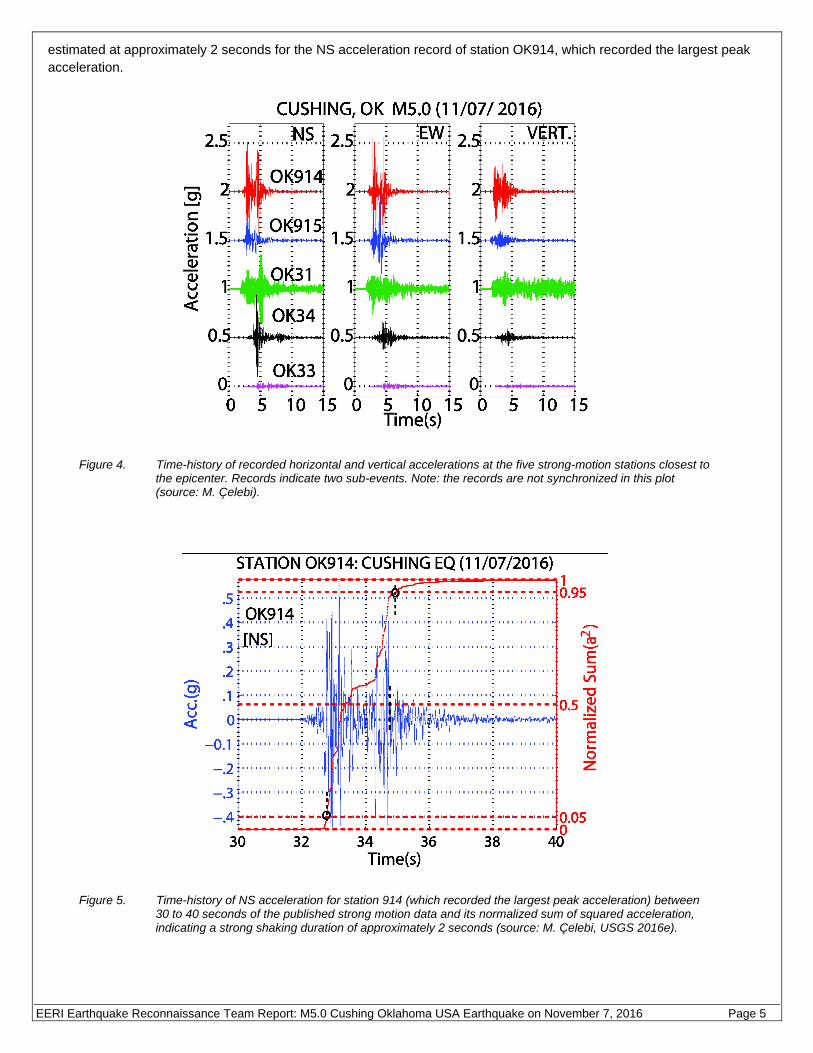
Time-histories of recorded horizontal and vertical accelerations at the five stations in Table 1 are plotted in Figure 4. In
three of the five records, two sub-events separated by about 2 seconds are observed. The acceleration records also
indicate the short duration of strong shaking. A widely accepted indicator of strong-shaking duration is used herein,
whereby the duration is estimated as the time interval between the 5% and 95% levels of the cumulative sum of squared
acceleration, as shown in Figure 5 (Trifunac and Brady 1975). According to this criterion, the strong-shaking duration is
EERI Earthquake Reconnaissance Team Report: M5.0 Cushing Oklahoma USA Earthquake on November 7, 2016 Page 5
estimated at approximately 2 seconds for the NS acceleration record of station OK914, which recorded the largest peak
acceleration.
Figure 4. Time-history of recorded horizontal and vertical accelerations at the five strong-motion stations closest to the epicenter. Records indicate two sub-events. Note: the records are not synchronized in this plot (source: M. Çelebi).
Figure 5. Time-history of NS acceleration for station 914 (which recorded the largest peak acceleration) between 30 to 40 seconds of the published strong motion data and its normalized sum of squared acceleration, indicating a strong shaking duration of approximately 2 seconds (source: M. Çelebi, USGS 2016e).
EERI Earthquake Reconnaissance Team Report: M5.0 Cushing Oklahoma USA Earthquake on November 7, 2016 Page 6
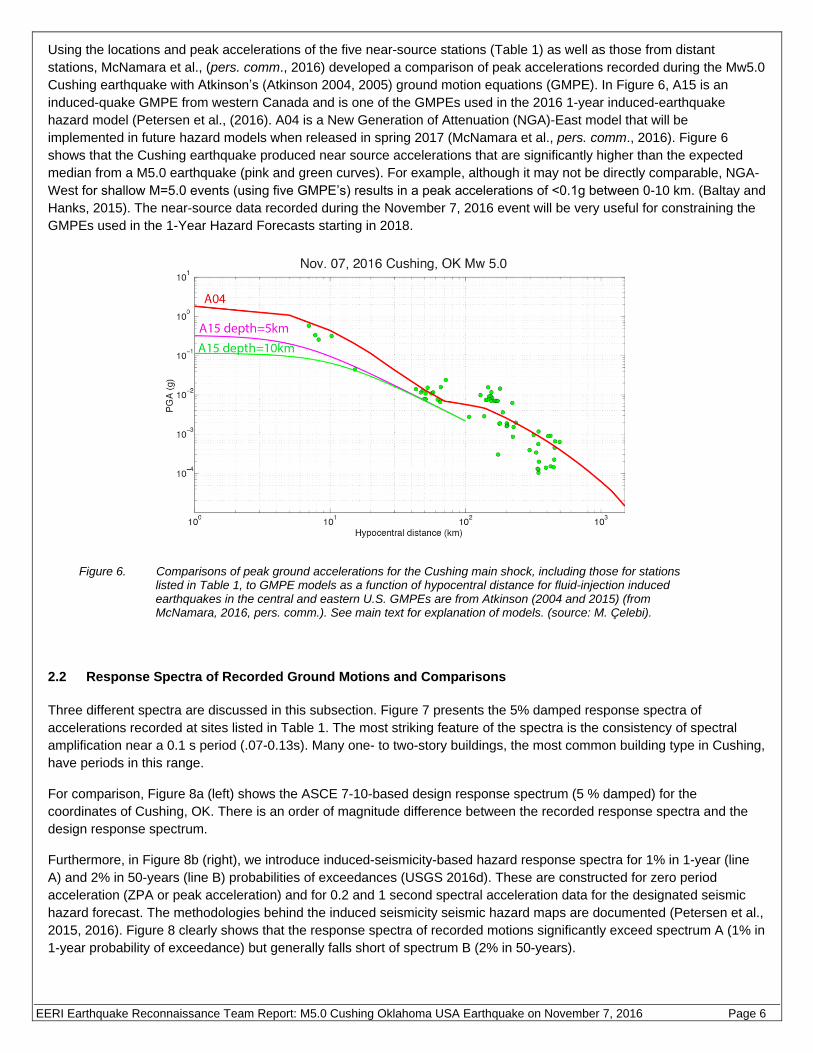
Using the locations and peak accelerations of the five near-source stations (Table 1) as well as those from distant
stations, McNamara et al., (pers. comm., 2016) developed a comparison of peak accelerations recorded during the Mw5.0
Cushing earthquake with Atkinson’s (Atkinson 2004, 2005) ground motion equations (GMPE). In Figure 6, A15 is an
induced-quake GMPE from western Canada and is one of the GMPEs used in the 2016 1-year induced-earthquake
hazard model (Petersen et al., (2016). A04 is a New Generation of Attenuation (NGA)-East model that will be
implemented in future hazard models when released in spring 2017 (McNamara et al., pers. comm., 2016). Figure 6
shows that the Cushing earthquake produced near source accelerations that are significantly higher than the expected
median from a M5.0 earthquake (pink and green curves). For example, although it may not be directly comparable, NGA-
West for shallow M=5.0 events (using five GMPE’s) results in a peak accelerations of <0.1g between 0-10 km. (Baltay and
Hanks, 2015). The near-source data recorded during the November 7, 2016 event will be very useful for constraining the
GMPEs used in the 1-Year Hazard Forecasts starting in 2018.
Figure 6. Comparisons of peak ground accelerations for the Cushing main shock, including those for stations listed in Table 1, to GMPE models as a function of hypocentral distance for fluid-injection induced earthquakes in the central and eastern U.S. GMPEs are from Atkinson (2004 and 2015) (from McNamara, 2016, pers. comm.). See main text for explanation of models. (source: M. Çelebi).
2.2 Response Spectra of Recorded Ground Motions and Comparisons
Three different spectra are discussed in this subsection. Figure 7 presents the 5% damped response spectra of
accelerations recorded at sites listed in Table 1. The most striking feature of the spectra is the consistency of spectral
amplification near a 0.1 s period (.07-0.13s). Many one- to two-story buildings, the most common building type in Cushing,
have periods in this range.
For comparison, Figure 8a (left) shows the ASCE 7-10-based design response spectrum (5 % damped) for the
coordinates of Cushing, OK. There is an order of magnitude difference between the recorded response spectra and the
design response spectrum.
Furthermore, in Figure 8b (right), we introduce induced-seismicity-based hazard response spectra for 1% in 1-year (line
A) and 2% in 50-years (line B) probabilities of exceedances (USGS 2016d). These are constructed for zero period
acceleration (ZPA or peak acceleration) and for 0.2 and 1 second spectral acceleration data for the designated seismic
hazard forecast. The methodologies behind the induced seismicity seismic hazard maps are documented (Petersen et al.,
2015, 2016). Figure 8 clearly shows that the response spectra of recorded motions significantly exceed spectrum A (1% in
1-year probability of exceedance) but generally falls short of spectrum B (2% in 50-years).

EERI Earthquake Reconnaissance Team Report: M5.0 Cushing Oklahoma USA Earthquake on November 7, 2016 Page 7
Figure 7. Response spectra of recorded accelerations of 5 closest stations to the epicenter (and/or town of Cushing). The striking peaks around 0.1 s is consistent for all stations. Spectral peaks around 0.1 s indicate an amplification of about 3 when compared to zero-period accelerations (source: M. Çelebi, USGS, 2016e).
(a)
(b)
Figure 8. (a) Design response spectra (5 % damped) for coordinates of Cushing, OK, according to ASCE 7-10, and (b) induced-seismic-hazard-based response spectra (A and B) for 1% in 1-year and 2% in 50-years probability of exceedances, respectively (source: M. Çelebi, USGS 2016d).
2.3 Geotechnical Setting and Effects
The top layer of unconsolidated deposits within Cushing and immediate vicinity is very shallow (e.g. between 2-7m in
depth) (pers. comm. S. Spears, 2016). Two borehole logs obtained during the reconnaissance mission do not provide
detailed depth-Vs profiles but consistently show a shallow top soil or clay layer followed by numerous layers of shale,
sandstone, limestone, and sandy layers of various rock types. Without well-documented soil profiles, the geotechnical
setting of Cushing and vicinity can be only approximately represented by a typical description, such as in Figure 9. The

EERI Earthquake Reconnaissance Team Report: M5.0 Cushing Oklahoma USA Earthquake on November 7, 2016 Page 8
estimate of site effects is mainly dependent on the Vs and depth of the softer top soil layer, which is almost always on top
of much stiffer shale, sandstone, or limestone. Thus, we can estimate a range of site periods (Ts) by using ranges of
depth (e.g. 2-7m) and Vs (e.g. 200-300m/s) of the top layer. For 200m/s, this would yield Ts ≈ 0.04-.14s and for 300m/s,
Ts≈0.027-0.093s. In essence, Ts is estimated to be between 0.03-0.14s depending on the assumed values. The average
value of the period (~.09s) is within the realm of a single story building.
Figure 9. A typical borehole description for Cushing, OK (source: M. Çelebi).
3 LIFELINES AND TRANSPORTATION
3.1 Lifelines
Water main breaks were reported at three locations near Cushing. The largest of these breaks included the fracture of a
4-inch diameter ductile iron pipe north of Cushing, at the intersection of North Oklahoma State Route 18 (North Little
Avenue) and East Carson St. (Figure 10a). The Cushing Emergency Manager reported that Highway 18 was shut down
from approximately noon on Monday, November 7, 2016 to 1:30 AM on Tuesday, November 8, 2016 for repairs.
Approximately 35 to 50 ft. of existing ductile iron pipe was removed and replaced with PVC pipe under the roadway. The
ductile iron pipe section removed from service was present near the roadway at the time of reconnaissance. There was
significant mineral deposit and/or corrosion product build-up inside the iron pipe (Figure 10b), as well as several holes.

EERI Earthquake Reconnaissance Team Report: M5.0 Cushing Oklahoma USA Earthquake on November 7, 2016 Page 9
(a)
(b)
Figure 10. (a) Location of removal and replacement of existing ductile iron water line; and (b) cross section of removed pipe showing build-up of corrosion and sediment inside pipe (photos: E. Wilson).
3.2 Roads and Bridges
Following the earthquake, emergency responders and emergency management officials restricted access to
approximately 15 blocks located in the downtown area due to debris on the sidewalks, the potential for more debris falling
from roofs and brick/stone facades, and a concern regarding potential gas leaks. At the time of reconnaissance (one week
after the event), sections of downtown Cushing streets and sidewalks remained closed.
According to the Oklahoma Department of Transportation (ODOT), guidelines for road and bridge inspections following an
earthquake of a magnitude 4.8 - 5.3 dictate a 15-mile inspection radius from the epicenter. ODOT officials reported no
damage to critical road or bridge infrastructure following their inspections.
4 BUILDINGS
4.1 Unreinforced Masonry Buildings
Most of the buildings damaged by the earthquake are located in the Central Business District (CBD), which contains
buildings primarily constructed between approximately 1910 and 1940. Common construction practices in the local area
and across the United States during this period included the construction of unreinforced masonry (URM) buildings with
timber floors and framing members. The lateral systems of these types of structures generally consist of a flexible wood
diaphragm, timber collector elements (if present), and URM shear walls. At the time of construction, these structures
were not designed to resist lateral wind or seismic forces; therefore, the load path in these buildings is typically deficient or
nonexistent.
The November 6, 2016 Mw 5.0 earthquake generally resulted in Modified Mercalli Intensities of VI (Strong) in the CBD. At
the recorded shaking levels, typical damage to URM structures in the CBD area included cracking of mortar joints and
brick units near window and door openings (Figure 11a), slight bulging or bowing of outer wythes or multi-wythe walls
lacking header brick units (Figure 11b), and fallen brick units from parapets and other projecting elements. More severe
damage was isolated and included collapsed and fallen parapets, broken windows, and permanent lateral deformations.
This damage resulted in unsafe conditions and the collapse of entire sections of exterior building walls in some buildings
(Figure 12a, 12b & 12c).

EERI Earthquake Reconnaissance Team Report: M5.0 Cushing Oklahoma USA Earthquake on November 7, 2016 Page 10
(a) (b)
Figure 11. (a) Cracking in brick units and mortar joints near window opening; and (b) Collapsed and bulging outer wythe of multi-wythe wall; note: no header units present to secure wythes (photos: E. Wilson).
(a)
(c)
(b)
Figure 12. (a) Entire city block with common walls leaning progressively to the west (i.e. left); (b) Outer brick wythe buckled and collapsed onto sidewalk and street; (c) Permanent lateral displacement of the end building’s common walls and roof diaphragm, creating a potentially unstable P-delta condition. The end building acted as a fuse that absorbed and dissipated a significant portion of the kinetic energy from the buildings on the entire city block due to a lack of continued confinement by buildings on the west end (photos: J. Taylor).
Out-of-plane failure of a non-load bearing wall, apparently due to the lack of an adequate diaphragm to top-of-wall
connection, is shown in Figure 13.

EERI Earthquake Reconnaissance Team Report: M5.0 Cushing Oklahoma USA Earthquake on November 7, 2016 Page 11
Figure 13. Out-of-plane failure of a URM building wall (photos: J. Taylor).
Several load-bearing URM walls out-of-plane sustained damage that created falling hazards and other potentially unstable
conditions. Figure 14 shows the rear wall of a building at the southeast corner that experienced significant out-of-plane
movement, cracking the masonry at the roof level and pulling a roof beam out of the supporting masonry pocket. In
addition, the load-bearing rear wall is bowed significantly outward between the roof and grade.
(a)
(b)
Figure 14. (a) southeast building corner that experienced significant out-of-plane movement, cracking and displacing brick masonry at the roof level; and (b) roof beam pulled approximately 1-inch out of the supporting masonry pocket (photos: J. Taylor).
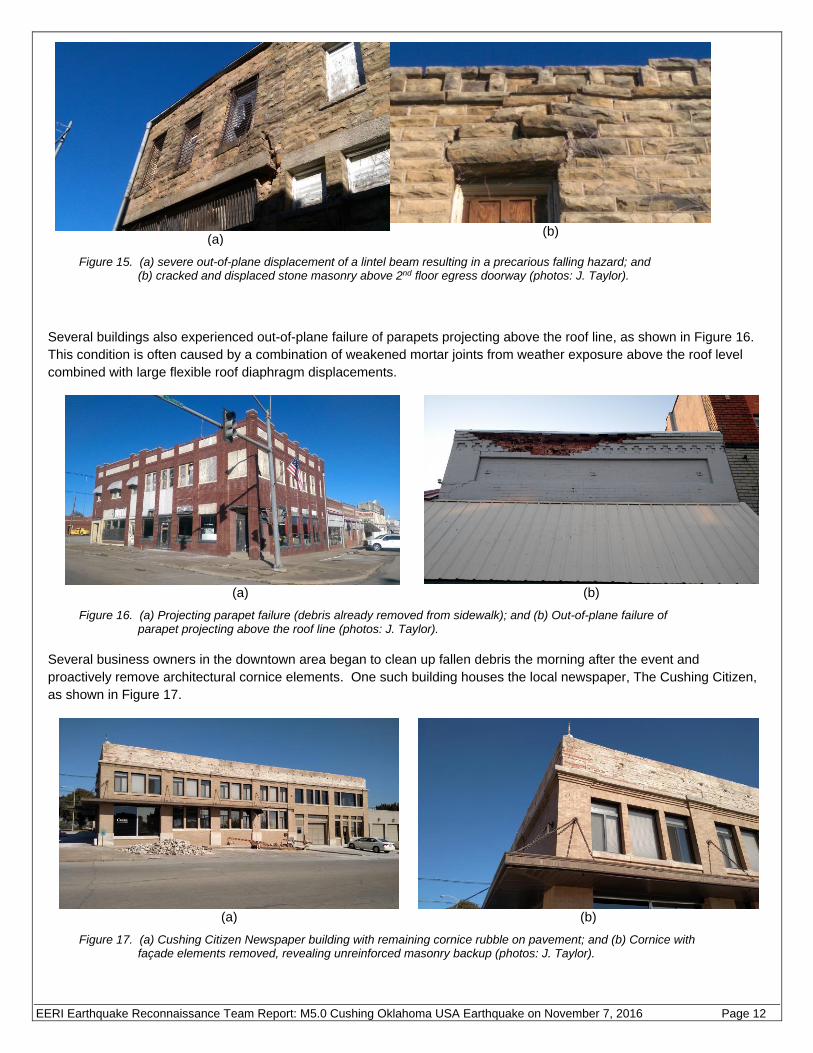
Out-of-plane cracking and displacement conditions were noted in many other locations resulting in significant falling
hazards, as shown in Figure 15.
EERI Earthquake Reconnaissance Team Report: M5.0 Cushing Oklahoma USA Earthquake on November 7, 2016 Page 12
(a) (b)
Figure 15. (a) severe out-of-plane displacement of a lintel beam resulting in a precarious falling hazard; and (b) cracked and displaced stone masonry above 2nd floor egress doorway (photos: J. Taylor).
Several buildings also experienced out-of-plane failure of parapets projecting above the roof line, as shown in Figure 16.
This condition is often caused by a combination of weakened mortar joints from weather exposure above the roof level
combined with large flexible roof diaphragm displacements.
(a) (b)
Figure 16. (a) Projecting parapet failure (debris already removed from sidewalk); and (b) Out-of-plane failure of parapet projecting above the roof line (photos: J. Taylor).
Several business owners in the downtown area began to clean up fallen debris the morning after the event and
proactively remove architectural cornice elements. One such building houses the local newspaper, The Cushing Citizen,
as shown in Figure 17.
(a)
(b)
Figure 17. (a) Cushing Citizen Newspaper building with remaining cornice rubble on pavement; and (b) Cornice with façade elements removed, revealing unreinforced masonry backup (photos: J. Taylor).

EERI Earthquake Reconnaissance Team Report: M5.0 Cushing Oklahoma USA Earthquake on November 7, 2016 Page 13
4.2 Reinforced Concrete Buildings
Cimarron Tower is a 7-story reinforced concrete frame structure clad with unreinforced clay brick and terra cotta infill
masonry. A penthouse projects above the roof level, and 4-, 2-, and 1- story wings form a stair-step configuration down
from the 7-story tower portion on the east and west sides. This building was constructed in the early 1900’s, and appears
to be the tallest structure in the City of Cushing. A drone survey was reported to have been performed with an infrared
camera following the earthquake, which revealed masonry cracking at the roof and penthouse levels. At the time of the
EERI Team’s site visit, the terra cotta cornice on the parapet at the 7-story tower roof level was in the process of being
removed by masons working with a crane basket (Figure 18). This was done in response to concerns regarding falling
hazards posed by loose masonry units around the parapet level. While the building is not on the Historic Register, the
removal of the terra cotta has a significant impact on the aesthetic appearance. An unknown number of water supply
pipes for plumbing fixtures were reported to have broken open during the earthquake, causing water damage inside the
building. However, due to safety concerns and work in progress on the building, the EERI Team did not enter the building
to examine the interior condition.
Figure 18. Cimarron Tower, a reinforced concrete frame building with unreinforced masonry infill walls. Masons are removing terra cotta from the 7th-story roof parapet due to falling hazard concerns (photo: J. Taylor).

EERI Earthquake Reconnaissance Team Report: M5.0 Cushing Oklahoma USA Earthquake on November 7, 2016 Page 14
4.3 Steel Frame Buildings
The Cushing Municipal Power Plant in Figure 19 is located to the west of the CBD, closer to the epicenter. It sustained
only minor structural damage during the earthquake, primarily consisting of cracked masonry infill walls adjacent to steel
frames supporting the high-bay roof and cracked floor slabs. Minor non-structural damage included fallen ceiling panels,
a cracked interior masonry wall in the high-bay area, and displaced masonry coping stones. Minor equipment damage
also occurred in a few limited locations, but no fuel leaks or other serious hazards occurred. A short-term power outage
occurred immediately following the earthquake event, lasting approximately 30 minutes.
Figure 19. The Cushing Municipal Power Plant, a steel frame building with unreinforced masonry infill walls, sustained minor damage during the earthquake (photo: J. Taylor).
4.4 Light Frame Buildings
Outside the CBD, structures are primarily homes, which are mainly light frame one or two story structures. As is typical for
light frame structures during moderate earthquakes, damage was limited to nonstructural components, mainly partition
wall cracks in corners and near openings. The section on nonstructural components gives specific examples. There were
few observed instances of structural damage to light frame wooden structures. Brick façade and chimney damage was
common in homes. Owners reported many cases of foundation damage, primarily a displaced residence or cracks in the
foundation. Many of these may have been pre-existing conditions.

EERI Earthquake Reconnaissance Team Report: M5.0 Cushing Oklahoma USA Earthquake on November 7, 2016 Page 15
5 NONSTRUCTURAL COMPONENTS
Damage to nonstructural components such as partition walls and facades can represent a significant portion of losses.
These components are generally sensitive to story drift ratios. Many of the structures in the CBD experienced exterior
façade damage. Figure 20a shows the brick façade of a former church that has separated from the CMU backing wall.
There do not appear to be ties holding the brick back. Numerous businesses had damage similar to that shown in Figure
20b, in which brick and terra cotta tiles at the top of the façade fell onto the sidewalk, and a window was broken. A small
number of structures in the CBD had cracks in floor tiles. Only the severely racked Lion’s Den building (see section 8.2)
had doors that would not open (reportedly). Typical finishes in light frame structures are damaged at very low story drift
ratios (< 0.2%), such as the gypsum board with cracks in the corners shown in Figure 20c. This type of damage to
partition walls was typical to homes around the CBD. The earthquake damaged numerous chimneys of homes (Figure
20d).
(a)
(b)
(c)
(d)
Figure 20. (a) Separation of a brick façade from CMU backing; (b) Broken window, bricks and tiles fallen off façade near roof; (c) Cracks at corners of gypsum board sheathing in a house; (d) Chimney damage with precariously perched bricks over porch egress (photos: E. Jampole).

EERI Earthquake Reconnaissance Team Report: M5.0 Cushing Oklahoma USA Earthquake on November 7, 2016 Page 16
6 BUILDING CONTENTS
Damage to building contents can disrupt the functionality of businesses, government facilities, and homes, while leading
to substantial economic losses. Building contents, ceiling finishes, elevators, HVAC systems, fire sprinklers, and electrical
distribution systems are particularly sensitive to floor accelerations (Miranda and Ramirez, 2009). The several recording
stations within a few kilometers of downtown Cushing, which experienced the most damage, recorded peak ground
accelerations of 0.5 g. Almost all structures in Cushing are one or two stories. Depending on local site effects, the
contents in one story structures would thus be subjected to accelerations as high as 0.5 g, and the ceilings and contents
in the second story of the two story structures would potentially be subjected to accelerations higher than 0.5 g.
The Police and Fire Center, constructed in 2013, had many downed ceiling tiles and damage to steel grid support systems
(Figure 21a), as well as a few reports of contents falling off bookshelves, which resulted in a short period of emergency
service disruption. Numerous businesses had ceiling tiles fall out. A safety deposit box in the RCB Bank slid about one
centimeter during the earthquake (Figure 21b). Widespread ceiling tile damage is not unexpected. FEMA (2012) reports
median floor accelerations for three ceiling damage states as 0.3 g. for a few fallen panels, 0.65 g. for damage to some
runners and fallen panels, and 1.28g for ceiling grids near collapse. Observed damage and likely floor accelerations both
fall in the range of the first two damage states.
(a)
(b)
Figure 21. (a) Fallen ceiling tiles in Police and Fire Center and damage to steel grid; (b) Safety deposit box in RCB Bank shifted one centimeter – shim in the corner was originally covered (photos: E. Jampole).
Numerous businesses in the central business district showed signs that fallen contents had been cleaned-up prior to the
arrival of the reconnaissance team. The contents of many buildings had been completely cleared out as businesses
temporarily relocated. The Buckhorn Bar reported a substantial loss of liquor from falling bottles. There were only
isolated reports of damage to HVAC and electrical systems in businesses. Typical homeowners reported relatively minor
contents damage, limited to a few items falling off shelves and pictures falling from walls, but no overturned bookshelves
or other furniture, despite the apparent lack of anchorage in any of the homes the reconnaissance team entered.
7 COMMUNITY IMPACTS
7.1 Central Business District & Business Interruption
Part of the downtown area was briefly evacuated immediately after the earthquake due to reports of possible natural gas
line ruptures. Officials reported that no major natural gas lines were ruptured and any other minor leaks had been sealed.
7.2 Schools
The Cushing Upper Elementary School reported a significant number of downed ceiling tiles, but little additional contents
damage. The downed ceiling tiles closed the school for one day, and gave occupants (who spoke with the
reconnaissance team) the impression that the school had experienced significant damage.

EERI Earthquake Reconnaissance Team Report: M5.0 Cushing Oklahoma USA Earthquake on November 7, 2016 Page 17
Minor structural damage to schools was only reported at Sunnyside Elementary (Figure 22a), one of eight schools in the
Cushing Public School District. Sunnyside is less than 2 miles South/Southeast from the epicenter of the November 6,
2016 magnitude 5.0 earthquake. Damage to this school building included: cracks in mortar joints and brick units (near
window openings in the brick veneer, Figure 22b), fallen ceiling tiles, and suspended grid. A steel-framed canopy
structure is located outside the main entrance to the school building, and moderate damage was observed to this
structure. The canopy structure apparently separated laterally from the brick veneer, and displaced vertically downward
after the earthquake event; the steel support posts for the canopy roof also displaced laterally relative to the canopy
beams. No attachment (i.e. weld or bolts) was observed between the cap plate on the post and the canopy beam, which
allowed the relative displacement to occur, and resulted in an unstable condition. Nuts on anchors between the steel
baseplate at the bottom of the posts and the concrete sidewalk were not fully tightened, allowing the baseplate to rotate
relative to the sidewalk (Figure 22c). It is unlikely that the nuts were fully tightened prior to the earthquake. Installation of a
single 2x4 nominal wood member as temporary shoring between the underside of the canopy beam and concrete
sidewalk below was completed prior to the time of structural damage assessment (Figure 22d).
(a)
(b)
(c)
(d)
Figure 22. (a) Overall view of Sunnyside Elementary; (b) cracking in brick veneer near main entrance; (c) loose anchor nuts in canopy post base plate connection to concrete sidewalk; and (d) 2x4 stud post member installed as temporary shoring by school maintenance staff (photos: E. Wilson).
7.3 Housing and Insurance
Many residents in the area did not have earthquake insurance, an endorsement that must be added to existing
homeowner’s insurance policies in the state. Even in cases where homeowners had an active policy, however, often the
damage was too minor to warrant a claim. While earthquake endorsements are relatively cheap (averaging $50-300 per
year), the deductible is a percentage of the insured value, not to be confused with the standard dollar amount associated

EERI Earthquake Reconnaissance Team Report: M5.0 Cushing Oklahoma USA Earthquake on November 7, 2016 Page 18
with other policies. Additionally, most of the endorsements offered in the state are for catastrophic coverage, which does
not cover minor losses (OID, 2016). In many cases, damage was limited to only the brick veneer, which is not covered
under most policies. The State Insurance Commissioner’s office was available to speak to residents at the Chamber of
Commerce building over a three-day span, and indicated that a number of residents had visited.
8 EMERGENCY RESPONSE
8.1 Evacuating Cimarron Tower
Local Emergency Management Director, Bob Noltensmeyer, along with local fire stations, arrived at the Cimarron Tower
retirement community shortly after the earthquake. Upon arrival, Director Noltensmeyer contacted the local Red Cross
chapter so it could prepare to receive approximately 15 to 20 evacuees from the Cimarron Tower retirement community.
Approximately 10 of the remaining evacuees relocated to stay with local families and friends. Buses arrived within 30
minutes of the earthquake, transporting the retirement community members to the nearby Red Cross shelter established
at a local youth center. One evacuee was transported to the hospital due to a laceration on the back of the hand.
8.2 Building Safety Assessments and Damage Hotline for Building Owners
Following the preliminary damage assessments, the City of Cushing set up a local hotline for residents and businesses to
report damage to the City Manager’s Office. The hotline received over 150 reports of damage. Figure 23 shows
approximate damage descriptions called-in to the hotline within the first week after the earthquake.
Figure 23. Coarse damage descriptions called in to Cushing City Manager’s office as of one week after the earthquake (data source: City of Cushing damage hotline; map: E. Jampole).
The Oklahoma Department of Emergency Management (OEM) set up a joint preliminary damage assessment team with
FEMA, the Small Business Administration (SBA), and local officials. The OEM team of eight officials visited buildings
reported through the hotline as damaged and conducted cursory damage assessments. Based upon OEM team findings,
the governor’s office determined that the damage did not meet the threshold to request assistance from either FEMA or
SBA.
During their fieldwork in Cushing, the EERI reconnaissance team noticed that building safety placards had not been
clearly posted on any of the damaged buildings. EERI and the LFE reconnaissance team for Oklahoma strongly
recommend the cities of Cushing and Pawnee, the County of Payne, and the State of Oklahoma develop a
comprehensive plan for conducing building safety evaluations and posting building safety placards on buildings after
earthquakes to inform building occupants of building safety hazards. Several URM buildings, such as the Lions Club
building, located in the historic downtown, and the American Legion building, located southeast of the historic downtown,

EERI Earthquake Reconnaissance Team Report: M5.0 Cushing Oklahoma USA Earthquake on November 7, 2016 Page 19
were obviously unsafe to occupy, as shown in Figure 24. While caution tape had selectively been placed around the
exterior of both buildings, the reconnaissance team witnessed people entering the Lions Club building. The hazard posed
by these and other buildings would be more clearly communicated with a comprehensive placard-based system.
(a)
(b)
Figure 24. Damaged buildings in Cushing did not have any building placards posted to inform building occupants of
building safety hazards, despite serious structural damage and life-safety risk posed by both (a) the Lions Club building, and (b) the American Legion building (photos: E. Jampole).
9 SOCIAL AND ECONOMIC IMPACTS
9.1 Business Impact
There were about 400 for-profit business in Cushing, OK. About a quarter of the businesses were in the retail trade sector
and one fifth were in the service sector (Table 2). Cushing, OK is known as the “pipeline crossroads of the world”. It is
home to over thirty oil extraction and pipeline firms.
Table 2. List of business sectors by percentage of all sectors (Source: Reference USA).
Business Sector Percent
Agriculture, Forestry & Fishing 3 Construction 13 Finance, Insurance & Real Estate 10 Manufacturing 7 Mining 6 Retail Trade 26 Services 21 Transportation, Communications, Electric, Gas & Sanitary Services 10
Wholesale Trade 5 Total 100
The historic downtown area and the East Main Street business corridor are the two major business areas in town.
Buildings in the East Main Street corridor were mostly constructed in the past three decades. These buildings suffered no
damage or only minor damage from the earthquake. Businesses in this area felt no impact or only minor impact.
The downtown area has a much older building stock. Following EERI's resilience-based framework for observing and
documenting earthquake impacts on businesses (EERI, 2016d), the reconnaissance team visited most businesses
located in the CBD. For each business, members of the EERI team performed a short building damage assessment and
recorded the business operational status in a short survey form. The results of these assessments are shown in Figure 25
and Table 3. The damage assessment of 52 buildings in the downtown area shows that over 70 percent of the buildings
had no damage or minor damage (Table 3). About 17 percent had moderate damage, and 12 percent had severe
damage.

EERI Earthquake Reconnaissance Team Report: M5.0 Cushing Oklahoma USA Earthquake on November 7, 2016 Page 20
(a)
(b)
Figure 25. Maps showing the results of the EERI reconnaissance team’s business survey in downtown Cushing, Oklahoma, including (a) Building Damage Assessment results categorized by severity of damage; and (b) Business Operational Status categorized as “Open,” “Closed,” or “Other” (source: EERI Reconnaissance Team survey).

EERI Earthquake Reconnaissance Team Report: M5.0 Cushing Oklahoma USA Earthquake on November 7, 2016 Page 21
Table 3. Building damage assessment conducted by the EERI Reconnaissance Team for downtown Cushing, OK, categorized by severity of damage (source: EERI Reconnaissance Team survey).
In addition to the building damage assessment conducted by engineers from the reconnaissance teams, downtown
business owners were asked to self-report the severity of damage experienced to various components of necessary for
their business operation, including the building, machinery and equipment, inventory, and other items. The results from
the survey are shown in Figure 26.
Figure 26. Self-reported severity of damage to various components of necessary for business operation by businesses in the downtown area of Cushing, Oklahoma (source: EERI Reconnaissance Team survey).
The survey of 41 businesses in the historic downtown area shows that about 59 percent of businesses were open and 15
percent were closed at the time of reconnaissance (Table 4). The rest of the businesses had already closed before the
earthquake, were seasonal businesses that did not open during the winter months, or had moved to other locations.
Building Damage Numbers of Building Percent
No damage 6 11.5
Minor damage 31 59.6
Moderate damage 9 17.3
Severe damage 6 11.5
Total 52 100.0
EERI Earthquake Reconnaissance Team Report: M5.0 Cushing Oklahoma USA Earthquake on November 7, 2016 Page 22
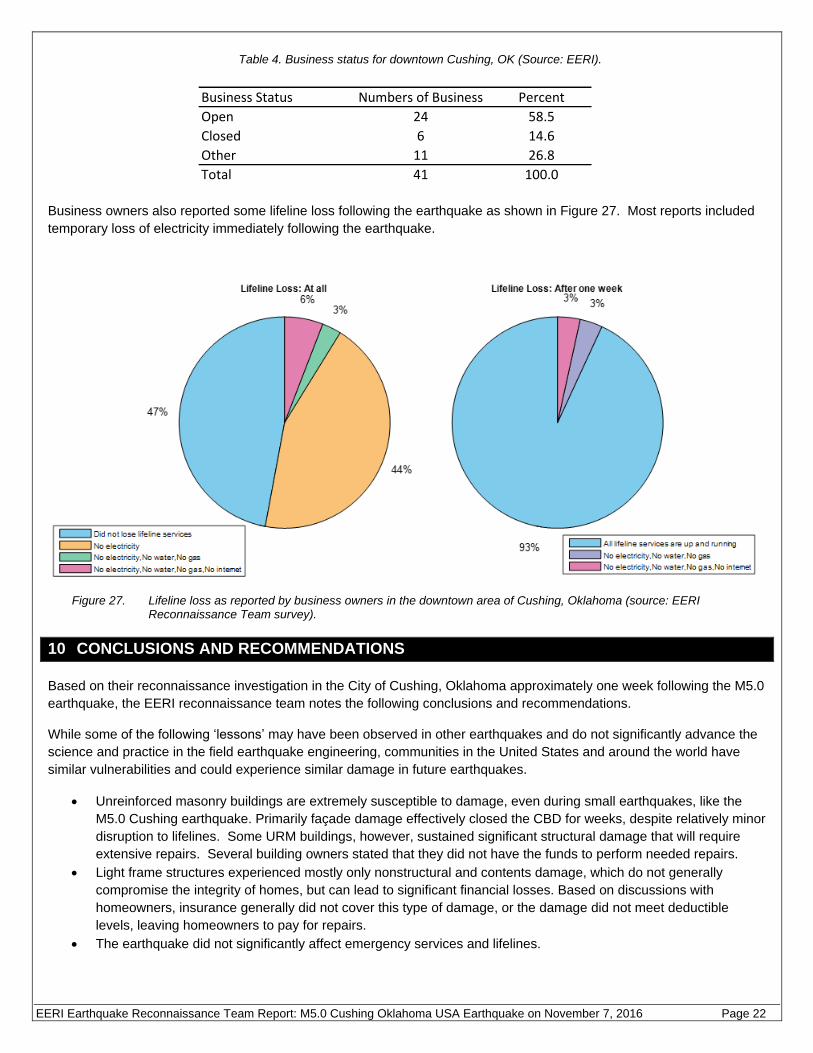
Table 4. Business status for downtown Cushing, OK (Source: EERI).
Business owners also reported some lifeline loss following the earthquake as shown in Figure 27. Most reports included
temporary loss of electricity immediately following the earthquake.
Figure 27. Lifeline loss as reported by business owners in the downtown area of Cushing, Oklahoma (source: EERI Reconnaissance Team survey).
10 CONCLUSIONS AND RECOMMENDATIONS
Based on their reconnaissance investigation in the City of Cushing, Oklahoma approximately one week following the M5.0
earthquake, the EERI reconnaissance team notes the following conclusions and recommendations.
While some of the following ‘lessons’ may have been observed in other earthquakes and do not significantly advance the
science and practice in the field earthquake engineering, communities in the United States and around the world have
similar vulnerabilities and could experience similar damage in future earthquakes.
Unreinforced masonry buildings are extremely susceptible to damage, even during small earthquakes, like the
M5.0 Cushing earthquake. Primarily façade damage effectively closed the CBD for weeks, despite relatively minor
disruption to lifelines. Some URM buildings, however, sustained significant structural damage that will require
extensive repairs. Several building owners stated that they did not have the funds to perform needed repairs.
Light frame structures experienced mostly only nonstructural and contents damage, which do not generally
compromise the integrity of homes, but can lead to significant financial losses. Based on discussions with
homeowners, insurance generally did not cover this type of damage, or the damage did not meet deductible
levels, leaving homeowners to pay for repairs.
The earthquake did not significantly affect emergency services and lifelines.
Business Status Numbers of Business Percent
Open 24 58.5
Closed 6 14.6
Other 11 26.8
Total 41 100.0
EERI Earthquake Reconnaissance Team Report: M5.0 Cushing Oklahoma USA Earthquake on November 7, 2016 Page 23
Oklahoma historically had a low exposure to earthquake hazards, and is now experiencing induced seismicity for the first
time. These communities need to increased their knowledge and practice of earthquake mitigation, response and
recovery best practices. In particular, the reconnaissance team recommends the following:
Residents of Cushing may not fully understand the risk or cause of recent earthquakes. Risk messaging should
be improved, and programs put in place that encourage seismic upgrades.
Due to the lack of posted building safety evaluation placards on buildings after the Mw5.0 earthquake in Cushing,
a comprehensive plan should be developed for conducting building safety evaluations. Building safety evaluation
placards should be posted on buildings as soon as possible after earthquakes to inform building occupants of
building safety hazards. This recommendation should be considered by the City of Cushing, City of Pawnee, the
County of Payne, and the State of Oklahoma.
11 ACKNOWLEDGEMENTS
In compiling this report, contributions from the following USGS researchers are acknowledged:
Annemarie Baltay, Nicolas Luco, Art McGarr, Daniel McNamara, Justin Rubinstein, Christopher Stephens, and Robert
Williams.
The EERI reconnaissance team would like to thank the City of Cushing residents that shared their hospitality, experiences
and information with the team, including Mr. Steve Spears, City Manager; Robert Notensmeyer, City Emergency
Manager; and the many City of Cushing employees and residents with whom we interacted. We greatly appreciate
everyone’s cooperation and generosity that made our teams’ visit to Cushing, OK both an enjoyable experience and a
success. We wish the residents of Cushing great success in their recovery, with improved seismic safety as a result of
their efforts.
12 REFERENCES
ASCE 7-10, 2011. Minimum design loads for buildings and other structures, American Society of Civil Engineers, Reston, VA.
Atkinson, G.M., 2015. Ground‐Motion Prediction Equation for Small‐to‐Moderate Events at Short Hypocentral Distances, with Application to Induced‐Seismicity Hazards: Bulletin of the Seismological Society of America, v. 105, no. 2A, p. 981- 992. (http://dx.doi.org/10.1785/0120140142). [Also available at http://www.bssaonline.org/content/early/2015/02/12/0120140142]
Atkinson G.M., 2004. Empirical attenuation of ground-motion spectral amplitudes in southeastern Canada and the northeastern United States, Bull. Seismol. Soc. Am. , 94: 1079–1095. 9
Baltay, A. S. and Hanks, T. C., 2014. Understanding the Magnitude Dependence of PGA and PGV in NGA-West 2 Data, Bulletin of the Seismological Society of America, Vol. 104, No. 6, pp. –, December 2014, doi: 10.1785/0120130283
Earthquake Engineering Research Institute (EERI), 2016a. Oklahoma USA Earthquakes Clearinghouse website, available at http://www.eqclearinghouse.org/2016-09-03-oklahoma/.
Earthquake Engineering Research Institute (EERI), 2016b. EERI Oklahoma Photo Gallery, available at http://www.eqclearinghouse.org/2016-09-03-oklahoma/maps-and-photos/photo-gallery/.
Earthquake Engineering Research Institute (EERI), 2016c. Oklahoma USA Earthquakes Field Observation Map, available at http://arcg.is/2cDV83u.
Earthquake Engineering Research Institute (EERI), 2016d. Learning From Earthquakes Resilience Observatory web page, available at https://www.eeri.org/projects/learning-from-earthquakes-lfe/resilience-observatory/.
Federal Emergency Management Agency (FEMA), 2012. Next-Generation Methodology for Seismic Performance Assessment of Buildings, prepared by the Applied Technology Council for the Federal Emergency Management Agency, Report No. FEMA P-58, Washington, D.C.
Juozapavicius, J. (2016). 40 to 50 buildings damaged in Oklahoma earthquake, available at: https://www.bostonglobe.com/news/nation/2016/11/07/buildings-damaged-oklahoma-earthquake/pkSNT73brUkVrHCJWfhm2L/story.html.

EERI Earthquake Reconnaissance Team Report: M5.0 Cushing Oklahoma USA Earthquake on November 7, 2016 Page 24
Marsh, S. and Holland, A., 2016, Oklahoma Geological Survey (OGS) OFR2-2016. Comprehensive Fault Database and Interpretive Fault Map of Oklahoma, 2 plates with supplement. 15 pages. 2016, available at: http://ogs.ou.edu/docs/openfile/OF2-2016.pdf.
McNamara, D. E., Hayes, G. P., Benz, H., Williams, R. A., McMahon, N. D., Aster, R. C., Holland, A., Sickbert, T., Herrmann, R., Briggs, R., Bergman, E., and Earle, P. (2015), Reactivated faulting near Cushing, Oklahoma: Increased potential for a triggered earthquake in an area of United States strategic infrastructure, Geophys. Res. Lett., 42, doi:10.1002/2015GL064669.
Mitchell, J. (2016). Lt. Governor Todd Lamb Tours Cushing Earthquake Damage, available at: http://www.news9.com/story/33687256/lt-governor-todd-lamb-to-tour-cushing-earthquake-damage.
National Pipeline Mapping System, 2016. Available at: https://www.npms.phmsa.dot.gov.
Oklahoma Department of Emergency Management (ODEM), 2016. Cushing Earthquake Damage, available at: https://okem.maps.arcgis.com/apps/View/index.html?appid=3cac1848810f4933968035788af32a17.
Oklahoma Geological Survey (OGS), 2016. Oklahoma Fault Database, available at: http://www.ou.edu/ogs/data/fault.html.
Oklahoma Insurance Department (OID), 2016. Oklahoma Insurance Department – Earthquakes, available at: https://www.ok.gov/oid/Consumers/Prepare_Yourself/Earthquakes.html.
Oklahoma School Security Institute (OSSI), 2016. School Security Drill Reporting. December 20, 2016, available at: https://www.ok.gov/schoolsecurity/DRILL_REPORTING/.
Petersen, M.D., Mueller, C.S., Moschetti, M.P., Hoover, S.M., Rubinstein, J.L., Llenos, A.L., Michael, A.J., Ellsworth, W.L., McGarr, A.F., Holland, A.A., and Anderson, J.G., 2015, Incorporating induced seismicity in the 2014 United States National Seismic Hazard Model—Results of 2014 workshop and sensitivity studies: U.S. Geological Survey Open-File Report 2015–1070, 69 p., http://dx.doi.org/10.3133/ofr20151070.
Petersen, M.D., Mueller, C.S., Moschetti, M.P., Hoover, S.M.,, Llenos, A. L., Ellsworth, W. L., Michael, A.J.,, Rubinstein, J.L.,, McGarr, A/ F., and Rukstales. K. S.. 2016. 2016 one-year seismic hazard forecast for the Central and Eastern United States from induced and natural earthquakes, U/ S. Geological Survey, Open-File Report 2016-1035. DOI:10.3133/ofr20161035
Powell, K. (2016). FEMA, state inspectors document damage caused by big quake in Cushing. Retrieved November 25, 2016, available at: http://www.koco.com/article/fema-state-inspectors-document-damage-caused-by-big-quake-in-cushing/8275594.
Ramirez, C.M. and Miranda, E., 2009. Building-specific loss estimation methods & tools for simplified performance-based earthquake engineering (Doctoral dissertation, Stanford University).
Trifunac MD, Brady AG. 1975. A study on the duration of strong earthquake ground motion. Bulletin of the Seismological Society of America 65(3): 581–626.
United States Geological Survey (USGS), 2016a. M5.0 - 3km. W of Cushing, Oklahoma: ShakeMap GIS file, available at: http://earthquake.usgs.gov/archive/product/shakemap/us100075y8/us/1482098024534/download/shape.zip (accessed January 2017).
United States Geological Survey (USGS), 2016b. M 5.8 - 14km. NW of Pawnee, Oklahoma: ShakeMap GIS file, available at: http://earthquake.usgs.gov/archive/product/shakemap/us10006jxs/us/1477635764169/download/shape.zip (accessed January 2017).
United States Geological Survey (USGS), 2016c. Earthquake Hazards Program, M 5.0 - 3km W of Cushing, Oklahoma, available at: http://earthquake.usgs.gov/earthquakes/eventpage/us100075y8.
United States Geological Survey (USGS), 2016d. Earthquake Hazards Program, Data for 2016 One-Year Seismic Hazard Forecast, available at: http://earthquake.usgs.gov/hazards/induced/data.php.
United States Geological Survey (USGS), 2016e. Center for Engineering Strong Motion Data (CESMD), retrieved 30 November, 2016, available at: http://www.strongmotioncenter.org/.
13 COPYRIGHT
© 2016 Earthquake Engineering Research Institute, Oakland, California, 94612-1934

EERI Earthquake Reconnaissance Team Report: M5.0 Cushing Oklahoma USA Earthquake on November 7, 2016 Page 25
All rights reserved. No part of this publication may be reproduced in any form or by any means without the prior written
permission of the publisher, Earthquake Engineering Research Institute, 499 14th Street, Suite 220, Oakland, CA 94612-
1934, telephone: +1 (510) 451-0905, email: [email protected], website: www.eeri.org.
The Earthquake Engineering Research Institute (EERI) is a nonprofit corporation. The objective of EERI is to reduce
earthquake risk by (1) advancing the science and practice of earthquake engineering, (2) improving understanding of the
impact of earthquakes on the physical, social, economic, political, and cultural environment, and (3) advocating
comprehensive and realistic measures for reducing the harmful effects of earthquakes.
Any opinions, findings, conclusions, or recommendations expressed herein are the authors’ and do not necessarily reflect
the views of EERI, the authors’ organizations, or any funding agencies.
This publication is available in PDF format from http://www.eeri.org.


