m3commentary - m3property Strategists · | P1 Key Research Contacts: m3commentary MELBOURNE CBD...
8
| P1 www.m3property.com.au Key Research Contacts: m3commentary MELBOURNE CBD OFFICE Autumn | 2017 m3property.com.au Jennifer Williams National Director | NSW (02) 8234 8116 Casey Robinson Research Manager | QLD (07) 3620 7906 Erin Obliubek Research Manager | VIC (03) 9605 1075 Zoe Haskett Research Manager | SA (08) 7099 1807
Transcript of m3commentary - m3property Strategists · | P1 Key Research Contacts: m3commentary MELBOURNE CBD...

| P1www.m3property.com.au
Key Research Contacts:
m3commentary MELBOURNE CBD OFFICE
Autumn | 2017
m3property.com.au
Jennifer Williams
National Director | NSW
(02) 8234 8116
Casey Robinson
Research Manager | QLD
(07) 3620 7906
Erin Obliubek
Research Manager | VIC
(03) 9605 1075
Zoe Haskett
Research Manager | SA
(08) 7099 1807

| P2www.m3property.com.au
m3property Research
Market Overview 3
Key Influences 4
Key Indicators 5
Significant Sales 7
Outlook 8
CONTENTS
•Sales activity was healthy in the twelve months to
March 2017, albeit below the year prior;
•Prime yields continued to compress while
secondary yields stabilised over the year to March
2017;
•Supply levels increased in the second half of
2016, however, new supply will be limited in 2017
with just one significant project expected to
complete;
•Leasing conditions improved towards the end of
2016 and set to strengthen further in 2017;
•The CBD vacancy rate declined in January 2017,
driven by a combination of stock withdrawals and
improved leasing conditions; and
•Prime effective rental growth of 8.9% was
recorded in the twelve months to March 2017.
TENANT DEMAND
STRENGTHENS IN
THE MELBOURNE
CBD OFFICE
MARKET
DEFINITIONS
A-REIT: ASX listed Australian Real
Estate Investment Trust
Completion date: determined by issue
of a “Certificate of Occupancy”
Grade: is determined using the PCA
report “A Guide to Office Building
Quality”.
Net absorption: is the change in
occupied stock within a market over a
specified period of time.
Net lettable area (NLA): defined in
accordance with the PCA “Method of
Measurement”
Pre-commitment: contract signed to
occupy space in new or refurbished
space prior to construction commencing.
Prime: Combination of premium and
grade A.
Secondary: Combination of grades B, C
and D.
WALE: Weighted average lease expiry.
m3commentary Autumn 2017
| P3www.m3property.com.au
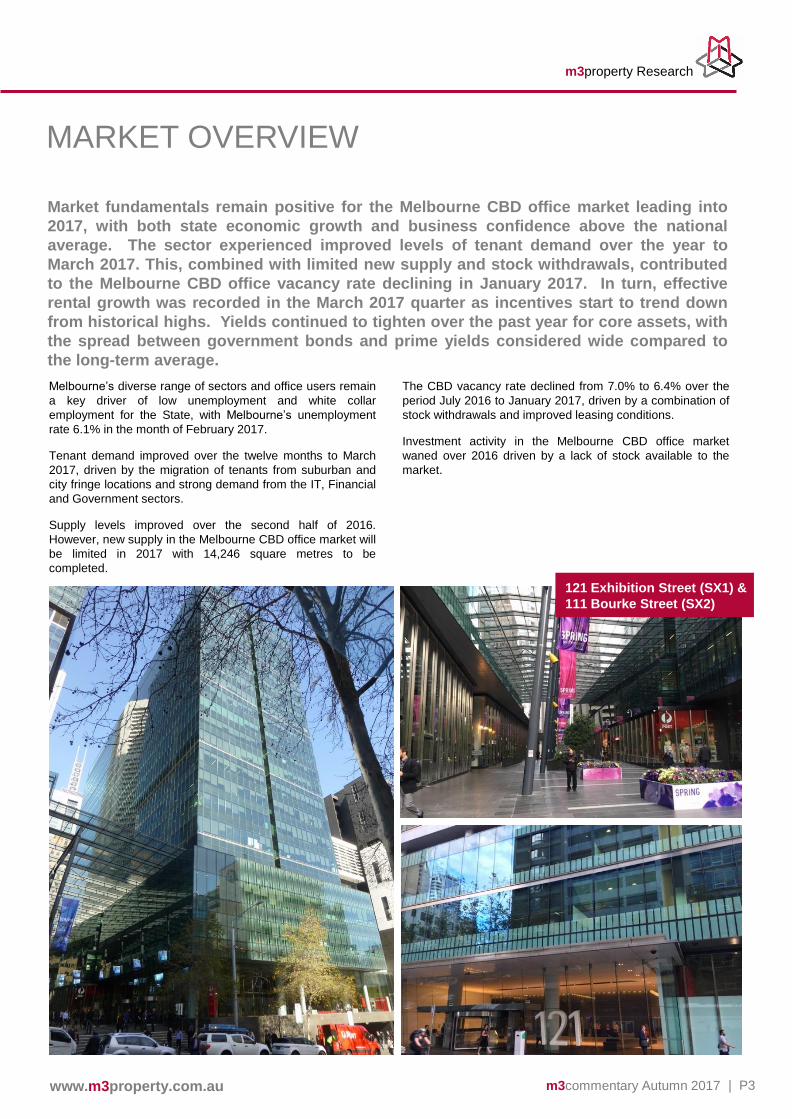
Market fundamentals remain positive for the Melbourne CBD office market leading into
2017, with both state economic growth and business confidence above the national
average. The sector experienced improved levels of tenant demand over the year to
March 2017. This, combined with limited new supply and stock withdrawals, contributed
to the Melbourne CBD office vacancy rate declining in January 2017. In turn, effective
rental growth was recorded in the March 2017 quarter as incentives start to trend down
from historical highs. Yields continued to tighten over the past year for core assets, with
the spread between government bonds and prime yields considered wide compared to
the long-term average.
Melbourne’s diverse range of sectors and office users remain
a key driver of low unemployment and white collar
employment for the State, with Melbourne’s unemployment
rate 6.1% in the month of February 2017.
Tenant demand improved over the twelve months to March
2017, driven by the migration of tenants from suburban and
city fringe locations and strong demand from the IT, Financial
and Government sectors.
Supply levels improved over the second half of 2016.
However, new supply in the Melbourne CBD office market will
be limited in 2017 with 14,246 square metres to be
completed.
The CBD vacancy rate declined from 7.0% to 6.4% over the
period July 2016 to January 2017, driven by a combination of
stock withdrawals and improved leasing conditions.
Investment activity in the Melbourne CBD office market
waned over 2016 driven by a lack of stock available to the
market.
MARKET OVERVIEW
m3property Research
121 Exhibition Street (SX1) &
111 Bourke Street (SX2)
m3commentary Autumn 2017

| P4www.m3property.com.au
ECONOMIC GROWTHGross Domestic Product (GDP) grew by 2.4% during 2016. Strongest growth was
recorded in the Mining, Agriculture, Forestry and Fishing; and Professional, Scientific and
Technical Services sectors. Victoria State Final Demand, a key indicator of the health of
the state’s economy, grew by 3.4% during 2016. Economic growth in Victoria is forecast to
outperform national economic growth over the long-term.
EMPLOYMENTIn the year to February 2017 Victoria added over 95,000 jobs, compared to the year prior,
with most of the growth occurring towards the end of 2016. Although Victoria’s seasonally
adjusted unemployment rate increased in the month of February to 6.1%, the
underemployment rate declined by 0.2 percentage points. The IT, Finance and Insurance
sectors remain the main drivers of white collar employment in the State.
CASH RATE AND GOVERNMENT BOND RATESThe Reserve Bank of Australia (RBA) has lowered the official cash rate by 75 basis points
over the past two years, with the most recent reduction (1.50%) being in August 2016. The
low cost of debt remains a key driver of investor demand for commercial property assets.
Historically low returns on government bonds have also encouraged strong demand for
property during recent years. However, it’s anticipated the gap between government
bonds and commercial yields will compress in 2017 as bond yields commence to rise.
BUSINESS CONFIDENCEThe National Australia Bank’s monthly business survey remained strong at 7 index points
in February 2017 (0 = neutral). This is above the long-term average for business
confidence and remains favourable for future economic growth. Business confidence in
Victoria remained above the national average at 14 index points. Confidence is a driving
force behind tenant decisions to relocate, expand or contract.
EXCHANGE RATEWhile the value of the exchange rate has increased over the past year, it remains
considerably lower than it was between mid-2009 and mid-2015, when it didn’t fall below
80 cents. The lower value has been a driving force behind strong investment demand from
foreign investors.
KEY INFULENCES
m3property Research
575 Bourke Street, Melbourne520 Bourke Street, Melbourne
$
m3commentary Autumn 2017
| P5www.m3property.com.au
TENANT DEMAND
Despite the lack of stock available to the market in 2016,
tenant demand in the Melbourne CBD office market
strengthened over the second half of 2016. Net absorption in
the six months to January 2017 up 7,641 square metres.
Prime stock accounted for over 75% of positive net absorption
in the year to January 2017. This is consistent with the market
experiencing a rise in tenant enquiry for prime CBD office
space, with several tenants seeking to secure lease
agreements given the current lack of prime stock available.
Although tenant demand is expected to remain strong over the
short term, demand is anticipated to soften in the second half
of 2017 as tenants pre-commit to new builds forecast to
complete in 2018 and 2019.
KEY INDICATORS
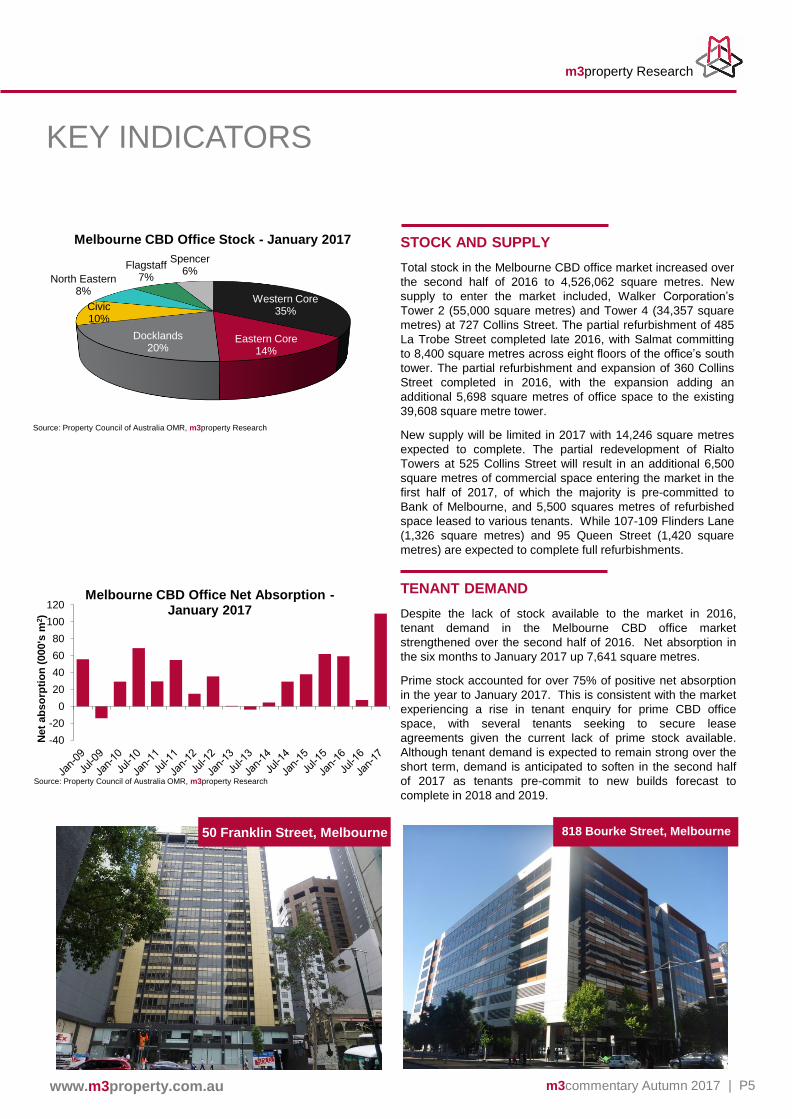
STOCK AND SUPPLY
Total stock in the Melbourne CBD office market increased over
the second half of 2016 to 4,526,062 square metres. New
supply to enter the market included, Walker Corporation’s
Tower 2 (55,000 square metres) and Tower 4 (34,357 square
metres) at 727 Collins Street. The partial refurbishment of 485
La Trobe Street completed late 2016, with Salmat committing
to 8,400 square metres across eight floors of the office’s south
tower. The partial refurbishment and expansion of 360 Collins
Street completed in 2016, with the expansion adding an
additional 5,698 square metres of office space to the existing
39,608 square metre tower.
New supply will be limited in 2017 with 14,246 square metres
expected to complete. The partial redevelopment of Rialto
Towers at 525 Collins Street will result in an additional 6,500
square metres of commercial space entering the market in the
first half of 2017, of which the majority is pre-committed to
Bank of Melbourne, and 5,500 squares metres of refurbished
space leased to various tenants. While 107-109 Flinders Lane
(1,326 square metres) and 95 Queen Street (1,420 square
metres) are expected to complete full refurbishments.
m3property Research
818 Bourke Street, Melbourne50 Franklin Street, Melbourne
-40
-20
0
20
40
60
80
100
120
Net
ab
so
rpti
on
(000's
m2)
Melbourne CBD Office Net Absorption -January 2017
Source: Property Council of Australia OMR, m3property Research
Western Core35%
Eastern Core14%
Docklands20%
Civic10%
North Eastern8%
Flagstaff7%
Spencer6%
Melbourne CBD Office Stock - January 2017
Source: Property Council of Australia OMR, m3property Research
m3commentary Autumn 2017

| P6www.m3property.com.au
INVESTMENT MARKET AND YIELDS
Investor activity in the Melbourne CBD slowed in the twelve
months to March 2017 with approximately $1.3 billion worth of
office stock traded. Transactional activity was below the
previous year’s total of $2.9 billion.
Significant transactions to occur the past twelve months include
the sale of 100 Queen Street to GPT Wholesale Office Fund in
the order of $274.5 million, 114 William Street having sold to a
European based fund for $161.4 million and 438 Elizabeth
Street which was purchased by an offshore private investor for
$75.6 million.
Prime yields compressed 25 basis points over the year to
March 2017, with prime yields ranging from 5.00% to 6.00%.
Over the same period, secondary yields remained stable
continuing to range from 6.00% to 7.00%.
Yields within the Melbourne CBD office market have reached
historically low levels, the current spread between Melbourne’s
CBD prime office yields and government bonds is
approximately 2.7%, which is considered wide when compared
to the 20-year average of around 1.6%.
VACANCY
The total vacancy rate for Melbourne’s CBD office market fell to
6.4% in January 2017 with prime grade vacancy at 6.7% in July
2016 falling to 6.6% over the six month period. Secondary
grade vacancy was recorded at 6.4% in January 2017 down
1.2% over the same period. The vacancy rate as at January
2017 remained well below the long term (since 1990) average
of 11.4% and the lowest since July 2012 (5.5%)
RENTAL GROWTH AND INCENTIVES
Face rental growth in Melbourne’s CBD office market
remained relatively flat over the year to March 2017, with
prime net face rents ranging from $380 to $700 per square
metre.
Prime CBD office incentives declined in the six months to
March 2017 to range from 25.0% to 32.0%. It is anticipated
incentives will continue to trend downwards due to improved
tenant leasing conditions and the lack of new supply entering
the market in 2017.
Strong prime effective rental growth is anticipated over 2017,
while prime net face rents are expected to grow at average in
2017.
KEY INDICATORS
m3property Research
0.0%
2.0%
4.0%
6.0%
8.0%
10.0%
12.0%
14.0%
16.0%
Civic EasternCore
Flagstaff NorthEastern
Spencer WesternCore
Docklands
Vacan
cy (
%)
Melbourne CBD Office Vacancy January 2017
CBD 6.4%
Source: Property Council of Australia OMR, m3property Research
$0
$100
$200
$300
$400
$500
$600
Net
Fa
ce R
en
ts (
$/m
2)
Melbourne Prime and SecondaryAverage Net Face Rents
Prime Secondary
Source: m3property Research.
0
500
1,000
1,500
2,000
2,500
3,000
2008 2009 2010 2011 2012 2013 2014 2015 2016 2017
Sale
s v
olu
me (
$m
illi
on
s)
Melbourne CBD Office Sales Volume
Source: m3property Research. *Office Sales over $5 million to end March 2017.
.
*
m3commentary Autumn 2017

| P7www.m3property.com.au
Property Date Price Equated
Market
Yield
Vendor Purchaser
50 Franklin Street, Melbourne Jan-17 $51,500,000 5.80% Selected Growth Properties Offshore Investor
Esso House, 51-65 Southbank
Promenade, SouthbankDec-16 $160,000,000 *6.06% ExxonMobil Offshore Investor
100 Queen Street, Melbourne Dec-16 $274,500,000 5.51% ANZ Banking GroupGPT Wholesale Office
Fund
438 Elizabeth Street, Melbourne Dec-16 $75,600,000 5.80% Selected Growth Properties Offshore Private Investor
301 Flinders Lane, Melbourne Dec-16 $34,200,000 4.67% KLW Holdings Local Private Investor
114 William Street, Melbourne Oct-16 $161,457,704 6.05% CorVal / Straits Real Estate European Based Fund
Twenty8 Freshwater Place,
SouthbankAug-16 $290,000,000 *6.00% GPT/Frasers Property TBA
51 Queen Street, Melbourne Jun 16 $25,000,000 5.71% Queville Pty Ltd Undisclosed
120 Spencer Street, Melbourne Mar-16 $165,200,000 6.60% Harry Stamoulis Anton Capital
1 Collins Street, Melbourne Feb-16 $125,000,000 5.40% Robert Magid Harry Stamoulis
*Initial Yield
Please contact one of our Commercial Valuers for a detailed sales analysis.
SELECT SALES TO DATE
m3property Research
55 King Street, Melbourne
m3commentary Autumn 2017
KEY COMMERCIAL VALUATION
CONTACTS
The outlook for the Melbourne CBD office market remains
positive. The sector will continue to benefit from strong
annual population growth, increased productivity, and an
expanding Victorian economy.
Tenant demand is expected to strengthen over the short
term, driven by a lack of available stock, with incentive
levels likely to reduce over the year.
Vacancy is expected to remain contained over 2017 before
increasing in 2018 on the back of new supply and backfill
space entering the market.
Limited new supply and improved tenant demand will result
in above average prime effective rental growth in 2017,
while secondary effective rents are expected to grow at
average.
Offshore purchasers are expected to remain active in the
Melbourne CBD office market, attracted to Victoria’s
positive fundamentals. Solid economic growth, strong
annual population growth, and increasing white collar
employment are expected to drive appetite from local and
offshore investors in 2017.
Investment opportunities, particularly for premium CBD
assets, are expected to remain limited, this coupled with
strengthening market fundamentals will result in a
continued low yielding environment in 2017.
OUTLOOKMELBOURNE CBD OFFICE
DISCLAIMER
© m3property Australia. This report has been derived, in part, from sources other than m3property. In passing on this information, m3property makes no
representation that any information or assumption contained in this material is accurate or complete.
To the extent that this material contains any statement as to the future, it is simply an estimate or opinion based on information currently available to m3property
and contains assumptions which may be incorrect. m3property makes no representation that any such statements are, or will be, accurate.
Gary Longden
Director | VIC
(03) 9605 1040
Andrew Duguid
Managing Director | NSW
(02) 8234 8101
Ross Perkins
Managing Director | QLD
(07) 3620 7901
Adrian Burg
Director | SA
(08) 7099 1801
m3property Research
m3property provides national
coverage in all States and Territories.