LS2: Exploring the Complexity of Policy Design
58
EXPLORING THE COMPLEXITY OF POLICY DESIGN January 2013 Research team: Rosário Macário (coord) Luís N. Filipe Maria Spandou Vasco Reis Luis Martinez Instituto Superior Técnico Universidade Técnica de Lisboa
-
Upload
brtcoe -
Category
Technology
-
view
114 -
download
5
description
Transcript of LS2: Exploring the Complexity of Policy Design
EXPLORING THE COMPLEXITY OF POLICY DESIGN
January 2013
Research team: Rosário Macário (coord)
Luís N. FilipeMaria Spandou
Vasco ReisLuis Martinez
Instituto Superior TécnicoUniversidade Técnica de Lisboa
• Understand the main decision making processes in BRT systems
• Develop a formal structure for retrospective analysis of the various interplaying policy components, and relations between institutional design and performance
• Develop a systems dynamic model to search for well‐designed and promising BRT policy packages
Project objectives
• Luis N. Filipe, Rosário Macário, “A first glimpse on policy packaging for implementation of BRT projects” in Research in Transportation Economics 39 (2013) 150 – 157
• Spandou M., Macário R., Decentralization as an institutional determinant for the performance of urban mobility systems, VREF CoE Workshop 26‐29 October 2011, Beijing, China
• Macário R. Thinking on public accountability: How to address quality of policy design and decision‐making? 12th Thredbo Conference, 11‐15 September 2011, Durban, South Africa
• + working reports
• Preliminary analysis on policy packaging in Santiago Chile
• Coalition analysis in New York
Contents
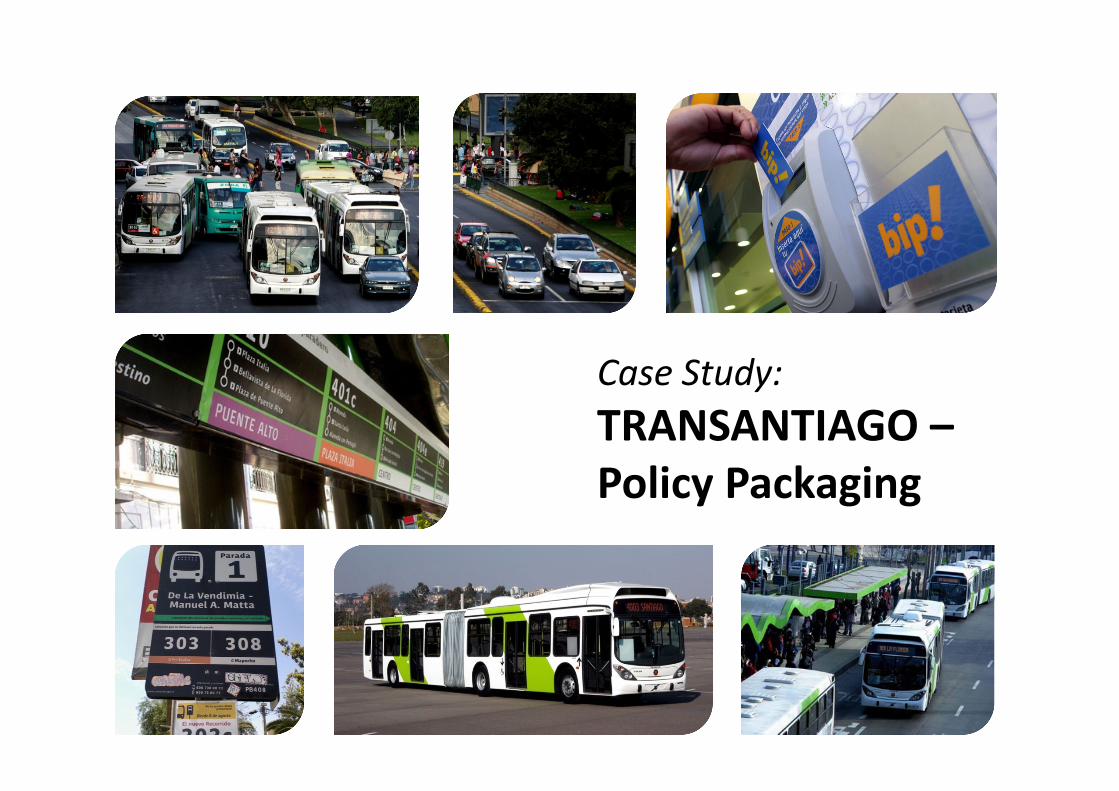
Case Study: TRANSANTIAGO –Policy Packaging
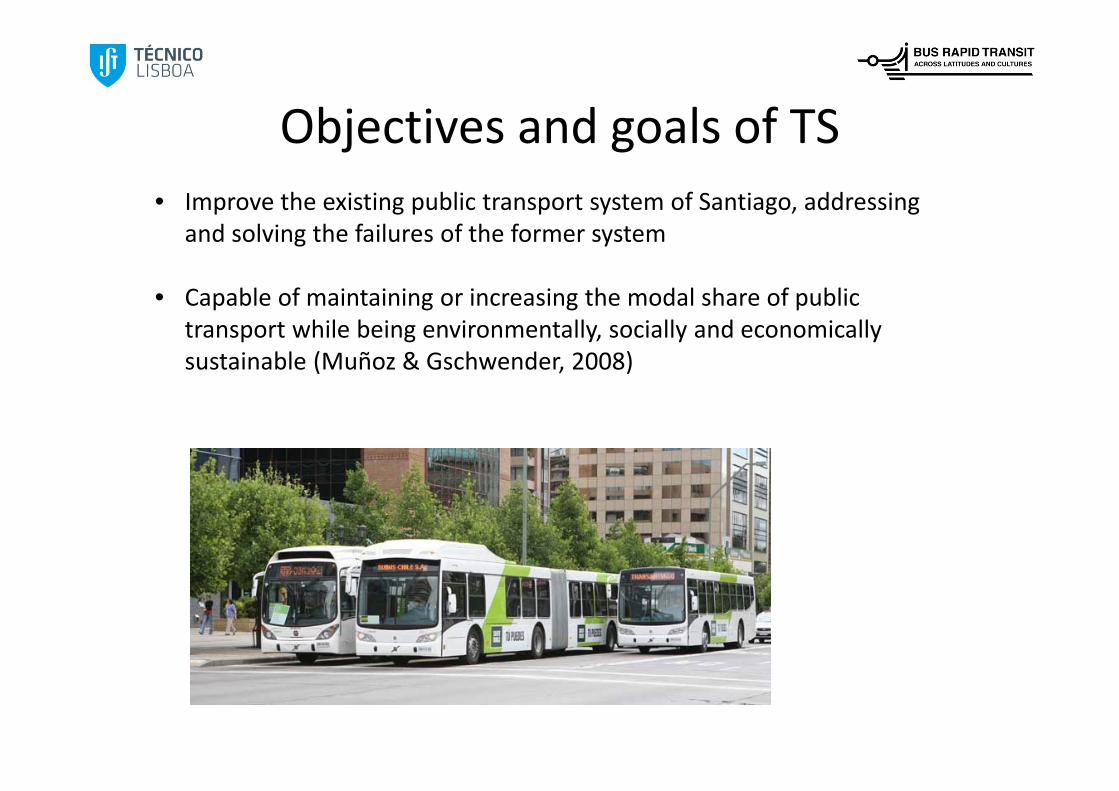
Objectives and goals of TS• Improve the existing public transport system of Santiago, addressing
and solving the failures of the former system
• Capable of maintaining or increasing the modal share of public transport while being environmentally, socially and economically sustainable (Muñoz & Gschwender, 2008)
Old transport system – issues to beaddressed
(Allende, I., et. al., 2007; Muñoz & Gschwender, 2008; Brione, 2009)
• Defective business structure, with many small companies operating only a few services; companies organized into powerful cooperatives that were able to capture the government
• No formal working relations, driver’s income linked to the number of passengers ‐ tax evasion, promotion of abusive practices, discrimination of subsidized passengers, on‐street competition
• Payments done directly to drivers, who were subject to constant assaults
• Defective network: 80% of the routes used one of the 6 main city streets; very long routes (average 60km), leading to high operating costs, bus bunching, congestion
Old transport system – issues to beaddressed (cont.)
• No integration (fore or physical) making transfers expensive and low use of the metro
• Old / uncomfortable and badly maintained buses, causing passenger discomfort, high air pollution and noise emissions
(Allende, I., et. al., 2007; Muñoz & Gschwender, 2008; Brione, 2009)
But...• Relevant positive features in the old system:
(Allende, I., et. al., 2007; Brione, 2009)• high network density and capillarity• high frequencies• low or no need for transfers• no subsidies• Flexibility to serve new residential areas
Main features of the TS Plan
(Muñoz & Gschwender, 2009)• Organised as trunk and feeder system with the metro as the backbone
• Specifications defined to minimize total social cost, operate without subsidies and subject to a maximal fare, with an average travel time similar to former system
• Drivers’ salaries independent from the number of passengers – eliminate aggressive driving techniques
• Operators receive the same for all passengers ‐ discrimination against poorer/subsidized passengers
• Fares and services integration, including the metro – increase metro ridership
Policy Packaging in BRTTranSantiago Case Study
Main features of the TS Plan (cont.)(Muñoz & Gschwender, 2009)
• Totally new fleet, with facilities for disabled riders
• A new information system to passengers, based on GPS technology
• Smartcard transaction, thus eliminating money handling in buses –reducing assaults to drivers
• Money administered by AFT (financial and technological manager)
• Awards and penalties scheme on operators’ contracts
• Network of segregated bus corridors and high quality bus stops ‐ increase in average speed
Policy Packaging in BRTTranSantiago Case Study (WP3)
Implementation• Transition plan foreseen for a seamless transition from the old system
• Several delays (e.g. AFT implementation ) led to postponements which in turn led to relaxing of planned features (e.g. flat fare)
• Changes in political power led to important changes to the plan (e.g. reduction on the scope of the information system; allowing companies to rent buses)
• Despite extensive planning several problems arose on the starting date (Feb 10th 2007), causing the Chilean parliament to produce a massive report (Cámara de Diputados, 2007) used by several parties and associations to dissect the project
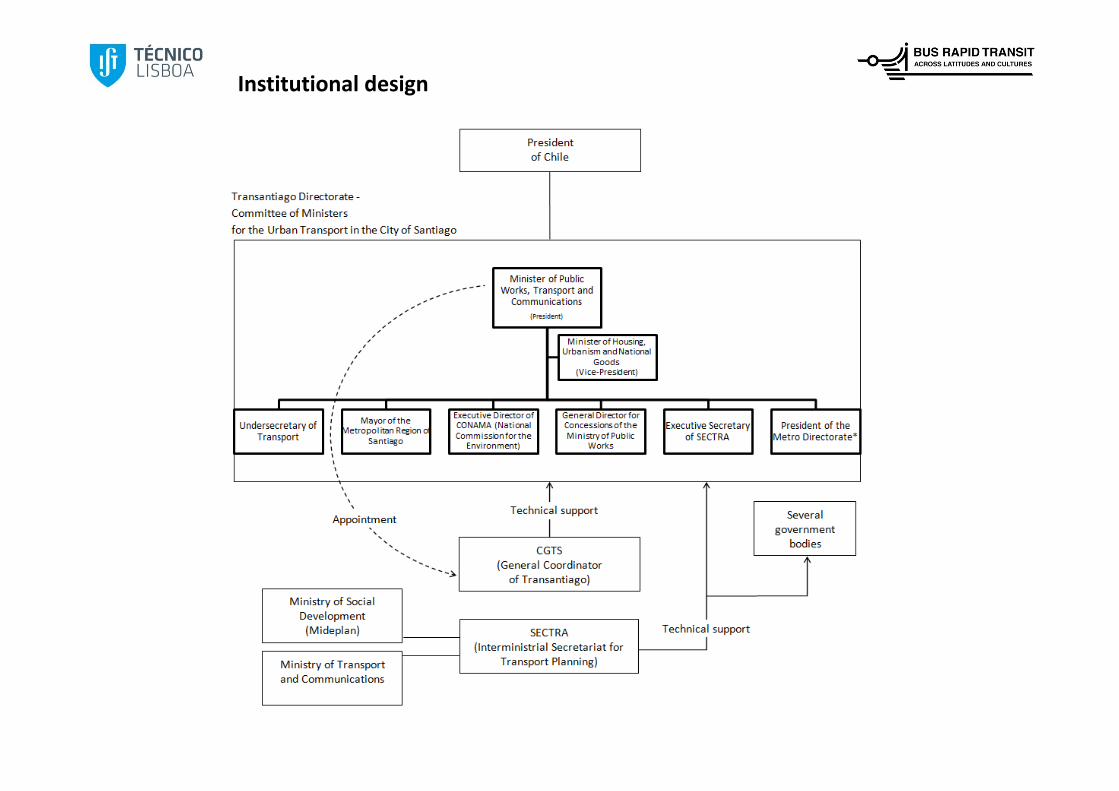
Institutional design
• Plan emerged from a very high and closed hierarchy with no independent members or technicians, leading to low public participation (Brione, 2009)
• Different members of the committee had different (sometimes opposing) agendas, according to their backgrounds
• No clear definition of responsibilities of each of the members of the Committee (Cámara de Diputados, 2007)
• CGTS was created following the model of the agency responsible for road concessions (Coordinadora de Concesiones), assuming the concession process for roads and for bus operations were similar
• Transport Authority with proper attributions could have helped overcoming some of the institutional issues identified (e.g. Allende et. al., 2007)
Some Institutional issues
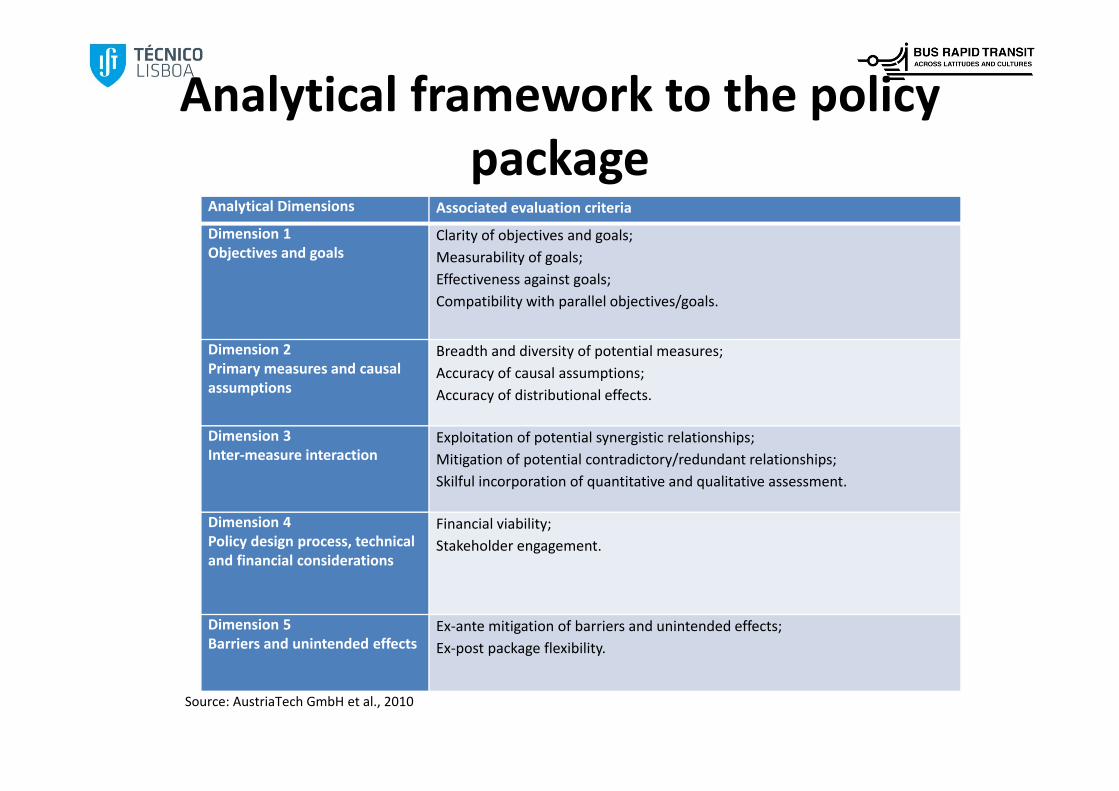
Analytical framework to the policypackage
Analytical Dimensions Associated evaluation criteria
Dimension 1Objectives and goals
Clarity of objectives and goals;Measurability of goals;Effectiveness against goals;Compatibility with parallel objectives/goals.
Dimension 2Primary measures and causal assumptions
Breadth and diversity of potential measures;Accuracy of causal assumptions;Accuracy of distributional effects.
Dimension 3Inter‐measure interaction
Exploitation of potential synergistic relationships;Mitigation of potential contradictory/redundant relationships;Skilful incorporation of quantitative and qualitative assessment.
Dimension 4Policy design process, technical and financial considerations
Financial viability;Stakeholder engagement.
Dimension 5Barriers and unintended effects
Ex‐ante mitigation of barriers and unintended effects;Ex‐post package flexibility.
Source: AustriaTech GmbH et al., 2010
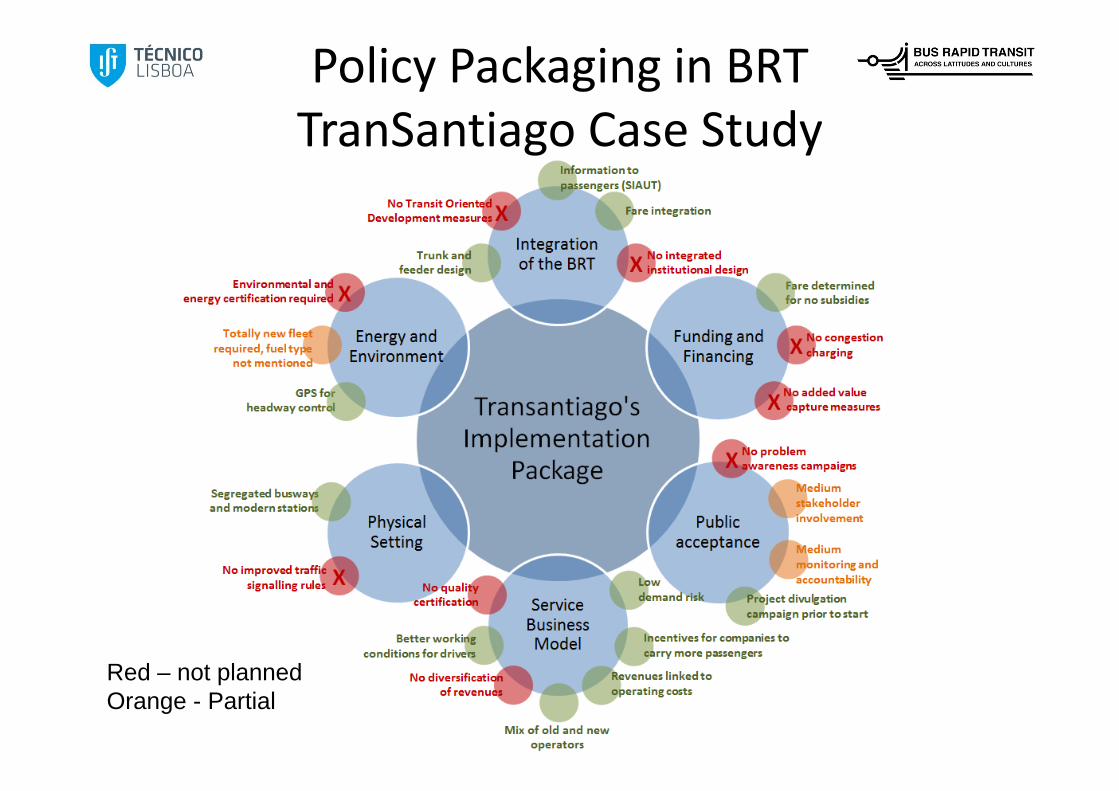
Policy Packaging in BRTTranSantiago Case Study
Red – not plannedOrange - Partial
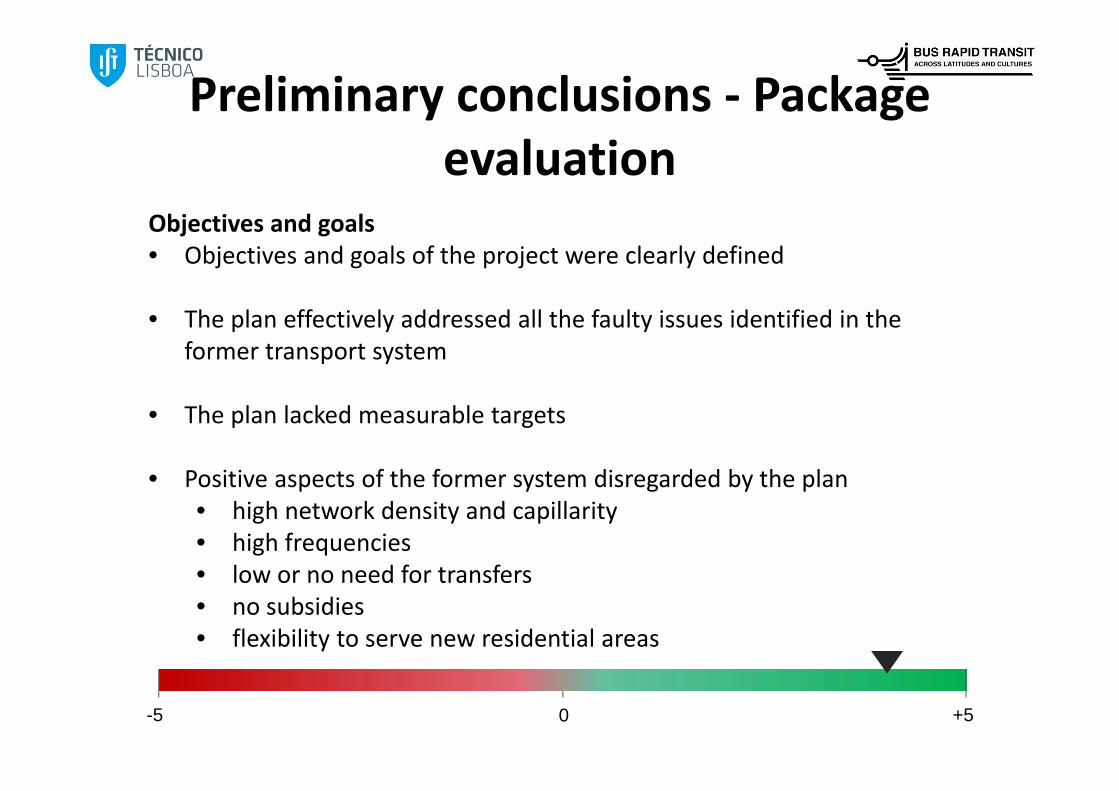
Preliminary conclusions ‐ Package evaluation
Objectives and goals• Objectives and goals of the project were clearly defined
• The plan effectively addressed all the faulty issues identified in the former transport system
• The plan lacked measurable targets
• Positive aspects of the former system disregarded by the plan• high network density and capillarity• high frequencies• low or no need for transfers• no subsidies• flexibility to serve new residential areas
-5 0 +5
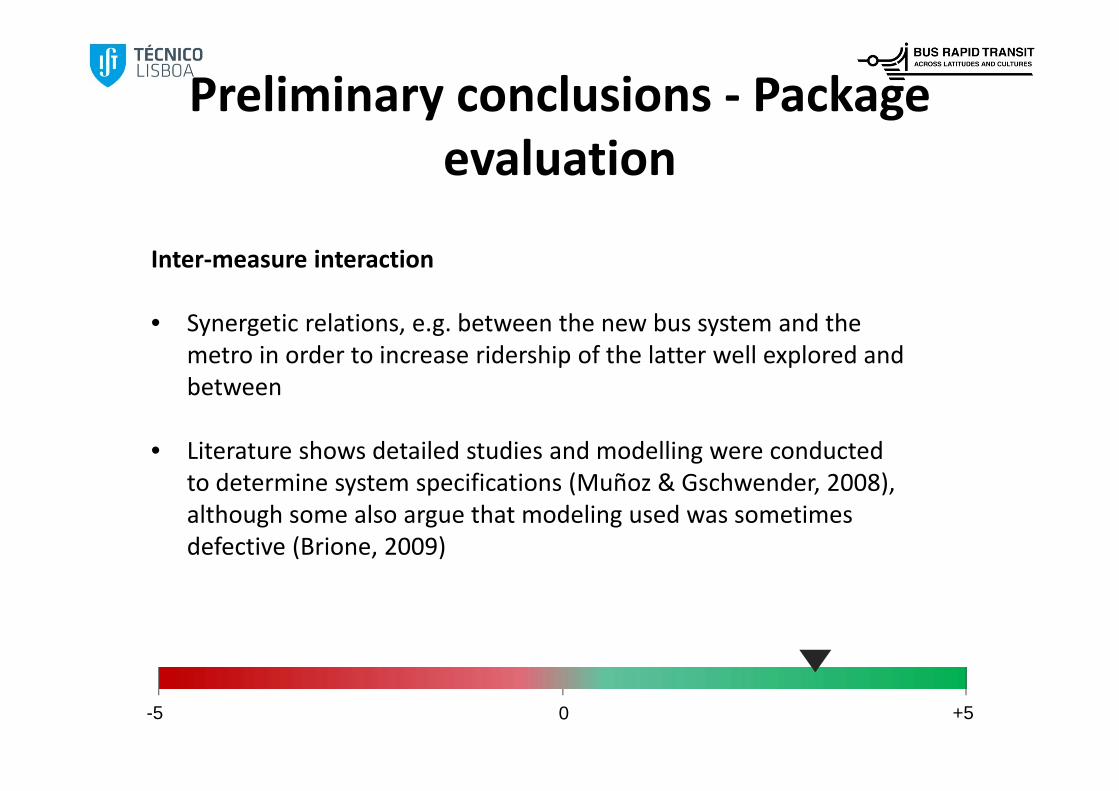
Preliminary conclusions ‐ Package evaluation
Inter‐measure interaction
• Synergetic relations, e.g. between the new bus system and the metro in order to increase ridership of the latter well explored and between
• Literature shows detailed studies and modelling were conducted to determine system specifications (Muñoz & Gschwender, 2008), although some also argue that modeling used was sometimes defective (Brione, 2009)
-5 0 +5
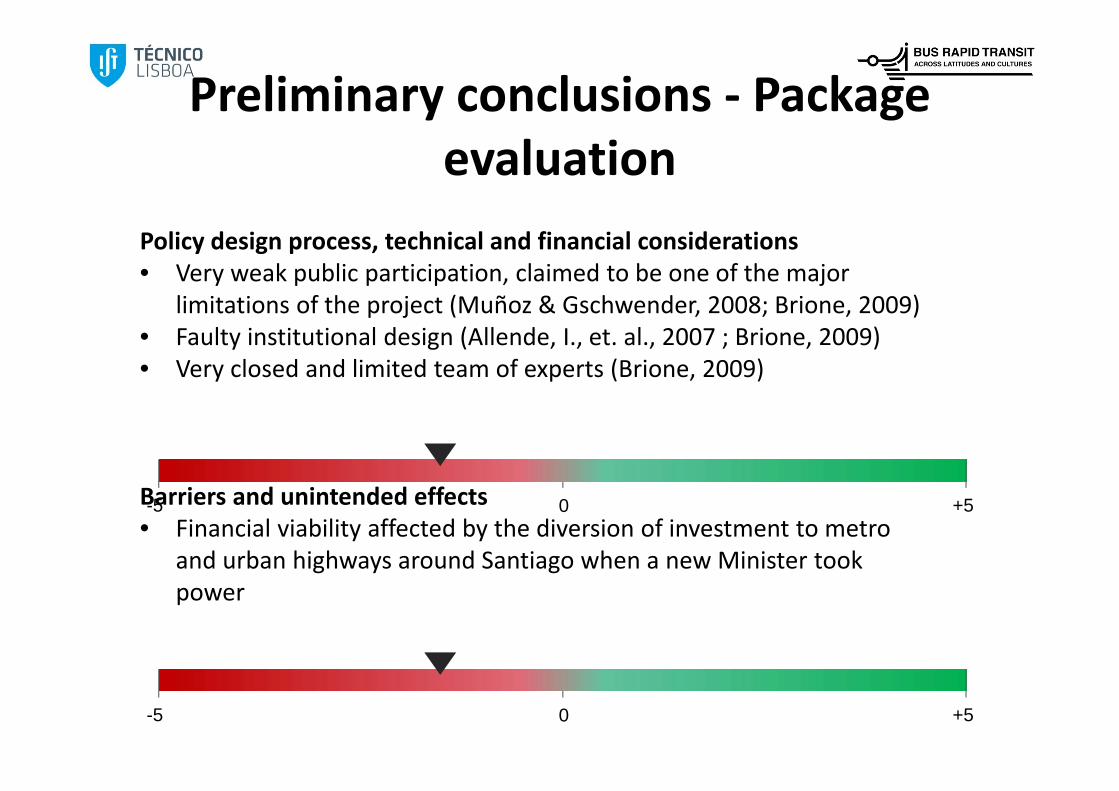
Preliminary conclusions ‐ Package evaluation
Policy design process, technical and financial considerations• Very weak public participation, claimed to be one of the major
limitations of the project (Muñoz & Gschwender, 2008; Brione, 2009)• Faulty institutional design (Allende, I., et. al., 2007 ; Brione, 2009)• Very closed and limited team of experts (Brione, 2009)
Barriers and unintended effects • Financial viability affected by the diversion of investment to metro
and urban highways around Santiago when a new Minister took power
-5 0 +5
-5 0 +5
Stakeholders(besides the actors presented before)
• Operator companies (associated into cooperatives ‐ gremiales) – in the old system functioned as a cartel and had the power to influence and capture governments’ actions during the creation and implementation of Transantiago; some were incorporated in the new system (TS)
• Bus Drivers’ – had vary bad working conditions in the old system; were explored by the owners (operators) and had a vary bad reputation by the citizens who accused them of system’s failures;
• Citizens – the ones affected by the plan
• NGO’s – had an important role in creating awareness about the problems in the transportation system and had an important role in influencing the political agenda
Preliminary conclusions
• Project had several problems, not caused by policy package but by implementation issues
• Delays in several areas, causing the postponement of the project;• Postponement of technology and infrastrucutre (segregated
busways and stops)• Diversion of funding to metro and road projects• Reduction of the information system• Operational deficit
Preliminary conclusions (cont.)
• Problems affecting implementation related to weaknesses in institutional design, namely:• Implementation hierarchy highly dependent from political power• No authority officially committed to the implementation of the
system• No clear definition of responsabilities and overlaping roles (in the
Transantiago Directorate)

Classification of BRT systems adopted for the project (ITDP, 2007)
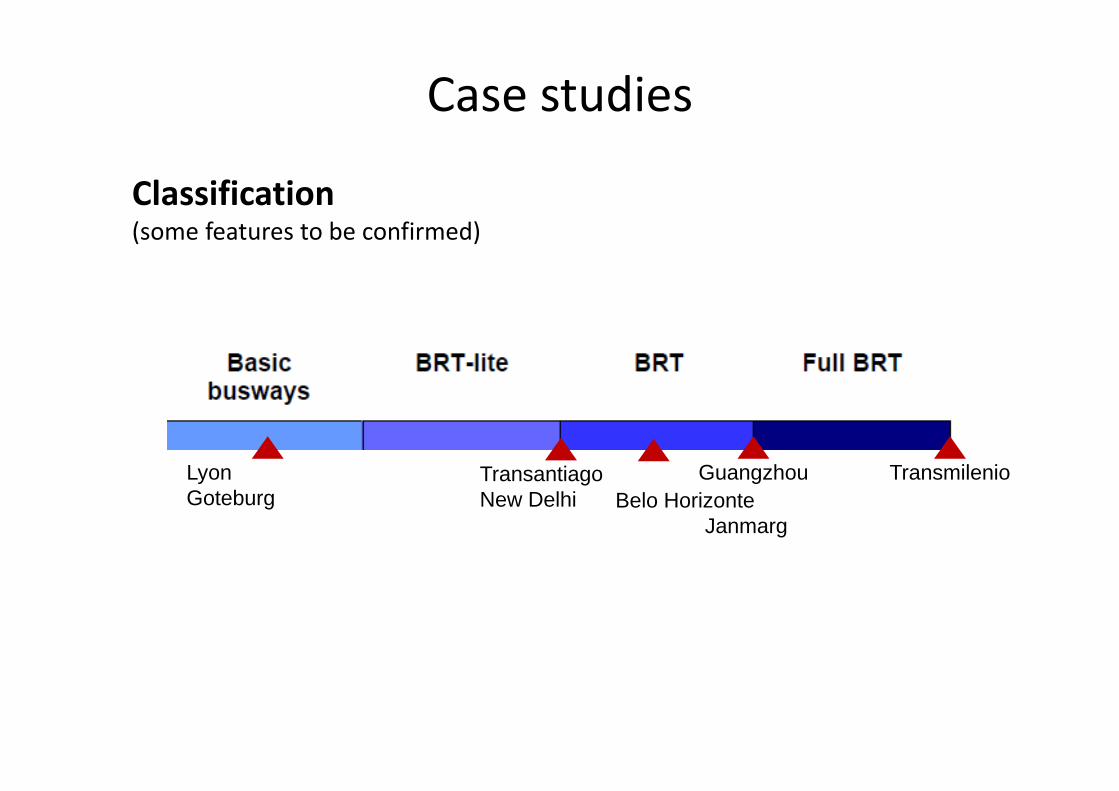
Case studies
TransmilenioTransantiagoNew Delhi Belo Horizonte
Janmarg
GuangzhouLyonGoteburg
Classification(some features to be confirmed)
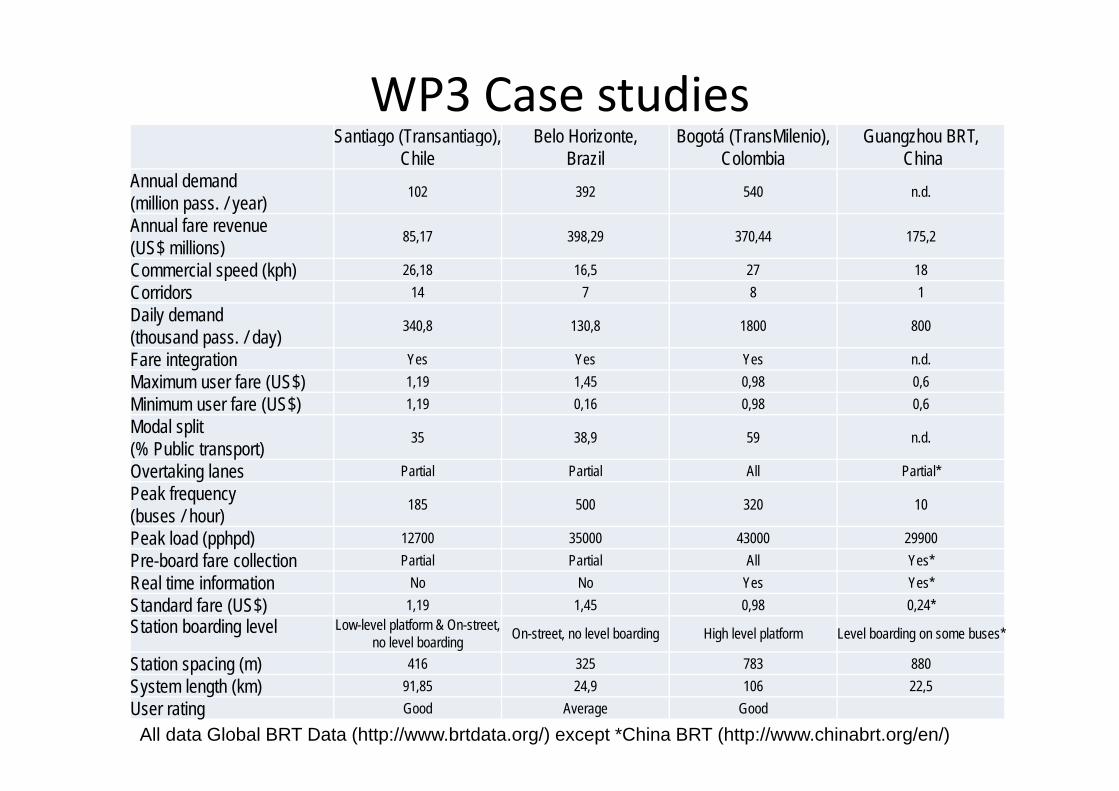
WP3 Case studies Santiago (Transantiago),
ChileBelo Horizonte,
BrazilBogotá (TransMilenio),
ColombiaGuangzhou BRT,
ChinaAnnual demand(million pass. / year) 102 392 540 n.d.
Annual fare revenue(US$ millions) 85,17 398,29 370,44 175,2
Commercial speed (kph) 26,18 16,5 27 18Corridors 14 7 8 1Daily demand(thousand pass. / day) 340,8 130,8 1800 800
Fare integration Yes Yes Yes n.d.Maximum user fare (US$) 1,19 1,45 0,98 0,6Minimum user fare (US$) 1,19 0,16 0,98 0,6Modal split(% Public transport) 35 38,9 59 n.d.
Overtaking lanes Partial Partial All Partial*Peak frequency(buses / hour) 185 500 320 10
Peak load (pphpd) 12700 35000 43000 29900Pre-board fare collection Partial Partial All Yes*Real time information No No Yes Yes*Standard fare (US$) 1,19 1,45 0,98 0,24*Station boarding level Low-level platform & On-street,
no level boarding On-street, no level boarding High level platform Level boarding on some buses*
Station spacing (m) 416 325 783 880System length (km) 91,85 24,9 106 22,5User rating Good Average Good
All data Global BRT Data (http://www.brtdata.org/) except *China BRT (http://www.chinabrt.org/en/)
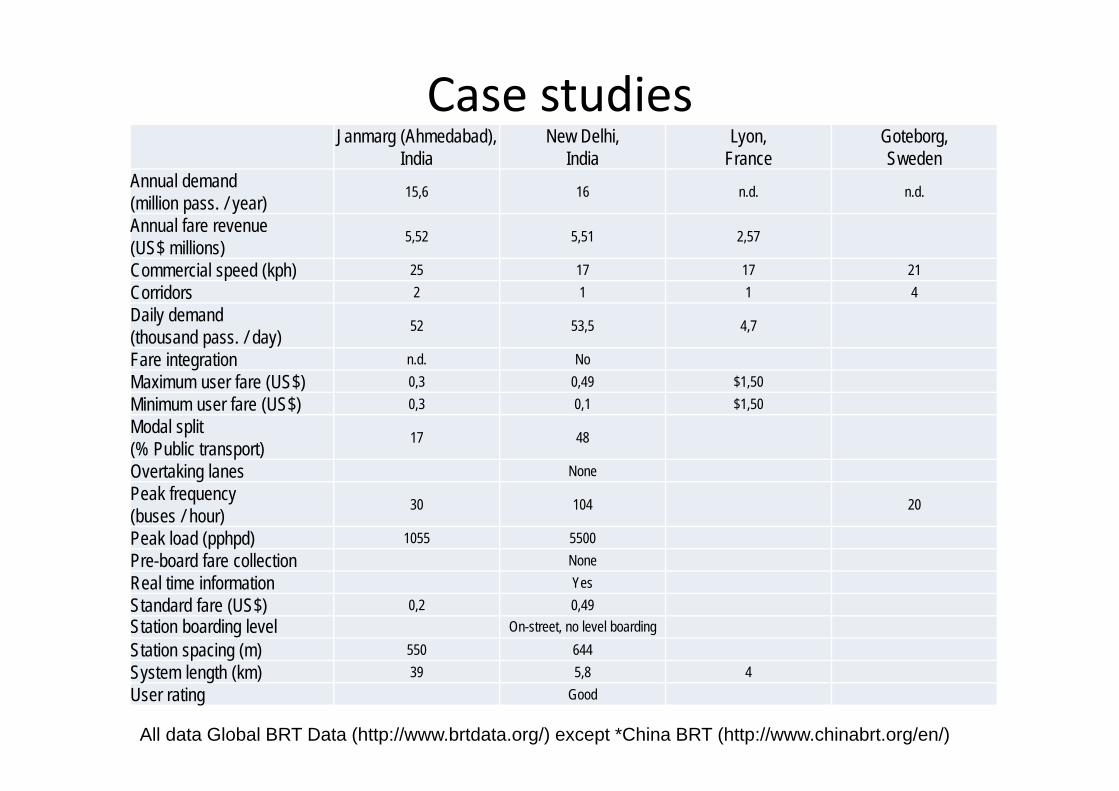
Case studies Janmarg (Ahmedabad),
IndiaNew Delhi,
IndiaLyon,
FranceGoteborg,Sweden
Annual demand(million pass. / year) 15,6 16 n.d. n.d.
Annual fare revenue(US$ millions) 5,52 5,51 2,57
Commercial speed (kph) 25 17 17 21Corridors 2 1 1 4Daily demand(thousand pass. / day) 52 53,5 4,7
Fare integration n.d. NoMaximum user fare (US$) 0,3 0,49 $1,50Minimum user fare (US$) 0,3 0,1 $1,50Modal split(% Public transport) 17 48
Overtaking lanes NonePeak frequency(buses / hour) 30 104 20
Peak load (pphpd) 1055 5500Pre-board fare collection NoneReal time information YesStandard fare (US$) 0,2 0,49Station boarding level On-street, no level boardingStation spacing (m) 550 644System length (km) 39 5,8 4User rating Good
All data Global BRT Data (http://www.brtdata.org/) except *China BRT (http://www.chinabrt.org/en/)
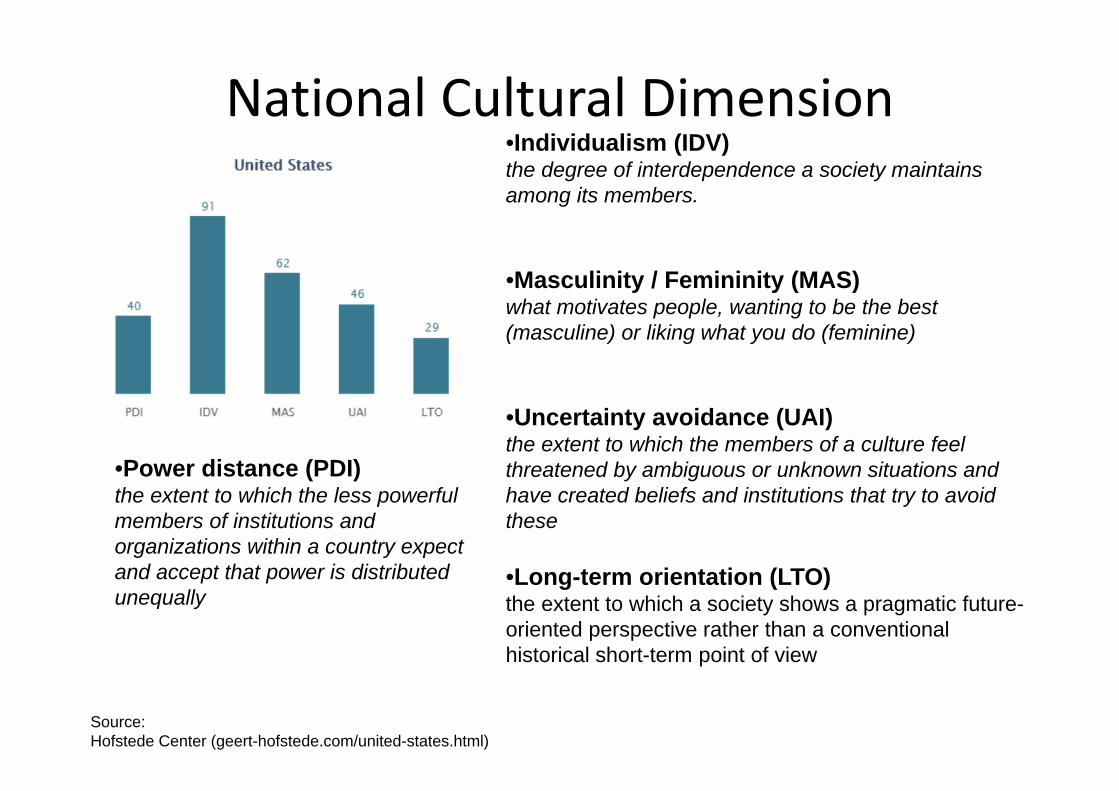
National Cultural Dimension
Source: Hofstede Center (geert-hofstede.com/united-states.html)
•Individualism (IDV)the degree of interdependence a society maintains among its members.
•Masculinity / Femininity (MAS)what motivates people, wanting to be the best (masculine) or liking what you do (feminine)
•Uncertainty avoidance (UAI)the extent to which the members of a culture feel threatened by ambiguous or unknown situations and have created beliefs and institutions that try to avoid these
•Long-term orientation (LTO)the extent to which a society shows a pragmatic future-oriented perspective rather than a conventional historical short-term point of view
•Power distance (PDI)the extent to which the less powerful members of institutions and organizations within a country expect and accept that power is distributed unequally
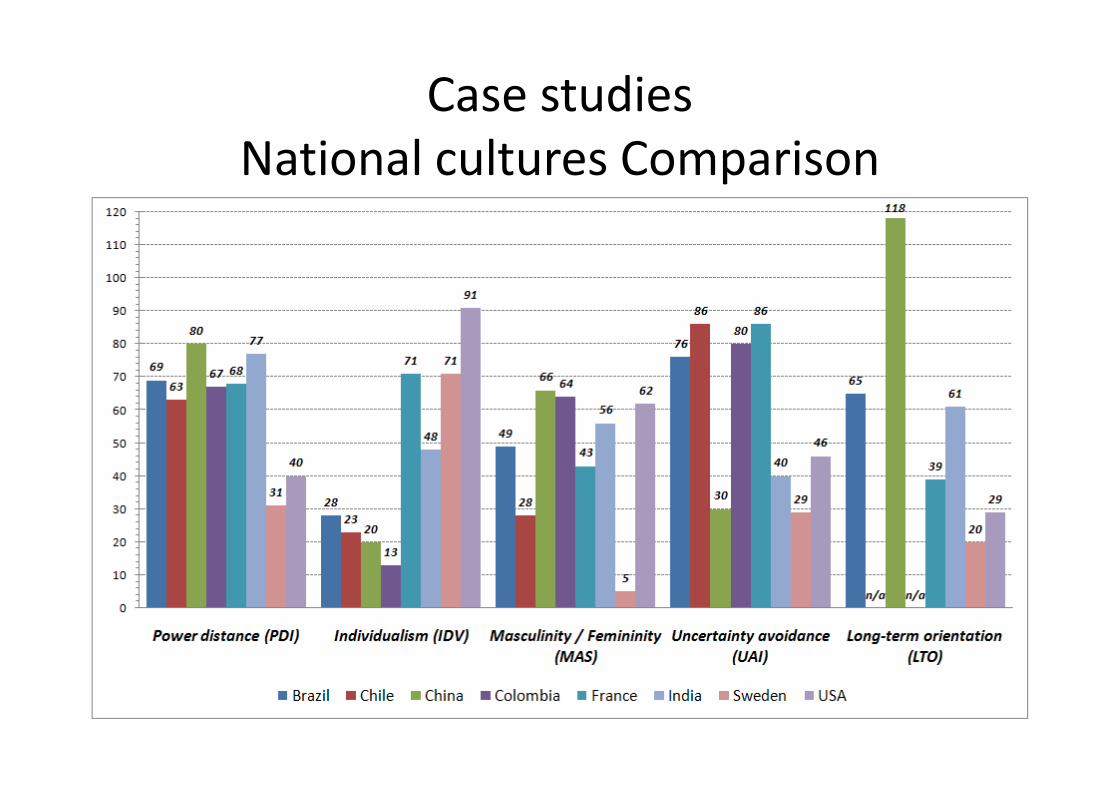
Case studies National cultures Comparison
Case Study: New York City Public TransitIncl. Select Bus Service
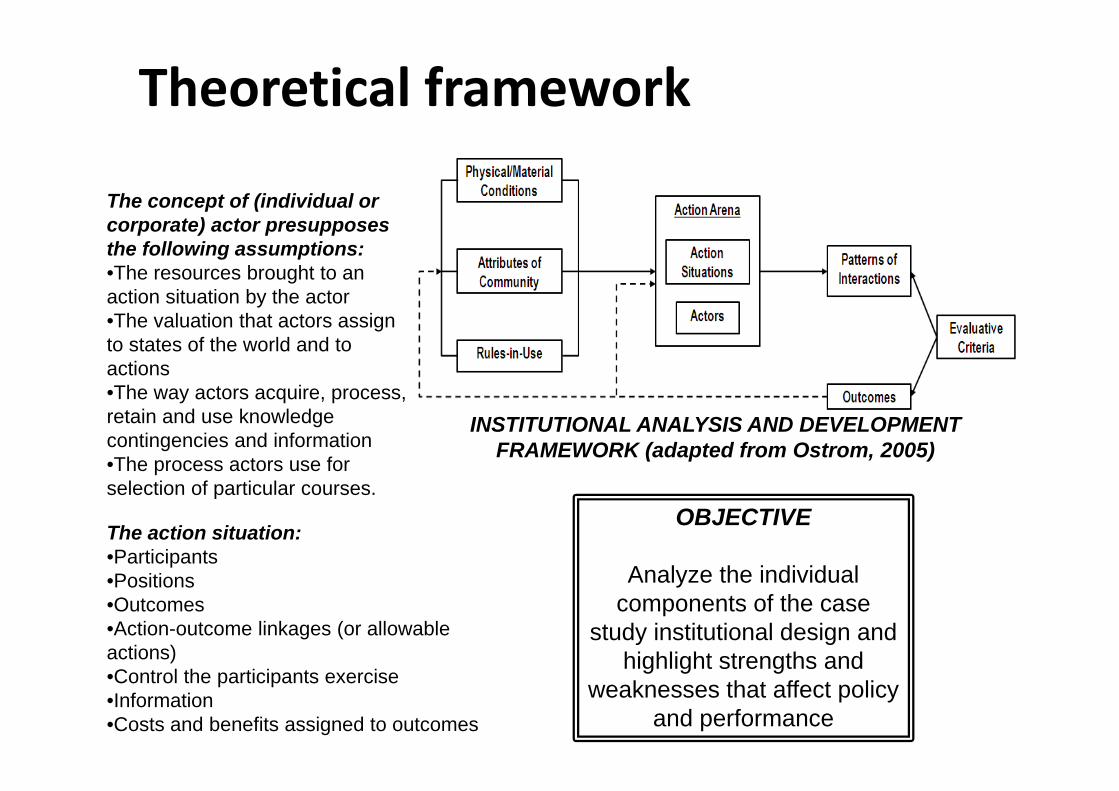
Theoretical framework
INSTITUTIONAL ANALYSIS AND DEVELOPMENT FRAMEWORK (adapted from Ostrom, 2005)
The action situation:•Participants•Positions•Outcomes•Action-outcome linkages (or allowable actions)•Control the participants exercise•Information•Costs and benefits assigned to outcomes
The concept of (individual or corporate) actor presupposes the following assumptions:•The resources brought to an action situation by the actor•The valuation that actors assign to states of the world and to actions•The way actors acquire, process, retain and use knowledge contingencies and information•The process actors use for selection of particular courses.
OBJECTIVE
Analyze the individual components of the case
study institutional design and highlight strengths and
weaknesses that affect policy and performance
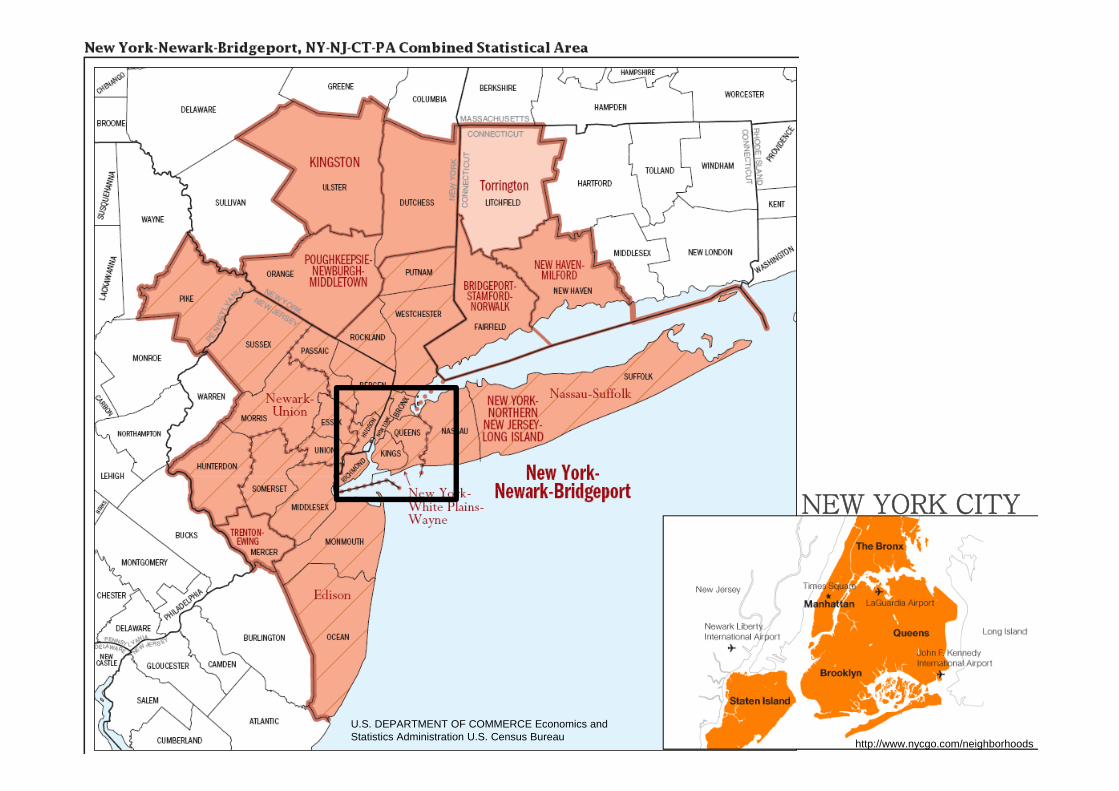
NEW YORK CITY
http://www.nycgo.com/neighborhoods
U.S. DEPARTMENT OF COMMERCE Economics and Statistics Administration U.S. Census Bureau
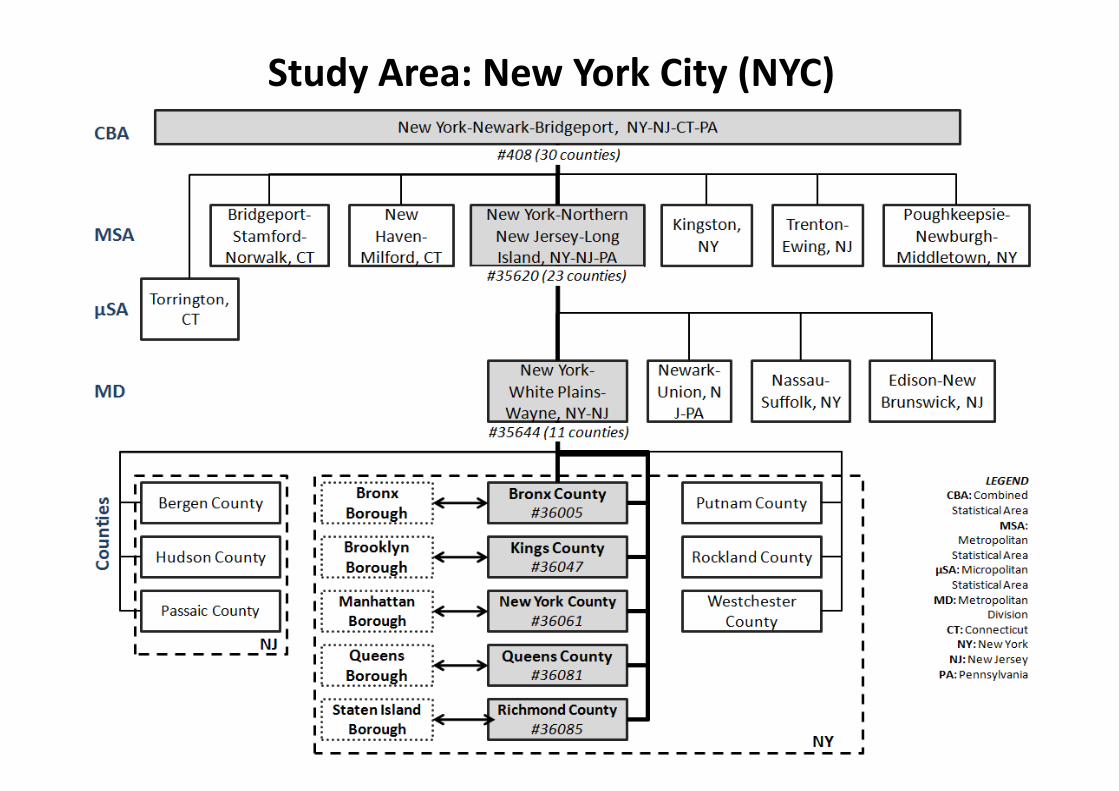
Study Area: New York City (NYC)
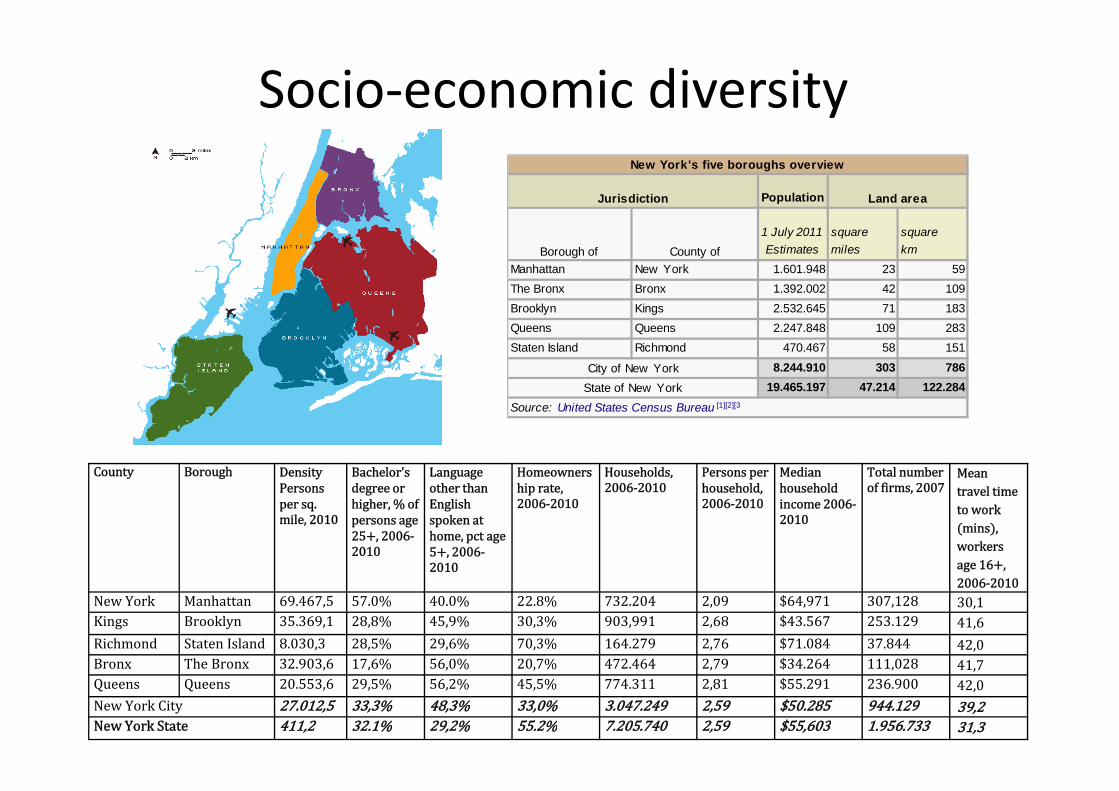
County Borough DensityPersonspersq.mile,2010
Bachelor'sdegreeorhigher,%ofpersonsage25 ,2006‐2010
LanguageotherthanEnglishspokenathome,pctage5 ,2006‐2010
Homeownershiprate,2006‐2010
Households,2006‐2010
Personsperhousehold,2006‐2010
Medianhouseholdincome2006‐2010
Totalnumberoffirms,2007
Meantraveltimetoworkmins ,workersage16 ,2006‐2010
NewYork Manhattan 69.467,5 57.0% 40.0% 22.8% 732.204 2,09 $64,971 307,128 30,1Kings Brooklyn 35.369,1 28,8% 45,9% 30,3% 903,991 2,68 $43.567 253.129 41,6Richmond StatenIsland 8.030,3 28,5% 29,6% 70,3% 164.279 2,76 $71.084 37.844 42,0Bronx TheBronx 32.903,6 17,6% 56,0% 20,7% 472.464 2,79 $34.264 111,028 41,7Queens Queens 20.553,6 29,5% 56,2% 45,5% 774.311 2,81 $55.291 236.900 42,0NewYorkCity 27.012,5 33,3% 48,3% 33,0% 3.047.249 2,59 $50.285 944.129 39,2NewYorkState 411,2 32.1% 29,2% 55.2% 7.205.740 2,59 $55,603 1.956.733 31,3
Socio‐economic diversity
Population
1 July 2011 square squareEstimates miles km
Manhattan New York 1.601.948 23 59The Bronx Bronx 1.392.002 42 109Brooklyn Kings 2.532.645 71 183Queens Queens 2.247.848 109 283Staten Island Richmond 470.467 58 151
8.244.910 303 78619.465.197 47.214 122.284State of New York
Source: United States Census Bureau [1][2][3
New York's five boroughs overview
Borough of
Jurisdiction Land area
County of
City of New York
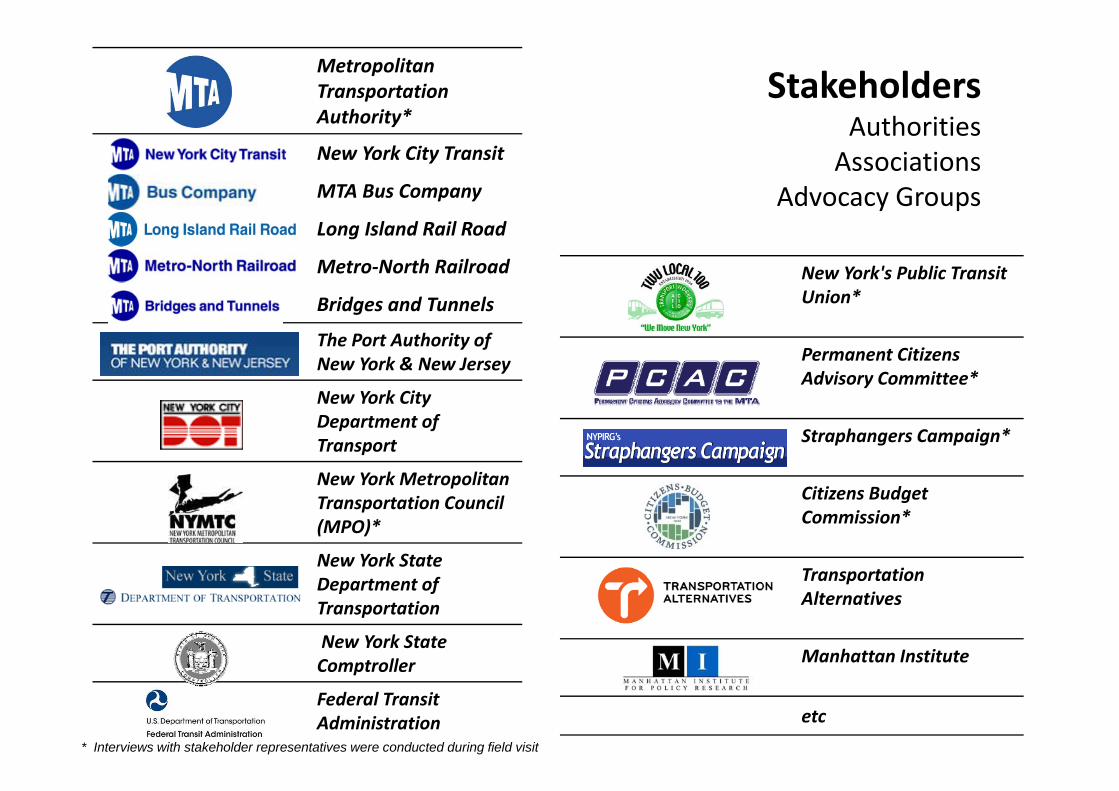
Metropolitan Transportation Authority*
New York City Transit
MTA Bus Company
Long Island Rail Road
Metro‐North Railroad
Bridges and Tunnels
The Port Authority ofNew York & New Jersey
New York CityDepartment ofTransport
New York Metropolitan Transportation Council (MPO)*
New York State Department of Transportation
New York StateComptroller
Federal TransitAdministration
New York's Public Transit Union*
Permanent Citizens Advisory Committee*
Straphangers Campaign*
Citizens Budget Commission*
TransportationAlternatives
Manhattan Institute
etc
StakeholdersAuthoritiesAssociations
Advocacy Groups
* Interviews with stakeholder representatives were conducted during field visit
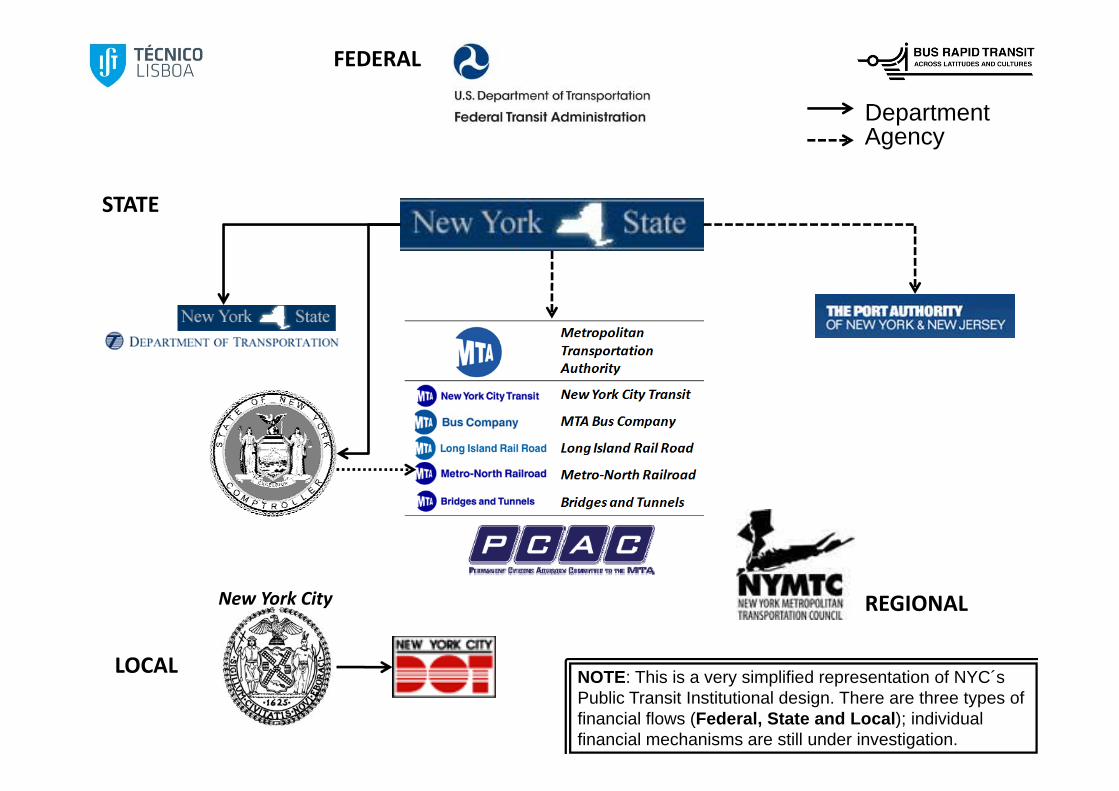
FEDERAL
STATE
REGIONAL
LOCAL
New York City
NOTE: This is a very simplified representation of NYC´s Public Transit Institutional design. There are three types of financial flows (Federal, State and Local); individual financial mechanisms are still under investigation.
DepartmentAgency

NY State Public Transit LegislationPublic Authorities State Law
Transportation State Law
Public Authorities Reform Act of 2009
Public Authorities Accountability Act of
2005
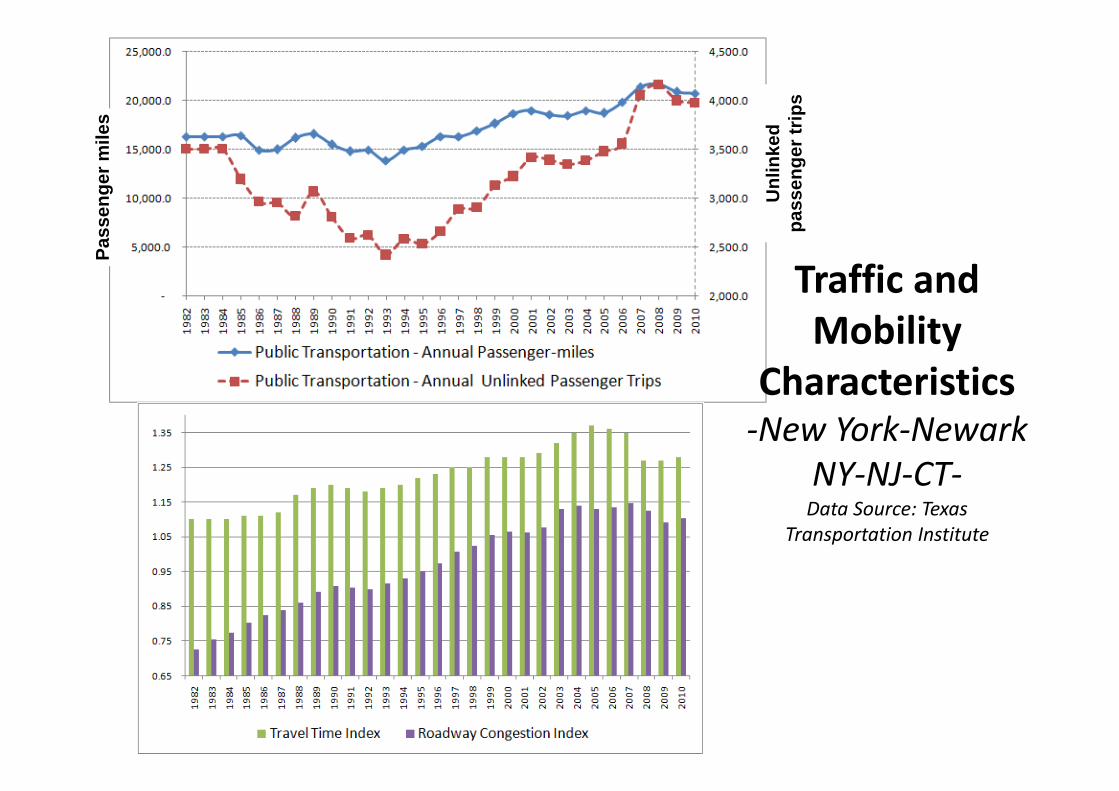
Pass
enge
r mile
s
Traffic and Mobility
Characteristics‐New York‐Newark
NY‐NJ‐CT‐Data Source: Texas
Transportation Institute
Unl
inke
d pa
ssen
ger t
rips
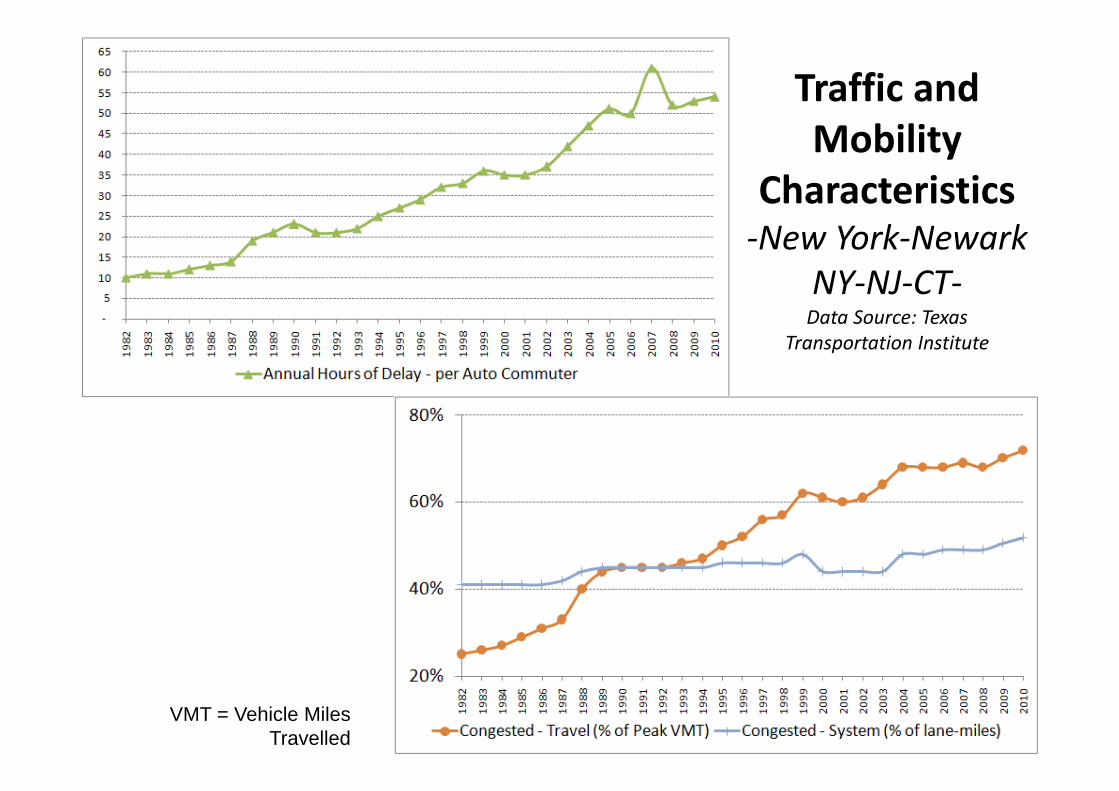
Traffic and Mobility
Characteristics‐New York‐Newark
NY‐NJ‐CT‐Data Source: Texas
Transportation Institute
VMT = Vehicle Miles Travelled

Average weekday bus & rail ridership (trips)

Commuters
Commuters to Manhattan
Figures adapted from Moss, M.L., Qing, C.Y. and Kaufman, S. (2012). Commuting to Manhattan: A study of residence location trends for Manhattan workers from 2002 to 2009. Rudin Center for Transportation Policy and Management, New York University Wagner School of Public Service, March 2012
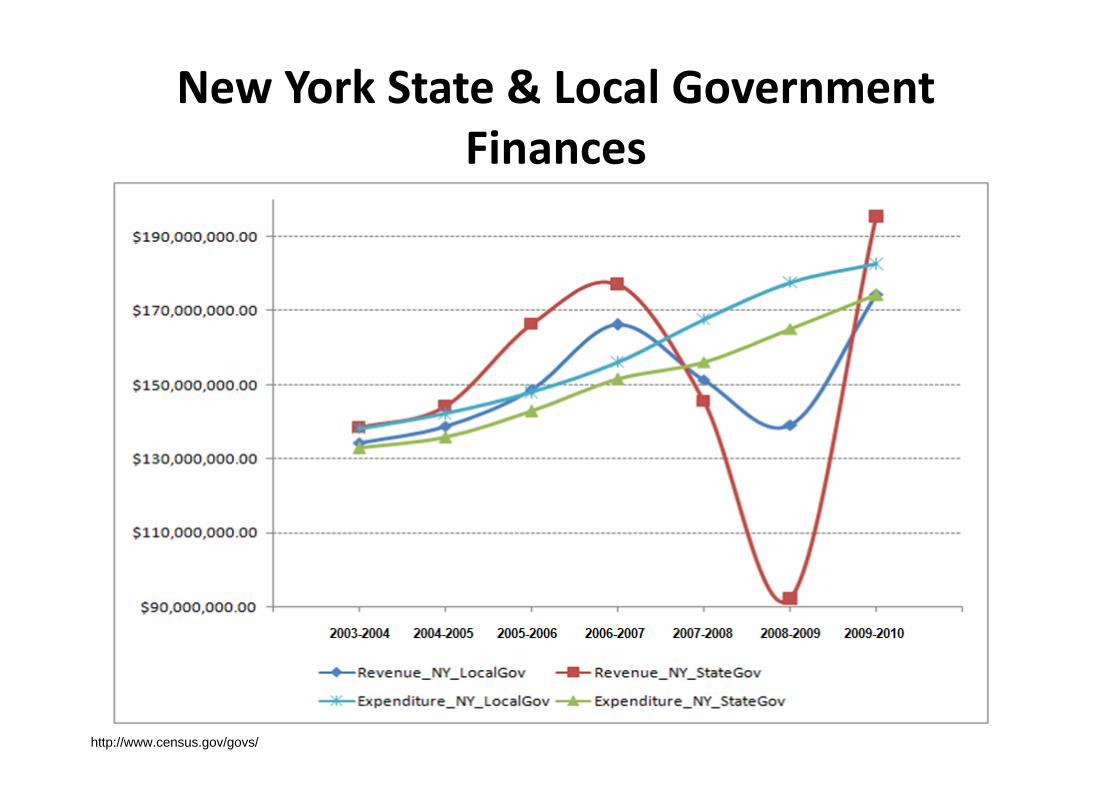
New York State & Local Government Finances
http://www.census.gov/govs/
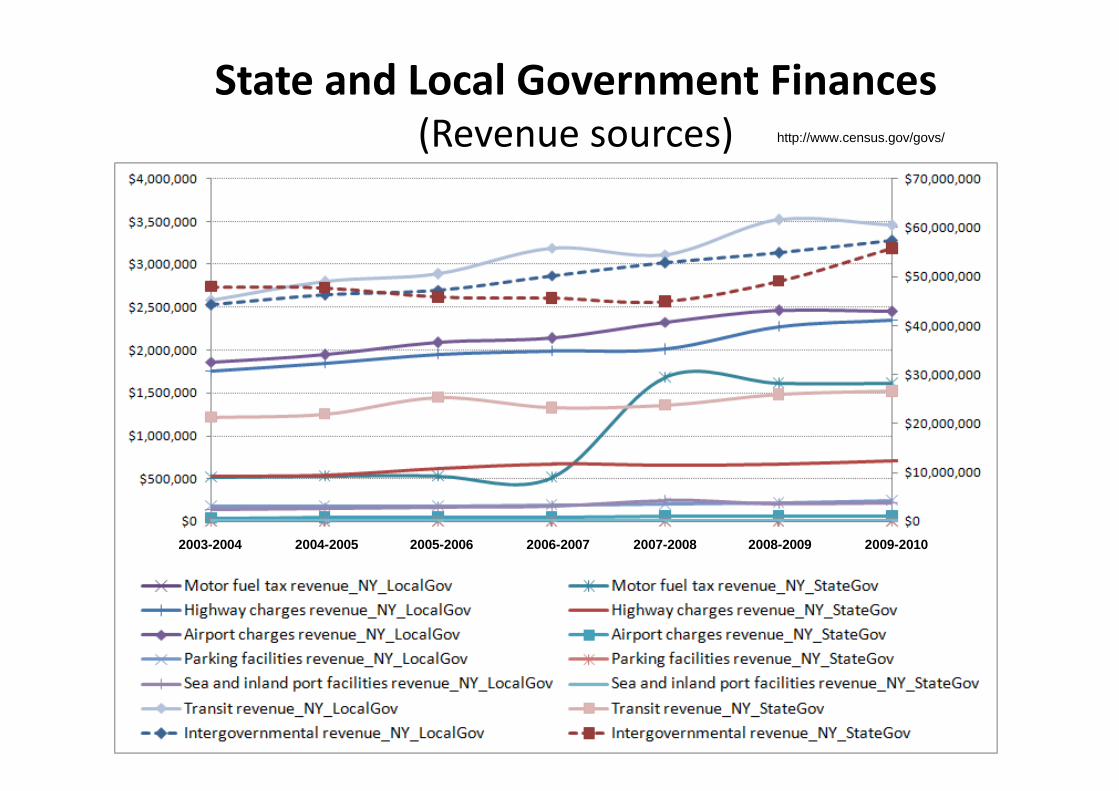
State and Local Government Finances (Revenue sources)
2003-2004 2004-2005 2005-2006 2006-2007 2007-2008 2008-2009 2009-2010
http://www.census.gov/govs/
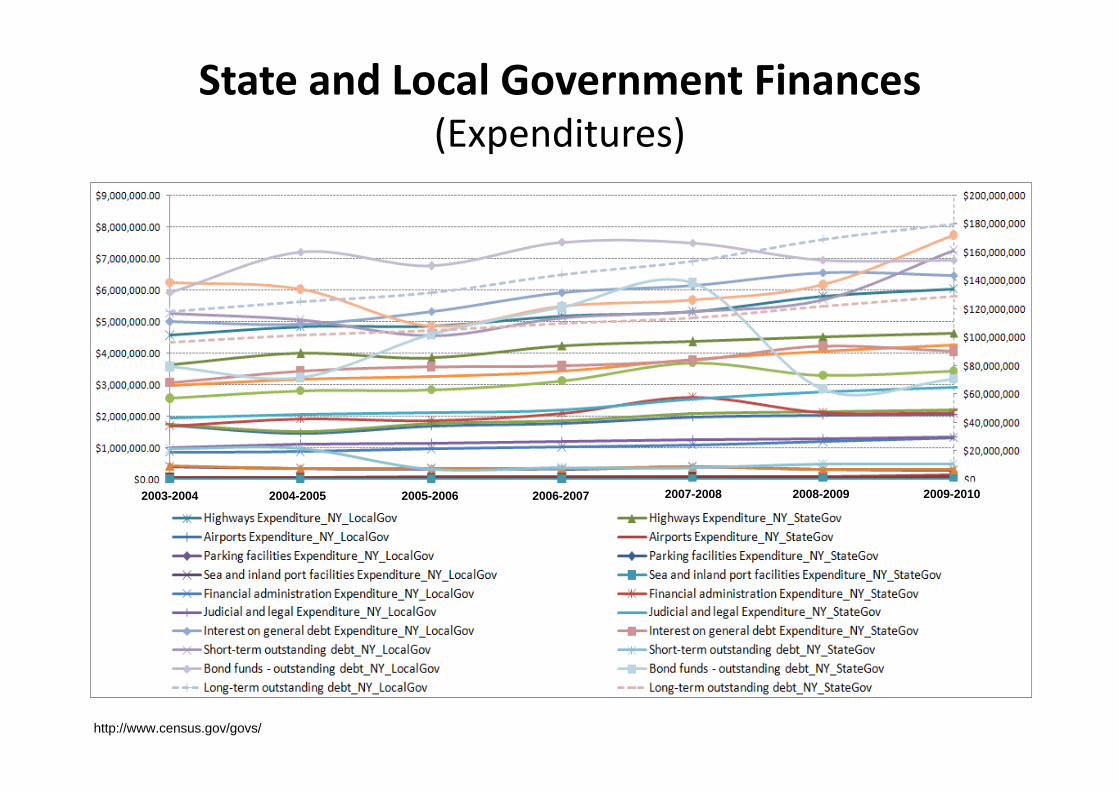
State and Local Government Finances (Expenditures)
http://www.census.gov/govs/
2003-2004 2004-2005 2005-2006 2006-2007 2007-2008 2008-2009 2009-2010
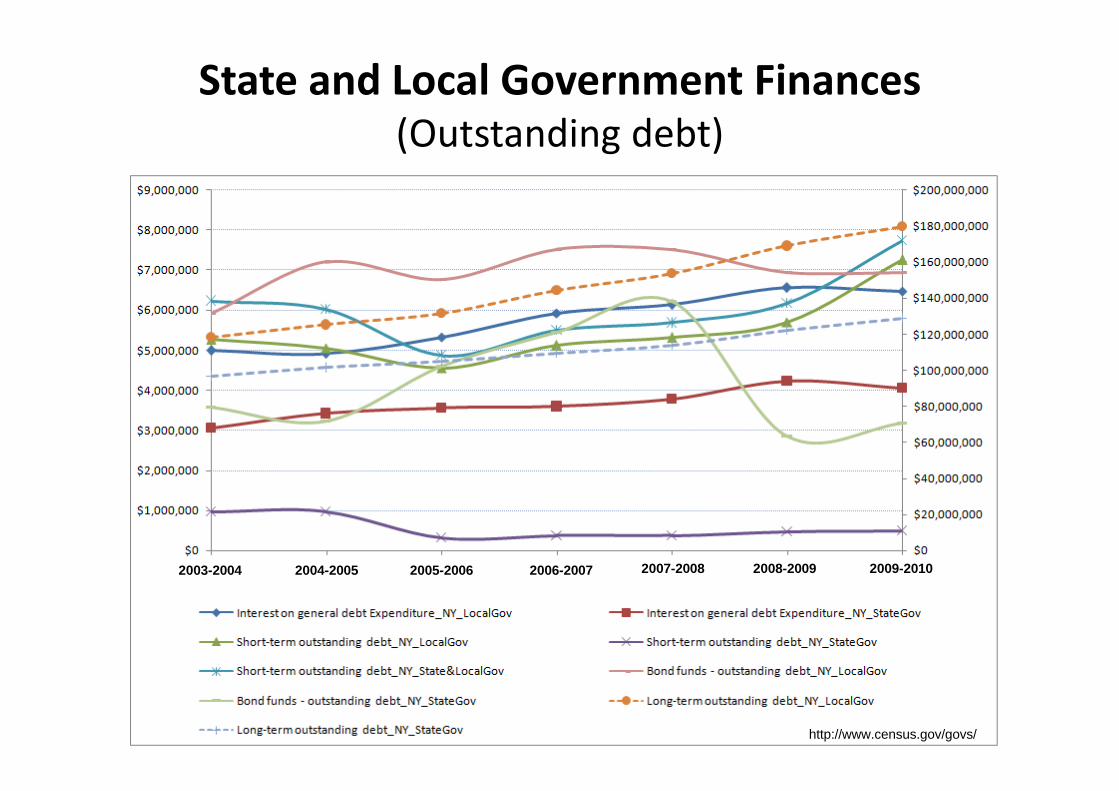
State and Local Government Finances (Outstanding debt)
http://www.census.gov/govs/
2003-2004 2004-2005 2005-2006 2006-2007 2007-2008 2008-2009 2009-2010
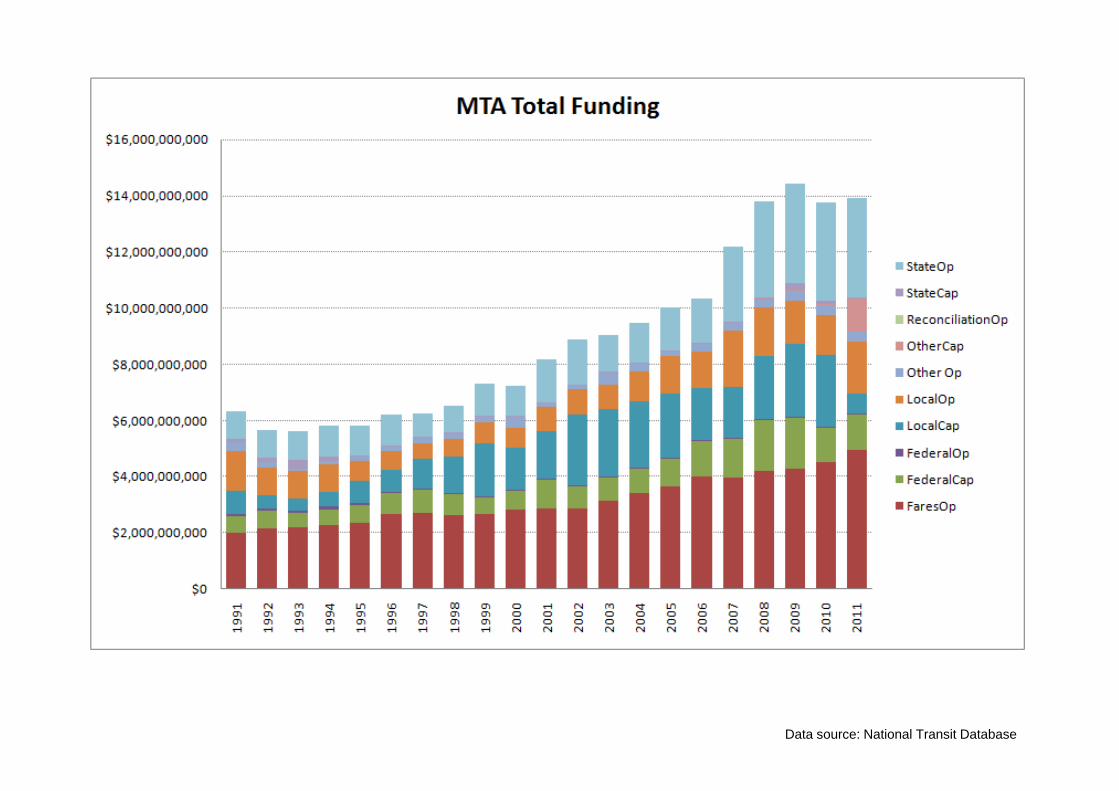
Data source: National Transit Database
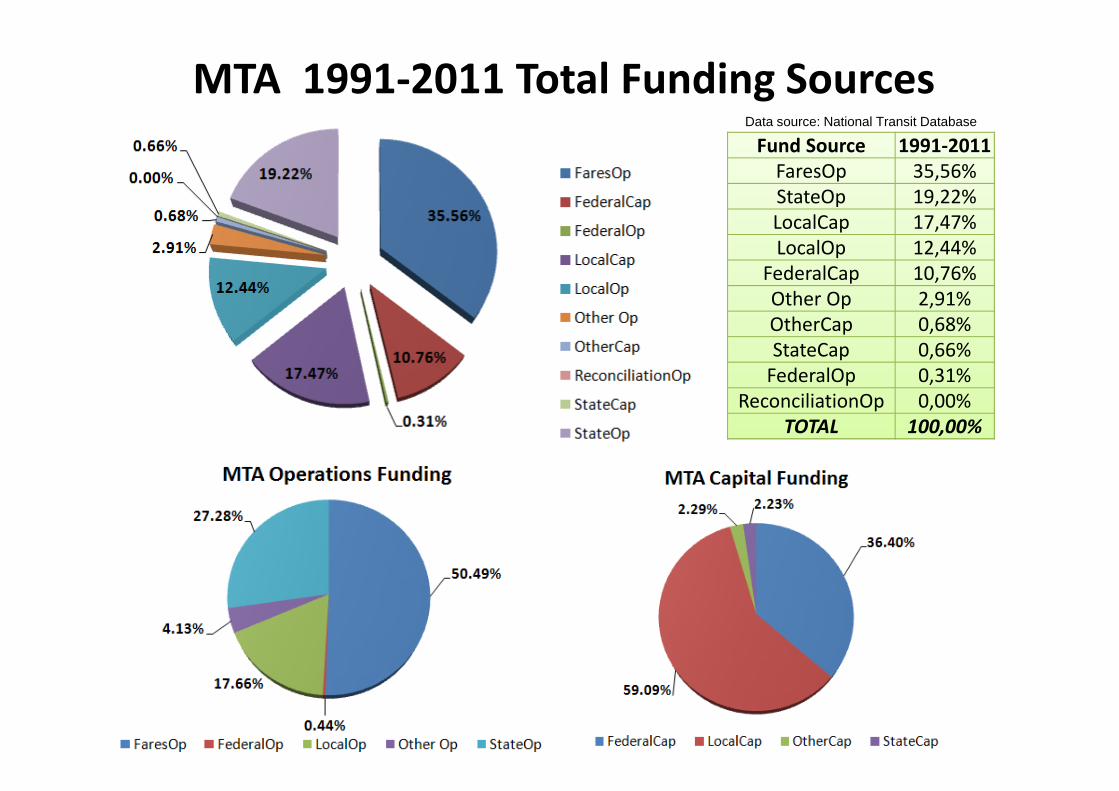
MTA 1991‐2011 Total Funding SourcesFund Source 1991‐2011FaresOp 35,56%StateOp 19,22%LocalCap 17,47%LocalOp 12,44%
FederalCap 10,76%Other Op 2,91%OtherCap 0,68%StateCap 0,66%FederalOp 0,31%
ReconciliationOp 0,00%TOTAL 100,00%
Data source: National Transit Database
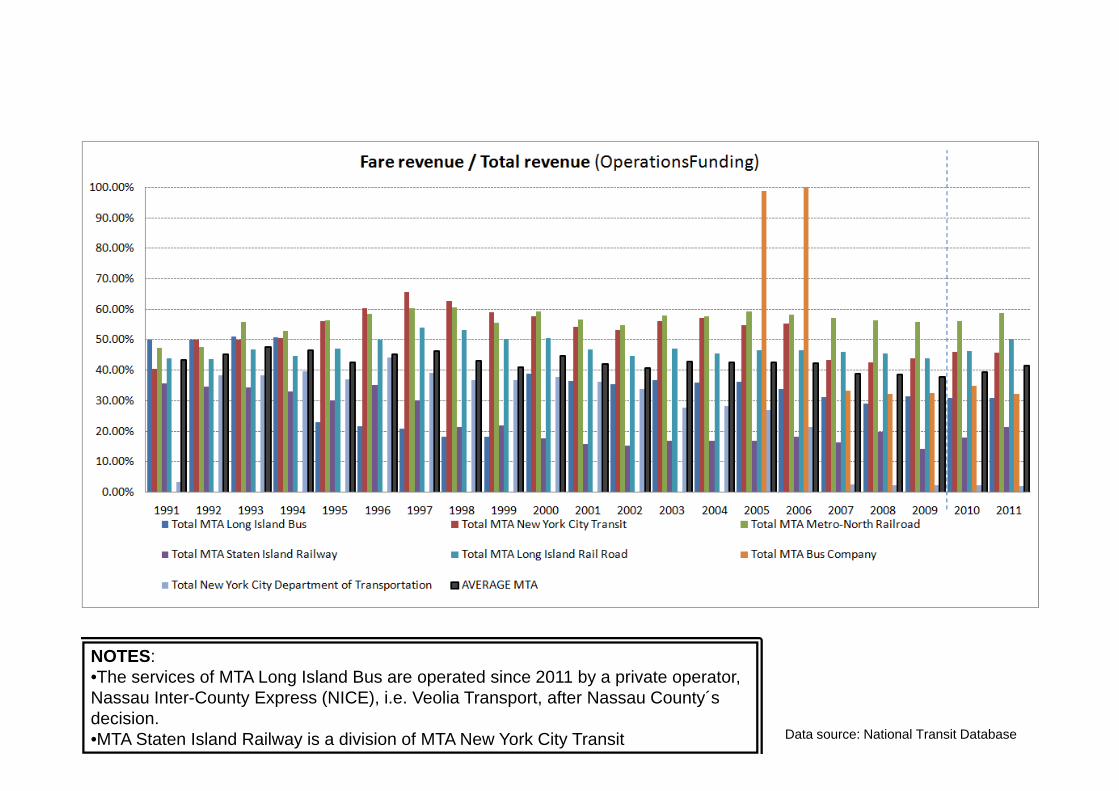
Data source: National Transit Database
NOTES: •The services of MTA Long Island Bus are operated since 2011 by a private operator, Nassau Inter-County Express (NICE), i.e. Veolia Transport, after Nassau County´s decision.•MTA Staten Island Railway is a division of MTA New York City Transit
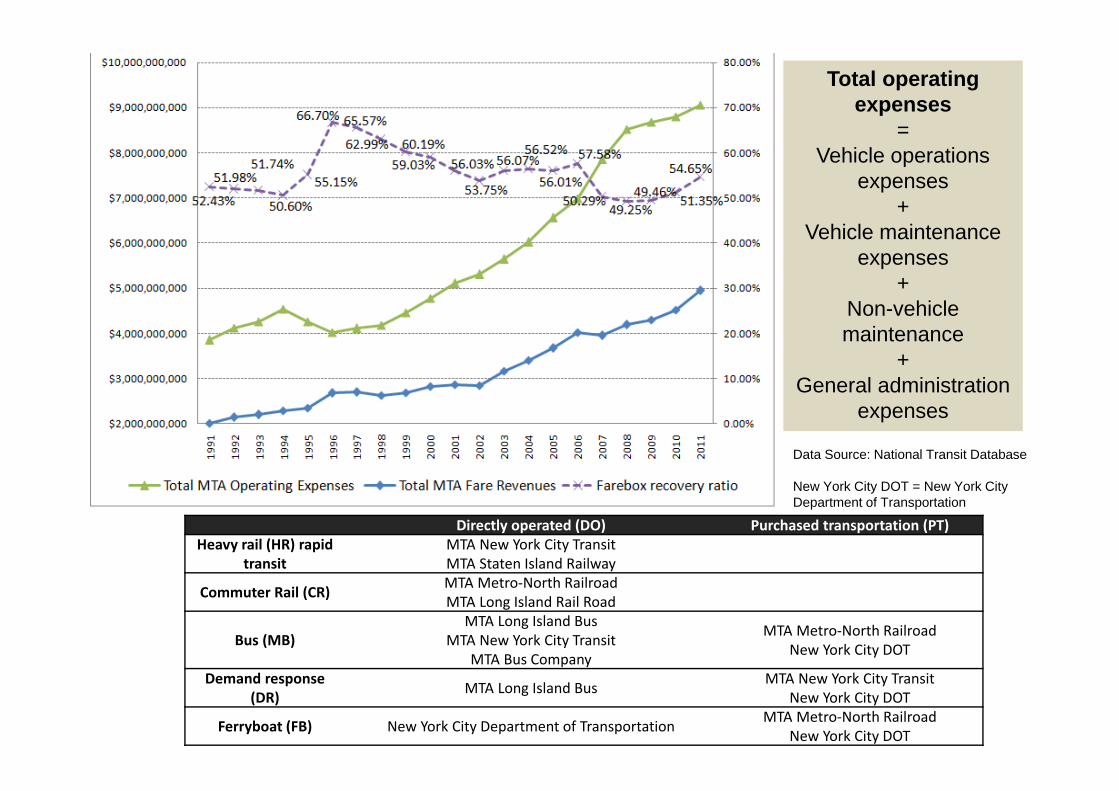
Data Source: National Transit Database
New York City DOT = New York City Department of Transportation
Total operating expenses
= Vehicle operations
expenses+
Vehicle maintenance expenses
+Non-vehicle maintenance
+General administration
expenses
Directly operated (DO) Purchased transportation (PT)Heavy rail (HR) rapid
transitMTA New York City TransitMTA Staten Island Railway
Commuter Rail (CR) MTA Metro‐North RailroadMTA Long Island Rail Road
Bus (MB)MTA Long Island Bus
MTA New York City TransitMTA Bus Company
MTA Metro‐North RailroadNew York City DOT
Demand response (DR) MTA Long Island Bus MTA New York City Transit
New York City DOT
Ferryboat (FB) New York City Department of Transportation MTA Metro‐North RailroadNew York City DOT
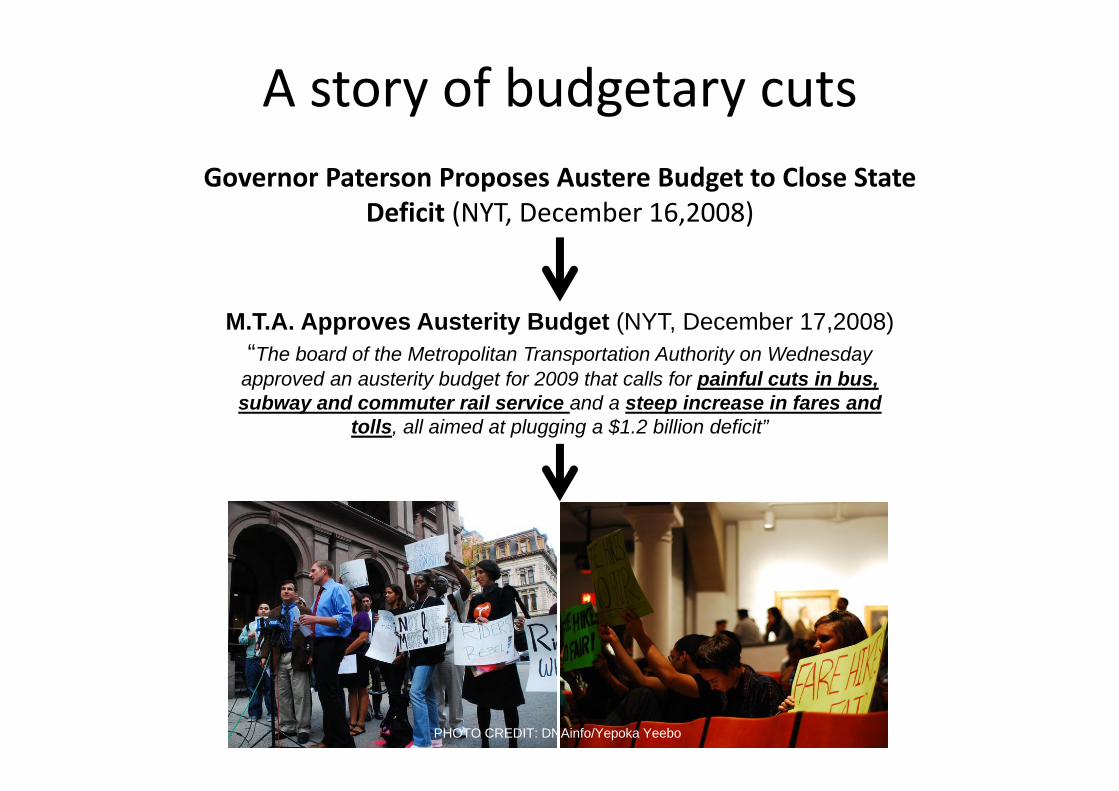
A story of budgetary cutsGovernor Paterson Proposes Austere Budget to Close State
Deficit (NYT, December 16,2008)
“The board of the Metropolitan Transportation Authority on Wednesday approved an austerity budget for 2009 that calls for painful cuts in bus, subway and commuter rail service and a steep increase in fares and
tolls, all aimed at plugging a $1.2 billion deficit”
M.T.A. Approves Austerity Budget (NYT, December 17,2008)
PHOTO CREDIT: DNAinfo/Yepoka Yeebo
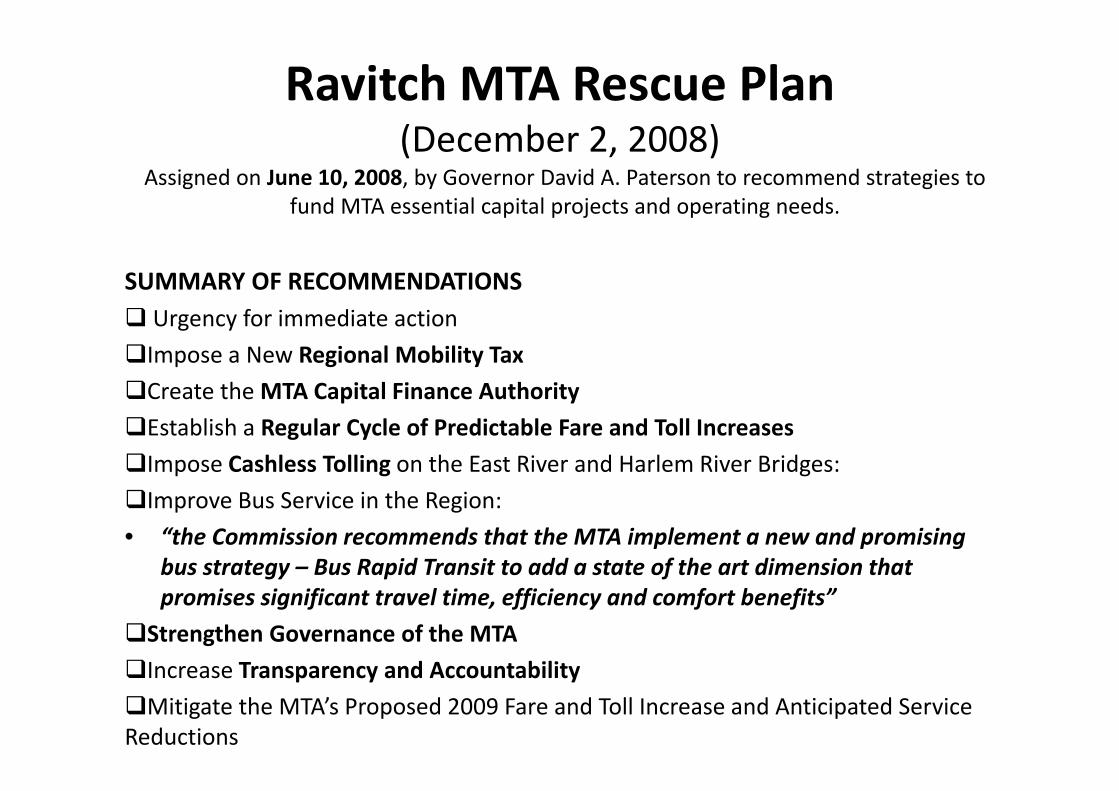
Ravitch MTA Rescue Plan (December 2, 2008)
Assigned on June 10, 2008, by Governor David A. Paterson to recommend strategies to fund MTA essential capital projects and operating needs.
SUMMARY OF RECOMMENDATIONS Urgency for immediate actionImpose a New Regional Mobility TaxCreate the MTA Capital Finance AuthorityEstablish a Regular Cycle of Predictable Fare and Toll IncreasesImpose Cashless Tolling on the East River and Harlem River Bridges:Improve Bus Service in the Region:• “the Commission recommends that the MTA implement a new and promising
bus strategy – Bus Rapid Transit to add a state of the art dimension that promises significant travel time, efficiency and comfort benefits”
Strengthen Governance of the MTAIncrease Transparency and AccountabilityMitigate the MTA’s Proposed 2009 Fare and Toll Increase and Anticipated Service Reductions
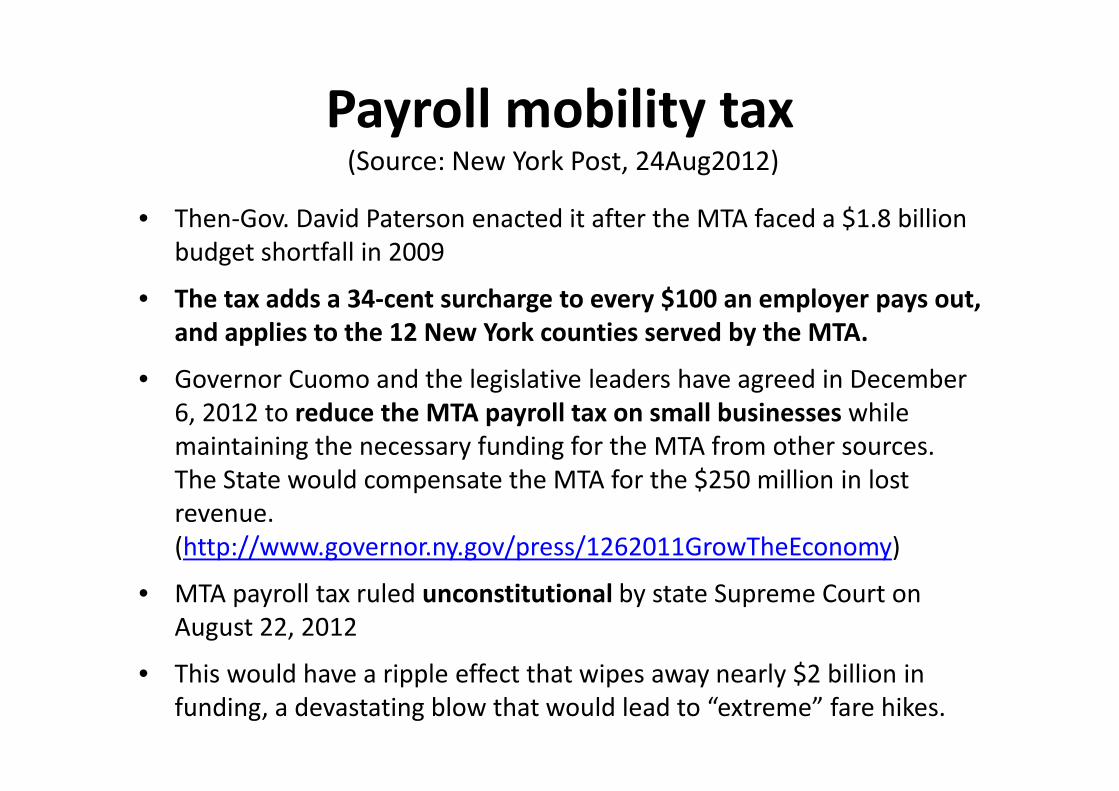
Payroll mobility tax(Source: New York Post, 24Aug2012)
• Then‐Gov. David Paterson enacted it after the MTA faced a $1.8 billion budget shortfall in 2009
• The tax adds a 34‐cent surcharge to every $100 an employer pays out, and applies to the 12 New York counties served by the MTA.
• Governor Cuomo and the legislative leaders have agreed in December 6, 2012 to reduce the MTA payroll tax on small businesses while maintaining the necessary funding for the MTA from other sources. The State would compensate the MTA for the $250 million in lost revenue. (http://www.governor.ny.gov/press/1262011GrowTheEconomy)
• MTA payroll tax ruled unconstitutional by state Supreme Court on August 22, 2012
• This would have a ripple effect that wipes away nearly $2 billion in funding, a devastating blow that would lead to “extreme” fare hikes.
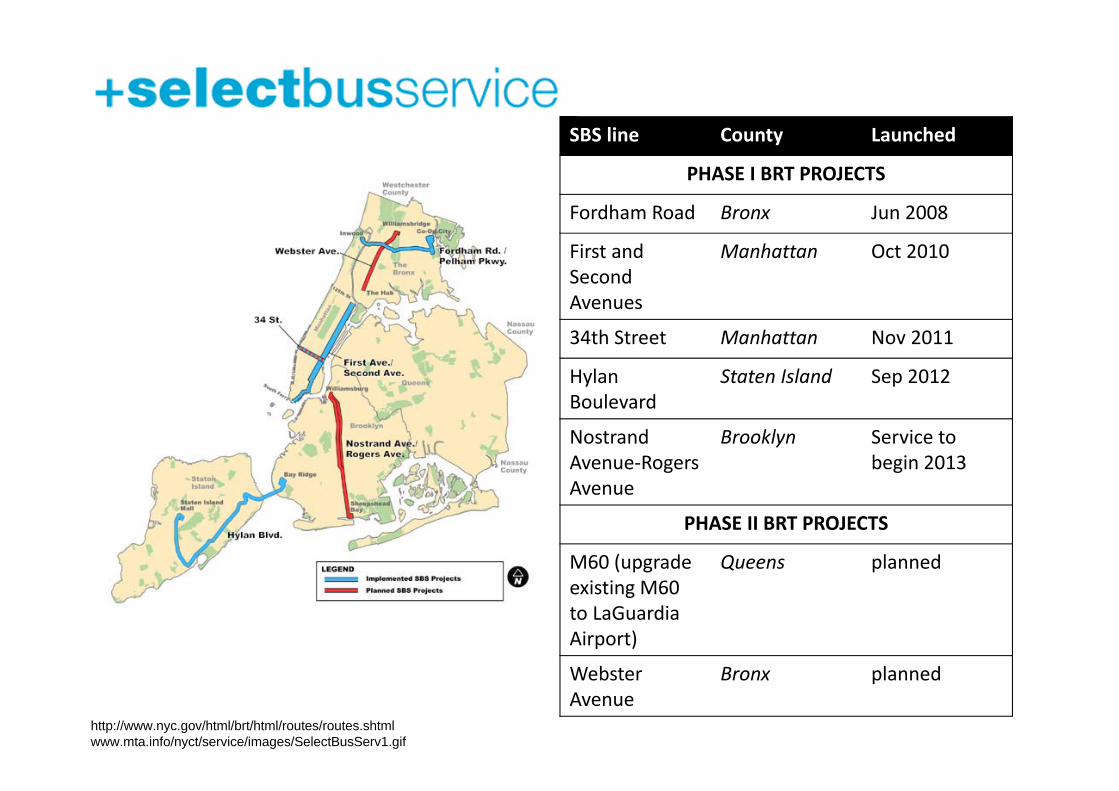
SBS line County Launched
PHASE I BRT PROJECTS
Fordham Road Bronx Jun 2008
First and Second Avenues
Manhattan Oct 2010
34th Street Manhattan Nov 2011
HylanBoulevard
Staten Island Sep 2012
NostrandAvenue‐Rogers Avenue
Brooklyn Service to begin 2013
PHASE II BRT PROJECTS
M60 (upgrade existing M60 to LaGuardia Airport)
Queens planned
Webster Avenue
Bronx planned
http://www.nyc.gov/html/brt/html/routes/routes.shtmlwww.mta.info/nyct/service/images/SelectBusServ1.gif
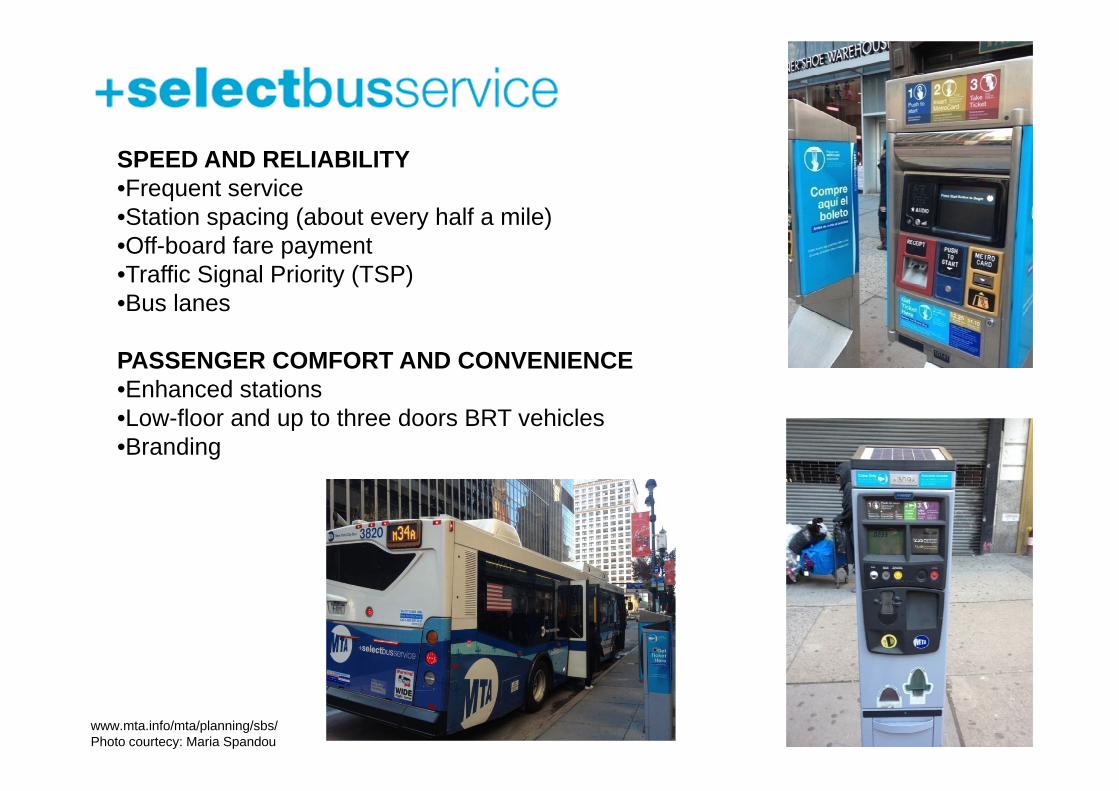
www.mta.info/mta/planning/sbs/Photo courtecy: Maria Spandou
SPEED AND RELIABILITY•Frequent service•Station spacing (about every half a mile)•Off-board fare payment•Traffic Signal Priority (TSP) •Bus lanes
PASSENGER COMFORT AND CONVENIENCE•Enhanced stations•Low-floor and up to three doors BRT vehicles•Branding
Interesting Issues highlighted during the interviews (I)
CULTURAL / INSTITUTIONAL• Cultural barriers ‐ “Public goods provided by the public sector”
philosophy• Clarification of role ‐ Governor´s de jure and de facto role and
influence• In people´s perceptions MTA is supervised by the City of New York,
instead of the NY State (Governor)
FINANCIAL• Unstable and uncertain financial flows• Competition within NY state counties for funding and financing, in the
form of negotiations• Money availability ‐ Funds Appropriation processes are timely• Debt increase ‐ Bond issuing affected strongly MTA´s financial situation
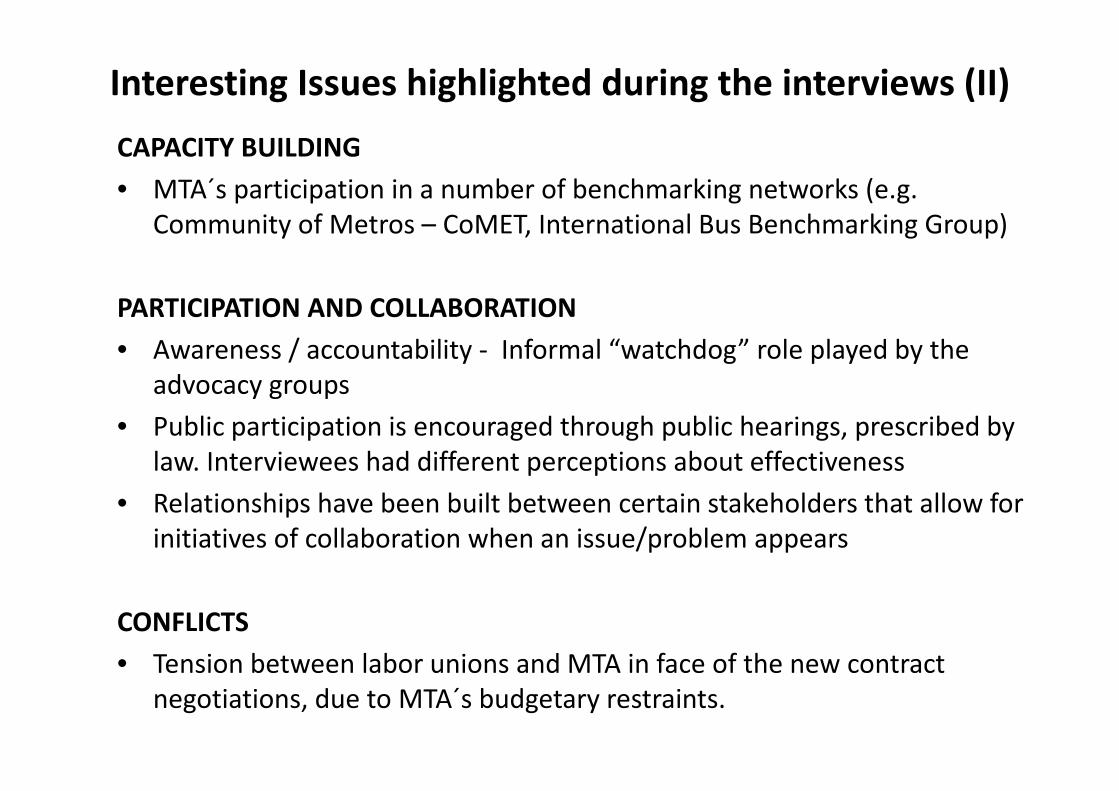
Interesting Issues highlighted during the interviews (II)CAPACITY BUILDING• MTA´s participation in a number of benchmarking networks (e.g.
Community of Metros – CoMET, International Bus Benchmarking Group)
PARTICIPATION AND COLLABORATION• Awareness / accountability ‐ Informal “watchdog” role played by the
advocacy groups• Public participation is encouraged through public hearings, prescribed by
law. Interviewees had different perceptions about effectiveness• Relationships have been built between certain stakeholders that allow for
initiatives of collaboration when an issue/problem appears
CONFLICTS• Tension between labor unions and MTA in face of the new contract
negotiations, due to MTA´s budgetary restraints.
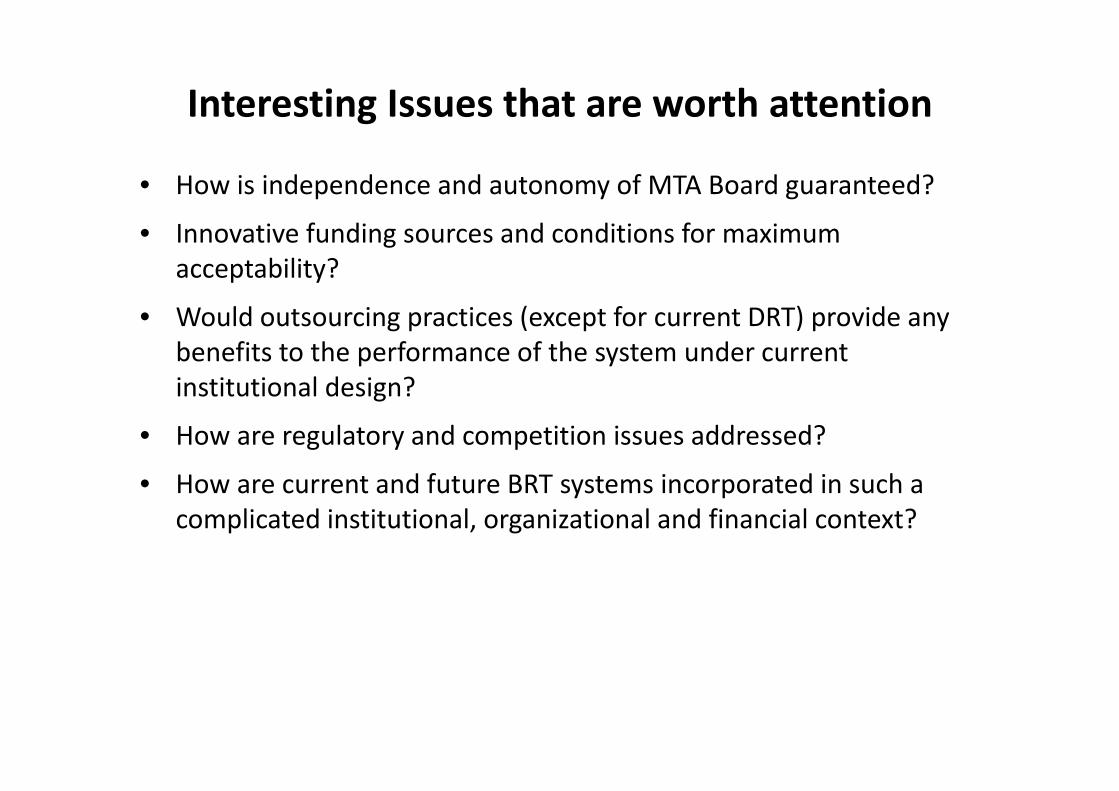
Interesting Issues that are worth attention
• How is independence and autonomy of MTA Board guaranteed?
• Innovative funding sources and conditions for maximum acceptability?
• Would outsourcing practices (except for current DRT) provide any benefits to the performance of the system under current institutional design?
• How are regulatory and competition issues addressed?
• How are current and future BRT systems incorporated in such a complicated institutional, organizational and financial context?
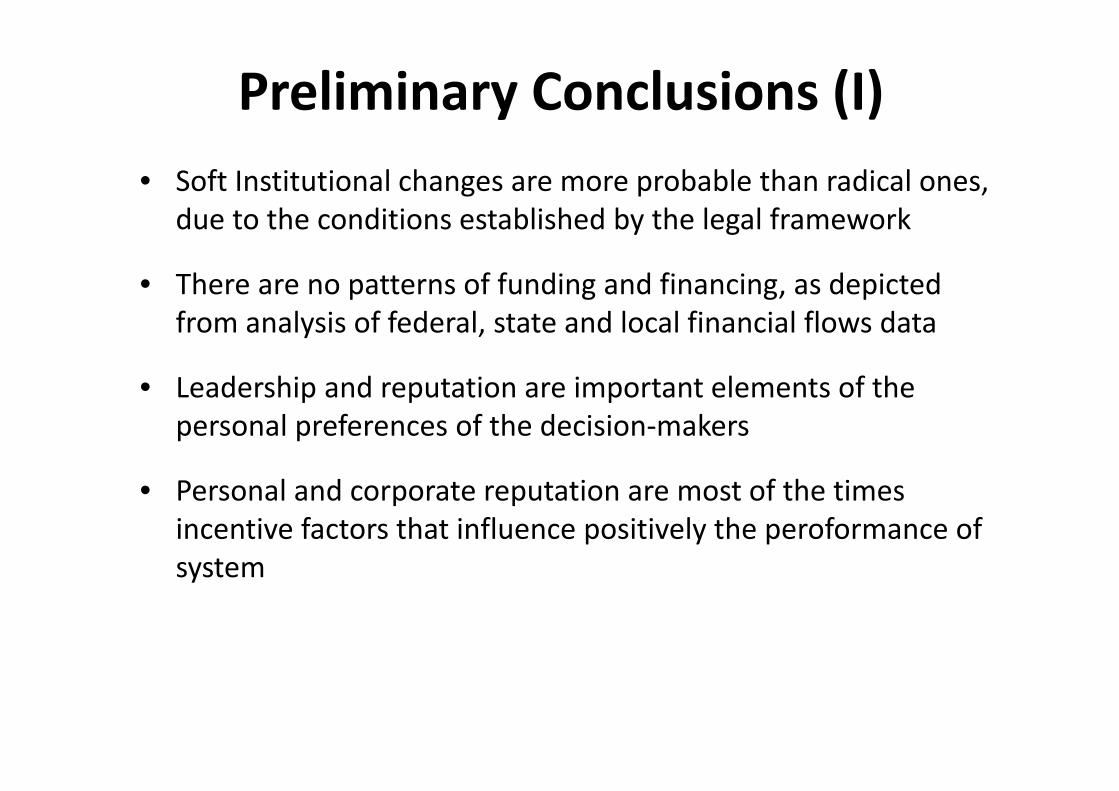
Preliminary Conclusions (I)• Soft Institutional changes are more probable than radical ones,
due to the conditions established by the legal framework
• There are no patterns of funding and financing, as depicted from analysis of federal, state and local financial flows data
• Leadership and reputation are important elements of the personal preferences of the decision‐makers
• Personal and corporate reputation are most of the times incentive factors that influence positively the peroformance of system
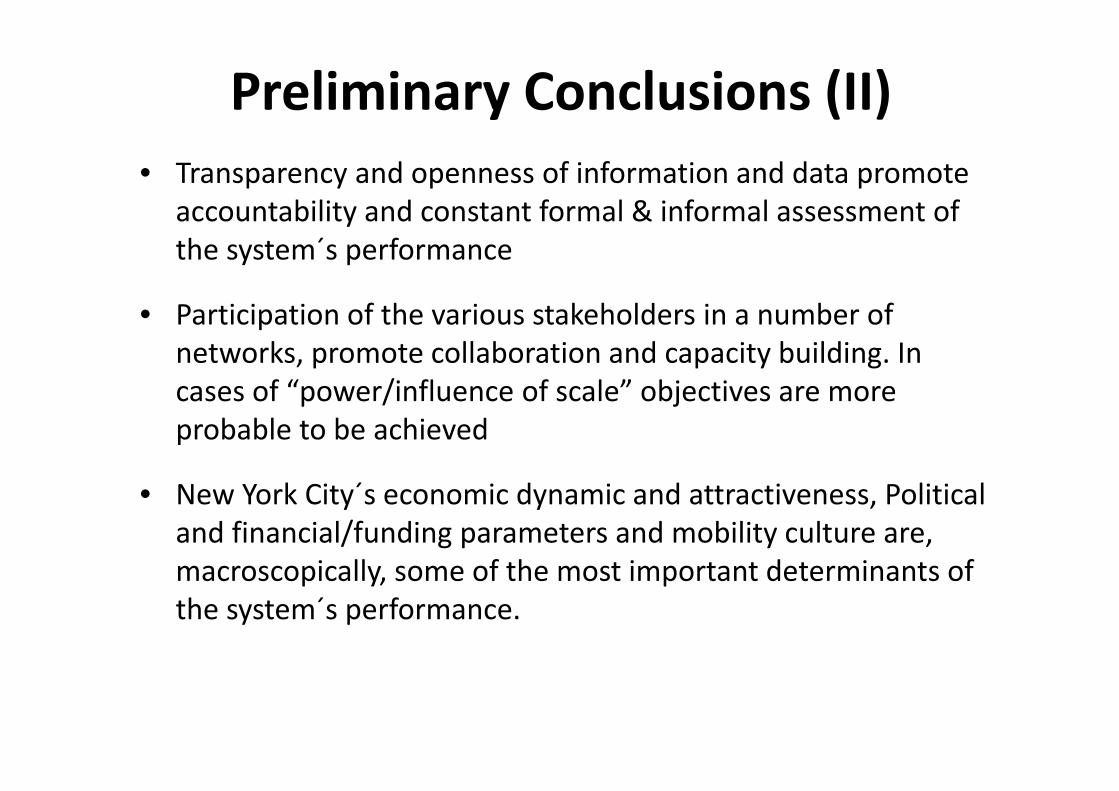
Preliminary Conclusions (II)• Transparency and openness of information and data promote
accountability and constant formal & informal assessment of the system´s performance
• Participation of the various stakeholders in a number of networks, promote collaboration and capacity building. In cases of “power/influence of scale” objectives are more probable to be achieved
• New York City´s economic dynamic and attractiveness, Political and financial/funding parameters and mobility culture are, macroscopically, some of the most important determinants of the system´s performance.
Bus Rapid Transit Across Latitudes and Cultures
VREF Center of Excellence
Thank you for your attention !
Prof. Rosário Macário [email protected]
Luís N. Filipe (Transantiago)[email protected]
Maria Spandou (New York City)[email protected]