Lowering Drinking Age - Ministry of Justice
39
Young People and Alcohol: Some Statistics on Possible Effects of Lowering the Drinking Age Barb Lash
Transcript of Lowering Drinking Age - Ministry of Justice

Young People and Alcohol:Some Statistics on Possible Effects
of Lowering the Drinking Age
Barb Lash

2
First published in October 2002 by theResearch and Evaluation Unit
Ministry of JusticePO Box 180Wellington
New Zealand
© Crown Copyright
ISSN 1175-9984

3
Contents
Executive Summary 51 Introduction 9
1.1 Legal background 91.2 Alcohol available for consumption 91.3 Scope of the report 10
2 Drinking behaviour of young New Zealanders 112.1 Drinking by those aged 14 – 15 years 112.2 Drinking by those aged 16 – 17 years 112.3 Drinking by those aged 18 – 19 years 122.4 Information from national surveys of drug use in New Zealand 1998 and 2001 12
3 Indicators of alcohol-related offending by minors 133.1 Minors drinking or possessing alcohol for consumption in a public place 133.2 Minors in restricted or supervised areas of licensed premises 153.3 Purchasing of liquor from licensed premises by minors 163.4 Offences related to minors committed by managers, licensees or employees
under the Sale of Liquor Act 1989 18
4 Indicators of alcohol-related offending by minors and all ages - disorderlybehaviour 21
5 Indicators of alcohol-related traffic offending by those under 20 years old andall ages 25
6 Indicators of age-verification practices 297 Health indicators of alcohol-related harm for minors and all ages 31
7.1 Alcohol-related hospitalisations 317.2 Auckland Hospital Emergency Department experience of alcohol abuse 32
8 Educational indicators of alcohol-related harm to minors 359 Conclusions 37References 39
Tables
Table 1.1 Alcohol available for consumption 10Table 3.1 Number of apprehensions and infringement notices for minors under 18 years
old drinking or possessing alcohol for consumption in public places,1994 - 2001 13
Table 3.2 Number of apprehensions and infringement notices for minors under 18 yearsold in restricted or supervised areas of licensed premises, 1994 - 2001 15
Table 3.3 Number of apprehensions and infringement notices for minors under 18 yearsold purchasing liquor from licensed premises, 1994 - 2001 17
Table 3.4 Convictions and apprehensions for offences related to minors committed bymanagers, licensees or employees under the Sale of Liquor Act 1989,1992 - 2001 19

4
Table 4.1 Number of apprehensions for disorderly behaviour for those under 18 yearsold, and percentage of all disorderly behaviour apprehensions, 1994 - 2001 21
Table 4.2 Number of convictions for disorderly behaviour for those between 18 and 19years old, and percentage of all disorderly behaviour convictions, 1992 - 2001 22
Table 5.1 Prosecutions for driving with excess breath or blood alcohol, 1992 - 2001 25Table 5.2 Number and percentage of 15 - 19 year old drivers involved in crashes who
had alcohol recorded as a factor, 1992 - 2001 27Table 5.3 Percentage of drivers aged under 20 exceeding their legal breath alcohol limit
from random roadside breath-testing data 28Table 6.1 Number of sales made to 18 year olds without 'evidence of age documents' in
Auckland cities and rural districts by type of premise 29Table 6.2 Requests for 'evidence of age documents' from those under 20 years old, as a
proportion of drinking occasions in licensed locations, by type of licensedlocation 30
Table 6.3 Requests for 'evidence of age documents' from those under 20 years old, as aproportion of successful purchases at takeaway outlets, by type of licensedlocation 30
Table 7.1 Number and percentage of publicly-funded hospitalisations where the primarydiagnosis was alcohol-related, for those aged 15 - 19 years, 1996 - 2000 31
Table 7.2 Presentations at Auckland Hospital Emergency Department before and afterthe Sale of Liquor Amendment Act 1999 32
Table 8.1 Stand-downs and suspensions for alcohol in schools, 2000 - 2001 35
Figures
Figure 3.1 Number of apprehensions and infringement notices for minors under 18 yearsold drinking or possessing alcohol for consumption in public places,1994 - 2001 14
Figure 3.2 Number of apprehensions and infringement notices for minors under 18 yearsold in restricted or supervised areas of licensed premises, 1994 - 2001 16
Figure 3.3 Number of apprehensions and infringement notices for minors under 18 yearsold purchasing liquor from licensed premises, 1994 - 2001 18
Figure 3.4 Convictions for offences related to minors committed by managers, licenseesor employees under the Sale of Liquor Act 1989, 1992 – 2001 20
Figure 4.1 Number of apprehensions for disorderly behaviour for those under 18 yearsold, 1994 - 2001 22
Figure 4.2 Number of convictions for disorderly behaviour for 18 and 19 year olds,1992 - 2001 23
Figure 5.1 Prosecutions for offences committed by those under 20 years old for drivingwith excess breath or blood alcohol, 1992 - 2001 26
Figure 5.2 Number of 15 - 19 year old drivers involved in crashes who had alcoholrecorded as a factor, 1992 - 2001 27

5
Executive SummaryLegal background
The Sale of Liquor Amendment Act 1999 introduced a number of major changes that cameinto effect on 1 December 1999 concerning the minimum age that people may legally drinkalcohol. Firstly, the legal minimum drinking age was lowered from 20 years to 18 years withone exception. Secondly, some offences involving minors became infringement offenceswhere the person may either be prosecuted through the court system, or an infringementnotice may be issued. A definition of 'evidence of age documents' was also introduced.
Alcohol available for consumption
In 2000, following the law change, the volume of alcoholic beverage available forconsumption was 1.5 percent lower than in 1999. However, in 2001 the volume was 0.8%higher than in 2000. The volume of spirit-based drinks available for consumption hasincreased in each year following the law change.
Scope of the report
The first version of this report was published in 2002 (Lash 2002). This report updates theearlier report with new information and the inclusion, where possible, of another year of data.Some statistics on the possible effects of the Sale of Liquor Amendment Act 1999 arepresented, focusing on the lowering of the drinking age. The statistics presented are mostlylimited to those routinely collected on a national basis. The statistics do not explicitlymeasure the impact of lowering the minimum legal drinking age, rather, they are indicators ofthe possible impact. Changes in indicator levels over time may be due to other factors, suchas changes in Police practices or recording practices. At best, statistical information wasavailable for two years following the law change. For these reasons the statistics presented inthe report represent only a partial picture of the likely impact of lowering the drinking age.
Drinking behaviour of young New Zealanders
• Results from the Alcohol and Public Health Research Unit comparison of the 1995 and2000 national surveys of drinking in New Zealand (Habgood et al. 2001) showed that,while the proportion of 14 – 15 year olds who had consumed alcohol in the previous 12months had not significantly increased, the frequency of drinking by those who drank,and the amount consumed on a typical occasion had significantly increased.
• The prevalence of drinking by 16 – 17 year olds did not change significantly over the five-year period. However, the 16 – 17 year olds who drank had increased their frequency ofdrinking and increased their average consumption of alcohol on a typical drinkingoccasion.
• The prevalence of drinking by 18 – 19 year olds increased slightly between 1995 and 2000,the increase being higher among 18 – 19 year old women. Among 18 – 19 year olds whodrank alcohol, their average consumption of alcohol on a typical occasion increased fromfive to seven drinks over the five-year period.

6
• Results from the Alcohol and Public Health Research Unit surveys of drug use in NewZealand in 1998 and 2001 (Wilkins et al. 2002) showed that there were increases from1998 to 2001 in the percentages of males and females aged 15 – 17 who consumedenough to feel drunk at least monthly in the last year.
Indicators of alcohol-related offending by minors
• The number of apprehensions of under 18 year olds for drinking or possessing alcoholfor consumption in a public place increased from 834 in 1994 to 1430 in 1999, butdecreased to 451 in 2000 and 380 in 2001. Since the number of infringement noticesissued to minors drinking or possessing alcohol in a public place in 2000 and 2001 (2818and 2340 respectively) were more than the number of apprehensions in each of the years1994 to 1999, it appears that Police dealt with more of this type of offending in 2000 and2001 than in previous years. The increase in the amount of this type of offending dealtwith by the Police was more than would have been expected based on the trend inapprehensions from 1994 to 1999.
• The number of apprehensions of under 18 year olds for being in restricted or supervisedareas on licensed premises decreased from 466 in 1994 to 235 in 1999. In 2000, thenumber of such apprehensions decreased markedly to 51, and continued at the lower levelin 2001 (49). Police issued 263 infringement notices to under 18 year olds for this offencein 2000 and issued 162 infringement notices in 2001.
• The number of apprehensions of under 18 year olds for purchasing liquor from licensedpremises fluctuated a little between 1994 and 1999. There were 98 such apprehensions in1994 compared with 76 in 1999. The number of these apprehensions decreased markedlyto 17 in 2000. In the same year Police issued only 24 infringement notices to minors. In2001, both the number of apprehensions and infringement notices increased slightly fromthe 2000 figures, however the total number dealt with by the Police was still less than thenumber apprehended each year prior to the law change.
• The number of managers, licensees or employees convicted for offences related to minorsunder the Sale of Liquor Act 1989 reached a peak of 46 in 1994 before tending todecrease in subsequent years to 10 in 2001.
Indicators of alcohol-related offending by minors and all ages - disorderly behaviour
People committing disorderly behaviour offences may be more likely to be under theinfluence of alcohol when the offence was committed.
• The upward trend in the number of apprehensions of under 18 year olds for disorderlybehaviour shown prior to the law change continued in 2000 and 2001. The trend reflectsan increase over the same time period for apprehensions of people of all ages fordisorderly behaviour offences.
• The number of convictions of 18 – 19 year olds for disorderly behaviour continued toincrease following the law change. The trend reflects an increase over the same timeperiod for convictions of people of all age groups for disorderly behaviour offences.

7
Indicators of alcohol-related traffic offending by those under 20 years old and all ages
• The number of those between 14 and 17 years old prosecuted for driving with excessbreath or blood alcohol showed an increasing trend from 600 in 1992 to 911 in 1999. Theupward trend continued in the two years following the law change, with 1053prosecutions in 2001.
• Between 1992 and 1999, the number of people 18 or 19 years old prosecuted for drivingwith excess breath or blood alcohol fluctuated between 1990 and 2274. In each of theyears after the law change the number of such prosecutions increased, and at 2399 in 2001was higher than for any year since 1992.
• The numbers of 15 – 19 year old drivers involved in crashes with alcohol recorded as afactor contributing to the crash decreased between 1992 and 1999, and the decreasingtrend continued into 2000, before increasing slightly in 2001. The percentage of all 15 –19 year old drivers involved in crashes with alcohol recorded as a factor contributing tothe crash similarly decreased between 1992 and 1999, with the decreasing trendcontinuing into 2000, and increasing slightly in 2001.
• Compulsory breath testing operations carried out in the year 2000 showed that thepercentage of drivers under 20 years old who exceeded the legal breath alcohol limit wasslightly less than the percentage in each of the preceding three years.
Indicators of age-verification practices
• Results from the Auckland Pseudo Patrons Project (Woolgrove et al. 2002) showed thatalmost two-thirds of the off-license premises surveyed in the Auckland area sold alcoholto the 18 year old pseudo patrons without 'evidence of age documents'. Staff in groceryshops were the most likely to sell alcohol to 18 year olds without ID.
• Habgood et al. 2001 reported that requests for 'evidence of age documents' as aproportion of drinking occasions were highest for 18 – 19 year olds compared with 16 –17 and 14 – 15 year olds.
• People under 20 drinking in pubs or nightclubs were more likely to be asked for 'evidenceof age documents' than in other types of licensed locations.
• Requests for 'evidence of age documents' as a proportion of successful purchases ofalcohol at takeaway outlets were higher for 18 – 19 year olds than for 16 – 17 year olds.
Health indicators of alcohol-related harm for minors and all ages
Alcohol-related hospitalisations
• For 15 – 17 year olds, the number of publicly-funded hospitalisations where the primarydiagnosis was alcohol-related fluctuated between 124 in 1996 and 158 in 1999, andincreased to 205 in 2000. Hospitalisations for this age group comprised between 7% and10% of all hospitalisations where the primary diagnosis was alcohol-related, with thepercentage being slightly higher in 1999 and 2000 than between 1996 and 1998.
• For 18 – 19 year olds, the number of publicly-funded hospitalisations where the primarydiagnosis was alcohol-related showed an increasing trend from 55 in 1996 to 85 in 1999,

8
and continued to increase to 114 in 2000. Hospitalisations for this age group comprisedbetween 3% and 6% of all hospitalisations where the primary diagnosis was alcohol-related, with the percentage being slightly higher in 1999 and 2000 than between 1996 and1998.
• The total number of publicly-funded hospitalisations where the primary diagnosis wasalcohol-related also increased from 1683 in 1996 to 1735 in 1999, with the increasecontinuing to 2087 in 2000.
Auckland Hospital Emergency Department experience of alcohol abuse
• A recent study (Everitt & Jones 2001) found that the proportion of intoxicated 18 and 19year olds presenting to the Auckland Hospital Emergency Department increased from 3%to 4% after the Sale of Liquor Amendment Act 1999. There were also small increases inthe proportion of intoxicated 15 – 17 year olds and number of intoxicated over 19 yearolds presenting to the Emergency Department one year after the law change.
Educational indicators of alcohol-related harm to minors
• The available information suggests that alcohol was not a major reason for students beingsuspended or stood-down from school in 2000 or 2001.
Conclusions
The statistics presented in this paper show a mixed and partial picture of the possible impactof lowering the drinking age. The indicators presented here point to diverse trends with noclear picture of whether the change in legislation has had a detrimental effect on youngpeople's drinking behaviour.
While this second report includes 2001 data for most indicators (most indicators in the firstreport stopped at 2000), the time frame is still too short for conclusive analysis of the impactof lowering the drinking age. Further and more complete data is needed to better assess theimpact of lowering the drinking age.

9
1 Introduction1.1 Legal background
The Sale of Liquor Amendment Act 1999 introduced a number of major changes concerningthe minimum age that people may legally drink alcohol. Two of these changes came intoeffect on 1 December 1999. Firstly, the legal minimum drinking age was lowered from 20years to 18 years with one exception. Previously there had been a number of exceptions tothe legal minimum drinking age of 20 years.
Secondly, some offences involving minors became infringement offences where the personmay either be prosecuted through the court system, or an infringement notice may be issued.(Those issued with an infringement notice must pay an infringement fee or request a hearing.)The infringement offences are those involving minors under 18 years old who purchase liquoron or from licensed premises, are found in a restricted area on licensed premises, are found inany supervised area on licensed premises unless accompanied by a parent or guardian, whodrink alcohol in a public place while not accompanied by a parent or guardian, or who possessalcoholic drink for consumption in a public place while not accompanied by a parent orguardian.
The 1999 amendment introduced a definition of 'evidence of age documents'. A person whois charged with selling or supplying liquor to a person under 18 years or permitting a personunder 18 to be in restricted or supervised areas of licensed premises has a defence if, at thetime of the offence, they sighted a recognised 'evidence of age document' that indicated thatthe person was at least 18 years old. The three recognised 'evidence of age documents' are apassport, a photo driver licence, or a Hospitality Association of New Zealand 18+ card.
1.2 Alcohol available for consumption
Table 1.1 shows that the total volume of alcoholic beverage available for consumption in theyear ended December 2001 was 0.8 percent higher than in 2000. The main contributor to theincrease was a 9.9% increase in the volume of spirits and spirit-based drinks available forconsumption. The volume of spirit-based drinks available for consumption increased by15.4% in the December 2001 year. This increase followed a 22.0% increase in the previousyear. The total volume of wine available for consumption decreased by 1.4% from theDecember 2000 year.

10
Table 1.1 Alcohol available for consumption (1)
Volume of Available BeverageTable Wine(2) Fortified
Wine(3)Total Wine Beer Spirit-based
Drinks(4)Spirits(5) Total Spirits
and Spirit-based Drinks
Total
Million LitresYear endedDecember1996 62.891 3.196 66.087 337.248 3.889 8.800 12.688 416.0231997 64.366 3.119 67.485 315.598 9.185 9.653 18.838 401.9211998 64.353 2.580 66.933 315.395 18.329 8.986 27.314 409.6421999 69.884 2.427 72.312 316.906 20.096 8.715 28.811 418.0292000 69.697 2.150 71.847 305.611 24.509 9.705 34.214 411.6722001 69.071 1.796 70.867 306.342 28.288 9.327 37.614 414.824
Percentage change from previous December year1997 2.3 -2.4 2.1 -6.4 136.2 9.7 48.5 -3.41998 - -17.3 -0.8 -0.1 99.6 -6.9 45.0 1.91999 8.6 -5.9 8.0 0.5 9.6 -3.0 5.5 2.02000 -0.3 -11.4 -0.6 -3.6 22.0 11.4 18.8 -1.52001 -0.9 -16.5 -1.4 0.2 15.4 -3.9 9.9 0.8
Notes: (1) Alcohol available for consumption is calculated from production for domestic consumption plusimports less re-exports. The above table does not include alcoholic beverages produced byhouseholds.
(2) Table wine has an alcohol content less than or equal to 14 percent.(3) Fortified wine has an alcohol content greater than 14 percent.(4) Spirit-based drinks have an alcohol content less than or equal to 23 percent. They include RTDs
(ready-to-drink beverages), beer, and wine, that are spirit-based.(5) Spirits have an alcohol content greater than 23 percent.(6) Source Statistics New Zealand 2002.
1.3 Scope of the report
This report presents some statistics on the possible effects of the Sale of Liquor AmendmentAct 1999, and focuses on the lowering of the drinking age. The statistics presented are mostlylimited to those statistics routinely collected on a national basis for various purposes. Thestatistics presented do not explicitly measure the impact of lowering the minimum legaldrinking age, rather, they are indicators of the possible impact of lowering the drinking age.Changes in indicator levels over time may be due to other factors, such as changes in Policepractices or recording practices. At best, statistical information was available for two yearsfollowing the law change. For these reasons, these statistics represent only a partial picture ofthe likely impact of lowering the drinking age.
The first version of this report was published in 2002 (Lash 2002). This report updates theearlier report with new information and the inclusion of another year of data.

11
2 Drinking behaviour of young NewZealanders
The Alcohol and Public Health Research Unit conducted surveys of drinking in New Zealandin 1995 and 2000. The 1995 survey consisted of 4232 people, and the 2000 surveyinterviewed 5113 people. The results of the surveys are compared in Habgood et al. 2001.The report is of interest as the surveys measured the drinking behaviour of New Zealandersbefore and after the 1999 amendments to the Sale of Liquor Act 1989. The surveys alsoasked some questions that focussed on drinking by young people. All drinkers under 20 yearsold were asked where they drank, how often they were refused entry to various licensedpremises, or once inside, refused alcohol because of their age, how often they were asked forage verification documents, and their experiences of buying takeaway alcohol. This sectionmainly presents those results that relate to the drinking behaviour of young people.
2.1 Drinking by those aged 14 – 15 years
While the proportion of 14 – 15 year olds who had consumed alcohol in the previous 12months did not significantly increase between 1995 and 2000, the frequency of drinking bythose who drank and the amount consumed on a typical occasion, significantly increased.The average 14 – 15 year old who drank, became a weekly drinker and his or her averageconsumption on a typical occasion rose from three to five drinks.
There were few changes over the five-year period in the proportions of those aged 14 – 15years drinking in licensed locations. Fifty-one percent of 14 – 15 year olds had consumedalcohol at special events (dances, music events and festivals) in 2000. The next most popularlocations for consuming alcohol in 2000 were at sports events, restaurants, cafes and coffeeshops.
With the exception of bottle stores, where the proportions of 14 – 15 year olds purchasingalcohol decreased from 12% in 1995 to 5% in 2000, there was little change for this age groupbetween 1995 and 2000 in the proportions buying takeaway alcohol at any location.
2.2 Drinking by those aged 16 – 17 years
The prevalence of drinking by 16 – 17 year olds did not change significantly over the five-yearperiod. However, 16 – 17 year olds who drank in the past 12 months increased theirfrequency of drinking and also increased their average alcohol consumption on a typicaldrinking occasion from four to seven drinks.
Between 1995 and 2000 there were no significant changes in the proportions of 16 – 17 yearolds drinking at least once in the past year in licensed locations. Fifty-seven percent hadconsumed alcohol at special events in 2000. About one in four had consumed alcohol at leastonce in pubs, hotels or taverns, at sports events or at sports clubs that year.
The percentage of 16 – 17 year olds who bought alcohol at least once in the previous 12months from bottle stores in pubs, hotels or taverns decreased from 30% in 1995 to 21% in2000. There was also a decrease in the proportion of this age group buying from wine shops.

12
However, over the same period, purchases of alcohol from supermarkets by 16 – 17 year oldsincreased from 8% to 15%.
2.3 Drinking by those aged 18 – 19 years
Overall, the prevalence of drinking in the past year by 18 – 19 year olds increased slightlybetween 1995 and 2000. The increase was greater among 18 – 19 year old women - in 1995,78% had consumed alcohol in the previous year, compared with 89% in 2000. Eighteen or 19year old drinkers significantly increased their quantities of alcohol consumed on a typicaloccasion - an average increase from five to seven drinks over the five-year period.
There were few changes in the proportions of 18 – 19 year olds drinking in licensed locations.Pubs were their most popular drinking venue (72%).
The proportion of 18 – 19 year olds who had bought alcohol at least once from wine shops orwholesalers increased from 70% in 1995 to 83% in 2000.
2.4 Information from national surveys of drug use in New Zealand 1998and 2001
Recently the Alcohol and Public Health Research Unit published the results of surveys ofdrug use in New Zealand in 1998 and 2001 (Wilkins et al. 2002). Alcohol is one of the drugsstudied in the survey, although the alcohol questions are not as extensive as those reported inHabgood et al. 2001.
The report tended to confirm the results reported in Habgood et al. 2001. The proportion offemales aged 15 – 17 who drank four drinks or more at least once a week increased from 15%in 1998 to 28% in 2001. There were increases in the percentages of males aged 15 – 17 years(from 43% in 1998 to 58% in 2001) and females aged 15 – 17 (from 33% to 50%) whoconsumed enough to feel drunk at least monthly in the last year.

13
3 Indicators of alcohol-related offending byminors
Before the Sale of Liquor Act 1989 was amended in December 1999 the term 'minor' wouldhave included all people under 20 years old. Where this section analyses offending by minors,the term 'minor' is used to refer to those who were under 18 years old. However, when theoffending by managers, licensees and employees related to minors was analysed, it was notpossible to provide analysis only for minors under 18 years old.
For the analysis of offending by minors, Police apprehensions, rather than prosecutions orconvictions, are used as a measure of offending. Because of the provisions of the Children,Young Persons and Their Families Act 1989 most young offenders (those between 14 and 16years old) are not prosecuted in formal court proceedings. For this reason, Policeapprehensions give a more accurate indication of the amount of offending by 14 – 16 yearolds.
3.1 Minors drinking or possessing alcohol for consumption in a publicplace
The offence of a minor drinking or possessing alcohol for consumption in a public place isdefined in section 38 of the Summary Offences Act 1981. As well as lowering the definitionof the minimum drinking age from 20 to 18 years, the Sale of Liquor Amendment Act 1999made this offence an infringement offence from 1 December 19991.
Table 3.1 Number of apprehensions and infringement notices for minors under 18years old drinking or possessing alcohol for consumption in public places,1994 - 2001
Year Apprehensions Infringement notices
1994 834 -1995 943 -1996 1074 -1997 1141 -1998 1660 -1999 1430 *2000 451 28182001 380 2340Notes: (1) * = 'not available'.
(2) - = 'not applicable'.(3) Source New Zealand Police.
1 For infringement offences, the person may either be prosecuted through the court system, or an infringementnotice may be issued.

14
Between 1994 and 1999 apprehensions for minors (those under 18) drinking or possessingalcohol for consumption in a public place increased from 834 to 1430. However, after the1999 legislative changes, the number of such apprehensions decreased to 451 in 2000, and380 in 2001. Much of the decrease from 2000 is due to a change in Police practice to apreference for the issuing of an infringement notice rather than apprehending an offender.2In 2000, Police issued 2818 infringement notices for minors drinking or possessing alcoholfor consumption in a public place, and in 2001, 2340 such infringement notices were issued.
Figure 3.1 Number of apprehensions and infringement notices for minors under 18years old drinking or possessing alcohol for consumption in public places,1994 - 2001
Since the number of infringement notices issued to minors drinking or possessing alcohol in apublic place in 2000 and 2001 (2818 and 2340 respectively) were more than the number ofapprehensions in each of the years 1994 to 1999 (between 834 and 1660), it appears thatPolice dealt with more of this type of offending in 2000 and 2001 than in previous years. Theincrease in the amount of this type of offending dealt with by the Police was more than wouldhave been expected based on the trend in apprehensions from 1994 to 1999.
The increase in the numbers of minors drinking or possessing alcohol for consumption in apublic place dealt with by Police may have occurred because it is easier to issue aninfringement notice than apprehend an offender. Thus, some offenders who may not havebeen apprehended in the past had an infringement notice issued against them. However,anecdotal information from Police staff, particularly Youth Aid officers, around the countryindicates that there has been an increase in minors drinking in public and in the numbers ofintoxicated young people on the streets.
2 Infringement notices are not included in Police apprehension statistics.
0
500
1000
1500
2000
2500
3000
1994 1995 1996 1997 1998 1999 2000 2001
year
InfringementsApprehensions

15
3.2 Minors in restricted or supervised areas of licensed premises
The offences of minors being found in a restricted or supervised area of licensed premises aredefined in section 163 of the Sale of Liquor Act 1989. Prior to the 1999 changes to the Saleof Liquor Act 1989 that lowered the legal minimum drinking age from 20 years to 18 years(with one exception) there had been a number of exceptions to the legal minimum drinkingage of 20 years. The exemptions that applied to restricted and supervised areas were:
Restricted Areas: A person who is of 18 years or over and who is accompanied by anadult spouse, a parent, or a guardian could be present in a restricted area.
Supervised Areas: Any person could be present in a supervised area if under 20 andaccompanied by an adult spouse, a parent, a guardian, or any other adult familymember properly responsible for him or her. A person of 18 years or over could bepresent in the supervised area by himself or herself for the purpose of having a meal.
The exemption that now applies to supervised areas is:
Supervised Areas: A person under 18 may be present in a supervised area ifaccompanied by a parent or guardian.
The Sale of Liquor Amendment Act 1999 also made these offences infringement offencesfrom 1 December 1999 where the person may either be prosecuted through the court system,or an infringement notice may be issued.
Between 1994 and 1999 apprehensions of minors (those under 18 years old) in restricted orsupervised areas on licensed premises decreased from 466 to 235. However, after the 1999legislative changes, the number of such apprehensions decreased markedly to 51 in 2000, andcontinued at the lower level in 2001 (49). Police suggest that the reduction in apprehensionsfor minors in restricted or supervised areas on licensed premises may be due to improved ageidentification, greater compliance from licensed premises, or Police preference for issuing aninfringement notice to young people.
Table 3.2 Number of apprehensions and infringement notices for minors under 18years old in restricted or supervised areas of licensed premises, 1994 - 2001
Year Apprehensions Infringement notices
1994 466 -1995 468 -1996 458 -1997 354 -1998 319 -1999 235 *2000 51 2632001 49 162Notes: (1) * = 'not available'.
(2) - = 'not applicable'.(3) Source New Zealand Police.

16
Figure 3.2 Number of apprehensions and infringement notices for minors under 18years old in restricted or supervised areas of licensed premises, 1994 - 2001
In the year 2000, Police issued 263 infringement notices3 for minors in restricted orsupervised areas of licensed premises, and in 2001, 162 such infringement notices were issued.The 2001 figure is just over half of the 2000 figure, and Police suggest that the drop could beattributed to a number of factors including changes in Police resourcing and practice. SomePolice officers consider that the $200 fine is too high, leading to a preference for warningoffenders rather than issuing an infringement notice (New Zealand Police 2001, andGreenaway et al. 2002 p. 46).
In summary, these statistics present a mixed picture of minors in restricted or supervised areasof licensed premises who were dealt with by the Police. The total number of such offenderswho were either apprehended or had an infringement notice issued in 2000 was greater thanthe number apprehended in 1998 or 1999, but less than the numbers apprehended in earlieryears (1994 to 1997). In 2000 Police issued more infringement notices to these offendersthan the number they had apprehended in 2000. However, the number of infringementnotices in 2001 decreased to just over half the 2000 infringement notices, so that the totalnumber of such offenders who were either apprehended or had an infringement notice issuedin 2001 was slightly less than the number apprehended in 1999.
3.3 Purchasing of liquor from licensed premises by minors
The offence of minors purchasing liquor from licensed premises is defined in section 162 ofthe Sale of Liquor Act 1989. Prior to the 1999 changes to the Sale of Liquor Act 1989 therehad been a number of exceptions to the legal minimum drinking age of 20 years. The
3 Infringement notices are not included in Police apprehension statistics.
0
50
100
150
200
250
300
350
400
450
500
1994 1995 1996 1997 1998 1999 2000 2001
year
InfringementsApprehensions
17
exemptions that applied to purchasing in areas other than restricted and supervised areaswere:
Liquor could be purchased by a person of 18 years or over who is accompanied by anadult spouse, or a parent, or a guardian. Liquor could be purchased in other than arestricted area by a person who is 18 years or over or is accompanied by an adultspouse, or a parent or guardian for consumption as part of a meal.
There are now no exemptions for this offence.
The Sale of Liquor Amendment Act 1999 also made this offence an infringement offence.From 1 December 1999 a person may either be prosecuted through the court system, or aninfringement notice may be issued.
Licensed premises include all premises which are licensed to sell liquor. The Sale of LiquorAct 1989 lists four types of licenses; on-licenses, off-licenses, club licenses and speciallicenses.
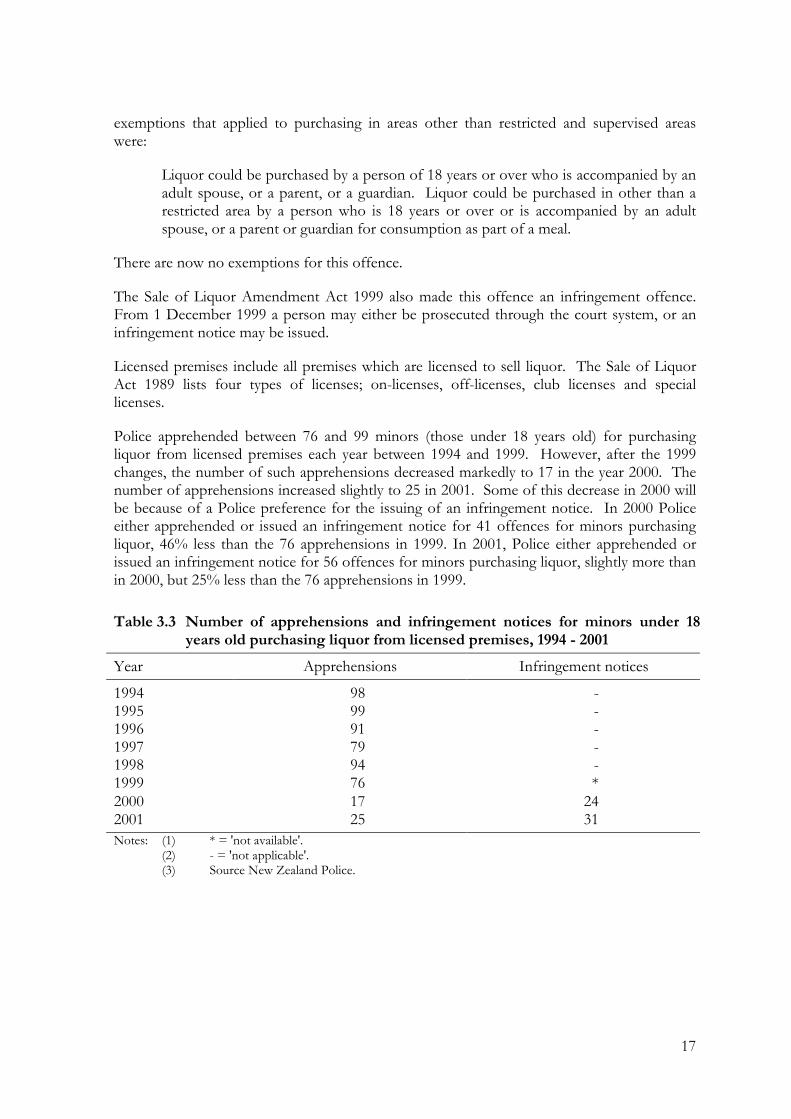
Police apprehended between 76 and 99 minors (those under 18 years old) for purchasingliquor from licensed premises each year between 1994 and 1999. However, after the 1999changes, the number of such apprehensions decreased markedly to 17 in the year 2000. Thenumber of apprehensions increased slightly to 25 in 2001. Some of this decrease in 2000 willbe because of a Police preference for the issuing of an infringement notice. In 2000 Policeeither apprehended or issued an infringement notice for 41 offences for minors purchasingliquor, 46% less than the 76 apprehensions in 1999. In 2001, Police either apprehended orissued an infringement notice for 56 offences for minors purchasing liquor, slightly more thanin 2000, but 25% less than the 76 apprehensions in 1999.
Table 3.3 Number of apprehensions and infringement notices for minors under 18years old purchasing liquor from licensed premises, 1994 - 2001
Year Apprehensions Infringement notices
1994 98 -1995 99 -1996 91 -1997 79 -1998 94 -1999 76 *2000 17 242001 25 31Notes: (1) * = 'not available'.
(2) - = 'not applicable'.(3) Source New Zealand Police.

18
Figure 3.3 Number of apprehensions and infringement notices for minors under 18years old purchasing liquor from licensed premises, 1994 - 2001
Police have identified some difficulties associated with the enforcement of the Act. Many ofthe problems centre on off-licensed premises where the purchase of alcohol by a minor mayonly take a matter of minutes, meaning that there is little recourse unless Police were presentat the time the offence was committed. The problem is compounded in supermarkets wherethe liquor aisles are not designated as restricted or supervised areas, and many cashiers areunder age themselves. However, Police note that this situation is not new, and has notchanged as a result of the amended Act. While on-license premises are easier to policethrough visits and the verification of age identification, this process can be time consumingand involve a number of officers.
In summary, in both 2000 and 2001 Police dealt with less minors purchasing liquor fromlicensed premises by issuing an infringement notice or apprehending the person, than theyapprehended in previous years (1994 to 1999).
3.4 Offences related to minors committed by managers, licensees oremployees under the Sale of Liquor Act 1989
Offences analysed in this section are those in Sections 155 and 164 of the Sale of Liquor Act1989. These offences relate to selling or supplying liquor to minors, and permitting minors tobe in restricted or supervised areas. The Sale of Liquor Amendment Act 1999 changed thedefinition of minor from those under 20 to those under 18 years old from 1 December 1999.
0
20
40
60
80
100
120
1994 1995 1996 1997 1998 1999 2000 2001
Year
InfringementsApprehensions

19
In this section, convictions are used as the main measure of offending rather thanapprehensions.4
The number of managers, licensees or employees convicted for offences related to minorsunder the Sale of Liquor Act 1989 reached a peak of 46 in 1994 before tending to decrease insubsequent years to 10 in 2001.
Table 3.4 Convictions and apprehensions for offences related to minors committed bymanagers, licensees or employees under the Sale of Liquor Act 1989,1992 - 2001
Year Convictions(2) Apprehensions(3)
1992 33 -1993 31 -1994 46 2941995 31 2571996 32 2571997 20 2311998 23 2121999 12 1732000 15 1192001 10 86Notes: (1) - = 'not available'.
(2) Source Ministry of Justice.(3) Source New Zealand Police.
Police apprehensions of managers, licensees or employees for offences under the Sale ofLiquor Act 1989 relating to minors showed a similar decreasing trend to the trend forconvictions, decreasing from 294 in 1994 to 86 in 2001.
Police suggest this decrease may indicate improved age identification and greater compliancefrom licensed premises. It is also possible that this decline is due to a Police preference forissuing an infringement notice to young people rather than taking the more time consumingand resource-intensive action against licensed premises. The total number of minors found inrestricted or supervised areas of licensed premises that were apprehended or issued withinfringement notices in the year 2000 was more than the number of minors apprehended bythe Police in the two previous years (see Table 3.2). The decline may also indicate wider useof section 132 of the Sale of Liquor Act 1989 to make applications to the Liquor LicensingAuthority for the suspension or cancellation of a license.
4 Apprehensions were used to measure offending by minors. Because of the provisions of the Children, YoungPersons and Their Families Act 1989, most young offenders, those between 14 and 16 years old, are notprosecuted in formal court proceedings. However, these provisions generally do not apply to managers,licensees or employees.

20
Figure 3.4 Convictions for offences related to minors committed by managers,licensees or employees under the Sale of Liquor Act 1989, 1992 – 2001
0
5
10
15
20
25
30
35
40
45
50
1992 1993 1994 1995 1996 1997 1998 1999 2000 2001
Year
21
4 Indicators of alcohol-related offending byminors and all ages - disorderly behaviour
Information is not generally available on whether a person was under the influence of alcoholwhen an offence was committed. (The exception is where alcohol is part of the definition ofthe offence e.g. driving under the influence of alcohol.) However, it is possible that thosecommitting disorderly behaviour offences may be more likely to have been under theinfluence of alcohol when the offence was committed.
Police staff in several districts have reported an increase in disorder offences relating to large-scale beach parties. However, the Police also commented that there was no direct evidence toattribute the increase in disorder offences for young people to the lowering of the drinkingage.
Police apprehensions, rather than prosecutions or convictions, are used as a measure ofoffending for those under 18 years old. Because of the provisions of the Children, YoungPersons and Their Families Act 1989 most young offenders (those between 14 and 16 yearsold) are not prosecuted in formal court proceedings.
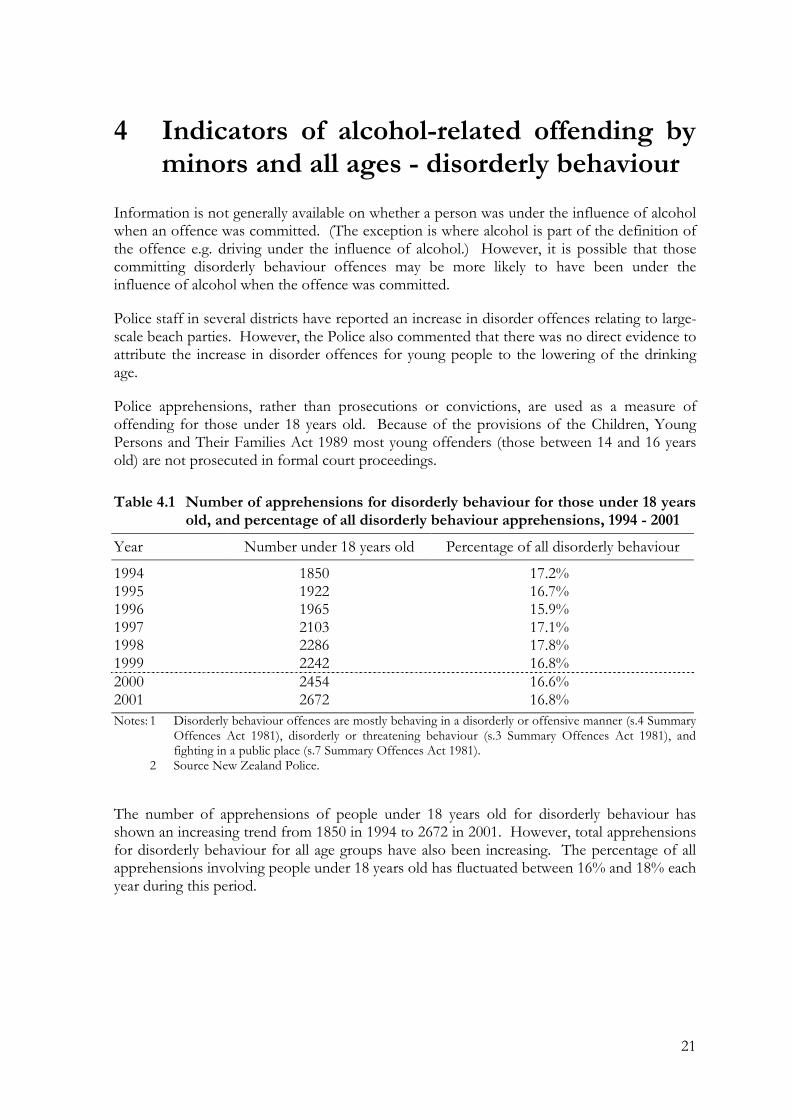
Table 4.1 Number of apprehensions for disorderly behaviour for those under 18 yearsold, and percentage of all disorderly behaviour apprehensions, 1994 - 2001
Year Number under 18 years old Percentage of all disorderly behaviour
1994 1850 17.2%1995 1922 16.7%1996 1965 15.9%1997 2103 17.1%1998 2286 17.8%1999 2242 16.8%2000 2454 16.6%2001 2672 16.8%Notes: 1 Disorderly behaviour offences are mostly behaving in a disorderly or offensive manner (s.4 Summary
Offences Act 1981), disorderly or threatening behaviour (s.3 Summary Offences Act 1981), andfighting in a public place (s.7 Summary Offences Act 1981).
2 Source New Zealand Police.
The number of apprehensions of people under 18 years old for disorderly behaviour hasshown an increasing trend from 1850 in 1994 to 2672 in 2001. However, total apprehensionsfor disorderly behaviour for all age groups have also been increasing. The percentage of allapprehensions involving people under 18 years old has fluctuated between 16% and 18% eachyear during this period.

22
Figure 4.1 Number of apprehensions for disorderly behaviour for those under 18 yearsold, 1994 - 2001
Convictions, rather than apprehensions, are used as the measure of offending for those 18 or19 years old because the provisions of the Children, Young Persons and Their Families Act1989 do not apply to this age group.
Table 4.2 Number of convictions for disorderly behaviour for those between 18 and 19years old, and percentage of all disorderly behaviour convictions, 1992 -2001
Year Number 18 – 19 years old Percentage of all disorderly behaviourconvictions
1992 286 19.8%1993 406 19.5%1994 468 18.8%1995 474 15.8%1996 515 15.7%1997 548 17.0%1998 652 18.6%1999 712 18.4%2000 903 20.7%2001 1023 20.6%Notes: 1 Disorderly behaviour offences are mostly behaving in a disorderly or offensive manner (s.4 Summary
Offences Act 1981), disorderly or threatening behaviour (s.3 Summary Offences Act 1981), andfighting in a public place (s.7 Summary Offences Act 1981).
2 Source Ministry of Justice.
0
500
1000
1500
2000
2500
3000
1994 1995 1996 1997 1998 1999 2000 2001
year

23
Figure 4.2 Number of convictions for disorderly behaviour for 18 and 19 year olds,1992 - 2001
The number of 18 and 19 year olds who were convicted of disorderly behaviour increasedstrongly throughout the decade (from 286 in 1992 to 1023 in 2001), as did the total number ofconvictions for disorderly behaviour for all age groups. The percentage of all disorderlybehaviour convictions for 18 and 19 year olds decreased between 1992 and 1996 (from 20%to 16%), but has been increasing since then.
0
200
400
600
800
1000
1200
1992 1993 1994 1995 1996 1997 1998 1999 2000 2001
year

24

25
5 Indicators of alcohol-related trafficoffending by those under 20 years old andall ages
Prosecutions are used as a measure of traffic offending for those under 20 years old.5 It isimportant to note, however, that under the provisions of the Children, Young Persons andTheir Families Act 1989 most young offenders (those between 14 and 16 years old) are notprosecuted in formal court proceedings.
The number of those between 14 and 17 years old prosecuted for driving with excess breathor blood alcohol showed an increasing trend from 600 in 1992 to 911 in 1999. The upwardtrend continued in the two years following the law change, with 1053 prosecutions in 2001.
Between 1992 and 1999, the number of people 18 or 19 years old prosecuted for driving withexcess breath or blood alcohol fluctuated between 1990 and 2274. In each of the years afterthe law change the number of such prosecutions increased, and at 2399 in 2001, was higherthan for any year since 1992.
Table 5.1 Prosecutions for driving with excess breath or blood alcohol, 1992 - 2001Year 14 – 17 18 – 19 All driving with excess alcohol
Number % Number % Number %
1992 600 2.7 2038 9.3 21943 100.01993 596 3.0 2058 10.2 20107 100.01994 687 3.6 2056 10.8 18950 100.01995 859 4.0 2274 10.7 21285 100.01996 851 4.0 2085 9.7 21492 100.01997 824 3.9 1990 9.5 21032 100.01998 838 4.0 2178 10.4 21002 100.01999 911 4.4 2089 10.2 20521 100.02000 907 4.7 2214 11.4 19491 100.02001 1053 5.2 2399 11.8 20356 100.0Notes: 1 Offences included in this table relate to driving with excess alcohol (including offences where
death or injury was involved). Offences related to driving under the influence of drugs areexcluded, as are offences related to refusing to supply a blood specimen.
2 Although a person under the age of 15 cannot hold a driver licence, each year a number of 14 yearold drivers were prosecuted for driving with excess alcohol.
3 Source Ministry of Justice.
The total number of prosecutions for driving with excess breath or blood alcohol showed adecreasing trend from 1992 to 1999, apart from increases in 1995 and 1996, continued todecrease in 1999, before increasing in 2001. The proportion of all drivers prosecuted fordriving with excess breath or blood alcohol who were under 18 showed an increasing trendacross the decade from 3% in 1992 to 5% in 2001. The proportion of all drivers prosecuted
5 Apprehension data for traffic offending is not available.

26
for driving with excess breath or blood alcohol who were 18 or 19 years old fluctuatedbetween 9% and 12% between 1992 to 2001, although this percentage was higher in the twoyears following the law change.
Although there were increases in young people prosecuted for traffic offences involvingalcohol after the drinking age was lowered, there were changes other than lowering thedrinking age which may have influenced prosecutions of these young people. Recent changesin licensing procedures6 made drivers under 20 years old easier to identify. (Drivers under theage of 20 have lower allowable alcohol limits, and the driver must be identified as under 20 sothat the testing equipment can be set to the correct level.)
Some information on the influence of better identification of young drivers on theprosecution of young people for traffic offences involving alcohol was provided by separateanalysis of those prosecuted for the lower allowable alcohol limits. The analysis showed thatthese prosecutions accounted for most of the increase in 2001 in the number of peoplebetween 18 and 19 years old who were prosecuted for excess breath or blood alcohol.
Figure 5.1 Prosecutions for offences committed by those under 20 years old fordriving with excess breath or blood alcohol, 1992 - 2001
Table 5.2 shows the number and percentage of 15 – 19 year old drivers involved in reportedinjury and fatal crashes which had alcohol recorded as a factor. These data relate to the 12month periods from 1 December to 30 November the following year. Both the number andthe percentage of 15 – 19 year old drivers involved in crashes who had alcohol recorded as a
6 The two recent changes to the licensing procedure were photo driver licenses and the mandatory productionof driver licences. The photo driver licence upgrade took place over a 14 month period from 3 May 1999 toearly July 2000. By 1 December 1999, approximately half of the driving population would have upgraded theirlicences. From 3 May 1999, drivers were required to produce immediately their driver licence for inspection atthe request of an enforcement officer.
0
500
1000
1500
2000
2500
3000
1992 1993 1994 1995 1996 1997 1998 1999 2000 2001
Year
14-1718-19

27
factor that contributed to the crash decreased between 1992 and 1999. Following the lawchange, for each of the age ranges, 15 – 17 and 18 – 19, the numbers and percentagesincreased slightly, but were still much lower than the 1992 figures.
Table 5.2 Number and percentage of 15 – 19 year old drivers involved in crashes whohad alcohol recorded as a factor, 1992 - 2001
Year ending 15–17 18–19 15–19
30 November Number Percent Number Percent Number Percent
1992 144 12.7% 327 19.6% 471 16.8%1993 133 12.1% 273 17.9% 406 15.5%1994 137 11.6% 262 15.6% 399 13.9%1995 148 12.4% 270 16.7% 418 14.9%1996 136 12.3% 190 14.2% 326 13.3%1997 109 10.3% 168 14.3% 277 12.4%1998 95 10.0% 162 15.4% 257 12.8%1999 87 10.0% 144 14.5% 231 12.4%2000 80 11.4% 116 12.8% 196 12.2%2001 97 11.8% 153 15.3% 250 13.7%Note: Source Land Transport Safety Authority.
Figure 5.2 Number of 15 – 19 year old drivers involved in crashes who had alcoholrecorded as a factor, 1992 - 2001
Activities that have contributed to these decreases include the introduction of compulsorybreath testing (CBT) in 1993, and increased enforcement and advertising effort associatedwith the Supplementary Road Safety Package funding from late 1995.
0
50
100
150
200
250
300
350
1992 1993 1994 1995 1996 1997 1998 1999 2000 2001
Year
15-1718-19

28
In 1999 a number of further changes were introduced. These included photo driver licences,the mandatory production of driver licences, the mandatory licence suspension regime thattargets grossly-intoxicated drivers, the introduction of more severe penalties for repeat drink-drive offences, and vehicle impoundment. (While vehicle impoundment directly targets illegaldrivers, it may also impact indirectly on drink-drivers since many of them are also disqualifiedor unlicensed.)
From 1997 to 2000, the Police have collected data from special CBT check-points todetermine the proportion of drivers exceeding their legal breath alcohol limits. These check-point operations were conducted at randomly-chosen sites at high risk times for alcoholimpaired driving (i.e. on Friday and Saturday nights between the hours of 10pm and 2am).Table 5.3 shows that the percentage of drivers under 20 years old who exceeded the legalbreath alcohol limit in 2000 was slightly less than the percentage in each year between 1997and 1999.
Table 5.3 Percentage of drivers aged under 20 exceeding theirlegal breath alcohol limit from random roadsidebreath-testing data
Year Percentage of drivers aged under 20 exceeding theirlegal breath alcohol limit
1997 3.3%1998 2.3%1999 2.7%2000 2.0%
Note: Source Land Transport Safety Authority.
The three traffic indicators – prosecutions for driving with excess alcohol, numbers of driversinvolved in crashes who had alcohol recorded as a factor, and percentage of drivers under 20exceeding their legal breath alcohol limit – showed slightly different trends. The number ofyoung people prosecuted for driving with excess alcohol in 2001 was higher than in any yearsince 1992. The numbers of young drivers involved in crashes who had alcohol recorded as afactor that contributed to the crash trended upwards in 2001 but was still much lower thanbefore the law change. The percentage of drivers under 20 years old who exceeded the legalbreath alcohol limit in 2000 was slightly lower than in the years prior to the law change.

29
6 Indicators of age-verification practicesAs mentioned in the introduction, the 1999 amendment of the Sale of Liquor Act 1989introduced a definition of 'evidence of age documents'. A person who is charged with sellingor supplying liquor to a person under 18 years or permitting a person under 18 to be inrestricted or supervised areas of licensed premises has a defence if, at the time of the offence,they sighted a recognised 'evidence of age document' that indicated that the person was atleast 18 years old. The three recognised 'evidence of age documents' are a passport, a photodriver licence, or a Hospitality Association of New Zealand 18+ card.
The Auckland Pseudo Patrons Project (Woolgrove et al. 2002) was conducted by the Alcoholand Public Health Research Unit to monitor the age-verification practices of personnel at off-license premises in the greater Auckland region. While the study is limited to Auckland only,and the results may not be applicable to other areas, the information is of interest.
The survey did not measure if personnel at off-license premises were breaking the law byselling alcohol to those under 18, as all pseudo patrons were 18 and allowed to purchasealcohol. However, as it can be hard to distinguish 18 year olds from those just under 18, salesmade to 18 year olds without 'evidence of age documents' may indicate that sales to thoseunder 18 are likely to be occurring.
On three successive weekends, some 18 year old pseudo patrons visited over 200 randomly-selected off-license premises (bottle shops, supermarkets, and grocery stores7) on twodifferent occasions (one visit by a male, one visit by a female) and attempted to buy alcoholwithout providing age verification. The pseudo patrons recorded if ID was requested, and if asale took place. The pseudo patrons also collected information on the presence and visibilityof '18+' signage.
The results showed that almost two-thirds (61%) of the off-license premises surveyed soldalcohol to the pseudo patrons without ID. Staff at grocery shops were the most likely to sellalcohol to 18 year olds without ID, as 80% of the visits resulted in sales.
Table 6.1 Number of sales made to 18 year olds without 'evidence of age documents'in Auckland cities and rural districts by type of premise
Type of premise Sale made (%) Sale not made (%) Total number of visits
Bottle shop 59% 41% 275Supermarket 53% 47% 75Grocery outlets 80% 20% 66
All premises 61% 39% 416Note: Source Woolgrove et al. 2002.
The anecdotal evidence collected by the pseudo patrons showed that some outlets asked forID, but made the sale anyway when the ID was not available. Other outlets asked the pseudo
7 Grocery stores include corner dairies, convenience stores, and superettes etc.

30
patrons to state their age or date of birth as proof of age in lieu of an 'evidence of agedocument'.
The information on '18+' signage was analysed in three categories; the signage was presentand easily visible, the signage was present but not easily visible, and the signage was notpresent. The results showed that the use and visibility of signage varied, with signage mostvisible in North Shore (84%), followed by Auckland (52%), Waitakere (50%) and Manukau(43%). The majority of premises in both Franklin and Papakura had no signage present (73%and 64% respectively).
Habgood et al. 2001 also reported some information on how often drinkers under 20 wereasked for 'evidence of age documents'. Two results were presented; requests for ID as aproportion of drinking occasions in licensed locations, and requests for ID in takeawayoutlets as a proportion of successful purchases.
In each type of licensed location, those 18 or 19 years old were more likely than 14 – 15 or 16– 17 year olds to be asked for 'evidence of age documents' when drinking at on-licensepremises.8 Habgood et al. commented that the figures could indicate that a high proportionof those under 18 years old obtained their drinks from someone 18 years old or older. Thosedrinking in pubs or nightclubs were more likely to be asked for 'evidence of age documents'than in the other types of locations.
Table 6.2 Requests for 'evidence of age documents' from those under 20 years old, asa proportion of drinking occasions in licensed locations, by type of licensedlocation
Age group Pubs Nightclubs Sports clubs Sports events Special events Restaurants
14 – 15 0.31 0.53 0.16 0.13 0.02 0.0416 – 17 0.38 0.43 0.06 0.10 0.03 0.0118 – 19 0.46 0.57 0.22 0.14 0.15 0.06Note: Source Habgood et al. 2001.
The requests for 'evidence of age documents' as a proportion of successful purchases ofalcohol at takeaway outlets was higher for 18 – 19 year olds than for 16 – 17 year olds, exceptat dairies. For 18 – 19 year olds the proportion of requests for ID was highest at sports clubs.
Table 6.3 Requests for 'evidence of age documents' from those under 20 years old, asa proportion of successful purchases at takeaway outlets, by type oflicensed location
Age group Sports clubs Supermarkets Hotel/tavern bottle stores Wine shops Dairies
16 – 17 0.19 0.22 0.13 0.11 0.4518 – 19 0.49 0.36 0.33 0.32 0.37Notes: 1 The number of requests for 'evidence of age documents' from 14 – 15 year olds in each takeaway
location was too small to report.2 Source Habgood et al. 2001.
8 Although 18 - 19 year olds could legally enter licensed premises and purchase alcohol in 2000, refusals couldstill occur if 'evidence of age documents' were not produced.

31
7 Health indicators of alcohol-related harmfor minors and all ages
7.1 Alcohol-related hospitalisations
The number of publicly-funded hospitalisations where the primary diagnosis was alcohol-related for those aged 15 to 17 years decreased from 124 in 1996 to 116 in 1997 beforeincreasing to 205 in 2000. Between 1996 and 2000 the number of such hospitalisationsincreased by 65% overall. Hospitalisations for this age group comprised between 7% and10% of all hospitalisations where the primary diagnosis was alcohol-related, with thepercentage being slightly higher in 1999 and 2000 than between 1996 and 1998.
For those aged 18 to 19 years, the number of publicly-funded hospitalisations where theprimary diagnosis was alcohol-related showed an increasing trend from 55 in 1996 to 114 in2000. Between 1996 and 2000 the number of such hospitalisations increased by 107% overall.Hospitalisations for this age group comprised between 3% and 6% of all hospitalisationswhere the primary diagnosis was alcohol-related, with the percentage being slightly higher in1999 and 2000 than between 1996 and 1998.
The total number of publicly-funded hospitalisations where the primary diagnosis wasalcohol-related decreased between 1996 and 1997, before increasing between 1998 and 2000.Between 1996 and 2000 the number of such hospitalisations increased by 24% from 1683 in1995 to 2087 in 2000.
Table 7.1 Number and percentage of publicly-funded hospitalisations where theprimary diagnosis was alcohol-related, for those aged 15 – 19 years,1996 - 2000
15 – 17 years 18 – 19 years All alcohol hospitalisationsNumber % Number % Number %
1996 124 7.4 55 3.3 1683 100.01997 116 7.0 59 3.6 1653 100.01998 129 7.5 61 3.5 1730 100.01999 158 9.1 85 4.9 1735 100.02000 205 9.8 114 5.5 2087 100.0Note: Source New Zealand Health Information Service.
There is some evidence that publicly-funded hospitalisations of young people where theprimary diagnosis was alcohol-related increased after the legal minimum legal drinking age waslowered. For both age groups, 15 – 17 years and 18 – 19 years, the number of suchhospitalisations increased in 2000. The proportion of all alcohol-related hospitalisations foreach of these age groups also increased in 2000. However, the New Zealand HealthInformation Service advised that in the year 2000, some public hospitals started including intheir statistics patients who stayed in their Emergency Departments for more than threehours, but were not actually admitted. These people were not included in earlier years andtheir inclusion may have contributed to the increases in the year 2000.

32
7.2 Auckland Hospital Emergency Department experience of alcoholabuse
The hospitalisation statistics given in the previous section do not include Accident andEmergency contacts where the patient was not admitted, although some have been includedin the 2000 hospitalisation statistics. A recent study (Everitt and Jones 2001) measured thepresentation of alcohol intoxicated patients to Auckland Hospital Emergency Department 12months before and after the change to the minimum legal drinking age.
Table 7.2 Presentations at Auckland Hospital Emergency Department before andafter the Sale of Liquor Amendment Act 1999
Age Intoxication Before AfterNumber % Number %
15 – 17 years Lab confirmed 49 3.4 70 4.9Clinical suspicion only 23 1.6 25 1.8Total intoxicated 72 5.0 95 6.7Not intoxicated 1362 95.0 1329 93.3Total 1434 100.0 1424 100.0
18 – 19 years Lab confirmed 52 2.3 80 3.3Clinical suspicion only 14 0.6 27 1.1Total intoxicated 66 2.9 107 4.4Not intoxicated 2205 97.1 2339 95.6Total 2271 100.0 2446 100.0
>19 years Lab confirmed 800 2.8 811 2.7Clinical suspicion only 163 0.6 181 0.6Total intoxicated 963 3.4 992 3.3Not intoxicated 27478 96.6 29272 96.7Total 28441 100.0 30264 100.0
Note: Source Everitt & Jones 2001.
All records of alcohol-intoxicated patients presenting to the Auckland Hospital EmergencyDepartment in the 12 months before and after the change to the minimum legal drinking agewere studied. Each patient was classified as having laboratory confirmed intoxication, clinicalsuspicion only, or no record of intoxication.
After the minimum legal drinking age was lowered from 20 years to 18 years in December1999, both the number and proportion of presentations to the Auckland Hospital EmergencyDepartment of intoxicated 18 and 19 year olds increased.9 A similar trend was seen for 15 to17 year olds. The number of those over 19 years old who were intoxicated increased veryslightly, but the proportion stayed the same.
9 The increase in the proportion of intoxicated 18 or 19 year olds presenting to the Auckland HospitalEmergency Department was significant (p = 0.009) when the two intoxication categories were combined.None of the other changes was significant.

33
The study has some limitations. The authors believe that not all patients presenting asintoxicated are captured by the existing data collection system. On the other hand, there wereno differences in the data collection techniques and the training given to the staff during thestudy period so that any bias due to under-counting will have been minimised. Otherlimitations of the study are that results may not be applicable to Emergency Departments inother Hospitals, and that with only two data points, trends cannot be analysed. The increasemay therefore be part of a trend that was present before the drinking age was lowered.

34

35
8 Educational indicators of alcohol-relatedharm to minors
Information on reasons for student stand-downs and suspensions is only available for twoschool years following the law change: 2000 and 2001. The Ministry of EducationSuspensions Report 2001 states that "Stand-downs, [and] suspensions, … are some ways todeal with student behaviour that disrupts teaching and learning and threatens the learning ofother students. These approaches are not used lightly by schools, but are part of the processto help students return to productive learning and relationships with the school community."To set the figures in Table 8.1 in context, for 2001, 2.3% of the school roll faced a stand-down and 0.6% a suspension.
The number of stand-downs for alcohol decreased in 2001, and also decreased as aproportion of all stand-downs. The number of suspensions for alcohol increased slightly in2001, and the percentage of all suspensions also increased slightly.
Table 8.1 Stand-downs and suspensions for alcohol in schools, 2000 - 2001Stand-downs Suspensions
Number % Number %
2000 1033 6.1% 181 3.5%2001 833 4.9% 208 4.3%Note: Source Ministry of Education 2001 and Ministry of Education 2002.

36

37
9 ConclusionsThis paper has presented some available statistics relevant to assessing the impact of loweringthe drinking age. The statistics presented are mostly limited to those statistics that areroutinely collected on a national basis for various purposes. The statistics do not explicitlymeasure the impact of lowering the minimum legal drinking age, rather, they are indicators ofthe possible impact of lowering the drinking age. Changes in indicator levels over time mayalso be due to other factors, such as changes in Police practices or recording practices. Atbest, statistical information was available for two years following the law change. For thesereasons these statistics represent only a partial picture of the likely impact of lowering thedrinking age.
The statistics presented in the paper show a mixed picture of the possible impact of loweringthe drinking age. The indicators presented here point to diverse trends with no clear pictureof whether the change in legislation has had a detrimental effect on young people's drinkingbehaviour.
Evidence from the 1995 and 2000 national surveys of drinking in New Zealand suggests thatthe lowering of the drinking age has been accompanied by an increased frequency of drinkingand increased alcohol consumption on a typical drinking occasion by young drinkers.
Some indicators of alcohol-related criminal offending by minors showed an increasing trendafter the law change, while others showed a decreasing trend. Anecdotal evidence fromPolice staff of more intoxicated young people on the streets is supported by figures showingan increased number of apprehensions and infringement notices issued to under 18 year oldsfor drinking or possessing alcohol in a public place following the law change. Numbers ofapprehensions and infringements were, however, lower in 2001 than in 2000. The overallincrease needs to be interpreted in the context of the continuing increase, after the lawchange, of people of all ages being apprehended and convicted for disorderly behaviouroffences.
The three traffic indicators – prosecutions for driving with excess alcohol, numbers of driversinvolved in crashes who had alcohol recorded as a factor, and percentage of drivers under 20exceeding their legal breath alcohol limit – showed slightly different trends. The number ofyoung people prosecuted for driving with excess alcohol in 2001 was higher than in any yearsince 1992. The numbers of young drivers involved in crashes who had alcohol recorded as afactor that contributed to the crash trended upwards in 2001 but was still much lower thanbefore the law change. The percentage of drivers under 20 years old who exceeded the legalbreath alcohol limit in 2000 was slightly lower than in the years prior to the law change.
The results of the Auckland Pseudo Patrons Project showed that almost two-thirds (61%) ofthe off-license premises surveyed in Auckland sold alcohol to the 18 year old pseudo patronswithout 'evidence of age documents'. Staff in grocery shops were the most likely to sellalcohol to 18 year olds without ID.
The main health indicator – numbers of publicly-funded hospitalisations where the primarydiagnosis was alcohol related – tended to fluctuate among 15 – 17 and 18 – 19 year olds priorto the law change, but to increase following it. However, the increase was also recordedamong people of all age groups. Also, the New Zealand Health Information Service advisedthat in the year 2000 some public hospitals started including patients in their statistics who

38
stayed in their Emergency Departments for more than three hours, but were not actuallyadmitted. A recent study of people presenting to the Auckland Hospital EmergencyDepartment showed a small but significant increase in the proportions of intoxicated 18 – 19year olds presenting there after the law change. There were also slight increases in theproportion of 15 – 17 year olds presenting as intoxicated following the law change.
There was little statistical information available on schools and alcohol. What evidence therewas suggested that alcohol did not appear to be a major reason for students being suspendedor stood-down from school following the law change.
In conclusion, while this second report includes 2001 data for most indicators (mostindicators in the first report stopped at 2000), the time frame is still too short for conclusiveanalysis of the impact of lowering the drinking age. Further and more complete data isneeded to better assess the impact of lowering the drinking age.
39
References
Everitt, R., & Jones, P. 2001, Changing the minimum legal drinking age – its effect on a central cityEmergency Department, New Zealand Medical Journal.
Greenaway, A., Conway, K., Field, A., Edwards, S., Bhatta, K., Huckle, T., & Butcher, A.,2002, Young People, Alcohol and Safer Public Places, Alcohol and Public Health Research Unit,Auckland.
Habgood, R., Casswell, S., Pledger, M. & Bhatta, K., 2001, Drinking in New Zealand: NationalSurveys Comparison, 1995 & 2000, Alcohol and Public Health Research Unit, Auckland.
Land Transport Safety Authority 2001, The Effects thus far of Lowering the Minimum Drinking Age,Unpublished, Wellington.
Lash, B., 2002, Some Statistics on the Possible Effects of the Sale of Liquor Amendment Act 1999(Lowering the Drinking Age), Ministry of Justice, Wellington.
Ministry of Education 2001, A Report on Stand-downs, Suspensions, Exclusions and Expulsions,Ministry of Education, Wellington.
Ministry of Education 2002, Suspensions Report 2001: A Report on Stand-downs, Suspensions,Exclusions and Expulsions, Ministry of Education, Wellington.
New Zealand Police, Office of the Commissioner 2001, Monitoring the Impact of the Sale of LiquorAmendment Act 1999, Unpublished, Wellington.
Statistics New Zealand 2002, Hot Off the Press: Alcohol and Tobacco Available for Consumption, Yearended December 2001, Statistics New Zealand, Wellington.
Wilkins, C., Casswell, S., Bhatta, K., & Pledger, M., 2002, Drug Use in New Zealand: NationalSurveys Comparison 1998 & 2001, Alcohol and Public Health Research Unit, Auckland.
Woolgrove, M., Huckle, T., Conway, K., & Casswell, S., 2002, The Auckland Pseudo PatronsProject, Alcohol and Public Health Research Unit, Auckland.