The Post Carbon Reader Series: Economy: The Competitiveness of Local Living Economies
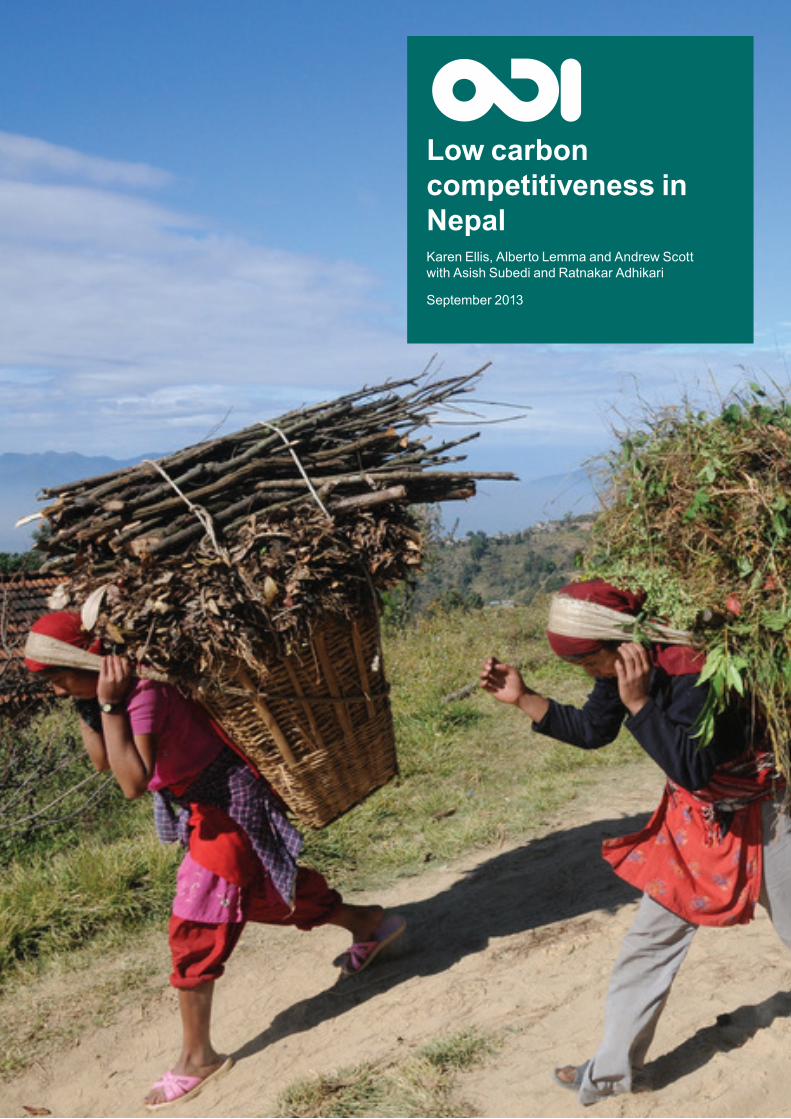
Low carbon competitiveness in NepalKaren Ellis, Alberto Lemma and Andrew Scott with Asish Subedi and Ratnakar Adhikari
September 2013

Shaping policy for development odi.org
Low carbon competitiveness in Nepal
Policy brief
Karen Ellis, Alberto Lemma and Andrew Scott with Asish Subedi and Ratnakar Adhikari
Climate change, international mitigation policies, and natural resource scarcity will transform global trade
patterns over the next decade, creating opportunities and threats for Nepal’s competitiveness and sources
of growth. Policy-makers and businesses should act now to manage the risks and capitalise on the
opportunities.
The potential to develop hydropower in Nepal is substantial, and would significantly enhance
competitiveness and growth; but a diversified energy mix would improve resilience to the potential impact of
climate change on hydropower generation. Fossil fuel subsidies will significantly undermine
competitiveness in a future carbon constrained global economy with high energy prices.
The unsustainable exploitation of forests can undermine growth and competitiveness by jeopardising forest-
dependent livelihoods and depleting natural assets. Incentives to protect the forest can be created by
developing commercial opportunities that rely on sustainable forest management, such as ecotourism, or
products such as medicinal and aromatic plants.
Further growth of the tourism industry could yield significant economic and environmental benefits, but
needs to be managed appropriately to ensure the sustainability of that growth, and to create a competitive
advantage by strengthening Nepal’s brand as a green tourism destination.
September 2013
Acknowledgements
This work was conducted jointly by ODI and South Asia Watch on Trade, Economics and Environment
(SAWTEE).
The authors would like to sincerely thank all those who participated in interviews and consultative workshops
and who made invaluable contributions to the research for this report. We would also like to thank Neil Bird,
Alex Bowen, Simon Maxwell and others who provided comments on the paper.
Low carbon competitiveness in Nepal i
Table of contents
Acknowledgements ii
Abbreviations iii
1 Introduction 1
1.1 Changing global trade patterns 1 1.2 The potential impact on countries’ competitiveness and sources of growth 2 1.3 The case study approach 3
2 The economic context in Nepal 4
2.1 Challenges and opportunities for growth 5 2.2 Nepal’s growth and climate change response strategies 6
3 The energy sector 7
3.1 The demand for energy 7 3.2 Energy supply 10 3.3 The impact of climate change 12 3.4 Export potential 13 3.5 Energy efficiency 13 3.6 Investment climate 13 3.7 Conclusion 14
4 The forestry sector 17
4.1 Forest management regimes in Nepal 17 4.2 Community forestry programme – a success story? 19 4.3 Current status of deforestation and forest degradation 20 4.4 Medicinal and aromatic plants 21 4.5 Tourism 25 4.6 Climate finance in the forestry sector 25 4.7 The potential for private management of forest resources 26 4.8 Conclusion 27
5 The tourism sector 30
5.1 Tourism in Nepal 30 5.2 Tourism and climate change 33 5.3 Carbon mitigation threats to Nepalese tourism 33 5.4 Environmental impact of tourism 33 5.5 Interactions between infrastructure, tourism and the environment 37 5.6 Conclusion 38
6 Conclusions 40
The energy sector 40 The forestry sector 41 The tourism sector 42
References 44

Low carbon competitiveness in Nepal ii
Figures
Figure 1: Nepalese GDP by sector (2011) 4 Figure 2: Electricity demand and load forecast 2012-2028 9 Figure 3: Number of visitors in selected tourist categories 2000-2012 31 Figure 4: Tourist Arrivals in Nepal 1999-2012 31
Tables
Table 1: 2012-13 WEF GCI scores for selected indicators – Nepal competitors 5 Table 2: Selected indicators from the Environmental Performance Index (2012) 5 Table 3: Composition of total final energy consumption in 2009 7 Table 4: Consumption of petroleum products by sector 2009 8 Table 5: Energy consumption by sector 2000-2009 9 Table 6: Summary of energy sector opportunities and risks associated with three drivers 15 Table 7: Different forest management regimes 18 Table 8: Forest and shrublands under different institutional regimes 19 Table 9: Exports of MAPs and essential oils from Nepal to the world (US$ ’000) 22 Table 10: Summary of the REDD+ piloting projects 25 Table 11: Summary of forestry sector opportunities and risks associated with three drivers 28 Table 12: Tourism Indicators for Nepal (2011) 32 Table 13: Summary of tourism sector opportunities and risks associated with three drivers 38
Boxes
Box 1: Freemalaya ................................................................................................................................. 34 Box 2: The Explore Nepal Group ........................................................................................................... 34 Box 3: MAST Nepal ............................................................................................................................... 35 Box 4: Great Himalaya Trail – Nepal ..................................................................................................... 36 Box 5: Nepal Environment and Tourism Initiative Foundation (NETIF)................................................. 36 Box 6: Rural Access Programme .......................................................................................................... 37

Low carbon competitiveness in Nepal iii
Abbreviations
Abbreviation Description
ADB Asian Development Bank
AEPC Alternative Energy Promotion Centre
ANSAB Asia Network for Sustainable Agriculture and Bioresources
CBS Central Bureau of Statistics
CDKN Climate and Development Knowledge Network
CDM Clean Development Mechanism
CF Community Forests
CFD Community Forestry Division
CFUG Community Forest User Group
DECC Department of Energy & Climate Change (UK)
DFID Department for International Development (UK)
DFO District Forest Office
DNPWC Department of National Parks and Wildlife Conservation
DoF Department of Forests
EIA Environmental Impact Assessment
FAO Food and Agriculture Organization of the United Nations
FCTF Forest Carbon Trust Fund
FECOFUN Federation of Community Forestry Users
FGD Focus Group Discussion
GCI Global Competitiveness Index
GDP Gross Domestic Product
GHT Great Himalaya Trail

Low carbon competitiveness in Nepal iv
GMP Good Manufacturing Practice
ICIMOD International Centre for Integrated Mountain Development
IEA International Energy Agency
IEE Initial Environmental Examination
IPCC Intergovernmental Panel on Climate Change
IPP Independent Power Producer
LCCD Low carbon competitiveness diagnostic
LFP The Livelihoods and Forestry Programme
MAPs Medicinal and aromatic plants
MAST Marketing Assistance for Sustainable Tourism
MoFSC Ministry of Forests and Soil Conservation
MOPE Ministry of Population and Environment
MSFP Multi Stakeholder Forestry Program
MW Megawatt
MWp Megawatt-peak
NAPA National Adaptation Programme of Action
NEA Nepal Electricity Authority
NEEP Nepal Energy Efficiency Programme
NETIF Nepal Environment and Tourism Initiative Foundation
NTIS Nepal Trade Integration Strategy
NORAD Norwegian Agency for Development and Cooperation
NOC Nepal Oil Corporation
NPR Nepalese Rupee
NTB Nepal Tourism Board
NTFP Non-timber forest product
PV Photovoltaic
RAP Rural Access Programme
REDD Reducing Emissions from Deforestation and Forest Degradation
SPS Sanitary and phytosanitary measures

Low carbon competitiveness in Nepal v
UNEP United Nations Environment Programme
WECS Water and Energy Commission Secretariat
Low carbon competitiveness in Nepal 1
1 Introduction
The Nepal Trade Integration Strategy 2010 identified the expansion of trade as one of the key drivers
of inclusive growth in Nepal going forward. This and the more recent Immediate Action Plan on
Economic Development and Prosperity, published in 2012, set out a number of policies to promote
export competitiveness and growth. The success of these policies will depend to a large extent on the
global trade patterns shaping the opportunities that Nepal faces.
Our analysis suggests that over the next 10 years, global trade patterns will be transformed by climate
change, international mitigation, and natural resource scarcity, resulting in an inevitable shift over time
to a low carbon global economy. This study has been asking what this might look like. What impact
will it have on Nepal’s competitiveness and growth? What threats and opportunities will it create? And
how should policy-makers and businesses respond?
Achieving competitiveness is important for achieving growth and development, and most countries are
keen to identify and support domestic sectors where they may have a competitive advantage. At the
same time, many countries are developing green growth or climate compatible development strategies
in order to promote sustainable growth trajectories. Yet these two sets of analysis are rarely brought
together to ask how climate change, mitigation policies and natural resource scarcity will affect
patterns of trade and comparative advantage at the global level, or to assess the implications of these
global changes for national policy.
These questions are the subject of a research programme that aims to analyse how these drivers might
affect economic prospects in low-income countries (LICs), and how they might achieve ‘low carbon
competitiveness’ (i.e. remain or become competitive in a future, low carbon global economy), and to
develop a ‘Low Carbon Competitiveness Diagnostic’ (LCCD), a framework to help policy-makers
analyse these issues in their own particular country context. The study does not purport to provide
detailed policy recommendations, as that can be done only on the basis of much more detailed
analysis. It simply aims to highlight these drivers of change and their possible impacts, to demonstrate
the importance of taking these trends into account when designing a national growth policy, and
ultimately to provide a diagnostic tool to assist with this analysis at the national level.
The programme explores these issues through case studies in three LICs: Cambodia, Kenya and Nepal.
The aim is to raise awareness and stimulate discussion about the issues at the national level in these
three countries, while at the same time facilitating the development of the diagnostic tool, which would
be applicable to a wider set of LICs. Once again, the objective is not to provide detailed policy
recommendations but rather to set out some possible policy and business responses to the issues
identified responses that would require further discussion and much more detailed analysis in each
particular country context. This Policy Brief is the output of the case study in Nepal.
1.1 Changing global trade patterns
The underlying hypothesis of this study is that the three drivers – increasing natural resource scarcity
(particularly with the growing global demand for energy), the impact of climate change, and the impact
of international climate change mitigation policies – will inevitably create transformational shifts in
prices and patterns of production and demand in future. And the changes in competitiveness patterns

Low carbon competitiveness in Nepal 2
generated are likely to have implications for countries’ growth strategies, and also for their incentives
to achieve low carbon growth. For example:
1. Increasing natural resource scarcity – particularly relating to energy, land and water, and partly
driven by economic growth in the emerging economies – will result in (for example)
higher oil prices, reducing the competitiveness of energy-intensive industries in oil importing
countries, which could enhance incentives for energy-efficiency measures in those countries
increased competition for land and water, which could strengthen incentives for effective
natural resource management and sustainable agricultural practices that improve land and
labour productivity.
2. Mitigation policies introduced at the global level or by trading partners, which may affect export
opportunities or import prices faced by developing countries, could result in (for example)
new standards requiring carbon footprinting of production in some sectors, potentially
reducing access to markets for relatively energy-intensive products or products which are not
certified
carbon taxation, which could lead to certain energy-intensive industries shifting to non-
mitigating countries (often termed ‘carbon leakage’), generating a possible trade-off between
competitiveness and low carbon growth
increased climate finance to support the development of new green industries such as
renewables (most likely from public funding sources in the short term, in the absence of
well-functioning carbon markets).
3. The impact of climate change – in the sense of planetary warming – will be significant for some
sectors. For example, climate change
will reduce yields and productivity of certain agricultural crops, undermining
competitiveness of those products
is reducing the efficacy of certain renewable energy sources, such as hydropower, in certain
contexts, undermining the competitiveness of countries reliant on them
threatens the prospects for tourism development by increasing the incidence of extreme
weather events and by reducing water supplies.
1.2 The potential impact on countries’ competitiveness and sources of growth
These changes could have significant implications for the sources of competitive advantage, growth,
and economic opportunity that countries will face going forward. Our initial analysis suggests that a
desire to remain competitive in the face of these drivers will generate a business case for low carbon
investment in some sectors. This is particularly important in light of the poor state of carbon markets,
which were previously seen as a key mechanism for funding the transition towards a low carbon
growth trajectory in developing countries. In the absence of this funding, understanding the economic
incentives that could help drive such a transition even in the absence of carbon markets will be key to
developing smart and well-targeted policy and donor support mechanisms in the short and medium
term.
However, in other cases there will be trade-offs between maintaining short-term competitiveness and
achieving low carbon growth. Therefore, the analysis will aim to identify both synergies and trade-offs
and identify implications for policy and donor support.
Policymakers are also faced with great uncertainty, relating for example to:
Fossil fuel discoveries and technological innovation which will affect the evolution of energy
prices going forward;
Future global and national climate change policy regimes;

Low carbon competitiveness in Nepal 3
The impact of climate change itself on different countries and economic activities;
How patterns of demand will change in response to the three global drivers identified.
In this work we have posited various outcomes in different sectors based on existing knowledge and
trends, but in many cases scenario analysis is warranted when weighing up different policy options, to
take account of the uncertainties surrounding various factors. It is intended that the LCCD to be
developed as the final output of this research programme will provide guidance on how scenario
analysis could be implemented to assist with decision-making. This uncertainty also highlights the
need for countries to adopt approaches to policy-making that allow for uncertainty, by building in
flexibility and keeping options open for example.
This study focuses on the opportunities and risks facing LICs in particular. Previous ODI analysis
suggests that competitiveness and growth prospects in LICs will be significantly affected by the global
trends discussed above, through their impact on trade patterns (Ellis et al, 2010). Thus,
competitiveness strategies in LICs will need to be reassessed if they are to be resilient in the face of
these changes.
The analytical framework for this study was set out in an ODI Working Paper (Ellis, 2013). It
identifies a number of transmission mechanisms through which the three drivers identified (natural
resource scarcity, climate change and international mitigation) could potentially affect
competitiveness, including
the creation of new markets (domestic or international) or a reduction in the size of existing
markets
changes in prices of exports and imports due to changes in global supply and demand
changes in costs due to changes in input prices
changes in flows of foreign direct investment, and location decisions by multinationals
impacts on the value of assets such as land, water resources, fossil fuel reserves, forests, etc.
increased climate finance
higher standards demanded in global value chains, and requirements for certification and
labelling
technology transfer.
1.3 The case study approach
The potential impacts identified in the analytical framework have now been assessed in detail in three
case study countries: Cambodia, Kenya and Nepal. This Policy Brief is the output of the case study in
Nepal.
The research programme covers the five tradable sectors of most relevance in terms of the trading and
production patterns of low income countries: agriculture, forestry, energy, tourism and manufacturing.
In each country case study we focused on three sectors; the energy sector was an area of focus in all
three countries, given its pivotal position both in determining overall country competitiveness and as a
potential export industry. The other two sectors were selected for each country depending on existing
patterns of production and potential, and with the objective of covering the five tradable sectors listed
above across the three country case studies. In Nepal we have focused on the energy sector, the
forestry sector and the tourism sector. We have looked at the issues in agriculture and manufacturing
through the other case studies.
The remainder of this Policy Brief sets out the findings from the Nepal case study. Chapter 2 provides
some background in the form of a brief description of Nepal’s existing economic structure and growth
dynamics; challenges and opportunities for growth and competitiveness as identified in recent studies
and indices; and the country’s growth and climate change response strategies. The Brief then examines
Low carbon competitiveness in Nepal 4
the energy, forestry and tourism sectors in turn, discussing the various opportunities and threats they
face, and possible implications and policy responses.
2 The economic context in Nepal
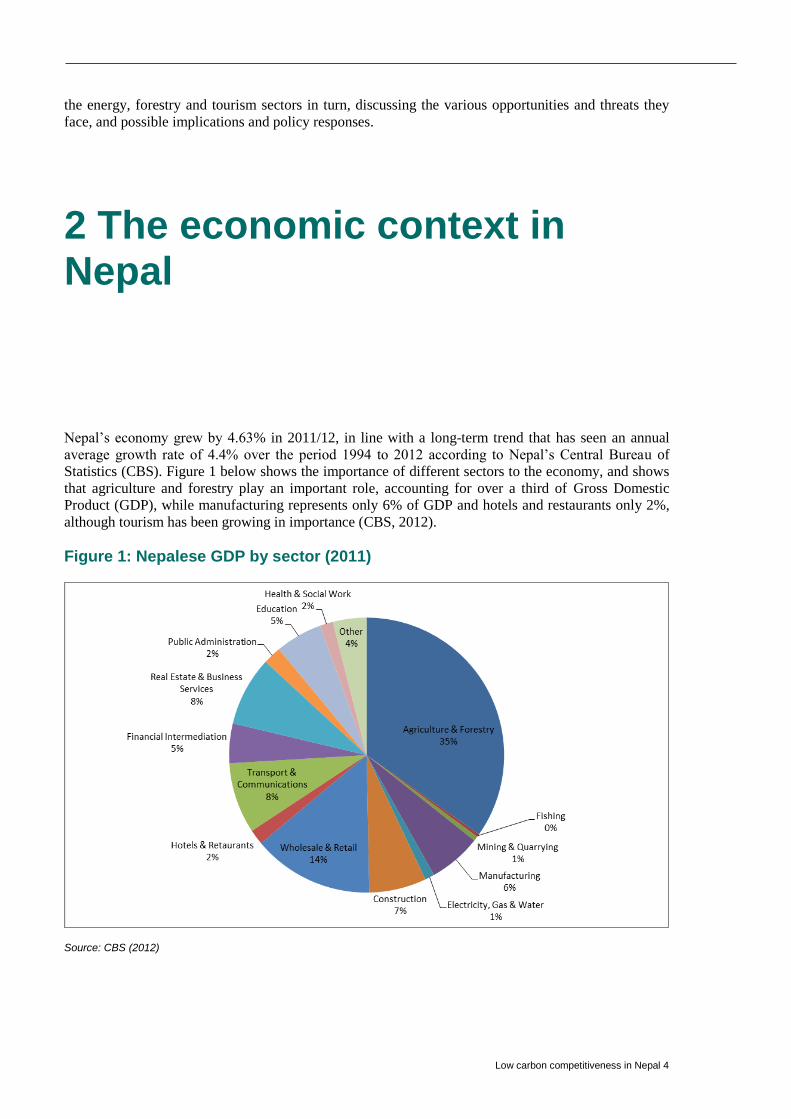
Nepal’s economy grew by 4.63% in 2011/12, in line with a long-term trend that has seen an annual
average growth rate of 4.4% over the period 1994 to 2012 according to Nepal’s Central Bureau of
Statistics (CBS). Figure 1 below shows the importance of different sectors to the economy, and shows
that agriculture and forestry play an important role, accounting for over a third of Gross Domestic
Product (GDP), while manufacturing represents only 6% of GDP and hotels and restaurants only 2%,
although tourism has been growing in importance (CBS, 2012).
Figure 1: Nepalese GDP by sector (2011)
Source: CBS (2012)
Low carbon competitiveness in Nepal 5
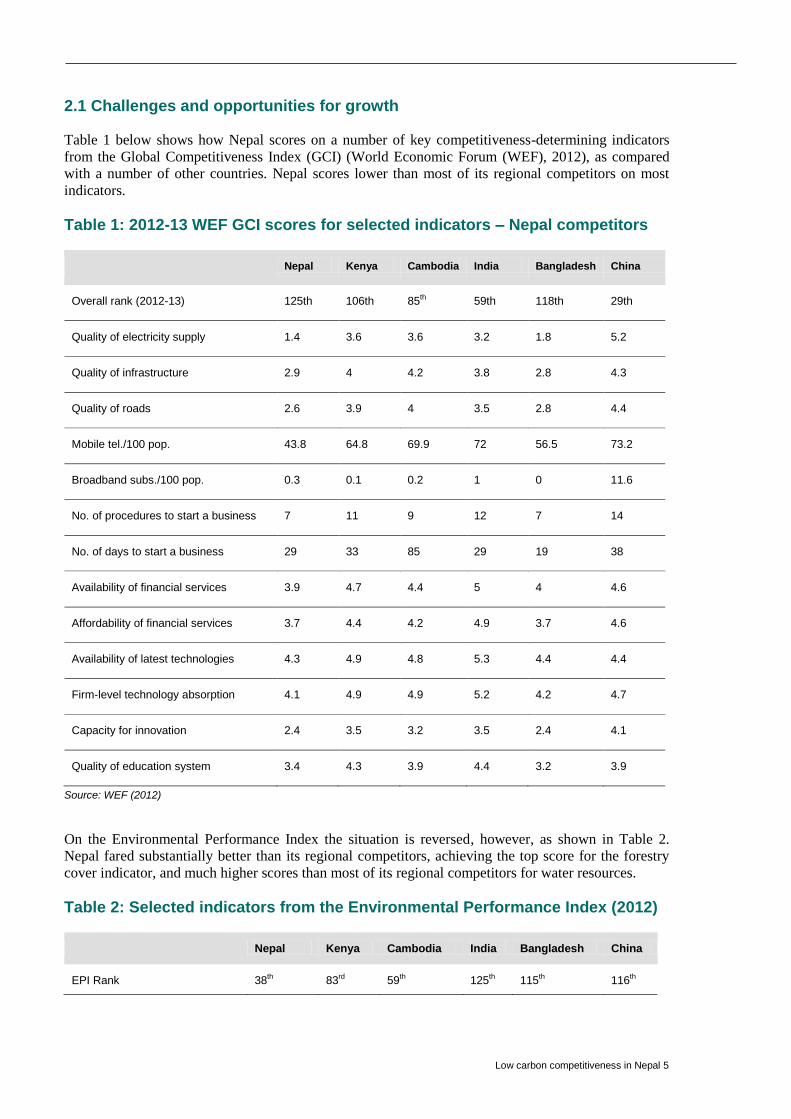
2.1 Challenges and opportunities for growth
Table 1 below shows how Nepal scores on a number of key competitiveness-determining indicators
from the Global Competitiveness Index (GCI) (World Economic Forum (WEF), 2012), as compared
with a number of other countries. Nepal scores lower than most of its regional competitors on most
indicators.
Table 1: 2012-13 WEF GCI scores for selected indicators – Nepal competitors
Nepal Kenya Cambodia India Bangladesh China
Overall rank (2012-13) 125th 106th 85th 59th 118th 29th
Quality of electricity supply 1.4 3.6 3.6 3.2 1.8 5.2
Quality of infrastructure 2.9 4 4.2 3.8 2.8 4.3
Quality of roads 2.6 3.9 4 3.5 2.8 4.4
Mobile tel./100 pop. 43.8 64.8 69.9 72 56.5 73.2
Broadband subs./100 pop. 0.3 0.1 0.2 1 0 11.6
No. of procedures to start a business 7 11 9 12 7 14
No. of days to start a business 29 33 85 29 19 38
Availability of financial services 3.9 4.7 4.4 5 4 4.6
Affordability of financial services 3.7 4.4 4.2 4.9 3.7 4.6
Availability of latest technologies 4.3 4.9 4.8 5.3 4.4 4.4
Firm-level technology absorption 4.1 4.9 4.9 5.2 4.2 4.7
Capacity for innovation 2.4 3.5 3.2 3.5 2.4 4.1
Quality of education system 3.4 4.3 3.9 4.4 3.2 3.9
Source: WEF (2012)
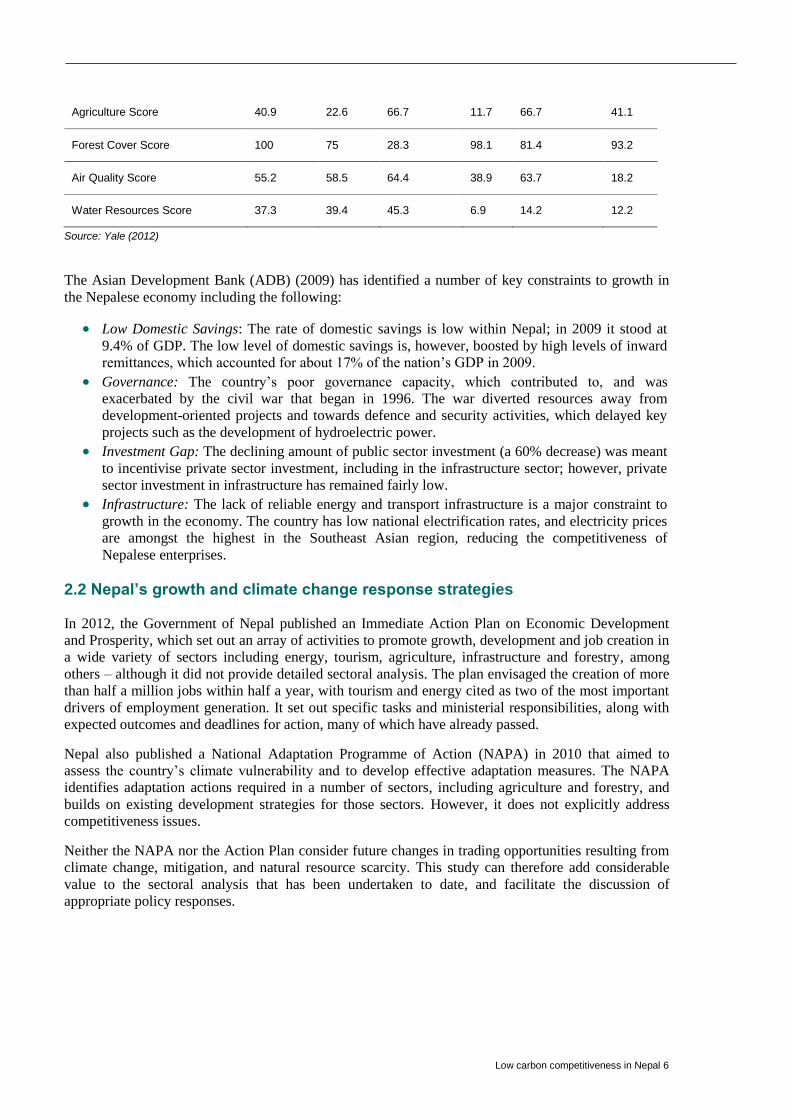
On the Environmental Performance Index the situation is reversed, however, as shown in Table 2.
Nepal fared substantially better than its regional competitors, achieving the top score for the forestry
cover indicator, and much higher scores than most of its regional competitors for water resources.
Table 2: Selected indicators from the Environmental Performance Index (2012)
Nepal Kenya Cambodia India Bangladesh China
EPI Rank 38th 83rd 59th 125th 115th 116th
Low carbon competitiveness in Nepal 6
Agriculture Score 40.9 22.6 66.7 11.7 66.7 41.1
Forest Cover Score 100 75 28.3 98.1 81.4 93.2
Air Quality Score 55.2 58.5 64.4 38.9 63.7 18.2
Water Resources Score 37.3 39.4 45.3 6.9 14.2 12.2
Source: Yale (2012)
The Asian Development Bank (ADB) (2009) has identified a number of key constraints to growth in
the Nepalese economy including the following:
Low Domestic Savings: The rate of domestic savings is low within Nepal; in 2009 it stood at
9.4% of GDP. The low level of domestic savings is, however, boosted by high levels of inward
remittances, which accounted for about 17% of the nation’s GDP in 2009.
Governance: The country’s poor governance capacity, which contributed to, and was
exacerbated by the civil war that began in 1996. The war diverted resources away from
development-oriented projects and towards defence and security activities, which delayed key
projects such as the development of hydroelectric power.
Investment Gap: The declining amount of public sector investment (a 60% decrease) was meant
to incentivise private sector investment, including in the infrastructure sector; however, private
sector investment in infrastructure has remained fairly low.
Infrastructure: The lack of reliable energy and transport infrastructure is a major constraint to
growth in the economy. The country has low national electrification rates, and electricity prices
are amongst the highest in the Southeast Asian region, reducing the competitiveness of
Nepalese enterprises.
2.2 Nepal’s growth and climate change response strategies
In 2012, the Government of Nepal published an Immediate Action Plan on Economic Development
and Prosperity, which set out an array of activities to promote growth, development and job creation in
a wide variety of sectors including energy, tourism, agriculture, infrastructure and forestry, among
others – although it did not provide detailed sectoral analysis. The plan envisaged the creation of more
than half a million jobs within half a year, with tourism and energy cited as two of the most important
drivers of employment generation. It set out specific tasks and ministerial responsibilities, along with
expected outcomes and deadlines for action, many of which have already passed.
Nepal also published a National Adaptation Programme of Action (NAPA) in 2010 that aimed to
assess the country’s climate vulnerability and to develop effective adaptation measures. The NAPA
identifies adaptation actions required in a number of sectors, including agriculture and forestry, and
builds on existing development strategies for those sectors. However, it does not explicitly address
competitiveness issues.
Neither the NAPA nor the Action Plan consider future changes in trading opportunities resulting from
climate change, mitigation, and natural resource scarcity. This study can therefore add considerable
value to the sectoral analysis that has been undertaken to date, and facilitate the discussion of
appropriate policy responses.

Low carbon competitiveness in Nepal 7
3 The energy sector
Nepal has one of the smallest carbon footprints in the world. Per capita emissions of greenhouse gases
are 0.1 tonne per year, a small fraction of the emissions in industrialised countries and much lower
than per capita emissions in its two large neighbours India (1.6 tonne/capita) and China (5.8
tonne/capita).1 Nepal’s grid electricity is among the cleanest in the world (3 grammes CO2e per kWh).
The country’s low-income status and late development start, reflected in low per capita energy
consumption, are clearly part of the explanation for Nepal’s current low carbon economy. Geography
and the country’s natural resource endowment are also part of the explanation. It is estimated that less
than 1% of Nepal’s hydropower potential has been exploited.
The availability and reliability of energy, especially electricity, are major constraints on growth,
competitiveness and living standards in Nepal. Close to 60% of the population has no access to
electricity, and those who do get electricity from the grid are currently subject to 12 or more hours a
day of load shedding. In the World Economic Forum’s 2012-13 Global Competitiveness Report, Nepal
was ranked 143rd, out of 144, for the quality of its electricity supply.
Renewable energy is set to become increasingly cost competitive as technologies mature, with some
renewable energy costs (e.g. solar, wind) already falling (Brown et al., 2011). In rural and remote
locations, decentralised renewable energy generation is often the most cost-effective option
(Intergovernmental Panel on Climate Change (IPCC), 2011), and its expansion – potentially supported
by new forms of climate finance – can support increased economic development and improved
competitiveness in those areas.
For Nepal’s growth and competitiveness, in the context of an increasingly carbon-constrained world,
the key questions for the energy sector are how to increase supply and whether this can be done in a
timely way without dramatically increasing energy-related greenhouse gas emissions.
3.1 The demand for energy
Total final energy consumption in Nepal was 9,878 ktoe (‘000 tonnes oil equivalent) in 2009.2
Residential consumption accounted for 88% of this, comprising mainly biomass consumption,
predominantly for cooking. Of the remaining 12%, almost half (47.7%) was consumed by the transport
sector, 30% by industry, 13% by services, and just over 9% by agriculture. See Table 3.
Table 3: Composition of total final energy consumption in 2009
Coal and
Peat
Oil
Products
Biofuels and
Waste
Electricity Total
(ktoe)
Industry 193 21 52 87 353
Transport 0 571 0 1 571
Residential 1 133 8450 99 8682
1 World Development Indicators (http://data.worldbank.org/indicator/EN.ATM.CO2E.PC).
2 International Energy Agency (http://www.iea.org/stats/balancetable.asp?COUNTRY_CODE=NP).

Low carbon competitiveness in Nepal 8
Commercial and public
services
0 73 50 32 155
Agriculture and forestry 0 109 0 5 113
Non-specified 0 0 0 4 4
Total final consumption 193 905 8552 227 9878
Source: IEA (International Energy Agency)
The demand for petroleum products (excluding aviation fuel) can be divided into demand for liquefied
petroleum gas (LPG), kerosene, petrol (motor gasoline) and diesel. LPG and kerosene are used mainly
for cooking and heating in urban areas. Demand for the former, even in rural areas, has been increasing
at the rate of 20% a year (partly to compensate for load shedding), while demand for kerosene is
declining. The consumer prices for LPG and diesel are subsidised.
Petrol and diesel are consumed primarily in the transport sector, according to official statistics, as
shown in Table 4. In the transport sector, apart from petrol and diesel, there is a very small demand for
electricity for ropeways and some vehicles.
Table 4: Consumption of petroleum products by sector 2009
LPG Motor
gasoline
Kerosene Diesel gasoline Total
(ktoe)
Industry 2 7 9
Transport 5 115 397 517
Residential 79 36 115
Services 57 5 62
Agriculture / Forestry 99 99
Total 141 115 43 503 802
Source: Water and Energy Commission Secretariat (WECS), 2010
Electricity consumption in 2009 was a little over 2% of Nepal’s total energy consumption and 17% of
commercial energy consumption. In the residential sector, which accounts for 43% of the electricity
consumed, electricity is used mainly for lighting, and increasingly for domestic appliances. In the
industrial sector (38% of electricity) is used for motive power, heating and lighting. The number of
residential consumers increased by an average of 10% a year between 2003 and 2012, and now stands
at over 2.2 million households3.
Overall energy consumption increased by an average of 2.2% a year in the period 2000-2009, lower
than GDP growth. Energy consumption by sector for the period is shown in Table 5 below.
Consumption grew by an average of 6.3% per year in the transport sector and 3.1% in the services
sector, while industrial consumption grew at a slower rate of 1.6% per year on average due to the slow
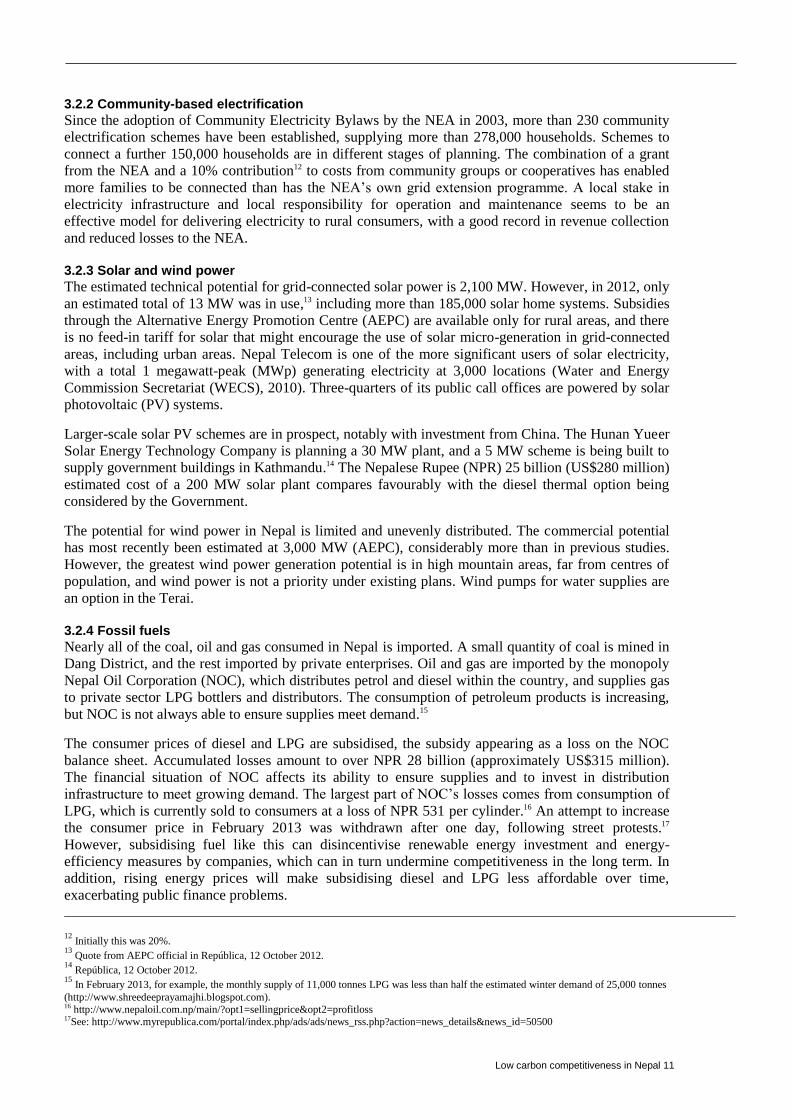
growth of the industrial sector. The Nepal Electricity Authority (NEA) forecast of electricity demand
3 Calculated from NEA Annual Reports.
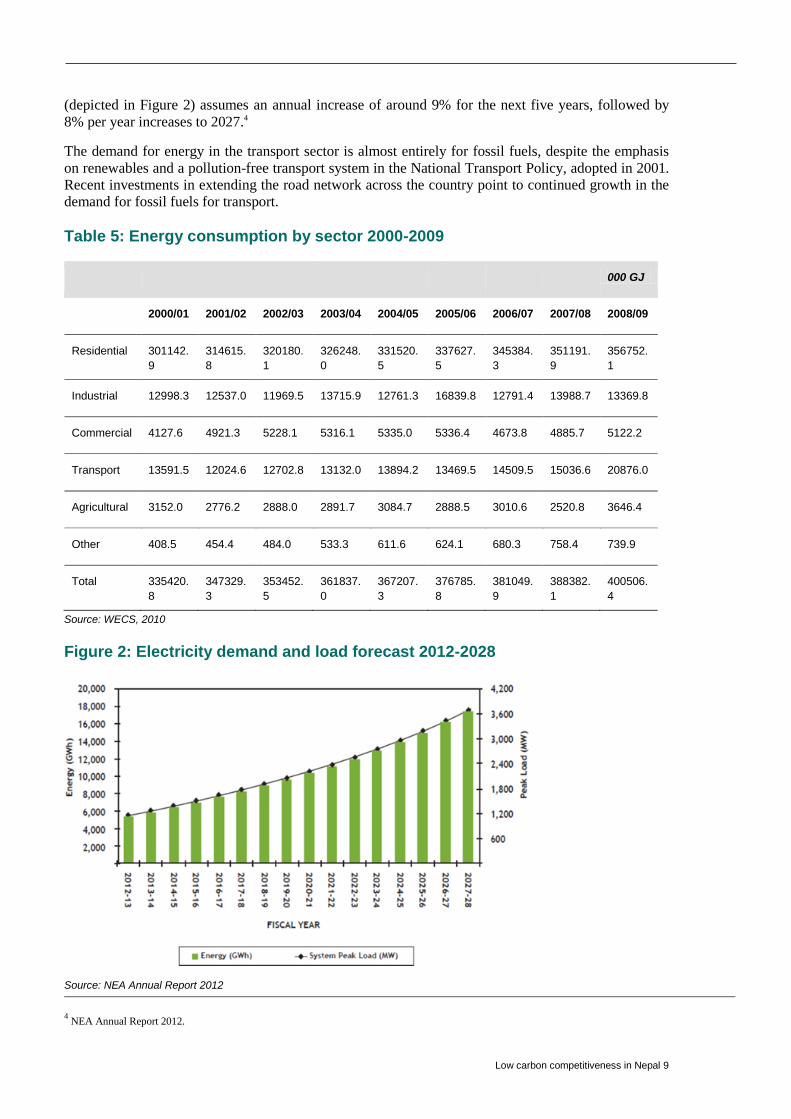
Low carbon competitiveness in Nepal 9
(depicted in Figure 2) assumes an annual increase of around 9% for the next five years, followed by
8% per year increases to 2027.4
The demand for energy in the transport sector is almost entirely for fossil fuels, despite the emphasis
on renewables and a pollution-free transport system in the National Transport Policy, adopted in 2001.
Recent investments in extending the road network across the country point to continued growth in the
demand for fossil fuels for transport.
Table 5: Energy consumption by sector 2000-2009
000 GJ
2000/01 2001/02 2002/03 2003/04 2004/05 2005/06 2006/07 2007/08 2008/09
Residential 301142.
9
314615.
8
320180.
1
326248.
0
331520.
5
337627.
5
345384.
3
351191.
9
356752.
1
Industrial 12998.3 12537.0 11969.5 13715.9 12761.3 16839.8 12791.4 13988.7 13369.8
Commercial 4127.6 4921.3 5228.1 5316.1 5335.0 5336.4 4673.8 4885.7 5122.2
Transport 13591.5 12024.6 12702.8 13132.0 13894.2 13469.5 14509.5 15036.6 20876.0
Agricultural 3152.0 2776.2 2888.0 2891.7 3084.7 2888.5 3010.6 2520.8 3646.4
Other 408.5 454.4 484.0 533.3 611.6 624.1 680.3 758.4 739.9
Total 335420.
8
347329.
3
353452.
5
361837.
0
367207.
3
376785.
8
381049.
9
388382.
1
400506.
4
Source: WECS, 2010
Figure 2: Electricity demand and load forecast 2012-2028
Source: NEA Annual Report 2012
4 NEA Annual Report 2012.

Low carbon competitiveness in Nepal 10
3.2 Energy supply
3.2.1 Electricity
The total installed capacity for electricity generation is 741.19 MW,5 92% of which is hydropower.
This includes 472.9 MW large hydropower and 54.41 MW diesel thermal in the public sector, and
158.3 MW medium and small hydropower owned by independent power producers (IPPs). Off-grid
small hydropower totals an estimated 4.5 MW, and micro-hydro capacity was estimated in 2009 to
total 13.9 MW6.
For several years, the supply of electricity from the grid (i.e. NEA) has been unable to meet demand.
Load shedding has been used to manage the gap between generation capacity and demand, averaging
12 hours a day at present and likely to increase during 2013. In recent years, transmission and
distribution losses of around 30% have added to the shortage.7 The response of many consumers to
load shedding has been to purchase a standby diesel generator. Estimates of the aggregate capacity of
these generators were put at 700-800 MW,8 which is roughly the same total capacity as NEA’s grid-
connected plants. In 2012, the Nepal Oil Corporation estimated the aggregate capacity of diesel
generators at 531 MW, consuming 40% of the country’s diesel.9
In 2008 the Government declared a ‘national energy crisis’ and adopted a 38-point Electricity Crisis
Management Plan. This action plan includes demand- and supply-side measures, such as development
of large hydropower by the private sector, and investment in infrastructure to enable the import of
electricity from India.
The gap between the demand and supply of grid electricity will not be closed for several years. (The
NEA’s load forecast is shown in Figure 2.) The capacity of new hydropower schemes currently under
construction or in planning stages suggests that there will be a gap at least until the end of the current
decade.10 New large hydropower schemes have a long lead time, which now includes extended time for
consultation and negotiation with affected communities, who have considerable political power in
Nepal today. Though large-scale schemes are a major part of Nepal’s strategy to exploit the country’s
hydropower resources, alternatives are being considered to bring additional generation capacity into
service more quickly.
One option proposed by the Government is the construction of a new 200 MW diesel thermal
generating plant. Though details of the proposal have not been made available and it is possible that it
will not be implemented, such a plant would entail a large increase in diesel consumption and
imports.11 The unit cost of power would be relatively high and only some form of subsidy would avoid
significant consumer price increases.
Investment in transmission and distribution infrastructure is also needed. Underinvestment in
transmission has contributed to a high level of losses, constrained electricity exchanges with India, and
limited access to power domestically. Between 2000 and 2010, NEA invested US$225 million in
transmission lines, estimated to be less than 30% of the value of electricity losses (Gautam, 2013).
Unaddressed, this under-investment will significantly constrain the potential future expansion of the
electricity supply. With sufficient finance, there would in fact be scope for Nepal to leapfrog older
grid technologies through the use of more modern and flexible smart grid technology, which would
enhance the potential for renewable energy development.
5 Department of Electricity Development (www.doed.gov.np).
6 There were also 6,253 water mills providing direct mechanical power for grain milling with a total capacity equivalent to 15.2 MW (WECS,
2010). 7 Losses in 2011/12 were 26.4% (NEA, 2012), down from 34% in 2010. A proportion of these losses are due to unofficial consumption and
poor revenue collection, as well as technical faults and poor maintenance of the infrastructure. 8 Estimates provided by informants during interviews in February 2013.
9 Kathmandu Today, 7 May 2012. http://www.ktm2day.com/2012/05/07/diesel-provides-531-mw-of-electricity/
10 The addition of 1,375 MW by 2017, from projects recently completed or under construction, would mean a 900 MW gap in five years’
time according to one commentator (http://www.ekantipur.com/2013/01/29/development/energy-efficient-technologies-to-better-rural-lives/366245.html). 11
Operating 10 hours a day, it would consume 700,000 litres diesel a day or 255,500 kl a year.
Low carbon competitiveness in Nepal 11
3.2.2 Community-based electrification
Since the adoption of Community Electricity Bylaws by the NEA in 2003, more than 230 community
electrification schemes have been established, supplying more than 278,000 households. Schemes to
connect a further 150,000 households are in different stages of planning. The combination of a grant
from the NEA and a 10% contribution12 to costs from community groups or cooperatives has enabled
more families to be connected than has the NEA’s own grid extension programme. A local stake in
electricity infrastructure and local responsibility for operation and maintenance seems to be an
effective model for delivering electricity to rural consumers, with a good record in revenue collection
and reduced losses to the NEA.
3.2.3 Solar and wind power
The estimated technical potential for grid-connected solar power is 2,100 MW. However, in 2012, only
an estimated total of 13 MW was in use,13 including more than 185,000 solar home systems. Subsidies
through the Alternative Energy Promotion Centre (AEPC) are available only for rural areas, and there
is no feed-in tariff for solar that might encourage the use of solar micro-generation in grid-connected
areas, including urban areas. Nepal Telecom is one of the more significant users of solar electricity,
with a total 1 megawatt-peak (MWp) generating electricity at 3,000 locations (Water and Energy
Commission Secretariat (WECS), 2010). Three-quarters of its public call offices are powered by solar
photovoltaic (PV) systems.
Larger-scale solar PV schemes are in prospect, notably with investment from China. The Hunan Yueer
Solar Energy Technology Company is planning a 30 MW plant, and a 5 MW scheme is being built to
supply government buildings in Kathmandu.14 The Nepalese Rupee (NPR) 25 billion (US$280 million)
estimated cost of a 200 MW solar plant compares favourably with the diesel thermal option being
considered by the Government.
The potential for wind power in Nepal is limited and unevenly distributed. The commercial potential
has most recently been estimated at 3,000 MW (AEPC), considerably more than in previous studies.
However, the greatest wind power generation potential is in high mountain areas, far from centres of
population, and wind power is not a priority under existing plans. Wind pumps for water supplies are
an option in the Terai.
3.2.4 Fossil fuels
Nearly all of the coal, oil and gas consumed in Nepal is imported. A small quantity of coal is mined in
Dang District, and the rest imported by private enterprises. Oil and gas are imported by the monopoly
Nepal Oil Corporation (NOC), which distributes petrol and diesel within the country, and supplies gas
to private sector LPG bottlers and distributors. The consumption of petroleum products is increasing,
but NOC is not always able to ensure supplies meet demand.15
The consumer prices of diesel and LPG are subsidised, the subsidy appearing as a loss on the NOC
balance sheet. Accumulated losses amount to over NPR 28 billion (approximately US$315 million).
The financial situation of NOC affects its ability to ensure supplies and to invest in distribution
infrastructure to meet growing demand. The largest part of NOC’s losses comes from consumption of
LPG, which is currently sold to consumers at a loss of NPR 531 per cylinder.16 An attempt to increase
the consumer price in February 2013 was withdrawn after one day, following street protests.17
However, subsidising fuel like this can disincentivise renewable energy investment and energy-
efficiency measures by companies, which can in turn undermine competitiveness in the long term. In
addition, rising energy prices will make subsidising diesel and LPG less affordable over time,
exacerbating public finance problems.
12 Initially this was 20%.
13 Quote from AEPC official in República, 12 October 2012.
14 República, 12 October 2012.
15 In February 2013, for example, the monthly supply of 11,000 tonnes LPG was less than half the estimated winter demand of 25,000 tonnes
(http://www.shreedeeprayamajhi.blogspot.com). 16 http://www.nepaloil.com.np/main/?opt1=sellingprice&opt2=profitloss 17See: http://www.myrepublica.com/portal/index.php/ads/ads/news_rss.php?action=news_details&news_id=50500
Low carbon competitiveness in Nepal 12
3.2.5 Bioenergy
Biogas
The installation of household biogas digesters has been growing rapidly, and more than 200,000 have
been installed nationwide according to one source. Estimates of the potential for biogas in Nepal range
from 1.2 million to 2.9 million units. Most of the potential is in the Terai, where conditions are more
favourable for biogas production. The promotion of biogas use through AEPC’s Biogas Support
Programme has resulted in the establishment of around 594 private biogas installation companies and
16 biogas appliance manufacturing enterprises. Subsidised loans for biogas are provided through 163
microfinance institutions (Basnyat, 2011). SNV, which supported the development and promotion of
biogas in Nepal, is now turning its attention to commercial biogas plants using animal or agro-waste as
feedstock. The introduction of feed-in tariffs could make such investment more financially viable.
Biofuels
Ethanol and biodiesel production in Nepal is at the experimental stage. The area under cultivation for
biofuels is small and widely dispersed (ibid.). Though the Government announced a mandate for NOC
to sell petrol with 10% ethanol content from January 2004, this has not been implemented. The
National Biofuels Programme under AEPC is promoting Jatropha for biodiesel production. Two
processing plants at Jhumsa, Palpa District, and Ramnagar, Chitwan District, have been established,
each with a capacity of 1,000 barrels per day. Two private companies (Everest Bio-Diesel and Crystal
Bio-energy) are also exploring the potential of Jatropha.18 The strategy that has been drafted for
biofuels proposes the use of waste land for biofuel crop production, and subsidised inputs to farmers.
Analysis to date suggests that biofuel production would be unviable without subsidies to farmers
(Basnyat, 2011). Given the poor food security of many communities in Nepal, the commercial
production of biofuels would have to take account of its effects upon land and water resources. It may
also be possible to develop dual crops, which provide both energy and food (e.g. maize, soya beans
and sugarcane).
3.3 The impact of climate change
Climate change projections for Nepal suggest there will be rising temperatures and changes in rainfall
patterns. Although there is considerable uncertainty around impacts on rainfall, the potential for
prolonged dry spells has been identified (Dixit, 2011). Thus climate change could significantly reduce
the hydropower potential of Nepal. A Government initiated research project (supported by the Climate
and Development Knowledge Network (CDKN)) will examine the evidence about the impact of
climate change on hydropower and agriculture with findings due later in 2013.
Most of Nepal’s hydropower capacity is run-of-river, so power generation depends on the levels of
water in rivers with hydropower schemes. The demand for electricity within Nepal is highest during
the dry season, when rivers are at their lowest. Many hydropower plants are now reportedly operating
significantly below capacity (50-60%) in the dry season because of low water levels (Shrestha, 2010).
Changes in the water resource due to climate change will affect total power generation and the
viability of individual schemes. However, research to date has focused on the longer-term effects of
climate change, with less being known about short- and medium-term effects (MOSTE, 2013).19
Uncertainty about the water resource increases the risk for investors, which could translate into higher
electricity prices for consumers.
The Government’s strategy for energy supply will need to become resilient to the effects of climate
change. This perhaps suggests more focus on small hydro, spreading the risk by having more dispersed
sites for power generation. It also suggests diversification of renewable energy sources, supporting and
enabling investment in solar PV and wind energy. AEPC, along with Practical Action, produced some
district-level energy improvement plans that aimed to improve the sensitivity to climate change of
energy planning (AEPC, 2011), though it is not clear to what extent the plans have been implemented.
18 República, 30 June 2012. 19
Ministry of Science, Technology and Environment (2013) Economic Impact Assessment of Climate Change in Key Sectors in Nepal:
Study Inception Report, Kathmandu: Government of Nepal.
Low carbon competitiveness in Nepal 13
3.4 Export potential
The export of hydroelectricity to India has been a subject of debate for many years. It is argued that
Nepal’s large hydropower potential is a significant resource that could be exploited for economic gain,
particularly given the shortage of electricity in India, and the high carbon content of the electricity that
is generated there.
One of the barriers to exporting significant amounts of power has been the lack of adequate cross-
border infrastructure. Interconnections already exist, and power is exchanged with India, but the
capacity is limited. The Muzaffarpur-Dhalkebar line, to be built under the World Bank-supported
Nepal-India Electricity Transmission and Trade Project, will have a capacity of 1,000 MW at 400 kV.
It is expected that this project (due for completion in 2016) will be used to import electricity, at least
during its first few years, thus increasing supply, and potentially helping to reduce variability of supply
arising from seasonal variation in hydropower generation potential.
Even with the infrastructure in place, the lower cost of electricity generation in India is likely to limit
the demand for imports from Nepal20 as well as the attractiveness of investing in Nepal for Indian
investors. The precarious financial situation of Indian state power utilities, combined with NEA’s
financial situation, also increases the risks for private investors.
3.5 Energy efficiency
According to those consulted, measures to improve energy efficiency in the industrial and commercial
sectors have had limited uptake. Despite the potential for financial returns from investment in energy
efficiency, the imperative to secure their supply of energy (electricity) has been the priority for
companies. The Nepal Energy Efficiency Programme (NEEP) identifies the hotel, food and beverage,
metal, cement, pulp and paper, cold storage, soap-making, chemical and brick-making industries as the
most energy-intensive sectors21.
The potential for energy savings has been estimated as 15% in electricity consumption and 30% in
thermal energy,22 valued at an estimated NPR 6,337 million.23 These estimated energy savings would
reduce CO2e emissions by 507,247 tonnes a year: 62% from brick-making, 17% from cement and 11%
from food industries. This is equivalent to about 15% of the country’s total emissions of greenhouse
gases.
Energy-efficiency measures have the potential to improve Nepal’s competitiveness considerably. LICs
tend to have higher energy intensity in production than developed countries, and thus their
competitiveness will be more adversely affected by high and rising energy prices in future.
3.6 Investment climate
A priority for enhancing Nepal’s international competitiveness is expansion of the country’s electricity
generation capacity. Private sector investment will be necessary for this, and has been part of the
strategy for the sector since the 1990s. The Electricity Crisis Management Plan (2008) and the
Immediate Action Plan on Economic Development and Prosperity (2012) both envisage investment by
the private sector to achieve their objectives. Large-scale hydropower developments (i.e. schemes of
hundreds or thousands of MW) will require foreign investment, commercial and concessional. For
small hydro, however, there is scope for local investors, if the risks and returns are attractive enough.
20 The cost of electricity in Nepal was estimated to be NPR 9.05/kWh, though only high consumers pay this amount. Kathmandu Post, 7 Dec
2012. 21
http://wecs-neep.gov.np/article-about 22
These estimates echo those from a previous study under the Danida-supported Environment Sector Programme Support (ESPS)
programme. 23
www.wecs-neep.gov.np/

Low carbon competitiveness in Nepal 14
There is no shortage of identified opportunities. Licenses for the construction of 57 new generation
schemes and survey licenses for a further 392 have been awarded.24 However, construction is not
taking place at the rate required to quickly close the gap between electricity supply and demand. The
four key interrelated reasons for this are
bureaucratic delays, associated with poorly defined procedures and limited institutional
capacity, including for example absence of an agreed format for Project Development
Agreements (PDAs), and the negotiation of individual Power Purchase Agreements (PPAs)25
ill-defined mechanisms and procedures for incorporating local community interests and benefit
sharing in grid-connected large hydropower schemes
uncoordinated evolution of the responsibilities and remits of key institutions (NEA, AEPC), in
the absence of an overall regulatory authority and clear Government direction (power sector
reform has not gone as far as in many other countries to organisationally separate generation,
transmission and distribution; and accountability mechanisms are weak)
high risks for commercial investors, due to uncertainties from a combination of political and
market factors.26
These factors are connected to the political instability and weak governance that characterise
assessments of the country’s overall investment climate and international competitiveness. Institutional
reform in the energy sector to take operational decision-making out of the political arena would be one
means to improve things.
There is the potential for Clean Development Mechanism (CDM) benefits for LIC producers of
renewable energy and energy-efficiency measures. However, carbon prices have been falling and are
expected to remain low in the short to medium term. As a result, the carbon revenue from CDM
projects in LICs will be lower than was expected when the projects were initiated, reducing the
attractiveness of future investments in the short to medium term at least. The carbon price is generally
predicted to rise over the long term (IPCC, 2007; UK Department of Energy & Climate Change
(DECC), 2011), but the size and pace of that increase is unclear, as it will depend on the extent of
international mitigation. Voluntary carbon markets are a more promising source of finance, and public
climate finance also is likely to become increasingly available for investment in renewable energy
generation, and may provide an important new source of funding for investment in LICs. The Clean
Energy Development Bank is an example of this. Established in Nepal in 2006, the Bank has been
receiving support and cooperation from a number of different donors.
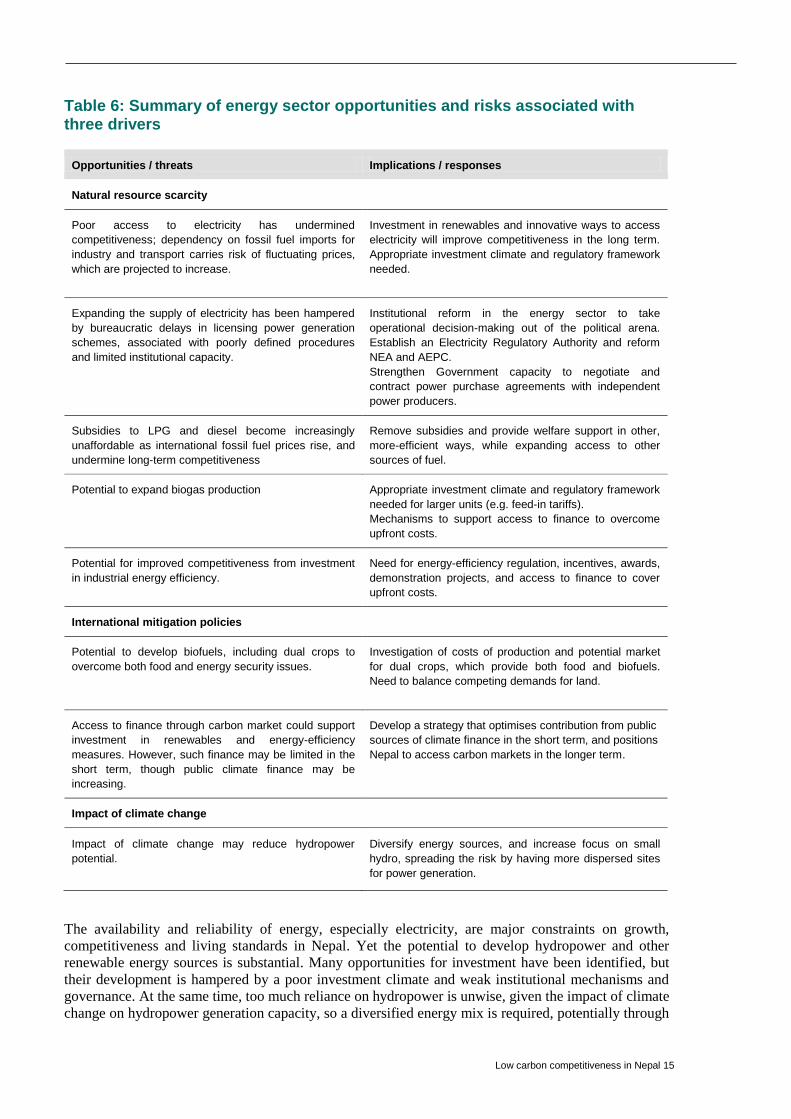
3.7 Conclusion
Table 6 below summarises the main opportunities and risks that are currently faced in Nepal’s energy
sector, associated with the relevant drivers identified at the beginning of this report: natural resource
scarcity, international mitigation policies and climate change. Possible policy and business responses
are suggested, for further discussion and exploration.
24 Registered applications for survey licences total 1,369 (see http://www.doed.gov.np/). However, the fees were recently increased, and
many of these are expected to lapse. 25
For schemes below 25 MW there is now a standardised PPA with set prices allowing for inflationary increases (currently NRs 8.4/kWh in
the dry season and NRs. 4.8/kWh in the wet season). For larger schemes PPAs are negotiated case by case. 26
Risks due to climate change did not appear to be a factor in the thinking of informants interviewed in February 2013.
Low carbon competitiveness in Nepal 15
Table 6: Summary of energy sector opportunities and risks associated with three drivers
Opportunities / threats Implications / responses
Natural resource scarcity
Poor access to electricity has undermined
competitiveness; dependency on fossil fuel imports for
industry and transport carries risk of fluctuating prices,
which are projected to increase.
Investment in renewables and innovative ways to access
electricity will improve competitiveness in the long term.
Appropriate investment climate and regulatory framework
needed.
Expanding the supply of electricity has been hampered
by bureaucratic delays in licensing power generation
schemes, associated with poorly defined procedures
and limited institutional capacity.
Institutional reform in the energy sector to take
operational decision-making out of the political arena.
Establish an Electricity Regulatory Authority and reform
NEA and AEPC.
Strengthen Government capacity to negotiate and
contract power purchase agreements with independent
power producers.
Subsidies to LPG and diesel become increasingly
unaffordable as international fossil fuel prices rise, and
undermine long-term competitiveness
Remove subsidies and provide welfare support in other,
more-efficient ways, while expanding access to other
sources of fuel.
Potential to expand biogas production
Appropriate investment climate and regulatory framework
needed for larger units (e.g. feed-in tariffs).
Mechanisms to support access to finance to overcome
upfront costs.
Potential for improved competitiveness from investment
in industrial energy efficiency.
Need for energy-efficiency regulation, incentives, awards,
demonstration projects, and access to finance to cover
upfront costs.
International mitigation policies
Potential to develop biofuels, including dual crops to
overcome both food and energy security issues.
Investigation of costs of production and potential market
for dual crops, which provide both food and biofuels.
Need to balance competing demands for land.
Access to finance through carbon market could support
investment in renewables and energy-efficiency
measures. However, such finance may be limited in the
short term, though public climate finance may be
increasing.
Develop a strategy that optimises contribution from public
sources of climate finance in the short term, and positions
Nepal to access carbon markets in the longer term.
Impact of climate change
Impact of climate change may reduce hydropower
potential.
Diversify energy sources, and increase focus on small
hydro, spreading the risk by having more dispersed sites
for power generation.
The availability and reliability of energy, especially electricity, are major constraints on growth,
competitiveness and living standards in Nepal. Yet the potential to develop hydropower and other
renewable energy sources is substantial. Many opportunities for investment have been identified, but
their development is hampered by a poor investment climate and weak institutional mechanisms and
governance. At the same time, too much reliance on hydropower is unwise, given the impact of climate
change on hydropower generation capacity, so a diversified energy mix is required, potentially through
Low carbon competitiveness in Nepal 16
the development of other technologies such as solar PV and wind energy. This would require the
extension of incentives (e.g. feed-in tariffs, and investment support) to renewable energy.
Almost all of the fossil fuels used within Nepal are imported, and diesel and LPG are subsidised.
Financial constraints hamper the ability of NOC to ensure supplies and to invest in distribution
infrastructure to meet growing demand. Subsidising fuel also disincentivises renewable energy
investment and energy-efficiency measures by companies, which can in turn undermine
competitiveness in the long term. In addition, rising energy prices will make subsidising diesel and
LPG less affordable over time, exacerbating public finance problems.
There are many economic opportunities that could be explored relating to possible new markets for
biogas and biofuels. In addition, there is much scope to undertake energy-efficiency measures, which
could significantly improve the competitiveness of Nepal’s industries. Such measures have generated
substantial savings in other LICs that have taken a more proactive approach to incentivising the private
sector through energy audits and regulation.
Climate finance and carbon markets can potentially support investment in renewable energy and
energy-efficiency measures in LICs. While some effort has been expended – by government, donors
and businesses alike – in developing projects that incorporate finance from carbon markets (through
CDM for example) into the business case, in practice this unfortunately now seems unlikely to yield
much finance in the short term. Thus a shift in focus seems warranted, to support and incentivise the
kinds of investments discussed here, which are linked to a wider business case based on energy prices.
Given Nepal’s current profile as a LIC with considerable potential for renewables development, the
country should be well positioned to secure public climate finance to support these kinds of
investments.
Low carbon competitiveness in Nepal 17
4 The forestry sector
It is estimated that around 40% of Nepal is currently forested,27 and many households within Nepal live
in or close to forest areas and are dependent on them for their livelihoods. Sources suggest that 11-18
million people are forest dependent within Nepal.28 However, it is also estimated that Nepal lost its
forest cover at the rate of 1.7% per annum during the period 1978/79 to1994, according to the Food
and Agriculture Organization of the United Nations (FAO).29 The rate of forest and shrub depletion
was 0.5% per annum during the same period. (The national forest inventory has not been updated since
then, so more recent data on forest cover is unavailable.) As in other countries, the forests in Nepal
inevitably compete with other land uses (Ministry of Forest and Soil Conservation (MoFSC), 2009).
Forests in the hills have been cleared primarily for agricultural activities, while those in the terai (low
lying land) have long been used for agriculture, settlement and infrastructure development, and
continue to suffer from illegal logging.
Some of these processes are part and parcel of development, and some degree of forest exploitation is
inevitable and indeed desirable in a growing economy. However, much of this activity is
unsustainable, such as illegal logging. While lucrative in the short term, this results in depletion of
natural assets and land degradation, with many land areas previously covered by forests becoming
barren, which undermines growth in the long term. Livelihoods based on more-sustainable harvesting
of forest products, including both timber and non-timber products, will be jeopardised by these
unsustainable uses of the forest.
Over time, various policy measures have been put in place to try and manage the forest more
sustainably. One of these is the community forestry programme, which has had quite a degree of
success. Giving control to forest user groups, whose ongoing livelihoods depend on the forest, creates
incentives for sustainable forest management by the community itself. This model has worked
particularly well in the mid-hills region, though less so in the terai, where better road links make illegal
logging easier and more lucrative.
One part of the solution to unsustainable forest use is appropriate legal control and better enforcement
of existing laws and regulations. But another part is creating a stronger incentive to protect the forest,
by facilitating the development of alternative livelihoods that are consistent with forest conservation,
including ecotourism, sustainable harvesting of timber or fuel wood, and the sustainable harvesting and
sale of non-timber forest products (NTFPs) such as medicinal and aromatic plants, paper and paper
products, furniture and handicrafts. In addition, when more fully developed, carbon market
mechanisms such as REDD+ promise to remunerate better forest management; thus, forests can be
seen as an asset that could increase in value over time.
4.1 Forest management regimes in Nepal
Policy measures to protect the forests date back to 1957, when all the forests in Nepal were
nationalised with the primary objective of their protection. However, deforestation continued unabated.
The realisation that forest protection was not possible without the buy-in of the population paved the
way for community participation in forestry sector management.
27http://dof.gov.np/about-us/functions-of-dof
28http://www.dfid.gov.uk/r4d/PDF/Outputs/Forestry/ZF0163_-_forest_dependent_people_Nepal.pdf
29http://www.forestrynepal.org/images/publications/fra_2010_nepal.pdf
Low carbon competitiveness in Nepal 18
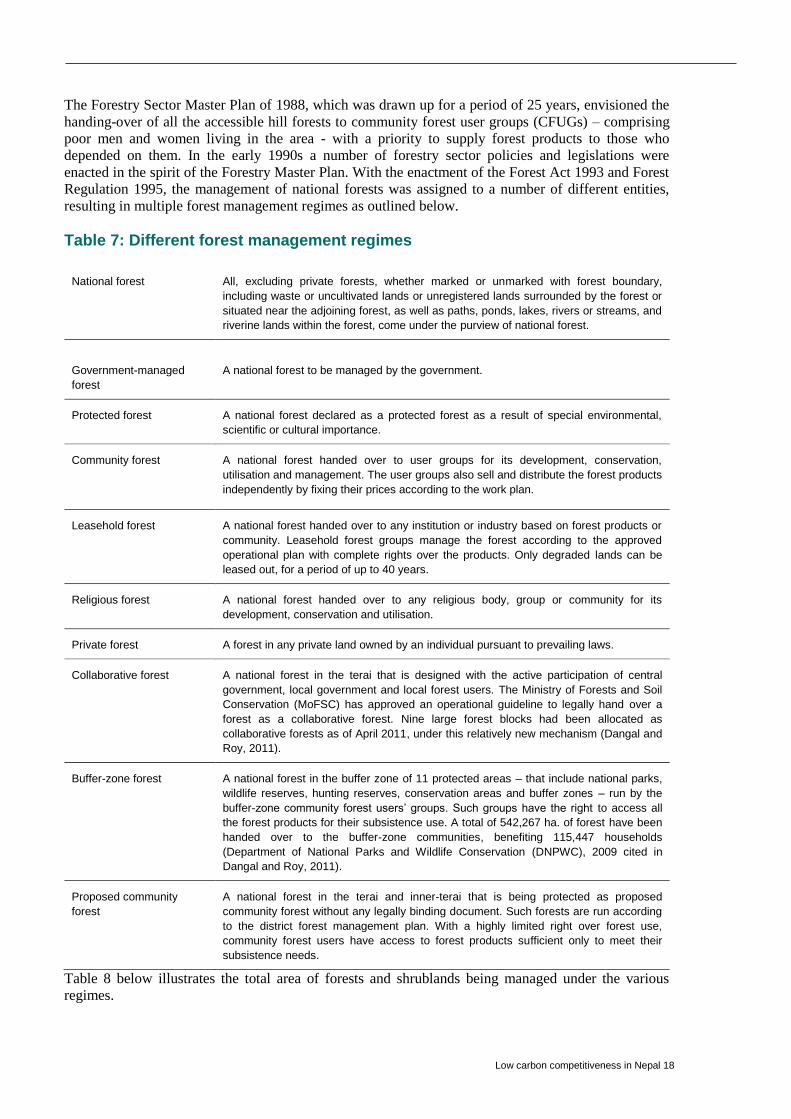
The Forestry Sector Master Plan of 1988, which was drawn up for a period of 25 years, envisioned the
handing-over of all the accessible hill forests to community forest user groups (CFUGs) – comprising
poor men and women living in the area - with a priority to supply forest products to those who
depended on them. In the early 1990s a number of forestry sector policies and legislations were
enacted in the spirit of the Forestry Master Plan. With the enactment of the Forest Act 1993 and Forest
Regulation 1995, the management of national forests was assigned to a number of different entities,
resulting in multiple forest management regimes as outlined below.
Table 7: Different forest management regimes
National forest All, excluding private forests, whether marked or unmarked with forest boundary,
including waste or uncultivated lands or unregistered lands surrounded by the forest or
situated near the adjoining forest, as well as paths, ponds, lakes, rivers or streams, and
riverine lands within the forest, come under the purview of national forest.
Government-managed
forest
A national forest to be managed by the government.
Protected forest A national forest declared as a protected forest as a result of special environmental,
scientific or cultural importance.
Community forest A national forest handed over to user groups for its development, conservation,
utilisation and management. The user groups also sell and distribute the forest products
independently by fixing their prices according to the work plan.
Leasehold forest A national forest handed over to any institution or industry based on forest products or
community. Leasehold forest groups manage the forest according to the approved
operational plan with complete rights over the products. Only degraded lands can be
leased out, for a period of up to 40 years.
Religious forest A national forest handed over to any religious body, group or community for its
development, conservation and utilisation.
Private forest A forest in any private land owned by an individual pursuant to prevailing laws.
Collaborative forest A national forest in the terai that is designed with the active participation of central
government, local government and local forest users. The Ministry of Forests and Soil
Conservation (MoFSC) has approved an operational guideline to legally hand over a
forest as a collaborative forest. Nine large forest blocks had been allocated as
collaborative forests as of April 2011, under this relatively new mechanism (Dangal and
Roy, 2011).
Buffer-zone forest A national forest in the buffer zone of 11 protected areas – that include national parks,
wildlife reserves, hunting reserves, conservation areas and buffer zones – run by the
buffer-zone community forest users’ groups. Such groups have the right to access all
the forest products for their subsistence use. A total of 542,267 ha. of forest have been
handed over to the buffer-zone communities, benefiting 115,447 households
(Department of National Parks and Wildlife Conservation (DNPWC), 2009 cited in
Dangal and Roy, 2011).
Proposed community
forest
A national forest in the terai and inner-terai that is being protected as proposed
community forest without any legally binding document. Such forests are run according
to the district forest management plan. With a highly limited right over forest use,
community forest users have access to forest products sufficient only to meet their
subsistence needs.
Table 8 below illustrates the total area of forests and shrublands being managed under the various
regimes.

Low carbon competitiveness in Nepal 19
Table 8: Forest and shrublands under different institutional regimes
Community
forests
Leasehold
forests
Collaborative
forests
Forests
under
protected
areas
Government
forests or
residual
forests
Total
Total area in ha. 1,350,873 23,534 10,936 887,000 3,555,967 5,828,310
Percent 23.18 0.4 0.19 15.22 61.01 100
Source: Poudyal (2009), community forest data from DoF (up to 15 April 2011) cited in Dangal and Roy, 2011.
4.2 Community forestry programme – a success story?
Community forestry has been seen as a success story in promoting sustainable use of forests in Nepal.
According to the Community Forestry Division (CFD) at the Department of Forests (DoF),30 a total of
18,133 CFUGs, covering an area of 1,700,048 ha. (11.55% of the total area of the country) had been
established as of August 2013. This covers 2,237,195 households in 74 of the 75 districts in Nepal, or
41.22% of the total households (5,427,302) in Nepal.
Forests are an integral component of livelihoods in Nepal. The Livelihoods and Forestry Programme
(LFP) (2009a) (a DFID funded project designed to promote more equitable, efficient, and sustainable
use of forest and other natural resources), cited in Bhattarai (2011), showed that the community forests
(CFs) contributed about 25.4% to increased incomes of the households under the LFP.31 The time
saved in gathering essential products from the forest, and the income-generating activities run under
the LFP, were the major factors that contributed to this income growth. The Multi Stakeholder Forestry
Program (MSFP) (a new programme designed to promote sustainable forest livelihoods, discussed
below), also cited in Bhattarai (2011), reports the direct benefits of community forestry in the form of
extraction of timber, fuel wood, fodder, grass and leaf; while indirect benefits come in the form of
higher carbon sequestration, soil stabilisation, reduced flood risks and improved biodiversity, among
other things.
Several studies have reported the success of community forestry in controlling deforestation and
degradation in Nepal. Branney and Yadav (1998), cited in MoFSC (2009), report an increase of 29%
basal area for degraded CFs in four years.32 Similarly, according to LFP (2009a), in 14 years there was
a 21% increase in biomass across CFs of all types and conditions. In the case of protected areas, the
participatory management of buffer zones has been relatively successful compared with a strict
protection system. Moreover, the success of community forestry is reflected in the overall
improvement of forest conditions, social mobilisation, poverty reduction, institutional development
and creation of rural employment (Dangal and Roy, 2011). The sense of ownership of forests among
the local people is also seen as a testament to the success of the community forestry programme in
Nepal. A recent study reviewing the thirty years of community forestry in Nepal, commissioned by the
MoFSC, applauds community forestry and participatory area management for their path-breaking
achievements since the 1980s, which, according to the study, are globally recognised as best practice
models (MoFSC, 2013).
Despite the success of community forestry however, government directives have been curtailing the
rights of the communities, and have effectively halted the CFs handover processes processes (Dangal
and Roy 2011). Moreover, the environmental guidelines enforced since 2005 make it mandatory to do
an initial environmental examination (IEE) for areas over 200 ha., and an environmental impact
assessment (EIA) for areas over 500 ha., before handing them over to the communities. Such
30http://dof.gov.np/wp-content/uploads/2013/07/Summary%20of%20Community%20Forest%20Data.pdf (accessed 15 August 2013)
31http://www.forestrynepal.org/project/40(accessed 28 March 2013)
32 http://www.dnr.state.mn.us/forestry/subsection/glossary.html(accessed 28 March 2013)

Low carbon competitiveness in Nepal 20
provisions have increased administrative procedures and costs of forest handover, and there has been a
sharp decline in the handover of forests as CFs since 2005. At the same time, it is reported there have
been cases where the communities have been given less than 200 ha. of forests to manage as CFs to
avoid the IEE, while they actually manage more than 200 ha. (ibid).
The district forest office (DFO) staff – assigned with the major tasks of facilitating the formation of
groups, developing and revising plans, providing technical support in the implementation of plans and
regular monitoring – have allegedly been found involved in activities that are against the law. For
example, they are reported to have overridden the provisions in forest acts and rules by encouraging or
supporting felling and transportation of forest products. Similarly, the provisions for sharing revenue
earned from the sale of timber between the government and the CFUGs in the terai is not welcomed by
the latter. In order to avoid the 13% value added tax (VAT) on the sale of surplus timber of two
commercial species in the terai as provisioned by the amended Finance Act of 2005, CFUGs allegedly
hide some logging activities, and thus cut more trees than approved under the forest management plan.
Therefore, there are proponents who call for leaving the sale of forest products to the market with
minimal government intervention or taxation, and also for revising the benefit-sharing provisions
between the government and the CFs – such as the VAT that the CFs have to pay for the trees with
high commercial value – and within the CFs themselves. Some thus argue there is a need to hand over
the forests to private entities for commercial purposes, while putting the conservation of forests at the
core of any such activity (ibid).
It is also reported that the current benefit-sharing practices of most of the CFUGs in the terai do not
address the needs of the users who reside far from the forests. These people have been adversely
affecting the forests in the terai by using them as open access resources without due concern for the
sustainability of their actions, as they do not own the forests. Thus, community forestry initiatives in
the terai have been considerably less successful than in other areas (Ibid). This suggests there is a need
to make such users the custodians of the forest through innovative approaches, perhaps through
collaborative forestry mechanisms (as defined in Table 7 above).
The political economy within the CF sector is such that the institutional set-up of the CFUGs
themselves has made them weak and appears in some cases to have provided a conducive environment
for the misappropriation of forest resources and revenues. Although the CFUGs are inclusive entities, a
few people still hold the power, and they have often been reported to have obtained personal benefits
through means that are damaging to the forests. It is also possible that the potential for personal gain
explains the observed growing competition to be elected to the CFUG executive committee. There are
also reports of CFUGs failing to incorporate socially and economically deprived groups (MoFSC,
2013), who, in turn, impact the forest adversely through their efforts to gain access to the forest
products – which are resources essential for their survival – at any cost. There are reports of almost
50% of the CFUGs not carrying out annual audits through a certified auditor, which raises concerns
about the possible misuse of funds (Dangal & Roy, 2011). Thus, there is a need to improve
transparency within the system, if the CFUGs are to function effectively as the custodians of forest
protection.
4.3 Current status of deforestation and forest degradation
Deforestation (described by the FAO as the conversion of forest to another land use or the long-term
reduction of the tree canopy cover below the minimum 10% threshold33) and forest degradation (a
reduction of canopy cover or stocking within the forest, and changes within the forest that negatively
affect the structure or function of the stand or site and thereby lower the capacity to supply products
and/or services34) have been reduced as a result of the community-based forestry programme, as
discussed above. The infrastructure development – especially rural roads – still causes forest loss in the
mid-hills, and the terai areas have continued to suffer deforestation and degradation due to
encroachment onto forests for settlement, infrastructure development, agricultural activities and illegal
33See FAO (2001) for detailed definition, http://www.fao.org/docrep/009/j9345e/j9345e07.htm (accessed 15 August 2013)
34See FAO (2001,2006) for detailed definition, http://www.fao.org/docrep/009/j9345e/j9345e08.htm (accessed 15 August 2013)
Low carbon competitiveness in Nepal 21
logging. These forests also suffer from recurrent fire and unregulated grazing that retard their
regeneration and growth.
MoFSC (2009) identifies nine major reasons for ongoing deforestation and forest degradation in
Nepal. They are as follows: high dependence on forest and forest products (timber, firewood and other
NTFPs); illegal harvesting of forest products; unsustainable harvesting practices; forest fire;
encroachment; overgrazing; infrastructure development; resettlement; and expansion of invasive plant
species. In the terai and Siwalik regions of Nepal, major reasons given are inappropriate and
inadequate policies to govern the forestry sector, coupled with the inefficient bureaucracy that results
in lax law enforcement. At the same time, there is high demand for timber and firewood, both in the
country and across the open border, which incentivises illegal logging.
High population pressure in the terai has resulted in encroachment of settlements onto forest areas.
Moreover, the opportunity cost of retaining forest areas in the terai is high due to the productive land
and the high price of timber that the forests in the terai yield. According to one informant in the
Mahottari district in eastern Nepal, selling a tree can buy a self-loading rifle, the implication being that
trees are worth a great deal, and that smugglers have better weapons than the forest guards. The current
state of political instability, lawlessness and insecurity, coupled with poverty and the lack of
alternative livelihoods, have provided a fertile ground for illegal logging to go unchecked.
There is very little information about forests in the mountainous region due to the harsh topography.
The media frequently report illegal export of timber to Tibet. Acharya (2003), cited in Dangal and Roy
(2011), reported that forest degradation has exceeded deforestation due to the excessive use of timber
for house or hut construction, fuel wood consumption and smuggling of timber to Tibet, as well as for
livestock fodder. Forests in the mountains also suffer from recurring fire, which is deliberately lit to
stimulate the growth of grass for yak and sheep (Dangal and Roy, 2011).
Problems of coordination in policy-making, planning and implementation among various ministries
and departments have also been seen as the cause for accelerated deforestation and forest degradation.
Weak coordination is particularly evident in infrastructure development programmes (MoFSC, 2009).
The negative impacts of unplanned rural road construction, and extraction of raw materials from forest
areas, especially sand, gravel and stone, are highly visible. There are conflicts over jurisdiction and
authority over forests in various parts of the legislation. Coordination is needed in order to balance the
objectives of forest conservation with the development of infrastructure such as power stations and
roads that are vital for national development.
Against this backdrop, Nepal’s forestry sector needs multi-stakeholder involvement in solving the
various problems. For example, as MoFSC (2009) suggests, it is necessary to sensitise the political
parties, enhance forest law enforcement and governance, create a conducive environment for
alternative income generation activities for poor people, and devise policies to attract private sector
investment in the forestry sector.
4.4 Medicinal and aromatic plants
Medicinal and aromatic plants (MAPs) was one of the 19 categories of goods and services identified as
having considerable export potential for Nepal in the Nepal Trade Integration Strategy (NTIS) 2010.
Given the abundance of endemic species, Nepal possesses the unique advantage of being home to a
number of important MAPs. Along with other products, such as essential oils and handmade paper,
these NTFPs represent potentially lucrative alternative livelihoods from forests. The development of
this sector could therefore improve the incentives for sustainable forest management, in order to
protect these livelihoods in the long term.
A recent UNEP study (UNEP, 2012) also confirms the potential to develop the sector to generate
livelihoods and contribute towards achieving a green economy. However, the paper notes that the
harvesting of MAPs is currently unregulated, and in the absence of appropriate forest management,
there is a risk that these plants, which mostly grow wild, could be harvested unsustainably given the
economic benefits they provide in the short run. Indeed, they could suffer the fate of Yarsagumba

Low carbon competitiveness in Nepal 22
(Ophiocordyceps sinensis), a highly expensive fungus known for its aphrodisiac uses, found in the
meadows of the Himalayas at 3,000-5,000m where the locals, and a few others, collect and sell them
almost unchecked. This has led to concerns about their significant decline in Nepal. Some are also of
the view that the declining supply of Yarsagumba could shift the pressure to the endangered medicinal
plants and forest products in the mountain forests35.
However, given sustainable management of the production of MAPs, both the existing industry and the
government believe there is significant potential to increase Nepal’s exports, especially in light of
growing international demand for MAPs products. So far, exports have mainly been to India, but there
seems to be a significant potential to sell to other markets. Based on the four predetermined criteria of
market size, import growth in the importing country market, ad valorem tariff imposed, and margin of
preference vis-a-vis the five top exporting countries, the NTIS (2010) has identified the top 10 most
attractive national markets for the export of medicinal herbs, and the top 10 for the export of essential
oils.
Table 9: Exports of MAPs and essential oils from Nepal to the world (US$ ’000)
Product 2009 2010 2011
Medicinal and aromatic plants 9,794 6,178 11,839
Essential oils 711 505 1,279
Source: Trade Map online database.
Subedi (2006), cited in Kunwar et al. (2009), reports over 161 plant species being harvested for
commercial use in Nepal, with the engagement of at least 137 entrepreneurs and about 71 community‐based enterprises. Our own study gathered information from private companies in Nepal that procure
MAPs and other NTFPs and process them into various products like essential oils and handmade
paper. Most of the companies work with CFUGs to grow the necessary products. They provide inputs
such as saplings to the CFUGs, provide training on how to grow them, and check for quality from
plantation to harvesting. These companies then buy back the products once they are harvested. The
price that the companies pay to the CFUGs depends on the quality of the products. This is corroborated
by the Federation of Community Forestry Users, Nepal (FECOFUN), although they also expressed
concerns that the market for these products is volatile, and that they are not provided with enough
training to grow, harvest and produce quality products.
Nepal also imports expensive finished goods from India that are made out of the raw materials
exported from Nepal. Indeed, according to estimates provided by one company, only 20-25% of the
herbal products in Nepal are domestically produced, with the rest coming from India. This is
symptomatic of the wider challenges associated with developing manufacturing sectors that add value
through processing and packaging, as opposed to the export of raw materials for relatively low return,
where value addition is undertaken elsewhere. Industry players said there was a lack of proper plans
and policies to promote Nepali herbal products and to develop the sector.
Despite the optimism about the sector, Kunwar et al. (2009) is critical about the role of NTFPs
enterprises as one of the potential means to reduce poverty as envisioned by the government.
According to Kunwar et al., so far only a limited number of NTFPs enterprises have been successful in
creating income and employment for the poor. According to Sharma and Shrestha (2011), despite the
annual growth of trade in MAPs and essential oils at the international level, Nepal’s share in the trade
is very small. This reflects a number of important challenges in developing the industry.
35 http://m.scidev.net/en/south-asia/news/-himalayan-viagra-harvesters-threaten-forest-resources.html
Low carbon competitiveness in Nepal 23
Lack of regulation, standards and certification
Nepal does not have clear standards for the sustainable use of forest products. There may be a need to
set national standards that are in line with decisions about the envisaged specialisation and
prioritisation of certain products to be developed for export. These should also be linked to the forest
inventory guidelines for the forests in the terai (which require user groups to ensure the sustainable use
of forest resources through the production of a forest management plan that has to be approved by the
government and renewed every five years). Regular inventories of MAPs resources could also be
carried out to monitor the impact of growth in the sector on the availability of the raw materials.
Since many international markets demand certification, this is an important – indeed, increasingly
essential – marketing tool for business. In the case of MAPs and essential oils, which are used in
manufacturing medicines, food supplements and other products for human consumption, ensuring and
maintaining the quality and standard of products is very important. However, Nepal has been grappling
with some of the requirements. For example, sometimes importing countries demand data on pests
associated with a particular product. However, Nepal does not have basic pest data for listed medicinal
plants; thus, exporters first send samples of products for quality inspection to the importers, and only
after they receive the go-ahead from importers can they export their products (Sharma and Shrestha,
2011). There are also issues around sanitary and phytosanitary (SPS) certification, good manufacturing
practice (GMP) standards and the requirement to fulfil a set of good agricultural practices applicable to
the production of MAPs as devised by the European Herb Growers Association, that must be complied
with for exporting to the European market in particular (ibid). The standards vary between countries.
European companies usually import only from certified Nepalese companies, while Asian companies
tend to be less concerned about standards and certification. However, certification can generate a price
premium, even in markets that do not require certification.
Capacity-building to enable producers to meet SPS and other requirements of importing countries is
needed. FECOFUN has been helping some CFUGs to get Forest Stewardship Council (FSC)
certification, although only 21 have obtained it, according to one source.36 The process is costly, given
the need to keep records of the production cycle of the plants and trees – from plantation to harvesting
– and CFUG members are not well equipped to meet these requirements. The appointment of an
auditor for proper bookkeeping is also costly, and it consumes resources and time to gather
information, organise focus group discussions, and undertake the many other activities that are
prerequisites for certification. The institutional and financial arrangements for all these processes
represent considerable effort for CFUGs that consist of only small groups of people.
Laboratory testing
Laboratory testing of products is an important part of the certification process. However, existing
laboratories in Nepal are reported to suffer from poor equipment and facilities, and a lack of electricity
and human resources. This means it can take several weeks to obtain a report, creating delays that
hamper exports. When large quantities of a product are produced in different batches, and the
importing firm abroad asks for a report for each separate batch, this can be almost impossible to obtain.
Branding
A need for national branding of Nepalese forest products, along with market research and marketing of
domestic products, was highlighted by firms in the industry. Reportedly, many Indian firms sell their
products to foreign companies labelling them as made in Nepal. At the same time, many Nepalese
companies cannot export their products due to a lack of branding and market recognition, amongst
other things.
Inadequate labour supply
A labour shortage is reported in the hills and high altitude districts due to labour migration to cities and
out of Nepal. This has resulted in high labour costs in these areas. It is exacerbated by the fact that, due
to a lack of information on market demand and prices, collectors of MAPs in Nepal receive less than
36In Nepal, only 21 CFUGs of Dolakha and Bajhang with 14,000 ha. area and 34,000 households have obtained an FSC certificate of
sustainable forest management. See Forest Certification National Working Group of Nepal, http://nfa.org.np/wp-
content/uploads/2010/10/brochure_project.pdf (accessed 14 March 2013).

Low carbon competitiveness in Nepal 24
they should for the product they sell, and thus incentives to supply this market are limited (UNEP,
2012).
Some farms in the terai region, according to one of the private companies we interviewed, have started
mechanising the production process, mainly the tilling and harvesting processes. Such mechanised
production may help the big firms achieve economies of scale through mass production, and overcome
labour shortages. However, such mechanisation is not feasible in all parts of the country due to more-
challenging topography.
Government support and incentives
UNEP (2012) notes that the lack of policy support and investment in improving the quality of Nepali
MAPs makes them less competitive in international markets. In addition, higher import duties levied
by India on processed products also discourages value addition in Nepal.
Interviewees highlighted various policies that could help to promote the MAPs industry, including
government incentives such as tax rebates to MAPs producers and exporters, the establishment of
advanced processing zones, and the development of institutional arrangements to support the necessary
research and development. Government could also provide support for research leading to the
identification of varieties suitable for cultivation, and a network could be established to link research,
regulatory and development agencies, and businesses to share information and to discuss challenges in
the sector, and solutions (UNEP, 2012). It is also argued that the government should do more to tackle
the various non-tariff barriers imposed by trading partners, especially those imposed by the various
Indian states.
The impact of climate change
A report by LFP (2009b) assesses the nature and type of climate change impacts on forests and forest-
dependent people in Nepal. According to the report, Nepal has seen reduced rainfall and water supply,
movement of certain plant species to higher elevations in response to temperature increases, and
increased incidence of disease in crops and livestock. The forests in the mountain region are expected
to be the most vulnerable to climate change as the rise in temperature brings more changes in
precipitation, which is expected to contribute to an increase in drought-resistant trees or grasslands that
will replace existing forest ecosystems. In addition, some CFUGs are reportedly suffering from water
shortages.37
Although most of the MAPs companies consulted during the research stated that they had not
experienced any significant impact on their business due to climate change, some noted that the
irregular rainfall pattern has been hampering their yields. In addition, some suggested that the
problems seen in the growth and quality of a few herbs – for example, plants flowering earlier than
normal – might be due to the changing climatic patterns, although over-harvesting is also blamed for
the poor performance of some plants.
One of the interviewees mentioned that the pre-monsoon in 2012 hampered harvesting, transportation
and subsequent processing and production of MAPs. It was also mentioned that the habitat of some
plants is shifting upwards to highland areas. For example, Spikenard (Nardostachys jatamansi),
commonly called Jatamansi, an important medicinal plant that 12 years ago could readily be found at
an altitude of 3,500m, is reportedly now found only above 3,800m. Scarcity of water for irrigation and
processing has also been mentioned by the interviewees as a major constraint. Poor water quality has
been found to reduce the quality of handmade paper – another NTFP – due to the presence of
substances like silica and iron in the water. Thus, it seems that a more in-depth study of the potential
impact of climate change on this sector, and analysis of appropriate risk mitigation strategies, may be
warranted.
37See for example http://www.thehindu.com/news/national/forest-communities-in-nepal-grappling-with-climate-change/article2048658.ece
(accessed 11 September 2013)
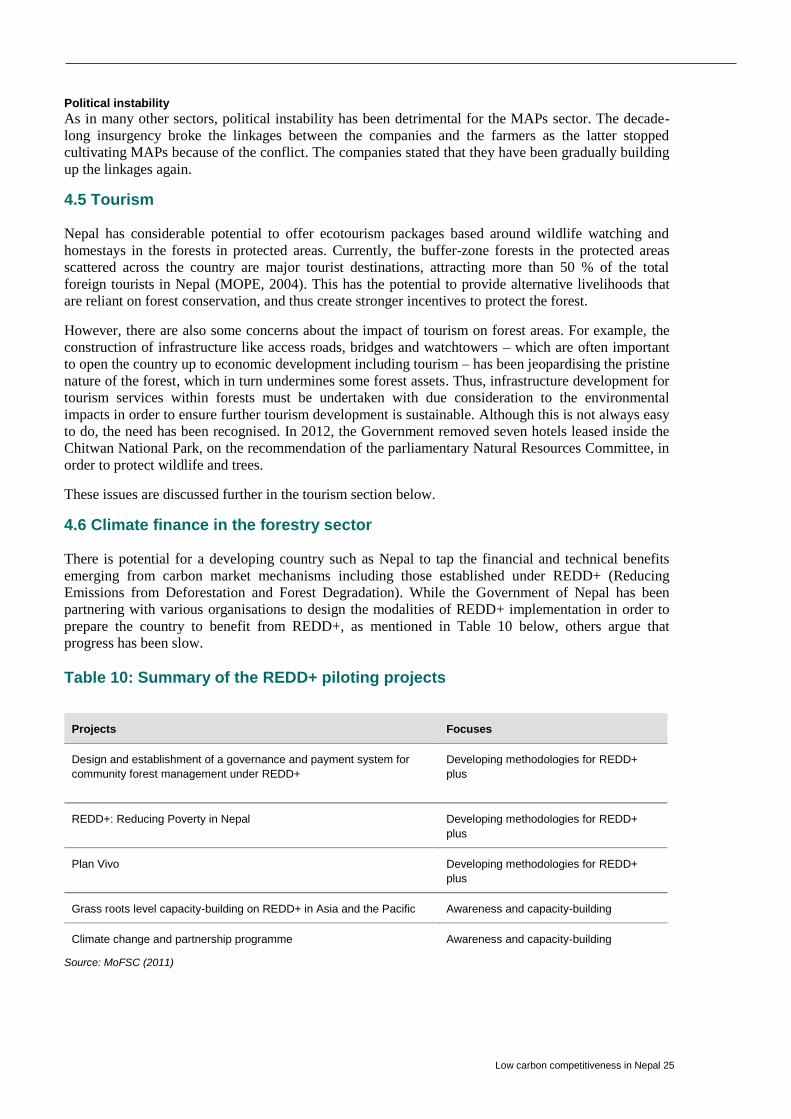
Low carbon competitiveness in Nepal 25
Political instability
As in many other sectors, political instability has been detrimental for the MAPs sector. The decade-
long insurgency broke the linkages between the companies and the farmers as the latter stopped
cultivating MAPs because of the conflict. The companies stated that they have been gradually building
up the linkages again.
4.5 Tourism
Nepal has considerable potential to offer ecotourism packages based around wildlife watching and
homestays in the forests in protected areas. Currently, the buffer-zone forests in the protected areas
scattered across the country are major tourist destinations, attracting more than 50 % of the total
foreign tourists in Nepal (MOPE, 2004). This has the potential to provide alternative livelihoods that
are reliant on forest conservation, and thus create stronger incentives to protect the forest.
However, there are also some concerns about the impact of tourism on forest areas. For example, the
construction of infrastructure like access roads, bridges and watchtowers – which are often important
to open the country up to economic development including tourism – has been jeopardising the pristine
nature of the forest, which in turn undermines some forest assets. Thus, infrastructure development for
tourism services within forests must be undertaken with due consideration to the environmental
impacts in order to ensure further tourism development is sustainable. Although this is not always easy
to do, the need has been recognised. In 2012, the Government removed seven hotels leased inside the
Chitwan National Park, on the recommendation of the parliamentary Natural Resources Committee, in
order to protect wildlife and trees.
These issues are discussed further in the tourism section below.
4.6 Climate finance in the forestry sector
There is potential for a developing country such as Nepal to tap the financial and technical benefits
emerging from carbon market mechanisms including those established under REDD+ (Reducing
Emissions from Deforestation and Forest Degradation). While the Government of Nepal has been
partnering with various organisations to design the modalities of REDD+ implementation in order to
prepare the country to benefit from REDD+, as mentioned in Table 10 below, others argue that
progress has been slow.
Table 10: Summary of the REDD+ piloting projects
Source: MoFSC (2011)
Projects Focuses
Design and establishment of a governance and payment system for
community forest management under REDD+
Developing methodologies for REDD+
plus
REDD+: Reducing Poverty in Nepal Developing methodologies for REDD+
plus
Plan Vivo Developing methodologies for REDD+
plus
Grass roots level capacity-building on REDD+ in Asia and the Pacific Awareness and capacity-building
Climate change and partnership programme Awareness and capacity-building
Low carbon competitiveness in Nepal 26
Some local and international non-governmental organisations have been piloting the modalities of
REDD implementation in Nepal. The Asia Network for Sustainable Agriculture and Bioresources
(ANSAB), the International Centre for Integrated Mountain Development (ICIMOD) and FECOFUN
have been implementing a pilot project to design governance and payment systems for Nepal’s CF
management within the REDD mechanism. The project is being implemented in three watershed areas
with financial support from the Norwegian Agency for Development Cooperation (NORAD). The
project specifically aims to gauge the feasibility of a payment mechanism under REDD that would
potentially provide additional economic benefits from the forest to locals involved in CFUGs, along
with carbon financing as an incentive to reduce deforestation and forest degradation and to promote
more-sustainable use of forests.38
The project is aiming to institutionalise a forest carbon trust fund (FCTF) at the grassroots level using a
seed grant of US$100,000 from NORAD. A taskforce distributed a total of US$95,000 up to June 2012
in the three project areas based on three criteria: the quantity of forest carbon saved above the baseline
established by the project, the number of indigenous and minority group households, and the female
population and number of poor households in the area.
The fund is reported to have been distributed among CFUG members, who have been using it for
purposes such as alternative energy promotion, conservation of forest carbon stocks, sustainable
management of forest, biodiversity conservation, poverty reduction and livelihood improvement,
awareness raising and capacity-building on REDD and climate change, and the auditing of FCTF and
verification of data.39
Unfortunately, progress towards developing carbon finance through REDD+ has been very slow at the
international level, and it is not clear how or how quickly the mechanism will develop going forward.
So although government, international donors, NGOs and private sector entities have been considering
how to build REDD funding into the business case for various forestry related projects, this now seems
unlikely to yield much finance in the short term. Thus, while positioning the country to benefit from
REDD+ makes sense, too much reliance should not be placed on this as a funding mechanism.
A shift in focus seems warranted, to identify and support the development of market opportunities that
do not rely on carbon markets to create alternative, sustainable, forest-based livelihoods and that by
themselves can increase the economic value associated with forest conservation and sustainable forest
management. In addition, as public sources of climate finance are perhaps more likely to be
forthcoming (than finance through carbon markets) for LICs such as Nepal, the most appropriate way
forward may be to develop strategies to capitalise on these sorts of finance in ways that build
competitive markets in sectors that are consistent with forestry conservation.
An example of this is provided by the MSFP, which was set up in 2011.40 This initiative, started by the
MoFSC with support from the Finnish, Swiss and United Kingdom governments, aims to promote
community-based forest management and forest-based livelihoods and income generation, including
by promoting investment by the private sector in forest business partnerships.
4.7 The potential for private management of forest resources
One option that has not yet been explored much within Nepal is management of forest by private
enterprises. As with community groups, giving a private entity rights over forest products for a
reasonably long period (or ownership of the forested land as an asset) could in principle create
incentives for sustainable forest management, as degrading the forest would reduce the value of the
asset. Given the strength of incentives for short-term gain through logging and forest clearance, this
solution would doubtless require a strong regulatory framework governing permitted use of the forest
38Interview with ANSAB officials, 6 February 2013, Kathmandu and the website http://www.ansab.org/publication/himalayan-bioresources-
volume-3-issue-3/. 39
Interview with ANSAB officials 6 February 2013, Kathmadu and website http://www.ansab.org/publication/himalayan-bioresources-
volume-3-issue-3/ 40
http://www.msfp.org.np/
Low carbon competitiveness in Nepal 27
by the private entity, and could well run into the kinds of problems already observed within Nepal,
around poor capacity to manage the forest on a sustainable basis, weak enforcement, and the risk of
corruption that permits unsustainable exploitation of forest resources. Indeed, in many instances, large
private actors have been responsible for the worst governance failings within the forest sector.
On the other hand, management by private entities might have advantages over management by
CFUGs: having ownership concentrated in the hands of one entity might strengthen governance – as
all community groups have competing interests within them, which makes managing difficult – and
private entities might have more resources that make them better able to monitor activities within the
forest and enforce the regulations governing usage. Such entities can potentially identify and develop
alternative sustainable livelihoods that can be created out of these forest resources, e.g. by exploring,
identifying and tapping into growing national and international markets. Since there is a research gap
in this area, an assessment of the potentials – both opportunities and challenges – of this kind of private
sector forest management in Nepal could be a useful exercise.
Another possible management model is one in which private firms who use firewood for their own
energy needs buy up areas of forest and manage them in a sustainable way in order to provide an
ongoing source of fuel wood and thus reduce their own vulnerability to rising and fluctuating energy
prices. The feasibility of this would depend on the extent of dependence on fuel wood by industry
within Nepal, and price trends in alternative energy sources.
The Immediate Action Plan on Economic Development and Prosperity (2012) states that the forestry
sector will be developed commercially in order to increase the contribution of forest products to GDP,
through the increased implementation of leasehold forestry – which currently only accounts for a very
small proportion of forest area in Nepal. Such a policy could potentially generate sustainable economic
gains, if it is implemented effectively, with long-term sustainability considerations in mind, and if the
resulting commercial activities are regulated carefully.
4.8 Conclusion
Table 11 below summarises the main opportunities and risks that are currently faced in Nepal’s
forestry sector, associated with the relevant drivers identified at the beginning of this report: natural
resource scarcity, climate change and international mitigation policies. Possible policy and business
responses are suggested, for further discussion and exploration.

Low carbon competitiveness in Nepal 28
Table 11: Summary of forestry sector opportunities and risks associated with three drivers
Opportunities / risks Implications / responses
Natural resource scarcity
Illegal logging and clearance for competing land use,
incl. agriculture, settlement, and infrastructure
development, deplete Nepal’s natural assets and
threaten forest-dependent livelihoods in the long term.
Multi-stakeholder processes to develop a joined up strategy
for forestry management that balances competing national
development priorities.
Demand for timber, firewood and raw materials for
infrastructure development, which in turn impact wider
domestic competitiveness of other industries.
Identification of alternative sources of energy and other raw
materials, and better management of their extraction.
Weak forest governance due to lack of capacity,
corruption, weak enforcement, poor inter-ministerial
coordination.
Improved monitoring and enforcement.
Forest management models that create incentives for self-
monitoring and enforcement of sustainable forestry use
such as community forest management.
Community forest management has helped encourage
sustainable forest management, but also faces
challenges.
Scaled up community forest management and reform to
reduce perverse incentives.
Potential for private sector management of forest to
commercialise the sector further, under an appropriate
regulatory framework to ensure sustainability.
Exploration of the economic and political feasibility of this
model of forest management, perhaps through the
implementation of leasehold forestry.
Identification of livelihoods from sustainable forest use
e.g. ecotourism, NTFPs such as MAPs.
Public-private dialogue to devise a strategy to develop the
sustainability, competitiveness and socioeconomic benefits
of these sectors.
International mitigation policies
Forestry Stewardship Council certification can improve
access to markets and generate a price premium, but is
also difficult to achieve.
Support more community forest user groups to obtain
certification.
Climate finance from public sources, or potentially
through REDD+ in the longer term.
Develop a strategy that optimises contribution from public
sources of climate finance, but does not rely on REDD+ in
the short term.
Impact of climate change
Reduced rainfall and water supply, changes in
distribution of plants, changes to yields of particular
crops, and increased incidence of disease could
threaten certain forest-dependent livelihoods.
More in-depth study of impacts on particular livelihoods,
awareness raising activities, and appropriate risk mitigation
strategies.
Deforestation and exploitation of forests can yield high economic gains in the short term, but if
undertaken in an unsustainable manner can undermine long-term growth and competitiveness by
jeopardising forest-dependent livelihoods, depleting natural assets, and causing soil erosion that leaves
large tracts of land barren. Given the high proportion of Nepal’s population who are dependent on
forest, managing it appropriately in order to secure sustainable livelihoods will be crucial to achieving
inclusive and sustainable growth.
The introduction of community forestry management has successfully reduced deforestation and
yielded economic benefits for participating communities. However, the model is facing some
Low carbon competitiveness in Nepal 29
implementation challenges, and further reforms could potentially help to improve its impact.
Exploitation of Nepal’s forests still continues in an uncontrolled fashion in many areas. The forests in
Nepal inevitably compete with other land uses, including agricultural production, settlement and
infrastructure development. Logging continues in light of lucrative domestic and export markets for
both timber and fuel wood. Some of these processes are part and parcel of development, and some
degree of forest exploitation is inevitable and indeed desirable in a growing economy. Infrastructure
development and firewood availability are important for the wider competitiveness of the national
economy. However, it is clear that a balance needs to be struck between competing national
development priorities. Multi-stakeholder processes to develop a more joined up strategy for forestry
management could help to achieve this.
One part of the solution to unsustainable forest use is appropriate forest management at the national
level, and better enforcement of existing laws and regulations. But another part is creating stronger
economic incentives to protect the forest, by facilitating the development of alternative livelihoods that
are consistent with forest conservation. CFUGs are one way to achieve this, as they have relatively
strong incentives to identify and develop livelihoods based on sustainable forest use. Private
management of forest resources, along with an appropriate incentive mechanism and regulatory
framework, could also provide a possible model for more sustainable forest management that would
potentially help to commercialise the forest sector further, perhaps through the careful implementation
of leasehold forestry as set out in the Immediate Action Plan on Economic Development and
Prosperity (2012).
Forest-dependent livelihoods can be based on sustainable harvesting of timber or fuel wood, and the
sustainable harvesting and sale of NTFPs, particularly those in which Nepal has a significant
competitive advantage, such as MAPs. There appears to be considerable scope to develop these
markets further and to develop Nepal’s export competitiveness and manufacturing base on the back of
these products in a way that also contributes to sustainable forest management. However, there are
many challenges to be overcome relating to standards and certification, marketing and branding, labour
supply, and investment climate, etc. Thus, some form of public-private dialogue to devise a strategy to
strengthen the sustainability, competitiveness and added value of the sector could help to prioritise
government and donor support for the necessary reforms and the development of appropriate market
institutions.
In addition, when more fully developed, carbon market mechanisms such as REDD+ promise to
remunerate forest conservation and could be used to develop these kinds of livelihoods. Thus, Nepal’s
forests should be seen as an asset that could increase in value over time. However, given the slow rate
of international progress on REDD+, it seems safer to base forest development and conservation
strategies on contributions from public sources of climate finance in the short term, rather than on
carbon markets.

Low carbon competitiveness in Nepal 30
5 The tourism sector
Tourism is a high-growth sector, representing a significant opportunity for Nepal. It creates jobs
directly, as well as many indirect livelihood opportunities down the supply chain, e.g. supplying hotels
with food. However, it also creates challenges, relating for example to natural resource management –
where growing tourism demand competes with other uses of energy and water, which may already be
in short supply. Tourism can also generate large volumes of waste and rubbish that pollute the local
area, and infrastructure development – though important, as better transportation also benefits tourism
growth – can erode natural assets such as forests.
These issues need to be managed well, if Nepal is to continue to compete successfully with alternative
tourism destinations. Growth of the tourism industry can itself be jeopardised by poor natural resource
management, for example where pollution reduces the value of tourism-related assets such as
mountain environments, or where deforestation threatens biodiversity, water resources, and the beauty
of the landscape. Thus the tourism industry has an interest in developing a sustainable and
environmentally conscious sector and protecting the natural environment, and can act as an important
advocate of green growth policies.
Ecotourism – as a specific subset of the tourism industry, defined as ‘responsible travel to natural areas
that conserves the environment and improves the well-being of local people’ (Blangy and Wood, 1993)
– has been growing even faster at the global level, at rates up to two or three times higher than normal
tourism activities (FAO, 2011). Ecotourism allows countries to take advantage of, and at the same time
preserve, their natural capital (e.g. forests and ecosystem services) through tourism-related activities
and products aimed at environmentally aware international tourists.
By promoting sustainable forest management – creating alternative livelihoods to unsustainable
logging and the conversion of forest areas to other land uses – ecotourism can create stronger
incentives for green growth outcomes. In addition, there is often greater scope for inclusion of local
communities in the value chain because they tend to provide the majority of ecotourism services, as
opposed to larger international or national tourism service providers (ibid).
5.1 Tourism in Nepal
The number of tourists visiting Nepal over the last decade has grown steadily, since the country
returned to a situation of peace and relative stability after the civil war. Tourist attractions include the
Himalayas as well as historical sites of cultural and religious significance, such as the four UNESCO
World Heritage Sites. The country has significant natural and cultural capital that gives it a potentially
significant competitive advantage in the tourism sector. Nepal has a particularly strong reputation as a
mountaineering and trekking destination, although many in the industry are keen to focus on
broadening its appeal and attracting a wider set of tourists, particularly high-income tourists who may
generate a higher economic contribution per head. This appears to be happening, according to official
statistics – see Figure 3 below.41
41 See: http://www.tourism.gov.np/uploaded/TourrismStat2012.pdf
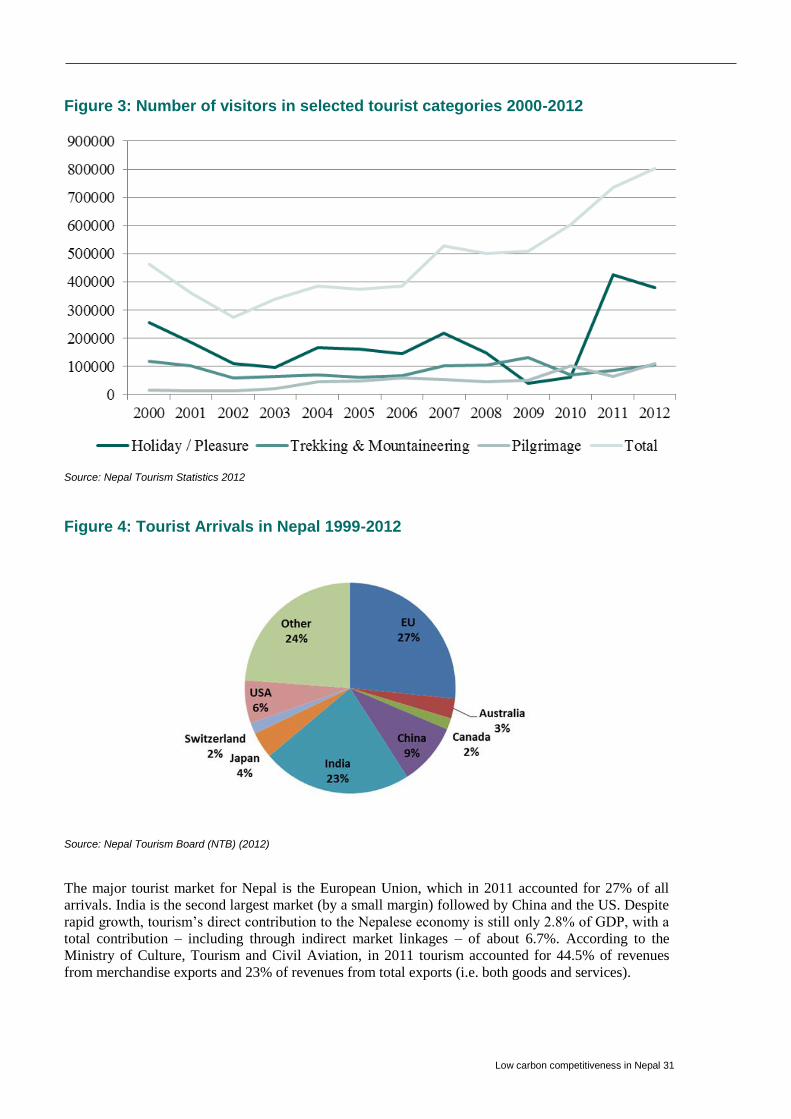
Low carbon competitiveness in Nepal 31
Figure 3: Number of visitors in selected tourist categories 2000-2012
Source: Nepal Tourism Statistics 2012
Figure 4: Tourist Arrivals in Nepal 1999-2012
Source: Nepal Tourism Board (NTB) (2012)
The major tourist market for Nepal is the European Union, which in 2011 accounted for 27% of all
arrivals. India is the second largest market (by a small margin) followed by China and the US. Despite
rapid growth, tourism’s direct contribution to the Nepalese economy is still only 2.8% of GDP, with a
total contribution – including through indirect market linkages – of about 6.7%. According to the
Ministry of Culture, Tourism and Civil Aviation, in 2011 tourism accounted for 44.5% of revenues
from merchandise exports and 23% of revenues from total exports (i.e. both goods and services).
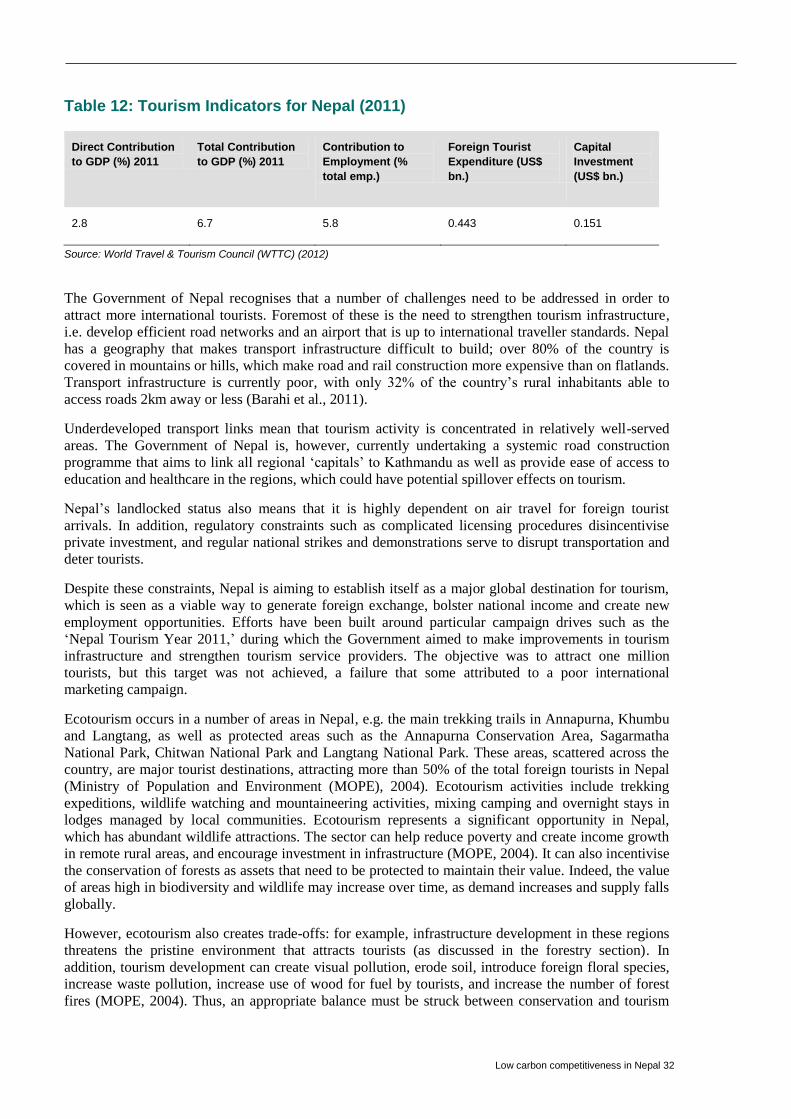
Low carbon competitiveness in Nepal 32
Table 12: Tourism Indicators for Nepal (2011)
Direct Contribution
to GDP (%) 2011
Total Contribution
to GDP (%) 2011
Contribution to
Employment (%
total emp.)
Foreign Tourist
Expenditure (US$
bn.)
Capital
Investment
(US$ bn.)
2.8 6.7 5.8 0.443 0.151
Source: World Travel & Tourism Council (WTTC) (2012)
The Government of Nepal recognises that a number of challenges need to be addressed in order to
attract more international tourists. Foremost of these is the need to strengthen tourism infrastructure,
i.e. develop efficient road networks and an airport that is up to international traveller standards. Nepal
has a geography that makes transport infrastructure difficult to build; over 80% of the country is
covered in mountains or hills, which make road and rail construction more expensive than on flatlands.
Transport infrastructure is currently poor, with only 32% of the country’s rural inhabitants able to
access roads 2km away or less (Barahi et al., 2011).
Underdeveloped transport links mean that tourism activity is concentrated in relatively well-served
areas. The Government of Nepal is, however, currently undertaking a systemic road construction
programme that aims to link all regional ‘capitals’ to Kathmandu as well as provide ease of access to
education and healthcare in the regions, which could have potential spillover effects on tourism.
Nepal’s landlocked status also means that it is highly dependent on air travel for foreign tourist
arrivals. In addition, regulatory constraints such as complicated licensing procedures disincentivise
private investment, and regular national strikes and demonstrations serve to disrupt transportation and
deter tourists.
Despite these constraints, Nepal is aiming to establish itself as a major global destination for tourism,
which is seen as a viable way to generate foreign exchange, bolster national income and create new
employment opportunities. Efforts have been built around particular campaign drives such as the
‘Nepal Tourism Year 2011,’ during which the Government aimed to make improvements in tourism
infrastructure and strengthen tourism service providers. The objective was to attract one million
tourists, but this target was not achieved, a failure that some attributed to a poor international
marketing campaign.
Ecotourism occurs in a number of areas in Nepal, e.g. the main trekking trails in Annapurna, Khumbu
and Langtang, as well as protected areas such as the Annapurna Conservation Area, Sagarmatha
National Park, Chitwan National Park and Langtang National Park. These areas, scattered across the
country, are major tourist destinations, attracting more than 50% of the total foreign tourists in Nepal
(Ministry of Population and Environment (MOPE), 2004). Ecotourism activities include trekking
expeditions, wildlife watching and mountaineering activities, mixing camping and overnight stays in
lodges managed by local communities. Ecotourism represents a significant opportunity in Nepal,
which has abundant wildlife attractions. The sector can help reduce poverty and create income growth
in remote rural areas, and encourage investment in infrastructure (MOPE, 2004). It can also incentivise
the conservation of forests as assets that need to be protected to maintain their value. Indeed, the value
of areas high in biodiversity and wildlife may increase over time, as demand increases and supply falls
globally.
However, ecotourism also creates trade-offs: for example, infrastructure development in these regions
threatens the pristine environment that attracts tourists (as discussed in the forestry section). In
addition, tourism development can create visual pollution, erode soil, introduce foreign floral species,
increase waste pollution, increase use of wood for fuel by tourists, and increase the number of forest
fires (MOPE, 2004). Thus, an appropriate balance must be struck between conservation and tourism

Low carbon competitiveness in Nepal 33
development, to support livelihoods and at the same time preserve the value of these assets for the
future.
5.2 Tourism and climate change
As discussed previously, most climate scenarios for Nepal show that there will be less rainfall and
rising temperatures, with estimates of potential increases of between 0.5˚C and 2.0˚C by 2030, and up
to 4.7˚C by the 2090s (Nepal Climate Vulnerability Study Team (NCVST), 2009). Studies also suggest
that by 2060 there may be an increase of up to 55% in the number of ‘extremely’ hot days (i.e. well
above average temperature) and 77% in the number of ‘extremely’ hot nights (Dixit, 2011). There is
greater uncertainty about impacts on rainfall. There could also be changes in the ability of particular
areas to grow particular crops, which could create increased competition for certain areas of land.
In a paper by Nyaupane and Chhetri (2011) it is indicated that changing climatic conditions will have
variable impacts on tourism, dependent on the physical characteristics of the regions. In the country’s
north-eastern areas, where there are more mountain parks, there could be increased avalanches and
glacial lake floods, while hilly and lowland regions such as the Terai may see more landslides and
flash floods. Such hazards would have a negative effect on tourism infrastructure, including road
damage, decreased availability of hydroelectricity, and damage to trekking trails and tourist facilities.
Of particular concern is the impact of climate change on glaciers, and the increases in snow melt and
glacial lake outburst floods that may negatively affect tourism in the mountainous areas such as
Everest, Annapurna and Langtang (Dixit, 2011), since the natural beauty of the areas could deteriorate,
and trekking in them could become more risky. There may also be indirect effects of climate change
on tourism, such as decreased crop yields leading to decreased food availability and hence higher
prices, which in turn could lead to more competition for food resources between tourists and local
people. In addition, agricultural shifts may cause farmers to start using previously wild areas, removing
their allure to nature tourists (Brinkman, 2012).
Another threat to the tourism industry arises from the ‘Atmospheric Brown Cloud’ (ABC) that has
been identified as affecting parts of South Asia including the Himalayas. This has health effects and
may also change rainfall patterns and cause the possible retreat of the Hindu Kush-Himalayan glaciers
and snow packs (Ramanathan et. al, 2008), as well as undermining the pristine landscape that attracts
trekkers and mountaineers to Nepal.
5.3 Carbon mitigation threats to Nepalese tourism
Increased air travel costs arising from higher fuel prices and aviation carbon taxation may reduce long-
haul flights, affecting tourism growth potential. Air passenger duty is being imposed by a number of
countries, and air travel is now a part of the European Emissions Trading Scheme, which could affect
prices of travel to long-haul destinations such as Nepal; however, this is likely to represent only a
small proportion of the total cost of air travel, and evidence suggests that tourists may be relatively
price inelastic, so the ultimate effect on tourism numbers may be limited. In addition, as much of the
growth of tourism to Nepal is from neighbouring countries rather than from more-distant, rich
countries, these risks may not represent too significant a threat.
5.4 Environmental impact of tourism
The tourism industry can be an advocate of environmental sustainability, but tourism can also damage
the environment and create challenges for natural resource management. Within Nepal, the
Government has introduced Environmental Impact Assessment standards as well as improved water
management systems that all new tourism buildings must adhere to, and a number of sustainable
tourism initiatives and projects have been implemented. Some are projects with particular goals in
mind, such as eliminating plastic waste from tourism (see Box 1 below), while others take a more
comprehensive approach, such as the Marketing Assistance for Sustainable Tourism (MAST) project
Low carbon competitiveness in Nepal 34
(See Box 3), which involved the introduction of sustainable tourism practices to local tour operators
and subsequent marketing of their activities to international tour operators.
Some hotels and tourist operators have focused on building a reputation for social responsibility and
environmental sustainability (see Box 2). This could yield a competitive advantage in a world of
increasingly environmentally conscious consumers – particularly at the higher-value end of the tourist
market.
Box 1: Freemalaya42
Freemalaya is a campaign to ban plastic products from the Nepalese Himalayas. The initiative
was set up in 2012 by Jerome Edou and Adhish Gurung, members of the Nepalese trekking
industry, inspired by similar bans in northern India (Ladakh region) and in Bhutan. The
campaign involves local tour operators and international operators asking their clients to bring
their own reusable non-plastic bags and bottles for their trip to Nepal. The campaign also
promotes the use of solar water heaters in rural areas, so that tourists can boil water to purify
it, and it provides income opportunities for communities to sell locally produced filtered water.
Box 2: The Explore Nepal Group43
The Explore Nepal Group takes various actions to improve the sustainability of its hotel
operations, including energy-efficiency measures such as installing more-efficient light bulbs,
avoiding the use of air conditioners or elevators in its enterprises, and using renewables for
some operations, such as solar water heating for its hotels. The company also reduces its
water use by minimising the amount used for cleaning (i.e. allowing hotel guests to decide
whether their linen needs to be changed). The use of plastic is minimised in favour of glass or
metal, and all waste material produced during trekking activities is collected.
The group has an eco-hotel in the centre of Kathmandu that uses local traditional architecture
to maximise temperature efficiency and comfort in the rooms, uses solar water heaters, and
has adopted a green purchasing policy that prioritises the use of locally grown, organic food in
its restaurant.
Tourism service providers also have implemented a number of environmental initiatives such as
planting trees, trying to ban plastic bags on treks, promoting clean trekking routes and providing
environmental training to local communities. Green tourism projects broadly fall under the following
categories:
Energy efficiency and renewable energy generation projects: reducing energy use in tourist
facilities, such as by using solar water heating and solar PV in hotels.
Waste management: reducing or eliminating the use of plastic (i.e. bottles and bags) and
keeping trekking trails rubbish free. Improved waste management can lead to reduced costs for
tourism businesses as well as opportunities for new enterprises that support tourism services,
such as those that recycle products or manage waste, with associated employment creation
opportunities.
42 http://www.freemalaya.org/
43 http://www.xplorenepal.com/

Low carbon competitiveness in Nepal 35
Water management: reducing water usage, i.e. through reduced toilet flushing and optional
washing of bed linens in hotel rooms, as well as more-sustainable water use, i.e. using locally
filtered water instead of imported water.
Reduction in transport emissions through campaigns and initiatives to eliminate highly polluting
transport systems and vehicles. For example, three-wheeled, highly polluting diesel ‘tempos’
taxis have been banned in Kathmandu and replaced with electric powered taxis.44
As discussed above, Nepal suffers from very high costs of energy and poor access, and this has
hampered the development of the tourism industry as it has other sectors. There is considerable scope
for the hotel industry to use renewable energy and adopt energy-efficiency measures, such as solar
lighting and solar water heaters that would create savings over time. However, due to high upfront
costs associated with renewable appliances, as well as a lack of awareness of potential savings, most
businesses in the tourism industry use traditional fossil fuel-based solutions such as diesel-powered
generators.
Solar water heating is being used, however, by a number of tourism enterprises, e.g. Explore Nepal
(see Box 2) and Himalayan Encounters, and this has sometimes helped them avoid paying grid
connection charges (United Nations Environment Programme (UNEP), 2008). The tourism enterprise
named Last Resort reduced energy use through utilising more efficient light bulbs, which helped it
save 15% on energy costs each month.
Access to finance for the upfront investment is also a problem, although institutions such as the Clean
Energy Development Bank (CEDB), which offers loans to private enterprises to invest in renewable
energy, may help to address the problem. However, there is little scope to subsidise this kind of
investment, given government budget constraints, and the policy framework does not create clear
incentives. For example, the lack of feed-in tariffs or net-metering hinders the uptake of renewable
energy technology by tourism operators, who may otherwise invest in such technologies if potential
revenues could be generated from them. The introduction of energy-efficiency audits could also help;
they have been introduced in other LICs with impressive results in terms of energy savings, which
improve competitiveness and reduce carbon emissions.
Water management activities can help increase the number of guests who can be sustainably
maintained in areas with water scarcity, and there are also short-term returns to investment on water
saving initiatives. It has been found that surface and groundwater supplies in major tourism areas (such
as the Kathmandu Valley) are being used unsustainably, with extraction levels twice the estimated
sustainable levels (UNEP, 2008). Hence, initiatives like the one undertaken by Syangboche Hotel,
which has installed a rainwater collection system that has helped reduce water usage (sourced from
local communities) by up to 60%, can make a big contribution to the sustainability of the tourism
sector, and will become essential if tourist numbers grow.
Box 3: MAST Nepal45
The ‘Marketing Assistance to Nepal for Sustainable Tourism Products’ programme was
launched by SNV Nepal in 2006 and ran until 2008. The programme had a number of
objectives, including the development of sustainable tourism products aimed at the European
market and the creation of stronger business links between Europe and Nepal. The programme
also aimed to raise awareness of the need to provide sustainable tourism services within Nepal.
The programme was considered a success in terms of its engagement with the private sector, as
it provided incentives for tourism enterprises to invest in sustainable practices and help build
the capacity of the sector. The project resulted in the development of sustainable tourism
products in 23 of the 30 companies it engaged with, introducing waste management,
44 http://xplorenepal.com/sustainability.php
45 http://www.unep.org/eou/Portals/52/Reports/Mast%20evaluation%20-%20Final-August08.pdf
Low carbon competitiveness in Nepal 36
preservation and training activities.
Box 4: Great Himalaya Trail – Nepal46
The Great Himalaya Trail (GHT) programme, a joint initiative of the Government of Nepal,
the UK’s Department for International Development (DFID) and SNV, works with Nepalese
tourism enterprises to ensure the trail is developed into ‘an iconic and globally significant
new tourism product’ that is managed with sustainable practices and contributes to the
country’s natural and cultural heritage. The GHT is focussed on the promotion of trekking
activities within the Nepalese Himalayas and surrounding environs, in recognition that the
trail has great potential to provide a significant boost to the country’s tourism industry and its
various support sectors, thus supporting inclusive growth. The GHT is collaborating with
Travelife to develop the ‘Responsible Travel Nepal’ programme, aiming to improve the
sustainability of Nepalese travel companies and to generate increased revenues.
Trekking and mountaineering can also have negative environmental impacts. The two activities –
which tend to be concentrated in environmentally fragile areas (such as the Himalayas) – create water
and land pollution (due to the construction of tourism facilities), increase waste, and increase use of
fuel wood (MOPE, 2004).
Box 5: Nepal Environment and Tourism Initiative Foundation (NETIF)47
NETIF builds links between tourism enterprises and the local communities they operate in
by promoting collaboration on environmental issues and creating livelihood opportunities
for community members. One project being developed is the Payment for Environmental
Services (PES) Action Research Project. NETIF states that PES is a new concept in Nepal.
The scheme charges downstream users of rivers for ‘services received’, e.g. in the form of
an improved water supply, and pays upstream community groups for providing those
services through conservation management. The project is being piloted in the Shivapuri
Nagarjun National Park. Park rivers supply 66% of Kathmandu’s water; hence the project
promotes both water conservation in the National Park and improved water supplies in
nearby urban areas. Other NETIF projects include the construction of environmentally
sensitive tourism infrastructure, capacity-building for sustainable tourism activities for local
communities, and the environmental management of selected trekking trails.
Pressure from international tour operators for more sustainable operations is slowly growing. Partly
this reflects demand from customers for more sustainable holidays, but it is also a result of pressure
from investors. This voluntary self-regulation is exemplified by the Travelife Award system – an
international certification scheme, set up by tourism industry members, that awards Gold, Silver or
Bronze ratings to participating hotels and accommodations (currently represented in 25 countries, of
which Kenya is the only LIC to date) based on a number of environmental and social criteria.
46 www.thegreathimalayatrail.org
47 http://www.netif-nepal.org/about_us.htm#Vision
Low carbon competitiveness in Nepal 37
Growth of such certification schemes may drive increased water, energy and carbon footprinting, and
compliance may become increasingly important in order for Nepalese tourism companies to remain
competitive going forward. Thus, putting in place the necessary natural resource management policies,
regulations, and private sector incentives for efficiency and sustainable natural resource management
could help to enhance the sector’s competitiveness. This could be especially beneficial for early
adopting countries, who can establish a reputation and associated international ‘brand’ for green
tourism (ERD, 2012). However, environmental awareness is relatively low amongst tourists from
within the region; thus, pressure to adopt green measures may be less evident in current patterns of
tourism growth in Nepal.
Climate finance could potentially support the development of sustainable tourism, for example by
supporting the use of solar power by hotels, or by supporting ecotourism projects as a way to promote
sustainable forest management.
5.5 Interactions between infrastructure, tourism and the environment
The Government of Nepal is currently building a series of roads to connect all the provincial
‘headquarters’ cities within the country. This will have an impact on tourism by opening up regions
that have been previously overlooked due to their inaccessibility.
However, it has been reported by various members of the Nepali tourism industry that the construction
of new roads has contributed to environmental or economic damage such as
trekking trails destroyed during road construction
local products (such as food or locally produced handicrafts) substituted by more competitive
imported products after roads are built
deforestation, when badly managed road construction works resulted in losses to forest cover.
Road construction and expansion works have allegedly helped decrease the price of imported goods
into the affected areas by at least 50%, but have at the same time reduced the number of foreign
tourists visiting some affected areas since certain trekking trails were removed during the road
construction process (Brinkman, 2012).
Box 6: Rural Access Programme48
DFID, together with the Government of Nepal, is carrying out the ‘Rural Access Programme’
(RAP). The programme aims to reduce poverty in rural communities across Nepal by
improving access to transport by constructing roads. The transport infrastructure is meant to be
constructed in a labour intensive and environmentally friendly manner, with environmental
mitigation measures taken both during and after construction activities.
Evaluations have shown that there have been net benefits for the businesses in affected areas,
both farms and other enterprises; for example, agricultural productivity has improved, and the
number of hotels has increased.
The Phewa Lake Dam (close to the city of Pokhara and situated in a major tourism hotspot) serves to
illustrate the potential complementarities and trade-offs of different economic activities. The dam
provides hydroelectricity as well as water regulation services, and also creates opportunities for a
number of water-based tourism activities. The dam is thus a good example of how energy,
environmental regulatory services and tourism activities can be complementary. However, the dam is
suffering from increased siltation (Pokharel, 2008), which could undermine these benefits. Rising
48 http://www.rapnepal.com/Publication/Impact%20Assessment%20Report%20RAP%20I.pdf

Low carbon competitiveness in Nepal 38
siltation levels have been attributed to increased deforestation activities around the lake, while
pollution levels have also increased, as a result of waste from local settlements and activities. This
illustrates the complex interactions between different economic activities, and highlights the need for a
coordinated approach to natural resource management that takes into account wider socioeconomic
impacts and trade-offs.
5.6 Conclusion
Table 13 below summarises the main opportunities and risks that are currently faced in Nepal’s
tourism sector associated with the three key drivers identified at the beginning of this report: natural
resource scarcity, international mitigation policies, and the impact of climate change. Possible policy
and business responses are suggested, for further discussion and exploration at the national level.
Table 13: Summary of tourism sector opportunities and risks associated with three drivers
Opportunities / risks Implications / responses
Natural resource scarcity
Growth of tourism creates challenges for natural
resource management (water and energy), including
threats to the value of existing tourist attractions from
pollution and waste creation.
Invest in diversification of tourist attractions to reduce
pressure on particular areas and promote more widespread
benefits.
Invest in infrastructure and services (e.g. water and
sanitation) necessary for sustainable expansion of tourism.
Develop appropriate regulatory framework.
Raise awareness on natural resource management and
green and sustainable tourism, in the community and with
tourists themselves.
Increased access to rural areas could increase tourist
numbers but also damage natural tourism assets.
Develop coordinated strategy for tourism development
involving all relevant Ministries and stakeholders to balance
competing objectives, and establish appropriate regulatory
framework.
Poor access to energy, and high costs, reduce
competitiveness in the short term but could promote
greater use of renewable energy sources and energy
efficiency, reducing costs and improving competitiveness
over time.
Create appropriate incentives for investment in energy
efficiency and alternative energy sources, e.g. solar water
heaters.
Climate change mitigation policies
Increased demand for sustainable tourism standards and
certification. Increased use of sustainable tourism
initiatives by Nepalese enterprises can help them better
market themselves at the global level, attracting
environmentally conscious tourists.
Establish Nepal’s brand as a green tourism destination to
create a competitive advantage.
Introduce and strengthen standards, labels, award
schemes that reward green credentials in the tourism
industry.
Consider joining international Travelife Award scheme.
Undertake targeted marketing to environmentally
conscious, high-value tourists
Carbon taxation schemes could potentially increase
travel costs to Nepal and reduce tourist numbers.
Promote tourism from within the region.
Climate finance could support sustainable tourism
initiatives or support ecotourism development to promote
sustainable forest management.
Develop a strategy that optimises contribution from public
sources of climate finance.

Low carbon competitiveness in Nepal 39
Tourism industry as an advocate and driver of green
growth patterns.
Collaborate with the tourism industry in rolling out initiatives
to promote clean, attractive environment, and raise
awareness.
Impact of climate change
Climate change effects e.g. increased glacier melt and
glacial lake floods (and the Atmospheric Brown Cloud)
could threaten some tourism activities and infrastructure.
Undertake more detailed analysis of the potential impacts
of climate change on tourism in different locations, and
adapt infrastructure and services appropriately.
Nepal has substantial natural assets and has benefited significantly from the fast growth of tourism in
the last 10 years, and there is still much potential for further growth in the industry. However,
appropriate management of natural resources, and sensitive, well-regulated infrastructure development,
are required to ensure that continued growth is not undermined. Similarly, there is potential to develop
the ecotourism sector further, which could help Nepal to take advantage of, and at the same time
preserve, its natural assets, such as forests, water and wildlife. However, a balance must be struck
between developing the sector and maintaining the environmental assets that attract tourists in the first
place.
Increasing international emphasis on environmental credentials within the tourism industry is
inevitable going forward, and will reward those tourism destinations that are perceived as relatively
green. Thus, establishing Nepal’s brand as a green tourism destination could be important to creating a
competitive advantage for the future – even if current sources of demand from within the region are
not yet placing much importance on these issues.
Within that context, investment in renewable energy and energy-efficiency measures by hotels can
provide both cost advantages and reputational benefits. However, there appears to be less awareness
about these issues within Nepal than there is within other countries, so publicising the benefits and
providing support and incentives for these investments may be warranted to maintain a competitive
sector. Climate finance could potentially support the development of a green tourism sector, for
example by supporting energy audits or the introduction of green energy by hotels, or by supporting
ecotourism projects as a way to promote sustainable forest management.
The tourism industry itself has an interest in developing a sustainable and environmentally conscious
sector, and in protecting the natural environment, and thus can act as an important advocate of green
growth policies. As this study has shown, there are many potential synergies between developing a
sustainable and lucrative tourism sector, and promoting sustainable and inclusive growth.

Low carbon competitiveness in Nepal 40
6 Conclusions
The Nepal Trade Integration Strategy 2010 identified the expansion of trade as one of the key drivers
of inclusive growth in Nepal going forward. This and the more recent Immediate Action Plan on
Economic Development and Prosperity, published in 2012, set out a number of policies to promote
export competitiveness and growth. The success of these policies will depend to a large extent on the
global trade patterns shaping the opportunities that Nepal faces.
Our analysis suggests that over the next 10 years, global trade patterns will be transformed by climate
change, international mitigation, and natural resource scarcity, resulting in an inevitable shift over time
to a low carbon global economy. This study has been asking what this might look like. What impact
will it have on Nepal’s competitiveness and growth? What threats and opportunities will it create? And
how should policy-makers and businesses respond?
This report has examined how these issues could play out in Nepal over the next decade, particularly
focusing on the energy, forestry and tourism sectors. It has identified potential opportunities and
threats to Nepal’s competitiveness and growth, and possible policy responses.
The energy sector
The availability and reliability of energy, especially electricity, are major constraints on
competitiveness, growth and living standards in Nepal. Yet the potential to develop hydropower and
other renewable energy sources is substantial. Many opportunities for investment have been identified,
but their development is hampered by a poor investment climate and weak institutional mechanisms
and governance.
A diversified energy mix is required, potentially through the development of solar PV and wind energy
in addition to hydropower, as too much reliance on hydropower could undermine resilience, given the
impact of climate change on hydropower generation capacity.
Almost all of the fossil fuels used within Nepal are imported, and diesel and LPG are subsidised. But
financial constraints undermine the ability of the Nepal Oil Corporation to ensure supplies and to
invest in distribution infrastructure to meet growing demand. Subsidising fuel disincentives renewable
energy investment and energy-efficiency measures by companies, which will undermine
competitiveness in a future carbon constrained global economy. In addition, rising energy prices will
make subsidising diesel and LPG less affordable over time, exacerbating public finance problems.
There are many economic opportunities that could be explored relating to potential new markets for
biogas and biofuels. In addition, there is much scope to undertake energy-efficiency measures, which
could significantly improve the competitiveness of Nepal’s industries. Such measures have generated
substantial savings in other countries that have taken a more proactive approach to incentivising the
private sector through energy audits and regulation.
Low carbon competitiveness in Nepal 41
Possible policy responses:
1. Remove subsidies on LPG and diesel to improve future competitiveness, and find mechanisms
to further incentivise industrial energy efficiency – for example, through regulation, awards,
demonstration projects, or enhanced access to finance to cover upfront costs.
2. Strengthen and encourage investment in renewables and innovative ways to access electricity
to improve competitiveness in the long term. Investment in hydropower should be balanced by
some diversification of energy sources to increase resilience to climate change impacts.
Consider a greater focus on small hydro, which would spread the risk by having more
dispersed sites for power generation.
3. Support the development of commercial biogas production through an appropriate investment
climate and regulatory framework, and through mechanisms to support access to finance, to
overcome upfront costs. Encourage foreign investment to bring capital and technology.
The forestry sector
The unsustainable exploitation of forests can undermine growth and competitiveness in the future, by
jeopardising forest-dependent livelihoods and depleting natural assets. Stronger incentives to protect
the forest can be created by developing sectors that rely on sustainable forest management, such as
ecotourism, and products with export potential such as medicinal and aromatic plants.
The introduction of community forestry management has successfully reduced deforestation and
yielded economic benefits for participating communities. However, the model is facing some
implementation challenges and further reforms could potentially help to improve its impact.
Exploitation of Nepal’s forests still continues in an uncontrolled fashion in many areas. Forests
inevitably compete with other land uses, including agricultural production, settlement, and
infrastructure development. Logging continues in light of lucrative domestic and export markets for
both timber and fuel wood. Some of these processes are part and parcel of development, and some
degree of forest exploitation is inevitable and indeed desirable in a growing economy. Infrastructure
development and firewood availability are important for the wider competitiveness of the national
economy. However, it is clear that a balance needs to be struck between competing national
development priorities.
One part of the solution to unsustainable forest use is appropriate forest management at the national
level, and better enforcement of existing laws and regulations. But another part is creating stronger
economic incentives to protect the forest, by facilitating the development of alternative livelihoods that
are consistent with forest conservation. Community forest user groups are one way to achieve this, as
they have relatively strong incentives to identify and develop livelihoods based on sustainable forest
use. Private management of forest resources, along with an appropriate incentive mechanism and
regulatory framework, could also provide a possible model for more sustainable forest management
that would potentially help to commercialise the forest sector further.
Forest-dependent livelihoods can be based on sustainable harvesting of timber or fuel wood, or of non-
timber forest products, particularly those in which Nepal has a significant competitive advantage, such
as medicinal and aromatic plants. There appears to be considerable scope to develop these markets
further and to develop Nepal’s export competitiveness and manufacturing base on the back of these
products in a way that also contributes to sustainable forest management. However, there are many
challenges to be overcome relating to standards and certification, marketing and branding, labour
supply, and the investment climate.
Low carbon competitiveness in Nepal 42
Possible policy responses:
1. Implement multi-stakeholder processes to develop a joined up strategy for forest
management that balances competing national development priorities, and focuses on
creating livelihoods that are based on sustainable forest management and that contribute to
ongoing competitiveness and long-term growth.
2. Continue to expand community forestry and undertake reforms to improve implementation.
Help build sustainable livelihoods for community forest user groups, by supporting their
attainment of Forestry Stewardship Council certification for example, and by helping them
to benefit from ecotourism opportunities.
3. Explore the potential for increased commercial development of the forest sector through the
implementation of leasehold forestry as set out in the Immediate Action Plan on Economic
Development and Prosperity (2012), ensuring that long-term sustainability considerations
are taken into account, and that a strong regulatory framework is in place.
4. Through public-private dialogue, identify and devise a strategy to sustainably develop non-
timber forest product markets in which Nepal has a potential competitive advantage; for
example, by putting in place the necessary market institutions, such as standards and
certification mechanisms, and tackling barriers to moving up the value chain.
The tourism sector
Nepal has substantial natural assets and has benefited significantly from the fast growth of tourism in
the last 10 years, and there is much potential for further growth in the industry. However, appropriate
management of natural resources and sensitive, well-regulated infrastructure development are required
to ensure that the growth of the tourism industry (and the value of the natural assets upon which it
depends) is not undermined over time.
There is potential to develop the ecotourism sector further, which could help Nepal to take advantage
of – and at the same time preserve – its natural assets, such as forests, water and wildlife. However, a
balance must be struck between developing the needed tourism infrastructure and maintaining the
environmental assets that attract tourists in the first place.
Increasing international emphasis on environmental credentials within the tourism industry is
inevitable going forward, and will reward those tourism destinations that are perceived as relatively
green. Thus, establishing Nepal’s brand as a green tourism destination could be an important source of
competitive advantage for the future.
Within that context, investment in renewable energy and energy-efficiency measures by hotels can
provide both cost advantages and reputational benefits. However, there appears to be less general
awareness about these issues within the tourism industry in Nepal than there is within some other
countries.
The tourism industry itself has an interest in developing a sustainable and environmentally conscious
sector, and in protecting the natural environment, and therefore can act as an important advocate of
green growth policies. Thus, there are many potential synergies between developing a competitive and
sustainable tourism sector, and promoting sustainable and inclusive growth.
Low carbon competitiveness in Nepal 43
Possible policy responses:
1. Develop a coordinated strategy for tourism development, involving all relevant Ministries
and stakeholders, to balance competing interests with regard to natural resource
management and infrastructure development, and to establish a regulatory framework that
supports a sustainable, competitive tourism industry.
2. Promote the synergies between tourism development and sustainable growth by
establishing Nepal’s brand as a green tourism destination and thus creating a competitive
advantage. To complement this, introduce and strengthen standards, labels, and award
schemes that reward green credentials in the tourism industry, including for example the
international Travelife Award scheme. Consider supporting targeted marketing to
environmentally conscious, high-value tourists.
3. Collaborate with the tourism industry in supporting initiatives to promote a clean, attractive
environment, and raise awareness about the competitiveness benefits of energy efficiency
and renewable energy usage.
4. Identify opportunities for using climate finance to support the development of a green
tourism sector, for example by supporting energy audits or the introduction of green energy
by hotels, or by supporting ecotourism projects as a way to promote sustainable forest
management.
Low carbon competitiveness in Nepal 44
References
Acharya, D. (2003) A Review and Synopsis of Information Relating to Natural Resource Management
in High Altitude Areas in Nepal. A Report Submitted to Livelihood and Forestry Project (LFP),
Kathmandu, Nepal.
ADB (2009) ‘Country Diagonistics Studies, Nepal: Critical Development Constraints’ Asian
Development Bank (ADB), Department for International Development (DFID), International Labour
Organization (ILO).
Adhikari, B. R. (2002) Forest Encroachment: Problems and Measures to tackle the Problems (in
Nepali). Hamro Ban. Department of Forests. Kathmandu.
Alternative Energy Promotion Centre (2011) ‘District Climate and Energy Plan (DCEP) Preparation
Guideline’. Government of Nepal.
Apsara Authority (2005), ‘Water Supply’, [online] accessed 22 March 2013 available from
http://www.autoriteapsara.org/en/apsara/urban_development/city/water_supply.html
ASEAN (2011) ‘Electrical Tariffs in ASEAN Member Countries’ ASEAN Energy.
Barahi, S. Fan, R. Hung, P. Malla, P. and Yeung, R. (2011) ‘Tourism Cluster in Nepal:
Microeconomics of Competitiveness’ Harvard Business School.
Basnyat, B. (2011) ‘Bioenergy Need Assessment Nepal’ Food and Agricultural Organization (FAO) of
the United Nations.
Blangy, S. and Wood, M.E. (1993) ‘Developing and implementing ecotourism guidelines for wildlands
and neighboring communities’ In Kreg Lindberg and Donald E. Hawkins (eds.). Ecotourism: a guide
for planners and managers. North Bennington,VT: Ecotourism Society: 32-54.
Brinkman, E. (2012) ‘The Influences of Climate Change, Roads and Tourism on the Adaptive
Capacity of Villagers in the Nepalese Himalaya’ Utrecht University.
BP plc. (2012) ‘Statistical Review of World Energy June 2012’, London: BP
(http://www.bp.com/content/dam/bp/pdf/Statistical-Review-
2012/statistical_review_of_world_energy_2012.pdf)
CBS (2012) ‘National Account Estimate 2011/2012’ Nepal: Central Bureau of Statistics.
CBS (2008) ‘Environment Statistics of Nepal 2008’ Nepal: Central Bureau of Statistics.
Dangal, S. and Roy, R. (2011) Forest Tenure Assessment in the Selected Countries in Asia: A Case
from Nepal. A Report Submitted to RECOFTC – The Center for People and Forests, Bangkok.
Derkeiler (2009) ‘Stung Meanchey waste to become methane gas, electricity’, [online] accessed on 26
March 2013 (http://newsgroups.derkeiler.com/Archive/Soc/soc.culture.cambodia/2009-
04/msg00346.html)
Low carbon competitiveness in Nepal 45
Dixit, A. (2011) ‘Climate Change in Nepal: changes in precipitation dynamics, flow, livelihoods and
adaptive actions’ Nepal: Institute of Social and Environmental Transition.
DNPWC (2009) ‘Annual Report (2008/09)’ Kathmandu: Department of National Parks and Wildlife
Conservation/GoN.
EPI (2012) ‘Environmental Performance Index’ Yale University.
European Union (2012) ‘European Report on Development 2012 Confronting Scarcity: Managing
Water, Energy and Land for Inclusive and Sustainable Growth’ London: Overseas Development
Institute (ODI), European Centre for Development Policy Management (ECDPM), German
Development Institute/Deutsches Institut für Entwicklungspolitik (GDI/DIE). (http://www.die-
gdi.de/CMS-Homepage/openwebcms3.nsf/(ynDK_FileContainerByKey)/MSIN-
82CDE6/$FILE/European-Commission_European-Report-on-Development-2011-2012.pdf?Open
Food and Agriculture Organization (FAO) of the United Nations (2011) ‘Ecotourism can play vital
role in maintaining healthy forests’ Rome: FAO (http://www.fao.org/news/story/en/item/90192/icode/)
Gautam, S. (2013) ‘Economic analysis of Nepal’s transmission power loss’ Energy for Nepal blog, 6
May 2013. (http://energyfornepal.wordpress.com/2013/05/06/economics-of-nepals-power-loss/)
GoN (2004) ‘National Ecotourism Strategy and Marketing Programme of Nepal’ Government of
Nepal.
GoN (2010) ‘Nepal National Adaptation Programme of Action’ Government of Nepal.
International Energy Agency (2007) ‘Tracking Industrial Energy Efficiency CO2 Emissions’ France:
IEA (http://www.iea.org/publications/freepublications/publication/tracking_emissions.pdf)
International Energy Agency (2012) ‘International Energy Agency Statics Database’ France: IEA
(http://www.iea.org/stats/balancetable.asp?COUNTRY_CODE=NP)
IMF World Economic Outlook (2012) ‘Coping with High Debt and Sluggish Growth’ Washington:
International Monetary Fund (http://www.imf.org/external/pubs/ft/weo/2012/02/pdf/text.pdf)
Kanel, K.R., Shah, S.B., Poudel, K. and Regmi, N.P. (2009) ‘Quick Assessment of Land Use, Forest
Policy and Governance’. Kathmandu: Nepal Forester’s Association, Green Governance Nepal and
SEEPORT.
Kunwar, S.C., Ansari, A.S. and Luintel, H. (2009) ‘Non-timber Forest Products Enterprise
Development: Regulatory Challenges in the Koshi Hills of Nepal’. Journal of Forest and Livelihood
8(2).
LFP (2009) ‘Community forestry for poverty alleviation: How UK aid has increased incomes in
Nepal’s middle hills.’ Livelihoods and Forestry Program (LFP).
Lonn P., Nobuya, M., Tsuyoshi, K. and Shigejiro, Y. (2012), ‘Effectiveness of Community-Based
Ecotourism in Forest Conservation and Livelihood Improvement: A Case Study in Chambok
Community-Based Ecotourism, Cambodia’ Conference on Sustainable Forest Ecosystem Management
in Rapidly Changing World, 12-14 September 2012, Taiwan.
Men, P. (2006) ‘Tourism, poverty, and income distribution: Chambok community-based ecotourism
development, Kirirom national park, Kompong Speu province’ Cambodia Social Research Institute,
Chiang Mai University.
MoFSC (2009) ‘Nepal’s readiness preparation proposal REDD 2010-2013: Kathmandu’. Ministry of
Forests and Soil Conservation, Government of Nepal.

Low carbon competitiveness in Nepal 46
MOPE (2004) ‘State of the Environment – Eco Tourism 2004’ Government of Nepal, Ministry of
Population and Environment.
NCVST (2009) ‘Vulnerability Through the Eyes of Vulnerable: Climate Change Induced Uncertainties
and Nepal’s Development Predicaments’ Institute for Social and Environmental Transition-Nepal
(ISET-N, Kathmandu) and Institute for Social and Environmental Transition (ISET, Boulder,
Colorado) for Nepal Climate Vulnerability Study Team (NCVST) Kathmandu.
NEA (2012) ‘NEA Annual Report 2012’ Nepal Energy Authority.
NTB (2012) ‘Tourist Arrivals’ (http://welcomenepal.com/promotional/about-us/tourist-arrivals/)
Nyaupane, G.P. and Chhetri, N. (2011) ‘Vulnerability to Climate Change of Nature Based Tourism in
the Nepalese Himalayas’, Tourism Geographies, No. 11 Vol. 1.
Ramanathan, V. et al. (2008) ‘Atmospheric brown clouds regional assessment report with focus on
Asia’ United Nations Environment Programme, Nairobi, Kenya.
Schott, C. (2009) ‘Socio-Economic Dynamics of Biofuel Development in Asia Pacific’ Jakarta:
Friedrich Ebert Stiftung.
Schwab, K (2012) ‘Global Competitiveness Index’ & ‘Sustainability Competitiveness Index’ World
Economic Forum (http://www3.weforum.org/docs/WEF_GlobalCompetitivenessReport_2012-13.pdf)
Sharma, Puspa and Shrestha, Niraj. (2011) Promoting exports of medicinal and aromatic plants
(MAPs) and essential oils from Nepal. A study report prepared for South Asia Watch on Trade,
Economics and Environment (SAWTEE) and submitted to German International Cooperation (GIZ),
Kathmandu.
Shrestha, R. S. (2010) Electricity Crisis (Load Shedding) in Nepal, Its Manifestations and
Ramifications, Hydro Nepal No. 6.
TIES (2012) How is ecotourism different from nature tourism, sustainable tourism, responsible
tourism? [online] accessed on 2 April 2012 (http://www.ecotourism.org/book/how-ecotourism-
different-nature-tourism-sustainable-tourism-responsible-tourism)
Travel Daily News (2012), ‘ASEAN Green Hotel Recognition Award 2012’, [online] accessed on 22
March 2013, available from http://www.traveldailynews.asia/news/article/47180/asean-green-hotel-
recognition-award)
UNData (2012) (http://data.un.org/)
UNEP, 2012, Green Economy Sectoral Study: BioTrade – Harnessing the potential for transitioning to
a green economy – The Case of Medicinal and Aromatic Plants in Nepal [online]
(http://www.unep.org/greeneconomy/Portals/88/documents/research_products/Bio%20Trade%20Medi
cinal%20and%20Aromatic%20Plants%20in%20Nepal.pdf)
United Nations Environmental Programme (2008) ‘Building Nepal’s Private Sector Capacity for
Sustainable Tourism Operations: A Collection of Best Practices and Resulting Business Benefits’
Paris, France. Nepal: UNEP and Nepal Tourism Board.
United Nations Environmental Programme (2011) ‘Tourism: Investing in Energy and Resource
Efficiency’ in Towards a Green Economy: Pathways to Sustainable Development and Poverty
Eradication - - A Synthesis for Policy Makers. UNEP
WECS (2010) ‘Energy Sector Synopsis Report 2010’. Water and Energy Commission Secretariat,
Kathmandu, Nepal

Low carbon competitiveness in Nepal 47
WDI (2012) ‘World Development Indicators 2012’
(http://data.worldbank.org/indicator/EN.ATM.CO2E.PC)
World Bank (2013) ‘Ease of Doing Business Index’ (http://www.doingbusiness.org/)
WTTC (2012) ‘Nepal Economic Impact Report’ World Travel & Tourism Council.

ODI is the UK’s leading
independent think tank on
international development and
humanitarian issues.
Our mission is to inspire and
inform policy and practice which
lead to the reduction of poverty,
the alleviation of suffering and the
achievement of sustainable
livelihoods.
We do this by locking together
high-quality applied research,
practical policy advice and policy-
focused dissemination and
debate.
We work with partners in the
public and private sectors, in both
developing and developed
countries.
This material has been funded by UK Aid from
the UK Government; however the views
expressed do not necessarily reflect the UK
Government’s official policies.
Readers are encouraged to reproduce
material from ODI Reports for their
own publications, as long as they are
not being sold commercially. As
copyright holder, ODI requests due
acknowledgement and a copy of the
publication. For online use, we ask
readers to link to the original resource
on the ODI website. The views
presented in this paper are those of the
author(s) and do not necessarily
represent the views of ODI.
© Overseas Development
Institute 2013. This work is licensed
under a Creative Commons
Attribution-NonCommercial Licence
(CC BY-NC 3.0).
ISSN: 2052-7209
Overseas Development Institute
203 Blackfriars Road
London SE1 8NJ
Tel +44 (0)20 7922 0300
Fax +44 (0)20 7922 0399

ODI is the UK’s leading independent think tank on international development and humanitarian issues.
Our mission is to inspire and inform policy and practice which lead to the reduction of poverty, the alleviation of suffering and the achievement of sustainable livelihoods.
We do this by locking together high-quality applied research, practical policy advice and policy-focused dissemination and debate.
We work with partners in the public and private sectors, in both developing and developed countries.
Readers are encouraged to reproduce material from ODI Reports for their own publications, as long as they are not being sold commercially. As copyright holder, ODI requests due acknowledgement and a copy of the publication. For online use, we ask readers to link to the original resource on the ODI website. The views presented in this paper are those of the author(s) and do not necessarily represent the views of ODI.© Overseas Development Institute 2013. This work is licensed under a Creative Commons Attribution-NonCommercial Licence (CC BY-NC 3.0).ISSN: 2052-7209
Overseas Development Institute 203 Blackfriars Road London SE1 8NJ
Tel +44 (0)20 7922 0300 Fax +44 (0)20 7922 0399
Cover image: Bikas Rauniar, 2009 Using forest resources in Nepal Department for International Development Flickr