Global Carbon Fiber Composites Supply Chain ... · Global Carbon Fiber Composites Supply Chain...
116
Global Carbon Fiber Composites Supply Chain Competitiveness Analysis Sujit Das, Josh Warren, and Devin West Energy and Transportation Science Division, Oak Ridge National Laboratory Susan M. Schexnayder The University of Tennessee, Knoxville CEMAC is operated by the Joint Institute for Strategic Energy Analysis for the U.S. Department of Energy's Clean Energy Manufacturing Initiative. Technical Report ORNL/SR-2016/100 | NREL/TP-6A50-66071 May 2016 Contract No. DE-AC36-08GO28308
Transcript of Global Carbon Fiber Composites Supply Chain ... · Global Carbon Fiber Composites Supply Chain...
Global Carbon Fiber Composites Supply Chain Competitiveness Analysis Sujit Das, Josh Warren, and Devin West Energy and Transportation Science Division, Oak Ridge National Laboratory
Susan M. Schexnayder The University of Tennessee, Knoxville
CEMAC is operated by the Joint Institute for Strategic Energy Analysis for the U.S. Department of Energy's Clean Energy Manufacturing Initiative.
Technical Report ORNL/SR-2016/100 | NREL/TP-6A50-66071 May 2016
Contract No. DE-AC 36-08GO28308
CEMAC is operated by the Joint Institute for Strategic Energy Analysis for the U.S. Department of Energy's Clean Energy Manufacturing Initiative.
Clean Energy Manufacturing Analysis Center 15013 Denver West Parkway
Golden, CO 80401
303-275-3000
www.manufacturingcleanenergy.org
Global Carbon Fiber Composites Supply Chain Competitiveness Analysis Sujit Das, Josh Warren, and Devin West Energy and Transportation Science Division, Oak Ridge National Laboratory
Susan M. Schexnayder The University of Tennessee, Knoxville
Prepared under Task No. DOCC.LT19
Technical Report ORNL/SR-2016/100 | NREL/TP-6A50-66071 May 2016
Contract No. DE-AC36-08GO28308
iv
NOTICE
This report was prepared as an account of work sponsored by an agency of the United States government. Neither the United States government nor any agency thereof, nor any of their employees, makes any warranty, express or implied, or assumes any legal liability or responsibility for the accuracy, completeness, or usefulness of any information, apparatus, product, or process disclosed, or represents that its use would not infringe privately owned rights. Reference herein to any specific commercial product, process, or service by trade name, trademark, manufacturer, or otherwise does not necessarily constitute or imply its endorsement, recommendation, or favoring by the United States government or any agency thereof. The views and opinions of authors expressed herein do not necessarily state or reflect those of the United States government or any agency thereof.
Available electronically at SciTech Connect: http:/www.osti.gov/scitech
Available for a processing fee to U.S. Department of Energy and its contractors, in paper, from:
U.S. Department of Energy Office of Scientific and Technical Information P.O. Box 62 Oak Ridge, TN 37831-0062 OSTI http://www.osti.gov Phone: 865.576.8401 Fax: 865.576.5728 Email: [email protected]
Available for sale to the public, in paper, from:
U.S. Department of Commerce National Technical Information Service 5301 Shawnee Road Alexandria, VA 22312 NTIS http://www.ntis.gov Phone: 800.553.6847 or 703.605.6000 Fax: 703.605.6900 Email: [email protected]
Cover Photos: (left to right) iStock 2225189; iStock 16687273; Oak Ridge National Laboratory; iStock 24304597; iStock 26005993; iStock 2069560
NREL prints on paper that contains recycled content.
v
Preface Founded in 2015 with support from U.S. Department of Energy’s Clean Energy Manufacturing Initiative, the Clean Energy Manufacturing Analysis Center (CEMAC) draws from open source and industry data to deliver insights of supply chains and manufacturing for clean energy technologies through uniquely detailed, bottom-up cost analysis. CEMAC provides objective analysis and up-to-date information on global clean energy manufacturing to inform choices for economic growth and the transition to a clean energy economy.
This initial report on the global carbon fiber composites supply chain competitiveness analysis provides an analysis of carbon fiber and carbon fiber polymer composites supply, demand, and markets and the geographic distribution of these in four major market growth areas: aerospace, automotive, wind energy, and pressure vessels. The analysis is primarily based on the available market forecasts and in some cases the authors’ personal communications with industry experts. The level of analysis and availability of information differ across the four application areas, particularly in terms of the supply chain competitiveness analysis. Detailed economic competitiveness analysis has been limited to only two applications—automotive and pressure vessels—using a bottom-up cost modeling framework developed by the National Renewable Energy Laboratory to examine the competitiveness of several clean energy technologies. Conventional manufacturing technologies such as petroleum feedstock (i.e., polyacrylonitrile) based carbon fiber, and resin transfer molding and filament winding technologies for automotive and pressure vessel manufacturing, respectively were only considered as a part of the analysis.
Future reports will focus on the detailed competiveness analysis of the remaining two major clean energy application areas (i.e., aerospace and wind energy using the NREL cost modeling framework). The analysis will be expanded to other major potential application areas, for example, sporting goods, beyond the four sectors initially considered. An updated analysis of the carbon fiber and carbon fiber polymer composites industry will take into consideration the recent market developments such as a significant increase in supply and demand in China and Russia. Among the four major sectors considered in the initial analysis, commercial aerospace sector has shown an increased growth in carbon fiber use as the latest Boeing 787/777 and the Airbus A350XWP contain more than 50% carbon fiber reinforced plastics by weight. Impacts of alternative low-cost precursors such as biomass-based lignin material and heavy tow textile grade acrylic fiber used for clothing application today on the manufacturing supply chain and its competitiveness will be considered. An understanding of the industry impacts on the alternative carbon fiber composites part manufacturing technologies being considered by the industry to improve its competitiveness will also be explored.

vi
Acknowledgments The authors would like to thank Joe Cresko and Brian Walker of the Department of Energy for their support of this publication. The authors would also like to thank Samuel Booth and Donald Chung of the National Renewable Energy Laboratory, Ravi Deo of the Department of Energy, and Dale Brosius and Cliff Eberle of Institute of Advanced Composites Manufacturing Innovation (IACMI) for their reviews and input.
vii
Executive Summary The objective of this study is to identify key opportunities in the carbon fiber (CF) supply chain where resources and investments can help advance the clean energy economy. The report focuses on four application areas—wind energy, aerospace, automotive, and pressure vessels—that top the list of industries using CF and carbon fiber reinforced polymers (CFRP) and are particularly relevant to the mission of U.S. Department of Energy’s Office of Energy Efficiency and Renewable Energy (DOE EERE). For each of the four application areas, the report addresses the supply and demand trends within that sector, supply chain, and costs of carbon fiber and components.
Examining CF and CFRP supply, demand, and markets, and the geographic distribution of these now is timely. Currently, there are regulatory, economic, market-entry, and consumer-interest motivations for manufacturers to adopt materials that reduce the weight of the manufactured product and maintain or increase its performance profile. Manufacturers are interested in producing aircraft and automobiles that are more fuel efficient, increasing the size of wind energy blades to efficiently capture additional resource, and producing strong lightweight storage vessels for alternative transportation fuels. CF and CFRP, by providing maximum “lightweighting” potential, are primary candidate materials for achieving each of these goals.
The level of analysis and availability of information differ across the four application areas, particularly in terms of the supply chain competitiveness analysis. Detailed economic competitiveness analysis of two applications—automotive and pressure vessels—has benefitted greatly from a bottom-up cost model developed by the National Renewable Energy Laboratory to examine the competitiveness of several clean energy technologies. In addition, a low-cost carbon fiber technology based on the high-output textile grade acrylic fiber used for clothing application today has been used to examine as the most optimistic competitive analysis scenario of these two applications at a large-scale commercial production level. For the remaining two applications, the competitiveness analysis largely relies upon the authors’ critical assessment of available literature. Industry analysts’ forecasts of demand and production, open literature about future applications and processes, and in some cases, the authors’ personal communications with industry experts inform the assessment.
Carbon fiber demand is anticipated to be 92,802 tonnes by 2018; this figure is based on a 12.5% compound annual growth rate, a rate that averages three industry projections of demand growth made in 2012 and 2013. More recent demand projections are more aggressive. Europe leads the world in CF and CFRP demand, and it is expected to retain that lead. Demand growth in North America is expected to keep pace with Europe and exceed demand growth rates of both Asia and Japan. Excess manufacturing capacity exists currently, especially in small-tow capacity and in North America and Asia, but recent forecasts suggest significant demand growth in the large-tow markets of wind and automotive applications necessitating capacity expansions to meet demand. This creates a potential export opportunity for North American manufacturers. The need for ready supply of precursor and carbon fiber, the proprietary nature
viii
of process technology, and U.S. export controls have led to an industry with significant vertical integration, even across continents.
Wind energy carbon fiber uses moderate to large-tow fibers (a group of parallel filaments). It accounts for about 17% of total demand and is projected to grow from about 7,600 tonnes/year to 25,000 tonnes/year by 2018. Europe will continue to have the major share of total worldwide wind energy carbon fiber demand (i.e., about 65% in 2020) due to its renewable energy targets and use of offshore wind capacity. Zoltek is the primary producer of carbon fiber used in wind turbine blades, but companies in Taiwan, Japan, Germany, and elsewhere are involved in the supply chain for CFRP parts. As the wind industry works to increase the size of turbines and blades either for land or off-shore based installations, performance considerations may override the current limiting factor for CF use, cost.
The aerospace industry, with its strict performance requirements, uses small-tow fibers, so as a market driver it stands apart from the three other application areas examined here. While small-tow production capacity is centered in Asia, production in major supply chains includes precursor and carbon fiber nodes located in the United States. Although co-location of facilities is not mandatory and some shipping of inputs across continents occurs, recent new facilities have been sited near existing aerospace production hubs. Capacity exceeds current demand and is expected to remain robust. Producers in this area have enjoyed relative stability afforded by the long-term production schedules of the Airbus and Boeing aircraft programs. There is a strong relationship between process improvements and the increasing CF and CFRP content in aerospace applications, and process research remains robust in methods applicable to aerospace composite manufacturing.
The automotive industry has slowly expanded its used of CF and CFRP, and continued growth at a compound annual growth rate of 20.5% or higher is expected in the next several years. The majority of automotive CF demand is from BMW’s i3 line of cars. Small-market cars have been the focus for CF application for both price and production-scale reasons. Process improvement research is robust for this market, and breakthroughs that improve processing speed can significantly affect part cost and, thus, adoption of CFRP in the automotive sector. The United States has a current role in the CFRP automotive part supply chains that are most cost-competitive in part because of low electricity costs, although materials still dominates the cost of CFRP parts.
North America leads the world in current and projected production of CF-based pressure vessels. Seven of the eight leading manufacturers of these Type III and IV pressure vessels are located in North America, with five of them located in the United States. Supply chain nodes are located in the United States, Japan, and Europe. Little price difference was estimated by region. Lower Chinese labor costs were offset by lower utility and capital costs in the United States. Materials account for 90% of the total cost of CFRP pressure vessels. The end market occurs primarily in Asia-Pacific and Latin American countries where natural gas vehicle use is concentrated.

ix
Industry experts in the United States perceive the United States lagging behind Asian producers in the CF and CFRP markets, and they perceive U.S. innovation to have slowed. Non-U.S. representatives point to the advantage the United States has achieved through its experiences in the aerospace applications markets, especially with respect to quality control, design technologies, and materials’ mechanical properties.
x
Table of Contents 1 Introduction .................................................................................................................................................... 1
1.1 Carbon Fiber Composite Applications ............................................................................................................. 4
1.2 Carbon Fiber and Carbon Fiber Reinforced Polymer Demand ........................................................................ 4
1.3 Carbon Fiber Manufacturing Capacity .......................................................................................................... 11
2 Wind Energy ................................................................................................................................................. 19 2.1 Demand and Supply ...................................................................................................................................... 20
2.2 Price and Value .............................................................................................................................................. 23
2.3 Supply Chains ................................................................................................................................................ 25
2.4 Manufacturing ............................................................................................................................................... 27
2.5 Regional Competitiveness ............................................................................................................................. 27
2.6 Summary ....................................................................................................................................................... 29
3 Aerospace ..................................................................................................................................................... 30 3.1 Demand and Supply ...................................................................................................................................... 30
3.2 Price and Value .............................................................................................................................................. 35
3.3 Supply Chains ................................................................................................................................................ 37
3.4 Manufacturing ............................................................................................................................................... 41
3.5 Regional Competitiveness ............................................................................................................................. 43
3.6 Summary ....................................................................................................................................................... 45
4 Automotive Industry ..................................................................................................................................... 46 4.1 Demand and Supply ...................................................................................................................................... 47
4.2 Price and Value .............................................................................................................................................. 51
4.3 Supply Chains ................................................................................................................................................ 54
4.4 Manufacturing ............................................................................................................................................... 59
4.5 Regional Competitiveness ............................................................................................................................. 61
4.6 Summary ....................................................................................................................................................... 69
5 Pressure Vessels ........................................................................................................................................... 71 5.1 Demand and Supply ...................................................................................................................................... 72
5.2 Price and Value .............................................................................................................................................. 78
5.3 Supply Chains ................................................................................................................................................ 80
5.4 Manufacturing ............................................................................................................................................... 82
5.5 Regional Competitiveness ............................................................................................................................. 82
5.6 Summary ....................................................................................................................................................... 89

xi
6 Industry Perceptions of Issues and Opportunities for Growth of the Carbon Fiber Composite Industry ........ 90 6.1 Points of Inefficiency in Production .............................................................................................................. 90
6.2 Industry-Diagnosed Growth Issues and Solutions ......................................................................................... 91
6.3 Perceptions of U.S. Industry’s Position and Market Growth ......................................................................... 94
7 Summary ...................................................................................................................................................... 96
8 References .................................................................................................................................................... 99
xii
List of Figures Figure 1-1. CF and CFRP value chain ....................................................................................................................... 3
Figure 1-2. Annual forecasted carbon fiber demand ............................................................................................. 6
Figure 1-3. CF demand projections by weight for the four major applications analyzed ...................................... 9
Figure 1-4. CFRP market value estimates ............................................................................................................... 9
Figure 1-5. Carbon fiber demand by region (tonnes) ........................................................................................... 10
Figure 1-6. Carbon fiber reinforced polymer demand by region (tonnes) ........................................................... 10
Figure 1-7. Geographic distribution of carbon fiber manufacturing locations ..................................................... 12
Figure 1-8. Geographic distribution of acrylonitrile and carbon fiber manufacturing in 2012 ............................ 16
Figure 1-9. Forecast of large-tow carbon fiber production capacity, by region ................................................... 16
Figure 1-10. Trade balance trend of U.S. carbon fiber industry ........................................................................... 17
Figure 1-11. U.S. import sources for carbon fiber in 2012 ................................................................................... 18
Figure 2-1. A schematic of carbon fiber spar cap application in wind blades ...................................................... 20
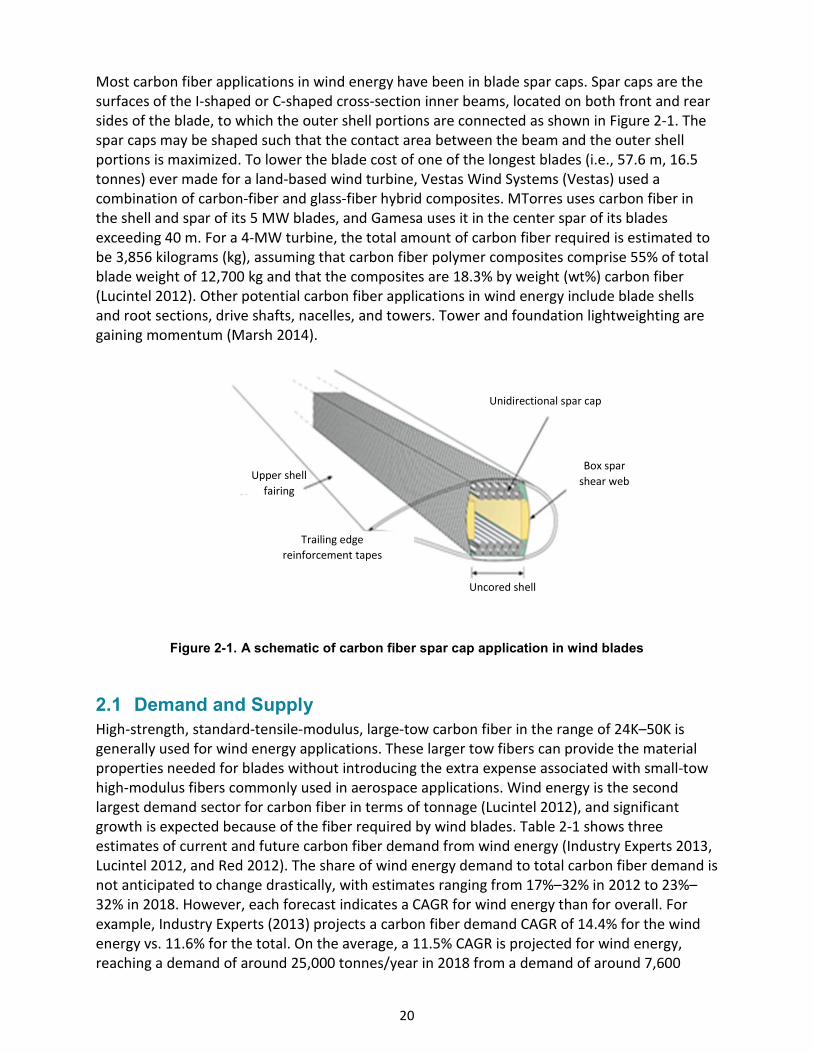
Figure 2-2. Forecast of carbon fiber demand for the wind energy industry, by region ....................................... 22
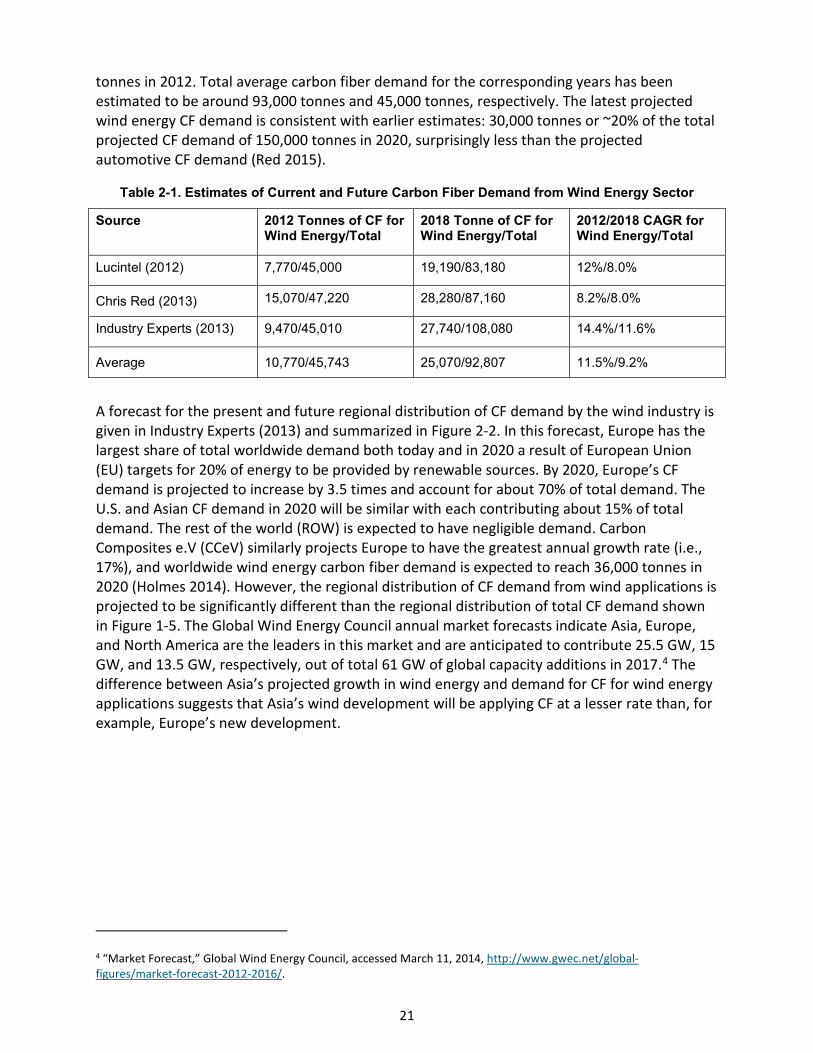
Figure 2-3. Forecast of CFRP demand for the wind energy industry, by region ................................................... 22
Figure 2-4. Forecast of large-tow carbon fiber production capacity vs demand, by region ................................ 23
Figure 2-5. Forecast of regional carbon fiber market demand (in value) for the wind energy industry .............. 24
Figure 2-6. Forecast of regional CFRP market demand (in value) for the wind energy industry ......................... 25
Figure 2-7. Cost breakdown of a 100-m carbon spar blade (SNK 100-01) ........................................................... 28
Figure 3-1. Breakdown of aircraft raw material demand ..................................................................................... 31
Figure 3-2. Breakdown of aerospace CF demand by sector ................................................................................. 32
Figure 3-3. An illustration of increasing composite content, by weight, in Boeing and Airbus aircraft ............... 32
Figure 3-4. Carbon fiber demand for aerospace applications by region .............................................................. 33
Figure 3-5. Small-tow carbon fiber capacity by region ......................................................................................... 34
Figure 3-6. Small-tow carbon fiber capacity by manufacturer ............................................................................. 35
Figure 3-7.Value of CF demand by sector ............................................................................................................. 36
Figure 3-8. Supply chain from CF precursor to complete Boeing 787 fuselage.................................................... 39
Figure 3-9. Supply chain from CF precursor to complete Airbus A350 XWB fuselage ......................................... 39
Figure 3-10. A visualization of the changing methods of CFRP manufacturing process over time as compared to
the composite content of aircraft ................................................................................................................. 42
Figure 3-11. Results of a survey of eight industry experts from five Chinese aircraft composite manufacturers
regarding composite manufacturing cost breakdown for composite manufacturing .................................. 43
Figure 4-1. Annual forecasted carbon fiber demand by the automotive industry ............................................... 48
Figure 4-2. Regional forecasted carbon fiber demand by the automotive industry ............................................ 49
Figure 4-3. Regional forecasted carbon fiber reinforced polymer demand by the automotive industry ............ 50
xiii
Figure 4-4. Carbon fiber demand potential from the automotive industry in 2017 if carbon fiber prices could be
halved ............................................................................................................................................................ 52
Figure 4-5. Regional forecasted automotive carbon fiber market values ............................................................ 53
Figure 4-6. Regional forecasted automotive carbon fiber reinforced polymer market values ............................ 54
Figure 4-7. BMW i3 supply chain .......................................................................................................................... 55
Figure 4-8. Distribution of 2013 automotive carbon fiber demand by specific automotive programs................ 56
Figure 4-9. Toray-Plasan Carbon Composites supply chain .................................................................................. 57
Figure 4-10. A historical perspective on global automotive industry carbon fiber demand and manufacturing
cycle time ...................................................................................................................................................... 61
Figure 4-11. 50K tow CF landed costs ................................................................................................................... 63
Figure 4-12. Distribution of 50K tow CF landed costs for scenario UUU .............................................................. 64
Figure 4-13. Bidirectional fabric landed costs ...................................................................................................... 65
Figure 4-14. Distribution of bidirectional fabric landed costs for scenario UUU.................................................. 66
Figure 4-15. Upper dash panel landed costs ........................................................................................................ 67
Figure 4-16. Distribution of upper dash panel landed costs for scenario UUU .................................................... 68
Figure 5-1. Annual forecasted carbon fiber demand by the pressure vessel industry ......................................... 73
Figure 5-2. Forecasted regional carbon fiber demand by the pressure vessel manufacturing industry .............. 77
Figure 5-3. Forecasted regional carbon fiber reinforced polymer demand by the pressure vessel manufacturing
industry ......................................................................................................................................................... 77
Figure 5-4. Forecasted pressure vessel carbon fiber market values by region .................................................... 79
Figure 5-5. Forecasted pressure vessel carbon fiber reinforced polymer market values by region .................... 80
Figure 5-6. 24K tow landed costs ......................................................................................................................... 84
Figure 5-7. Distribution of 24K tow landed costs for scenario UU ....................................................................... 85
Figure 5-8. Pressure vessel landed costs .............................................................................................................. 86
Figure 5-9, Distribution of pressure vessel landed costs for scenario UU ............................................................ 87
Figure 5-10. Pressure vessel landed costs with materials excluded ..................................................................... 88
Figure 6-1. Industry involvement of North American respondents to the “Carbon Fiber Composites Supply
Industry and Markets in the U.S.” Survey ..................................................................................................... 90
xiv
List of Tables Table 1-1. Modulus Classifications of Carbon Fiber ............................................................................................... 1
Table 1-2. Annual Forecasted Carbon Fiber Demand (tonnes) .............................................................................. 5
Table 1-3. Forecasted Carbon Fiber Demand Disaggregated by Major Applications ............................................. 8
Table 1-4. 2012 Forecasted Regional Carbon Fiber Demand and Regional Manufacturing Capacity .................. 11
Table 1-5. 2020 Forecasted Regional Carbon Fiber Demand and Regional Manufacturing Capacity .................. 13
Table 1-6. Precursor and Carbon Fiber Manufacturing Locations ........................................................................ 14
Table 1-7. Level of Supply Chain Integration in Major Carbon Fiber Manufacturers ........................................... 15
Table 2-1. Estimates of Current and Future Carbon Fiber Demand from Wind Energy Sector ............................ 21
Table 2-2. Major Supply Chain Nodes for Wind Energy Industry Carbon Fiber Reinforced Polymers ................. 26
Table 3-1. Forecasted 2012 and 2018 CF Demand by the Aerospace Industry .................................................... 31
Table 3-2. Comparison of Market Value and Price Information for Two Market Reports ................................... 36
Table 3-3. Summary of Capacity and Locations of the Top Six Small-Tow Carbon Fiber Producers .................... 38
Table 4-1. Annual Forecasted Carbon Fiber Demand by the Automotive Industry (tonnes) ............................... 48
Table 4-2. 2020 Forecasted Regional Carbon Fiber Demand by the Automotive Industry and Regional Large-
Tow Manufacturing Capacity ........................................................................................................................ 51
Table 4-3. Automotive Carbon Fiber Market Value Estimates ............................................................................. 51
Table 4-4. Automotive carbon fiber reinforced polymer market value estimates ............................................... 53
Table 4-5. Major Supply Chain Nodes for Automotive Carbon Fiber Reinforced Polymer .................................. 58
Table 4-6. Automotive OEM and CF/CFRP Supplier Partnerships ........................................................................ 58
Table 4-7. Regional Competitiveness Scenarios for CFRP Automotive Applications ............................................ 62
Table 4-8. Sensitivity Analysis of 50K Tow CF Landed Costs for Scenario UUU .................................................... 64
Table 4-9. Sensitivity Analysis of Bidirectional Fabric Landed Costs for Scenario UUU ....................................... 66
Table 4-10. Sensitivity Analysis of Upper Dash Panel Landed Costs for Scenario UUU ........................................ 69
Table 5-1. Pressure Vessel Types .......................................................................................................................... 71
Table 5-2. Annual Forecasted Carbon Fiber Demand by the Pressure Vessel Industry (tonnes) ......................... 73
Table 5-3. Top Ten Countries in Terms of NGV Population .................................................................................. 75
Table 5-4. 2012 NGV Regional Population Distribution ....................................................................................... 75
Table 5-5. 2020 Forecasted Regional Carbon Fiber Demand by the Pressure Vessel Industry and Regional Small-
Tow Manufacturing Capacity ........................................................................................................................ 78
Table 5-6. Pressure Vessel Carbon Fiber Market Value Estimates ....................................................................... 79
Table 5-7. Major Manufacturers of Type III and Type IV Pressure Vessels .......................................................... 80
Table 5-8. Major Supply Chain Nodes for Type III and Type IV Pressure Vessels ................................................. 81
Table 5-9. Regional Competitiveness Scenarios ................................................................................................... 83
Table 5-10. Sensitivity Analysis of 24K Tow Landed Costs for Scenario UU ......................................................... 85

xv
Table 5-11. Sensitivity Analysis of Pressure Vessel Landed Costs for Scenario UU .............................................. 88
Table 6-1. Materials, Production and Policy Issues that Affect Growth and Competitiveness of the U.S. Carbon
Fiber Composites Industry............................................................................................................................. 91
Table 6-2. Anticipated Growth in Automotive and Aircraft Demand for Carbon Fiber Composites .................... 95
Table 7-1. Summary of CF Demand by CF Tow and Geographic Region .............................................................. 96
1
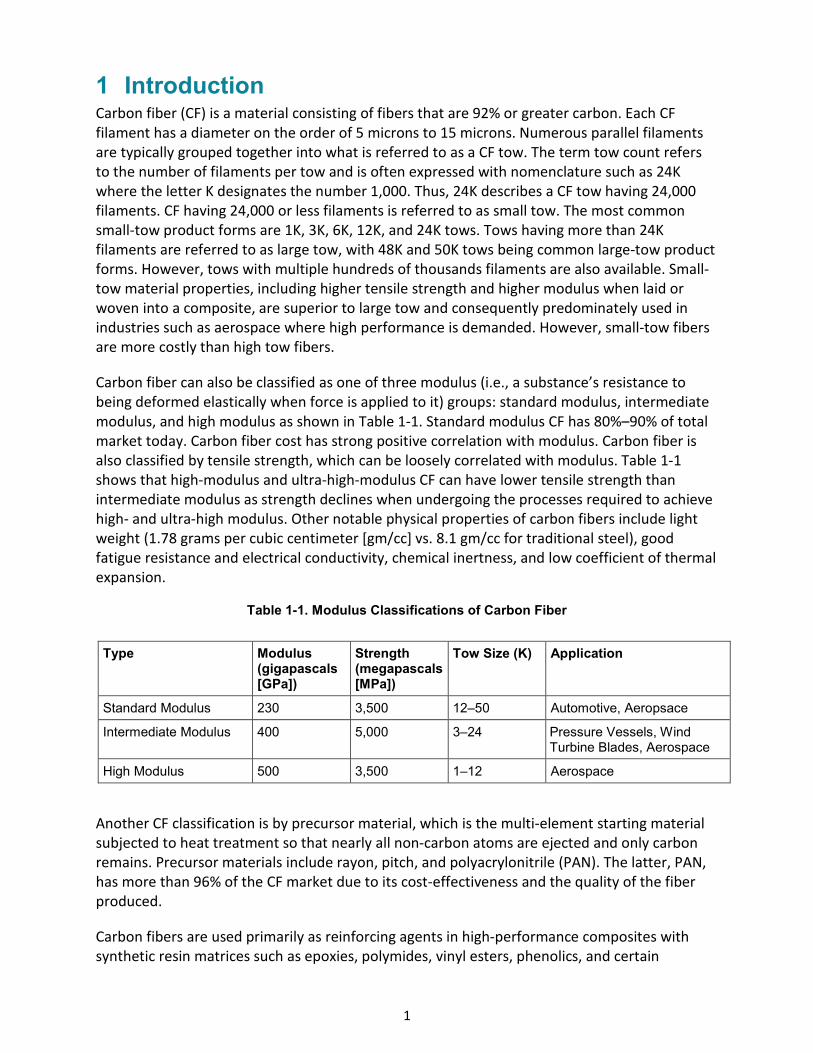
1 Introduction Carbon fiber (CF) is a material consisting of fibers that are 92% or greater carbon. Each CF filament has a diameter on the order of 5 microns to 15 microns. Numerous parallel filaments are typically grouped together into what is referred to as a CF tow. The term tow count refers to the number of filaments per tow and is often expressed with nomenclature such as 24K where the letter K designates the number 1,000. Thus, 24K describes a CF tow having 24,000 filaments. CF having 24,000 or less filaments is referred to as small tow. The most common small-tow product forms are 1K, 3K, 6K, 12K, and 24K tows. Tows having more than 24K filaments are referred to as large tow, with 48K and 50K tows being common large-tow product forms. However, tows with multiple hundreds of thousands filaments are also available. Small-tow material properties, including higher tensile strength and higher modulus when laid or woven into a composite, are superior to large tow and consequently predominately used in industries such as aerospace where high performance is demanded. However, small-tow fibers are more costly than high tow fibers.
Carbon fiber can also be classified as one of three modulus (i.e., a substance’s resistance to being deformed elastically when force is applied to it) groups: standard modulus, intermediate modulus, and high modulus as shown in Table 1-1. Standard modulus CF has 80%–90% of total market today. Carbon fiber cost has strong positive correlation with modulus. Carbon fiber is also classified by tensile strength, which can be loosely correlated with modulus. Table 1-1 shows that high-modulus and ultra-high-modulus CF can have lower tensile strength than intermediate modulus as strength declines when undergoing the processes required to achieve high- and ultra-high modulus. Other notable physical properties of carbon fibers include light weight (1.78 grams per cubic centimeter [gm/cc] vs. 8.1 gm/cc for traditional steel), good fatigue resistance and electrical conductivity, chemical inertness, and low coefficient of thermal expansion.
Table 1-1. Modulus Classifications of Carbon Fiber
Another CF classification is by precursor material, which is the multi-element starting material subjected to heat treatment so that nearly all non-carbon atoms are ejected and only carbon remains. Precursor materials include rayon, pitch, and polyacrylonitrile (PAN). The latter, PAN, has more than 96% of the CF market due to its cost-effectiveness and the quality of the fiber produced.
Carbon fibers are used primarily as reinforcing agents in high-performance composites with synthetic resin matrices such as epoxies, polymides, vinyl esters, phenolics, and certain
Type Modulus (gigapascals [GPa])
Strength (megapascals [MPa])
Tow Size (K) Application
Standard Modulus 230 3,500 12–50 Automotive, Aeropsace
Intermediate Modulus 400 5,000 3–24 Pressure Vessels, Wind Turbine Blades, Aerospace
High Modulus 500 3,500 1–12 Aerospace
2
thermoplastics. The CF provides the strength and stiffness to the composite, while the matrix material maintains fiber alignment and transfers structural load among the fibers. Structural members made from these composites can be designed to have twice the strength and more than twice the fatigue resistance of steel; also, they can be twice as stiff as aluminum at half the weight. Lower weight equals improved performance in multiple applications among diverse markets. Carbon fibers compete in high-performance polymeric composites mainly with glass and aramid, and, to a lesser extent, boron fibers. Because they cost more than glass fibers, carbon fibers are used mainly in applications requiring high stiffness properties exceeding the tensile modulus of glass or aramid fibers.
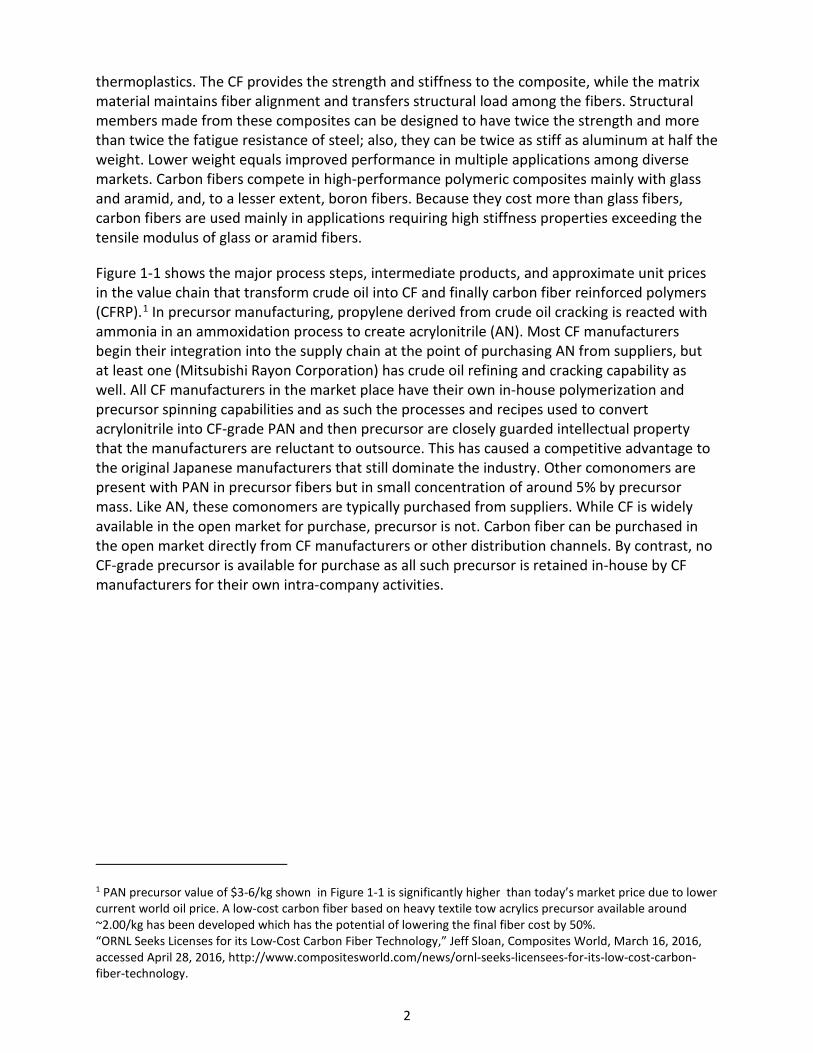
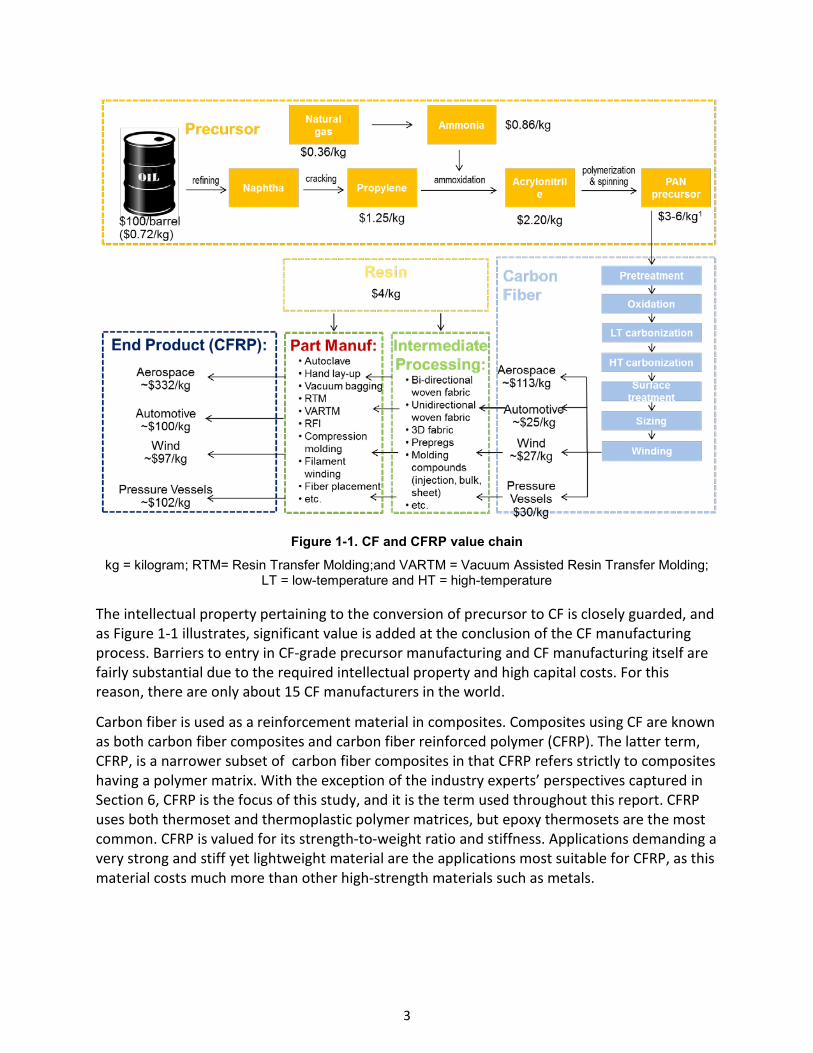
Figure 1-1 shows the major process steps, intermediate products, and approximate unit prices in the value chain that transform crude oil into CF and finally carbon fiber reinforced polymers (CFRP).1 In precursor manufacturing, propylene derived from crude oil cracking is reacted with ammonia in an ammoxidation process to create acrylonitrile (AN). Most CF manufacturers begin their integration into the supply chain at the point of purchasing AN from suppliers, but at least one (Mitsubishi Rayon Corporation) has crude oil refining and cracking capability as well. All CF manufacturers in the market place have their own in-house polymerization and precursor spinning capabilities and as such the processes and recipes used to convert acrylonitrile into CF-grade PAN and then precursor are closely guarded intellectual property that the manufacturers are reluctant to outsource. This has caused a competitive advantage to the original Japanese manufacturers that still dominate the industry. Other comonomers are present with PAN in precursor fibers but in small concentration of around 5% by precursor mass. Like AN, these comonomers are typically purchased from suppliers. While CF is widely available in the open market for purchase, precursor is not. Carbon fiber can be purchased in the open market directly from CF manufacturers or other distribution channels. By contrast, no CF-grade precursor is available for purchase as all such precursor is retained in-house by CF manufacturers for their own intra-company activities.
1 PAN precursor value of $3-6/kg shown in Figure 1-1 is significantly higher than today’s market price due to lower current world oil price. A low-cost carbon fiber based on heavy textile tow acrylics precursor available around ~2.00/kg has been developed which has the potential of lowering the final fiber cost by 50%. “ORNL Seeks Licenses for its Low-Cost Carbon Fiber Technology,” Jeff Sloan, Composites World, March 16, 2016, accessed April 28, 2016, http://www.compositesworld.com/news/ornl-seeks-licensees-for-its-low-cost-carbon-fiber-technology.
3
Figure 1-1. CF and CFRP value chain
kg = kilogram; RTM= Resin Transfer Molding;and VARTM = Vacuum Assisted Resin Transfer Molding; LT = low-temperature and HT = high-temperature
The intellectual property pertaining to the conversion of precursor to CF is closely guarded, and as Figure 1-1 illustrates, significant value is added at the conclusion of the CF manufacturing process. Barriers to entry in CF-grade precursor manufacturing and CF manufacturing itself are fairly substantial due to the required intellectual property and high capital costs. For this reason, there are only about 15 CF manufacturers in the world.
Carbon fiber is used as a reinforcement material in composites. Composites using CF are known as both carbon fiber composites and carbon fiber reinforced polymer (CFRP). The latter term, CFRP, is a narrower subset of carbon fiber composites in that CFRP refers strictly to composites having a polymer matrix. With the exception of the industry experts’ perspectives captured in Section 6, CFRP is the focus of this study, and it is the term used throughout this report. CFRP uses both thermoset and thermoplastic polymer matrices, but epoxy thermosets are the most common. CFRP is valued for its strength-to-weight ratio and stiffness. Applications demanding a very strong and stiff yet lightweight material are the applications most suitable for CFRP, as this material costs much more than other high-strength materials such as metals.
4
Unlike CF manufacturers, CFRP manufacturers are numerous as barriers to entry can be quite low due to the wide availability of CF and intermediate products such as fabric and prepreg2 in the open market. Depending on the CFRP manufacturing process (e.g., hand layup and atmospheric curing), capital costs can also be much lower than they are for CF manufacturing. Figure 1-1 offers an overview of the inputs and processing steps from CF precursor to CF to CFRP processing and parts manufacture. The figure shows the significant value added at the CFRP step. The development of a fast-cure epoxy resin and the use of a faster manufacutring technology such as high pressure resin transfer molding technology has allowed BMW i3 CFRP part production to be more cost-effective.The carbon fiber precursor value chain shown in Figure 1-1’s yellow box has not been modeled in this analysis due to the proprietary technology used in precursor manufacture. Thus, this report focuses on CF manufacturing, intermediate processing, and part manufacturing.
1.1 Carbon Fiber Composite Applications Carbon fiber and carbon fiber reinforced polymers are recognized as clean energy technologies due to their positions as enabling materials for several initiatives of the U.S. Department of Energy (DOE) Office of Energy Efficiency and Renewable Energy (EERE). For instance, CFRP enables “lightweighting” in transportation applications such as automobiles and aerospace that leads to energy reductions through fuel savings. It is estimated that every 10% of vehicle mass savings results in a 6%–8% improvement in fuel economy. CFRP also enables blade length extension in wind turbines, leading to more wind energy captured per turbine as well as the development of mid- and lower-wind speed resources, which may be impractical with the limitations of conventional glass fiber reinforced polymer (GFRP) technology. CFRP-based pressure vessels have higher containment pressures, lighter weights, and longer lifespans than conventional metals-based pressure vessels. With these benefits, CFRP-based pressure vessels enable alternative fuel vehicles such as natural gas vehicles and fuel cell vehicles to increase fuel economy through lightweighting as well as achieve longer driving distances between refueling. Other potential CFRP applications not considered in our detailed analysis include the oil and gas industry and civil infrastructure. In the oil and gas industry, CFRP enables access to a greater range of resources such as deep water reserves where conventional technology is severely limited at depths greater than two and half miles. In civil infrastructure, CFRP enables retrofitting and repair of aged or damaged structures such as bridges to extend their service lives. While the above-mentioned CF applications are clearly relevant to the mission of EERE in the domestic manufacturing competitiveness of clean energy technology supply chain, many other applications exist.
1.2 Carbon Fiber and Carbon Fiber Reinforced Polymer Demand The anticipated future demand of CF is presented in Table 1-2, which presents sets of CF estimates by Red and Zimm (2012), Industry Experts (2013), and Lucintel (2012). Table 1-2 shows, for example, annual total demand for CF was estimated in the range of 45,009 tonnes to 47,220 tonnes in 2012. The year 2018 represents the most distant forecast common data point among the three sources. Empty cells in the table indicate a year for which a forecast was not given by the respective source. The source having the shortest forecast period (Lucintel 2012) anticipates demand for CF to be 83,167 tonnes in 2018. The source having the longest forecast
2 Carbon fiber impregnated with the polymer resin matrix material of CFRP
5
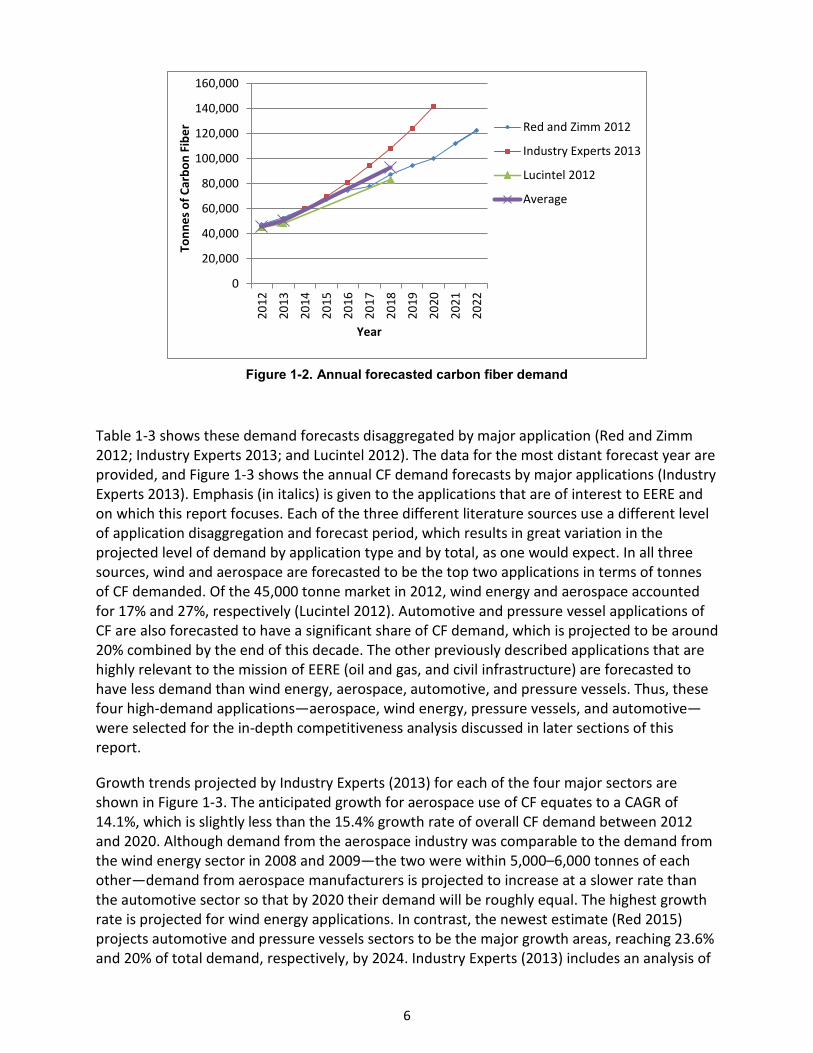
period (Red and Zimm 2012) anticipates CF demand to be nearly 123,000 tonnes in 2022. The source having the highest forecast demand (Industry Experts 2013) anticipates CF demand to be about 142,000 tonnes in 2020. Even the most conservative estimate—Lucintel (2012)—forecasts a double-digit compound annual growth for the 2012–2018 period. Average demand values are given in the last row of Table 1-2 for the three years (i.e., 2012, 2013, and 2018) for which all three forecasts have provided an estimate. The average forecasted demand for 2018 is 92,802 tonnes with an average compound annual growth rate (CAGR) of 12.5% from 2012 through 2018, compared to approximately 8% witnessed from 2005 through 2010 and due largely to growth in demand in the wind energy, aerospace, pressure vessel, and automotive industries. The data in Table 1-2 are plotted as a time series chart in Figure 1-2 showing a range of estimates toward the end of forecast period.
The most recent carbon fiber demand projection (Red 2015) is more optimistic than past estimates, including the previously most aggressive estimate by Industry Experts (2013). Total demand is estimated to reach 150,200 tonnes and 199,800 tonnes by 2020 and 2024, respectively (Red 2015). However, another recent estimate projects a less optimistic total worldwide carbon fiber demand of 116,000 tonnes by 2021 (Kraus and Kuhnel 2015).
Table 1-2. Annual Forecasted Carbon Fiber Demand (tonnes)
Source 2012 2013 2014 2015 2016 2017 2018 2019 2020 2021 2022 CAGR 2012–2018
Red and Zimm 2012 47,220 52,560 60,450 67,480 74,740 78,130 87,160 94,300 100,310 111,900 122,790 10.76%
Industry Experts 2013 45,010 51,670 59,810 69,660 81,160 94,190 108,080 123,860 141,720 15.72%
Lucintel 2012 45,009 48,094 83,167 10.78%
Average 45,746 50,775 92,802 12.51%
6
Figure 1-2. Annual forecasted carbon fiber demand
Table 1-3 shows these demand forecasts disaggregated by major application (Red and Zimm 2012; Industry Experts 2013; and Lucintel 2012). The data for the most distant forecast year are provided, and Figure 1-3 shows the annual CF demand forecasts by major applications (Industry Experts 2013). Emphasis (in italics) is given to the applications that are of interest to EERE and on which this report focuses. Each of the three different literature sources use a different level of application disaggregation and forecast period, which results in great variation in the projected level of demand by application type and by total, as one would expect. In all three sources, wind and aerospace are forecasted to be the top two applications in terms of tonnes of CF demanded. Of the 45,000 tonne market in 2012, wind energy and aerospace accounted for 17% and 27%, respectively (Lucintel 2012). Automotive and pressure vessel applications of CF are also forecasted to have a significant share of CF demand, which is projected to be around 20% combined by the end of this decade. The other previously described applications that are highly relevant to the mission of EERE (oil and gas, and civil infrastructure) are forecasted to have less demand than wind energy, aerospace, automotive, and pressure vessels. Thus, these four high-demand applications—aerospace, wind energy, pressure vessels, and automotive—were selected for the in-depth competitiveness analysis discussed in later sections of this report.
Growth trends projected by Industry Experts (2013) for each of the four major sectors are shown in Figure 1-3. The anticipated growth for aerospace use of CF equates to a CAGR of 14.1%, which is slightly less than the 15.4% growth rate of overall CF demand between 2012 and 2020. Although demand from the aerospace industry was comparable to the demand from the wind energy sector in 2008 and 2009—the two were within 5,000–6,000 tonnes of each other—demand from aerospace manufacturers is projected to increase at a slower rate than the automotive sector so that by 2020 their demand will be roughly equal. The highest growth rate is projected for wind energy applications. In contrast, the newest estimate (Red 2015) projects automotive and pressure vessels sectors to be the major growth areas, reaching 23.6% and 20% of total demand, respectively, by 2024. Industry Experts (2013) includes an analysis of
0
20,000
40,000
60,000
80,000
100,000
120,000
140,000
160,000
2012
2013
2014
2015
2016
2017
2018
2019
2020
2021
2022
Tonn
es o
f Car
bon
Fibe
r
Year
Red and Zimm 2012
Industry Experts 2013
Lucintel 2012
Average
7
the market for carbon fiber reinforced polymer (CFRP), which follows the same trends as the CF market but with larger demand volumes that reflect the additional mass of the composite matrix (Industry Experts 2013).
Figure 1-4 illustrates the size of the global CFRP market compared with the five major underlying markets that supply the CFRP market. For instance, at the bottom of the 2012 pyramid, it is shown that about $160 million worth of crude oil and natural gas were necessary to support the production of that year’s approximate 46,000 tonnes of CF (Table 1-3). From these crude oil and natural gas inputs are derived the necessary quantities of propylene and ammonia for the manufacture of acrylonitrile and comonomers, and then precursor. The estimated values of the precursor and upstream markets are based on a previously developed CF cost model by Oak Ridge National Laboratory (ORNL) (Das and Warren 2012). The value of the 2012 CF market was estimated to be in the range of about $1.7 billion (Lucintel 2012) to $2.0 billion (Industry Experts 2013). The 2012 CFRP market is much larger and is estimated to be in the range of about $10.3 billion (Industry Experts 2013) to $14.0 billion (Lucintel 2012). As can be seen in Figure 1-4, most of the value added in the CFRP value chain occurs at the CF and CFRP steps. These markets are estimated to experience compound annual growth rates of about 10%–12% over the 2012–2018 timeframe, with the differences in growth rates being largely a result of differential price increases among the various inputs. These upstream input growth rates are in line with the growth forecasts for CF itself in terms of tonnes demanded as illustrated in Table 1-2.
8
Table 1-3. Forecasted Carbon Fiber Demand Disaggregated by Major Applications
Source 2022 Demand (Red and Zimm 2012)
2020 Demand (Industry Experts 2013)
2018 Demand (Lucintel 2012)
Rank Application Tonnes % of Total Application Tonnes % of Total Application Tonnes % of Total
1 Wind 47,390 38.6% Wind 36,350 25.6% Aerospace 20,644 24.8%
2 Aerospace 21,370 17.4% Aerospace 23,170 16.3% Wind 14,837 17.8%
3 Pressure Vessels 11,200 9.1% Automotive 22,620 16.0% Automotive 12,613 15.2%
4 Sporting Goods 8,390 6.8% Other Industrial 17,730 12.5%
Molding Compounds 10,662 12.8%
5 Automotive 6,200 5.0% Sporting Goods 12,310 8.7% Sporting Goods 7,985 9.6%
6 Molding Compounds 5,280 4.3% Molding Compounds 9,350 6.6% Industrial Other 5,989 7.2%
7 Tooling 4,540 3.7% Pressure Vessels 9,340 6.6%
Pressure Vessels 5,808 7.0%
8 Civil 4,300 3.5% Civil 6,850 4.8% Civil 3,584 4.3%
9 Pultrusion Misc. 4,090 3.3% Oil and Gas 4,000 2.8% Marine 1,044 1.3%
10 Misc. Consumer 3,920 3.2%
11 Sailing/Yacht Building 2,320 1.9%
12 Misc. Energy 2,010 1.6%
13 Oil and Gas 920 0.7%
14 Medical/Prosthetics 460 0.4%
15 Industrial Rollers 390 0.3%
Total 122,780 100.0% 141,720 100.0% 83,167 100.0%
Applications in italics are of interest to EERE, and this report focuses on them.
9
Figure 1-3. CF demand projections by weight for the four major applications analyzed
Based on Industry Experts 2013
Figure 1-4. CFRP market value estimates
Source: Das and Warren 2012
North America, Europe, and Japan are where the CF industry began and remains concentrated in terms of both supply and demand to this day. The present distributions and a forecast for the future regional distribution of CF demand are given in Industry Experts (2013) and summarized in Figure 1-5. Europe was the leading region in terms of tonnes CF demanded in 2012, with an estimated demand of 16,650 tonnes or about 37% of the global total. Europe’s share of total demand is forecasted to rise to 43% in 2020. The second leading region in 2012 was Asia, followed by North America as the third leading region. However, by 2020 North America is forecasted to be nearly equal with Asia in terms of CF demand. In fact, both Asia and Japan are anticipated to decline in share of global CF demand over this period as Europe, North America, and the rest of the world gain in share. However, the latest forecast indicates that Asia and Europe will each have a higher share—35% and 32%, respectively—of total worldwide demand, compared to 27% in North America by 2024 (Red 2015).
0
10
20
30
40
2006 2008 2010 2012 2014 2016 2018 2020 2022
kTon
ne C
F De
man
d
Aerospace Pressure Vessels Wind Energy Automotive
10
Figure 1-5. Carbon fiber demand by region (tonnes)
Based on Industry Experts 2013
Figure 1-6. Carbon fiber reinforced polymer demand by region (tonnes)
Based on Industry Experts 2013
The present distribution and a forecast for the future regional distribution of CFRP demand are also given in Industry Experts (2013) and summarized in Figure 1-6. Regional CFRP demand follows a similar distribution as CF demand, with Europe being the leader and Asia and North America exchanging second place over the 2012 to 2020 timeframe. In a new significantly higher demand estimate with CFRP demand of 105,200 tonnes in 2014, North America and Europe’s shares have been estimated to be 40% and 36.8%, respectively (Kraus and Kuhnel 2015). As in the CF case, both Asia and Japan are forecasted to relinquish share of global CFRP demand while Europe, North America, and the rest of the world gain in share. Although not shown here, the regional market values for CF and CFRP follow similar distributions as the regional tonnage demands.
9,430
33,140
16,650
60,550
4,260
10,01013,730
33,320
9404,700
0
10,000
20,000
30,000
40,000
50,000
60,000
70,000
2012 2020
Tonn
esNorth America
Europe
Japan
Asia
ROW
15,690
54,470
22,830
83,050
6,27014,820
20,760
50,360
1,420
7,100
0
10,000
20,000
30,000
40,000
50,000
60,000
70,000
80,000
90,000
2012 2020
Tonn
es
North America
Europe
Japan
Asia
ROW
11
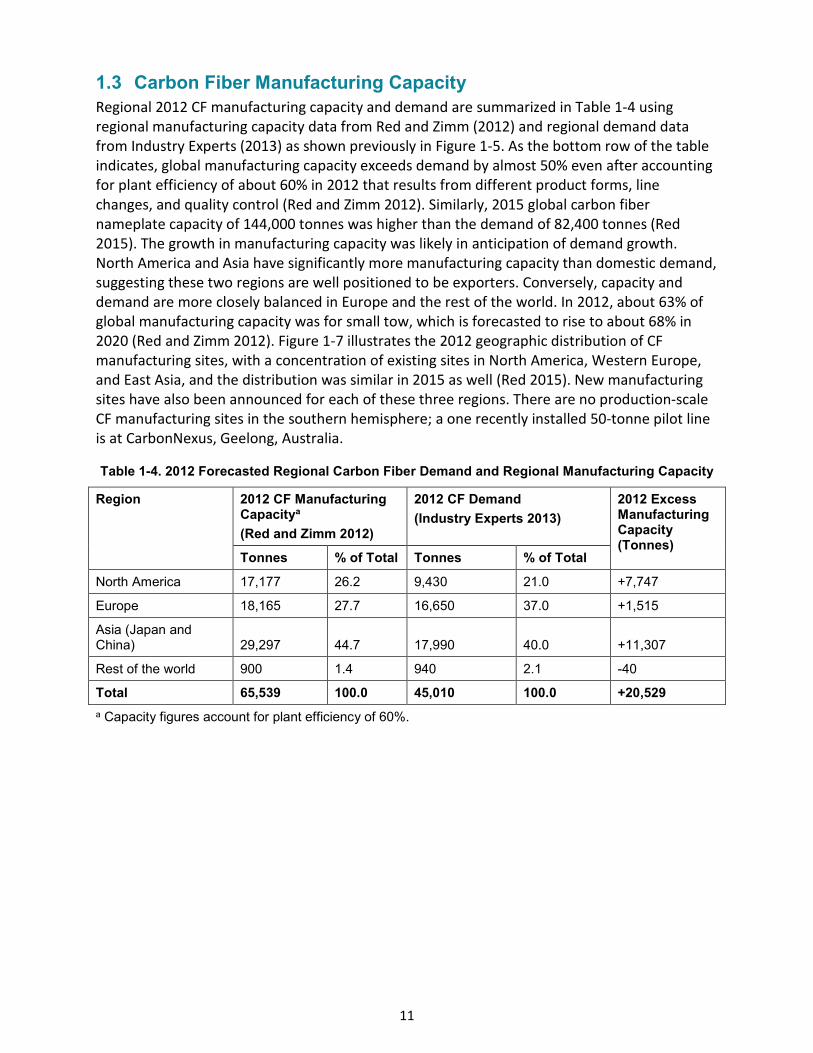
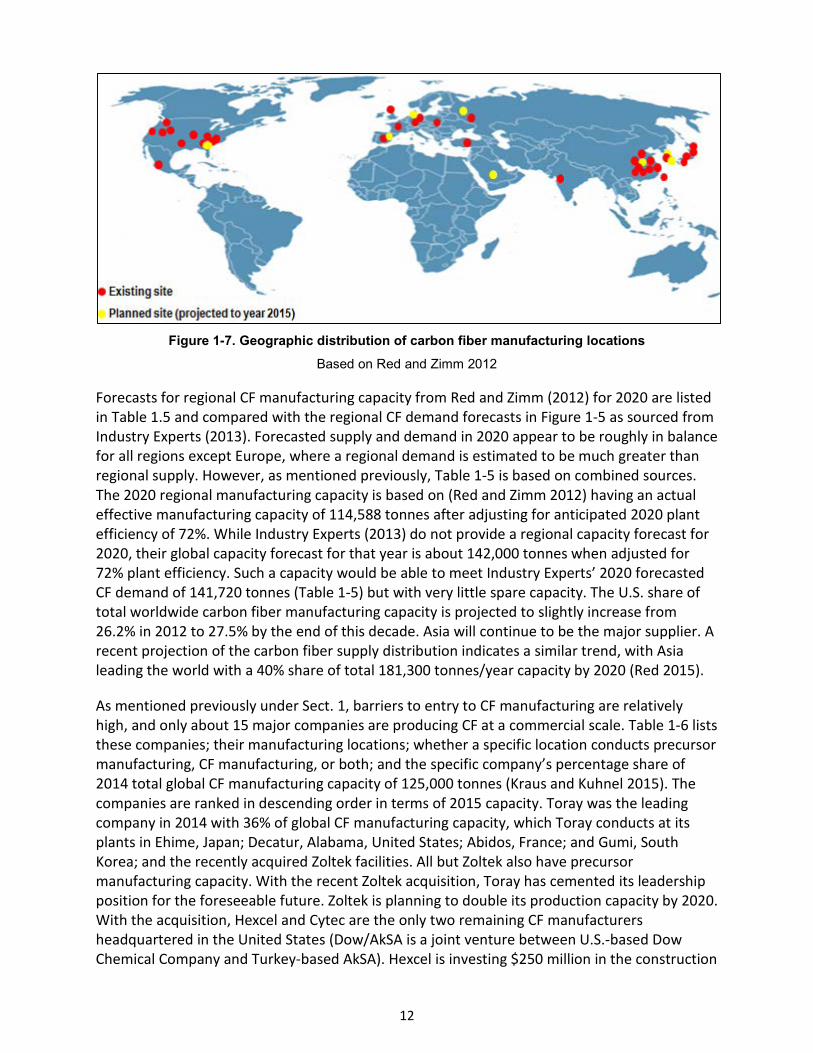
1.3 Carbon Fiber Manufacturing Capacity Regional 2012 CF manufacturing capacity and demand are summarized in Table 1-4 using regional manufacturing capacity data from Red and Zimm (2012) and regional demand data from Industry Experts (2013) as shown previously in Figure 1-5. As the bottom row of the table indicates, global manufacturing capacity exceeds demand by almost 50% even after accounting for plant efficiency of about 60% in 2012 that results from different product forms, line changes, and quality control (Red and Zimm 2012). Similarly, 2015 global carbon fiber nameplate capacity of 144,000 tonnes was higher than the demand of 82,400 tonnes (Red 2015). The growth in manufacturing capacity was likely in anticipation of demand growth. North America and Asia have significantly more manufacturing capacity than domestic demand, suggesting these two regions are well positioned to be exporters. Conversely, capacity and demand are more closely balanced in Europe and the rest of the world. In 2012, about 63% of global manufacturing capacity was for small tow, which is forecasted to rise to about 68% in 2020 (Red and Zimm 2012). Figure 1-7 illustrates the 2012 geographic distribution of CF manufacturing sites, with a concentration of existing sites in North America, Western Europe, and East Asia, and the distribution was similar in 2015 as well (Red 2015). New manufacturing sites have also been announced for each of these three regions. There are no production-scale CF manufacturing sites in the southern hemisphere; a one recently installed 50-tonne pilot line is at CarbonNexus, Geelong, Australia.
Table 1-4. 2012 Forecasted Regional Carbon Fiber Demand and Regional Manufacturing Capacity
Region 2012 CF Manufacturing Capacitya (Red and Zimm 2012)
2012 CF Demand (Industry Experts 2013)
2012 Excess Manufacturing Capacity (Tonnes)
Tonnes % of Total Tonnes % of Total North America 17,177 26.2 9,430 21.0 +7,747
Europe 18,165 27.7 16,650 37.0 +1,515
Asia (Japan and China) 29,297 44.7 17,990 40.0 +11,307
Rest of the world 900 1.4 940 2.1 -40
Total 65,539 100.0 45,010 100.0 +20,529 a Capacity figures account for plant efficiency of 60%.
12
Figure 1-7. Geographic distribution of carbon fiber manufacturing locations
Based on Red and Zimm 2012
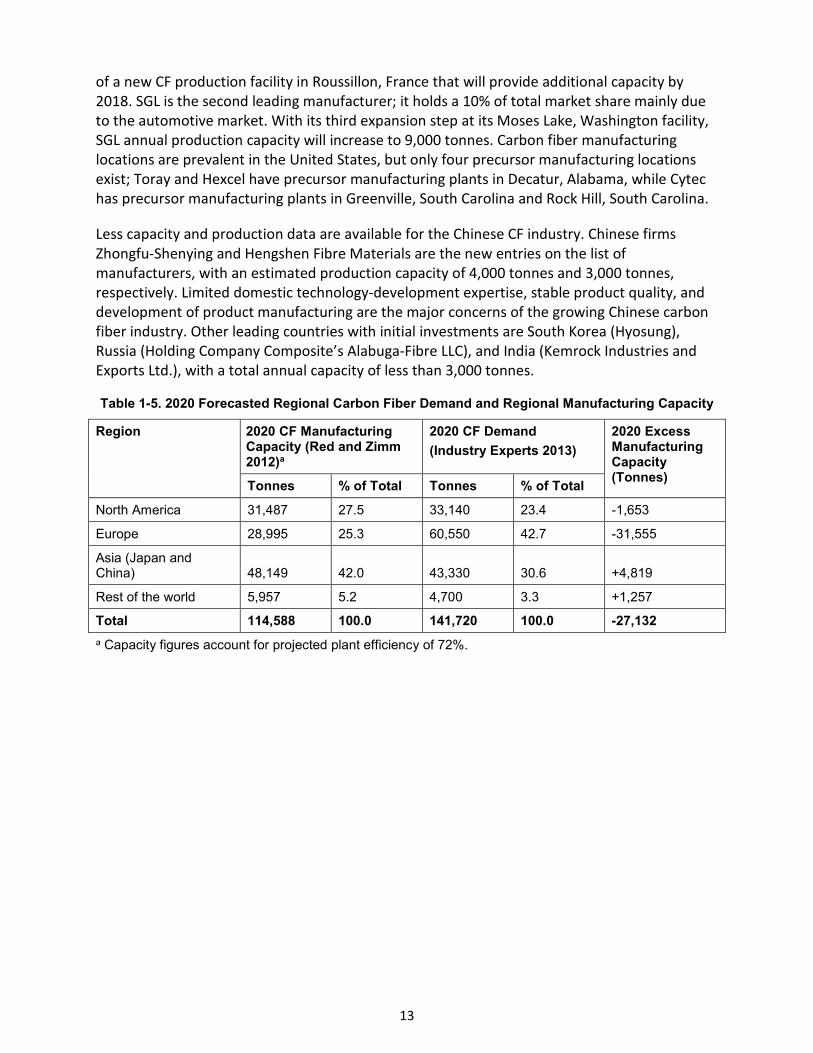
Forecasts for regional CF manufacturing capacity from Red and Zimm (2012) for 2020 are listed in Table 1.5 and compared with the regional CF demand forecasts in Figure 1-5 as sourced from Industry Experts (2013). Forecasted supply and demand in 2020 appear to be roughly in balance for all regions except Europe, where a regional demand is estimated to be much greater than regional supply. However, as mentioned previously, Table 1-5 is based on combined sources. The 2020 regional manufacturing capacity is based on (Red and Zimm 2012) having an actual effective manufacturing capacity of 114,588 tonnes after adjusting for anticipated 2020 plant efficiency of 72%. While Industry Experts (2013) do not provide a regional capacity forecast for 2020, their global capacity forecast for that year is about 142,000 tonnes when adjusted for 72% plant efficiency. Such a capacity would be able to meet Industry Experts’ 2020 forecasted CF demand of 141,720 tonnes (Table 1-5) but with very little spare capacity. The U.S. share of total worldwide carbon fiber manufacturing capacity is projected to slightly increase from 26.2% in 2012 to 27.5% by the end of this decade. Asia will continue to be the major supplier. A recent projection of the carbon fiber supply distribution indicates a similar trend, with Asia leading the world with a 40% share of total 181,300 tonnes/year capacity by 2020 (Red 2015).
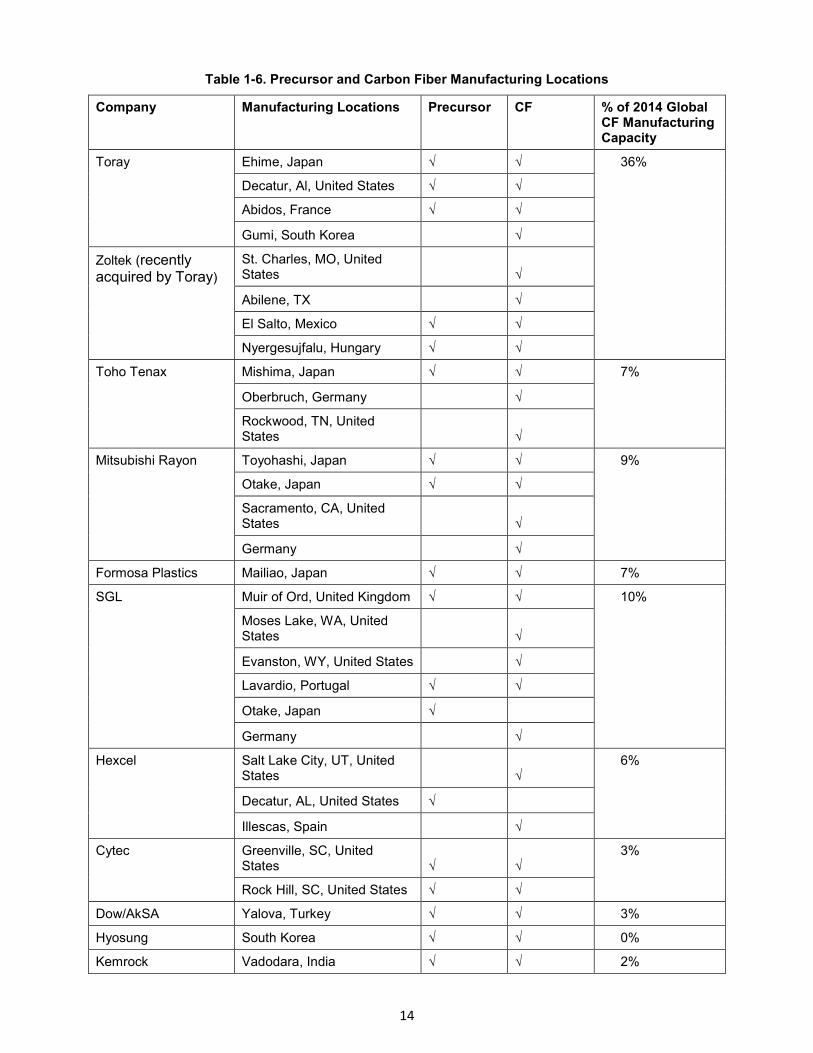
As mentioned previously under Sect. 1, barriers to entry to CF manufacturing are relatively high, and only about 15 major companies are producing CF at a commercial scale. Table 1-6 lists these companies; their manufacturing locations; whether a specific location conducts precursor manufacturing, CF manufacturing, or both; and the specific company’s percentage share of 2014 total global CF manufacturing capacity of 125,000 tonnes (Kraus and Kuhnel 2015). The companies are ranked in descending order in terms of 2015 capacity. Toray was the leading company in 2014 with 36% of global CF manufacturing capacity, which Toray conducts at its plants in Ehime, Japan; Decatur, Alabama, United States; Abidos, France; and Gumi, South Korea; and the recently acquired Zoltek facilities. All but Zoltek also have precursor manufacturing capacity. With the recent Zoltek acquisition, Toray has cemented its leadership position for the foreseeable future. Zoltek is planning to double its production capacity by 2020. With the acquisition, Hexcel and Cytec are the only two remaining CF manufacturers headquartered in the United States (Dow/AkSA is a joint venture between U.S.-based Dow Chemical Company and Turkey-based AkSA). Hexcel is investing $250 million in the construction
13
of a new CF production facility in Roussillon, France that will provide additional capacity by 2018. SGL is the second leading manufacturer; it holds a 10% of total market share mainly due to the automotive market. With its third expansion step at its Moses Lake, Washington facility, SGL annual production capacity will increase to 9,000 tonnes. Carbon fiber manufacturing locations are prevalent in the United States, but only four precursor manufacturing locations exist; Toray and Hexcel have precursor manufacturing plants in Decatur, Alabama, while Cytec has precursor manufacturing plants in Greenville, South Carolina and Rock Hill, South Carolina.
Less capacity and production data are available for the Chinese CF industry. Chinese firms Zhongfu-Shenying and Hengshen Fibre Materials are the new entries on the list of manufacturers, with an estimated production capacity of 4,000 tonnes and 3,000 tonnes, respectively. Limited domestic technology-development expertise, stable product quality, and development of product manufacturing are the major concerns of the growing Chinese carbon fiber industry. Other leading countries with initial investments are South Korea (Hyosung), Russia (Holding Company Composite’s Alabuga-Fibre LLC), and India (Kemrock Industries and Exports Ltd.), with a total annual capacity of less than 3,000 tonnes.
Table 1-5. 2020 Forecasted Regional Carbon Fiber Demand and Regional Manufacturing Capacity
Region 2020 CF Manufacturing Capacity (Red and Zimm 2012)a
2020 CF Demand (Industry Experts 2013)
2020 Excess Manufacturing Capacity (Tonnes) Tonnes % of Total Tonnes % of Total
North America 31,487 27.5 33,140 23.4 -1,653
Europe 28,995 25.3 60,550 42.7 -31,555
Asia (Japan and China) 48,149 42.0 43,330 30.6 +4,819
Rest of the world 5,957 5.2 4,700 3.3 +1,257
Total 114,588 100.0 141,720 100.0 -27,132 a Capacity figures account for projected plant efficiency of 72%.
14
Table 1-6. Precursor and Carbon Fiber Manufacturing Locations
Company Manufacturing Locations Precursor CF % of 2014 Global CF Manufacturing Capacity
Toray Ehime, Japan √ √ 36%
Decatur, Al, United States √ √ Abidos, France √ √
Gumi, South Korea √
Zoltek (recently acquired by Toray)
St. Charles, MO, United States √
Abilene, TX √ El Salto, Mexico √ √ Nyergesujfalu, Hungary √ √
Toho Tenax Mishima, Japan √ √ 7%
Oberbruch, Germany √ Rockwood, TN, United States √
Mitsubishi Rayon Toyohashi, Japan √ √ 9%
Otake, Japan √ √ Sacramento, CA, United States √
Germany √ Formosa Plastics Mailiao, Japan √ √ 7%
SGL Muir of Ord, United Kingdom √ √ 10%
Moses Lake, WA, United States √
Evanston, WY, United States √ Lavardio, Portugal √ √
Otake, Japan √
Germany √ Hexcel Salt Lake City, UT, United
States √ 6%
Decatur, AL, United States √
Illescas, Spain √ Cytec Greenville, SC, United
States √ √ 3%
Rock Hill, SC, United States √ √ Dow/AkSA Yalova, Turkey √ √ 3%
Hyosung South Korea √ √ 0%
Kemrock Vadodara, India √ √ 2%
15
Company Manufacturing Locations Precursor CF % of 2014 Global CF Manufacturing Capacity
Alabuga Fibre Ltd. Balakovo, Russia √ √ P.R. of China China √ √ Other √ √ 12%
Planned New Entrants
SABIC Saudi Arabia √ 0%
Spain √ √ Source: Kraus and Kuhnel (2015)
Table 1.7 shows the level of vertical integration among the nine major players in the carbon fiber industry. The level of supply-chain integration is quite high in most carbon fiber manufacturers. Three manufacturers (i.e., Mitsubishi Rayon Corporation, Toray, and Toho) are also involved in the final composite part manufacturing.
Table 1-7. Level of Supply Chain Integration in Major Carbon Fiber Manufacturers
MRC Toray Toho Cytec Hexcel FPC Zoltek SGC Aksa
acrylonitrile √ √
precursor √ √ √ √ √ √ √ √ √
carbon fiber √ √ √ √ √ √ √ √ √
prepeg √ √ √ √ √ √ √
composite √ √ √
Source: Okuno 2011
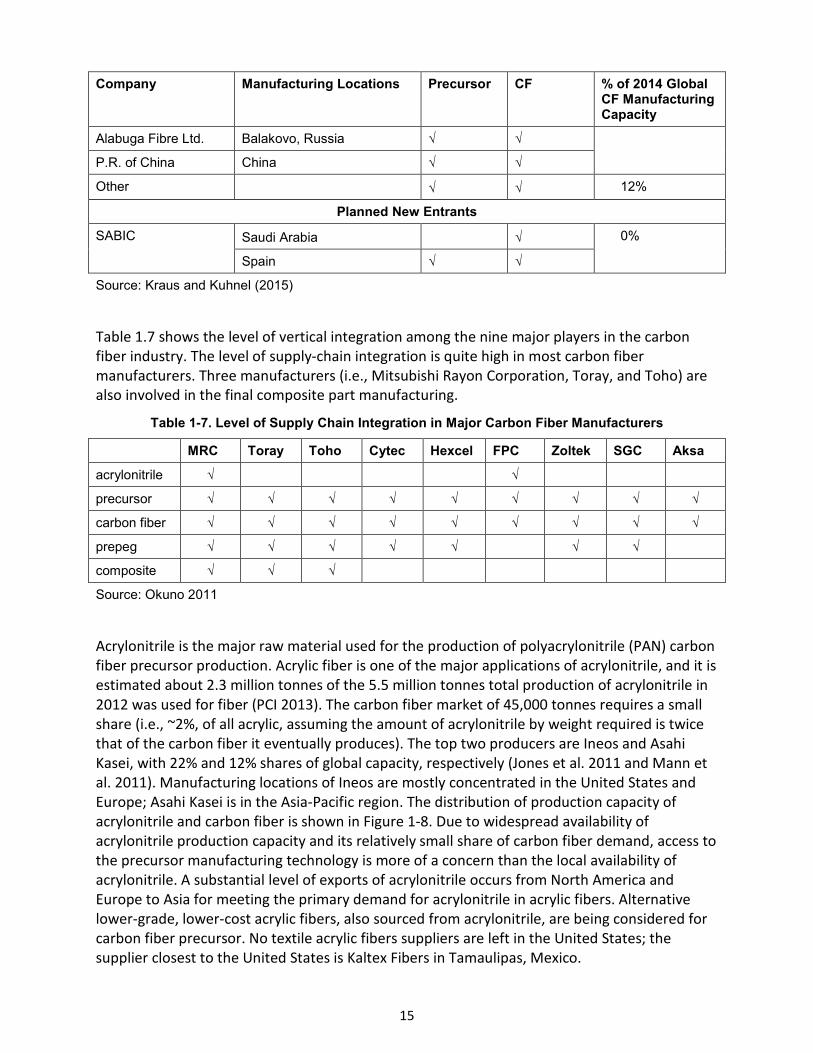
Acrylonitrile is the major raw material used for the production of polyacrylonitrile (PAN) carbon fiber precursor production. Acrylic fiber is one of the major applications of acrylonitrile, and it is estimated about 2.3 million tonnes of the 5.5 million tonnes total production of acrylonitrile in 2012 was used for fiber (PCI 2013). The carbon fiber market of 45,000 tonnes requires a small share (i.e., ~2%, of all acrylic, assuming the amount of acrylonitrile by weight required is twice that of the carbon fiber it eventually produces). The top two producers are Ineos and Asahi Kasei, with 22% and 12% shares of global capacity, respectively (Jones et al. 2011 and Mann et al. 2011). Manufacturing locations of Ineos are mostly concentrated in the United States and Europe; Asahi Kasei is in the Asia-Pacific region. The distribution of production capacity of acrylonitrile and carbon fiber is shown in Figure 1-8. Due to widespread availability of acrylonitrile production capacity and its relatively small share of carbon fiber demand, access to the precursor manufacturing technology is more of a concern than the local availability of acrylonitrile. A substantial level of exports of acrylonitrile occurs from North America and Europe to Asia for meeting the primary demand for acrylonitrile in acrylic fibers. Alternative lower-grade, lower-cost acrylic fibers, also sourced from acrylonitrile, are being considered for carbon fiber precursor. No textile acrylic fibers suppliers are left in the United States; the supplier closest to the United States is Kaltex Fibers in Tamaulipas, Mexico.
16
Figure 1-8. Geographic distribution of acrylonitrile and carbon fiber manufacturing in 2012
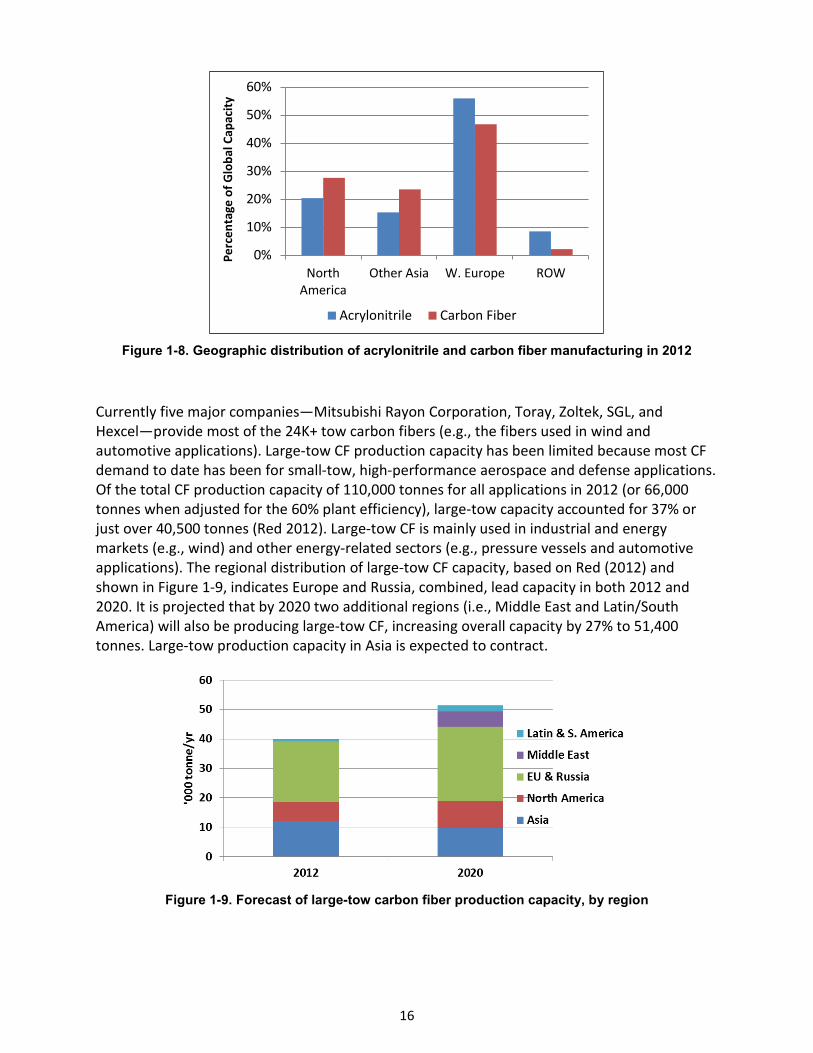
Currently five major companies—Mitsubishi Rayon Corporation, Toray, Zoltek, SGL, and Hexcel—provide most of the 24K+ tow carbon fibers (e.g., the fibers used in wind and automotive applications). Large-tow CF production capacity has been limited because most CF demand to date has been for small-tow, high-performance aerospace and defense applications. Of the total CF production capacity of 110,000 tonnes for all applications in 2012 (or 66,000 tonnes when adjusted for the 60% plant efficiency), large-tow capacity accounted for 37% or just over 40,500 tonnes (Red 2012). Large-tow CF is mainly used in industrial and energy markets (e.g., wind) and other energy-related sectors (e.g., pressure vessels and automotive applications). The regional distribution of large-tow CF capacity, based on Red (2012) and shown in Figure 1-9, indicates Europe and Russia, combined, lead capacity in both 2012 and 2020. It is projected that by 2020 two additional regions (i.e., Middle East and Latin/South America) will also be producing large-tow CF, increasing overall capacity by 27% to 51,400 tonnes. Large-tow production capacity in Asia is expected to contract.
Figure 1-9. Forecast of large-tow carbon fiber production capacity, by region
0%
10%
20%
30%
40%
50%
60%
NorthAmerica
Other Asia W. Europe ROW
Perc
enta
ge o
f Glo
bal C
apac
ity
Acrylonitrile Carbon Fiber
17
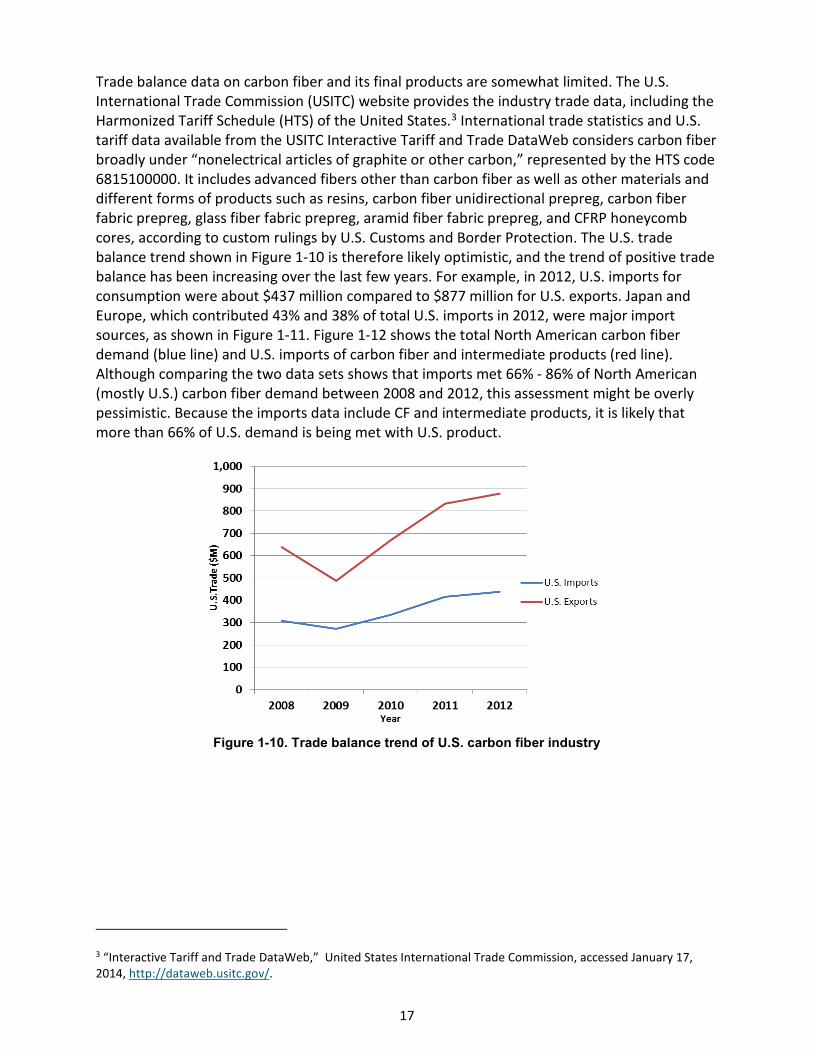
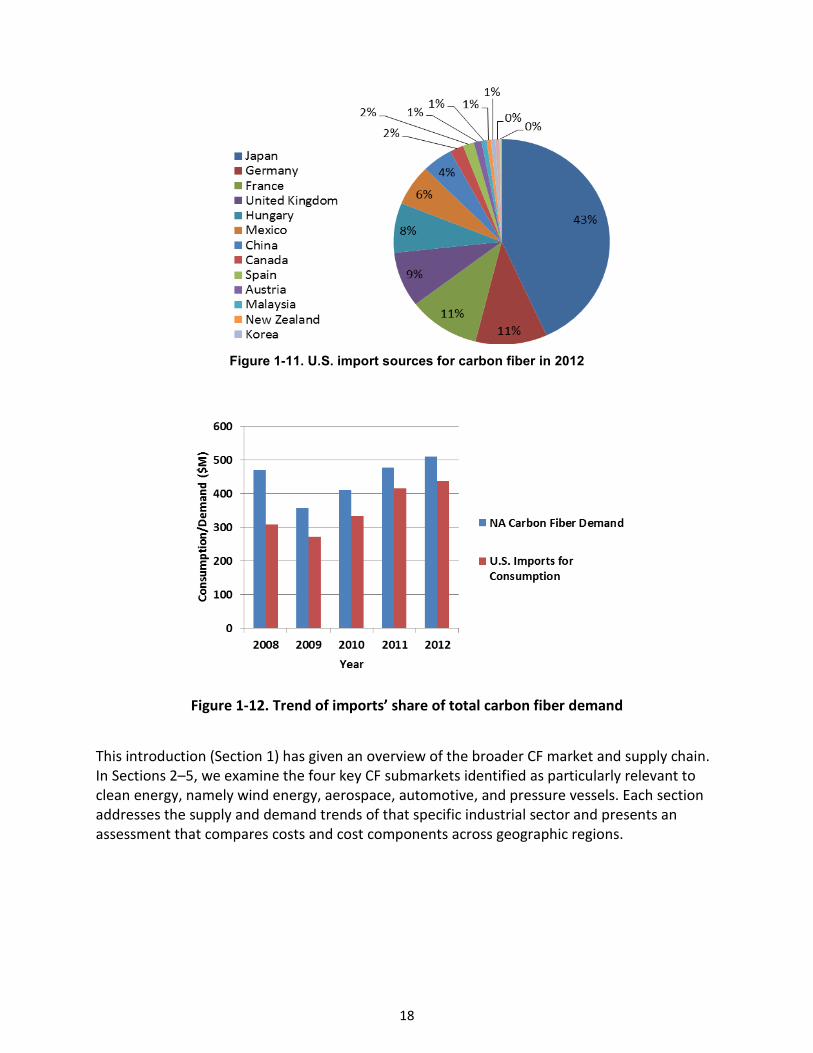
Trade balance data on carbon fiber and its final products are somewhat limited. The U.S. International Trade Commission (USITC) website provides the industry trade data, including the Harmonized Tariff Schedule (HTS) of the United States.3 International trade statistics and U.S. tariff data available from the USITC Interactive Tariff and Trade DataWeb considers carbon fiber broadly under “nonelectrical articles of graphite or other carbon,” represented by the HTS code 6815100000. It includes advanced fibers other than carbon fiber as well as other materials and different forms of products such as resins, carbon fiber unidirectional prepreg, carbon fiber fabric prepreg, glass fiber fabric prepreg, aramid fiber fabric prepreg, and CFRP honeycomb cores, according to custom rulings by U.S. Customs and Border Protection. The U.S. trade balance trend shown in Figure 1-10 is therefore likely optimistic, and the trend of positive trade balance has been increasing over the last few years. For example, in 2012, U.S. imports for consumption were about $437 million compared to $877 million for U.S. exports. Japan and Europe, which contributed 43% and 38% of total U.S. imports in 2012, were major import sources, as shown in Figure 1-11. Figure 1-12 shows the total North American carbon fiber demand (blue line) and U.S. imports of carbon fiber and intermediate products (red line). Although comparing the two data sets shows that imports met 66% - 86% of North American (mostly U.S.) carbon fiber demand between 2008 and 2012, this assessment might be overly pessimistic. Because the imports data include CF and intermediate products, it is likely that more than 66% of U.S. demand is being met with U.S. product.
Figure 1-10. Trade balance trend of U.S. carbon fiber industry
3 “Interactive Tariff and Trade DataWeb,” United States International Trade Commission, accessed January 17, 2014, http://dataweb.usitc.gov/.
18
Figure 1-11. U.S. import sources for carbon fiber in 2012
Figure 1-12. Trend of imports’ share of total carbon fiber demand
This introduction (Section 1) has given an overview of the broader CF market and supply chain. In Sections 2–5, we examine the four key CF submarkets identified as particularly relevant to clean energy, namely wind energy, aerospace, automotive, and pressure vessels. Each section addresses the supply and demand trends of that specific industrial sector and presents an assessment that compares costs and cost components across geographic regions.
19
2 Wind Energy There has been a recent surge of interest in using carbon fiber reinforced polymer (CFRP) composites in the blades of wind turbines. Carbon fiber provides higher specific modulus, strength, and fatigue resistance with lighter weight than glass fibers used today. Three factors are driving the interest: the increasing size of turbines that require longer blades, increased offshore wind development, and the desire to access sites with lower wind speeds. Longer blades are needed as turbine sizes and rotor diameters increase; they doubled from 50 m to 97 m between 1998 and 2013 and future increases to 160 m are expected (DOE 2015). Offshore wind generation is increasing, and these applications are generally larger and demand longer blades with the turbine size increasing from 3 MW to 5 MW and blade lengths increasing to greater than 45 m. And, longer blades could enable cost-effective use of sites with lower wind speeds. For mid- and lower-wind speed resources, the increased “swept area” of longer blades offers greater efficiency and capacity factor.
Because blade mass increases as the cube of the blade length and because gravity-induced bending stress increases with blade mass, blade mass is a critical issue. Reducing the considerable dynamic stresses on the blade can be accomplished with blade lightweighting. Weight savings of at least 20% can be achieved when moving from an all-glass blade to one with a carbon fiber-reinforced spar cap; for a 100-meter (m) blade the estimated mass savings from the switch to a carbon fiber spar cap is 35% at an 11% cost premium (Griffith and Johanns 2013).
Global wind power capacity has grown from 6 gigawatts (GW) in 1996 to 318 GW in 2013; it supplied about 3% of global electricity. In the same period in the United States, wind power capacity grew from 1.4 GW to 61 GW (DOE 2015). Wind power technology has been growing as a viable renewable energy option, and it accounted for 31% of all new generation capacity additions in the United States between 2008 and 2014 (Wiser and Bolinger 2015). This success has been enabled in part due to recent reductions in the cost of wind power as U.S. wind power prices have reached an all-time low. Power purchase agreements for wind have fallen from rates up to 7 cents per kilowatt-hour (kWh) in 2009 to an average of 2.4 cents per kWh in 2014. This low-cost wind power arises from projects installed in excellent resource locations in the central part of the country, and it is reflective in part of the federal production tax credit (PTC) (Wiser and Bolinger 2015). Sustained investment in improving wind technology, such as taller turbines and longer blades, has resulted in a significant cost reduction in wind power in recent years. A wind turbine installed today on average has 108% longer blades and is 48% taller than one installed in 1999 (Wiser and Bolinger 2015). Continued low natural gas prices, modest electricity demand growth, and limited near-term demand from state renewables portfolio standards in spite of the recent extension of the PTC through 2016 may dampen wind energy growth expectations (Wise and Bolinger 2015). Domestic manufacturing content is strong for some wind turbine components, but the U.S. wind industry remains reliant on imports for most components internal to the nacelle. A total of 18 offshore wind projects (15 GW) are in various stages of development in the continental United States; this compares to the estimated 2014 global offshore wind capacity of 7.7 GW (Wiser and Bolinger 2015). Offshore wind power development is ideal near primary port centers because it avoids the contentious issue of long transmission lines that are necessary for onshore supply. Northern Europe accounts for more than 90% of global offshore today.
20
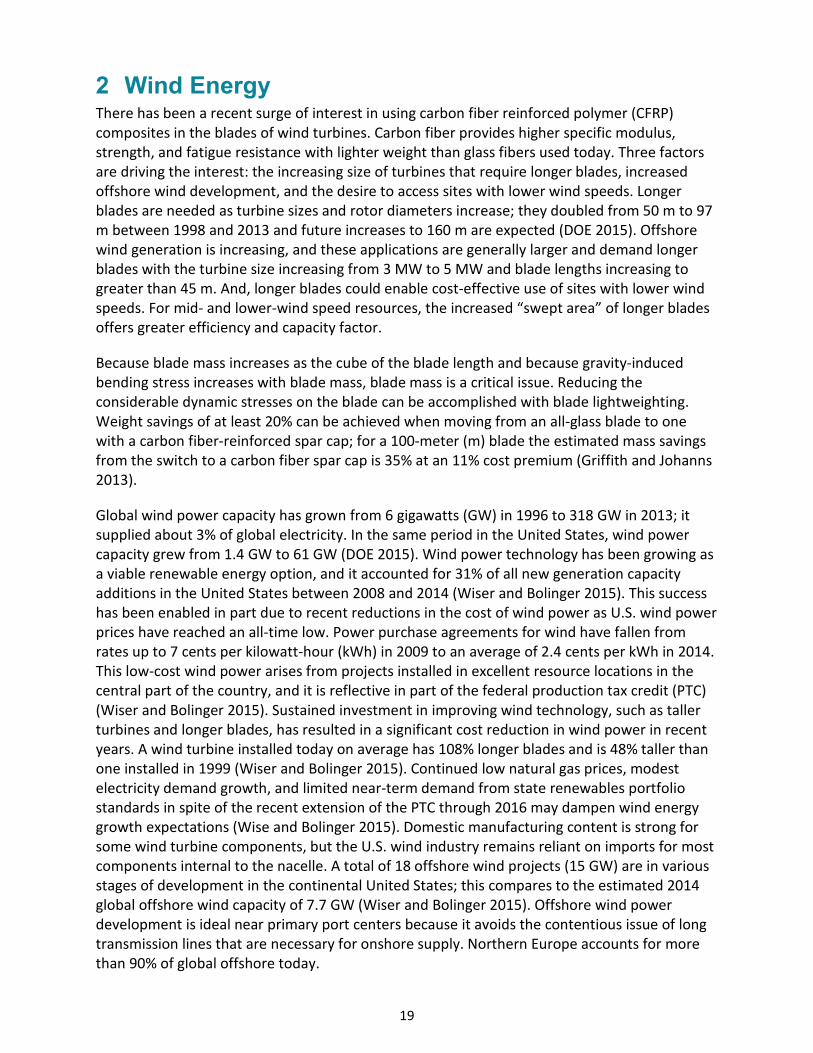
Most carbon fiber applications in wind energy have been in blade spar caps. Spar caps are the surfaces of the I-shaped or C-shaped cross-section inner beams, located on both front and rear sides of the blade, to which the outer shell portions are connected as shown in Figure 2-1. The spar caps may be shaped such that the contact area between the beam and the outer shell portions is maximized. To lower the blade cost of one of the longest blades (i.e., 57.6 m, 16.5 tonnes) ever made for a land-based wind turbine, Vestas Wind Systems (Vestas) used a combination of carbon-fiber and glass-fiber hybrid composites. MTorres uses carbon fiber in the shell and spar of its 5 MW blades, and Gamesa uses it in the center spar of its blades exceeding 40 m. For a 4-MW turbine, the total amount of carbon fiber required is estimated to be 3,856 kilograms (kg), assuming that carbon fiber polymer composites comprise 55% of total blade weight of 12,700 kg and that the composites are 18.3% by weight (wt%) carbon fiber (Lucintel 2012). Other potential carbon fiber applications in wind energy include blade shells and root sections, drive shafts, nacelles, and towers. Tower and foundation lightweighting are gaining momentum (Marsh 2014).
Figure 2-1. A schematic of carbon fiber spar cap application in wind blades
2.1 Demand and Supply High-strength, standard-tensile-modulus, large-tow carbon fiber in the range of 24K–50K is generally used for wind energy applications. These larger tow fibers can provide the material properties needed for blades without introducing the extra expense associated with small-tow high-modulus fibers commonly used in aerospace applications. Wind energy is the second largest demand sector for carbon fiber in terms of tonnage (Lucintel 2012), and significant growth is expected because of the fiber required by wind blades. Table 2-1 shows three estimates of current and future carbon fiber demand from wind energy (Industry Experts 2013, Lucintel 2012, and Red 2012). The share of wind energy demand to total carbon fiber demand is not anticipated to change drastically, with estimates ranging from 17%–32% in 2012 to 23%–32% in 2018. However, each forecast indicates a CAGR for wind energy than for overall. For example, Industry Experts (2013) projects a carbon fiber demand CAGR of 14.4% for the wind energy vs. 11.6% for the total. On the average, a 11.5% CAGR is projected for wind energy, reaching a demand of around 25,000 tonnes/year in 2018 from a demand of around 7,600
Uncored shell
Trailing edge reinforcement tapes
Upper shell fairing
Unidirectional spar cap
Box spar shear web
21
tonnes in 2012. Total average carbon fiber demand for the corresponding years has been estimated to be around 93,000 tonnes and 45,000 tonnes, respectively. The latest projected wind energy CF demand is consistent with earlier estimates: 30,000 tonnes or ~20% of the total projected CF demand of 150,000 tonnes in 2020, surprisingly less than the projected automotive CF demand (Red 2015).
Table 2-1. Estimates of Current and Future Carbon Fiber Demand from Wind Energy Sector
Source 2012 Tonnes of CF for Wind Energy/Total
2018 Tonne of CF for Wind Energy/Total
2012/2018 CAGR for Wind Energy/Total
Lucintel (2012) 7,770/45,000 19,190/83,180 12%/8.0%
Chris Red (2013) 15,070/47,220 28,280/87,160 8.2%/8.0%
Industry Experts (2013) 9,470/45,010 27,740/108,080 14.4%/11.6%
Average 10,770/45,743 25,070/92,807 11.5%/9.2%
A forecast for the present and future regional distribution of CF demand by the wind industry is given in Industry Experts (2013) and summarized in Figure 2-2. In this forecast, Europe has the largest share of total worldwide demand both today and in 2020 a result of European Union (EU) targets for 20% of energy to be provided by renewable sources. By 2020, Europe’s CF demand is projected to increase by 3.5 times and account for about 70% of total demand. The U.S. and Asian CF demand in 2020 will be similar with each contributing about 15% of total demand. The rest of the world (ROW) is expected to have negligible demand. Carbon Composites e.V (CCeV) similarly projects Europe to have the greatest annual growth rate (i.e., 17%), and worldwide wind energy carbon fiber demand is expected to reach 36,000 tonnes in 2020 (Holmes 2014). However, the regional distribution of CF demand from wind applications is projected to be significantly different than the regional distribution of total CF demand shown in Figure 1-5. The Global Wind Energy Council annual market forecasts indicate Asia, Europe, and North America are the leaders in this market and are anticipated to contribute 25.5 GW, 15 GW, and 13.5 GW, respectively, out of total 61 GW of global capacity additions in 2017.4 The difference between Asia’s projected growth in wind energy and demand for CF for wind energy applications suggests that Asia’s wind development will be applying CF at a lesser rate than, for example, Europe’s new development.
4 “Market Forecast,” Global Wind Energy Council, accessed March 11, 2014, http://www.gwec.net/global-figures/market-forecast-2012-2016/.
22
Figure 2-2. Forecast of carbon fiber demand for the wind energy industry, by region
Based on Industry Experts (2013)
Figure 2-3. Forecast of CFRP demand for the wind energy industry, by region
Based on Industry Experts (2013)
The forecast regional CFRP demand for wind applications shown in Figure 2-3 follows the same patterns of regional demand distribution observed for CF (Industry Experts 2013). Europe leads with 65% of total demand by 2020. The U.S. demand for CFRP is slightly higher than Asian demand. Total global CFRP demand for wind applications is estimated to be 13,520 tonnes in 2012 and 52,170 tonnes in 2020. For these years, the share of corresponding CF demand is about 70% of CFRP demand, a typical CF weight percentage used in CFRP.
1380
57807040
24850
30 1301010
5470
0
5000
10000
15000
20000
25000
30000
2012 2020
CF
DEM
AND
(TO
NN
ES)
North America
Europe
Japan
Asia
ROW
2,300
9,6309,650
34,080
40 1901,530
8,270
20 1800
5000
10000
15000
20000
25000
30000
35000
40000
2012 2020
CFRP
DEM
AND
(TO
NN
ES)
North America
Europe
Japan
Asia
ROW
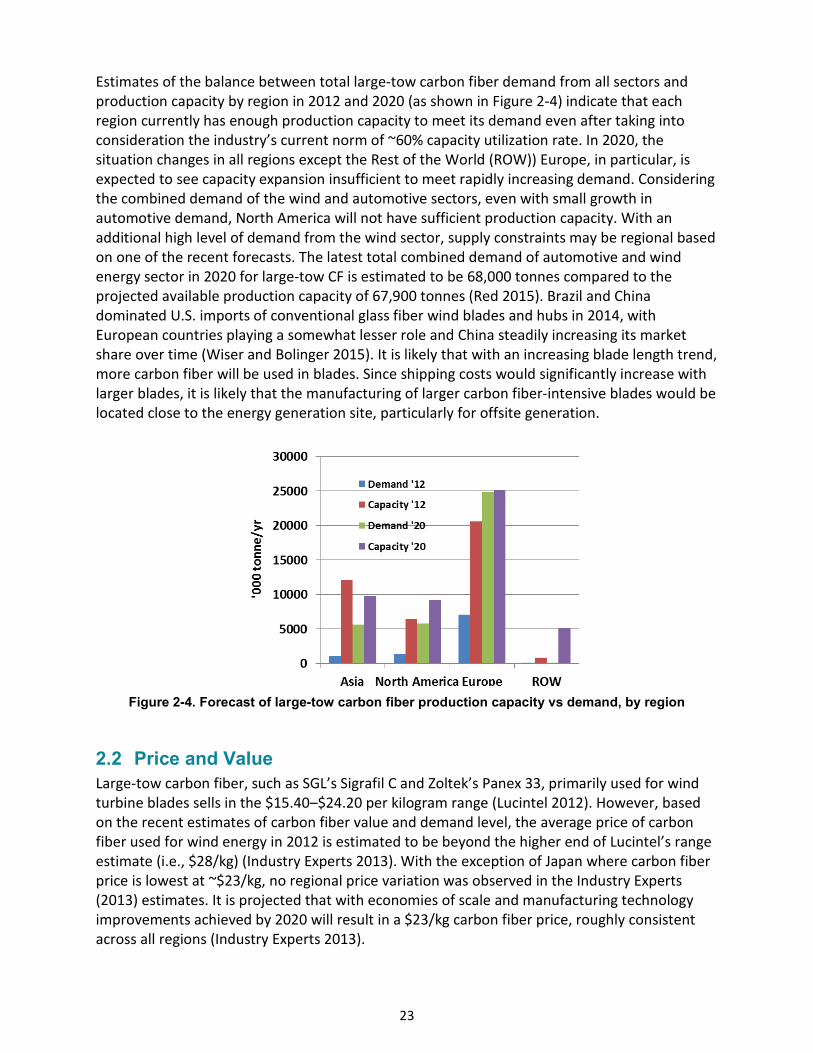
23
Estimates of the balance between total large-tow carbon fiber demand from all sectors and production capacity by region in 2012 and 2020 (as shown in Figure 2-4) indicate that each region currently has enough production capacity to meet its demand even after taking into consideration the industry’s current norm of ~60% capacity utilization rate. In 2020, the situation changes in all regions except the Rest of the World (ROW)) Europe, in particular, is expected to see capacity expansion insufficient to meet rapidly increasing demand. Considering the combined demand of the wind and automotive sectors, even with small growth in automotive demand, North America will not have sufficient production capacity. With an additional high level of demand from the wind sector, supply constraints may be regional based on one of the recent forecasts. The latest total combined demand of automotive and wind energy sector in 2020 for large-tow CF is estimated to be 68,000 tonnes compared to the projected available production capacity of 67,900 tonnes (Red 2015). Brazil and China dominated U.S. imports of conventional glass fiber wind blades and hubs in 2014, with European countries playing a somewhat lesser role and China steadily increasing its market share over time (Wiser and Bolinger 2015). It is likely that with an increasing blade length trend, more carbon fiber will be used in blades. Since shipping costs would significantly increase with larger blades, it is likely that the manufacturing of larger carbon fiber-intensive blades would be located close to the energy generation site, particularly for offsite generation.
Figure 2-4. Forecast of large-tow carbon fiber production capacity vs demand, by region
2.2 Price and Value Large-tow carbon fiber, such as SGL’s Sigrafil C and Zoltek’s Panex 33, primarily used for wind turbine blades sells in the $15.40–$24.20 per kilogram range (Lucintel 2012). However, based on the recent estimates of carbon fiber value and demand level, the average price of carbon fiber used for wind energy in 2012 is estimated to be beyond the higher end of Lucintel’s range estimate (i.e., $28/kg) (Industry Experts 2013). With the exception of Japan where carbon fiber price is lowest at ~$23/kg, no regional price variation was observed in the Industry Experts (2013) estimates. It is projected that with economies of scale and manufacturing technology improvements achieved by 2020 will result in a $23/kg carbon fiber price, roughly consistent across all regions (Industry Experts 2013).
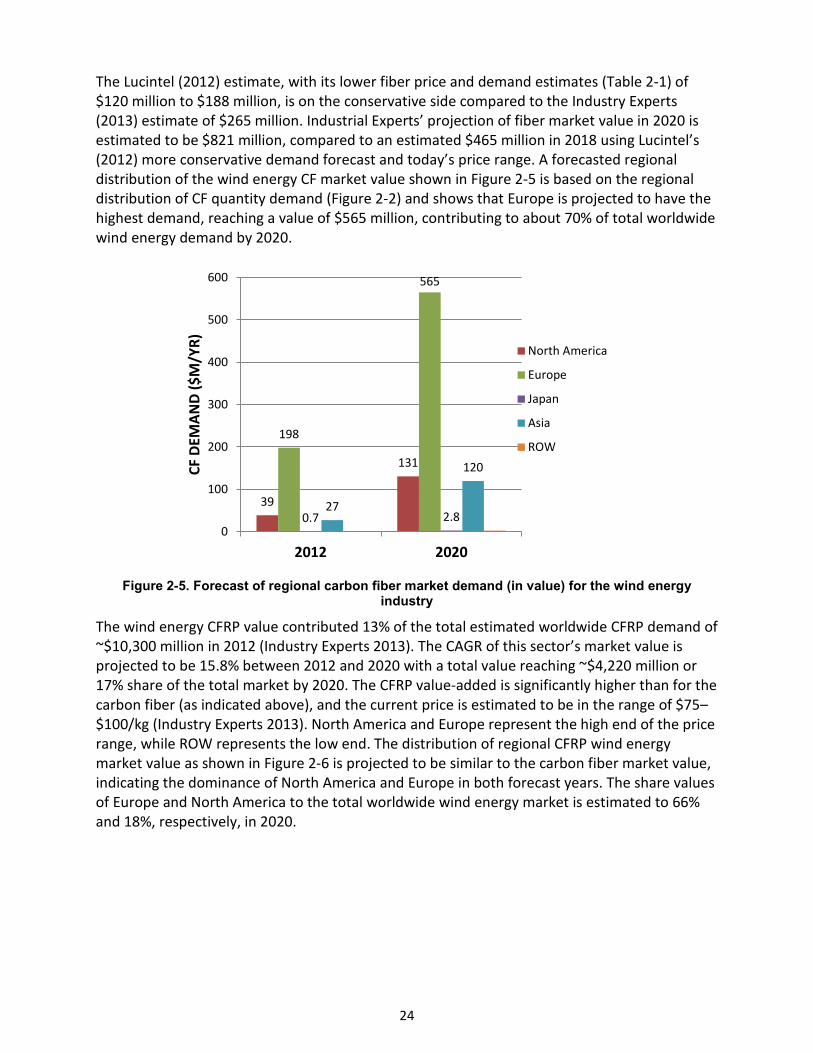
24
The Lucintel (2012) estimate, with its lower fiber price and demand estimates (Table 2-1) of $120 million to $188 million, is on the conservative side compared to the Industry Experts (2013) estimate of $265 million. Industrial Experts’ projection of fiber market value in 2020 is estimated to be $821 million, compared to an estimated $465 million in 2018 using Lucintel’s (2012) more conservative demand forecast and today’s price range. A forecasted regional distribution of the wind energy CF market value shown in Figure 2-5 is based on the regional distribution of CF quantity demand (Figure 2-2) and shows that Europe is projected to have the highest demand, reaching a value of $565 million, contributing to about 70% of total worldwide wind energy demand by 2020.
Figure 2-5. Forecast of regional carbon fiber market demand (in value) for the wind energy
industry
The wind energy CFRP value contributed 13% of the total estimated worldwide CFRP demand of ~$10,300 million in 2012 (Industry Experts 2013). The CAGR of this sector’s market value is projected to be 15.8% between 2012 and 2020 with a total value reaching ~$4,220 million or 17% share of the total market by 2020. The CFRP value-added is significantly higher than for the carbon fiber (as indicated above), and the current price is estimated to be in the range of $75–$100/kg (Industry Experts 2013). North America and Europe represent the high end of the price range, while ROW represents the low end. The distribution of regional CFRP wind energy market value as shown in Figure 2-6 is projected to be similar to the carbon fiber market value, indicating the dominance of North America and Europe in both forecast years. The share values of Europe and North America to the total worldwide wind energy market is estimated to 66% and 18%, respectively, in 2020.
39
131
198
565
0.7 2.827
120
0
100
200
300
400
500
600
2012 2020
CF D
EMAN
D ($
M/Y
R) North America
Europe
Japan
Asia
ROW
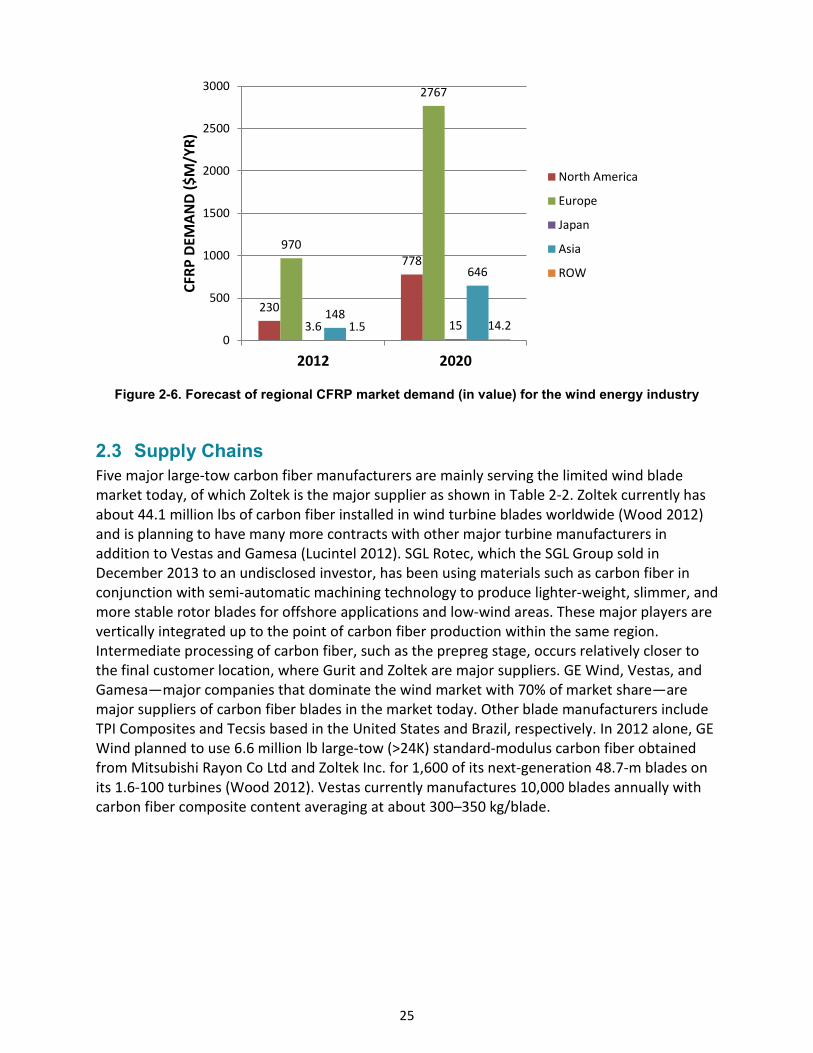
25
Figure 2-6. Forecast of regional CFRP market demand (in value) for the wind energy industry
2.3 Supply Chains Five major large-tow carbon fiber manufacturers are mainly serving the limited wind blade market today, of which Zoltek is the major supplier as shown in Table 2-2. Zoltek currently has about 44.1 million lbs of carbon fiber installed in wind turbine blades worldwide (Wood 2012) and is planning to have many more contracts with other major turbine manufacturers in addition to Vestas and Gamesa (Lucintel 2012). SGL Rotec, which the SGL Group sold in December 2013 to an undisclosed investor, has been using materials such as carbon fiber in conjunction with semi-automatic machining technology to produce lighter-weight, slimmer, and more stable rotor blades for offshore applications and low-wind areas. These major players are vertically integrated up to the point of carbon fiber production within the same region. Intermediate processing of carbon fiber, such as the prepreg stage, occurs relatively closer to the final customer location, where Gurit and Zoltek are major suppliers. GE Wind, Vestas, and Gamesa—major companies that dominate the wind market with 70% of market share—are major suppliers of carbon fiber blades in the market today. Other blade manufacturers include TPI Composites and Tecsis based in the United States and Brazil, respectively. In 2012 alone, GE Wind planned to use 6.6 million lb large-tow (>24K) standard-modulus carbon fiber obtained from Mitsubishi Rayon Co Ltd and Zoltek Inc. for 1,600 of its next-generation 48.7-m blades on its 1.6-100 turbines (Wood 2012). Vestas currently manufactures 10,000 blades annually with carbon fiber composite content averaging at about 300–350 kg/blade.
230
778970
2767
3.6 15148
646
1.5 14.20
500
1000
1500
2000
2500
3000
2012 2020
CFRP
DEM
AND
($M
/YR)
North America
Europe
Japan
Asia
ROW
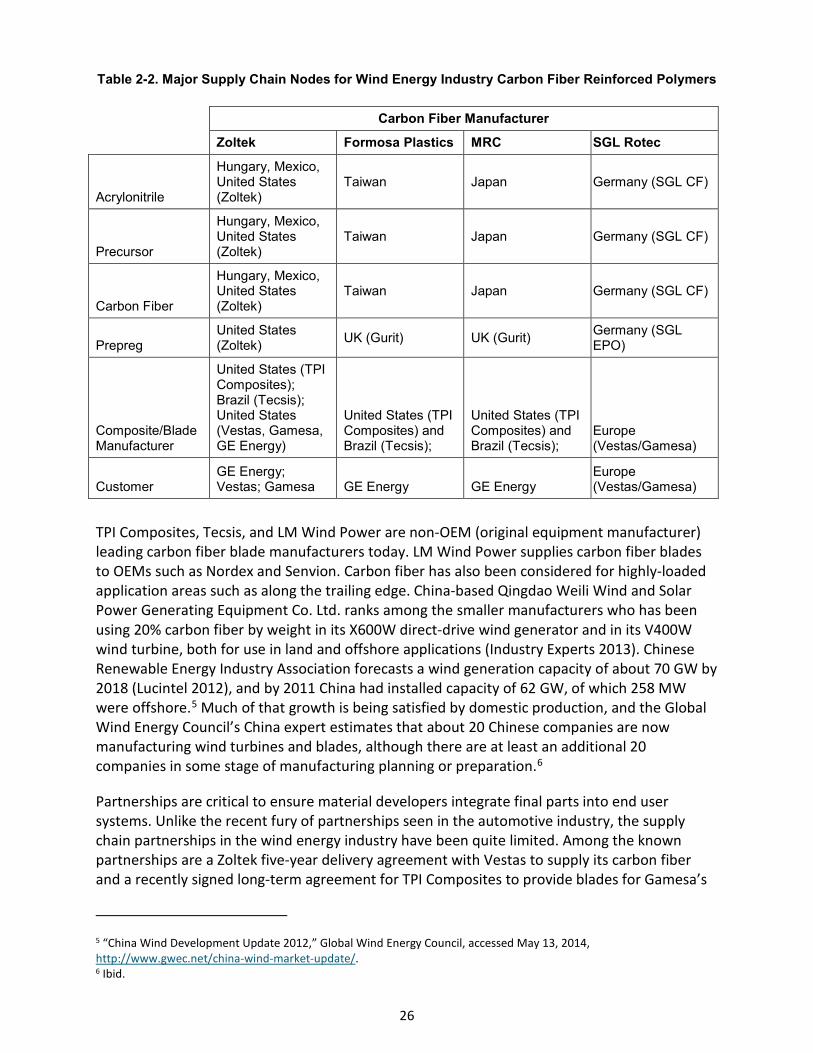
26
Table 2-2. Major Supply Chain Nodes for Wind Energy Industry Carbon Fiber Reinforced Polymers
TPI Composites, Tecsis, and LM Wind Power are non-OEM (original equipment manufacturer) leading carbon fiber blade manufacturers today. LM Wind Power supplies carbon fiber blades to OEMs such as Nordex and Senvion. Carbon fiber has also been considered for highly-loaded application areas such as along the trailing edge. China-based Qingdao Weili Wind and Solar Power Generating Equipment Co. Ltd. ranks among the smaller manufacturers who has been using 20% carbon fiber by weight in its X600W direct-drive wind generator and in its V400W wind turbine, both for use in land and offshore applications (Industry Experts 2013). Chinese Renewable Energy Industry Association forecasts a wind generation capacity of about 70 GW by 2018 (Lucintel 2012), and by 2011 China had installed capacity of 62 GW, of which 258 MW were offshore.5 Much of that growth is being satisfied by domestic production, and the Global Wind Energy Council’s China expert estimates that about 20 Chinese companies are now manufacturing wind turbines and blades, although there are at least an additional 20 companies in some stage of manufacturing planning or preparation.6
Partnerships are critical to ensure material developers integrate final parts into end user systems. Unlike the recent fury of partnerships seen in the automotive industry, the supply chain partnerships in the wind energy industry have been quite limited. Among the known partnerships are a Zoltek five-year delivery agreement with Vestas to supply its carbon fiber and a recently signed long-term agreement for TPI Composites to provide blades for Gamesa’s
5 “China Wind Development Update 2012,” Global Wind Energy Council, accessed May 13, 2014, http://www.gwec.net/china-wind-market-update/. 6 Ibid.
Carbon Fiber Manufacturer
Zoltek Formosa Plastics MRC SGL Rotec
Acrylonitrile
Hungary, Mexico, United States (Zoltek)
Taiwan Japan Germany (SGL CF)
Precursor
Hungary, Mexico, United States (Zoltek)
Taiwan Japan Germany (SGL CF)
Carbon Fiber
Hungary, Mexico, United States (Zoltek)
Taiwan Japan Germany (SGL CF)
Prepreg United States (Zoltek) UK (Gurit) UK (Gurit) Germany (SGL
EPO)
Composite/Blade Manufacturer
United States (TPI Composites); Brazil (Tecsis); United States (Vestas, Gamesa, GE Energy)
United States (TPI Composites) and Brazil (Tecsis);
United States (TPI Composites) and Brazil (Tecsis);
Europe (Vestas/Gamesa)
Customer GE Energy; Vestas; Gamesa GE Energy GE Energy
Europe (Vestas/Gamesa)
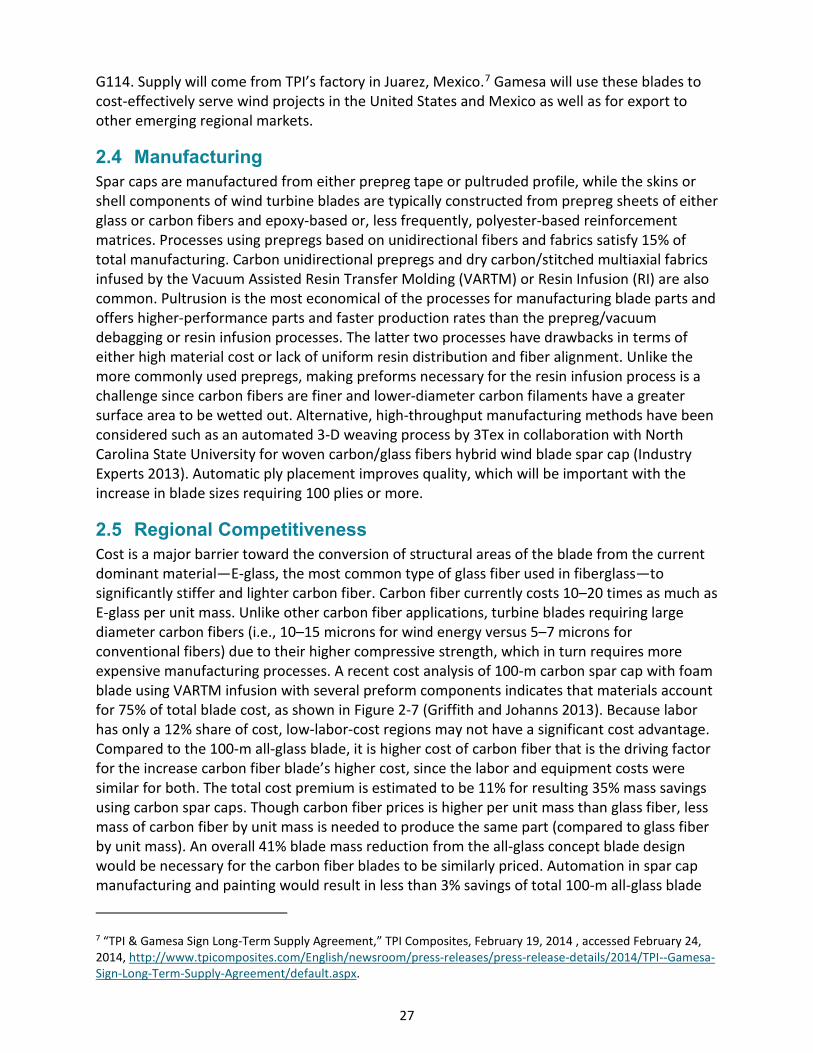
27
G114. Supply will come from TPI’s factory in Juarez, Mexico.7 Gamesa will use these blades to cost-effectively serve wind projects in the United States and Mexico as well as for export to other emerging regional markets.
2.4 Manufacturing Spar caps are manufactured from either prepreg tape or pultruded profile, while the skins or shell components of wind turbine blades are typically constructed from prepreg sheets of either glass or carbon fibers and epoxy-based or, less frequently, polyester-based reinforcement matrices. Processes using prepregs based on unidirectional fibers and fabrics satisfy 15% of total manufacturing. Carbon unidirectional prepregs and dry carbon/stitched multiaxial fabrics infused by the Vacuum Assisted Resin Transfer Molding (VARTM) or Resin Infusion (RI) are also common. Pultrusion is the most economical of the processes for manufacturing blade parts and offers higher-performance parts and faster production rates than the prepreg/vacuum debagging or resin infusion processes. The latter two processes have drawbacks in terms of either high material cost or lack of uniform resin distribution and fiber alignment. Unlike the more commonly used prepregs, making preforms necessary for the resin infusion process is a challenge since carbon fibers are finer and lower-diameter carbon filaments have a greater surface area to be wetted out. Alternative, high-throughput manufacturing methods have been considered such as an automated 3-D weaving process by 3Tex in collaboration with North Carolina State University for woven carbon/glass fibers hybrid wind blade spar cap (Industry Experts 2013). Automatic ply placement improves quality, which will be important with the increase in blade sizes requiring 100 plies or more.
2.5 Regional Competitiveness Cost is a major barrier toward the conversion of structural areas of the blade from the current dominant material—E-glass, the most common type of glass fiber used in fiberglass—to significantly stiffer and lighter carbon fiber. Carbon fiber currently costs 10–20 times as much as E-glass per unit mass. Unlike other carbon fiber applications, turbine blades requiring large diameter carbon fibers (i.e., 10–15 microns for wind energy versus 5–7 microns for conventional fibers) due to their higher compressive strength, which in turn requires more expensive manufacturing processes. A recent cost analysis of 100-m carbon spar cap with foam blade using VARTM infusion with several preform components indicates that materials account for 75% of total blade cost, as shown in Figure 2-7 (Griffith and Johanns 2013). Because labor has only a 12% share of cost, low-labor-cost regions may not have a significant cost advantage. Compared to the 100-m all-glass blade, it is higher cost of carbon fiber that is the driving factor for the increase carbon fiber blade’s higher cost, since the labor and equipment costs were similar for both. The total cost premium is estimated to be 11% for resulting 35% mass savings using carbon spar caps. Though carbon fiber prices is higher per unit mass than glass fiber, less mass of carbon fiber by unit mass is needed to produce the same part (compared to glass fiber by unit mass). An overall 41% blade mass reduction from the all-glass concept blade design would be necessary for the carbon fiber blades to be similarly priced. Automation in spar cap manufacturing and painting would result in less than 3% savings of total 100-m all-glass blade
7 “TPI & Gamesa Sign Long-Term Supply Agreement,” TPI Composites, February 19, 2014 , accessed February 24, 2014, http://www.tpicomposites.com/English/newsroom/press-releases/press-release-details/2014/TPI--Gamesa-Sign-Long-Term-Supply-Agreement/default.aspx.
28
cost (Griffith and Johanns 2013). However, it is likely that logistics concerns are likely to drive new investments in port-side blade facilities for offshore wind energy systems, as trucking cost at $35/mile is considerable more expensive than the $1.50–$4.00/nautical mile cost by ship or barge (Barr, A., MAKE Consulting, pers. comm. with Sujit Das, December 5, 2014). The levelized cost of energy is estimated to be significantly higher at about 21 cents/kWh using 100-m blades with carbon spar caps for 1.5-MW turbines based in an offshore, 250-MW wind farm (Griffith and Johanns 2013). With technology advancement, turbine scale-up, and efficiencies gained from larger volume manufacturing, domestic levelized cost of energy dropped more than 90%, from 50 cents/kWh in 1980 to 4.5 cents/kWh in 2013 (DOE 2015). Similarly, power purchase agreements for wind have fallen from rates up to 7 cents/kWh to an average of 2.4 cents/kWh in 2014 (Wiser and Bolinger 2015).
Figure 2-7. Cost breakdown of a 100-m carbon spar blade (SNK 100-01)
Source: Griffith and Johanns 2013
A recent life-cycle-based sustainability assessment of a 0.51m length conventional glass fiber reinforced composite horizontal-axis wind turbine blade has addressed environmental, economic, and social impacts with consideration of variations in the region of manufacturing of intermediate products (Owens et al. 2013). China, India, Europe, the western United States, and the eastern United States were the five regions considered for intermediate manufacturing; the five regions were selected based on local raw materials supply, with both blade manufacturing and final turbine locations occurring in the central United States. Owens et al. (2013) examined various impacts in terms of transportation cost, labor cost, working conditions, government regulations, and electricity in each of these regions. They found that from the cost perspective, China and India would be the most economical due to low labor costs, whereas the western United States rated most favorably from the combined economic and environmental perspective. This assessment of a glass fiber blade informs but is not comparable to an assessment of a large carbon fiber blade for three reasons. First, transportation costs for a 0.51-m blade would be far less than costs for very large blades. Second, labor costs are a larger share of total costs of GFRC than of CFRC, so the lower labor costs would have less effect on CFRC. Third, energy cost has a relatively smaller share of the overall cost of a glass fiber reinforced blade. Since the western United States was also the most favorable in terms of societal considerations based on labor wages and workplace fatality statistics, this intermediate manufacturing region would result in an overall more sustainable product.
29
2.6 Summary Carbon fiber use in blades for wind turbines accounts for the largest share by weight of total worldwide carbon fiber demand. Carbon fiber spar caps in blades are the major application However, other potential applications include blade shells and root sections, drive shafts, nacelles, and towers have also been demonstrated. Demand for large blades continues to grow, particularly to harness energy from mid- and low-wind areas and offshore. In these large blades (i.e., > 45 m long), weight savings of 20% can be achieved when moving from an all-glass conventional blade to one with a carbon fiber-reinforced spar cap.
With the projected substantial growth in worldwide wind energy, an average 11.5% CAGR in carbon fiber demand is anticipated through the remainder of this decade. Wind energy carbon fiber demand today accounts for about 17% of total demand, and it is projected to grow from about 7,600 tonnes/year today to 25,000 tonnes/year by 2018. Europe, which accounts for more than 90% of the global total of offshore wind, will continue to have the major share of total worldwide wind energy carbon fiber demand (i.e., about 65% in 2020) due to its renewable energy targets and strong use of offshore wind capacity. However, in terms of cumulative wind energy capacity, Asia will lead as it will have 209 GW of capacity by 2017 while Europe will have 173 GW. North America and Asia are projected to have similar levels of carbon fiber demand for the same period.
There are four major manufacturers of high-strength, standard-tensile-modulus, large-tow carbon fiber in the range of 24K–50K used for wind energy today. Zoltek (acquired by Toray) is the sole major supplier based in the United States; the remaining three are based in the Asia-Pacific and Europe. Two of these major manufacturers are vertically integrated up to the part manufacturing step. Four manufacturers hold most of the market for carbon-fiber-based part manufacturing, and Vestas and Gamesa are the leaders.
Large-tow carbon fiber capacity is 37% of total capacity worldwide. And, although large-tow CF capacity expansion is expected, Europe is projected to be unable to meet its demand. When expected demand for large-tow carbon fiber from the wind energy and automotive sectors are combined, the global demand total is projected to be 71,450 tonnes, while projected available production capacity is 51,400 tonnes. Meeting this demand will be a supply chain distributed worldwide. However, it is more likely that with the increase in blade size, logistical concerns are likely to drive new investments in portside facilities for offshore wind energy systems. The final part manufacturing base of large carbon fiber blades is thereby projected to be located close to the final consumer.
Along with technical challenges related to manufacturing comparatively larger-tow with larger filament diameter carbon fibers for better compressive strength, cost-effectiveness is a major barrier toward market growth in wind energy. With materials contributing about 75% of total part cost, alternative high-throughput materials processing methods will to some extent facilitate improvements in cost-effectiveness.
30
3 Aerospace Aerospace projects have been the primary drivers of the carbon fiber (CF) and carbon fiber reinforced plastics (CFRP) industry for most of their history. Although the aerospace sector now buys less CF by weight than the industrial sector—and this driven mostly by high demand for wind turbine blades—the high cost per weight of CFRP parts for aircraft and spacecraft means aerospace applications still constitute a large share (i.e., ~45% in 2012) of the CF market by monetary value.
Some of the first uses of CF in aerospace structural applications emerged from the U.S. Department of Defense and the National Aeronautics and Space Administration (NASA) where the material’s extraordinary mechanical properties were valuable enough to justify its high price. In 1974, filament-wound rocket motor cases were developed for the Department of Defense, and the next year NASA began to include CFRP parts in satellites where any weight savings would make a significant difference in the fuel required for a launch (Abdallah 2009). The 1970s also saw CF used in composite secondary structures and control surfaces of military aircraft, and the first flight of the F/A-18 Hornet in 1978 was a breakthrough in significant use of CF composite primary structures (Deo, Starnes, and Holzwarth 2001).
Applications of CFRP in the commercial aerospace market soon followed, with the introduction of a CF composite rudder by Airbus for the A300 and A310 in 1983 (Deo, Starnes, and Holzwarth 2001). Boeing followed suit with CFRP secondary structures on the 757 and 767, and Airbus broke another barrier with CFRP primary structures in the tail fin of the A320 in 1987 (Abdallah 2009). This sort of innovation has continued to this day with the use of high-composite content in the Boeing 787 and the Airbus A350, which has been driven by the weight savings of CFRP parts and their potential to reduce part counts with the creation of larger components. The latest models in civil aviation such as the Boeing Dreamliner and Airbus A350 are made of up to 52% CFRP (Carson 2012).
3.1 Demand and Supply The aerospace industry took in roughly $692 billion in revenues in 2012 (Captain 2013). The most obvious product of the aerospace industry, aircraft, accounted for $152 billion of that total through the manufacture and sale of roughly 4,390 planes and rotorcraft. This manufacturing effort (along with the maintenance, repair, and overhaul of older craft) required some 544,000 tonnes of raw materials. Composite materials, mostly CFRP composites, accounted for just 3% of that, with 16,300 tonnes as is shown in Figure 3-1 (Zimm 2012); but, given the size of the overall carbon fiber market, this represents a significant source of demand.
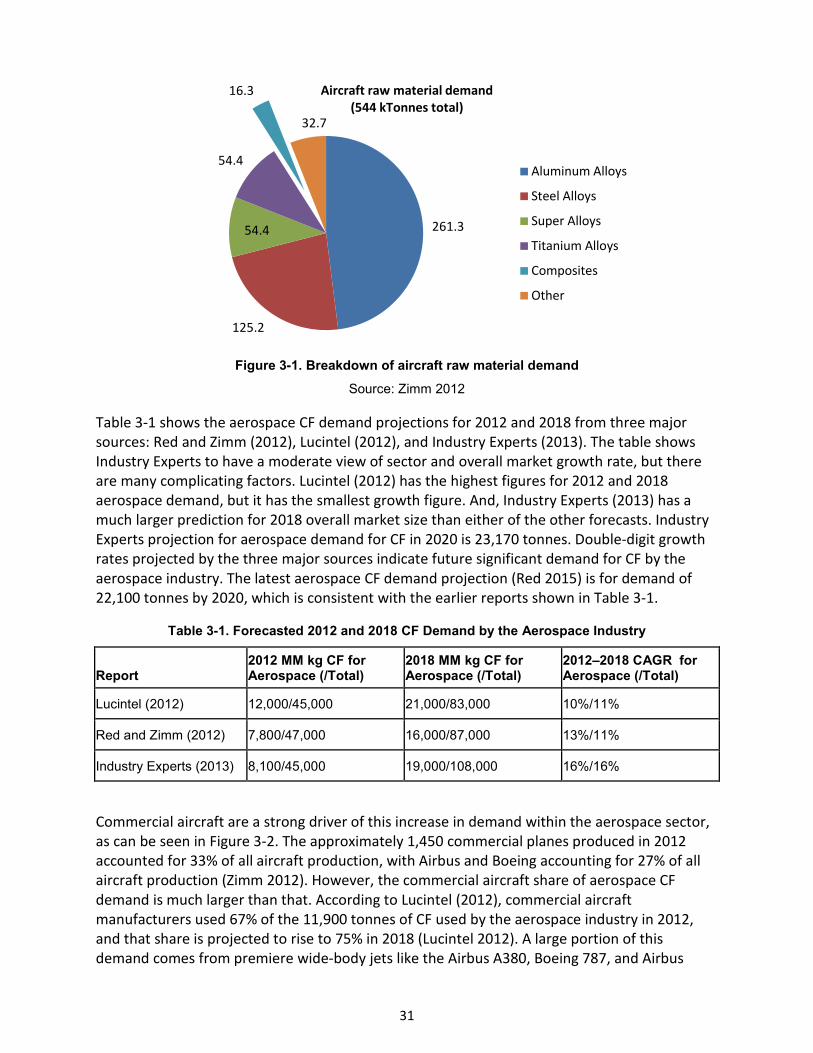
31
Figure 3-1. Breakdown of aircraft raw material demand
Source: Zimm 2012
Table 3-1 shows the aerospace CF demand projections for 2012 and 2018 from three major sources: Red and Zimm (2012), Lucintel (2012), and Industry Experts (2013). The table shows Industry Experts to have a moderate view of sector and overall market growth rate, but there are many complicating factors. Lucintel (2012) has the highest figures for 2012 and 2018 aerospace demand, but it has the smallest growth figure. And, Industry Experts (2013) has a much larger prediction for 2018 overall market size than either of the other forecasts. Industry Experts projection for aerospace demand for CF in 2020 is 23,170 tonnes. Double-digit growth rates projected by the three major sources indicate future significant demand for CF by the aerospace industry. The latest aerospace CF demand projection (Red 2015) is for demand of 22,100 tonnes by 2020, which is consistent with the earlier reports shown in Table 3-1.
Table 3-1. Forecasted 2012 and 2018 CF Demand by the Aerospace Industry
Report 2012 MM kg CF for Aerospace (/Total)
2018 MM kg CF for Aerospace (/Total)
2012–2018 CAGR for Aerospace (/Total)
Lucintel (2012) 12,000/45,000 21,000/83,000 10%/11%
Red and Zimm (2012) 7,800/47,000 16,000/87,000 13%/11%
Industry Experts (2013) 8,100/45,000 19,000/108,000 16%/16%
Commercial aircraft are a strong driver of this increase in demand within the aerospace sector, as can be seen in Figure 3-2. The approximately 1,450 commercial planes produced in 2012 accounted for 33% of all aircraft production, with Airbus and Boeing accounting for 27% of all aircraft production (Zimm 2012). However, the commercial aircraft share of aerospace CF demand is much larger than that. According to Lucintel (2012), commercial aircraft manufacturers used 67% of the 11,900 tonnes of CF used by the aerospace industry in 2012, and that share is projected to rise to 75% in 2018 (Lucintel 2012). A large portion of this demand comes from premiere wide-body jets like the Airbus A380, Boeing 787, and Airbus
261.3
125.2
54.4
54.4
16.3
32.7
Aircraft raw material demand (544 kTonnes total)
Aluminum Alloys
Steel Alloys
Super Alloys
Titanium Alloys
Composites
Other

32
A350 XWB. The dramatic increase in the composite content of these planes can be seen in Figure 3-3. In fact, given that the carbon fiber required for one Boeing 787 is roughly 27 tonnes (Roberts 2009) and that the production rate hit 10 aircraft per month in January of 2014,8 3,240 tonnes of fiber demand from this program alone will account for roughly 20% of the projected 2014 aerospace CF demand of 10,950 tonnes.
Figure 3-2. Breakdown of aerospace CF demand by sector
Source: Lucintel 2012
Figure 3-3. An illustration of increasing composite content, by weight, in Boeing and Airbus aircraft
Source: “Carbon Reinforced Composites: User Sectors (Continued),” July 29, 2013, accessed January 21, 2014, http://www.pluscomposites.eu/content/6-carbon-reinforced-composites-user-sectors-continued
8 “Boeing Rolls Out First 787 Dreamliner at Increased Production Rate,” Debbie Heathers, Boeing, January 24, 2014, accessed February 28, 2014, http://boeing.mediaroom.com/2014-01-24-Boeing-Rolls-Out-First-787-Dreamliner-at-Increased-Production-Rate.
8.0
1.5
0.20.7
1.4 0.1
2012 MM kg CF Demand in Aerospace(Total is 11.9 MM kg)
Comm. Aircraft
Reg.Jets
Gen. Av.
Rotorcraft
Defense
Space
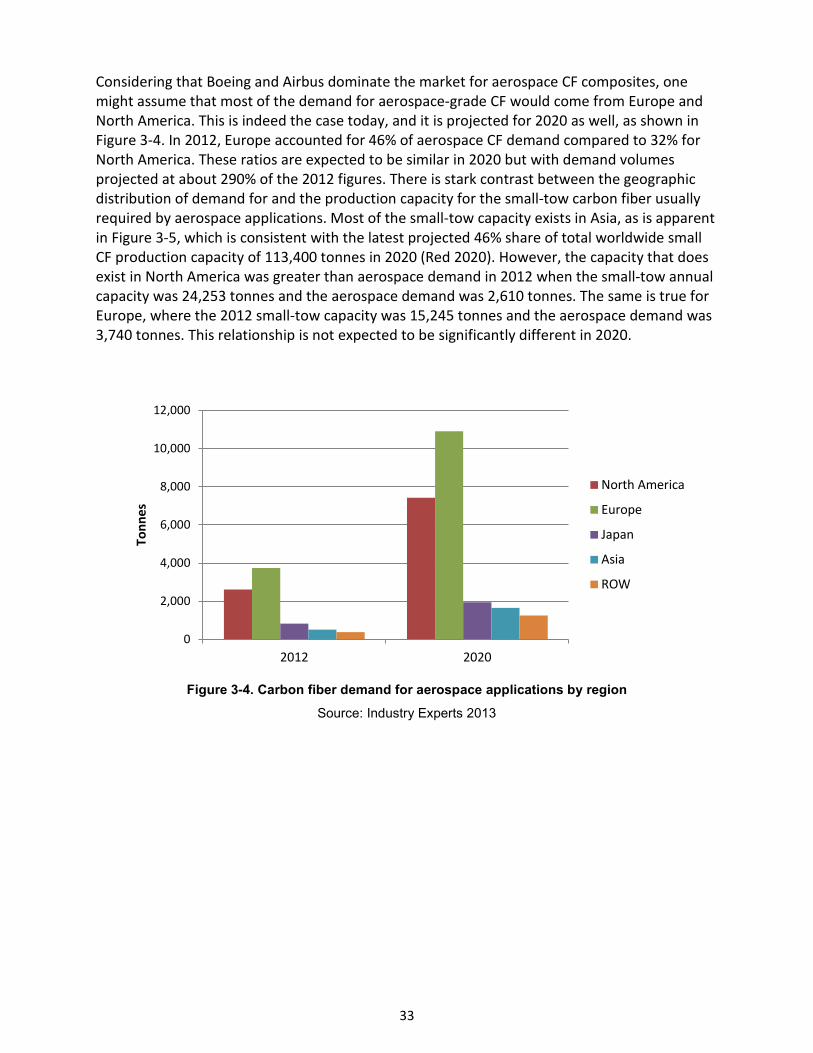
33
Considering that Boeing and Airbus dominate the market for aerospace CF composites, one might assume that most of the demand for aerospace-grade CF would come from Europe and North America. This is indeed the case today, and it is projected for 2020 as well, as shown in Figure 3-4. In 2012, Europe accounted for 46% of aerospace CF demand compared to 32% for North America. These ratios are expected to be similar in 2020 but with demand volumes projected at about 290% of the 2012 figures. There is stark contrast between the geographic distribution of demand for and the production capacity for the small-tow carbon fiber usually required by aerospace applications. Most of the small-tow capacity exists in Asia, as is apparent in Figure 3-5, which is consistent with the latest projected 46% share of total worldwide small CF production capacity of 113,400 tonnes in 2020 (Red 2020). However, the capacity that does exist in North America was greater than aerospace demand in 2012 when the small-tow annual capacity was 24,253 tonnes and the aerospace demand was 2,610 tonnes. The same is true for Europe, where the 2012 small-tow capacity was 15,245 tonnes and the aerospace demand was 3,740 tonnes. This relationship is not expected to be significantly different in 2020.
Figure 3-4. Carbon fiber demand for aerospace applications by region
Source: Industry Experts 2013
0
2,000
4,000
6,000
8,000
10,000
12,000
2012 2020
Tonn
es
North America
Europe
Japan
Asia
ROW
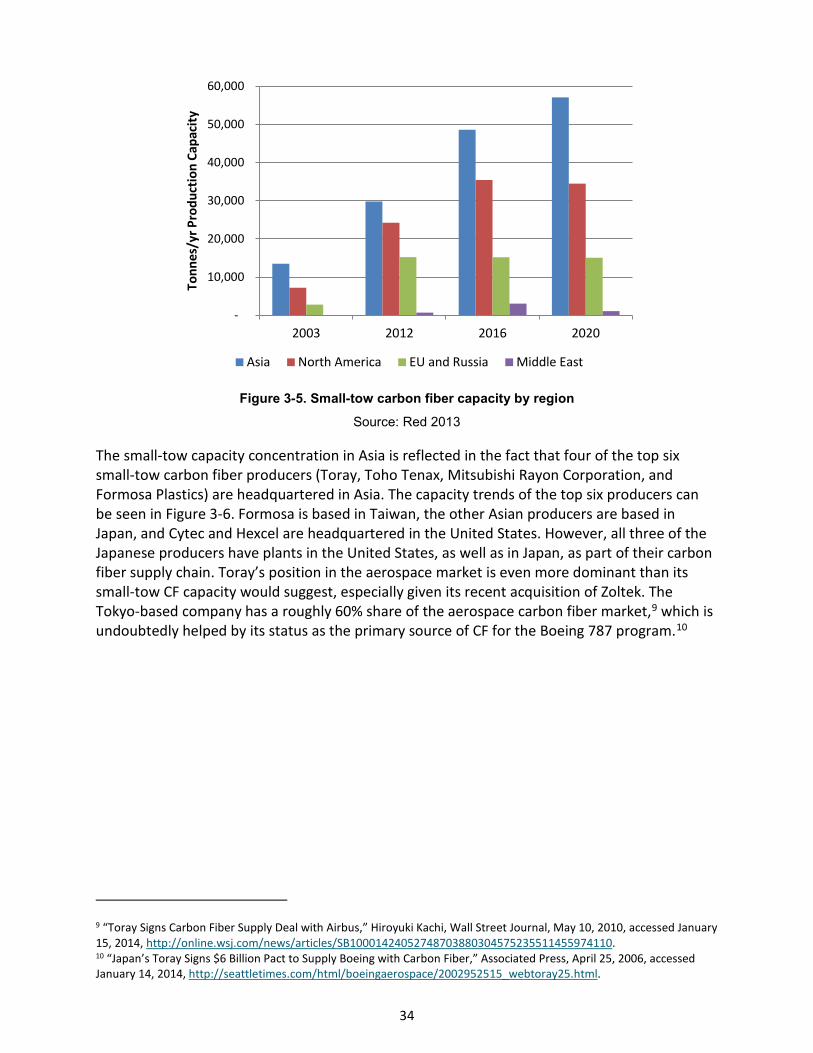
34
Figure 3-5. Small-tow carbon fiber capacity by region
Source: Red 2013
The small-tow capacity concentration in Asia is reflected in the fact that four of the top six small-tow carbon fiber producers (Toray, Toho Tenax, Mitsubishi Rayon Corporation, and Formosa Plastics) are headquartered in Asia. The capacity trends of the top six producers can be seen in Figure 3-6. Formosa is based in Taiwan, the other Asian producers are based in Japan, and Cytec and Hexcel are headquartered in the United States. However, all three of the Japanese producers have plants in the United States, as well as in Japan, as part of their carbon fiber supply chain. Toray’s position in the aerospace market is even more dominant than its small-tow CF capacity would suggest, especially given its recent acquisition of Zoltek. The Tokyo-based company has a roughly 60% share of the aerospace carbon fiber market,9 which is undoubtedly helped by its status as the primary source of CF for the Boeing 787 program.10
9 “Toray Signs Carbon Fiber Supply Deal with Airbus,” Hiroyuki Kachi, Wall Street Journal, May 10, 2010, accessed January 15, 2014, http://online.wsj.com/news/articles/SB10001424052748703880304575235511455974110. 10 “Japan’s Toray Signs $6 Billion Pact to Supply Boeing with Carbon Fiber,” Associated Press, April 25, 2006, accessed January 14, 2014, http://seattletimes.com/html/boeingaerospace/2002952515_webtoray25.html.
-
10,000
20,000
30,000
40,000
50,000
60,000
2003 2012 2016 2020
Tonn
es/y
r Pro
duct
ion
Capa
city
Asia North America EU and Russia Middle East
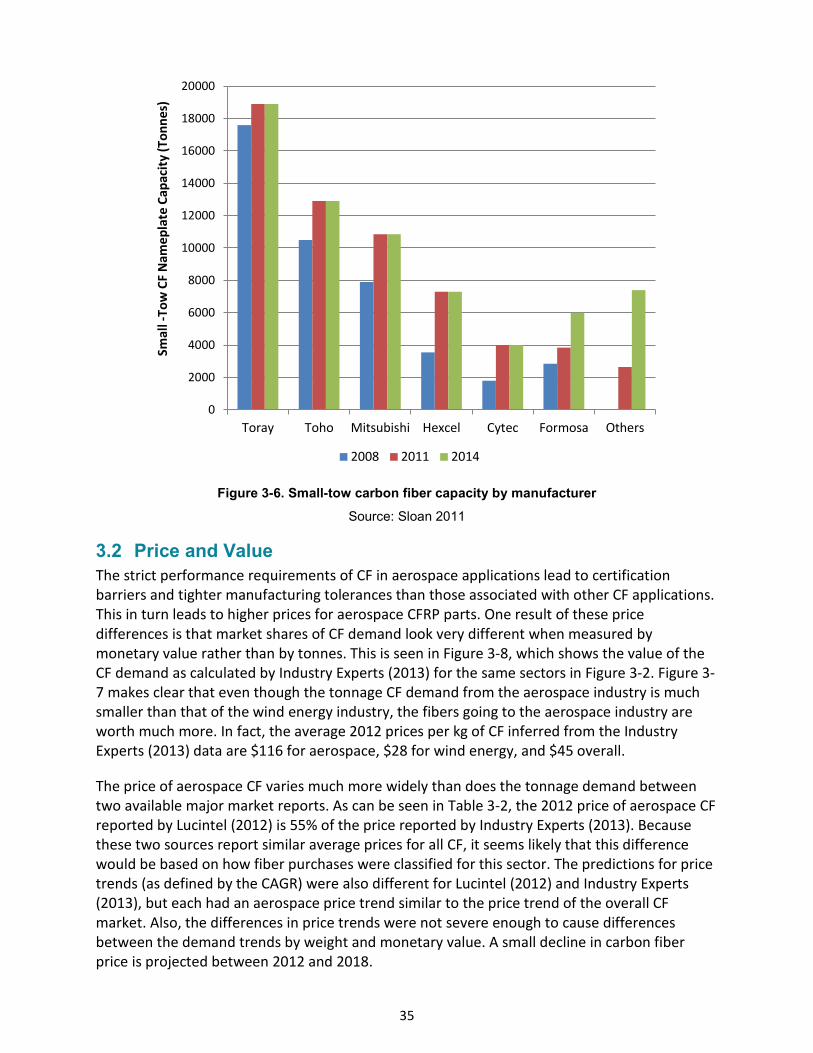
35
Figure 3-6. Small-tow carbon fiber capacity by manufacturer
Source: Sloan 2011
3.2 Price and Value The strict performance requirements of CF in aerospace applications lead to certification barriers and tighter manufacturing tolerances than those associated with other CF applications. This in turn leads to higher prices for aerospace CFRP parts. One result of these price differences is that market shares of CF demand look very different when measured by monetary value rather than by tonnes. This is seen in Figure 3-8, which shows the value of the CF demand as calculated by Industry Experts (2013) for the same sectors in Figure 3-2. Figure 3-7 makes clear that even though the tonnage CF demand from the aerospace industry is much smaller than that of the wind energy industry, the fibers going to the aerospace industry are worth much more. In fact, the average 2012 prices per kg of CF inferred from the Industry Experts (2013) data are $116 for aerospace, $28 for wind energy, and $45 overall.
The price of aerospace CF varies much more widely than does the tonnage demand between two available major market reports. As can be seen in Table 3-2, the 2012 price of aerospace CF reported by Lucintel (2012) is 55% of the price reported by Industry Experts (2013). Because these two sources report similar average prices for all CF, it seems likely that this difference would be based on how fiber purchases were classified for this sector. The predictions for price trends (as defined by the CAGR) were also different for Lucintel (2012) and Industry Experts (2013), but each had an aerospace price trend similar to the price trend of the overall CF market. Also, the differences in price trends were not severe enough to cause differences between the demand trends by weight and monetary value. A small decline in carbon fiber price is projected between 2012 and 2018.
0
2000
4000
6000
8000
10000
12000
14000
16000
18000
20000
Toray Toho Mitsubishi Hexcel Cytec Formosa Others
Smal
l -To
w C
F N
amep
late
Cap
acity
(Ton
nes)
2008 2011 2014
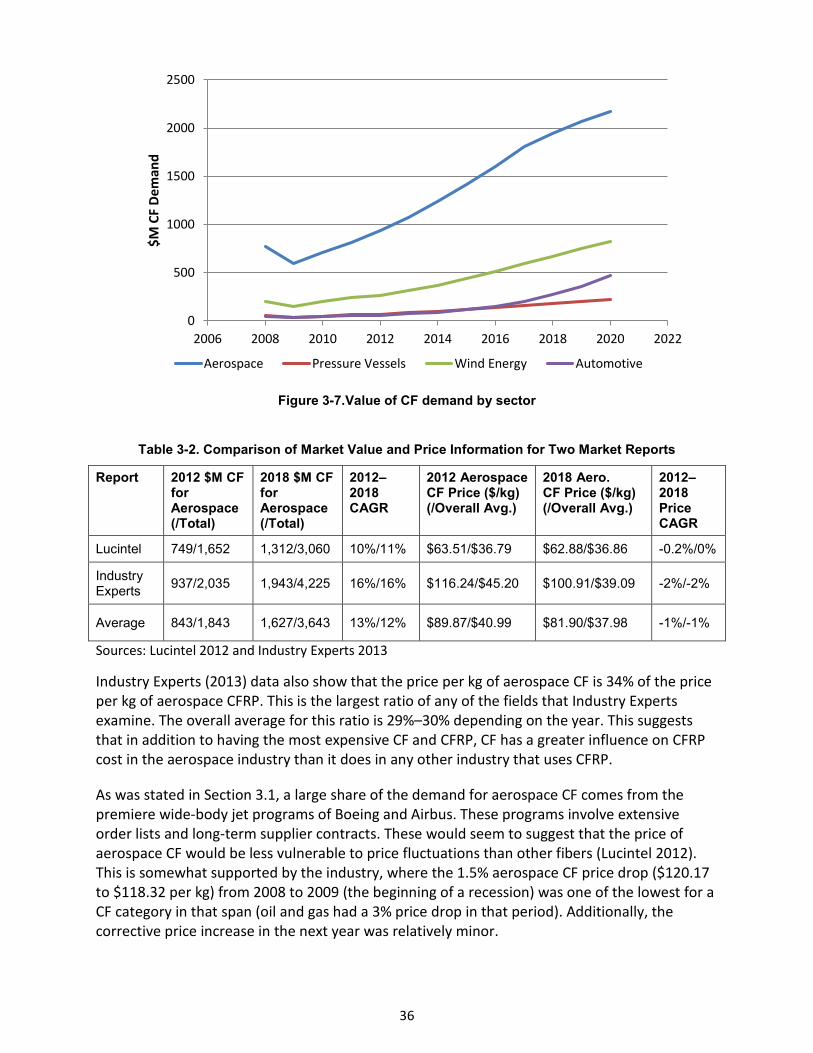
36
Figure 3-7.Value of CF demand by sector
Table 3-2. Comparison of Market Value and Price Information for Two Market Reports
Report 2012 $M CF for Aerospace (/Total)
2018 $M CF for Aerospace (/Total)
2012–2018 CAGR
2012 Aerospace CF Price ($/kg) (/Overall Avg.)
2018 Aero. CF Price ($/kg) (/Overall Avg.)
2012–2018 Price CAGR
Lucintel 749/1,652 1,312/3,060 10%/11% $63.51/$36.79 $62.88/$36.86 -0.2%/0%
Industry Experts 937/2,035 1,943/4,225 16%/16% $116.24/$45.20 $100.91/$39.09 -2%/-2%
Average 843/1,843 1,627/3,643 13%/12% $89.87/$40.99 $81.90/$37.98 -1%/-1%
Sources: Lucintel 2012 and Industry Experts 2013
Industry Experts (2013) data also show that the price per kg of aerospace CF is 34% of the price per kg of aerospace CFRP. This is the largest ratio of any of the fields that Industry Experts examine. The overall average for this ratio is 29%–30% depending on the year. This suggests that in addition to having the most expensive CF and CFRP, CF has a greater influence on CFRP cost in the aerospace industry than it does in any other industry that uses CFRP.
As was stated in Section 3.1, a large share of the demand for aerospace CF comes from the premiere wide-body jet programs of Boeing and Airbus. These programs involve extensive order lists and long-term supplier contracts. These would seem to suggest that the price of aerospace CF would be less vulnerable to price fluctuations than other fibers (Lucintel 2012). This is somewhat supported by the industry, where the 1.5% aerospace CF price drop ($120.17 to $118.32 per kg) from 2008 to 2009 (the beginning of a recession) was one of the lowest for a CF category in that span (oil and gas had a 3% price drop in that period). Additionally, the corrective price increase in the next year was relatively minor.
0
500
1000
1500
2000
2500
2006 2008 2010 2012 2014 2016 2018 2020 2022
$M C
F De
man
d
Aerospace Pressure Vessels Wind Energy Automotive
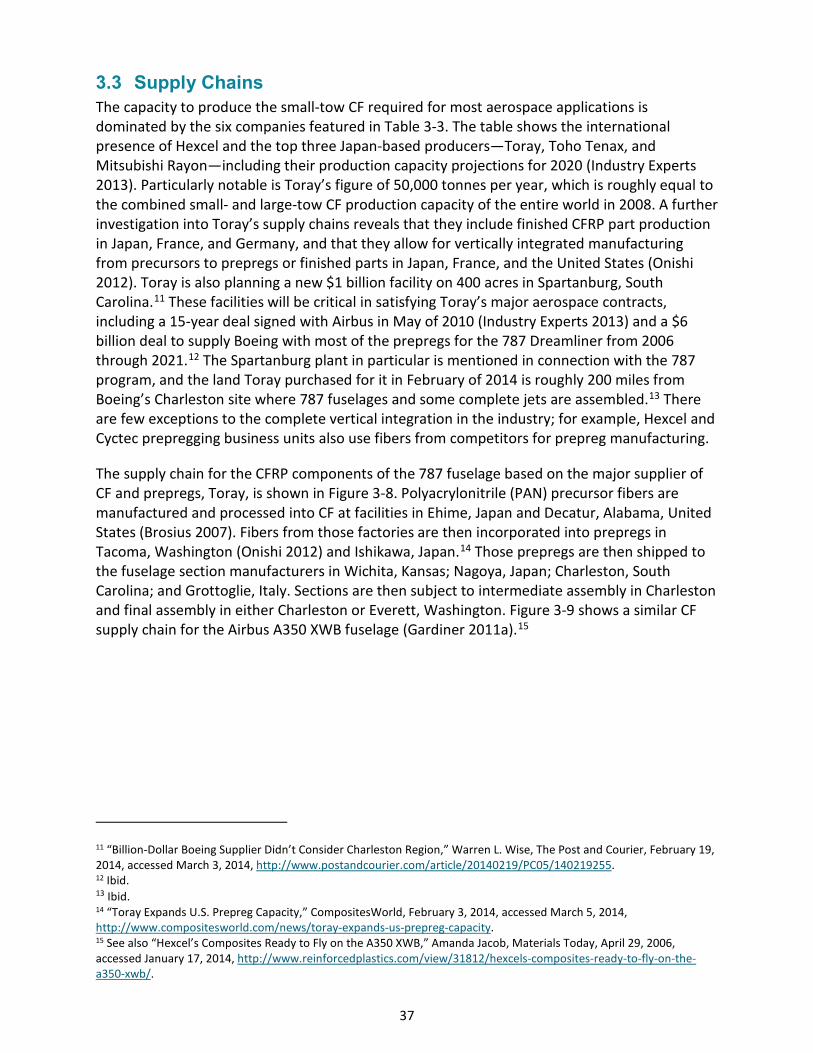
37
3.3 Supply Chains The capacity to produce the small-tow CF required for most aerospace applications is dominated by the six companies featured in Table 3-3. The table shows the international presence of Hexcel and the top three Japan-based producers—Toray, Toho Tenax, and Mitsubishi Rayon—including their production capacity projections for 2020 (Industry Experts 2013). Particularly notable is Toray’s figure of 50,000 tonnes per year, which is roughly equal to the combined small- and large-tow CF production capacity of the entire world in 2008. A further investigation into Toray’s supply chains reveals that they include finished CFRP part production in Japan, France, and Germany, and that they allow for vertically integrated manufacturing from precursors to prepregs or finished parts in Japan, France, and the United States (Onishi 2012). Toray is also planning a new $1 billion facility on 400 acres in Spartanburg, South Carolina.11 These facilities will be critical in satisfying Toray’s major aerospace contracts, including a 15-year deal signed with Airbus in May of 2010 (Industry Experts 2013) and a $6 billion deal to supply Boeing with most of the prepregs for the 787 Dreamliner from 2006 through 2021.12 The Spartanburg plant in particular is mentioned in connection with the 787 program, and the land Toray purchased for it in February of 2014 is roughly 200 miles from Boeing’s Charleston site where 787 fuselages and some complete jets are assembled.13 There are few exceptions to the complete vertical integration in the industry; for example, Hexcel and Cyctec prepregging business units also use fibers from competitors for prepreg manufacturing.
The supply chain for the CFRP components of the 787 fuselage based on the major supplier of CF and prepregs, Toray, is shown in Figure 3-8. Polyacrylonitrile (PAN) precursor fibers are manufactured and processed into CF at facilities in Ehime, Japan and Decatur, Alabama, United States (Brosius 2007). Fibers from those factories are then incorporated into prepregs in Tacoma, Washington (Onishi 2012) and Ishikawa, Japan.14 Those prepregs are then shipped to the fuselage section manufacturers in Wichita, Kansas; Nagoya, Japan; Charleston, South Carolina; and Grottoglie, Italy. Sections are then subject to intermediate assembly in Charleston and final assembly in either Charleston or Everett, Washington. Figure 3-9 shows a similar CF supply chain for the Airbus A350 XWB fuselage (Gardiner 2011a).15
11 “Billion-Dollar Boeing Supplier Didn’t Consider Charleston Region,” Warren L. Wise, The Post and Courier, February 19, 2014, accessed March 3, 2014, http://www.postandcourier.com/article/20140219/PC05/140219255. 12 Ibid. 13 Ibid. 14 “Toray Expands U.S. Prepreg Capacity,” CompositesWorld, February 3, 2014, accessed March 5, 2014, http://www.compositesworld.com/news/toray-expands-us-prepreg-capacity. 15 See also “Hexcel’s Composites Ready to Fly on the A350 XWB,” Amanda Jacob, Materials Today, April 29, 2006, accessed January 17, 2014, http://www.reinforcedplastics.com/view/31812/hexcels-composites-ready-to-fly-on-the-a350-xwb/.
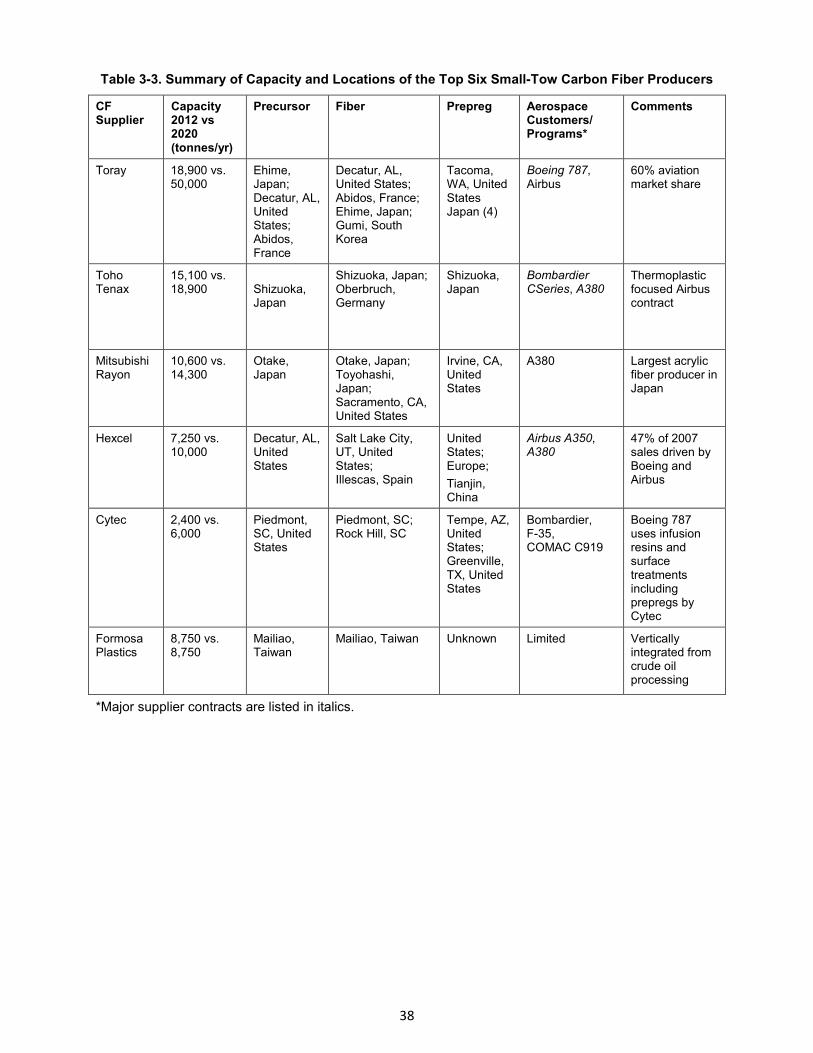
38
Table 3-3. Summary of Capacity and Locations of the Top Six Small-Tow Carbon Fiber Producers
CF Supplier
Capacity 2012 vs 2020 (tonnes/yr)
Precursor Fiber Prepreg Aerospace Customers/ Programs*
Comments
Toray 18,900 vs. 50,000
Ehime, Japan; Decatur, AL, United States; Abidos, France
Decatur, AL, United States; Abidos, France; Ehime, Japan; Gumi, South Korea
Tacoma, WA, United States Japan (4)
Boeing 787, Airbus
60% aviation market share
Toho Tenax
15,100 vs. 18,900 Shizuoka,
Japan
Shizuoka, Japan; Oberbruch, Germany
Shizuoka, Japan
Bombardier CSeries, A380
Thermoplastic focused Airbus contract
Mitsubishi Rayon
10,600 vs. 14,300
Otake, Japan
Otake, Japan; Toyohashi, Japan; Sacramento, CA, United States
Irvine, CA, United States
A380 Largest acrylic fiber producer in Japan
Hexcel 7,250 vs. 10,000
Decatur, AL, United States
Salt Lake City, UT, United States; Illescas, Spain
United States; Europe; Tianjin, China
Airbus A350, A380
47% of 2007 sales driven by Boeing and Airbus
Cytec 2,400 vs. 6,000
Piedmont, SC, United States
Piedmont, SC; Rock Hill, SC
Tempe, AZ, United States; Greenville, TX, United States
Bombardier, F-35,COMAC C919
Boeing 787 uses infusion resins and surface treatments including prepregs by Cytec
Formosa Plastics
8,750 vs. 8,750
Mailiao, Taiwan
Mailiao, Taiwan Unknown Limited Vertically integrated from crude oil processing
*Major supplier contracts are listed in italics.
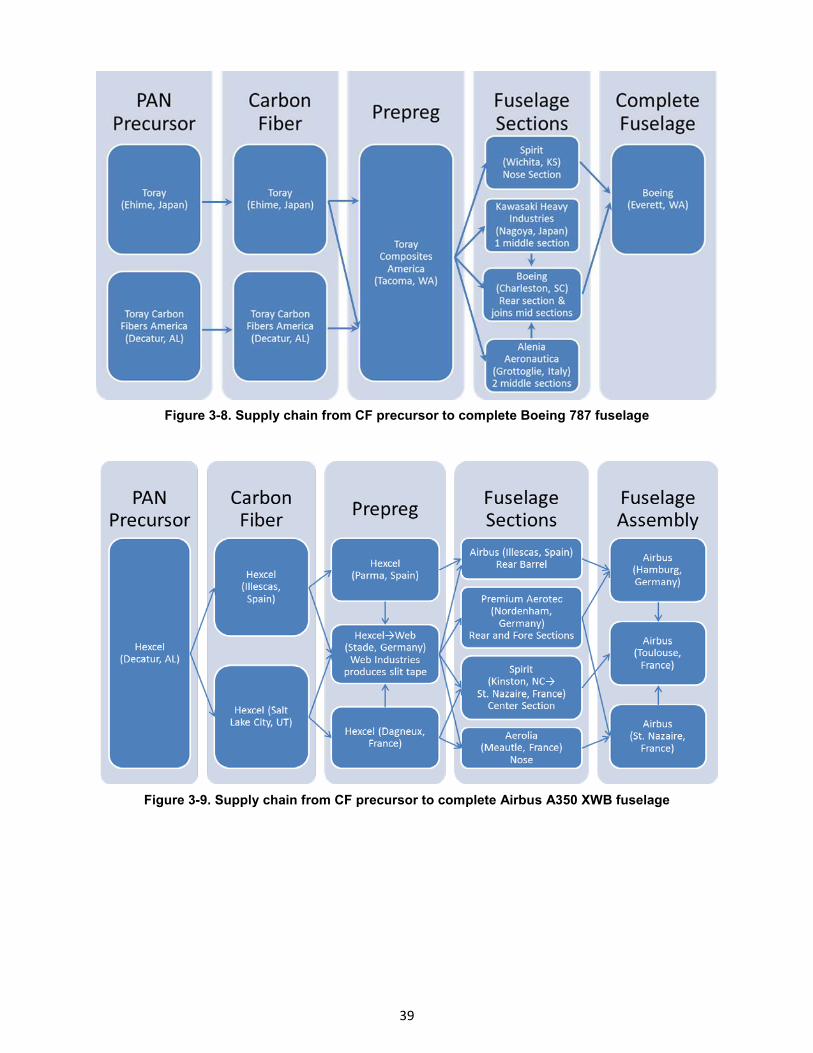
39
Figure 3-8. Supply chain from CF precursor to complete Boeing 787 fuselage
Figure 3-9. Supply chain from CF precursor to complete Airbus A350 XWB fuselage
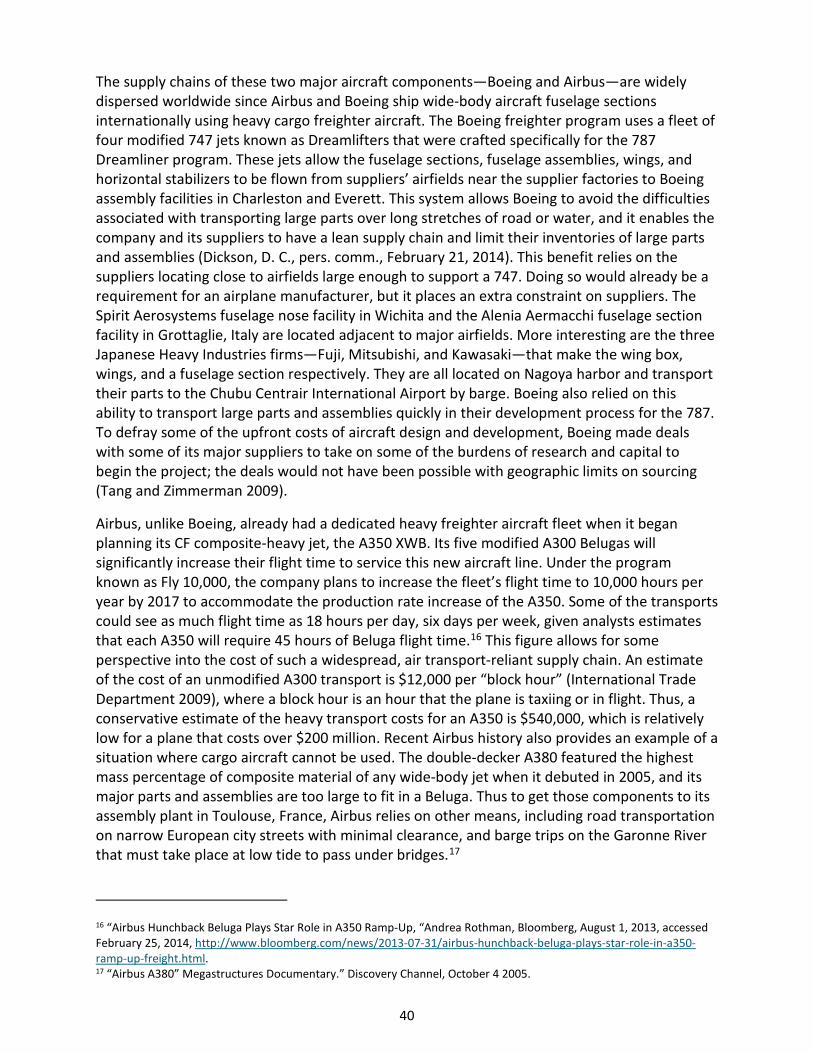
40
The supply chains of these two major aircraft components—Boeing and Airbus—are widely dispersed worldwide since Airbus and Boeing ship wide-body aircraft fuselage sections internationally using heavy cargo freighter aircraft. The Boeing freighter program uses a fleet of four modified 747 jets known as Dreamlifters that were crafted specifically for the 787 Dreamliner program. These jets allow the fuselage sections, fuselage assemblies, wings, and horizontal stabilizers to be flown from suppliers’ airfields near the supplier factories to Boeing assembly facilities in Charleston and Everett. This system allows Boeing to avoid the difficulties associated with transporting large parts over long stretches of road or water, and it enables the company and its suppliers to have a lean supply chain and limit their inventories of large parts and assemblies (Dickson, D. C., pers. comm., February 21, 2014). This benefit relies on the suppliers locating close to airfields large enough to support a 747. Doing so would already be a requirement for an airplane manufacturer, but it places an extra constraint on suppliers. The Spirit Aerosystems fuselage nose facility in Wichita and the Alenia Aermacchi fuselage section facility in Grottaglie, Italy are located adjacent to major airfields. More interesting are the three Japanese Heavy Industries firms—Fuji, Mitsubishi, and Kawasaki—that make the wing box, wings, and a fuselage section respectively. They are all located on Nagoya harbor and transport their parts to the Chubu Centrair International Airport by barge. Boeing also relied on this ability to transport large parts and assemblies quickly in their development process for the 787. To defray some of the upfront costs of aircraft design and development, Boeing made deals with some of its major suppliers to take on some of the burdens of research and capital to begin the project; the deals would not have been possible with geographic limits on sourcing (Tang and Zimmerman 2009).
Airbus, unlike Boeing, already had a dedicated heavy freighter aircraft fleet when it began planning its CF composite-heavy jet, the A350 XWB. Its five modified A300 Belugas will significantly increase their flight time to service this new aircraft line. Under the program known as Fly 10,000, the company plans to increase the fleet’s flight time to 10,000 hours per year by 2017 to accommodate the production rate increase of the A350. Some of the transports could see as much flight time as 18 hours per day, six days per week, given analysts estimates that each A350 will require 45 hours of Beluga flight time.16 This figure allows for some perspective into the cost of such a widespread, air transport-reliant supply chain. An estimate of the cost of an unmodified A300 transport is $12,000 per “block hour” (International Trade Department 2009), where a block hour is an hour that the plane is taxiing or in flight. Thus, a conservative estimate of the heavy transport costs for an A350 is $540,000, which is relatively low for a plane that costs over $200 million. Recent Airbus history also provides an example of a situation where cargo aircraft cannot be used. The double-decker A380 featured the highest mass percentage of composite material of any wide-body jet when it debuted in 2005, and its major parts and assemblies are too large to fit in a Beluga. Thus to get those components to its assembly plant in Toulouse, France, Airbus relies on other means, including road transportation on narrow European city streets with minimal clearance, and barge trips on the Garonne River that must take place at low tide to pass under bridges.17
16 “Airbus Hunchback Beluga Plays Star Role in A350 Ramp-Up, “Andrea Rothman, Bloomberg, August 1, 2013, accessed February 25, 2014, http://www.bloomberg.com/news/2013-07-31/airbus-hunchback-beluga-plays-star-role-in-a350-ramp-up-freight.html. 17 “Airbus A380” Megastructures Documentary.” Discovery Channel, October 4 2005.
41
To conclude, the supply chains for both aviation CF and the major CFRP-based parts and assemblies of the premiere wide-body jets often contain long-distance transportation routes. In the case of air transport for large composite aircraft parts, the transport is made easier by airfield proximity and aviation expertise of the companies involved. Additionally, the manufacturing rate and low density of the composite parts make these projects uniquely suited for a lean supply chain based on heavy air cargo.
3.4 Manufacturing Figure 3-10 shows how manufacturing methods for CF composites for the airframe content in the aerospace industry have changed since 1970 and their projected breakdown in 2020. The dotted line shows the growth in CF composites, with airframe content in 2020 productions estimated to range from 35% to just under 60%. The small volumes of specialized parts that characterized early use of CFRP parts in the aerospace industry meant that slower manufacturing methods like wet layup of fibers and hand layup of prepregs was cost effective. However, as CF composites were used in larger parts and in greater volumes, new manufacturing techniques were required that could increase the pace of production and make parts more consistently. Thus automated tape layup and fiber placement increased in importance. Also notable is the emergence of thermoplastics in 2005 and its projected increase in process share by 2020, a change that would allow for even faster manufacturing of CFRP parts. Global RTM, a private French company combining four companies active in the resin transfer molding aerospace sector, has been recently formed.18 It will focus on high efficiency processes for RTM and turnkey production systems for out-of-autoclave composites processing equipment for the aerospace industry, and in particular for complex parts, and it will likely facilitate a more rapid development of cost-effective manufacturing technologies for aerospace applications.
18 “Strategic Alliance Global RTM to Meet Aerospace Needs,” Mark Holmes, March 24, 2014, accessed March 28, 2016, http://www.materialstoday.com/composite-applications/news/strategic-alliance-global-rtm-to-meet-aerospace/.
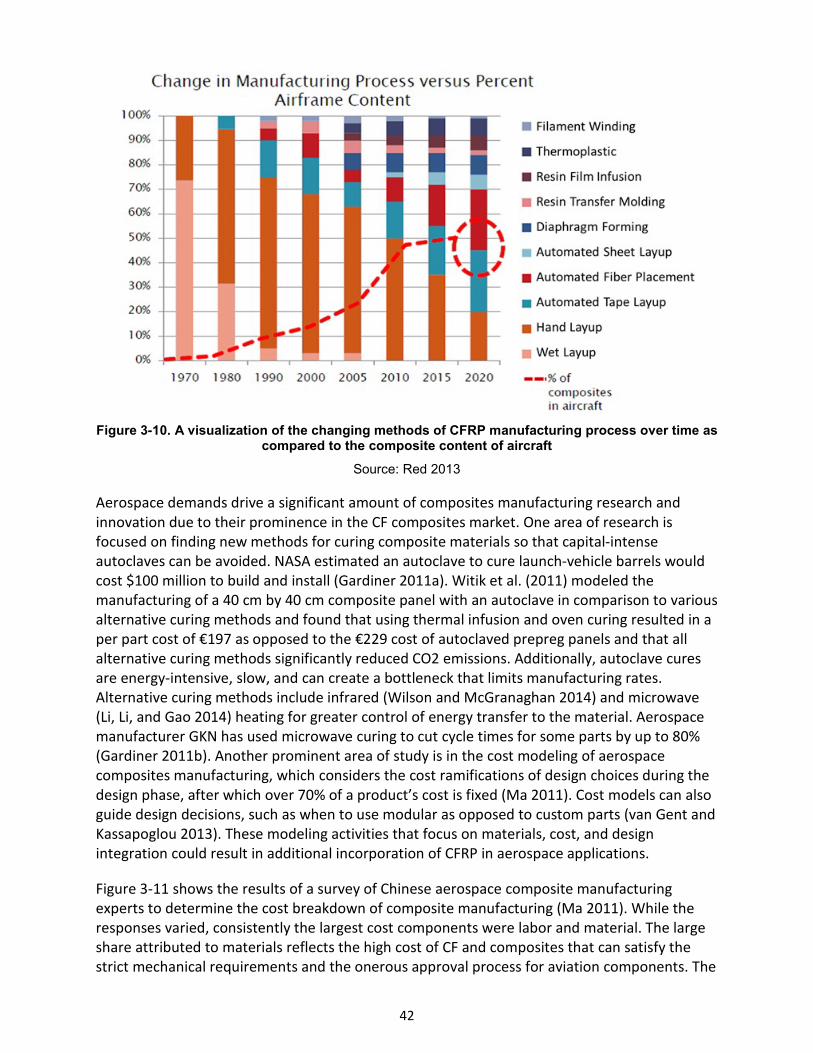
42
Figure 3-10. A visualization of the changing methods of CFRP manufacturing process over time as compared to the composite content of aircraft
Source: Red 2013
Aerospace demands drive a significant amount of composites manufacturing research and innovation due to their prominence in the CF composites market. One area of research is focused on finding new methods for curing composite materials so that capital-intense autoclaves can be avoided. NASA estimated an autoclave to cure launch-vehicle barrels would cost $100 million to build and install (Gardiner 2011a). Witik et al. (2011) modeled the manufacturing of a 40 cm by 40 cm composite panel with an autoclave in comparison to various alternative curing methods and found that using thermal infusion and oven curing resulted in a per part cost of €197 as opposed to the €229 cost of autoclaved prepreg panels and that all alternative curing methods significantly reduced CO2 emissions. Additionally, autoclave cures are energy-intensive, slow, and can create a bottleneck that limits manufacturing rates. Alternative curing methods include infrared (Wilson and McGranaghan 2014) and microwave (Li, Li, and Gao 2014) heating for greater control of energy transfer to the material. Aerospace manufacturer GKN has used microwave curing to cut cycle times for some parts by up to 80% (Gardiner 2011b). Another prominent area of study is in the cost modeling of aerospace composites manufacturing, which considers the cost ramifications of design choices during the design phase, after which over 70% of a product’s cost is fixed (Ma 2011). Cost models can also guide design decisions, such as when to use modular as opposed to custom parts (van Gent and Kassapoglou 2013). These modeling activities that focus on materials, cost, and design integration could result in additional incorporation of CFRP in aerospace applications.
Figure 3-11 shows the results of a survey of Chinese aerospace composite manufacturing experts to determine the cost breakdown of composite manufacturing (Ma 2011). While the responses varied, consistently the largest cost components were labor and material. The large share attributed to materials reflects the high cost of CF and composites that can satisfy the strict mechanical requirements and the onerous approval process for aviation components. The
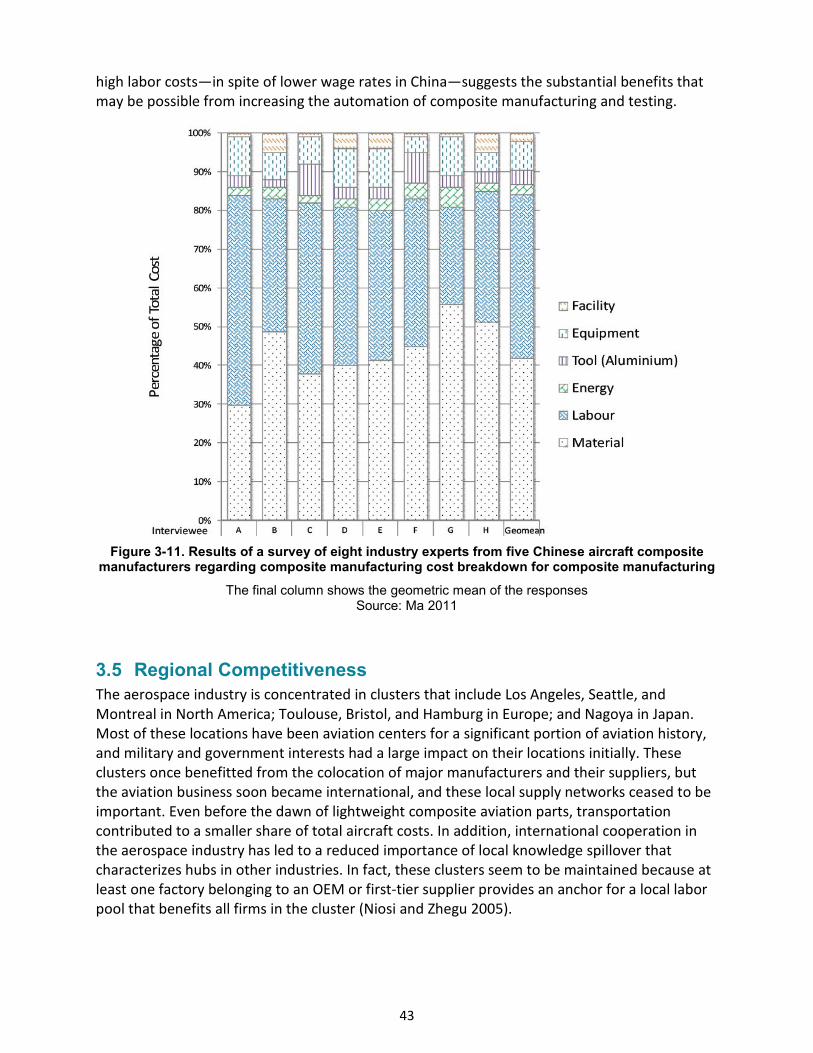
43
high labor costs—in spite of lower wage rates in China—suggests the substantial benefits that may be possible from increasing the automation of composite manufacturing and testing.
Figure 3-11. Results of a survey of eight industry experts from five Chinese aircraft composite manufacturers regarding composite manufacturing cost breakdown for composite manufacturing
The final column shows the geometric mean of the responses Source: Ma 2011
3.5 Regional Competitiveness The aerospace industry is concentrated in clusters that include Los Angeles, Seattle, and Montreal in North America; Toulouse, Bristol, and Hamburg in Europe; and Nagoya in Japan. Most of these locations have been aviation centers for a significant portion of aviation history, and military and government interests had a large impact on their locations initially. These clusters once benefitted from the colocation of major manufacturers and their suppliers, but the aviation business soon became international, and these local supply networks ceased to be important. Even before the dawn of lightweight composite aviation parts, transportation contributed to a smaller share of total aircraft costs. In addition, international cooperation in the aerospace industry has led to a reduced importance of local knowledge spillover that characterizes hubs in other industries. In fact, these clusters seem to be maintained because at least one factory belonging to an OEM or first-tier supplier provides an anchor for a local labor pool that benefits all firms in the cluster (Niosi and Zhegu 2005).
44
Many supply chain decisions for aviation projects can be influenced by government actions. Japan is notable in this regard. Japanese companies provide roughly 35% of the manufacturing work for the Boeing 787 Dreamliner. Many observers have stated that one reason Boeing selects Japanese suppliers is that Japanese airlines give preference to Boeing jets in return. Between 2002 and 2012, Japan’s air carriers made 80% of their purchases from Boeing, whereas the overall market is much closer to an even split between Boeing and Airbus. A formal agreement such as between Boeing and Japanese air carriers would violate the World Trade Organization’s “Agreement of Trade in Civil Aircraft,” but allegations of violation have never been proven.19 Additionally, the Japanese government takes actively encourages the country’s aviation industry through subsidies and other aid. So, Boeing’s choice of Japanese suppliers may have been the most cost-effective choice, but costs may have been higher without government incentives. Government aid from Japan, the United States, and other sources led Airbus CEO Tom Enders to claim that the 787 program benefitted from more subsidies—$7 billion by his count—than any other civil aircraft program. However, his claim is but one of many between Airbus and Boeing in their dispute over who is subsidized more, with both firms counting the other’s total subsidies in the hundreds of billions of dollars.20 Additionally, Airbus’s supply chains have been subject to more direct government influence in the past. For example, in 2006, the chief executive of Airbus, Christian Streiff, proposed a plan to consolidate more of Airbus’s A380 manufacturing in Toulouse, France and reduce the role of a plant in Hamburg, Germany. The backlash from the German government led to the cancellation of the plan and Streiff’s removal.21 Such governmental influence on supply chain decisions in the aerospace industry suggests any adoption of CFRP that changes supply locations could receive high scrutiny.
Competitiveness in aerospace-grade CF and CFRP manufacturing does not seem to require exact colocation with manufacturers of CFRP-based aerospace components, but examples of such colocation include Toray’s plant in Tacoma, Washington near Boeing’s Seattle and Everett operations and Hexcel’s plant in Illescas, Spain where Airbus has a plant. Both companies do precursor manufacturing in Decatur, Alabama, which is not a top ten North American aerospace cluster but which has some aerospace industry due to its proximity to Huntsville, Alabama. Perhaps the benefit to both firms comes from the established workforce for PAN manufacturing, as described by Niosi and Zhegu (2005) for aerospace cluster labor pools in general. A particularly interesting location decision is the planned Spartanburg County, South Carolina plant announced by Toray in February 2014. This plant will be 200 miles from the Charleston assembly line for the 787, which has caused many, including Boeing to cite that as a primary motivation for Toray’s location choice.22 However, the president of Toray cited access
19 “Japan’s Role in Making Batteries for Boeing,” James B. Stewart, The New York Times, January 25, 2013, accessed February 25, 2014, http://www.nytimes.com/2013/01/26/business/selection-of-the-boeing-787s-battery-maker-raises-questions.html. 20 “The Two Big Aircraft-makers Battle It Out at the World Trade Organisation,” The Economist, August 13, 2009, accessed February 25, 2014, http://www.economist.com/node/14214813. 21 “Chief Executive of Troubled Airbus Resigns,” David Gow, The Guardian, October 9 2006, accessed February 25, 2014, http://www.theguardian.com/business/2006/oct/09/money3. 22 “Billion-Dollar Boeing Supplier Didn’t Consider Charleston Region,” Warren L. Wise, The Post and Courier, February 19, 2014, accessed March 3, 2014, http://www.postandcourier.com/article/20140219/PC05/140219255.
45
to Interstates 26 and 85 as factors in the location choice. In addition, the choice was likely influenced by the $10 million in grants from South Carolina state government.23
3.6 Summary The aerospace industry is the most mature field of CF composite applications, and it is the top source of CF demand by monetary value in addition to being a major source of demand by weight. A long and expensive qualification process for major aerospace programs severely limits the introduction of new products and suppliers of carbon fiber. Additionally the prices for CF and CFRP for aerospace applications are higher on average than those for any other CF composite application. The manufacturing of aerospace-grade small-tow CF is most concentrated in Japan, where the top three manufacturing firms are headquartered, but there are significant manufacturing operations in the United States and Europe where aerospace manufacturing is most prominent. U.S.-based Boeing and Europe-based Airbus drive most of the demand for aerospace-grade CF, primarily through their major wide-body jet projects: the 787 for Boeing and the A380 and upcoming A350 for Airbus. An interesting aspect of the supply chains for these jets is the transnational shipping required for fibers composites and major aerostructures. The long-distance shipping of large aerostructures for the 787 and A350 is made possible by the use of small fleets of specially modified freight aircraft owned by the OEMs. The OEMs have shifted design and manufacturing work to toward their suppliers in recent years (1) to defray upfront costs and risk of new aircraft development and (2) to enable a leaner supply chain and assembly process. Supplier choice can be influenced by local and national government subsidies as well as efforts to build goodwill with airlines in lucrative markets by supporting manufacturing in those markets—Boeing’s relationship with Japanese manufacturers and airlines is a prime example. A major geographic characteristic of the aerospace industry is that suppliers and OEMs tend to have facilities in regional clusters in order to reap the benefits of skilled labor pools supported by a small number of anchor plants. The large-order books for composite-heavy wide-body jets promise a significant amount of CF demand for years to come, but demand could increase significantly if the economics were to shift in favor of using CFRP components on smaller airplanes, due either to increased fuel costs or lower composite manufacturing costs.
23 “Toray Announces $1 Billion Investment in SC Plant,” Associated Press, February 18, 2014, accessed March 3, 2014, http://www.huffingtonpost.com/huff-wires/20140218/sc--spartanburg-jobs/.
46
4 Automotive Industry The automotive industry has been interested in CFRP for several decades because the material has greater weight savings potential and higher stiffness than conventional automotive materials such as steel and aluminum. However, the uptake of CFRP in the automotive industry has been quite limited despite these superior properties. High CF costs, long CFRP manufacturing cycle times, and uncertain CF supply are among the primary reasons the use of CFRP by the automotive industry has largely remained confined to ultra-expensive, low-production-volume models such as the Lamborghini Murcielago. Manufacturers of such niche vehicles can tolerate high CF costs, which can be passed along to their customers who value performance more than cost. Similarly, long CFRP-manufacturing cycle times can be tolerated when models are produced at a rate of only a few tens to a few hundred units per year. Uptake of CFRP by these niche automotive manufacturers may have been greater if CF supplies were more dependable.24 As it is, securing long-term, stable supplies of CF has been problematic due to the small demand of the niche manufacturers. Carbon fiber suppliers choose to focus instead on industries historically having much larger demand, such as aerospace and sporting goods.
The first significant use of CFRP for automotive applications began in 1981 when the McLaren Formula One racing team constructed the monocoque cabin of its MP4/1 race car out of CFRP, aiming to reduce weight and improve crashworthiness.25 Both goals were tested that same year with remarkable success, and CFRP has since been adopted by all major Formula One teams due to its advantages over the conventional aluminum monocoque. About a decade later, CFRP found its first significant application in a road car, the McLaren F1 supercar; 106 units were produced between 1992 and 1998, and each retailed for $970,000. Other supercar manufacturers such as Ferrari and Lamborghini followed McLaren’s lead in the 2000s, and until very recently, CFRP usage in the automotive industry has largely remained confined to these European supercars. In addition, Corvette was an early adopter of this automotive material use; its advanced materials use began in 1953, when the first Corvettes were produced with all-fiberglass bodies. The introduction of the C6 Z06 in 2006 brought a greater percentage of lightweight carbon fiber body panels, which included front fenders, front wheel houses, and rear fenders. After the model year 2014 Corvette was introduced, carbon fiber hood and roof have been included on every vehicle, even base-line models.
A new age of CFRP use in the automotive industry was began in 2013 when BMW began selling the i3 electric vehicle, the first vehicle to simultaneously (1) use a significant amount of CFRP, (2) be produced in significant numbers, and (3) sell at a price point reachable by a significantnumber of consumers. Estimates for the mass of CFRP per i3 vehicle are in the range of 120kilograms26 to 150 kilograms.27 BMW is not publicly disclosing production volume targets, but
24 “Carbon Fibre’s Journey from Racetrack to Hatchback,” Iain Mackenzie, BBC, March 10, 2011, accessed November 12, 2013, http://www.bbc.co.uk/news/technology-12691062. 25 Ibid. 26 “BMW i3 Concept,” Stuart Fowle, Car and Driver, July 2011, accessed January 26, 2014. http://www.caranddriver.com/ news/bmw-i3-electric-city-car-concept-news. 27 “BMW i3, the Inside Story: What It’s Made of, How It’s Made,” SAE International, May 9, 2013, accessed January 26, 2014, http://articles.sae.org/12056/.
47
industry analysts are forecasting in the range of 30,000 units annually.28 In the United States, the i3 has a starting manufacturer’s suggested retail price (MSRP) of $41,350. In the i3, the passenger cabin—termed Life Module by BMW—is made of CFRP and sits atop the aluminum chassis, or Drive Module. BMW indicates that CFRP was the only material under serious consideration for the Life Module due to its superior lightweighting properties,29 which are essential for attaining a long all-electric driving range. In addition, BMW is planning to introduce a full carbon fiber as well as a carbon fiber/alloy hybrid wheel within the next two years that will provide 25%–35% mass savings over a regular alloy wheel.30 This lightweighting property and the resulting fuel savings are anticipated to drive significant growth in CFRP demand by the automotive industry in coming years as vehicles become increasingly electrified and manufacturers aim to comply with rising fuel economy standards.
4.1 Demand and Supply About 1,500 unique vehicle models are in production today, and a little over 100 of them use some amount of CFRP as standard equipment.31 While this may be interpreted as a small share, it is worth noting this is about a five-fold increase from the number of models using CFRP only a decade ago,32 which lends support to the assumption that CF demand by the automotive industry will rise sharply in coming years as lightweighting becomes increasingly important. In terms of tonnage demand, a wide range of estimates exist for present and future years. Red and Zimm (2012, Industry Experts (2013), and Lucintel (2012) have disaggregated forecasted CF demand for different applications at different time scales (Tables 1.1 and 1.2). While each forecast is based on a different time scale and uses different levels of application disaggregation, experts clearly agree the automotive industry will demand a very important share of the future carbon fiber market. Industry Experts (2012) and Lucintel (2012) anticipate automotive applications will be the third-highest demanding CF application in coming years. The most conservative estimate (Red and Zimm 2012) anticipates automotive will be the fifth-highest demanding application at the longest time scale (i.e., year 2022). The automotive industry’s share of total CF demand is estimated to be in the range of 5% to 16% based on three available projections.
Table 4-1, which is also based on Red and Zimm (2012), Industry Experts (2013), and Lucintel (2012), provides further insight into the forecasted demand scenarios for automotive CF. For example, annual total demand for CF by the automotive industry was estimated in the range of 2,150 tonnes to 4,808 tonnes in 2012. In 2018, which represents the furthest common data
28 “Higher-Volume Cars Get Carbon Fiber,” David Sedgwick, Crain Communications, March 18, 2013, accessed January 26, 2014, http://www.autonews.com/article/20130318/OEM01/303189995#axzz2rWr63t13. 29 “BMW i3, the Inside Story: What It’s Made of, How It’s Made,” SAE International, May 9, 2013, accessed January 26, 2014, http://articles.sae.org/12056/. 30 “BMW Reportedly Has Serious Plans to Introduce a Full Carbon Fiber Wheel Within the Next 24 Months,” Adrian Padeanu, BMW, February 21, 2014, accessed February 14, 2014, http://www.worldcarfans.com/ 114022170622/bmw-launching-full-carbon-fiber-wheel-within-next-two-years. 31 “CFRP Automotive Market Revving Up…But Still in Second Gear,” Composites Forecasts and Consulting, LLC, accessed November 12, 2013, http://compositesforecasts.com/automotive-market-revving-upbut-still-in-second-gear/ 32 Ibid.
http://www.worldcarfans.com/114022170622/bmw-launching-full-carbon-fiber-wheel-within-next-two-years
48
Table 4-1. Annual Forecasted Carbon Fiber Demand by the Automotive Industry (tonnes)
Source 2012 2013 2014 2015 2016 2017 2018 2019 2020 2021 2022 CAGR 2012–2018
Red and Zimm (2012) 2,700 3,000 3,600 4,000 4,250 4,600 5,000 5,300 5,600 5,900 6,200 10.8%
(Industry Experts (2013) 2,150 2,730 3,560 4,740 6,410 8,740 11,980 16,500 22,620 33.2%
Lucintel (2012) 4,808 5,399 12,610 17.4%
Average 3,219 3,710 9,863 20.5%
Figure 4-1. Annual forecasted carbon fiber demand by the automotive industry
0
5,000
10,000
15,000
20,000
25,00020
12
2013
2014
2015
2016
2017
2018
2019
2020
2021
2022
Tonn
es o
f Car
bon
Fibe
r
Year
Red and Zimm 2012
Industry Experts 2013
Lucintel 2012
Average
49
point among the three sources, CF demand is estimated to range from 5,000 tonnes to 12,610 tonnes. Empty cells in Table 4-1 indicate a year for which a forecast was not given by the respective source. The latest projected automotive CF demand is more optimistic than earlier estimates; it projects automotive demand of 38,000 tonnes, or ~25% of the total projected demand of 150,000 tonnes, in 2020 (Red 2015). Even the most conservative estimate forecasts a double-digit CAGR for the 20122018 period. Average demand values are given in the last row of Table 4-2 for the three years (i.e., 2012, 2013, and 2018) where all three forecasts have provided an estimate. The average forecasted demand for 2018 is 9,863 tonnes with an average CAGR of 20.5% for 2012–2018 versus only about 10%–12% for the CF industry as a whole. The data in Table 4-1 are plotted as a time series chart in Figure 4-1 indicating the differences among various forecasts increasing in the future as one would expect.
Industry Experts (2013) provides a forecast of regional distribution of CF demand by the automotive industry (Figure 4-2). Europe, the manufacturing site for most of the world’s supercars, including the BMW i3, is estimated to be the leading region for automotive CF demand in 2012 and 2020. In fact, Europe’s share of demand is forecast to increase from 56% in 2012 to 62% in 2020. North America is the second leading region, having about 26% share of total demand in both 2012 and 2020.
Figure 4-2. Regional forecasted carbon fiber demand by the automotive industry
550
5,960
1,200
14,100
290
1,970
80 41030 1800
2,000
4,000
6,000
8,000
10,000
12,000
14,000
16,000
2012 2020
Tonn
es
Carbon Fiber Demand for Automotive Applications by Region
North America
Europe
Japan
Asia
ROW
50
Figure 4-3. Regional forecasted carbon fiber reinforced polymer demand by the automotive
industry
The forecasted regional demand for automotive CFRP from Industry Experts (2013), shown in Figure 4-3, follows nearly the same distribution as the regional demand for automotive CF. The implication is that CFRP manufacturing and automobile assembly appear to locate within the same region. While it is conceivable that CFRP manufacture could take place in one region and automobile assembly in another, this does not appear to be the prevailing trend. As with the CF case, Europe is the forecasted leader for automotive CFRP demand at 52% and 58% in 2012 and 2018, respectively. Similarly, North America is forecast to be second in terms of demand at 29% and 30% during the same time periods. Total automotive CFRP demand is estimated to be 3,150 tonnes and 33,080 tonnes in 2012 and 2020, respectively. For these years, the corresponding CF demand (as can be seen in Table 4-2) is about 68% of CFRP demand, which is a typical CF mass percentage in CFRP.
Many of the leading CF applications, such as aerospace and sporting goods are relatively tolerant of high CF prices. However, the automotive industry is very sensitive to the price of CF, and high cost is seen as a major factor limiting widespread adoption (Lucintel 2012). For this reason, the automotive industry seeks the least expensive types of CF that are able to meet CFRP performance requirements. The lowest-cost commercially available fibers meeting these requirements are large tow (defined as more than 24,000 filaments per tow) textile-grade carbon fibers. Year 2020 forecasts for regional large-tow manufacturing capacity from Red and Zimm (2012) are listed in Table 4-2, and they are compared with the regional automotive CF demand forecasts in Figure 4-2 as sourced from Industry Experts (2013). The forecasted global large-tow manufacturing capacity is well in excess of demand in each region. However, other applications (wind, civil, oil and gas) demand significant amounts of large-tow CF as well. For example, Industry Experts (2013) forecasts a demand of 36,350 tonnes of CF by the wind industry in 2020. While not all of the wind demand will be large tow, it is clear that a supply constraint could develop if the large-tow manufacturing capacity forecast of 37,008 tonnes in Red and Zimm (2012) is realized.
920
9,940
1,650
19,340
420
2,910
120 62040 2700
5,000
10,000
15,000
20,000
25,000
2012 2020
Tonn
es
Carbon Fiber Reinforced Polymer Demand for Automotive Applications by Region
North America
Europe
Japan
Asia
ROW
51
Table 4-2. 2020 Forecasted Regional Carbon Fiber Demand by the Automotive Industry and Regional Large-Tow Manufacturing Capacity
Region 2020 Large-Tow Manufacturing Capacity (Tonnes)
2020 Automotive Carbon Fiber Demand (Tonnes)
2020 Excess Large-Tow Manufacturing Capacity (Tonnes)
North America 6,661 5,960 +701
Europe 18,134 14,100 +4,034
Asia (Japan and China) 7,032 2,380 +4,652
Rest of the world 5,181 180 +5,001
Total 37,008 22,620 +14,388
4.2 Price and Value As mentioned previously, the automotive industry is very sensitive to the price of CF, making large-tow, textile-grade CF the most cost-effective choice. Two companies, SGL (headquartered in Germany) and Zoltek (headquartered in the United States, but recently acquired by Japan-based Toray) are the leading manufacturers of large-tow CF. SGL’s Sigrafil C large-tow fiber sells in the $8/lb–$11/lb range, while Zoltek’s Panex 33 large-tow fiber sells in the $7/lb–$11/lb range (Lucintel 2012). Using the Lucintel-based price ranges between 2012 and 2018 and its forecasted 2012 and 2018 automotive CF demand as listed in Table 4-1, it is possible to develop an estimate of the value of automotive CF market. This estimate and the market value estimate provided by Industry Experts (2013) are listed in Table 4-3. It should be noted that large tow is not the only fiber type used by the automotive industry. For example, Formula One and supercars often use higher performance small tow, causing the Lucintel-based market value in Table 4-3 to be a slight underestimate. However, as seen in Table 4-3, the market value estimates from the two sources are generally in good agreement. The (Industry Experts (2013) automotive CF market value estimate for 2012 is $61 million, which is slightly below the lower bound of the Lucintel-based estimate of $74 million. For the year 2018, the latest year with a common data point between the two sources, the Industry Experts (2013) estimate is near the middle of the range of the estimate developed based on Lucintel (2012). The implied price of automotive CF in Industry Experts (2013) is generally higher than the prices based on Lucintel (2012), but it is reasonable as this captures the fact that not all automotive CF is large tow.
Table 4-3. Automotive Carbon Fiber Market Value Estimates
Source Lucintel (2012) Industry Experts (2013)
Year Automotive CF Price Range ($/kg)
Automotive CF Demand (kg)
Value of Automotive CF Market ($M)
Value of Automotive CF Market ($M)
Implied Average Automotive CF Price ($/kg)
2012 $15.40–$24.20 4,808,000 $74–$117 $61 $28.37
2018 $15.40–$24.20 12,610,000 $194–$306 $270 $22.54
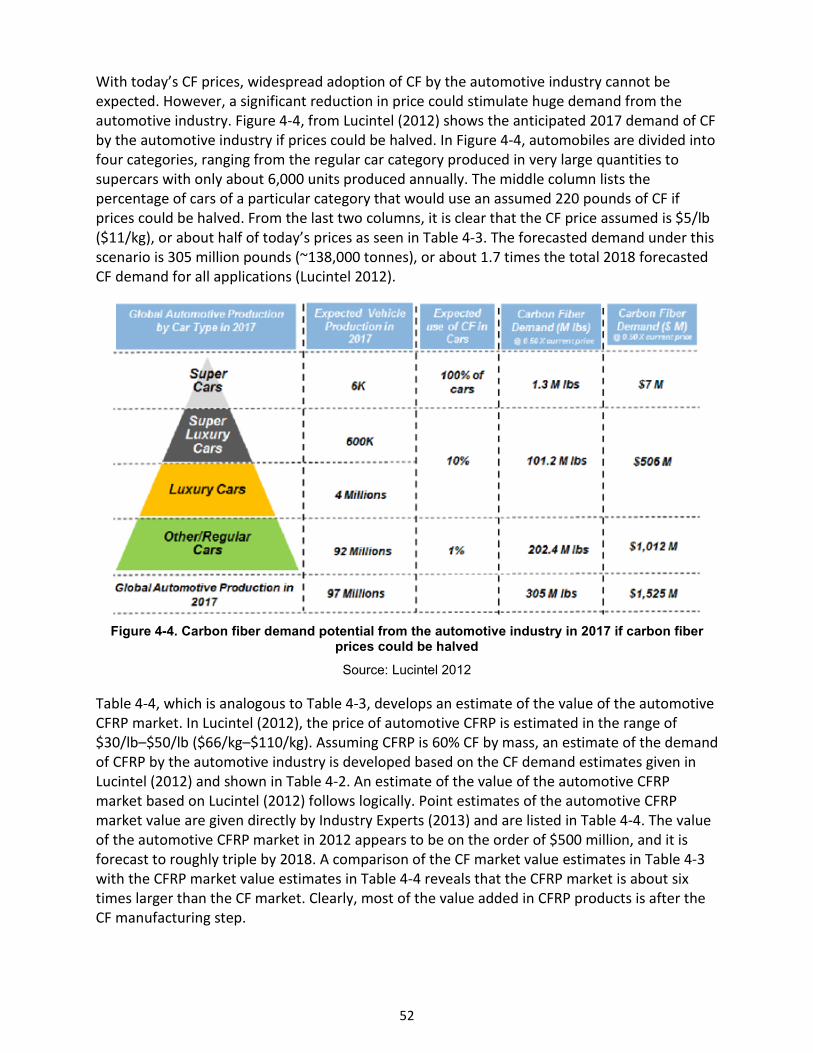
52
With today’s CF prices, widespread adoption of CF by the automotive industry cannot be expected. However, a significant reduction in price could stimulate huge demand from the automotive industry. Figure 4-4, from Lucintel (2012) shows the anticipated 2017 demand of CF by the automotive industry if prices could be halved. In Figure 4-4, automobiles are divided into four categories, ranging from the regular car category produced in very large quantities to supercars with only about 6,000 units produced annually. The middle column lists the percentage of cars of a particular category that would use an assumed 220 pounds of CF if prices could be halved. From the last two columns, it is clear that the CF price assumed is $5/lb ($11/kg), or about half of today’s prices as seen in Table 4-3. The forecasted demand under this scenario is 305 million pounds (~138,000 tonnes), or about 1.7 times the total 2018 forecasted CF demand for all applications (Lucintel 2012).
Figure 4-4. Carbon fiber demand potential from the automotive industry in 2017 if carbon fiber
prices could be halved
Source: Lucintel 2012
Table 4-4, which is analogous to Table 4-3, develops an estimate of the value of the automotive CFRP market. In Lucintel (2012), the price of automotive CFRP is estimated in the range of $30/lb–$50/lb ($66/kg–$110/kg). Assuming CFRP is 60% CF by mass, an estimate of the demand of CFRP by the automotive industry is developed based on the CF demand estimates given in Lucintel (2012) and shown in Table 4-2. An estimate of the value of the automotive CFRP market based on Lucintel (2012) follows logically. Point estimates of the automotive CFRP market value are given directly by Industry Experts (2013) and are listed in Table 4-4. The value of the automotive CFRP market in 2012 appears to be on the order of $500 million, and it is forecast to roughly triple by 2018. A comparison of the CF market value estimates in Table 4-3 with the CFRP market value estimates in Table 4-4 reveals that the CFRP market is about six times larger than the CF market. Clearly, most of the value added in CFRP products is after the CF manufacturing step.
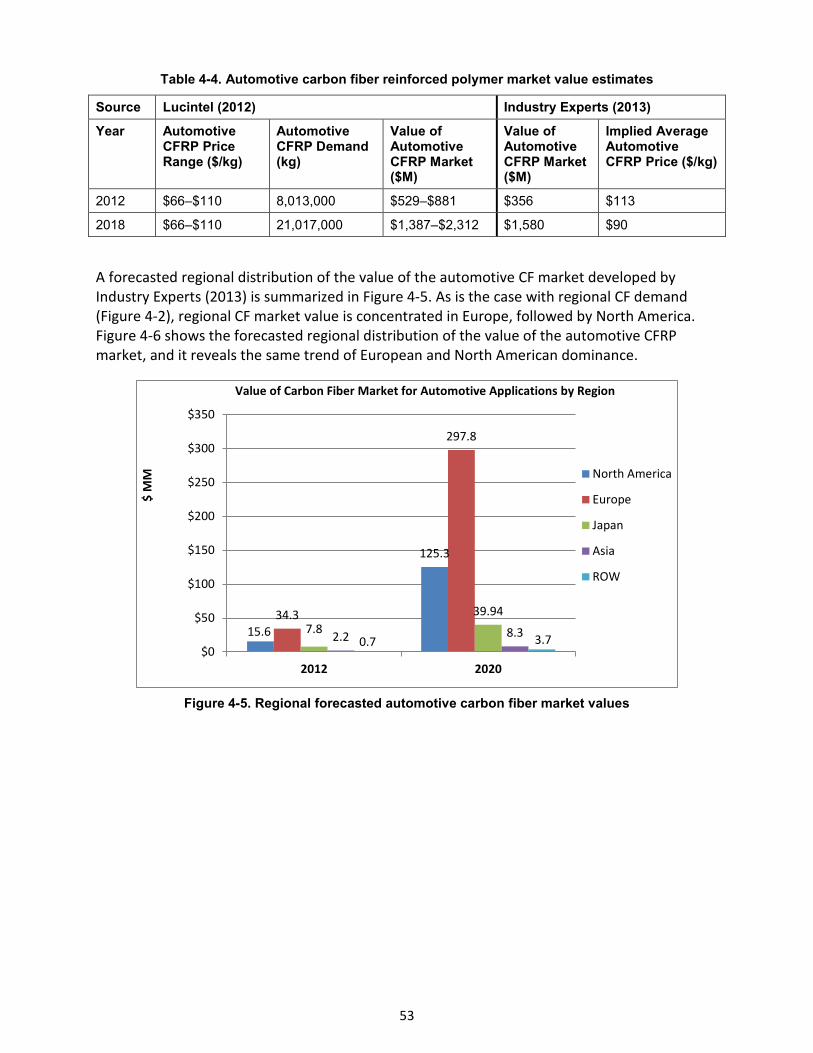
53
Table 4-4. Automotive carbon fiber reinforced polymer market value estimates
Source Lucintel (2012) Industry Experts (2013)
Year Automotive CFRP Price Range ($/kg)
Automotive CFRP Demand (kg)
Value of Automotive CFRP Market ($M)
Value of Automotive CFRP Market ($M)
Implied Average Automotive CFRP Price ($/kg)
2012 $66–$110 8,013,000 $529–$881 $356 $113
2018 $66–$110 21,017,000 $1,387–$2,312 $1,580 $90
A forecasted regional distribution of the value of the automotive CF market developed by Industry Experts (2013) is summarized in Figure 4-5. As is the case with regional CF demand (Figure 4-2), regional CF market value is concentrated in Europe, followed by North America. Figure 4-6 shows the forecasted regional distribution of the value of the automotive CFRP market, and it reveals the same trend of European and North American dominance.
Figure 4-5. Regional forecasted automotive carbon fiber market values
15.6
125.3
34.3
297.8
7.839.94
2.2 8.30.7 3.7
$0
$50
$100
$150
$200
$250
$300
$350
2012 2020
$ M
M
Value of Carbon Fiber Market for Automotive Applications by Region
North America
Europe
Japan
Asia
ROW
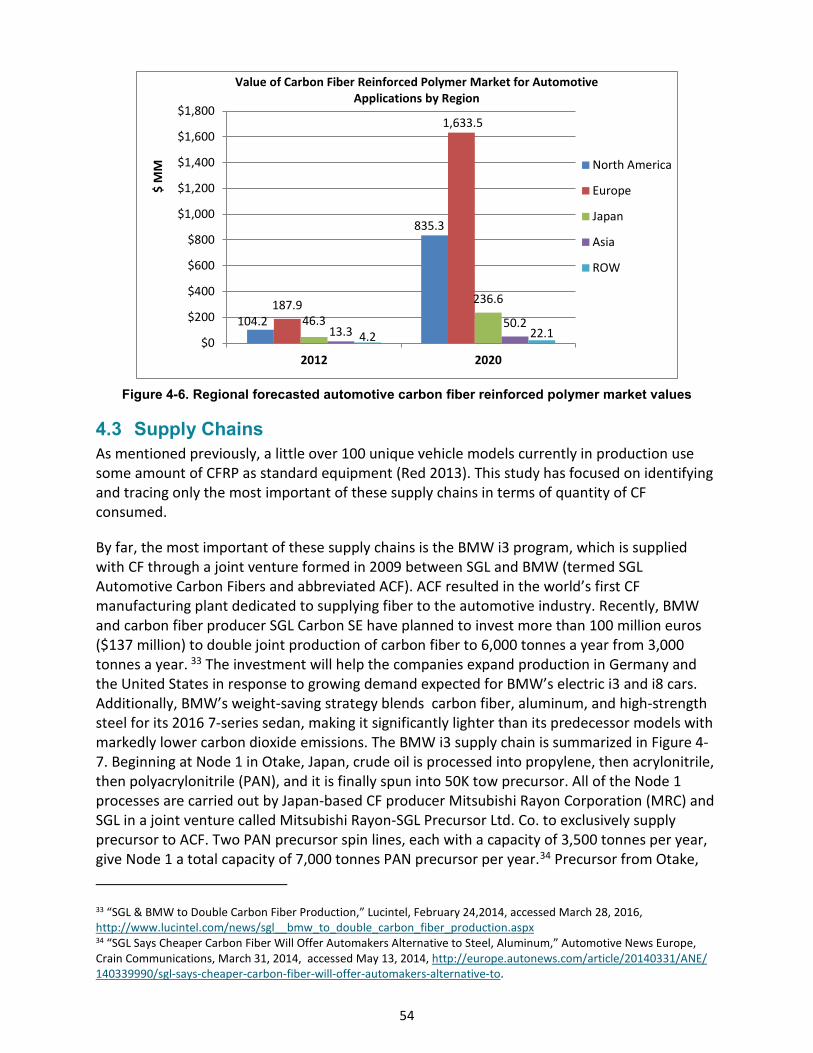
54
Figure 4-6. Regional forecasted automotive carbon fiber reinforced polymer market values
4.3 Supply Chains As mentioned previously, a little over 100 unique vehicle models currently in production use some amount of CFRP as standard equipment (Red 2013). This study has focused on identifying and tracing only the most important of these supply chains in terms of quantity of CF consumed.
By far, the most important of these supply chains is the BMW i3 program, which is supplied with CF through a joint venture formed in 2009 between SGL and BMW (termed SGL Automotive Carbon Fibers and abbreviated ACF). ACF resulted in the world’s first CF manufacturing plant dedicated to supplying fiber to the automotive industry. Recently, BMW and carbon fiber producer SGL Carbon SE have planned to invest more than 100 million euros ($137 million) to double joint production of carbon fiber to 6,000 tonnes a year from 3,000 tonnes a year. 33 The investment will help the companies expand production in Germany and the United States in response to growing demand expected for BMW’s electric i3 and i8 cars. Additionally, BMW’s weight-saving strategy blends carbon fiber, aluminum, and high-strength steel for its 2016 7-series sedan, making it significantly lighter than its predecessor models with markedly lower carbon dioxide emissions. The BMW i3 supply chain is summarized in Figure 4-7. Beginning at Node 1 in Otake, Japan, crude oil is processed into propylene, then acrylonitrile,then polyacrylonitrile (PAN), and it is finally spun into 50K tow precursor. All of the Node 1processes are carried out by Japan-based CF producer Mitsubishi Rayon Corporation (MRC) andSGL in a joint venture called Mitsubishi Rayon-SGL Precursor Ltd. Co. to exclusively supplyprecursor to ACF. Two PAN precursor spin lines, each with a capacity of 3,500 tonnes per year,give Node 1 a total capacity of 7,000 tonnes PAN precursor per year.34 Precursor from Otake,
33 “SGL & BMW to Double Carbon Fiber Production,” Lucintel, February 24,2014, accessed March 28, 2016, http://www.lucintel.com/news/sgl__bmw_to_double_carbon_fiber_production.aspx 34 “SGL Says Cheaper Carbon Fiber Will Offer Automakers Alternative to Steel, Aluminum,” Automotive News Europe, Crain Communications, March 31, 2014, accessed May 13, 2014, http://europe.autonews.com/article/20140331/ANE/ 140339990/sgl-says-cheaper-carbon-fiber-will-offer-automakers-alternative-to.
104.2
835.3
187.9
1,633.5
46.3
236.6
13.350.2
4.2 22.1$0
$200
$400
$600
$800
$1,000
$1,200
$1,400
$1,600
$1,800
2012 2020
$ M
M
Value of Carbon Fiber Reinforced Polymer Market for Automotive Applications by Region
North America
Europe
Japan
Asia
ROW
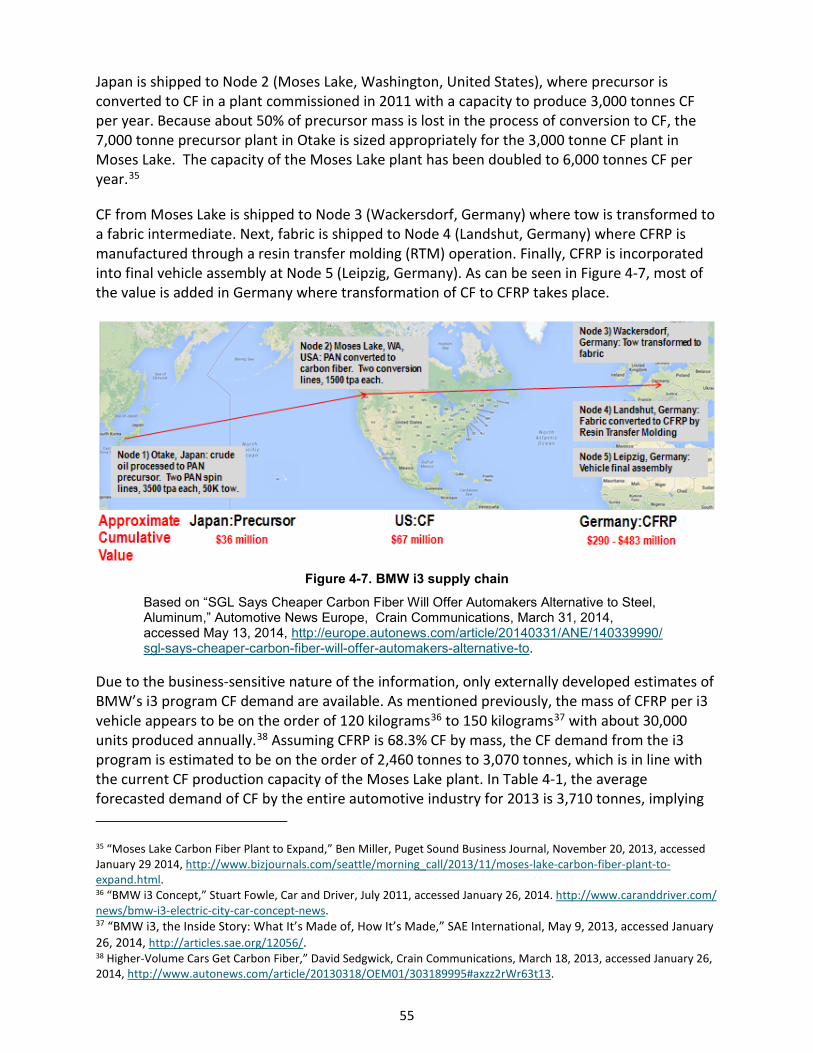
55
Japan is shipped to Node 2 (Moses Lake, Washington, United States), where precursor is converted to CF in a plant commissioned in 2011 with a capacity to produce 3,000 tonnes CF per year. Because about 50% of precursor mass is lost in the process of conversion to CF, the 7,000 tonne precursor plant in Otake is sized appropriately for the 3,000 tonne CF plant in Moses Lake. The capacity of the Moses Lake plant has been doubled to 6,000 tonnes CF per year.35
CF from Moses Lake is shipped to Node 3 (Wackersdorf, Germany) where tow is transformed to a fabric intermediate. Next, fabric is shipped to Node 4 (Landshut, Germany) where CFRP is manufactured through a resin transfer molding (RTM) operation. Finally, CFRP is incorporated into final vehicle assembly at Node 5 (Leipzig, Germany). As can be seen in Figure 4-7, most of the value is added in Germany where transformation of CF to CFRP takes place.
Figure 4-7. BMW i3 supply chain
Based on “SGL Says Cheaper Carbon Fiber Will Offer Automakers Alternative to Steel, Aluminum,” Automotive News Europe, Crain Communications, March 31, 2014, accessed May 13, 2014, http://europe.autonews.com/article/20140331/ANE/140339990/ sgl-says-cheaper-carbon-fiber-will-offer-automakers-alternative-to.
Due to the business-sensitive nature of the information, only externally developed estimates of BMW’s i3 program CF demand are available. As mentioned previously, the mass of CFRP per i3 vehicle appears to be on the order of 120 kilograms36 to 150 kilograms37 with about 30,000 units produced annually.38 Assuming CFRP is 68.3% CF by mass, the CF demand from the i3 program is estimated to be on the order of 2,460 tonnes to 3,070 tonnes, which is in line with the current CF production capacity of the Moses Lake plant. In Table 4-1, the average forecasted demand of CF by the entire automotive industry for 2013 is 3,710 tonnes, implying
35 “Moses Lake Carbon Fiber Plant to Expand,” Ben Miller, Puget Sound Business Journal, November 20, 2013, accessed January 29 2014, http://www.bizjournals.com/seattle/morning_call/2013/11/moses-lake-carbon-fiber-plant-to-expand.html. 36 “BMW i3 Concept,” Stuart Fowle, Car and Driver, July 2011, accessed January 26, 2014. http://www.caranddriver.com/ news/bmw-i3-electric-city-car-concept-news. 37 “BMW i3, the Inside Story: What It’s Made of, How It’s Made,” SAE International, May 9, 2013, accessed January 26, 2014, http://articles.sae.org/12056/. 38 Higher-Volume Cars Get Carbon Fiber,” David Sedgwick, Crain Communications, March 18, 2013, accessed January 26, 2014, http://www.autonews.com/article/20130318/OEM01/303189995#axzz2rWr63t13.
http://www.bizjournals.com/seattle/morning_call/2013/11/moses-lake-carbon-fiber-plant-to-expand.html
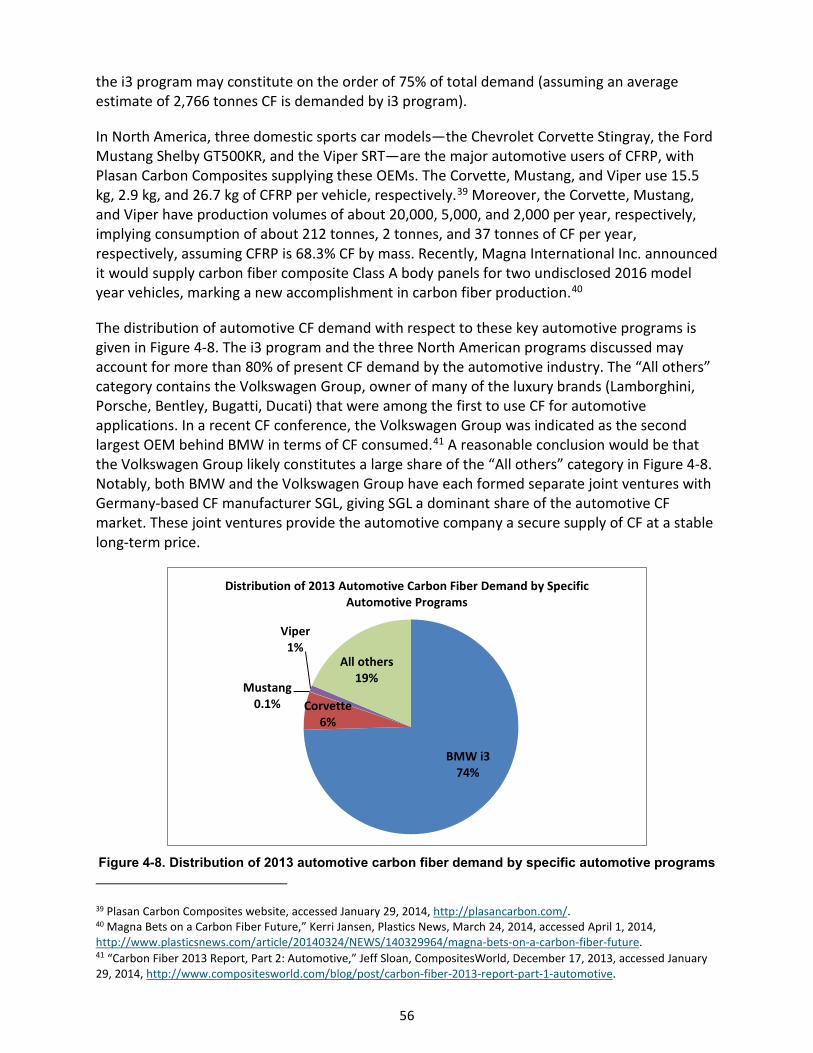
56
the i3 program may constitute on the order of 75% of total demand (assuming an average estimate of 2,766 tonnes CF is demanded by i3 program).
In North America, three domestic sports car models—the Chevrolet Corvette Stingray, the Ford Mustang Shelby GT500KR, and the Viper SRT—are the major automotive users of CFRP, with Plasan Carbon Composites supplying these OEMs. The Corvette, Mustang, and Viper use 15.5 kg, 2.9 kg, and 26.7 kg of CFRP per vehicle, respectively.39 Moreover, the Corvette, Mustang, and Viper have production volumes of about 20,000, 5,000, and 2,000 per year, respectively, implying consumption of about 212 tonnes, 2 tonnes, and 37 tonnes of CF per year, respectively, assuming CFRP is 68.3% CF by mass. Recently, Magna International Inc. announced it would supply carbon fiber composite Class A body panels for two undisclosed 2016 model year vehicles, marking a new accomplishment in carbon fiber production.40
The distribution of automotive CF demand with respect to these key automotive programs is given in Figure 4-8. The i3 program and the three North American programs discussed may account for more than 80% of present CF demand by the automotive industry. The “All others” category contains the Volkswagen Group, owner of many of the luxury brands (Lamborghini, Porsche, Bentley, Bugatti, Ducati) that were among the first to use CF for automotive applications. In a recent CF conference, the Volkswagen Group was indicated as the second largest OEM behind BMW in terms of CF consumed.41 A reasonable conclusion would be that the Volkswagen Group likely constitutes a large share of the “All others” category in Figure 4-8. Notably, both BMW and the Volkswagen Group have each formed separate joint ventures with Germany-based CF manufacturer SGL, giving SGL a dominant share of the automotive CF market. These joint ventures provide the automotive company a secure supply of CF at a stable long-term price.
Figure 4-8. Distribution of 2013 automotive carbon fiber demand by specific automotive programs
39 Plasan Carbon Composites website, accessed January 29, 2014, http://plasancarbon.com/. 40 Magna Bets on a Carbon Fiber Future,” Kerri Jansen, Plastics News, March 24, 2014, accessed April 1, 2014, http://www.plasticsnews.com/article/20140324/NEWS/140329964/magna-bets-on-a-carbon-fiber-future. 41 “Carbon Fiber 2013 Report, Part 2: Automotive,” Jeff Sloan, CompositesWorld, December 17, 2013, accessed January 29, 2014, http://www.compositesworld.com/blog/post/carbon-fiber-2013-report-part-1-automotive.
BMW i374%
Corvette6%
Mustang0.1%
Viper1%
All others19%
Distribution of 2013 Automotive Carbon Fiber Demand by Specific Automotive Programs
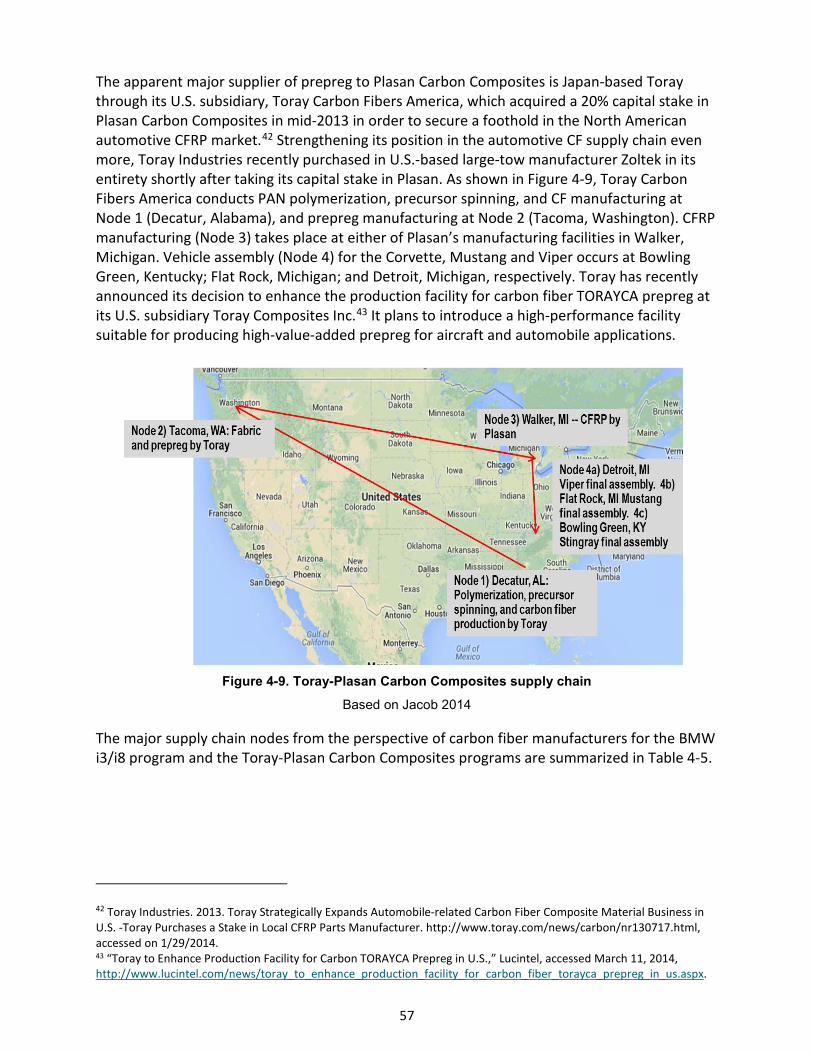
57
The apparent major supplier of prepreg to Plasan Carbon Composites is Japan-based Toray through its U.S. subsidiary, Toray Carbon Fibers America, which acquired a 20% capital stake in Plasan Carbon Composites in mid-2013 in order to secure a foothold in the North American automotive CFRP market.42 Strengthening its position in the automotive CF supply chain even more, Toray Industries recently purchased in U.S.-based large-tow manufacturer Zoltek in its entirety shortly after taking its capital stake in Plasan. As shown in Figure 4-9, Toray Carbon Fibers America conducts PAN polymerization, precursor spinning, and CF manufacturing at Node 1 (Decatur, Alabama), and prepreg manufacturing at Node 2 (Tacoma, Washington). CFRP manufacturing (Node 3) takes place at either of Plasan’s manufacturing facilities in Walker, Michigan. Vehicle assembly (Node 4) for the Corvette, Mustang and Viper occurs at Bowling Green, Kentucky; Flat Rock, Michigan; and Detroit, Michigan, respectively. Toray has recently announced its decision to enhance the production facility for carbon fiber TORAYCA prepreg at its U.S. subsidiary Toray Composites Inc.43 It plans to introduce a high-performance facility suitable for producing high-value-added prepreg for aircraft and automobile applications.
Figure 4-9. Toray-Plasan Carbon Composites supply chain
Based on Jacob 2014
The major supply chain nodes from the perspective of carbon fiber manufacturers for the BMW i3/i8 program and the Toray-Plasan Carbon Composites programs are summarized in Table 4-5.
42 Toray Industries. 2013. Toray Strategically Expands Automobile-related Carbon Fiber Composite Material Business in U.S. -Toray Purchases a Stake in Local CFRP Parts Manufacturer. http://www.toray.com/news/carbon/nr130717.html, accessed on 1/29/2014. 43 “Toray to Enhance Production Facility for Carbon TORAYCA Prepreg in U.S.,” Lucintel, accessed March 11, 2014, http://www.lucintel.com/news/toray_to_enhance_production_facility_for_carbon_fiber_torayca_prepreg_in_us.aspx.
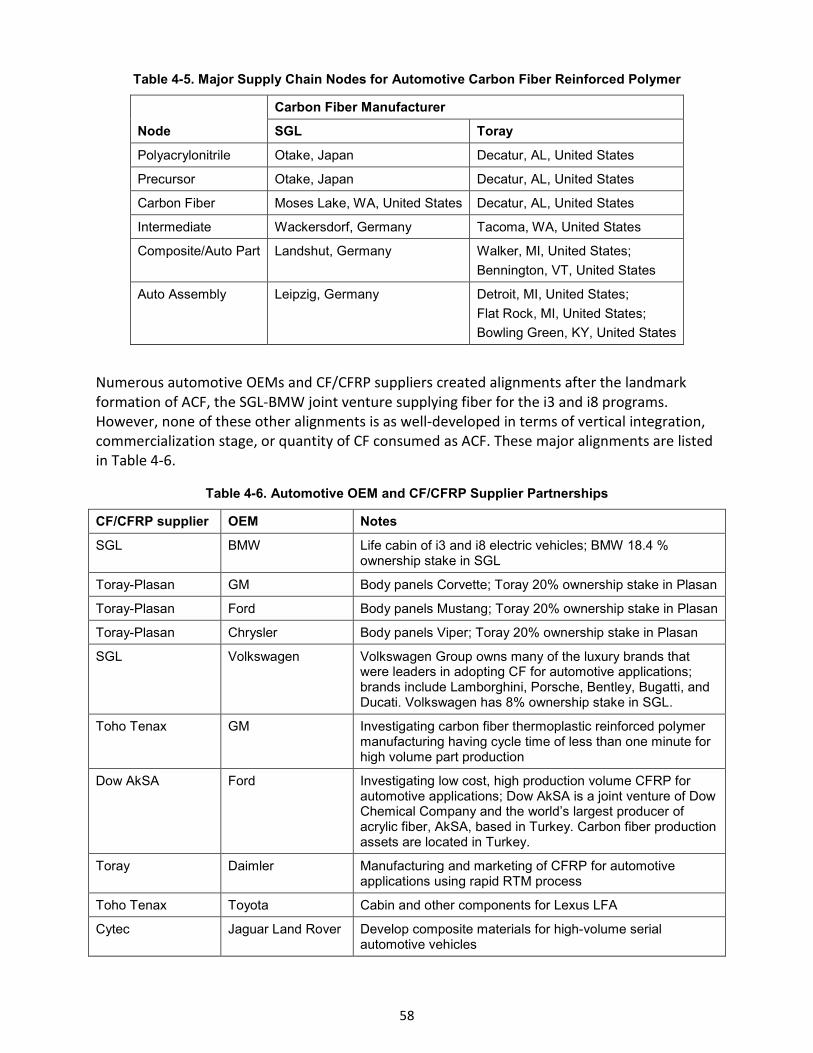
58
Table 4-5. Major Supply Chain Nodes for Automotive Carbon Fiber Reinforced Polymer
Node Carbon Fiber Manufacturer
SGL Toray
Polyacrylonitrile Otake, Japan Decatur, AL, United States
Precursor Otake, Japan Decatur, AL, United States
Carbon Fiber Moses Lake, WA, United States Decatur, AL, United States
Intermediate Wackersdorf, Germany Tacoma, WA, United States
Composite/Auto Part Landshut, Germany Walker, MI, United States; Bennington, VT, United States
Auto Assembly Leipzig, Germany Detroit, MI, United States; Flat Rock, MI, United States; Bowling Green, KY, United States
Numerous automotive OEMs and CF/CFRP suppliers created alignments after the landmark formation of ACF, the SGL-BMW joint venture supplying fiber for the i3 and i8 programs. However, none of these other alignments is as well-developed in terms of vertical integration, commercialization stage, or quantity of CF consumed as ACF. These major alignments are listed in Table 4-6.
Table 4-6. Automotive OEM and CF/CFRP Supplier Partnerships
CF/CFRP supplier OEM Notes
SGL BMW Life cabin of i3 and i8 electric vehicles; BMW 18.4 % ownership stake in SGL
Toray-Plasan GM Body panels Corvette; Toray 20% ownership stake in Plasan
Toray-Plasan Ford Body panels Mustang; Toray 20% ownership stake in Plasan
Toray-Plasan Chrysler Body panels Viper; Toray 20% ownership stake in Plasan
SGL Volkswagen Volkswagen Group owns many of the luxury brands that were leaders in adopting CF for automotive applications; brands include Lamborghini, Porsche, Bentley, Bugatti, and Ducati. Volkswagen has 8% ownership stake in SGL.
Toho Tenax GM Investigating carbon fiber thermoplastic reinforced polymer manufacturing having cycle time of less than one minute for high volume part production
Dow AkSA Ford Investigating low cost, high production volume CFRP for automotive applications; Dow AkSA is a joint venture of Dow Chemical Company and the world’s largest producer of acrylic fiber, AkSA, based in Turkey. Carbon fiber production assets are located in Turkey.
Toray Daimler Manufacturing and marketing of CFRP for automotive applications using rapid RTM process
Toho Tenax Toyota Cabin and other components for Lexus LFA
Cytec Jaguar Land Rover Develop composite materials for high-volume serial automotive vehicles
59
Due to its dominant share of global automotive CF demand, ACF is examined in detail to understand drivers of manufacturing locations and partnerships. The following is a list of factors given by the Managing Director of ACF (Wuellner 2011), with supporting data from other sources:
• BMW sought a -carbon supply chain to complement its low-carbon emissions electricvehicles, i3 and i8Moses Lake plant hydropower, Leipzig plant wind power;
• BMW partnered with SGL to secure long term production capacity, have costtransparency and influence on cost, and capitalize on SGL’s competence in fibers andfabrics;
• Moses Lake provides reliable, very low-cost, electricity—reported to be $0.03 perkilowatt-hour44;
• The Moses Lake site has a desert-like climate with a low risk of natural disasters and nolanguage barriers—other SGL CF facilities in English-speaking locations (e.g., Wyomingand United Kingdom)
• A business friendly environment exists at Moses Lake with support from state, county,and city—$4 million in tax incentives from state and local governments; $1.5 millionloan and $0.5 million grant by Community Economic Revitalization Board to Port ofMoses Lake for power supply substation; state funds for energy conservation and wasterecycling equipment; state funds for worker training; sales tax exemption on someequipment; sales tax deferral on construction45;
• Wackersdorf fabrics manufacturing site chosen for access to already existing plantinfrastructure allowing short (three-month) setup. Additionally, the Wackersdorf sitehas excellent highway and railroad access, proximity to BMW technology anddevelopment centers, a qualified workforce, and a supportive government.
4.4 Manufacturing In the automotive industry, several CFRP manufacturing pathways are used or under consideration:
• Filament Winding—CF tow is passed through a resin bath and then wound undertension around a rotating mandrel, usually into a cylindrical shape such as a driveshaft.Filament winding is highly automated and does not require an expensive intermediateproduct form such as a fabric or prepreg. However, filament winding is limited to partshaving cylindrical or near cylindrical shapes.
• Autoclave Molding—Unidirectional or bidirectional fabric prepreg is laid up in thedesired part configuration and then cured with heat and pressure in an autoclave.Autoclave molded parts have low porosity, a smooth paintable surface, and excellent
44 “BMW Makes Lone Shift to Carbon Fiber to Gain Auto Edge,” Chris Reiter, Bloomberg, November 15, 2013, accessed January 31, 2014, http://www.bloomberg.com/news/2013-11-14/bmw-makes-lone-shift-to-carbon-fiber-to-gain-auto-edge.html. 45 “Hydropower Draws BMW Carbon Fiber Factory to Washington,” Eric Pryne, The Seattle Times Company, April 6, 2010, accessed January 31, 2014, http://seattletimes.com/html/businesstechnology/ 2011539444_moseslake07.html.
http://www.bloomberg.com/news/2013-11-14/bmw-makes-lone-shift-to-carbon-fiber-to-gain-auto-edge.html
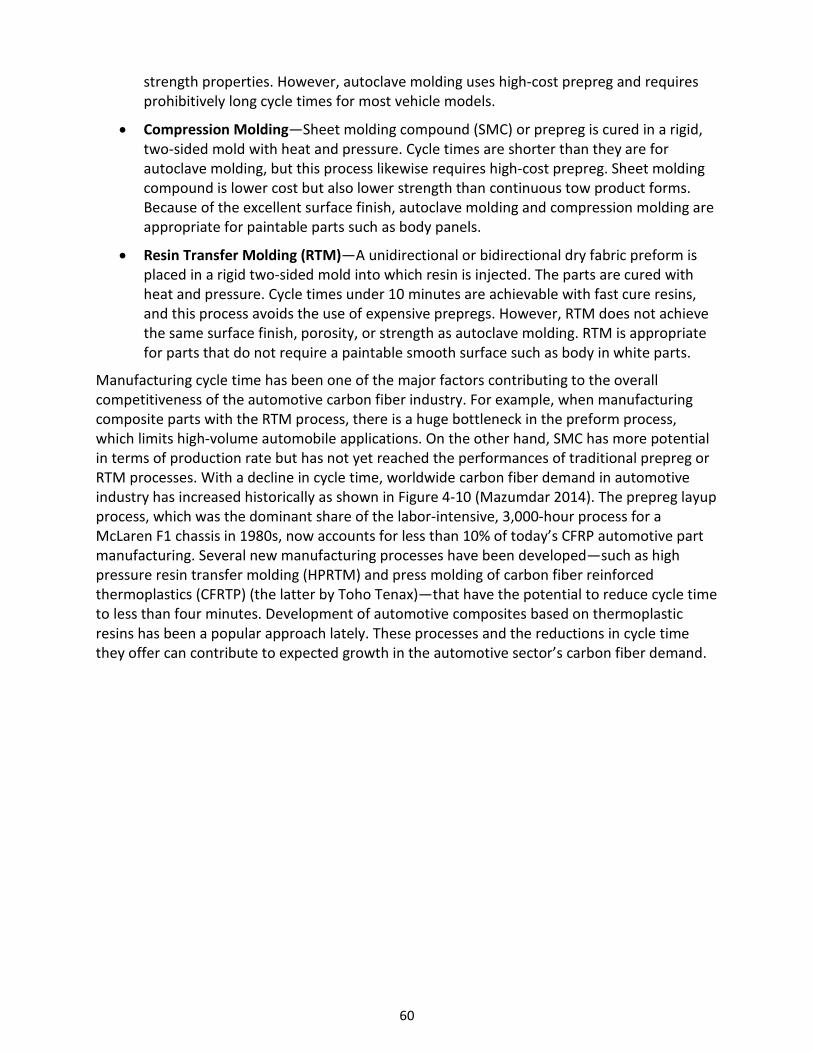
60
strength properties. However, autoclave molding uses high-cost prepreg and requires prohibitively long cycle times for most vehicle models.
• Compression Molding—Sheet molding compound (SMC) or prepreg is cured in a rigid,two-sided mold with heat and pressure. Cycle times are shorter than they are forautoclave molding, but this process likewise requires high-cost prepreg. Sheet moldingcompound is lower cost but also lower strength than continuous tow product forms.Because of the excellent surface finish, autoclave molding and compression molding areappropriate for paintable parts such as body panels.
• Resin Transfer Molding (RTM)—A unidirectional or bidirectional dry fabric preform isplaced in a rigid two-sided mold into which resin is injected. The parts are cured withheat and pressure. Cycle times under 10 minutes are achievable with fast cure resins,and this process avoids the use of expensive prepregs. However, RTM does not achievethe same surface finish, porosity, or strength as autoclave molding. RTM is appropriatefor parts that do not require a paintable smooth surface such as body in white parts.
Manufacturing cycle time has been one of the major factors contributing to the overall competitiveness of the automotive carbon fiber industry. For example, when manufacturing composite parts with the RTM process, there is a huge bottleneck in the preform process, which limits high-volume automobile applications. On the other hand, SMC has more potential in terms of production rate but has not yet reached the performances of traditional prepreg or RTM processes. With a decline in cycle time, worldwide carbon fiber demand in automotive industry has increased historically as shown in Figure 4-10 (Mazumdar 2014). The prepreg layup process, which was the dominant share of the labor-intensive, 3,000-hour process for a McLaren F1 chassis in 1980s, now accounts for less than 10% of today’s CFRP automotive part manufacturing. Several new manufacturing processes have been developed—such as high pressure resin transfer molding (HPRTM) and press molding of carbon fiber reinforced thermoplastics (CFRTP) (the latter by Toho Tenax)—that have the potential to reduce cycle time to less than four minutes. Development of automotive composites based on thermoplastic resins has been a popular approach lately. These processes and the reductions in cycle time they offer can contribute to expected growth in the automotive sector’s carbon fiber demand.
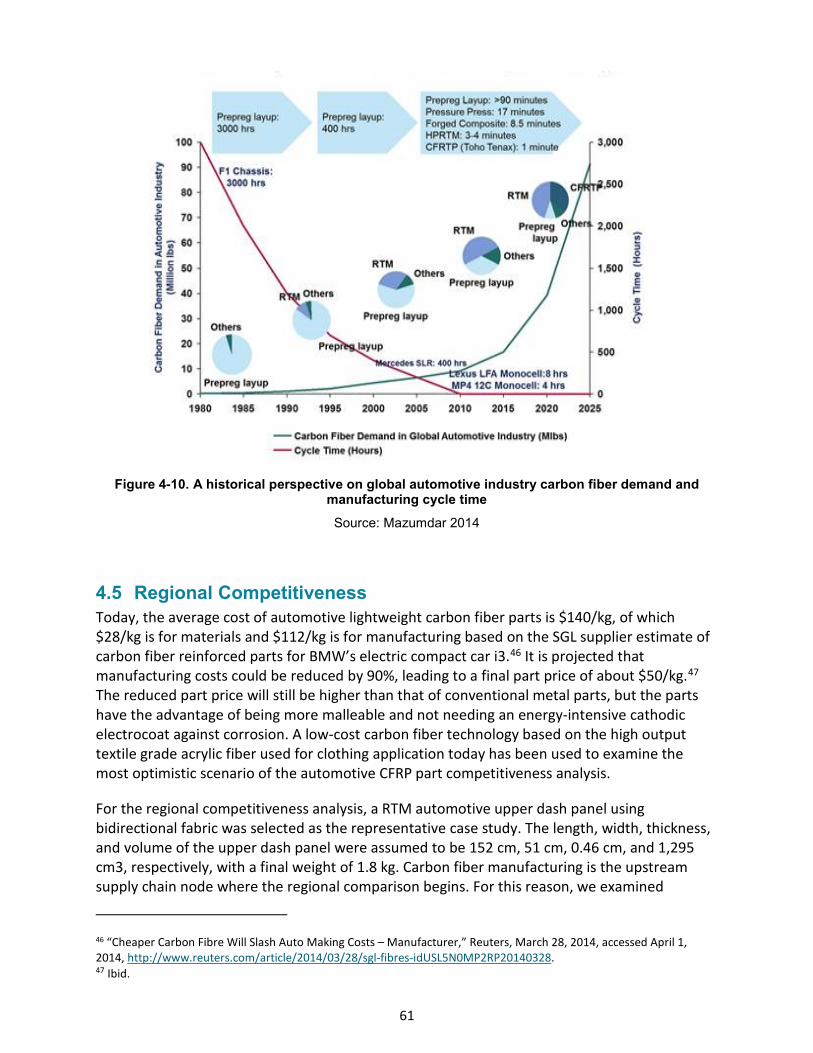
61
Figure 4-10. A historical perspective on global automotive industry carbon fiber demand and manufacturing cycle time
Source: Mazumdar 2014
4.5 Regional Competitiveness Today, the average cost of automotive lightweight carbon fiber parts is $140/kg, of which $28/kg is for materials and $112/kg is for manufacturing based on the SGL supplier estimate of carbon fiber reinforced parts for BMW’s electric compact car i3.46 It is projected that manufacturing costs could be reduced by 90%, leading to a final part price of about $50/kg.47 The reduced part price will still be higher than that of conventional metal parts, but the parts have the advantage of being more malleable and not needing an energy-intensive cathodic electrocoat against corrosion. A low-cost carbon fiber technology based on the high output textile grade acrylic fiber used for clothing application today has been used to examine the most optimistic scenario of the automotive CFRP part competitiveness analysis.
For the regional competitiveness analysis, a RTM automotive upper dash panel using bidirectional fabric was selected as the representative case study. The length, width, thickness, and volume of the upper dash panel were assumed to be 152 cm, 51 cm, 0.46 cm, and 1,295 cm3, respectively, with a final weight of 1.8 kg. Carbon fiber manufacturing is the upstream supply chain node where the regional comparison begins. For this reason, we examined
46 “Cheaper Carbon Fibre Will Slash Auto Making Costs – Manufacturer,” Reuters, March 28, 2014, accessed April 1, 2014, http://www.reuters.com/article/2014/03/28/sgl-fibres-idUSL5N0MP2RP20140328. 47 Ibid.
62
regional competitiveness for CF manufacturing, bidirectional fabric manufacturing, and RTM. Resin transfer molding was examined in the greatest detail (i.e., at the level of three major process steps: preform, mold, and trim) because CFRP manufacturing is the step where the most value is added. Transfer costs between supply chain nodes were considered including transport from the CFRP manufacturer to an automotive assembly plant. As CF manufacturing was the starting point for this analysis, we assumed a single global cost for PAN precursor. Competitiveness was examined using process-based cost modeling in spreadsheet software where unit costs were estimated for each process step at the level of the major cost components, such as materials, labor, cost of capital, and utilities. A template cost model developed by the National Renewable Energy Laboratory (NREL) for an earlier, similar competitiveness analyses for wind, solar, and battery technologies was populated with data by ORNL. Earlier work by ORNL in CF cost modeling (Das 2005; Das and Warren 2012), private conversations with industry and academia, literature (Das 2005; Verrey 2006), and vendor price quotes were the cost model data sources. In our analysis, the term “landed costs” refers to the total manufacturing cost plus shipping cost to deliver a manufactured product to the next supply chain node. Selling; general and administrative costs; and profit were not included to preserve resolution in the differences in regional costs. Shipping costs were based (1) on assumed 500 mile overland transfers at $0.18 per ton-mile and (2) for specific scenarios, overseas container shipping costs from several vendor quotes.
The five scenarios in Table 4-7 were examined. As seen in Figure 4-2, Europe and North America are the leading regions for automotive CF demand, and they are expected to retain or grow their market shares through 2020. Hence, four of the five scenarios entail CFRP manufacturing in these regions. Scenario UGG is representative of the supply chain flow for the prominent i3 program, while scenario UUU is representative of the Toray-Plasan Carbon Composites program. Scenario GGG was selected to quantify potential advantages that might be present in scenario UGG versus European-manufactured CF. Scenario JGG reflects Japan’s position as a world leader in CF production, while scenario CCC examines the competitiveness of low labor costs in China.
Table 4-7. Regional Competitiveness Scenarios for CFRP Automotive Applications
Scenario Name CF Fabric CFRP
UGG U.S. Germany Germany
UUU United States United States United States
GGG Germany Germany Germany
JGG Japan Germany Germany
CCC China China China
Figure 4-11 shows the estimated landed costs of CF at the factory gate of the bidirectional fabric manufacturer for the five scenarios described in Table 4-7. The UUU and CCC scenarios are the lowest cost and nearly the same at $15.65/kg and $15.62/kg, respectively. But, they are lower than today’s fiber cost due to lower precursor cost and economies of scale achieved through higher fiber throughput and plant capacity. Low electricity and capital costs in the
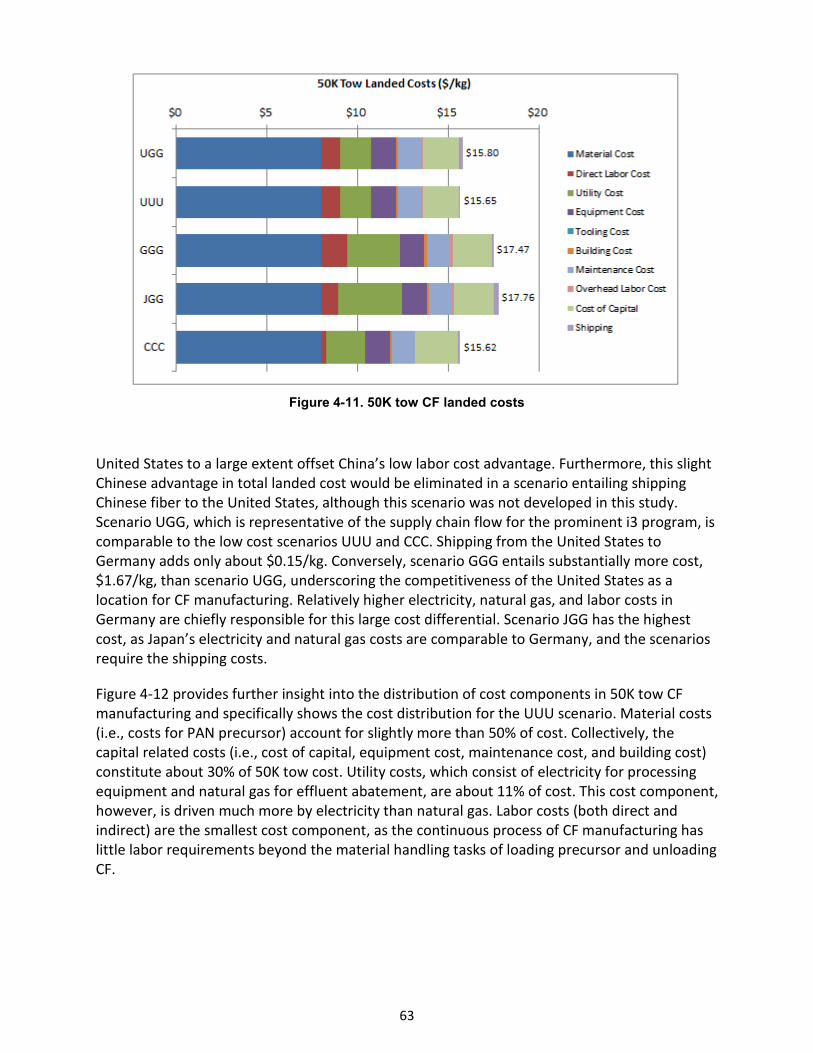
63
Figure 4-11. 50K tow CF landed costs
United States to a large extent offset China’s low labor cost advantage. Furthermore, this slight Chinese advantage in total landed cost would be eliminated in a scenario entailing shipping Chinese fiber to the United States, although this scenario was not developed in this study. Scenario UGG, which is representative of the supply chain flow for the prominent i3 program, is comparable to the low cost scenarios UUU and CCC. Shipping from the United States to Germany adds only about $0.15/kg. Conversely, scenario GGG entails substantially more cost, $1.67/kg, than scenario UGG, underscoring the competitiveness of the United States as a location for CF manufacturing. Relatively higher electricity, natural gas, and labor costs in Germany are chiefly responsible for this large cost differential. Scenario JGG has the highest cost, as Japan’s electricity and natural gas costs are comparable to Germany, and the scenarios require the shipping costs.
Figure 4-12 provides further insight into the distribution of cost components in 50K tow CF manufacturing and specifically shows the cost distribution for the UUU scenario. Material costs (i.e., costs for PAN precursor) account for slightly more than 50% of cost. Collectively, the capital related costs (i.e., cost of capital, equipment cost, maintenance cost, and building cost) constitute about 30% of 50K tow cost. Utility costs, which consist of electricity for processing equipment and natural gas for effluent abatement, are about 11% of cost. This cost component, however, is driven much more by electricity than natural gas. Labor costs (both direct and indirect) are the smallest cost component, as the continuous process of CF manufacturing has little labor requirements beyond the material handling tasks of loading precursor and unloading CF.
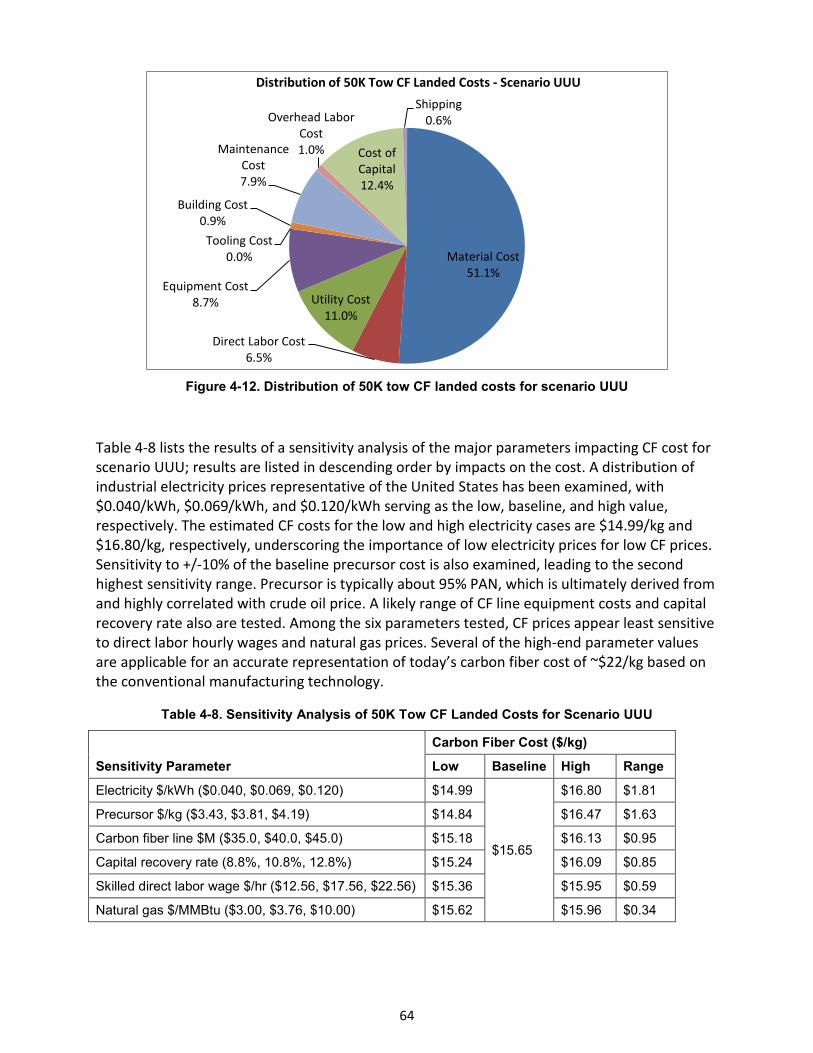
64
Figure 4-12. Distribution of 50K tow CF landed costs for scenario UUU
Table 4-8 lists the results of a sensitivity analysis of the major parameters impacting CF cost for scenario UUU; results are listed in descending order by impacts on the cost. A distribution of industrial electricity prices representative of the United States has been examined, with $0.040/kWh, $0.069/kWh, and $0.120/kWh serving as the low, baseline, and high value, respectively. The estimated CF costs for the low and high electricity cases are $14.99/kg and $16.80/kg, respectively, underscoring the importance of low electricity prices for low CF prices. Sensitivity to +/-10% of the baseline precursor cost is also examined, leading to the second highest sensitivity range. Precursor is typically about 95% PAN, which is ultimately derived from and highly correlated with crude oil price. A likely range of CF line equipment costs and capital recovery rate also are tested. Among the six parameters tested, CF prices appear least sensitive to direct labor hourly wages and natural gas prices. Several of the high-end parameter values are applicable for an accurate representation of today’s carbon fiber cost of ~$22/kg based on the conventional manufacturing technology.
Table 4-8. Sensitivity Analysis of 50K Tow CF Landed Costs for Scenario UUU
Sensitivity Parameter Carbon Fiber Cost ($/kg)
Low Baseline High Range
Electricity $/kWh ($0.040, $0.069, $0.120) $14.99
$15.65
$16.80 $1.81
Precursor $/kg ($3.43, $3.81, $4.19) $14.84 $16.47 $1.63
Carbon fiber line $M ($35.0, $40.0, $45.0) $15.18 $16.13 $0.95
Capital recovery rate (8.8%, 10.8%, 12.8%) $15.24 $16.09 $0.85
Skilled direct labor wage $/hr ($12.56, $17.56, $22.56) $15.36 $15.95 $0.59
Natural gas $/MMBtu ($3.00, $3.76, $10.00) $15.62 $15.96 $0.34
Material Cost51.1%
Direct Labor Cost6.5%
Utility Cost11.0%
Equipment Cost8.7%
Tooling Cost0.0%
Building Cost0.9%
Maintenance Cost7.9%
Overhead Labor Cost1.0% Cost of
Capital12.4%
Shipping0.6%
Distribution of 50K Tow CF Landed Costs - Scenario UUU

65
Figure 4-13 shows the estimated landed costs of bidirectional fabric at the factory gate of the upper dash panel manufacturer for the five scenarios described in Table 4-7. In fabric manufacturing, the Chinese advantage of low labor costs has a higher impact as this activity is more labor intensive than CF manufacturing. Furthermore, capital costs and utility costs are less for fabric than for CF manufacturing, which reduces the impact of the United States advantage in these cost components. For this reason, scenario UUU is about 10% higher than scenario CCC. While little difference was observed between UUU and UGG at the CF step (i.e., shipping costs added little to landed costs), a significant difference is seen at the fabric step due to labor costs that are higher in Germany than the United States. Scenario GGG is higher still, as this scenario assumes CF is manufactured in Germany where utility costs are significantly higher than in the United States. Finally, scenario JGG is highest of all, as CF manufacturing in this scenario is assumed to take place in Japan, followed by shipping to Germany where fabric manufacturing takes place.
Figure 4-13. Bidirectional fabric landed costs
Figure 4-14 provides further insight into the distribution of cost components in bidirectional fabric manufacturing and specifically shows the cost distribution for the UUU scenario. Material costs (i.e., costs for 50K tow CF) account for more than two-thirds of cost. Labor costs are nearly 14% of total landed costs, or about twice the percentage share as seen in CF manufacturing in Figure 4-11. Collectively, the capital-related costs (i.e., cost of capital, equipment cost, maintenance cost, and building cost) constitute about 12% of cost. Utility costs are a much smaller percentage share of cost in fabric versus CF manufacturing, constituting less than 5% of total landed costs in the former versus 11% in the latter. Shipping is the smallest cost component at less than 0.5% of total landed cost.
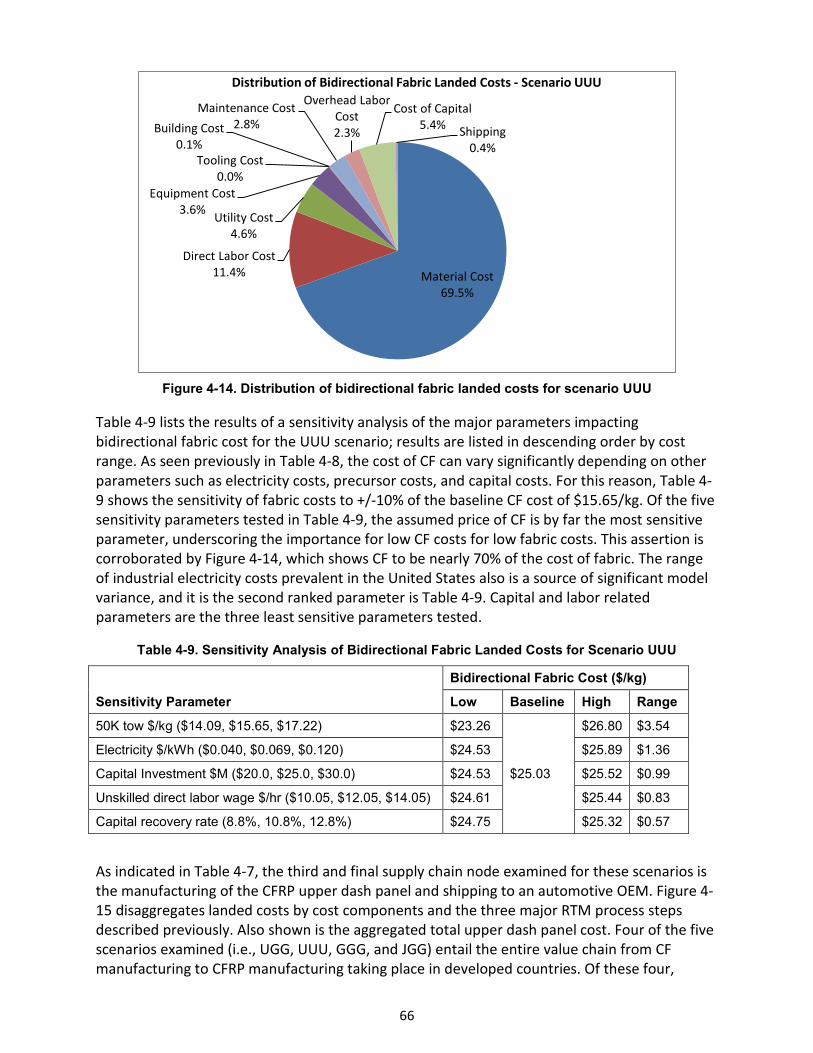
66
Figure 4-14. Distribution of bidirectional fabric landed costs for scenario UUU
Table 4-9 lists the results of a sensitivity analysis of the major parameters impacting bidirectional fabric cost for the UUU scenario; results are listed in descending order by cost range. As seen previously in Table 4-8, the cost of CF can vary significantly depending on other parameters such as electricity costs, precursor costs, and capital costs. For this reason, Table 4-9 shows the sensitivity of fabric costs to +/-10% of the baseline CF cost of $15.65/kg. Of the five sensitivity parameters tested in Table 4-9, the assumed price of CF is by far the most sensitive parameter, underscoring the importance for low CF costs for low fabric costs. This assertion is corroborated by Figure 4-14, which shows CF to be nearly 70% of the cost of fabric. The range of industrial electricity costs prevalent in the United States also is a source of significant model variance, and it is the second ranked parameter is Table 4-9. Capital and labor related parameters are the three least sensitive parameters tested.
Table 4-9. Sensitivity Analysis of Bidirectional Fabric Landed Costs for Scenario UUU
Sensitivity Parameter Bidirectional Fabric Cost ($/kg)
Low Baseline High Range
50K tow $/kg ($14.09, $15.65, $17.22) $23.26
$25.03
$26.80 $3.54
Electricity $/kWh ($0.040, $0.069, $0.120) $24.53 $25.89 $1.36
Capital Investment $M ($20.0, $25.0, $30.0) $24.53 $25.52 $0.99
Unskilled direct labor wage $/hr ($10.05, $12.05, $14.05) $24.61 $25.44 $0.83
Capital recovery rate (8.8%, 10.8%, 12.8%) $24.75 $25.32 $0.57
As indicated in Table 4-7, the third and final supply chain node examined for these scenarios is the manufacturing of the CFRP upper dash panel and shipping to an automotive OEM. Figure 4-15 disaggregates landed costs by cost components and the three major RTM process steps described previously. Also shown is the aggregated total upper dash panel cost. Four of the five scenarios examined (i.e., UGG, UUU, GGG, and JGG) entail the entire value chain from CF manufacturing to CFRP manufacturing taking place in developed countries. Of these four,
Material Cost69.5%
Direct Labor Cost11.4%
Utility Cost4.6%
Equipment Cost3.6%
Tooling Cost0.0%
Building Cost0.1%
Maintenance Cost2.8%
Overhead Labor Cost2.3%
Cost of Capital5.4% Shipping
0.4%
Distribution of Bidirectional Fabric Landed Costs - Scenario UUU
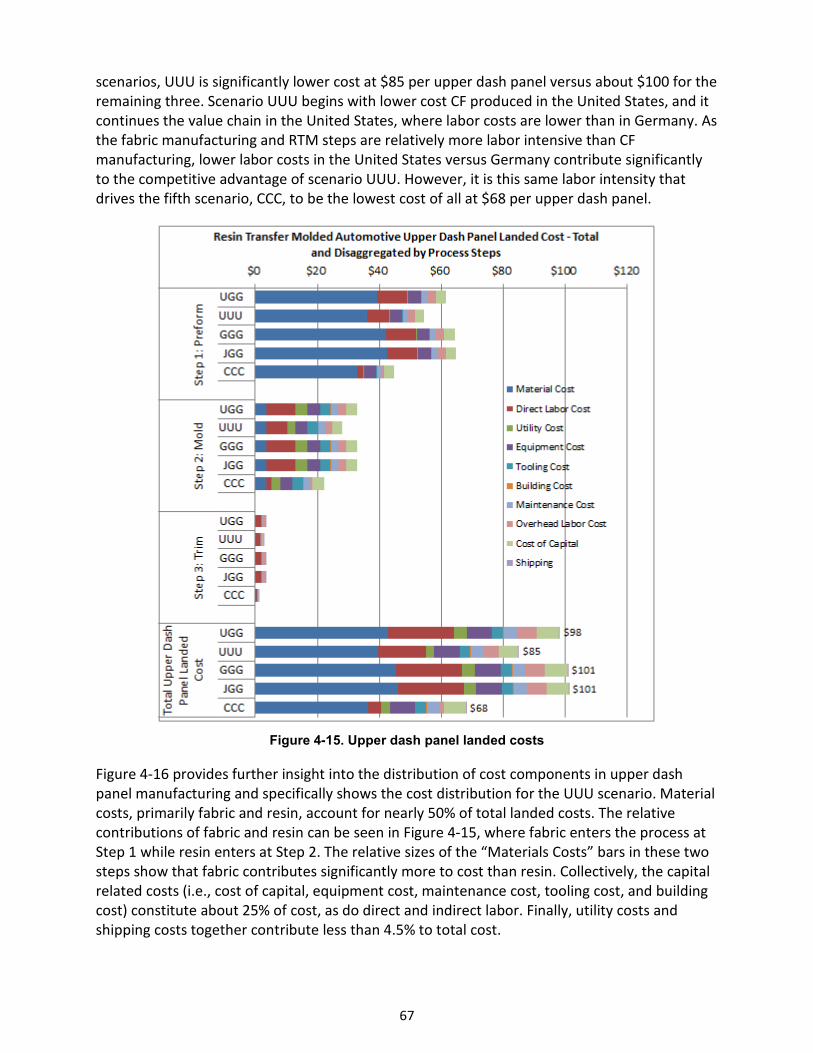
67
scenarios, UUU is significantly lower cost at $85 per upper dash panel versus about $100 for the remaining three. Scenario UUU begins with lower cost CF produced in the United States, and it continues the value chain in the United States, where labor costs are lower than in Germany. As the fabric manufacturing and RTM steps are relatively more labor intensive than CF manufacturing, lower labor costs in the United States versus Germany contribute significantly to the competitive advantage of scenario UUU. However, it is this same labor intensity that drives the fifth scenario, CCC, to be the lowest cost of all at $68 per upper dash panel.
Figure 4-15. Upper dash panel landed costs
Figure 4-16 provides further insight into the distribution of cost components in upper dash panel manufacturing and specifically shows the cost distribution for the UUU scenario. Material costs, primarily fabric and resin, account for nearly 50% of total landed costs. The relative contributions of fabric and resin can be seen in Figure 4-15, where fabric enters the process at Step 1 while resin enters at Step 2. The relative sizes of the “Materials Costs” bars in these two steps show that fabric contributes significantly more to cost than resin. Collectively, the capital related costs (i.e., cost of capital, equipment cost, maintenance cost, tooling cost, and building cost) constitute about 25% of cost, as do direct and indirect labor. Finally, utility costs and shipping costs together contribute less than 4.5% to total cost.
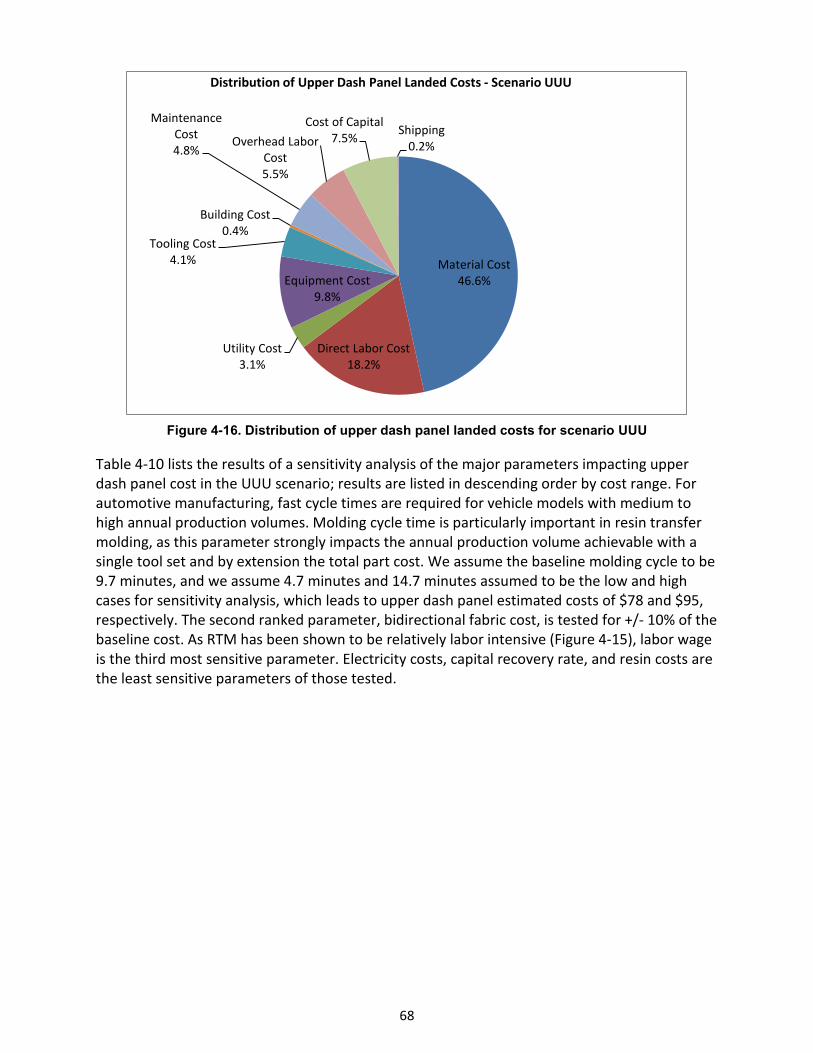
68
Figure 4-16. Distribution of upper dash panel landed costs for scenario UUU
Table 4-10 lists the results of a sensitivity analysis of the major parameters impacting upper dash panel cost in the UUU scenario; results are listed in descending order by cost range. For automotive manufacturing, fast cycle times are required for vehicle models with medium to high annual production volumes. Molding cycle time is particularly important in resin transfer molding, as this parameter strongly impacts the annual production volume achievable with a single tool set and by extension the total part cost. We assume the baseline molding cycle to be 9.7 minutes, and we assume 4.7 minutes and 14.7 minutes assumed to be the low and high cases for sensitivity analysis, which leads to upper dash panel estimated costs of $78 and $95, respectively. The second ranked parameter, bidirectional fabric cost, is tested for +/- 10% of the baseline cost. As RTM has been shown to be relatively labor intensive (Figure 4-15), labor wage is the third most sensitive parameter. Electricity costs, capital recovery rate, and resin costs are the least sensitive parameters of those tested.
Material Cost46.6%
Direct Labor Cost18.2%
Utility Cost3.1%
Equipment Cost9.8%
Tooling Cost4.1%
Building Cost0.4%
Maintenance Cost4.8%
Overhead Labor Cost5.5%
Cost of Capital7.5% Shipping
0.2%
Distribution of Upper Dash Panel Landed Costs - Scenario UUU
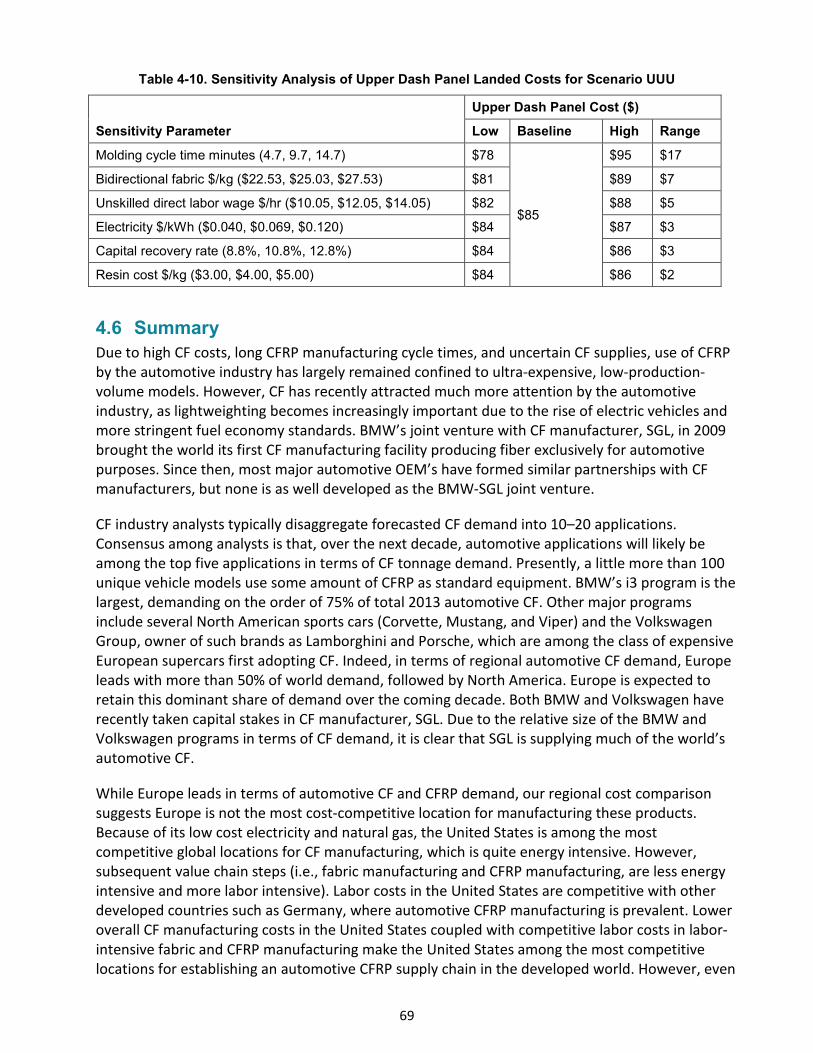
69
Table 4-10. Sensitivity Analysis of Upper Dash Panel Landed Costs for Scenario UUU
Sensitivity Parameter Upper Dash Panel Cost ($)
Low Baseline High Range
Molding cycle time minutes (4.7, 9.7, 14.7) $78
$85
$95 $17
Bidirectional fabric $/kg ($22.53, $25.03, $27.53) $81 $89 $7
Unskilled direct labor wage $/hr ($10.05, $12.05, $14.05) $82 $88 $5
Electricity $/kWh ($0.040, $0.069, $0.120) $84 $87 $3
Capital recovery rate (8.8%, 10.8%, 12.8%) $84 $86 $3
Resin cost $/kg ($3.00, $4.00, $5.00) $84 $86 $2
4.6 Summary Due to high CF costs, long CFRP manufacturing cycle times, and uncertain CF supplies, use of CFRP by the automotive industry has largely remained confined to ultra-expensive, low-production-volume models. However, CF has recently attracted much more attention by the automotive industry, as lightweighting becomes increasingly important due to the rise of electric vehicles and more stringent fuel economy standards. BMW’s joint venture with CF manufacturer, SGL, in 2009 brought the world its first CF manufacturing facility producing fiber exclusively for automotive purposes. Since then, most major automotive OEM’s have formed similar partnerships with CF manufacturers, but none is as well developed as the BMW-SGL joint venture.
CF industry analysts typically disaggregate forecasted CF demand into 10–20 applications. Consensus among analysts is that, over the next decade, automotive applications will likely be among the top five applications in terms of CF tonnage demand. Presently, a little more than 100 unique vehicle models use some amount of CFRP as standard equipment. BMW’s i3 program is the largest, demanding on the order of 75% of total 2013 automotive CF. Other major programs include several North American sports cars (Corvette, Mustang, and Viper) and the Volkswagen Group, owner of such brands as Lamborghini and Porsche, which are among the class of expensive European supercars first adopting CF. Indeed, in terms of regional automotive CF demand, Europe leads with more than 50% of world demand, followed by North America. Europe is expected to retain this dominant share of demand over the coming decade. Both BMW and Volkswagen have recently taken capital stakes in CF manufacturer, SGL. Due to the relative size of the BMW and Volkswagen programs in terms of CF demand, it is clear that SGL is supplying much of the world’s automotive CF.
While Europe leads in terms of automotive CF and CFRP demand, our regional cost comparison suggests Europe is not the most cost-competitive location for manufacturing these products. Because of its low cost electricity and natural gas, the United States is among the most competitive global locations for CF manufacturing, which is quite energy intensive. However, subsequent value chain steps (i.e., fabric manufacturing and CFRP manufacturing, are less energy intensive and more labor intensive). Labor costs in the United States are competitive with other developed countries such as Germany, where automotive CFRP manufacturing is prevalent. Lower overall CF manufacturing costs in the United States coupled with competitive labor costs in labor-intensive fabric and CFRP manufacturing make the United States among the most competitive locations for establishing an automotive CFRP supply chain in the developed world. However, even

70
with the advantages of low-labor-cost in countries like China and the relatively high labor intensity of fabric and CFRP manufacturing, the United States still remains the most competitive region for the automotive CFRP part manufacturing due to its lower carbon fiber cost.
The present automotive CFRP supply chains, concentrated in the relatively higher cost developed world, have thus far remained insulated from cost pressures from developing nations as the various vehicle types using CF are themselves high cost. Consumers of these high cost vehicles are less sensitive to vehicle cost and make purchasing decisions based on performance or other factors. As CF penetrates the market for lower-cost, high-production-volume models, pricing pressure from lower cost supply chains could threaten the established North American and European supply chains that presently dominate.
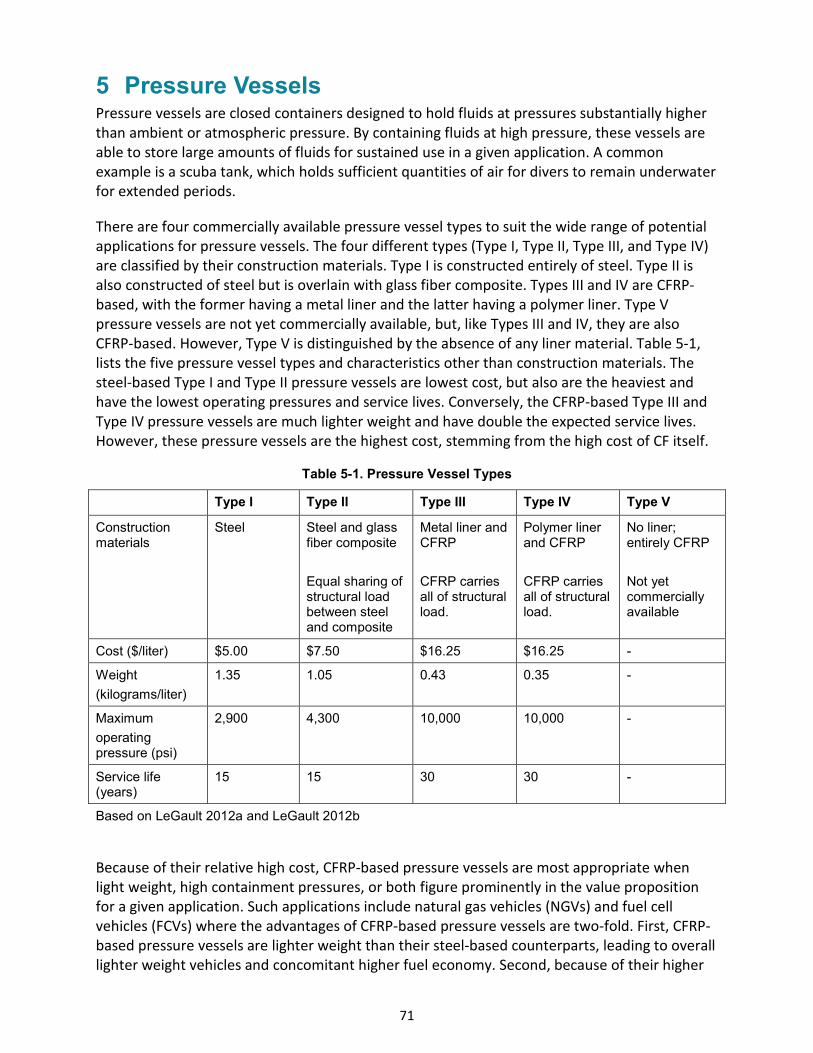
71
5 Pressure Vessels Pressure vessels are closed containers designed to hold fluids at pressures substantially higher than ambient or atmospheric pressure. By containing fluids at high pressure, these vessels are able to store large amounts of fluids for sustained use in a given application. A common example is a scuba tank, which holds sufficient quantities of air for divers to remain underwater for extended periods.
There are four commercially available pressure vessel types to suit the wide range of potential applications for pressure vessels. The four different types (Type I, Type II, Type III, and Type IV) are classified by their construction materials. Type I is constructed entirely of steel. Type II is also constructed of steel but is overlain with glass fiber composite. Types III and IV are CFRP-based, with the former having a metal liner and the latter having a polymer liner. Type V pressure vessels are not yet commercially available, but, like Types III and IV, they are also CFRP-based. However, Type V is distinguished by the absence of any liner material. Table 5-1, lists the five pressure vessel types and characteristics other than construction materials. The steel-based Type I and Type II pressure vessels are lowest cost, but also are the heaviest and have the lowest operating pressures and service lives. Conversely, the CFRP-based Type III and Type IV pressure vessels are much lighter weight and have double the expected service lives. However, these pressure vessels are the highest cost, stemming from the high cost of CF itself.
Table 5-1. Pressure Vessel Types
Type I Type II Type III Type IV Type V
Construction materials
Steel Steel and glass fiber composite Equal sharing of structural load between steel and composite
Metal liner and CFRP CFRP carries all of structural load.
Polymer liner and CFRP CFRP carries all of structural load.
No liner; entirely CFRP Not yet commercially available
Cost ($/liter) $5.00 $7.50 $16.25 $16.25 -
Weight (kilograms/liter)
1.35 1.05 0.43 0.35 -
Maximum operating pressure (psi)
2,900 4,300 10,000 10,000 -
Service life (years)
15 15 30 30 -
Based on LeGault 2012a and LeGault 2012b
Because of their relative high cost, CFRP-based pressure vessels are most appropriate when light weight, high containment pressures, or both figure prominently in the value proposition for a given application. Such applications include natural gas vehicles (NGVs) and fuel cell vehicles (FCVs) where the advantages of CFRP-based pressure vessels are two-fold. First, CFRP-based pressure vessels are lighter weight than their steel-based counterparts, leading to overall lighter weight vehicles and concomitant higher fuel economy. Second, because of their higher
72
containment pressures, CFRP-based pressure vessels are able to store more fuel and thereby extend vehicle driving range. Similarly, more fuel can be stored in a smaller volume, thereby reducing the vehicle volume occupied by the fuel storage system.
While onboard fuel storage for NGVs and FCVs is anticipated to be the leading application for CFRP-based pressure vessels over the next decade in terms of tonnes CF demanded (Red and Zimm 2012), other applications are also important. CFRP-based pressure vessels are also used for the bulk transport of natural gas by tractor trailer or other means where pipelines are not feasible. Self-contained breathing apparatus (SCBA) applications such as firefighting and underwater diving also use CFRP-based pressure vessels. Stationary storage of natural gas and hydrogen, paintballs, and hydraulic hybrid vehicles are a few of the other existing or potential applications for CFRP-based pressure vessels, but they are small in terms of tonnes CF demanded (Red and Zimm 2012).
5.1 Demand and Supply Red and Zimm (2012), Industry Experts (2013), and Lucintel (2012) have disaggregated forecasted CF demand for different applications at different time scales; they are the data sources for Table 1-2. Industry Experts (2012) and Lucintel (2012) anticipate pressure vessels to be the seventh highest demanding CF application in coming years, having about 6%–7% of total CF demand. The forecast with the longest time scale (Red and Zimm 2012) anticipates pressure vessels will be the third highest demanding application in year 2022 and will have about 9% of total CF demand. All forecasts indicated demand from pressure vessels would be less than half of demand of the second ranked application, which in the three forecasts is either wind or aerospace.
Table 5-2, which like Table 1-2 is based on Red and Zimm (2012), Industry Experts (2013), and Lucintel (2012), provides further insights into the forecasted demand scenarios for pressure vessel CF. For example, annual total demand for CF by the pressure vessel industry was estimated in the range of 1,780 tonnes to 2,560 tonnes in 2012. The year 2018 represents the latest common data point among the three sources, when CF demand is estimated to range from 5,808 tonnes to 2,560 tonnes. Empty cells in Table 5-2 indicate a year for which a forecast was not given by the respective source. Average demand values are given in the last row of Table 5-2 for the three years (i.e., 2012, 2013, and 2018) when all three forecasts provided an estimate. The average forecasted demand for 2018 is 7,225 tonnes with an average CAGR of 21.9% from 2012 to 2018. As with projections for automotive demand, the latest projections of pressure vessel-related CF demand—19,520 tonnes or ~13% of the total projected demand of 150,000 tonnes in 2020—are higher than previous estimates (Red 2015). The data in Table 5-3 are plotted as a time series chart in Figure 5-1.
The forecast by Red and Zimm (2012) disaggregates pressure vessels into three subcategories: (1) “CNG & H2” for applications related to NGVs and FCVs, (2) “Bulk Transport” for movement of natural gas where pipelines are impractical, and (3) “SCBA” for applications such as firefighting and underwater diving. These subcategories appear to comprise essentially 100% of CF demand for pressure vessels in coming years in the Red and Zimm (2012) forecast. Moreover, 80% of this demand is concentrated in the CNG & H2 subcategory, which also has fastest growth rate.
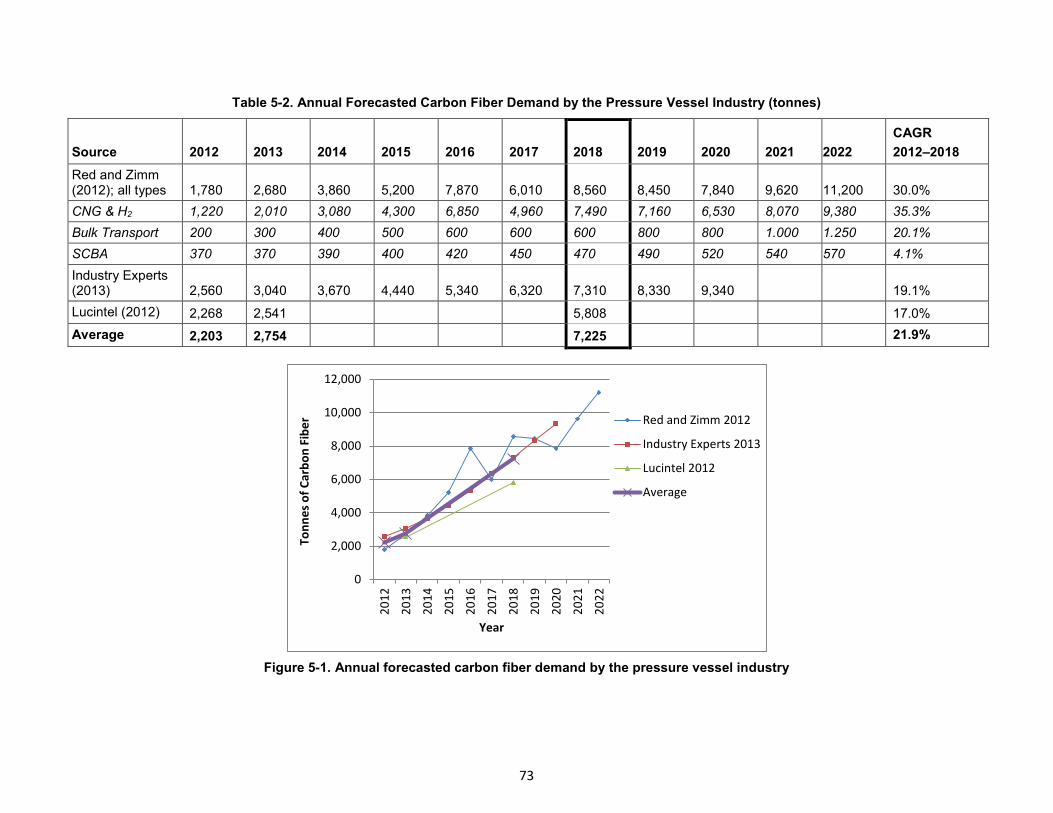
73
Table 5-2. Annual Forecasted Carbon Fiber Demand by the Pressure Vessel Industry (tonnes)
Source 2012 2013 2014 2015 2016 2017 2018 2019 2020 2021 2022 CAGR 2012–2018
Red and Zimm (2012); all types 1,780 2,680 3,860 5,200 7,870 6,010 8,560 8,450 7,840 9,620 11,200 30.0% CNG & H2 1,220 2,010 3,080 4,300 6,850 4,960 7,490 7,160 6,530 8,070 9,380 35.3% Bulk Transport 200 300 400 500 600 600 600 800 800 1.000 1.250 20.1% SCBA 370 370 390 400 420 450 470 490 520 540 570 4.1% Industry Experts (2013) 2,560 3,040 3,670 4,440 5,340 6,320 7,310 8,330 9,340 19.1% Lucintel (2012) 2,268 2,541 5,808 17.0% Average 2,203 2,754 7,225 21.9%
Figure 5-1. Annual forecasted carbon fiber demand by the pressure vessel industry
0
2,000
4,000
6,000
8,000
10,000
12,00020
12
2013
2014
2015
2016
2017
2018
2019
2020
2021
2022
Tonn
es o
f Car
bon
Fibe
r
Year
Red and Zimm 2012
Industry Experts 2013
Lucintel 2012
Average
74
Due to their dominant share of forecasted pressure vessel CF demand, NGVs and FCVs are examined further. In 1966, General Motors created the world’s first FCV, the Chevrolet Electrovan, having its entire rear section filled with hydrogen storage tanks and fuel cells. The commercial prospects of FCVs have improved since the Electrovan; however, technology evolution, cost reduction, and adoption have been persistently slow. The history of FCVs has been marked by periods of over-exuberance that have failed to materialize into commercial significance. For instance, in 2004, California Governor Arnold Schwarzenegger targeted 250 hydrogen filling stations and 20,000 FCVs by 2010. Yet in 2013, California had only nine filling stations and a few hundred FCVs.48 Annual worldwide FCV sales in 2012 were estimated to be well under 500 units (Navigant Research 2013). Despite slow progress, FCVs may finally be on the cusp of commercialization; Toyota, BMW, Hyundai, Renault, Nissan, Daimler, Ford, General Motors, and Honda all have plans to introduce commercially available FCVs in between 2015 and 2020.49 FCV annual sales are forecasted to grow from 1,000 units in 2015 to more than 2,000,000 units in 2030 (Navigant Research 2013) as a result of cost reductions as well as Corporate Average Fuel Economy (CAFE) regulations and an anticipated hydrogen infrastructure.
By contrast, the NGV market is firmly established, having well-developed technology and refueling infrastructure. In 2012, the global NGV fleet was estimated to be about 17 million, a net increase of about 1.6 million over the 2011 NGV fleet (NGV Global 2013). The vast majority of pressure vessels for NGVs are steel-based (i.e., Type I and Type II). Nevertheless, CFRP-based pressure vessels have a non-trivial market share; Red and Zimm (2012) estimate about 99,000 CFRP-based tanks were produced for NGVs in 2012, a time when total FCV production was estimated to be well under 500 units (Navigant Research 2013). Moreover, the penetration rate of CFRP-based pressure vessels in NGVs is expected to rise sharply in the coming decade, with sales of about 1 million CFRP-based pressure vessels for NGVs forecasted for 2022 (Red and Zimm 2022). Thus, NGVs clearly represent much larger opportunity space for CF than FCVs in the next decade. FCVs could be the larger opportunity space in following decades if (1) FCV adoption forecasts prove true and (2) CFRP-based pressure vessels prove to be the preferred onboard fuel-storage option among other options, such as metal hydrides.
The global NGV fleet is concentrated in developing countries that have targeted natural gas for its lower costs and emissions. Table 5-3 lists the top ten countries in terms of NGV population in 2012. With the exception of Italy, all of the top ten countries are developing countries with economies highly sensitive to the relative high cost of CFRP-based pressure vessels. Despite having abundant inexpensive domestic natural gas, the United States ranks 18 with a 2012 population of 127,735 NGVs (NGV Global 2013). Table 5-4 gives the regional distribution of NGVs in 2012 and shows the Asia-Pacific region to be the leader followed by Latin America. North America is the region with the smallest share. Table 5-4 also shows North America has also been the slowest growing market for NGVs, with a negative 0.9% growth rate between 2003 and 2012.
48 “Has the Fuel Cell Car’s Time Finally Come?” Brian Dumaine, August 15 2013, accessed February 18, 2014, http://money.cnn.com/2013/08/15/technology/fuel-cell-hydrogen.pr.fortune/. 49 Ibid.
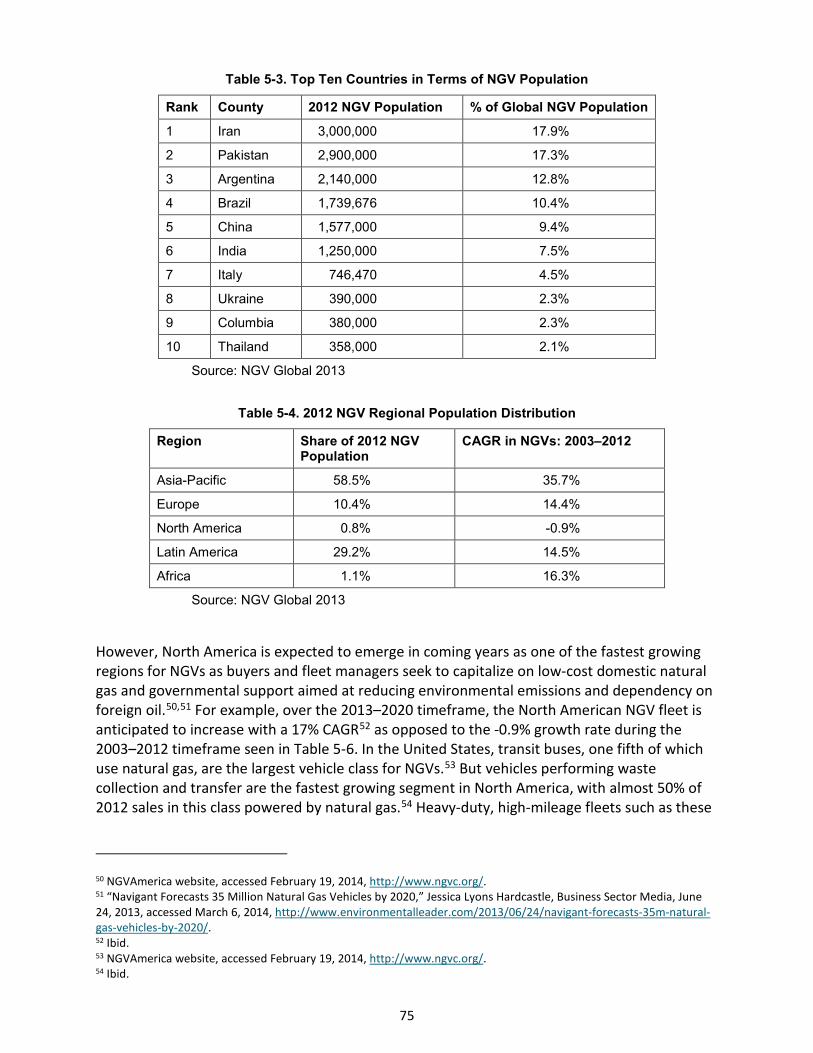
75
Table 5-3. Top Ten Countries in Terms of NGV Population
Rank County 2012 NGV Population % of Global NGV Population
1 Iran 3,000,000 17.9%
2 Pakistan 2,900,000 17.3%
3 Argentina 2,140,000 12.8%
4 Brazil 1,739,676 10.4%
5 China 1,577,000 9.4%
6 India 1,250,000 7.5%
7 Italy 746,470 4.5%
8 Ukraine 390,000 2.3%
9 Columbia 380,000 2.3%
10 Thailand 358,000 2.1%
Source: NGV Global 2013
Table 5-4. 2012 NGV Regional Population Distribution
Region Share of 2012 NGV Population
CAGR in NGVs: 2003–2012
Asia-Pacific 58.5% 35.7%
Europe 10.4% 14.4%
North America 0.8% -0.9%
Latin America 29.2% 14.5%
Africa 1.1% 16.3%
Source: NGV Global 2013
However, North America is expected to emerge in coming years as one of the fastest growing regions for NGVs as buyers and fleet managers seek to capitalize on low-cost domestic natural gas and governmental support aimed at reducing environmental emissions and dependency on foreign oil.50,51 For example, over the 2013–2020 timeframe, the North American NGV fleet is anticipated to increase with a 17% CAGR52 as opposed to the -0.9% growth rate during the 2003–2012 timeframe seen in Table 5-6. In the United States, transit buses, one fifth of which use natural gas, are the largest vehicle class for NGVs.53 But vehicles performing waste collection and transfer are the fastest growing segment in North America, with almost 50% of 2012 sales in this class powered by natural gas.54 Heavy-duty, high-mileage fleets such as these
50 NGVAmerica website, accessed February 19, 2014, http://www.ngvc.org/. 51 “Navigant Forecasts 35 Million Natural Gas Vehicles by 2020,” Jessica Lyons Hardcastle, Business Sector Media, June 24, 2013, accessed March 6, 2014, http://www.environmentalleader.com/2013/06/24/navigant-forecasts-35m-natural-gas-vehicles-by-2020/. 52 Ibid. 53 NGVAmerica website, accessed February 19, 2014, http://www.ngvc.org/. 54 Ibid.
76
can recover the higher first costs of NGV technology in as few as 18 to 24 months.55 Uptake of NGV technology in the North American light-duty fleet has been much more limited, as these models have lengthier payback periods, lower lifetime driving distances when compared with heavy-duty vehicles, and the absence of a well-developed NGV fueling infrastructure.56
The distribution of NGVs among different vehicle classes is much different globally than it is in North America, with light-duty vehicles constituting an estimated 95% of the global NGV fleet in 2013.57 However, light-duty NGVs are expected to lose some share in coming years to trucks and buses, with light-duty NGVs falling to 91% of the anticipated 2020 NGV population of 35 million.58
NGVs can operate on either liquefied natural gas (LNGV) or compressed natural gas (CNGV). CNGV technology is less expensive and thus much more prevalent, constituting essentially 100% of light-duty NGVs and about 80% of medium- and heavy-duty NGVs globally (Red 2009). It is estimated that the composite CNGV market will reach $524 million by 2019 with a double-digit growth over the next five years (Lucintel 2014).
A regional distribution of CF demand forecast by the pressure vessel manufacturing industry is given by Industry Experts (2013) and summarized in Figure 5-2. As many of the world’s leading CFRP-based pressure vessel manufacturers are located in North America, this region leads in terms of tonnes CF demanded. North America is anticipated to have about 60% of global demand for pressure vessel CF in both 2012 and 2020. Conversely, Europe and Japan are forecast to lose market share to Asia and the rest of the world where, as Table 5-4 confirms, the NGV population has been growing rapidly.
The forecasted regional demand for pressure vessel CFRP from Industry Experts (2013) is summarized in Figure 5-3, and it follows nearly the same distribution as the regional demand for CF. As with the CF case, North America is the forecasted leader for pressure vessel CFRP demand with about 63% share in both 2012 and 2020. Similarly, Europe and Japan are forecasted to lose market share to fast-growing Asia. Total global CFRP demand is estimated to be 4,030 tonnes and 14,830 tonnes in 2012 and 2020, respectively. For these years, the corresponding CF demand (as can be seen in Table 5-3) is about 63% of CFRP demand, which is a typical CF mass percentage in CFRP.
High-strength, intermediate-modulus CF tow in the 12K to 50K filament range is preferred for pressure vessels (Red and Zimm 2012); 24K tow is especially common and is dominated by high strength, standard modulus fibers today. Fibers having 24,000 filaments or fewer are classified
55 Ibid. 56 Ibid. 57 “Navigant Forecasts 35 Million Natural Gas Vehicles by 2020,” Jessica Lyons Hardcastle, Business Sector Media, June 24, 2013, accessed March 6, 2014, http://www.environmentalleader.com/2013/06/24/navigant-forecasts-35m-natural-gas-vehicles-by-2020/. 58 Ibid.
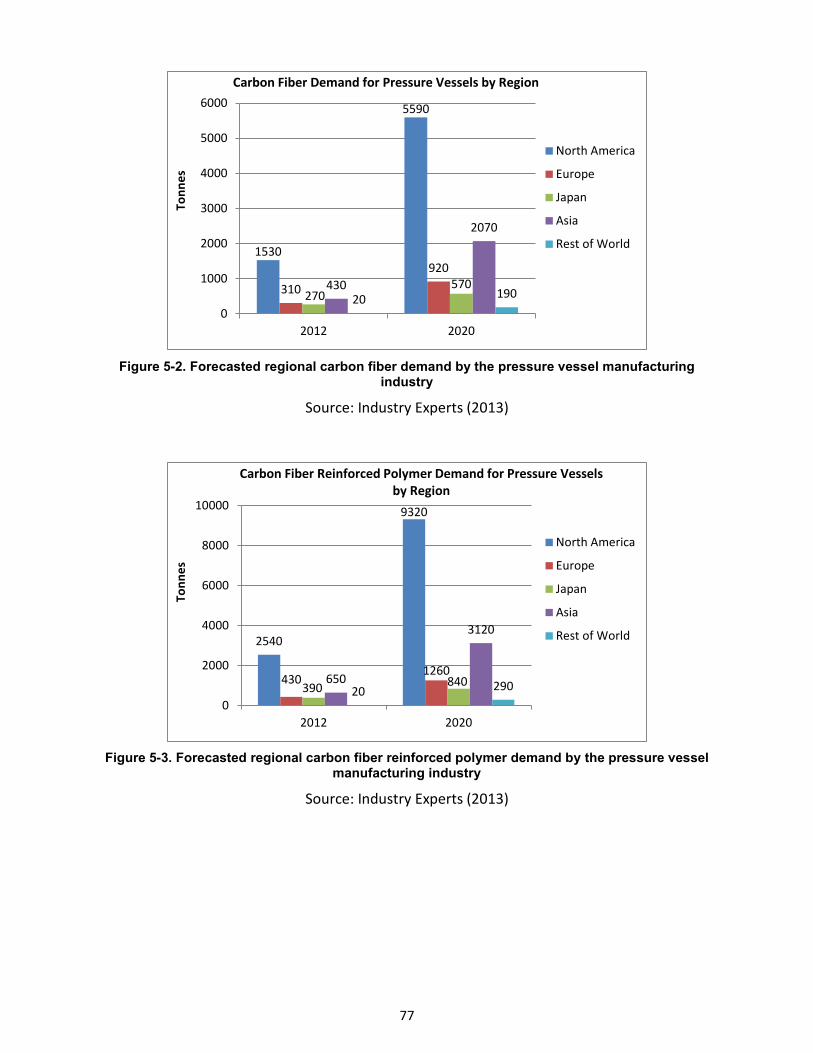
77
Figure 5-2. Forecasted regional carbon fiber demand by the pressure vessel manufacturing industry
Source: Industry Experts (2013)
Figure 5-3. Forecasted regional carbon fiber reinforced polymer demand by the pressure vessel manufacturing industry
Source: Industry Experts (2013)
1530
5590
310
920
270570430
2070
20 1900
1000
2000
3000
4000
5000
6000
2012 2020
Tonn
es
Carbon Fiber Demand for Pressure Vessels by Region
North America
Europe
Japan
Asia
Rest of World
2540
9320
4301260
390 840650
3120
20 2900
2000
4000
6000
8000
10000
2012 2020
Tonn
es
Carbon Fiber Reinforced Polymer Demand for Pressure Vessels by Region
North America
Europe
Japan
Asia
Rest of World
78
Table 5-5. 2020 Forecasted Regional Carbon Fiber Demand by the Pressure Vessel Industry and Regional Small-Tow Manufacturing Capacity
Region 2020 Small-Tow Manufacturing Capacity (Tonnes)
2020 Pressure Vessel Carbon Fiber Demand (Tonnes)
2020 Excess Small-Tow Manufacturing Capacity (Tonnes)
North America 24,826 5,590 +19,236
Europe 10,861 920 +9,941
Asia (Japan and China) 41,117 2,640 +38,477
Rest of the world 776 190 +586
Total 77,580 9,340 +68,240
as small tow. Year 2020 forecasts for regional small-tow manufacturing capacity from Red and Zimm (2012) are listed in Table 5-5, and they are compared with the regional pressure vessel CF demand forecasts in Figure 5-2 as sourced from (Industry Experts 2013). The forecasted global small-tow manufacturing capacity is well in excess of demand in each region. In the near term, other applications demanding larger amounts of small tow, such as aerospace and sporting goods, have greater impact on global small-tow supply-demand balance than pressure vessels.
5.2 Price and Value Pressure vessel manufacturers’ selection of 24k tow fiber (e.g., Toray’s T700S) is reflected in its selection as the representative fiber for ongoing cost analysis of onboard hydrogen storage pressure vessels for FCVs sponsored by DOE (James 2012). This fiber sells in the range of $24/kg to $30/kg (Lucintel 2012). Using Lucintel’s price range and its assumption that price will be stable through the 2012—2018 forecast period, it is possible to develop an estimate of the market value of pressure vessel CF. This estimate, along with point estimates given directly by Industry Experts (2013) are listed in Table 5-6. It should be noted T700S is not the only fiber used by the pressure vessel industry, which introduces uncertainty into the Lucintel-based estimate. However, as seen in Table 5-8, the market value estimates from the two sources are generally in agreement. The Industry Experts (2013) pressure vessel CF market value estimate for 2012 is $77 million, which is slightly above the upper bound of the Lucintel (2012)-based estimate of $68 million. The implied CF price from the Industry Experts (2013) data is $30.08/kg, which is almost the same as the upper bound price range for T700S provided by Lucintel (2012). For 2018, the latest year with a common data point between the two sources, the implied CF price of $27.40 based on Industry Experts (2013) is near the middle of the T700S price range provided by Lucintel (2012). The 2018 market value estimate based on Industry Experts (2013) is higher due to a higher forecasted demand of pressure vessel CF tonnage.
79
Table 5-6. Pressure Vessel Carbon Fiber Market Value Estimates
Year
Lucintel (2012) Industry Experts (2013)
Pressure Vessel CF Price Range ($/kg)
Pressure Vessel CF Demand (kg)
Value of Pressure Vessel CF Market ($M)
Value of Pressure Vessel CF Market ($M)
Implied Average Pressure Vessel CF Price ($/kg)
2012 $24–$30 2,268,000 $54–$68 $77 $30.08
2018 $24–$30 5,808,000 $139–$174 $200 $27.40
Industry Experts (2013) presents a regional distribution of its forecasted pressure vessel CF market, which is summarized in Figure 5-4. As is the case with regional CF demand (Figure 5-2), regional CF market value is concentrated in North America and is estimated to be about 60% of the global market in both 2012 and 2020. Asia and the rest of the world are expected to increase market share over this timeframe, while Europe and Japan decline in market share. NGVs, the leading CFRP-based pressure vessel application, are concentrated in developing regions where composites manufacturing capabilities are known to be limited (Red 2009). However, North America is expected to remain a preferred region for manufacturing growth, anticipated to parallel the development of new NGV vehicles and backed by natural gas exploration activities that are likely to increase the demand for CNG tanks. Thus, North America’s lead in Type III and Type IV pressure vessel manufacturing technology is to be credited for its leading share of pressure vessel CF demand. However, this lead may be threatened if the North American leaders choose to move their manufacturing facilities closer to their biggest end markets either as wholly-owned assets or joint ventures with local firms (Red 2009). Figure 5-5 similarly shows the forecasted regional distribution of the value of the pressure vessel CFRP market, revealing the same trend of North American dominance. The 2012 and 2020 global CFRP markets are estimated to be $422 million and $1,260 million, respectively.
Figure 5-4. Forecasted pressure vessel carbon fiber market values by region
Source: Industry Experts (2013)
$46.8
$138.7
$9.5$22.9
$7.0 $12.1$13.1
$51.0
$0.5$4.8
$0
$20
$40
$60
$80
$100
$120
$140
$160
2012 2020
$ M
M
Value of Carbon Fiber Market for Pressure Vessels by Region
North America
Europe
Japan
Asia
Rest of World
80
Figure 5-5. Forecasted pressure vessel carbon fiber reinforced polymer market values by region
Source: Industry Experts (2013)
5.3 Supply Chains As indicated in Figure 5-2, demand for pressure vessel CF is concentrated in North America, which had about 60% share of global demand in 2012. Furthermore, the leading pressure vessel application in terms of CF demanded is CNGVs, which are concentrated in developing countries in the Asia-Pacific and Latin America regions as shown in Table 5-5. Thus, it may be concluded that the major supply chain channels include pressure vessel manufacturing in North America for systems integrators providing CNGV solutions ultimately to the Asia-Pacific and Latin America regions.
Eldib Engineering & Research59 identified seven major manufacturers of CFRP-based pressure vessels such as those used for NGVs and FCVs (Table 5-7). Six of these seven manufacturers are located in North America, corroborating Figure 5-2, which shows North America to be the leading region in terms of pressure vessel CF tonnage demand. Italy-based Faber Industries is the only manufacturer in Table 5-7 not located in North America. Four of the North American manufacturers are located in the United States while the remaining two are located in Canada.
Table 5-7. Major Manufacturers of Type III and Type IV Pressure Vessels
Manufacturer Manufacturing Location Dynetek Industries Calgary, Alberta, Canada Faber Industries Italy Lincoln Composites Lincoln, NE Luxfer Gas Cylinders Riverside, CA
59 “Study Reports on Growth of Carbon Fiber Use in Pressure Vessels,” CompositesWorld, June 25, 2012, February 20, 2014, http://www.compositesworld.com/news/study-reports-on-growth-of-carbon-fiber-use-in-pressure-vessels.
$269.0
$797.3
$45.0$108.3
$36.8 $63.8$68.4
$265.8
$2.4 $25.0$0
$100
$200
$300
$400
$500
$600
$700
$800
$900
2012 2020
$ M
M
Value of Carbon Fiber Reinforced Polymer Market for Pressure Vessels by Region
North America
Europe
Japan
Asia
Rest of World
81
Manufacturer Manufacturing Location Quantum Technologies Irvine, CA Sleegers Machining and Fabricating London, Ontario, Canada Worthington Industries Columbus, Ohio AVANCO (Xperion) Germany and Ohio
Table 5-8 reports some of the major pressure vessel supply chains nodes with respect to carbon fiber manufacturer. Toray, the manufacturer of T700S, has all of its North America polyacrylonitrile polymerization, precursor spinning, and carbon fiber conversion operations in Decatur, Alabama, which represents the likely origins of a significant share of North American pressure vessel CF. Toray also supplies inputs to Luxfer,60 Dynetek,61 Lincoln Composites,62 and Quantum Technologies (Quantum Technologies 2013). Toray also has polyacrylonitrile polymerization, precursor spinning, and carbon fiber conversion capabilities in France and Japan. Recently, Toray added new CF conversion capacity in Gumi, South Korea as well. Mitsubishi Rayon is also a CF supplier to Luxfer and Dynetek.63 In the largest and fastest growing NGV region (i.e., the Asia-Pacific region), CF manufacturer Toho Tenax is the exclusive CF supplier to Thailand-based composite pressure vessel manufacturer Metal Mate Co. Ltd.64
Table 5-8. Major Supply Chain Nodes for Type III and Type IV Pressure Vessels
Node Carbon Fiber Manufacturer
Toray Mitsubishi Rayon Toho Tenax
Polyacrylonitrile Decatur, AL, United States; Abidos, France; Ehime, Japan
Toyohashi, Japan; Otake Japan
Mishima, Japan
Precursor Decatur, AL, United States; Abidos, France; Ehime, Japan
Toyohashi, Japan; Otake Japan
Mishima, Japan
Carbon Fiber Decatur, AL, United States; Abidos, France; Ehime, Japan; Gumi, South Korea
Toyohashi, Japan; Otake, Japan; Sacramento, CA, United States; Wuppertal, Germany
Mishima, Japan; Oberbruch, Germany; Rockwood, TN, United States
60 “Luxfer Holdings Plc-Adr (LXFR:New York Consolidated),” Bloomberg, accessed February 20, 2014, http://investing.businessweek.com/research/stocks/snapshot/snapshot_article.asp?ticker=LXFR. 61 Ibid. 62 “Lincoln Composites Participates in Hydrogen Storage Project,” Amanda Jacob, Materials Today, 2013, accessed March 28, 2016, http://www.materialstoday.com/composite-applications/news/lincoln-composites-participates-in-us-hydrogen/. 63 Luxfer Holdings Plc-Adr (LXFR:New York Consolidated),” Bloomberg, accessed February 20, 2014, http://investing.businessweek.com/research/stocks/snapshot/snapshot_article.asp?ticker=LXFR. 64 “Toho Tenax Carbon Fiber Wins Place in Thai Pressure Vessels, “CompositesWorld, February 1, 2011, accessed February 20, 2014, http://www.compositesworld.com/news/toho-tenax-carbon-fiber-wins-place-in-thai-pressure-vessels.
82
Node Carbon Fiber Manufacturer
Toray Mitsubishi Rayon Toho Tenax
Composite/Tank Manufacturer
Dynetek Industries (Calgary, Alberta, Canada); Lincoln Composites (Lincoln, NB, United States); Luxfer Gas Cylinders (Riverside, CA, United States); Quantum Technologies (Irving, CA, United States)
Luxfer Gas Cylinders (Riverside, CA, United States)
Metal Mate Co. Ltd (Thailand)
Systems Integrators
Marubeni Metals Corp (Japan); McNeilus Truck (United States); Iris Bus (Italy); Thomas Built Buses (United States); NEOMAN (Europe); Heuliez Bus (Europe); BredaMenarinibus (Europe); Pleasanton Truck Equipment (United States); Daimler (Germany); Ford Motor Company (United States); Nissan (Japan); Ballard Power (Canada); Hyundai (South Korea); BMW (Germany); Aston Martin (UK); Volkswagen (Germany); Linde (Germany); Air Products (United States); Tyco (United States); Honeywell (United States); Lockheed Martin (United States)
BMW (Germany); Aston Martin (UK); Volkswagen (Germany); Linde (Germany); Air Products (United States); Tyco (United States); Honeywell (United States); Lockheed Martin (United States)
Linde (Germany); PTT Public Company (Thailand)
5.4 Manufacturing In the pressure vessel industry, filament winding is the primary CFRP manufacturing pathway used. In filament winding, CF tow is wound under tension around a rotating mandrel usually into a cylindrical shape such as that of a pressure vessel. Two types of filament winding are used in the pressure vessel industry. Wet filament winding entails passing dry tow through a resin bath at the filament winding station immediately before it is wound around the mandrel. Conversely, prepreg filament winding entails winding of a tow prepreg such that there is no passage of the tow through a resin bath at the filament winding station. Rather, the tow has been preimpregnated with resin at another location. Wet filament winding results in resin wastage as resin is flung off the tow between emerging from the resin bath and being wound on the mandrel. Because care must be taken not to fling excessive amounts of resin from the tow, wet filament winding uses a slower winding speed with the net effect of reducing plant capacity. Tight control of the resin-to-fiber ratio is likewise more difficult due to resin wastage. Finally, wet filament winding is also messier and is accompanied by offensive odors. Despite these drawbacks, wet filament winding is much more prevalent due its overall lower cost. The high cost of the prepreg intermediate makes prepreg filament winding the less prevalent option.
5.5 Regional Competitiveness A wet-filament-wound Type IV, 700-bar hydrogen storage pressure vessel for FCVs was selected as the representative case study for regional competitiveness analysis. Carbon fiber manufacturing is the upstream supply chain node where the regional comparison begins. For this reason, we examined regional competitiveness for CF manufacturing and wet filament winding. Filament winding was examined in the greatest detail (i.e., at the level of seven major process steps: liner forming and inspection; liner thermal annealing and inspection; fiber
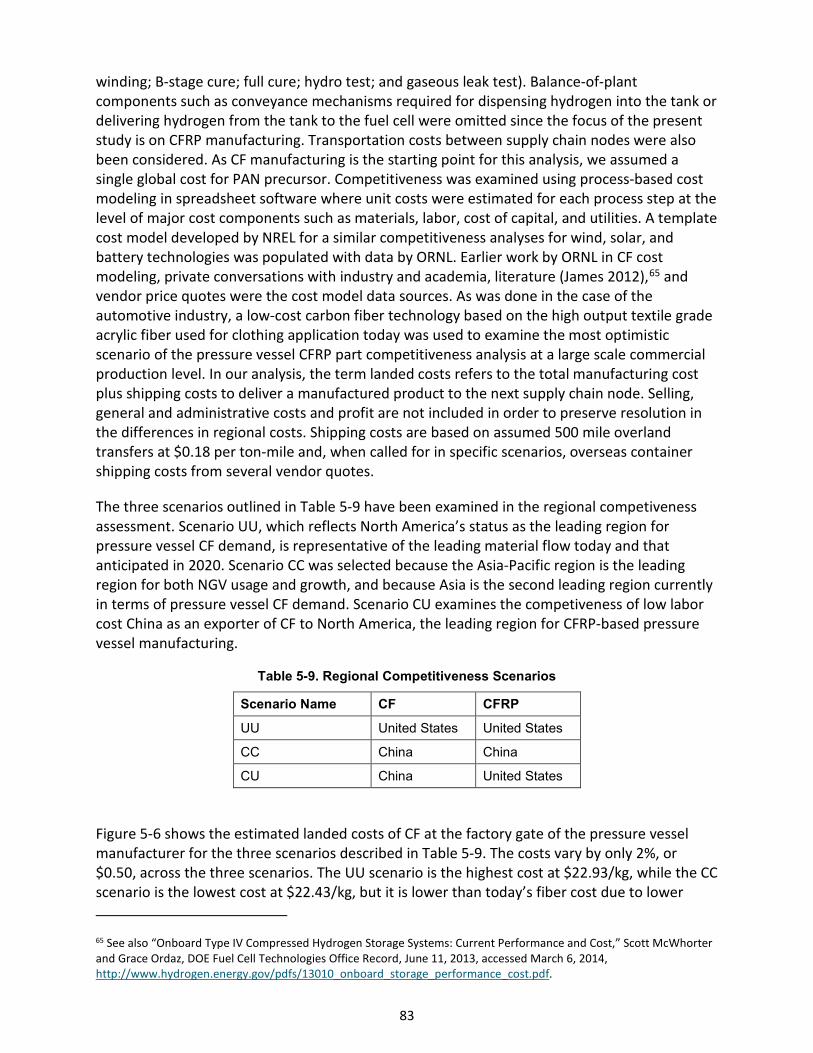
83
winding; B-stage cure; full cure; hydro test; and gaseous leak test). Balance-of-plant components such as conveyance mechanisms required for dispensing hydrogen into the tank or delivering hydrogen from the tank to the fuel cell were omitted since the focus of the present study is on CFRP manufacturing. Transportation costs between supply chain nodes were also been considered. As CF manufacturing is the starting point for this analysis, we assumed a single global cost for PAN precursor. Competitiveness was examined using process-based cost modeling in spreadsheet software where unit costs were estimated for each process step at the level of major cost components such as materials, labor, cost of capital, and utilities. A template cost model developed by NREL for a similar competitiveness analyses for wind, solar, and battery technologies was populated with data by ORNL. Earlier work by ORNL in CF cost modeling, private conversations with industry and academia, literature (James 2012),65 and vendor price quotes were the cost model data sources. As was done in the case of the automotive industry, a low-cost carbon fiber technology based on the high output textile grade acrylic fiber used for clothing application today was used to examine the most optimistic scenario of the pressure vessel CFRP part competitiveness analysis at a large scale commercial production level. In our analysis, the term landed costs refers to the total manufacturing cost plus shipping costs to deliver a manufactured product to the next supply chain node. Selling, general and administrative costs and profit are not included in order to preserve resolution in the differences in regional costs. Shipping costs are based on assumed 500 mile overland transfers at $0.18 per ton-mile and, when called for in specific scenarios, overseas container shipping costs from several vendor quotes.
The three scenarios outlined in Table 5-9 have been examined in the regional competiveness assessment. Scenario UU, which reflects North America’s status as the leading region for pressure vessel CF demand, is representative of the leading material flow today and that anticipated in 2020. Scenario CC was selected because the Asia-Pacific region is the leading region for both NGV usage and growth, and because Asia is the second leading region currently in terms of pressure vessel CF demand. Scenario CU examines the competiveness of low labor cost China as an exporter of CF to North America, the leading region for CFRP-based pressure vessel manufacturing.
Table 5-9. Regional Competitiveness Scenarios
Scenario Name CF CFRP
UU United States United States
CC China China
CU China United States
Figure 5-6 shows the estimated landed costs of CF at the factory gate of the pressure vessel manufacturer for the three scenarios described in Table 5-9. The costs vary by only 2%, or $0.50, across the three scenarios. The UU scenario is the highest cost at $22.93/kg, while the CC scenario is the lowest cost at $22.43/kg, but it is lower than today’s fiber cost due to lower
65 See also “Onboard Type IV Compressed Hydrogen Storage Systems: Current Performance and Cost,” Scott McWhorter and Grace Ordaz, DOE Fuel Cell Technologies Office Record, June 11, 2013, accessed March 6, 2014, http://www.hydrogen.energy.gov/pdfs/13010_onboard_storage_performance_cost.pdf.
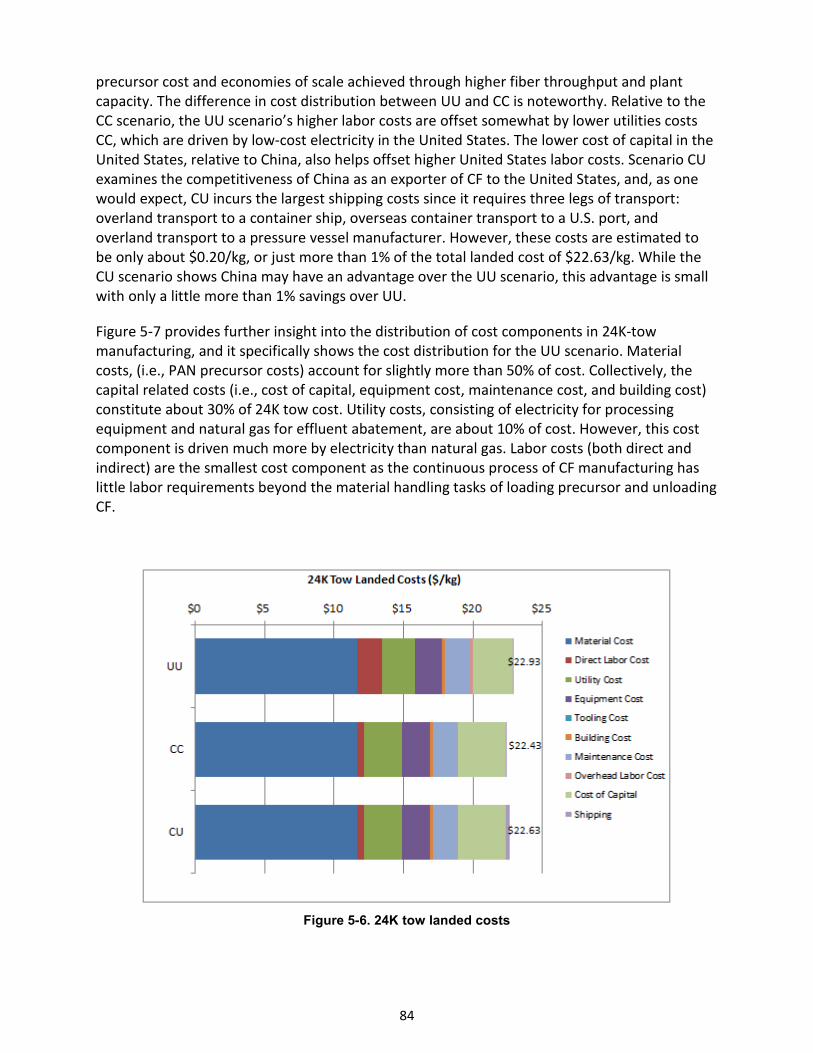
84
precursor cost and economies of scale achieved through higher fiber throughput and plant capacity. The difference in cost distribution between UU and CC is noteworthy. Relative to the CC scenario, the UU scenario’s higher labor costs are offset somewhat by lower utilities costs CC, which are driven by low-cost electricity in the United States. The lower cost of capital in the United States, relative to China, also helps offset higher United States labor costs. Scenario CU examines the competitiveness of China as an exporter of CF to the United States, and, as one would expect, CU incurs the largest shipping costs since it requires three legs of transport: overland transport to a container ship, overseas container transport to a U.S. port, and overland transport to a pressure vessel manufacturer. However, these costs are estimated to be only about $0.20/kg, or just more than 1% of the total landed cost of $22.63/kg. While the CU scenario shows China may have an advantage over the UU scenario, this advantage is small with only a little more than 1% savings over UU.
Figure 5-7 provides further insight into the distribution of cost components in 24K-tow manufacturing, and it specifically shows the cost distribution for the UU scenario. Material costs, (i.e., PAN precursor costs) account for slightly more than 50% of cost. Collectively, the capital related costs (i.e., cost of capital, equipment cost, maintenance cost, and building cost) constitute about 30% of 24K tow cost. Utility costs, consisting of electricity for processing equipment and natural gas for effluent abatement, are about 10% of cost. However, this cost component is driven much more by electricity than natural gas. Labor costs (both direct and indirect) are the smallest cost component as the continuous process of CF manufacturing has little labor requirements beyond the material handling tasks of loading precursor and unloading CF.
Figure 5-6. 24K tow landed costs
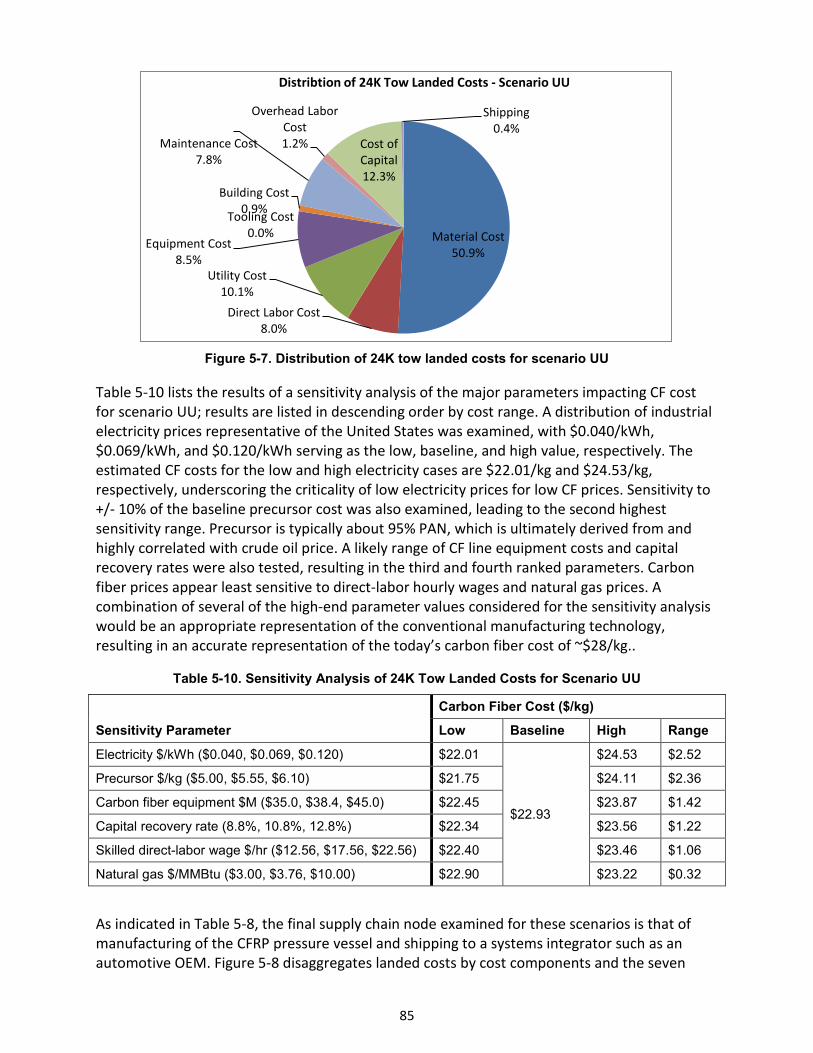
85
Figure 5-7. Distribution of 24K tow landed costs for scenario UU
Table 5-10 lists the results of a sensitivity analysis of the major parameters impacting CF cost for scenario UU; results are listed in descending order by cost range. A distribution of industrial electricity prices representative of the United States was examined, with $0.040/kWh, $0.069/kWh, and $0.120/kWh serving as the low, baseline, and high value, respectively. The estimated CF costs for the low and high electricity cases are $22.01/kg and $24.53/kg, respectively, underscoring the criticality of low electricity prices for low CF prices. Sensitivity to +/- 10% of the baseline precursor cost was also examined, leading to the second highest sensitivity range. Precursor is typically about 95% PAN, which is ultimately derived from and highly correlated with crude oil price. A likely range of CF line equipment costs and capital recovery rates were also tested, resulting in the third and fourth ranked parameters. Carbon fiber prices appear least sensitive to direct-labor hourly wages and natural gas prices. A combination of several of the high-end parameter values considered for the sensitivity analysis would be an appropriate representation of the conventional manufacturing technology, resulting in an accurate representation of the today’s carbon fiber cost of ~$28/kg..
Table 5-10. Sensitivity Analysis of 24K Tow Landed Costs for Scenario UU
Sensitivity Parameter Carbon Fiber Cost ($/kg)
Low Baseline High Range
Electricity $/kWh ($0.040, $0.069, $0.120) $22.01
$22.93
$24.53 $2.52
Precursor $/kg ($5.00, $5.55, $6.10) $21.75 $24.11 $2.36
Carbon fiber equipment $M ($35.0, $38.4, $45.0) $22.45 $23.87 $1.42
Capital recovery rate (8.8%, 10.8%, 12.8%) $22.34 $23.56 $1.22
Skilled direct-labor wage $/hr ($12.56, $17.56, $22.56) $22.40 $23.46 $1.06
Natural gas $/MMBtu ($3.00, $3.76, $10.00) $22.90 $23.22 $0.32
As indicated in Table 5-8, the final supply chain node examined for these scenarios is that of manufacturing of the CFRP pressure vessel and shipping to a systems integrator such as an automotive OEM. Figure 5-8 disaggregates landed costs by cost components and the seven
Material Cost50.9%
Direct Labor Cost8.0%
Utility Cost10.1%
Equipment Cost8.5%
Tooling Cost0.0%
Building Cost0.9%
Maintenance Cost7.8%
Overhead Labor Cost1.2% Cost of
Capital12.3%
Shipping0.4%
Distribtion of 24K Tow Landed Costs - Scenario UU
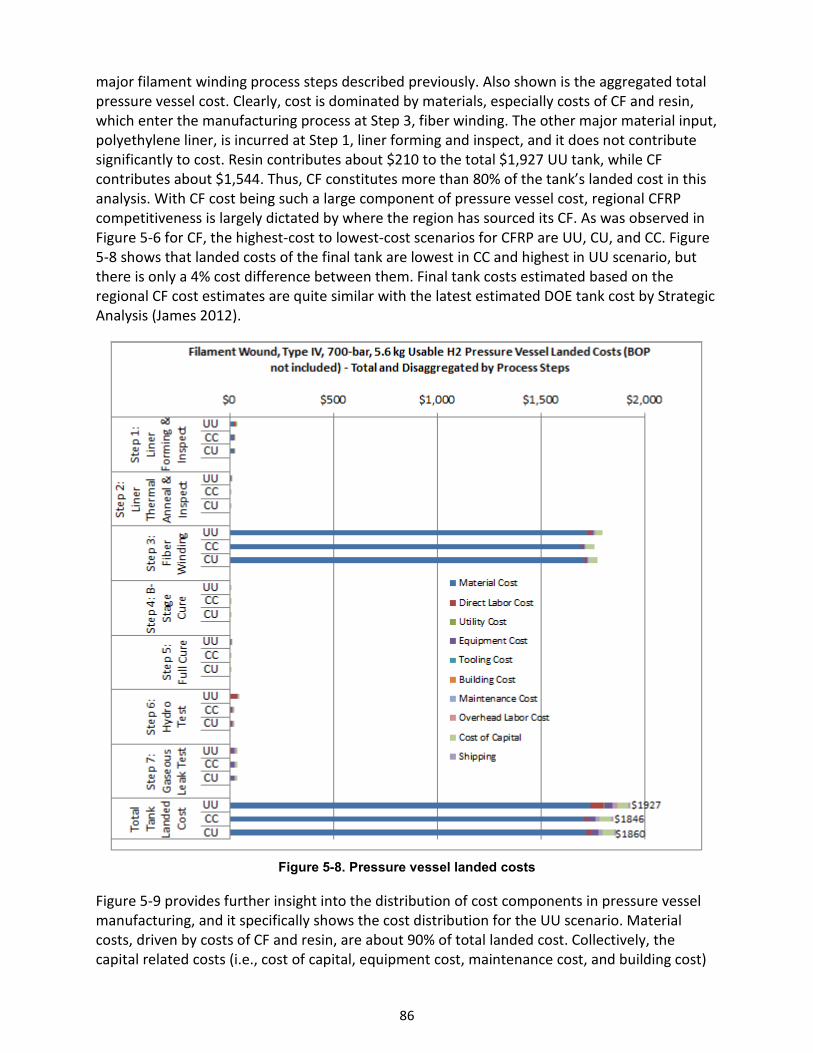
86
major filament winding process steps described previously. Also shown is the aggregated total pressure vessel cost. Clearly, cost is dominated by materials, especially costs of CF and resin, which enter the manufacturing process at Step 3, fiber winding. The other major material input, polyethylene liner, is incurred at Step 1, liner forming and inspect, and it does not contribute significantly to cost. Resin contributes about $210 to the total $1,927 UU tank, while CF contributes about $1,544. Thus, CF constitutes more than 80% of the tank’s landed cost in this analysis. With CF cost being such a large component of pressure vessel cost, regional CFRP competitiveness is largely dictated by where the region has sourced its CF. As was observed in Figure 5-6 for CF, the highest-cost to lowest-cost scenarios for CFRP are UU, CU, and CC. Figure 5-8 shows that landed costs of the final tank are lowest in CC and highest in UU scenario, but there is only a 4% cost difference between them. Final tank costs estimated based on the regional CF cost estimates are quite similar with the latest estimated DOE tank cost by Strategic Analysis (James 2012).
Figure 5-8. Pressure vessel landed costs
Figure 5-9 provides further insight into the distribution of cost components in pressure vessel manufacturing, and it specifically shows the cost distribution for the UU scenario. Material costs, driven by costs of CF and resin, are about 90% of total landed cost. Collectively, the capital related costs (i.e., cost of capital, equipment cost, maintenance cost, and building cost)
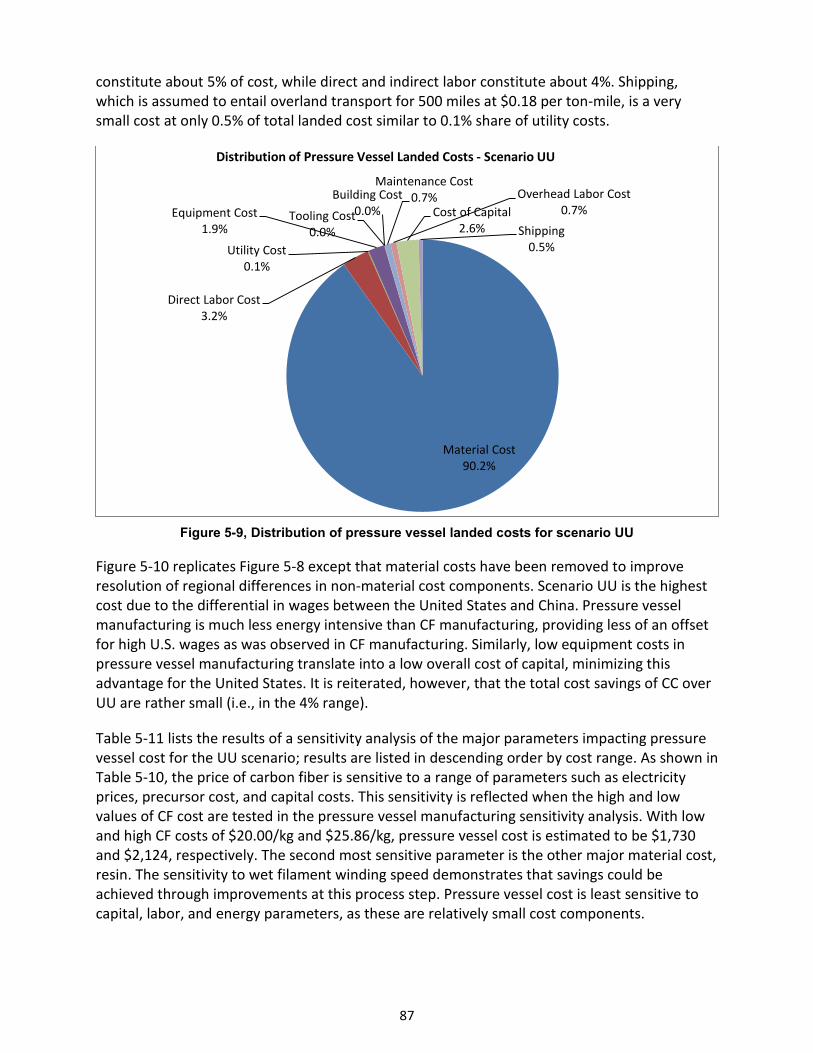
87
constitute about 5% of cost, while direct and indirect labor constitute about 4%. Shipping, which is assumed to entail overland transport for 500 miles at $0.18 per ton-mile, is a very small cost at only 0.5% of total landed cost similar to 0.1% share of utility costs.
Figure 5-9, Distribution of pressure vessel landed costs for scenario UU
Figure 5-10 replicates Figure 5-8 except that material costs have been removed to improve resolution of regional differences in non-material cost components. Scenario UU is the highest cost due to the differential in wages between the United States and China. Pressure vessel manufacturing is much less energy intensive than CF manufacturing, providing less of an offset for high U.S. wages as was observed in CF manufacturing. Similarly, low equipment costs in pressure vessel manufacturing translate into a low overall cost of capital, minimizing this advantage for the United States. It is reiterated, however, that the total cost savings of CC over UU are rather small (i.e., in the 4% range).
Table 5-11 lists the results of a sensitivity analysis of the major parameters impacting pressure vessel cost for the UU scenario; results are listed in descending order by cost range. As shown in Table 5-10, the price of carbon fiber is sensitive to a range of parameters such as electricity prices, precursor cost, and capital costs. This sensitivity is reflected when the high and low values of CF cost are tested in the pressure vessel manufacturing sensitivity analysis. With low and high CF costs of $20.00/kg and $25.86/kg, pressure vessel cost is estimated to be $1,730 and $2,124, respectively. The second most sensitive parameter is the other major material cost, resin. The sensitivity to wet filament winding speed demonstrates that savings could be achieved through improvements at this process step. Pressure vessel cost is least sensitive to capital, labor, and energy parameters, as these are relatively small cost components.
Material Cost90.2%
Direct Labor Cost3.2%
Utility Cost0.1%
Equipment Cost1.9%
Tooling Cost0.0%
Building Cost0.0%
Maintenance Cost0.7% Overhead Labor Cost
0.7%Cost of Capital2.6% Shipping
0.5%
Distribution of Pressure Vessel Landed Costs - Scenario UU
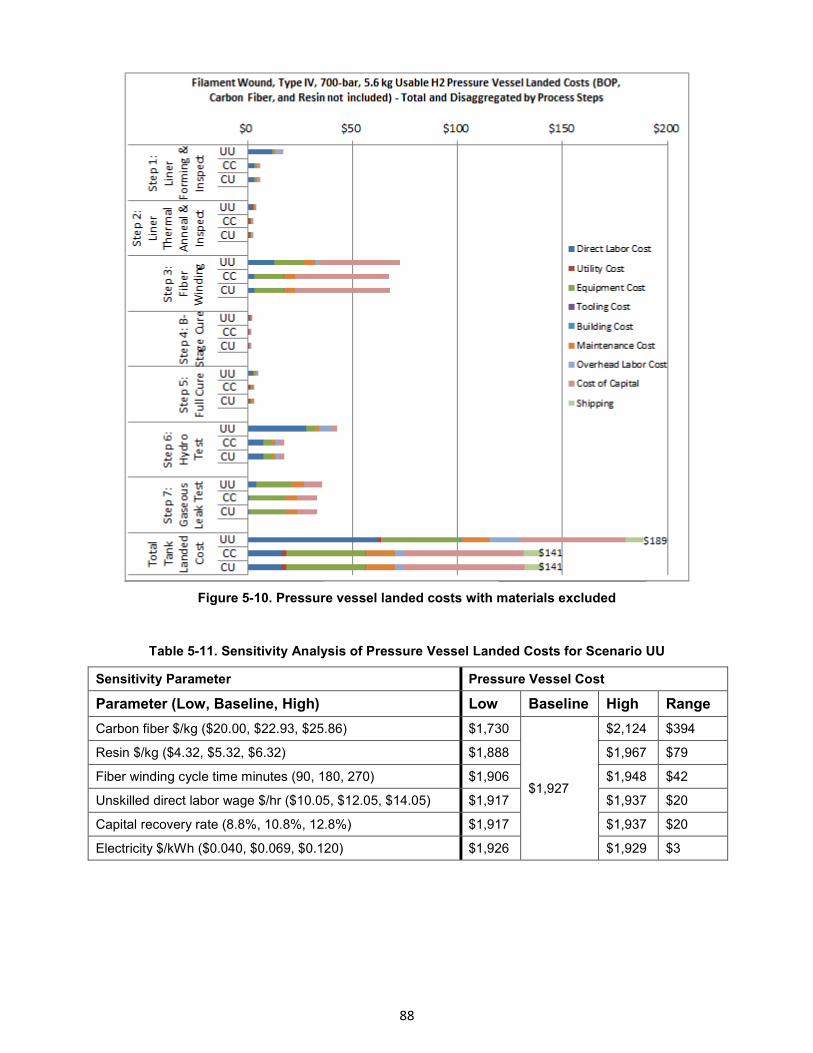
88
Figure 5-10. Pressure vessel landed costs with materials excluded
Table 5-11. Sensitivity Analysis of Pressure Vessel Landed Costs for Scenario UU
Sensitivity Parameter Pressure Vessel Cost
Parameter (Low, Baseline, High) Low Baseline High Range Carbon fiber $/kg ($20.00, $22.93, $25.86) $1,730
$1,927
$2,124 $394
Resin $/kg ($4.32, $5.32, $6.32) $1,888 $1,967 $79
Fiber winding cycle time minutes (90, 180, 270) $1,906 $1,948 $42
Unskilled direct labor wage $/hr ($10.05, $12.05, $14.05) $1,917 $1,937 $20
Capital recovery rate (8.8%, 10.8%, 12.8%) $1,917 $1,937 $20
Electricity $/kWh ($0.040, $0.069, $0.120) $1,926 $1,929 $3
89
5.6 Summary Four types of pressure vessels are commercially available, and they are distinguished by their material construction. Type III and Type IV are CFRP-based and are lighter, stronger, and longer lasting than metals-based Type I and Type II pressure vessels. The metals-based pressure vessels are much more prevalent due to their lower costs, but CFRP-based pressure vessels are increasing market share as transportation lightweighting and alternative fueling gain traction.
The leading application for pressure vessel CFRP in the present and near term is NGVs. Natural gas vehicles are most prevalent in developing Asia-Pacific and Latin American countries aiming to reduce automotive fuel costs and emissions. If adoption targets for FCVs are realized, in later decades, FCVs may eclipse NGVs as the leading application for pressure vessel CFRP. Bulk transportation of natural gas in truck-borne CFRP pressure vessels is also an important application enabling natural gas transport from locations where pipelines are infeasible. SCBA applications such as firefighting and underwater diving follow bulk transport of natural gas in terms of tonnes CF demanded.
While NGVs are concentrated in developing Asia-Pacific and Latin American countries, demand for pressure vessel CF is concentrated in North America where most of the major CFRP-based pressure vessel manufacturers are located. The major supply chains entail these pressure vessel manufacturers supplying systems integrators such as automotive OEMs, which in turn equip NGVs ultimately destined for Asia-Pacific and Latin America.
We conducted a regional competitiveness analysis to understand the major supply chains of today as well as potential future supply chains. Pressure vessel CF manufacturing in North America is estimated to be only about 2% more costly than manufacturing the same in China. Favorable electricity costs and costs of capital in the United States versus China help offset the substantially lower labor costs of the latter. Manufacturing CF in China and then exporting to the United States is estimated to have a very small advantage of only about 1% versus domestically manufactured CF. Carbon fiber constitutes a very large share of the total cost of pressure vessel CFRP. Thus, the competitiveness of a given region for pressure vessel CFRP manufacturing is largely dictated by from which region the CF was sourced.
In the near term, North America is forecasted to continue leading global CFRP-based pressure vessel manufacturing. Likewise, the United States is a very competitive region for pressure vessel CF manufacturing due chiefly to it having lower electricity costs than most of the world. The cost advantages of pressure vessel CF and CFRP manufacturing in low wage countries such as China are small. However, the leading end use application for CFRP-based pressure vessels, NGVs, is concentrated in Asia-Pacific and Latin America, which should be regarded as a potential threat to North America’s present industry dominance.
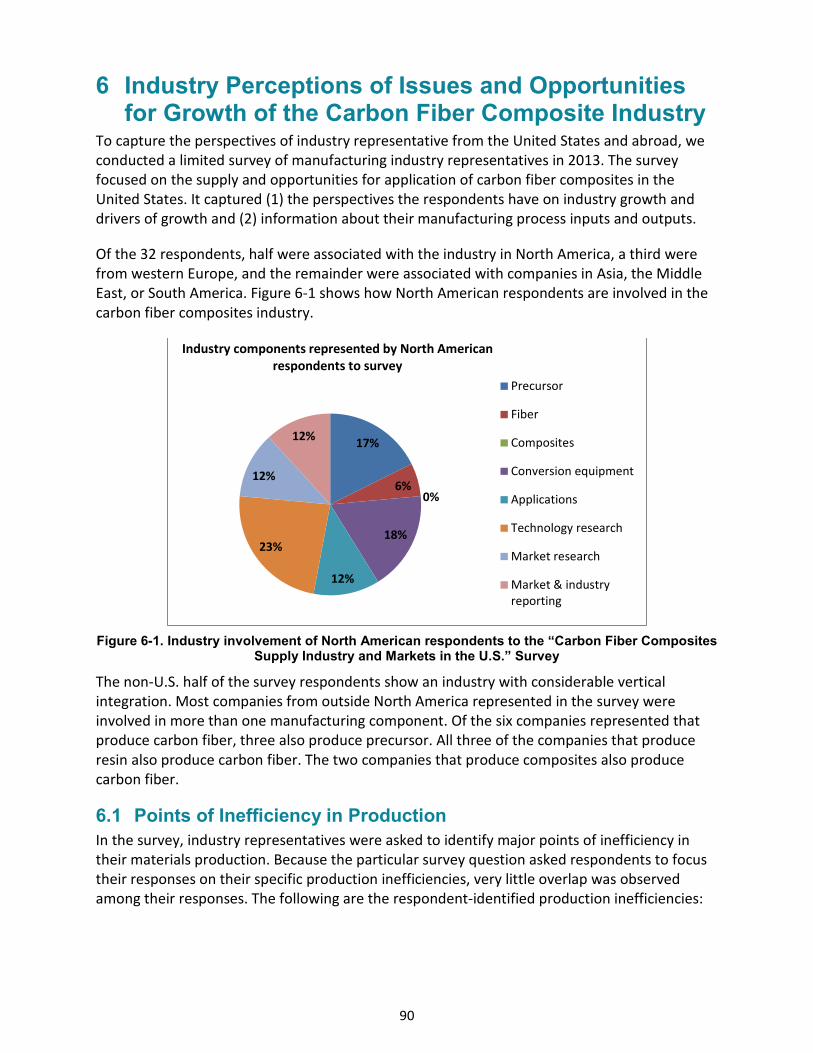
90
6 Industry Perceptions of Issues and Opportunities for Growth of the Carbon Fiber Composite Industry
To capture the perspectives of industry representative from the United States and abroad, we conducted a limited survey of manufacturing industry representatives in 2013. The survey focused on the supply and opportunities for application of carbon fiber composites in the United States. It captured (1) the perspectives the respondents have on industry growth and drivers of growth and (2) information about their manufacturing process inputs and outputs.
Of the 32 respondents, half were associated with the industry in North America, a third were from western Europe, and the remainder were associated with companies in Asia, the Middle East, or South America. Figure 6-1 shows how North American respondents are involved in the carbon fiber composites industry.
Figure 6-1. Industry involvement of North American respondents to the “Carbon Fiber Composites Supply Industry and Markets in the U.S.” Survey
The non-U.S. half of the survey respondents show an industry with considerable vertical integration. Most companies from outside North America represented in the survey were involved in more than one manufacturing component. Of the six companies represented that produce carbon fiber, three also produce precursor. All three of the companies that produce resin also produce carbon fiber. The two companies that produce composites also produce carbon fiber.
6.1 Points of Inefficiency in Production In the survey, industry representatives were asked to identify major points of inefficiency in their materials production. Because the particular survey question asked respondents to focus their responses on their specific production inefficiencies, very little overlap was observed among their responses. The following are the respondent-identified production inefficiencies:
17%
6%0%
18%
12%
23%
12%
12%
Industry components represented by North American respondents to survey
Precursor
Fiber
Composites
Conversion equipment
Applications
Technology research
Market research
Market & industryreporting
91
• Carbon fiber conversion into semi-finished goods
• Insufficient or ineffective regular maintenance check-ups (especially in waste gas treatment systems) that cause significant downtime
• High costs due to high temperature treatment and precursors
• High energy consumption
• High nitrogen purity investment
• Lengthy qualifications: excessive amount of testing
• Long cycle times for thermosets technology
• Focus on low-tonnage fiber and products that are not always profitable
• Inefficient production of PAN precursor without further processing into carbon fiber within the bounds of a single enterprise
• Inefficient production of customer-desired chemically modified products at small scale; the market will ultimately dictate which processes to scale up.
6.2 Industry-Diagnosed Growth Issues and Solutions The survey posed a series of questions to capture industry participants’ perspectives on issues that hinder the growth and competitiveness of the U.S. carbon fiber industry. These questions focused separately on materials-related issues, production-related issues, and policy-related issues. Table 6-1 presents these issues, noting the frequency with which an issue was mentioned either as a percentage of respondents for the more frequently mentioned issues or as the actual number of respondents, e.g., (1). Most significant among the issues affecting industry growth are production costs (and the related material price) and energy, with the latter primarily in the context of energy policy or strategy that would account for consider lightweight materials’ energy savings.
Table 6-1. Materials, Production and Policy Issues that Affect Growth and Competitiveness of the U.S. Carbon Fiber Composites Industry
Issue Category
Issue Type Description
Crosscutting Energy Thirty percent of respondents identified energy cost or energy source as an issue. U.S. respondents focused on the benefit of a policy that favors energy saving, while international respondents focused on perceptions that PAN based on fossil fuel is unsustainable. One non-U.S. respondent identified U.S. energy costs as a contributor to low-cost CF manufacturing.
General Some companies are suspicious of government-sponsored work and feel that participation in ORNL-led initiative could undermine position and technology (1)
Materials and Production
Cost Production cost and material price is the issue mentioned most frequently (33% of respondents). PAN precursor cost, is named specifically.
Domestic availability
1. Twelve percent of North American respondents and 31% of international respondents noted that their country’s industry is hampered by the absence of a lack of competitive producer in their
92
Issue Category
Issue Type Description
domestic industry. 2. Global industry capacity is considered too limited for next five
years of demand (1).
Production Investment 1. 16% of respondents noted that investment costs relative to the production output limit industry expansion. One respondent linked this t othe need for public financing.
2. Very few precursor manufacturers willing to sell their CF-ready technologies, so each entry company must embark on its own long technology development cycle (1).
3. In the United States, an anti-chemical business stance affects investment. (1)
Technology 1. Improved process automation will decrease cost and improve quality assurance (2)
2. A production facility with highly efficient pollution recovery sytems and ability or licenses to replicate the technology is needed in the United States; cooperation with U.S. EPA may be needed (1).
3. No significant technology breakthroughs (1) 4. Inefficienct conversion technologies (1) 5. Lack of preforming and conversion technology for aligned fiber
products (1) 6. Ultra-High Intensity processing of CF at temperature ranges of
2,400–2,800C (1) 7. Curing time for thermosets (1) 8. Lack of computer-assisted simulation and evaluation tools for CF
advanced design (1)
Labor 1. High labor cost in the United States (1) 2. Limited availability of skilled and trained workforce in the United
States (1); Lack of manufacturing workforce and engineers internationally (3)
Markets 1. Uncertain markets for automotive and wind applications in the United States challenge industry decision makers (2)
2. Ubiquitous use for carbon fiber composites can expand markets (1)
3. Strong position of Japanese CF producers challenges the U.S. industry (1)
Policy United States
1. Ten percent of respondents mentioned U.S. firms paying import taxes on precursor as a growth limiter (and the incongruity of imposing tax when there is no U.S.-based precursor production (1)).
1. U.S. export controls (of technologies and products) are poorly understood by manufacturers who then self-impose restrictions above the regulatory control levels (2).
2. A short-term view of research and development (R&D) (1)
Non-United States
1. EU restricion on acrylonitrile usage (banned from EU R&D programs) (1)
2. Inadequate federal attention to the industry (3)
93
Survey respondents offered several suggestions to address the materials, production, and policy issues identified above. Most identified needs related to policy and financial issues, although a number of production technology concepts also were promoted.
• Taxes and tax structures
o Assessment of special rates for lightweight materials
o Removal of U.S. tax on imported precursor (2)
o Implementation of tax incentives at the federal level to encourage investment (2) and at the local and state levels to encourage manufactures to build (1)
• R&D: structure and foci
o Public-private cooperation; industry investments with government support (3)
o Facilitation of international cooperation involving U.S. and European governments and bringing together of universities and end-user companies
o Focus of U.S. government programs only on those XYZ relevant to suppliers
o Sustained R&D investment and market development
o Large-scale XYZ
o Optimization of processes
o Focus on feedstocks and the scaling factor involved with supporting an industry with the potential usage as automotive
• Emissions related
o Streamlining of environmental approval for U.S. precursor production
o Continued U.S. government and industry cooperation on setting control levels (emissions related)
• Government outreach to industry to provide clear guidance on which exports are and which export are not controlled, especially regarding technology cooperation
• Industry investment (2), especially apart from the current path (i.e., investment in disruptive technology) (1)
• Industry partnerships (2)
• Public-private partnerships for financing (2) or some such structure to improve coordination among industry, university, and government groups
• Public financing, since return on investment is unattractive to traditional financing methods
• Workforce training programs (2)
• Re-education of engineers to design with CF
• Energy strategy that focuses on developing sustainable energy sources
• Specialized manufacturers that can provide small amounts of material
94
• Technology-focused solutions:
o Modernization of PAN precursor production technology (2) to produce quality precursor and integrate with CF production, especially concentrating more on 24K–50K range
o Technology related to raw materials, particularly in the development of extremely rapid “snap cure” resins
o Automated thermoplastics production with clean precursors
o Technology to shorten stabilization time
6.3 Perceptions of U.S. Industry’s Position and Market Growth Respondents shared their perceptions of the U.S. industry position along all nodes of the supply chain relative to other countries. Specifically, they were asked to focus on market share and market direction. As the survey included both U.S. and non-U.S. industry participants and because their perceptions could differ depending on that factor alone, we address their input separately.
Generally, the U.S. industry representatives observed that the United States lags behind Asian producers generally and Japanese producers in particular with respect to competitiveness and production particularly on the low-end of the market. The U.S. position in carbon fiber and composites is perceived as being much stronger than it is in precursor supply. Dedicated contracts with specific end users are the primary growth area for U.S. producers. There is some belief that the tempo of innovation has slowed in the United States, that U.S. government investment is small relative to investments by smaller governments such as South Korea and Australia, and that U.S. industries’ competitive rather than cooperative stance has hindered the U.S. position in world markets.
From non-U.S. industry representatives, the perception of the U.S. position is more mixed with about half of the respondents perceiving the United States to be positioned more strongly than other countries or as a strong competitor to Japan. This perception is fueled by the use of carbon fiber composites in aerospace applications produced by U.S. companies. Taking advantage of what has been learned through this application, with respect to quality control and design technologies and materials’ mechanical properties could be leveraged for growth in new application areas if the U.S. industry manages the situation well. Three limits to the U.S. industry were observed relative to other countries. First, Europe is perceived as moving more quickly on manufacturing methods largely because OEMs are more engaged in the R&D and in equipment investments. Second, Korean firms are growing fast and competing better in non-dedicated contract markets because of favorable prices and material availability. Third, there are no domestic incentives, policy-related or tax-wise, to manufacturing carbon fiber composites. Some international industry representatives perceive the U.S. industry to be benefitting from “high” financial support for R&D for fiber and composites and from the vertical integration of key production companies. It is widely expected that China is positioning itself to fill gaps in production and will compete well with the U.S. industry.
95
Respondents identified a diverse set of markets that they expect will drive growth in carbon fiber composites. Expected growth markets are
• Aircraft
• Automotive
• Batteries/electrodes
• Construction
• Defense
• Medical equipment
• Oil and gas
• Pressure vessels
• Recreational and sports products
• Wind power.
A sufficient number of growth estimates were offered for both aircraft and automotive markets to provide a synthesis of data. Respondents’ estimates of growth in the United States and worldwide at both 5 and 20 year horizons are summarized in Table 6-2. Growth in the demand from the aircraft market is expected to be greater in the short term but smaller in the long term than demand growth in the automotive market.
Table 6-2. Anticipated Growth in Automotive and Aircraft Demand for Carbon Fiber Composites
Market
5-Year horizon 20-Year horizon
United States Worldwide United States Worldwide
Mean (%) Range Mean Range Mean Range Mean Range
Automotive 48% 5,150 140% 3,500 263% 100,500 411% 401,500
Aircraft 60% 12,150 67% 10,300 179% 40,300 159% 50,300
Twelve and five respondents provided quantitative estimates of growth for the automotive and aircraft industries, respectively. Data were collected in 2013, so the 5-year horizon goes through the middle of 2018, while the 20-year horizon goes through the middle of 2033.
Industry representatives identified weight savings as the most significant driver of use of carbon fiber composites, and nearly half of all respondents noted it as the key driver. Other material properties mentioned as drivers include opportunities for aesthetics that add value to the product and product performance demands including durability, comfort, and corrosion resistance.
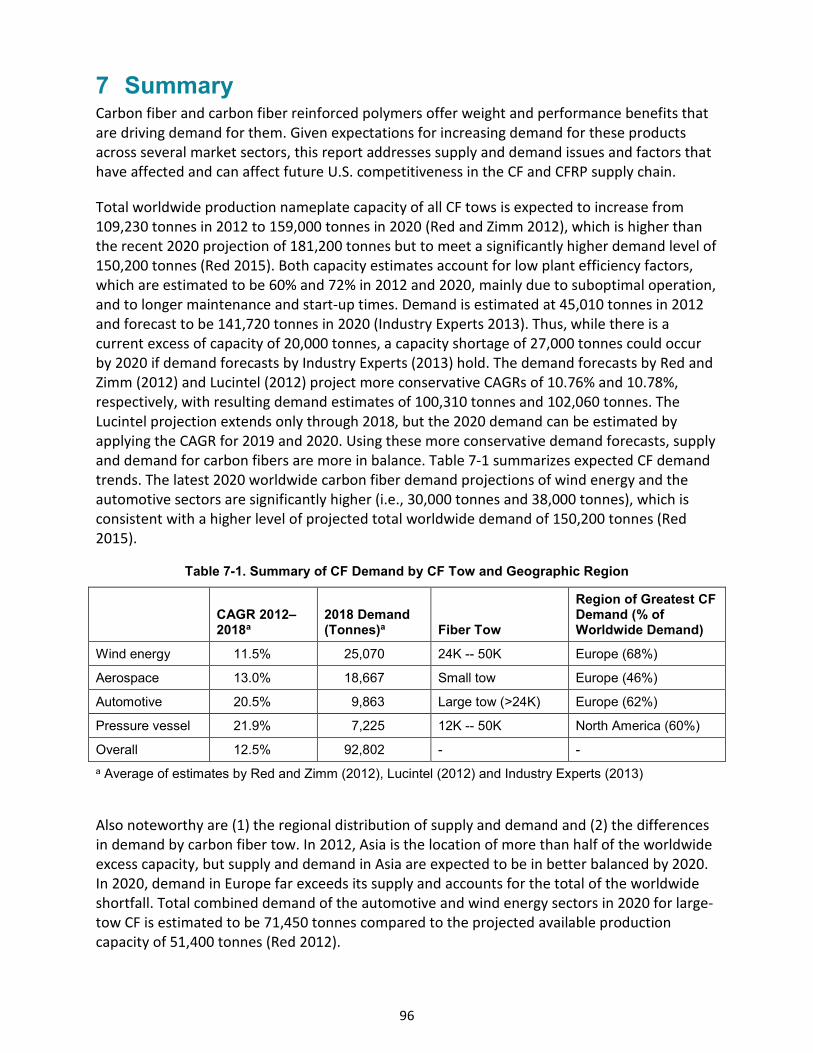
96
7 Summary Carbon fiber and carbon fiber reinforced polymers offer weight and performance benefits that are driving demand for them. Given expectations for increasing demand for these products across several market sectors, this report addresses supply and demand issues and factors that have affected and can affect future U.S. competitiveness in the CF and CFRP supply chain.
Total worldwide production nameplate capacity of all CF tows is expected to increase from 109,230 tonnes in 2012 to 159,000 tonnes in 2020 (Red and Zimm 2012), which is higher than the recent 2020 projection of 181,200 tonnes but to meet a significantly higher demand level of 150,200 tonnes (Red 2015). Both capacity estimates account for low plant efficiency factors, which are estimated to be 60% and 72% in 2012 and 2020, mainly due to suboptimal operation, and to longer maintenance and start-up times. Demand is estimated at 45,010 tonnes in 2012 and forecast to be 141,720 tonnes in 2020 (Industry Experts 2013). Thus, while there is a current excess of capacity of 20,000 tonnes, a capacity shortage of 27,000 tonnes could occur by 2020 if demand forecasts by Industry Experts (2013) hold. The demand forecasts by Red and Zimm (2012) and Lucintel (2012) project more conservative CAGRs of 10.76% and 10.78%, respectively, with resulting demand estimates of 100,310 tonnes and 102,060 tonnes. The Lucintel projection extends only through 2018, but the 2020 demand can be estimated by applying the CAGR for 2019 and 2020. Using these more conservative demand forecasts, supply and demand for carbon fibers are more in balance. Table 7-1 summarizes expected CF demand trends. The latest 2020 worldwide carbon fiber demand projections of wind energy and the automotive sectors are significantly higher (i.e., 30,000 tonnes and 38,000 tonnes), which is consistent with a higher level of projected total worldwide demand of 150,200 tonnes (Red 2015).
Table 7-1. Summary of CF Demand by CF Tow and Geographic Region
CAGR 2012–2018a
2018 Demand (Tonnes)a Fiber Tow
Region of Greatest CF Demand (% of Worldwide Demand)
Wind energy 11.5% 25,070 24K -- 50K Europe (68%)
Aerospace 13.0% 18,667 Small tow Europe (46%)
Automotive 20.5% 9,863 Large tow (>24K) Europe (62%)
Pressure vessel 21.9% 7,225 12K -- 50K North America (60%)
Overall 12.5% 92,802 - - a Average of estimates by Red and Zimm (2012), Lucintel (2012) and Industry Experts (2013)
Also noteworthy are (1) the regional distribution of supply and demand and (2) the differences in demand by carbon fiber tow. In 2012, Asia is the location of more than half of the worldwide excess capacity, but supply and demand in Asia are expected to be in better balanced by 2020. In 2020, demand in Europe far exceeds its supply and accounts for the total of the worldwide shortfall. Total combined demand of the automotive and wind energy sectors in 2020 for large-tow CF is estimated to be 71,450 tonnes compared to the projected available production capacity of 51,400 tonnes (Red 2012).
97
With all (1) of the three noted forecasts putting wind as the first or second largest demand sector and (2) each of the estimates showing wind will account for at least 25% of total demand, there seems little doubt about expected demand increases. Competing with wind energy for the large-tow fiber capacity will be the automotive sector. Although adoption of CF by the automotive sector has been slow and forecasts are less certain, the three industry sources—Red and Zimm (2012), Industry Experts (2013), and Lucintel (2012)—foresee automotive demand to rank between third and fifth among all demand sectors and to account for 5%–15% of all demand. Production expansions in small-tow capacity are expected to outpace expansions in large-tow capacity so that by 2020, 68% of capacity is projected to be small tow, compared to 63% currently (Red and Zimm 2012). Continued steady demand from the wind industry combined with expected increased demand from the automotive sector for large-tow CF exceed expected growth in supply for these fiber types and thus adequate large-tow CF capacity may be an issue.
Rounding out the top three demand sectors is the aerospace industry, which is the top most in terms of market value today. Using small-tow fibers, this industry does not compete directly with the other top markets for CF product and capacity. Also, predictions of aerospace’s share of the market are more consistent across the three key expert sources which estimate aerospace demand to account for between 16 and 25% of the market. Interestingly, it is the forecast with the shortest time horizon (Lucintel 2012 ) that puts aerospace demand above other sectors’ demands. This could suggest more similarity across the three sources, as other markets may surge later (i.e., after 2018).
Industry participants directly surveyed identified numerous growth markets for CFRP estimates of growth through 2018, but most focused on automotive and aerospace. From when participants reported in 2013 through 2018, industry experts project 48% growth in U.S. CF demand and 140% growth in worldwide CF demand for the automotive sector. The worldwide growth is consistent with the 20.5% CAGR growth rate reported in Table 7-1. The industry participants also expect 60% growth in aerospace CF use and 67% growth worldwide through 2018. Thus, industry participants’ growth projections for aerospace application of CF are more conservative than the CAGR cited in Table 7-1.
A regional analysis of the U.S. position in the four market sectors—wind energy, aerospace, automotive, and pressure vessels—shows the United States is currently competitive in these markets. A significantly smaller share of material shipping cost to the final product landed cost has contributed to a worldwide supply chain distribution in the industry today. Factors contributing to U.S. competitiveness in CF production include low utility costs that offset U.S. labor costs that are higher than labor in scenarios where production occurs in China or Japan. For wind energy, proximity to the location of deployment may affect future final-product manufacturing locations, as larger blades and transportation requirements present cost and logistic challenges. For aerospace markets, finished-CFRP product manufacturing locations also will be influenced by, but not dictated by, location. Factors such as informal business relationships, an established workforce or labor pool, and tax incentives have influenced regional competitiveness to date. In the automotive market, cost modeling of a U.S.-based supply chain for 50K-tow CF produced a product at an estimated cost of $15.65/kg, which was tied for the lowest-cost position and was 13.5% less than the modeled highest-cost Japan/Germany scenario. Since the wind sector uses similar CF, it is likely that U.S.
98
competitiveness in that demand sector will be similar to cost and competitiveness estimates for CF in the automotive sector. For a part-ready bidirectional fabric CFRP product, the modeled U.S.-based scenario produced a cost of $25.03/kg, which was second lowest among the five scenarios analyzed and was 17.9% less than the Japan/Germany scenario. The modeled lowest-cost part was produced through the China-based scenario and was 9.7% less than the U.S. scenario. For pressure vessels, the modeled U.S.-based scenario produced the highest cost CF, $22.93/kg, from among the three scenarios analyzed, but costs differed among scenarios by only 2.2%.
Sensitivity analyses show that CF costs are most sensitive to utility and precursor prices, while CFRP costs are generally most sensitive to CF costs. Actual finished part costs seem most sensitive to processing times and CFRP input costs.
The supply chain analyses and the industry participant surveys showed industries that are vertically integrated even if production locations for different nodes on the chain are on different continents. Industry participants noted that this vertical integration was driven (1) by the tightly linked processes at each step, and sometimes by proprietary nature and long development times associated with manufacturing processes and (2) in some applications, by very tight manufacturing tolerances. As process knowledge and automation increase, it is possible there will be less benefit to vertical integration.
99
8 References Abdallah, M. G. 2009, March. Status and Direction of Carbon Fiber Composites. Low Cost Carbon Fiber Composites in Energy Applications Workshop. Oak Ridge, TN: Oak Ridge National Laboratory.
Brosius, D. 2007, May 1. “Boeing 787 Update.” High-Performance Composites, accessed February 14, 2014, http://www.compositesworld.com/articles/boeing-787-update.
Captain, T. 2013. Global Aerospace & Defense Industry Financial Performance Study. New York City: Deloitte, accessed March 25, 2014, https://www2.deloitte.com/content/dam/Deloitte/ global/Documents/Manufacturing/gx_AD_industryperformancestudy_june2013.pdf.
Carson, E. G. 2012. The Future of Carbon Fiber to 2017. GoCarbon Conference. London.
Das, S. 2005. Cost-Effectiveness of Carbon Reinforced Composite Automotive Part Manufacturing Technologies. Conference proceedings from International Symposium of Society for the Advancement of Materials and Process Engineering.
Das, S., and J. Warren. 2012, April 5. Cost Modeling of Alternative Carbon Fiber Manufacturing Technologies: Baseline Model Demonstration. Presented at a DOE meeting in Washington, D.C.
Deo, R. B., J. H. Starnes, and R. C. Holzwarth. 2001. Low-Cost Composite Materials and Structures for Aircraft Applications. NATO RTO AVT Panel spring symposium and specialists’ meeting, Loen, Norway.
DOE (U.S. Department of Energy). 2015. Wind Vision: A New Era for Wind Power in the United States, Chapter 2. Washington, DC: U.S. Department of Energy.
Gardiner, G. 2011a, January 1. “Out-of-Autoclave Prepregs: Hype or Revolution?” High-Performance Composites, accessed March 31, 2014, http://www.compositesworld.com/articles/out-of-autoclave-prepregs-hype-or-revolution.
Gardiner, G. 2011b, September 1. “A350 XWB Update: Smart Manufacturing.” High-Performance Composites, accessed January 17, 2014, http://www.compositesworld.com/articles/a350-xwb-update-smart-manufacturing.
Griffith, D. T., and W. Johanns. 2013, April. Large Blade Manufacturing Cost Studies Using the Sandia Blade Manufacturing Cost Tool and Sandia 100-Meter Blades. Albuquerque, NM: Sandia National Laboratories. SAND2013-2734.
Holmes, M. 2014. “Carbon Fibre Reinforced Plastics Market Continues Growth Path.” Reinforced Plastics 57(6):24–29.
Industry Experts. 2013. Carbon Fibers and Carbon Fiber Reinforced Plastics (CFRP): A Global Market Overview. Hyderabad: Industry Experts.
100
International Trade Department. 2009. Air Freight: A Market Study with Implications for Landlocked Countries. Washington, D.C.: The World Bank Group, accessed February 25, 2014, from http://siteresources.worldbank.org/INTTRANSPORT/Resources/336291-1227561426235/5611053-1229359963828/5680661-1253555418746/tp-26-Air_Cargo_Study.pdf.
Jacob, A. 2014, January 16. “Carbon Fibre in Cars: 2013 in Review.” Reinforced Plastics 58(1):18–19.
James, B. 2012. Hydrogen Storage Cost Analysis, Preliminary Results. http://www.hydrogen.energy.gov/pdfs/review12/st100_james_2012_o.pdf, accessed February 20, 2014.
Jones, T, M. Dunwoodie, V. Boucher-Ferte, and O. Reiff. 2011, May 13. Bulk Chemicals for Beginners. Deutsche Bank.
Kraus, T., and M. Kuhnel. 2015, September. Composites Market Report 2015: Market Developments, Trends, Outlook, and Challenges. Germany: Carbon Composites.
LeGault, M. 2012a. “Pressure Vessel Tank Types.” High-Performance Composites, accessed February 18, 2014, http://www.compositesworld.com/articles/pressure-vessel-tank-types.
LeGault, M. 2012b. “Next-Generation Pressure Vessels.” High-Performance Composites, accessed February 18, 2014, http://www.compositesworld.com/articles/next-generation-pressure-vessels.
Li, Y., N. Li, and J. Gao. 2014, January. “Tooling Design and Microwave Curing Technologies for the Manufacturing of Fiber-Reinforced Polymer Composites in Aerospace Applications,” International Journal of Advanced Manufacturing Technology 70(1-4):591–606.
Lucintel. 2012, November. “Growth Opportunities in the Global Carbon Fiber Market: 2013-2018.” Irving, Texas.
Lucintel. 2014. Growth Opportunities for Composite CNG Tanks in Global Automotive Industry 2014-2019: Trend, Forecast, and Competitive Analysis.
Ma, W. 2011. “Cost Modelling for Manufacturing of Aerospace Composites.” MS Thesis, Cranfield University, Bedford.
Mann, P, et. al. 2011, April. Global Chemicals: An Investor’s Guide. Morgan Stanley.
Marsh, G. 2014, February 25. “Greater Role for Composites in Wind Energy,” Reinforced Plastics 58(1):20–24.
Mazumdar, S. 2014. “State of the Industry: Key Numbers and Opportunities in 2014.” Composites Manufacturing 2014(Jan/Feb):23–34.
Navigant Research. 2013a. Fuel Cell Vehicles – Light Duty Vehicles, Transit Buses, and Scooters: Global Market Analysis and Forecasts.
101
NGV Global. 2013. “Current Natural Gas Vehicle Statistics,” accessed February 18, 2014, http://www.iangv.org/current-ngv-stats/.
Niosi, J., and M. Zhegu. 2005. “Aerospace Clusters: Local or Global Knowledge Spillovers?” Industry & Innovation 12(1):5–29. Accessed March 28, 2016, http://www.tandfonline.com/ doi/abs/10.1080/1366271042000339049.
Okuno. M. 2011. “High-Performance Large Tow Carbon Fiber for Growing Industrial Applications,” paper presented at the CompositesWorld 2011 Carbon Fiber conference, December 5–7, Washington, D.C.
Onishi, M. 2012, September 21. Toray’s Business Strategy for Carbon Fiber Composite Materials, accessed January 14, 2014, http://www.toray.com/ir/pdf/lib/lib_a136.pdf.
Owens, B., J. Weber, B. F. Yancey, L. Zhuang, and R. Talreja. 2013. “Sustainability Assessment of a Wind Turbine Blade: An Engineering Framework,” paper presented at 54th AIAA/ASME/ASCE/AHS/ASC Structures, Structural Dynamics, and Materials Conference, April 8–11, in Boston, MA.
PCI Acrylonitrile Ltd. 2013. Acrylonitrile and Derivatives: World Supply/Demand Report.
Quantum Technologies. 2013. Form 10-K, accessed February 20, 2014, http://www.qtww.com/assets/u/2013AnnualReport.pdf.
Red, C. 2009, January 22. “The Outlook for Composite Pressure Vessels,” Composites Technology, accessed February 19, 2014, http://www.compositesworld.com/articles/the-outlook-for-composite-pressure-vessels,.
Red, C. 2012. 2012 Global Market for Carbon Fiber Composites: Maintaining Competitiveness in the Evolving Materials Market, presented at CW 2012, La Jolla, CA, December 4–6, 2012.
Red, C. 2013, December 13. Energy Drives the Need for Advanced Composites. Oak Ridge, TN: Oak Ridge National Laboratory. Composites Forecasts and Consulting, LLC.
Red, C. 2015. “2015 Global Markets for Carbon Fiber Composites: Adaptations to High Growth and Market Maturity,” CompositesWorld Carbon Fiber 2015 Conference, Knoxville, TN, December 8–10.
Red, C., and P. Zimm. 2012. 2012 Global Market for Carbon Fiber Composites: Maintaining Competitiveness in the Evolving Materials Market. CompositesWorld Carbon Fiber 2012 Conference, La Jolla, CA, December 4–6.
Roberts, T. 2009. The Carbon Fiber Industry Worldwide 2008–2014. Watford, UK: Materials Technology Publications.
Tang, C. S., and J. D . Zimmerman. 2009. “Managing New Product Development and Supply Chain Risks: The Boeing 787 Case.” International Journal 10(2):74–86.
van Gent, I., and C. Kassapoglou. 2013, November. “Cost-Weight Trades for Modular Composite Structures.” Structural and Multidisciplinary Optimization 2014(49):931–952.
102
Verrey, J., M. Wakeman, V. Michaud, and J.-A. E. Månson. 2006. “Manufacturing Cost Comparison of Thermoplastic and Thermoset RTM for an Automotive Floor Pan.” Composites: Part A: Applied Science and Manufacturing 37(1):9–22.
Wilson, C., and G. McGranaghan. 2014, March. “Infrared Heating Comes of Age.” Reinforced Plastics 58(2):43–47.
Wiser, R., and M. Bolinger, M. 2015, August. 2014 Wind Technologies Market Report. US. Department of Energy Office of Energy Efficiency and Renewable Energy..
Witik, R. A., F. Gaille, R. Teuscher, H. Ringwald, V. Michaud, and J.-A. Manson. 2011. “Assessing the Economic and Environmental Potential of Out of Autoclave Processing,” paper presented at International Conference on Composite Materials. Jeju Island, South Korea: The Institute of Materials, Minerals and Mining.
Wood, K. 2012, June. “Wind Turbine Blades: Glass vs. Carbon Fiber,” Composites Technology.
Wuellner, A. 2011. “SGL Automotive Carbon Fibers: Welcome to the Carbon Age in the Automotive Industry,” presented at the 14th Annual Global Outlook for Carbon Fiber, October 4–6, 2011.
Zimm, P. C. 2012. “Aircraft Raw Materials Outlook,” presented at CompositesWorld Carbon Fiber 2012. La Jolla, CA: Gardner Business Media.