CONDITION ASSESSMENT OF CARBON FIBER COMPOSITES …
99
CONDITION ASSESSMENT OF CARBON FIBER COMPOSITES USING RAMAN SPECTROSCOPY A Thesis Presented to the Faculty of the Graduate School of the University of Missouri - Columbia In Partial Fulfillment of the Requirements for the Degree Master of Science By Frank D. Blum, Jr. Dr. Glenn Washer, Graduate Advisor JULY 2009
Transcript of CONDITION ASSESSMENT OF CARBON FIBER COMPOSITES …
CONDITION ASSESSMENT OF CARBON FIBER
COMPOSITES USING RAMAN SPECTROSCOPY
A Thesis Presented to the Faculty of the Graduate School of the
University of Missouri - Columbia
In Partial Fulfillment of the Requirements for the Degree
Master of Science
By
Frank D. Blum, Jr.
Dr. Glenn Washer, Graduate Advisor
JULY 2009
The undersigned, appointed by the Dean of the Graduate School, have
examined the thesis entitled
CONDITION ASSESSMENT OF CARBON FIBER
COMPOSITES USING RAMAN SPECTROSCOPY
Presented by Frank D. Blum, Jr.,
A candidate for the degree of Master of Science,
And hereby certify that, in their opinion, it is worthy of acceptance.
Professor Glenn Washer
Professor John Bowders
Professor Roger Fales
ii
ACKNOWLEDGEMENTS
I would like to thank my advisor, Dr. Glenn Washer, Assistant Professor of
the Department of Civil and Environmental Engineering at the University of
Missouri-Columbia. Dr. Washer’s knowledge and supervision were critical in all
of the progress made on this project and in my development as a graduate
student.
For their expertise and generosity in equipment use I would like to thank
Dr. Steve Martin, Professor in the Department of Materials Science and
Engineering at Iowa State University, and Dr. Shubhra Gangopadhyay, Professor
in Electrical Engineering at the University of Missouri-Columbia. In addition to
these individuals I would like to express my gratitude to their research staff and
graduate students whom helped me during testing.
I would also like to thank Brian Samuels and Rex Gish and the rest of the
Engineering Technical Services (ETS) for their skill and technical assistance in
fabricating components for this project. Additionally I would like to thank a
number of graduate and undergraduate students who have helped me during my
graduate work. Naveen Bolleni, Tommy Brooks, Patrick Earney, Richard
Fenwick, Grant Luckenbill, Scott Morris, Seth Nelson, and Caleb Philipps all have
provided me with assistance in my research and graduate studies.

iii
Finally, I would like to give my sincere appreciation to the American
Society of Non-destructive Testing (ASNT) for funding this project and my
graduate studies.

iv
TABLE OF CONTENTS
ACKNOWLEDGEMENTS ......................................................................................ii
LIST OF FIGURES ...............................................................................................vii
LIST OF TABLES ............................................................................................... xiii
ABSTRACT ........................................................................................................ xiv
1 INTRODUCTION ........................................................................................... 1
1.1 Background ............................................................................................. 1
1.2 Goal ......................................................................................................... 2
1.3 Objectives ................................................................................................ 3
1.4 Scope ...................................................................................................... 3
2 BACKGROUND ............................................................................................. 5
2.1 Carbon Fiber ........................................................................................... 5
2.1.1 Overview ........................................................................................... 5
2.1.2 PAN-based ....................................................................................... 7
2.1.3 Pitch-based ....................................................................................... 8
2.1.4 Carbon Fiber Composites ................................................................. 9
2.1.5 Environmental Damage .................................................................. 10
2.2 Raman Spectroscopy ............................................................................ 11
2.3 Raman Spectroscopy of Carbon Fiber .................................................. 17

v
2.3.1 Raman Bands ................................................................................. 17
2.3.2 Strain Dependence ......................................................................... 20
3 EXPERIMENTAL ......................................................................................... 22
3.1 Instrumentation ...................................................................................... 22
3.2 Materials Tested .................................................................................... 24
3.2.1 Raw Fibers ...................................................................................... 24
3.2.2 Fiber/Epoxy Composites ................................................................. 28
3.2.3 Composites from Burst Tanks ......................................................... 29
3.3 Testing Methods .................................................................................... 34
3.3.1 Set-up and Procedure ..................................................................... 34
3.3.2 Strain Testing .................................................................................. 36
4 RESULTS .................................................................................................... 39
4.1 Spectra of Carbon Fibers and Composites ............................................ 39
4.1.1 Carbon Fibers ................................................................................. 39
4.1.2 Fiber/Epoxy Composites ................................................................. 44
4.1.3 Spectral Processing and Comparison ............................................. 46
4.1.4 Raman Bands ................................................................................. 49
4.2 Strain Testing Results ........................................................................... 50
4.2.1 Peak Shift ....................................................................................... 50
4.2.2 Full-width-at-half-maximum ............................................................. 61
vi
4.2.3 Intensity .......................................................................................... 65
4.3 Composite Material from Tanks ............................................................. 69
4.4 Data Summary and Discussion ............................................................. 77
5 CONCLUSIONS .......................................................................................... 80
5.1 Conclusions ........................................................................................... 80
5.2 Future Work ........................................................................................... 82
REFERENCES ................................................................................................... 83

vii
LIST OF FIGURES
Figure 2-1. Graphene layer in which carbon atoms are organized in a hexagonal
lattice. ................................................................................................................... 6
Figure 2-2. Commercially available tough shell COPVs for gas storage
manufactured by Lincoln Composites and published on the Lincoln Composites
website. ................................................................................................................ 9
Figure 2-3. A diatomic molecule showing the Raman scattering process. Energy
(via a photon) interacts with the molecule and is scattered at a different energy
level. ................................................................................................................... 13
Figure 2-4. An energy level diagram of different energy types of scattering during
the Raman process. ........................................................................................... 14
Figure 2-5. Illustration of converting absolute wavenumbers to Raman shifts [7].
........................................................................................................................... 15
Figure 2-6. Schematic of a typical Raman spectrometer. ................................. 17
Figure 2-7. Raman spectra of carbon fiber showing the G-band attributed to a
single graphite crystal and the D-band associated with structural disorder of the
crystal lattice. ...................................................................................................... 19
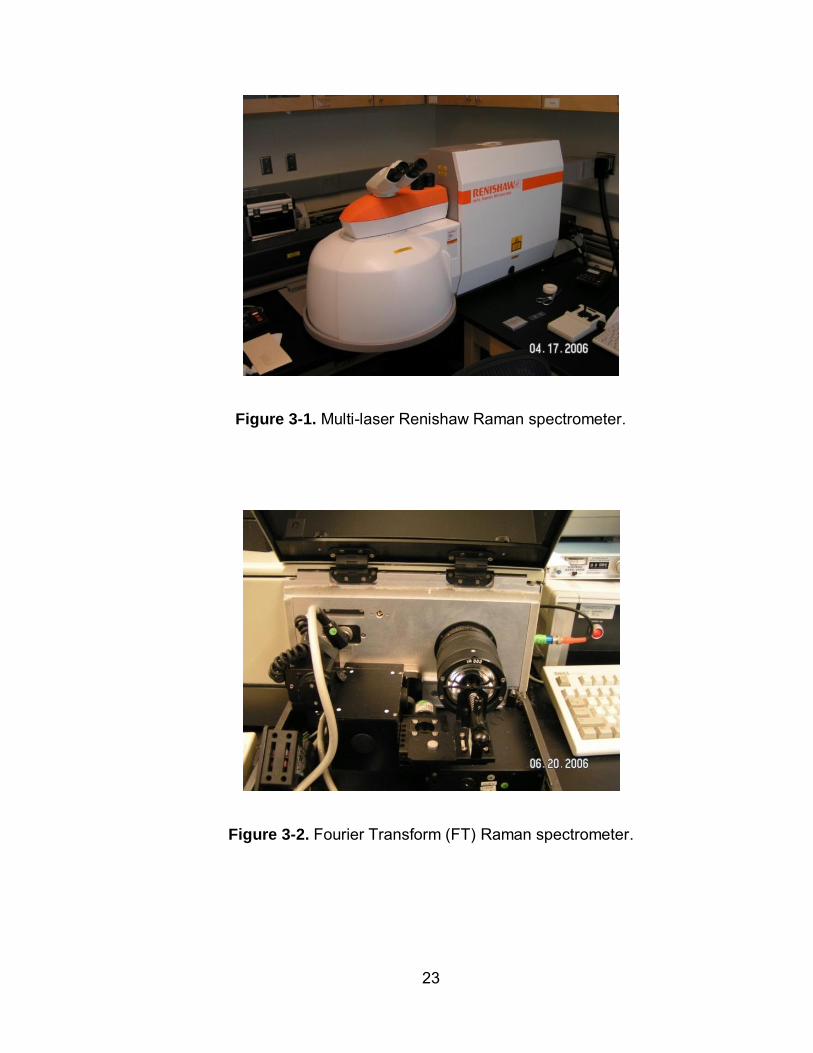
Figure 3-1. Multi-laser Renishaw Raman spectrometer. .................................... 23
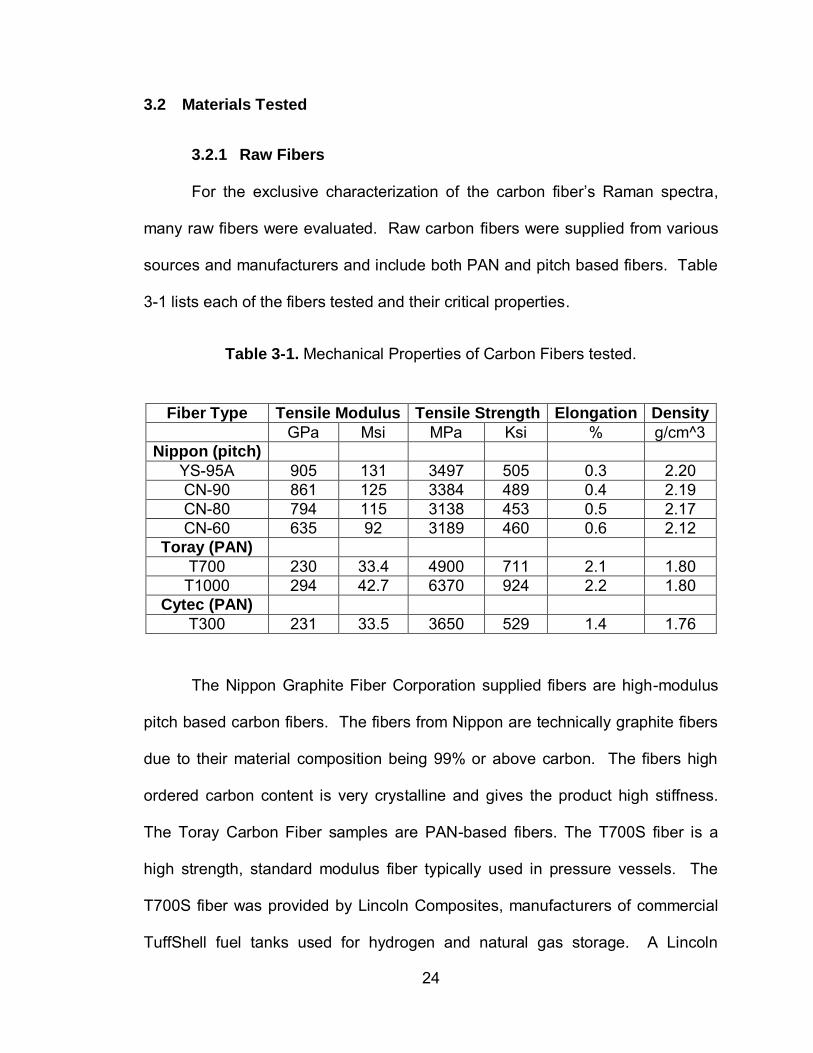
Figure 3-2. Fourier Transform (FT) Raman spectrometer. ................................. 23
Figure 3-3. Nippon Graphite Fibers samples from top left clockwise, CN60,
CN80, YS-95A, and CN90. ................................................................................. 25
Figure 3-4. Spool of T700 fiber (left) and a section of T1000 fiber (right). ......... 26

viii
Figure 3-5. Image of T1000 carbon fiber at 5000x using an electron microscope.
........................................................................................................................... 26
Figure 3-6. Image of T1000 carbon fiber at 4860x using an electron microscope.
........................................................................................................................... 27
Figure 3-7. Image of T1000 carbon fiber at 300x using an electron microscope.
........................................................................................................................... 27
Figure 3-8. Image of Hexcel IM-7 spool (top) and Toray T1000 spool (bottom). 29
Figure 3-9. Image of T1000/epoxy burst COPV. ................................................ 30
Figure 3-10. Zoom-in image of T1000/epoxy wrapping material of COPV. ........ 31
Figure 3-11. Zoom-in image of burst tank with IM7/epoxy with peal-ply treatment
on the outer surface. ........................................................................................... 31
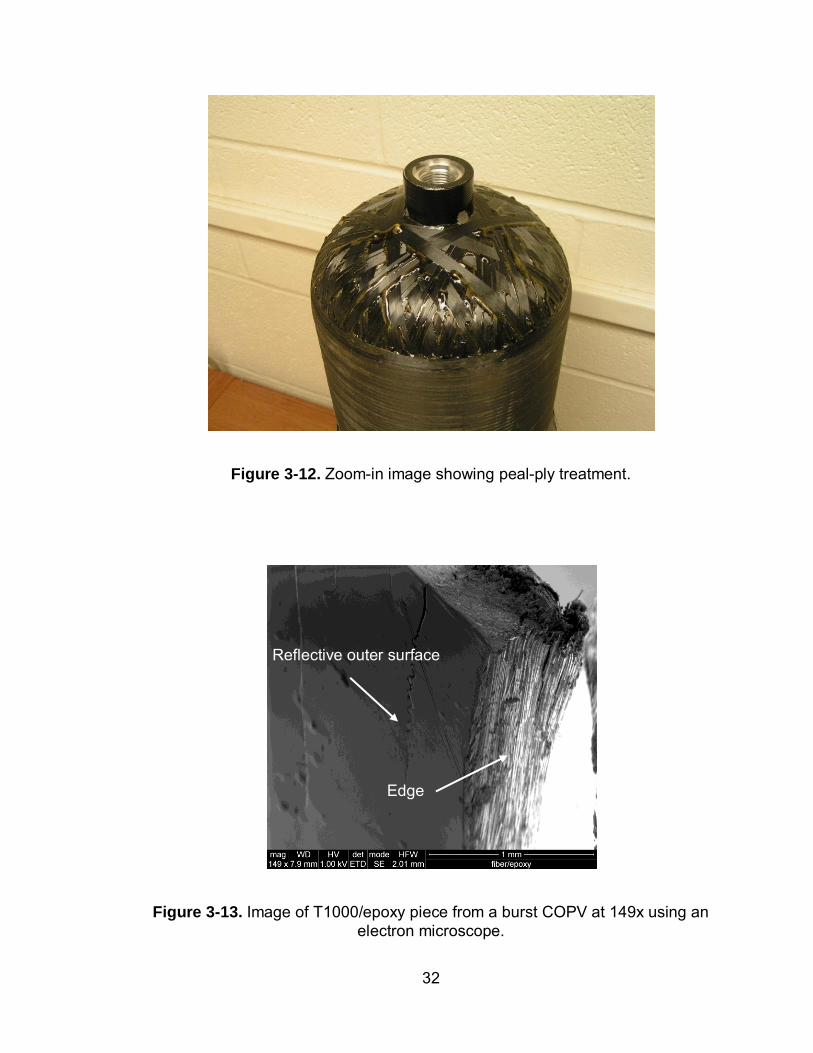
Figure 3-12. Zoom-in image showing peal-ply treatment. .................................. 32
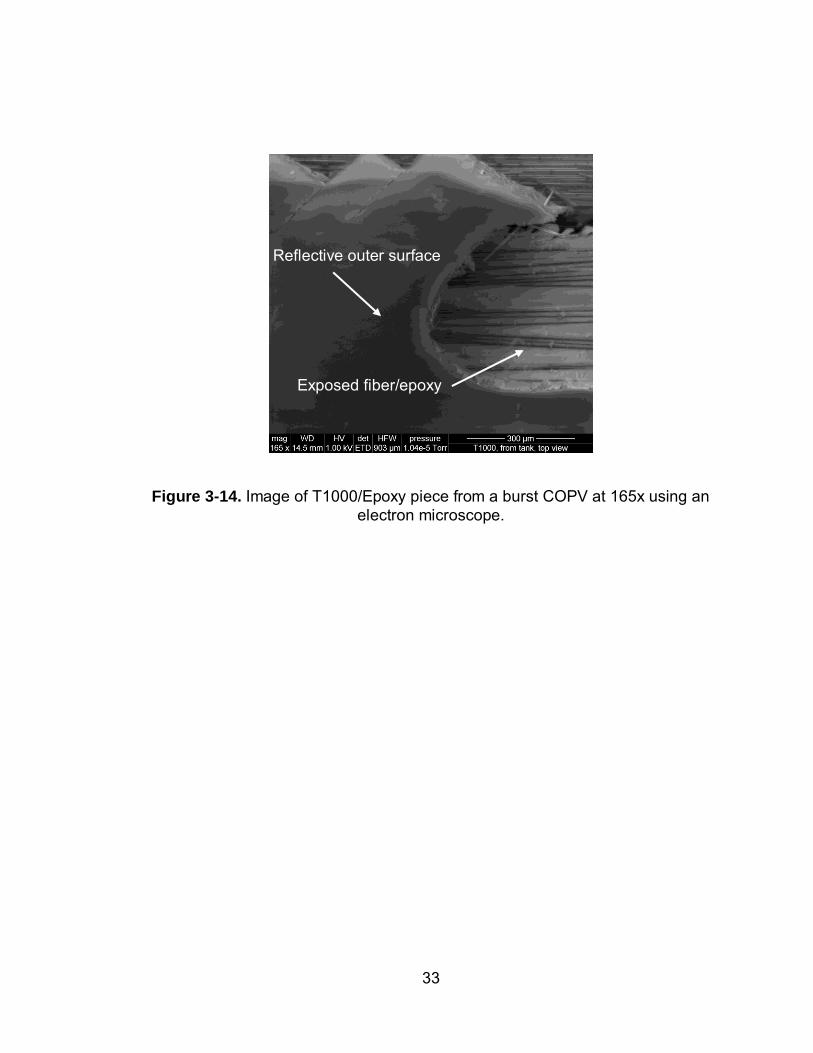
Figure 3-13. Image of T1000/epoxy piece from a burst COPV at 149x using an
electron microscope. .......................................................................................... 32
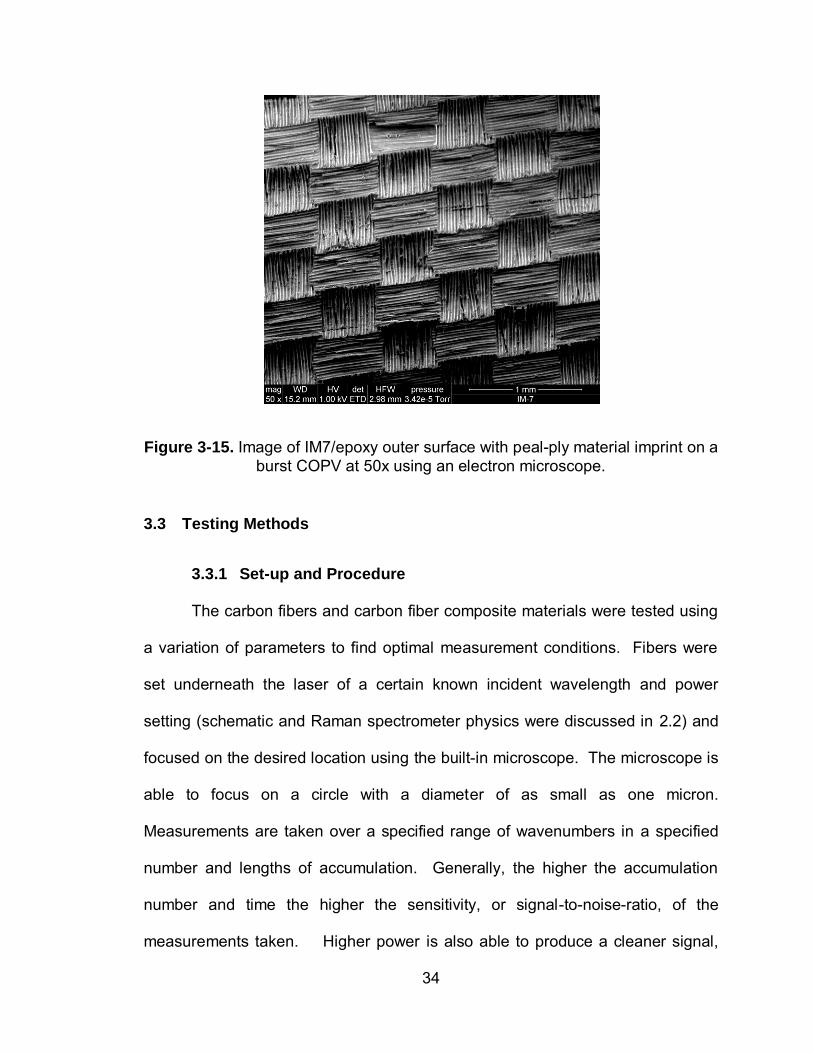
Figure 3-14. Image of T1000/Epoxy piece from a burst COPV at 165x using an
electron microscope. .......................................................................................... 33
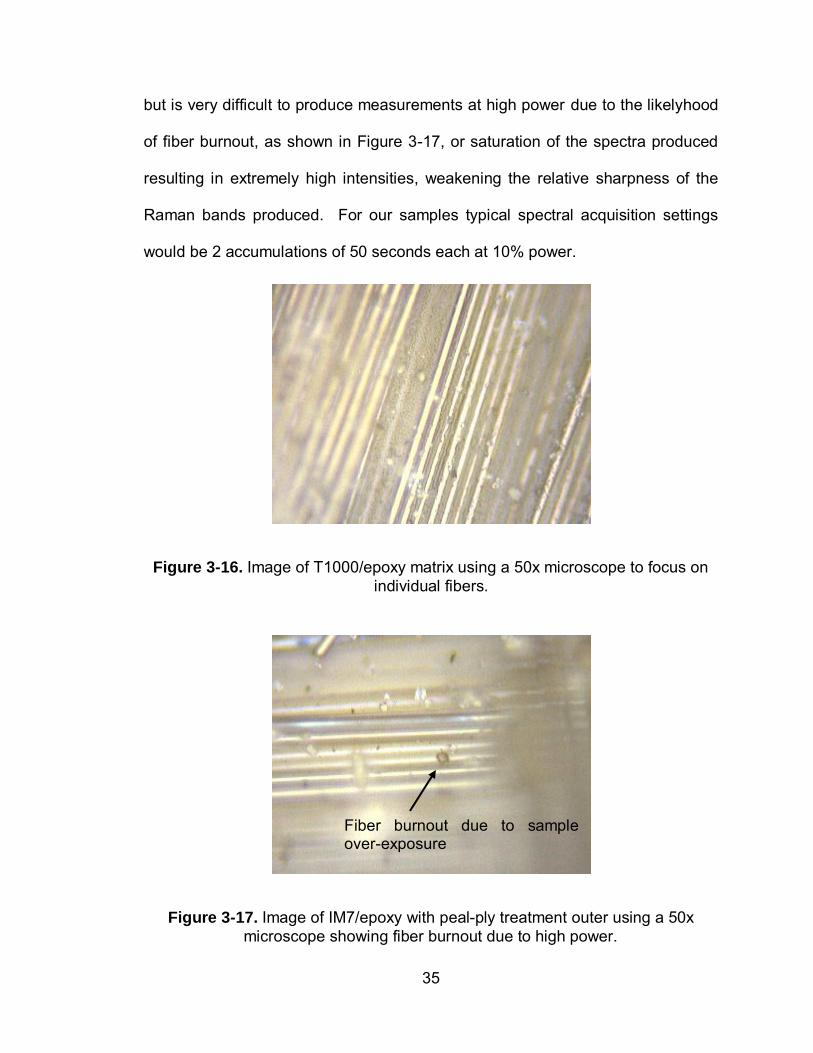
Figure 3-15. Image of IM7/epoxy outer surface with peal-ply material imprint on a
burst COPV at 50x using an electron microscope. ............................................. 34
Figure 3-16. Image of T1000/epoxy matrix using a 50x microscope to focus on
individual fibers. .................................................................................................. 35
Figure 3-17. Image of IM7/epoxy with peal-ply treatment outer using a 50x
microscope showing fiber burnout due to high power. ........................................ 35
ix
Figure 3-18. (Left) Initial load frame with load cell to measure force applied.
(Right) Wireless node that broadcasts load cell data to computer. ..................... 36
Figure 3-19. Load frame that applies load by raising steel rod in the middle of
frame, where applied strain can be calculated using the Pythagorean Theorem.
The fibers are oriented parallel to the direction of stretching. ............................. 37
Figure 4-1. Spectra of Nippon Graphite fibers (pitch-based) and identification of
the active Raman bands using a 752nm incident laser. ..................................... 40
Figure 4-2. Spectra of Nippon Graphite fibers (pitch-based) and identification of
the active Raman bands using a 514nm incident laser. ..................................... 41
Figure 4-3. Spectra of Toray T700 fiber (PAN-based) and identification of the
active Raman bands using incident lasers of 488, 647, and 752 nm. ................. 42
Figure 4-4. Spectra of Toray T1000 fiber (PAN-based) and identification of the
active Raman bands using incident lasers of 514 and 752 nm. .......................... 43
Figure 4-5. Spectra of Cytec T300 fiber (PAN-based) and identification of the
active Raman bands using a 752 nm incident laser. .......................................... 44
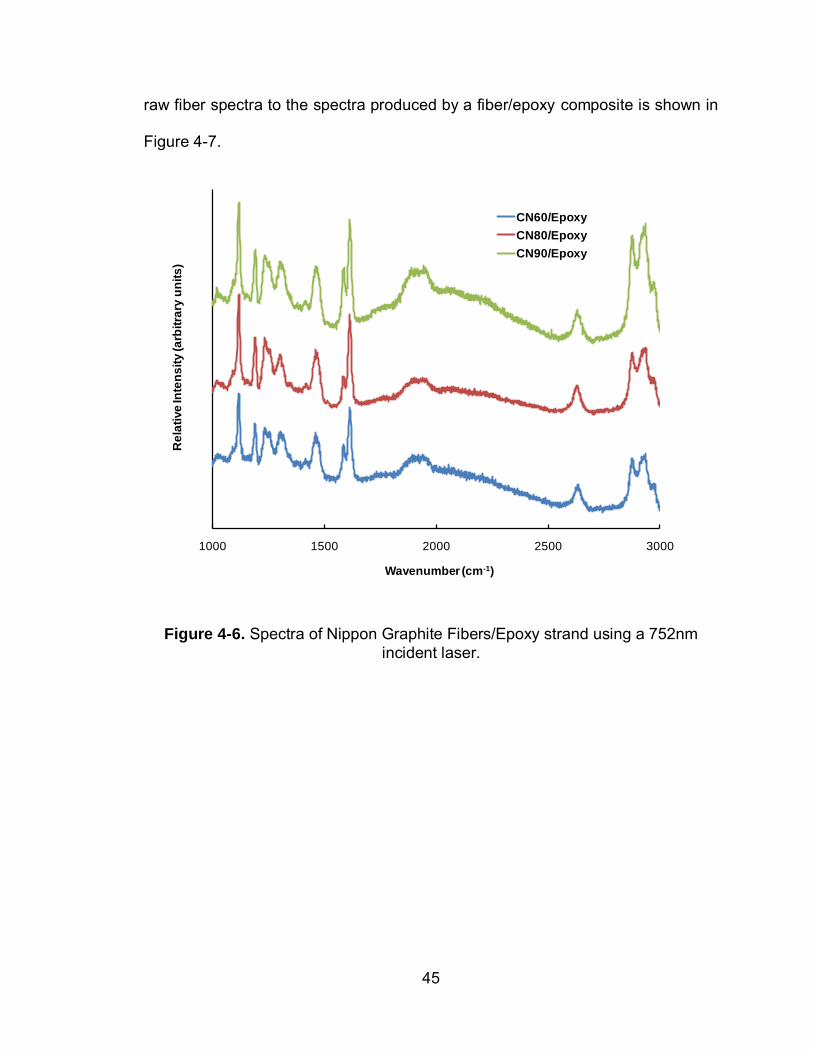
Figure 4-6. Spectra of Nippon Graphite Fibers/Epoxy strand using a 752nm
incident laser. ..................................................................................................... 45
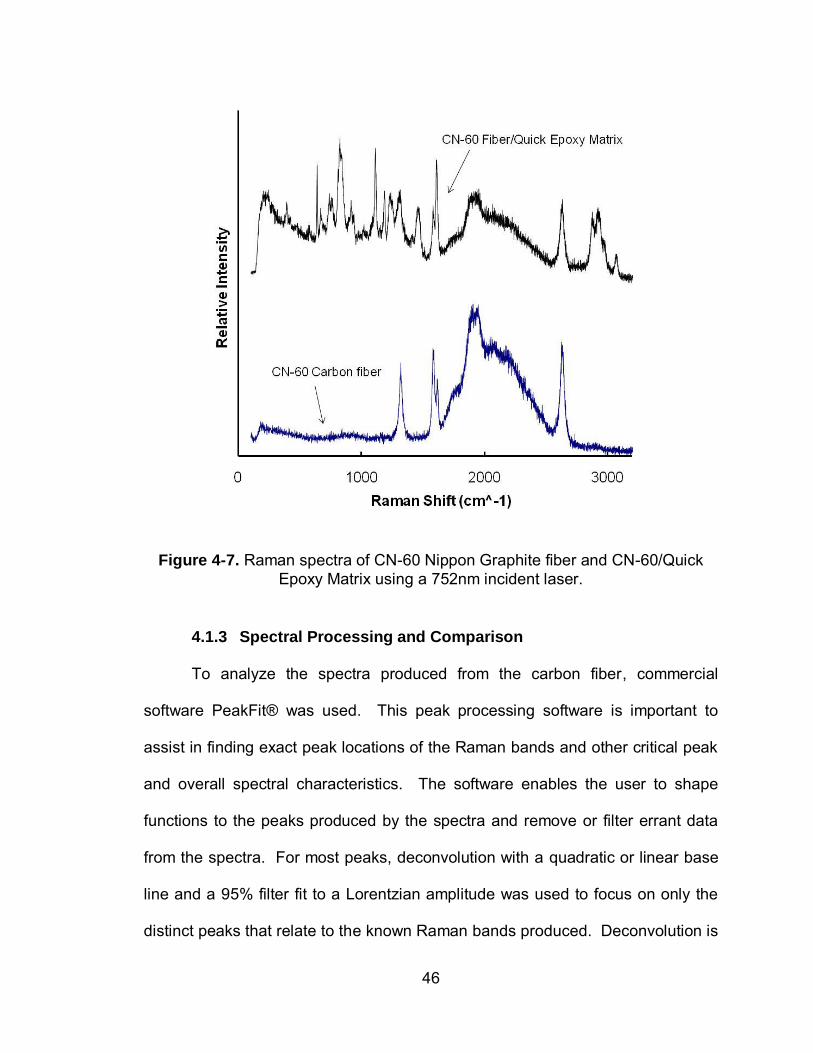
Figure 4-7. Raman spectra of CN-60 Nippon Graphite fiber and CN-60/Quick
Epoxy Matrix using a 752nm incident laser. ....................................................... 46
Figure 4-8. T1000 fiber spectrum from a 514nm incident laser. PeakFit® allows
users to select filters and specifications to remove false peaks that may appear
due to sampling imperfections. ........................................................................... 47
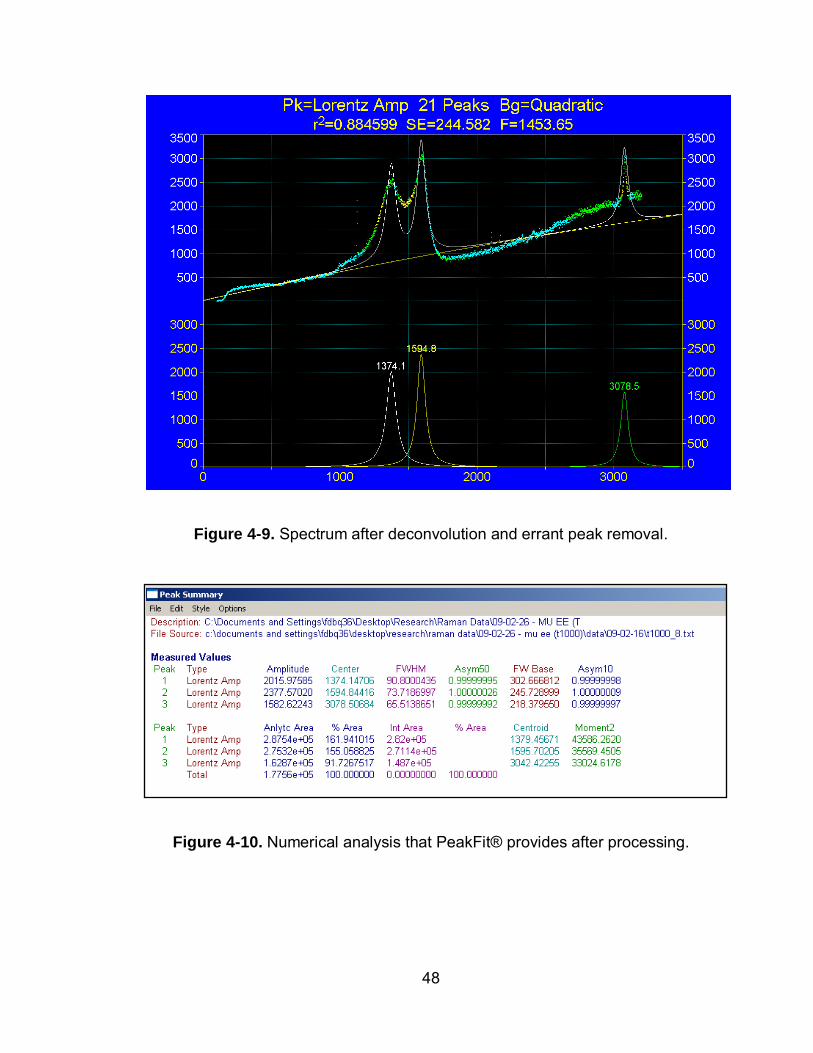
Figure 4-9. Spectrum after deconvolution and errant peak removal. ................. 48
x
Figure 4-10. Numerical analysis that PeakFit® provides after processing. ........ 48
Figure 4-11. Zoom-in of a raw and processed spectra of T1000 carbon fiber
showing D and G band shifts at 0% and 1.83% applied strain using a 752nm
incident laser. ..................................................................................................... 52
Figure 4-12. Zoom-in of a raw and processed spectra of T1000 carbon fiber
showing D and G band shifts at 0% and 1.68% applied strain using a 514nm
incident laser. ..................................................................................................... 53
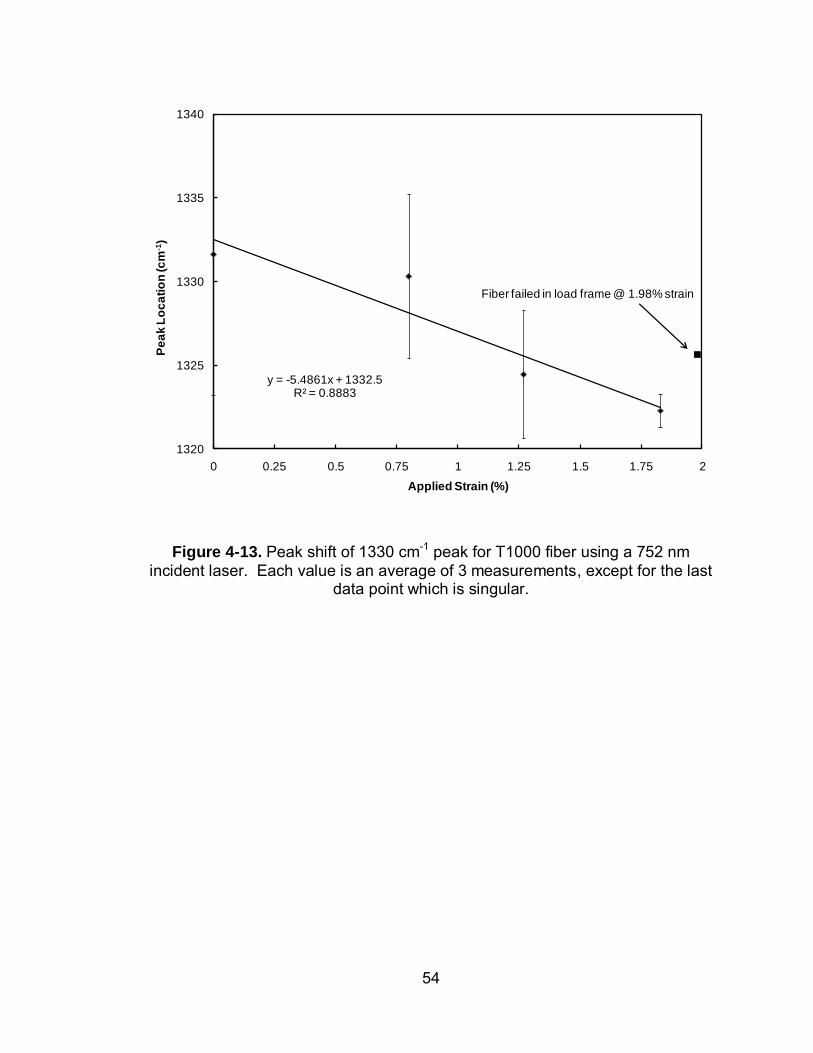
Figure 4-13. Peak shift of 1330 cm-1 peak for T1000 fiber using a 752 nm
incident laser. Each value is an average of 3 measurements, except for the last
data point which is singular................................................................................. 54
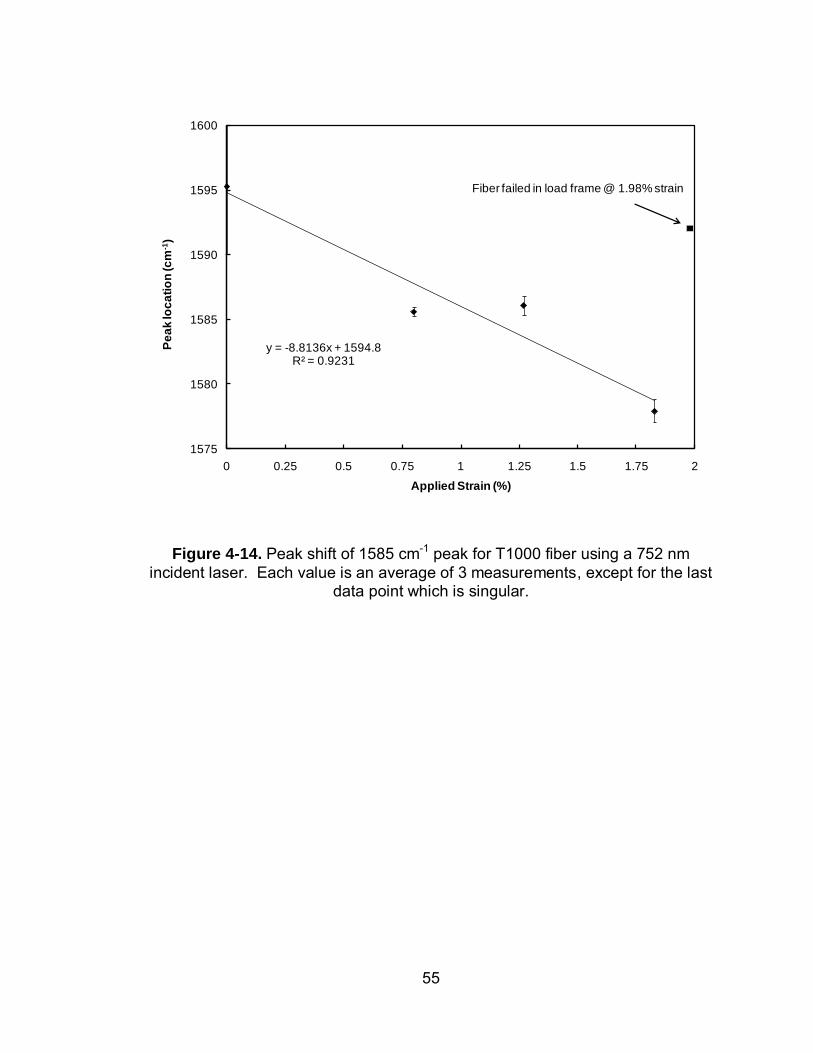
Figure 4-14. Peak shift of 1585 cm-1 peak for T1000 fiber using a 752 nm
incident laser. Each value is an average of 3 measurements, except for the last
data point which is singular................................................................................. 55
Figure 4-15. Peak shift of 1360 cm-1 peak for T1000 fiber using a 514 nm
incident laser. Each value is an average of 4 measurements. ........................... 56
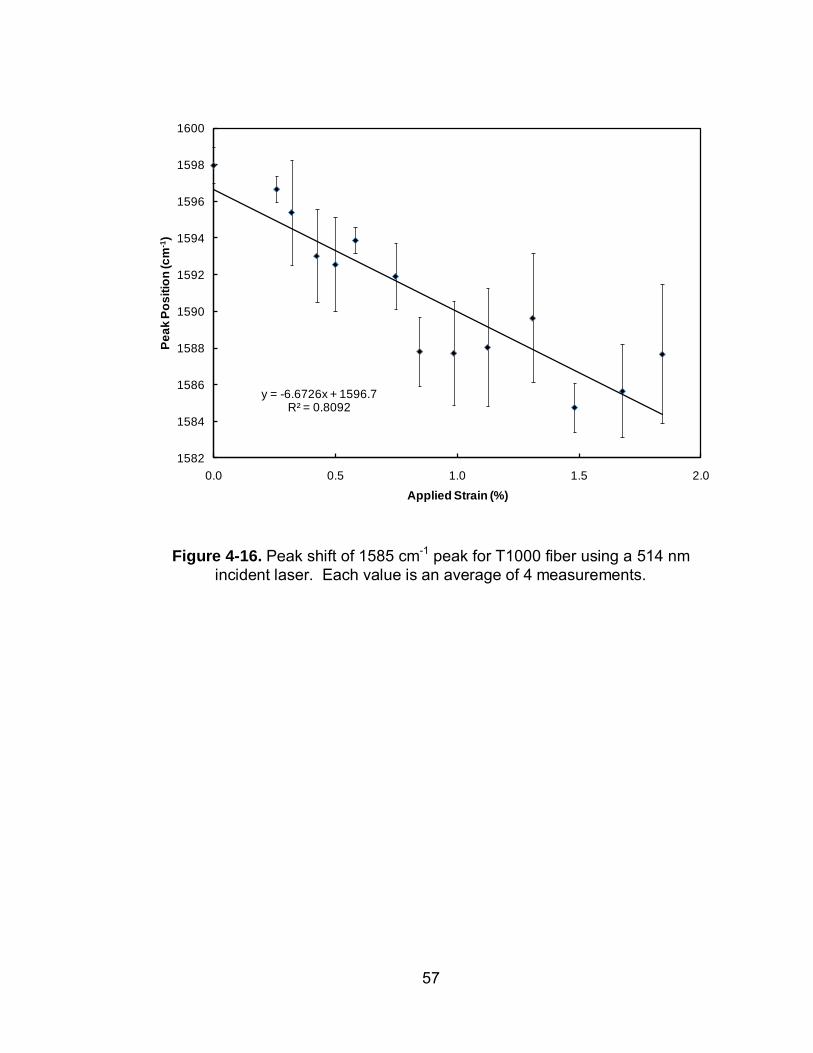
Figure 4-16. Peak shift of 1585 cm-1 peak for T1000 fiber using a 514 nm
incident laser. Each value is an average of 4 measurements. ........................... 57
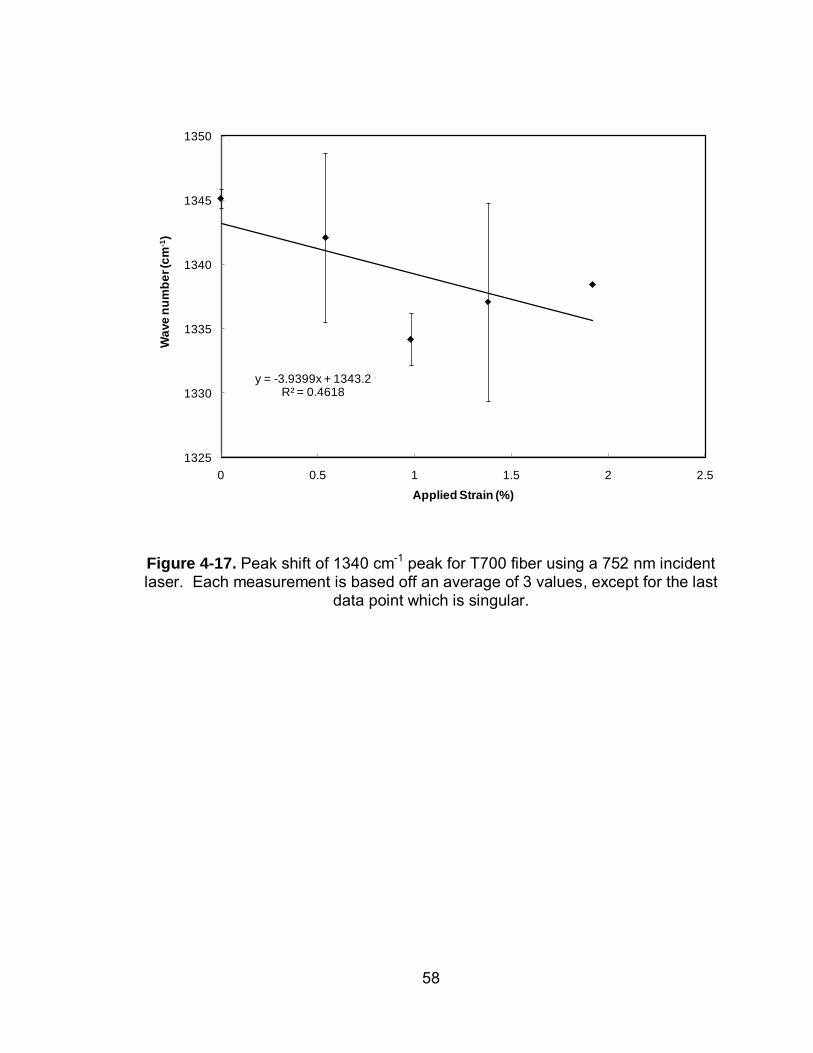
Figure 4-17. Peak shift of 1340 cm-1 peak for T700 fiber using a 752 nm incident
laser. Each measurement is based off an average of 3 values, except for the last
data point which is singular................................................................................. 58
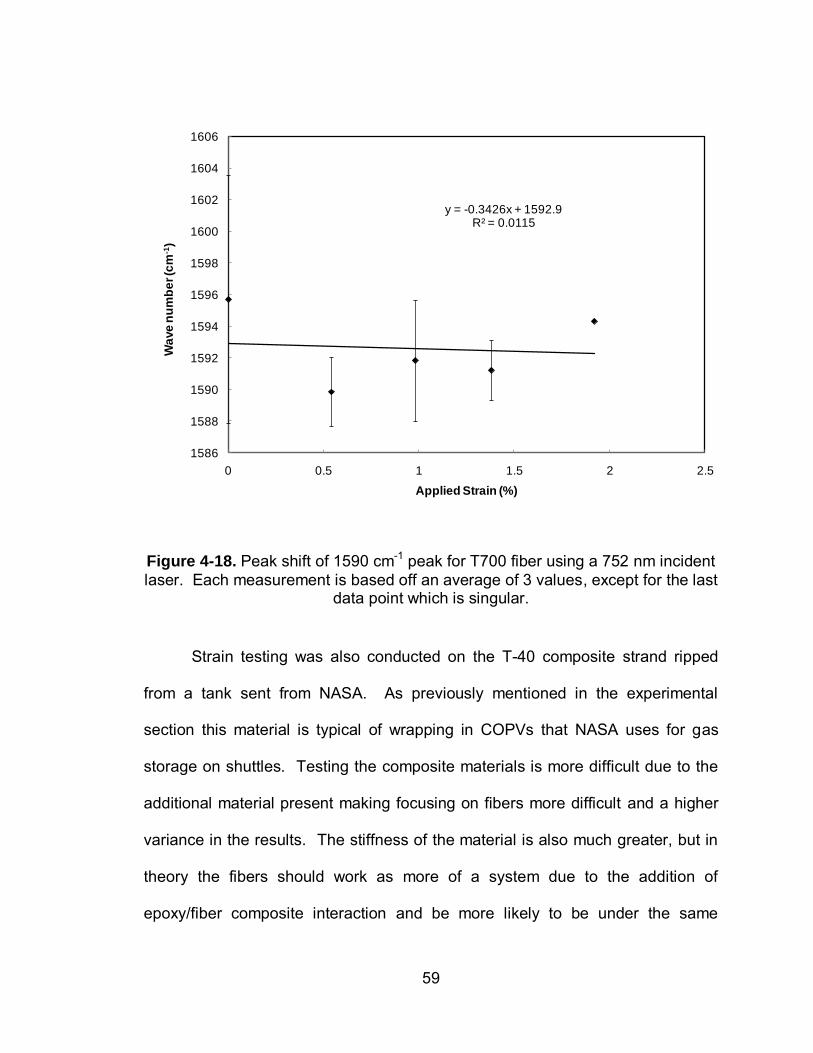
Figure 4-18. Peak shift of 1590 cm-1 peak for T700 fiber using a 752 nm incident
laser. Each measurement is based off an average of 3 values, except for the last
data point which is singular................................................................................. 59
xi
Figure 4-19. Peak shift of 1330 cm-1 peak for T-40 strand using a 752 nm
incident laser. Each value is an average of 3 measurements. ........................... 60
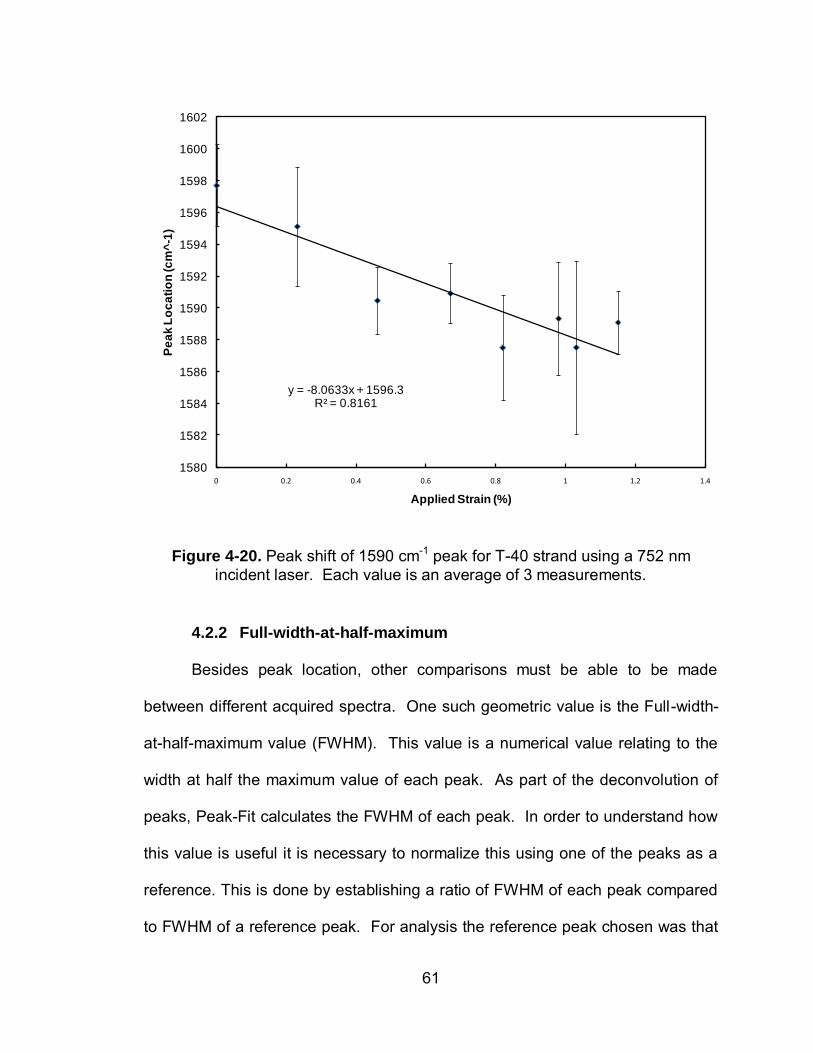
Figure 4-20. Peak shift of 1590 cm-1 peak for T-40 strand using a 752 nm
incident laser. Each value is an average of 3 measurements. ........................... 61
Figure 4-21. FWHM ratios of T1000 fiber at different applied strains using a
752nm incident laser. Each point is based on an average of several values. .... 63
Figure 4-22. FWHM ratios of T1000 fiber at different applied strains using a
514nm incident laser. Each point is an average of several values. ................... 64
Figure 4-23. FWHM ratios of T-40 strand at different applied strains using a
752nm incident laser. Each point is based on an average of several values. .... 65
Figure 4-24. Intensity ratios of T1000 fiber at different applied strains using a
752nm incident laser. Each point is based on an average of several values. .... 67
Figure 4-25. Intensity ratios of T1000 fiber at different applied strains using a
514nm incident laser. Each point is based on an average of several values. .... 68
Figure 4-26. Intensity ratios of T-40 strand at different applied strains using a
752nm incident laser. Each point is based on an average of several values. .... 69
Figure 4-27. Raman spectra of T-40/epoxy ripped strand from a burst tank using
a 752 nm incident laser. ..................................................................................... 70
Figure 4-28. Raman spectra of T1000/epoxy burst tank samples showing
measurements of the inner and outer portions of the tank using a 488 nm
incident laser. ..................................................................................................... 72
xii
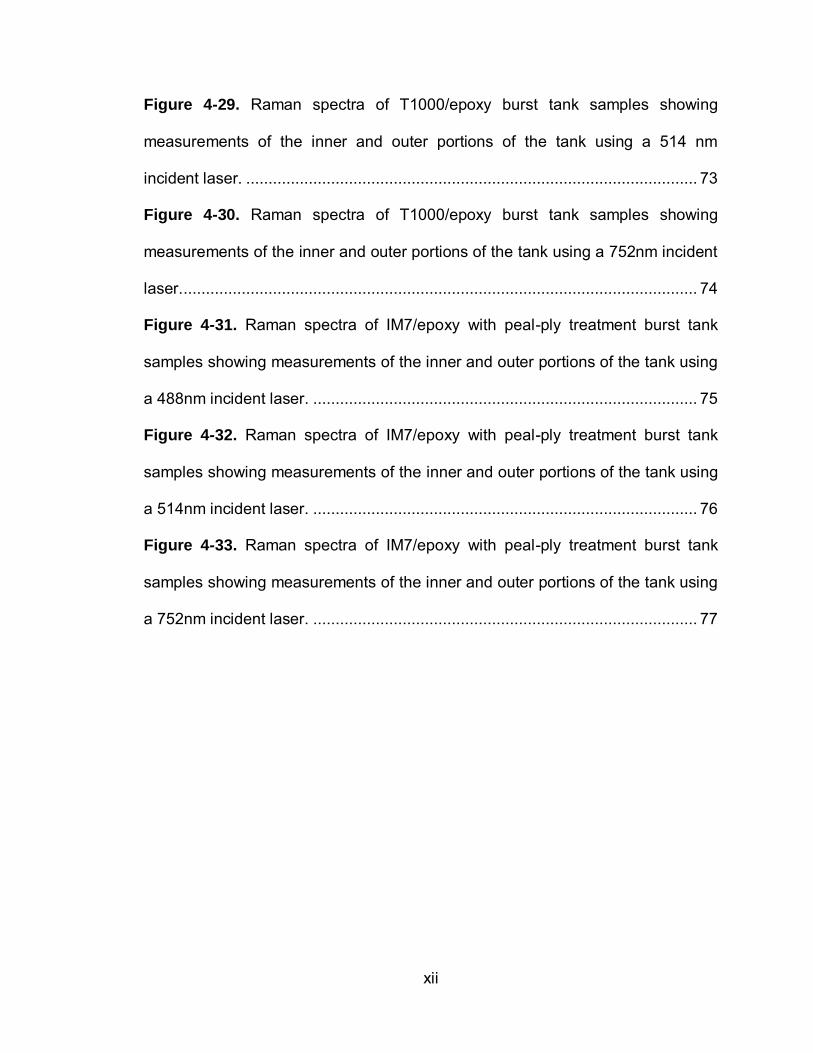
Figure 4-29. Raman spectra of T1000/epoxy burst tank samples showing
measurements of the inner and outer portions of the tank using a 514 nm
incident laser. ..................................................................................................... 73
Figure 4-30. Raman spectra of T1000/epoxy burst tank samples showing
measurements of the inner and outer portions of the tank using a 752nm incident
laser. ................................................................................................................... 74
Figure 4-31. Raman spectra of IM7/epoxy with peal-ply treatment burst tank
samples showing measurements of the inner and outer portions of the tank using
a 488nm incident laser. ...................................................................................... 75
Figure 4-32. Raman spectra of IM7/epoxy with peal-ply treatment burst tank
samples showing measurements of the inner and outer portions of the tank using
a 514nm incident laser. ...................................................................................... 76
Figure 4-33. Raman spectra of IM7/epoxy with peal-ply treatment burst tank
samples showing measurements of the inner and outer portions of the tank using
a 752nm incident laser. ...................................................................................... 77
xiii
LIST OF TABLES
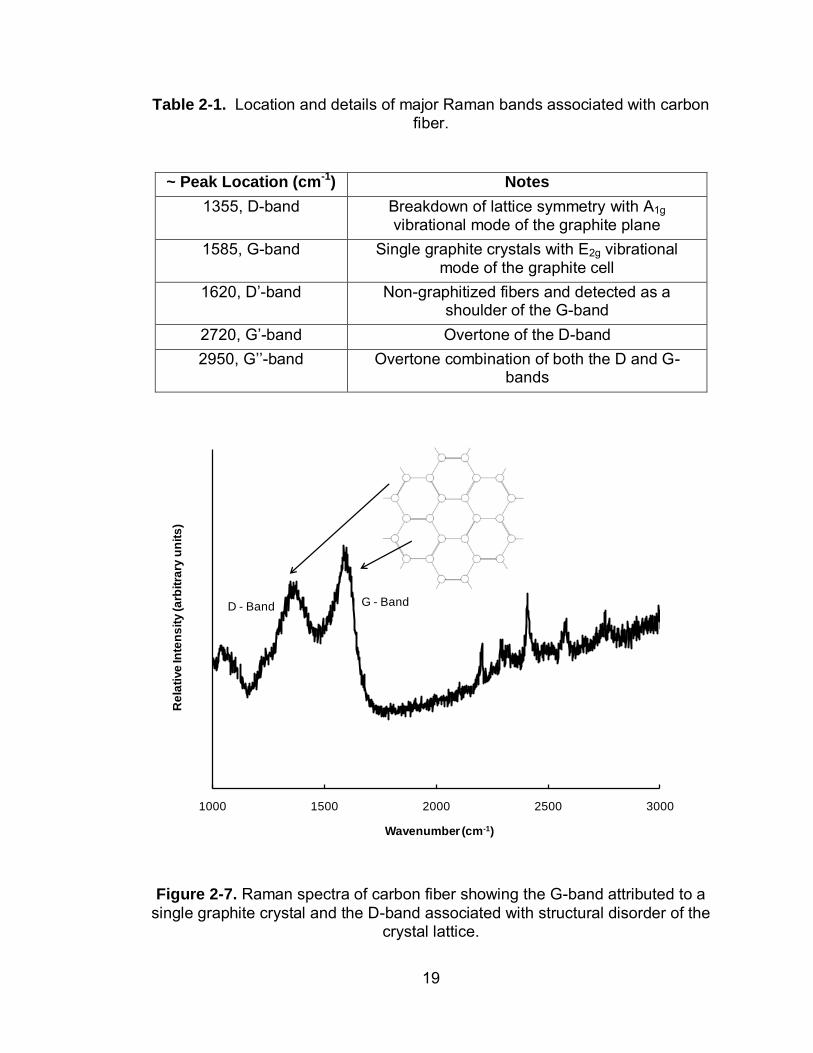
Table 2-1. Location and details of major Raman bands associated with carbon
fiber. ................................................................................................................... 19
Table 3-1. Mechanical Properties of Carbon Fibers tested. ............................... 24
Table 3-2. Types of Fiber/Epoxy composites tested. ......................................... 28
Table 3-3. Types of composites tested from burst tanks. ................................... 30
Table 4-1. Raman peaks of from literature and how they correspond to average
peaks found during measurements of raw carbon fibers at 752 nm. .................. 49
xiv
ABSTRACT
The goal of this research is to examine the potential of Raman
spectroscopy as a method of condition assessment for carbon fiber composite
materials. Carbon fiber composites are used in high performance situations such
as overwrapping of composite over-wrapped pressure vessels (COPVs) in
aerospace applications and hydrogen and natural-gas transportation systems.
The composites will play a larger role in the future due to the materials high
strength to mass ratio. There are currently limited nondestructive evaluation
(NDE) technologies to evaluate these composite materials in-situ. NDE
technologies will be critical for analyzing environmentally caused degradation
that can reduce strength and service life of the materials. Variations in elastic
strain in the composite material can manifest from degradation or damage, and
can be analyzed using Raman spectroscopy. The characterization of active
Raman bands and the strain sensitivity of these bands for commercially available
carbon fibers are reported. Additionally carbon fiber/epoxy matrix strands and
burst COPV samples are investigated. These results indicate that Raman
spectroscopy has some ability to make strain measurements in commercially
available carbon fibers. Such measurements have the potential to be used as a
tool for NDE in inspections and reliability assessment of carbon fiber composite
materials.
1
1 INTRODUCTION
1.1 Background
The role of carbon fiber is increasing in the world due to its high
performance characteristics provided by its high strength to weight ratio.
Additionally, as the cost of production goes down and performance
characteristics go up, new applications are appearing at a rapid pace. These
fibers are sometimes used on their own, but are more commonly used as
reinforcement of a composite material, often pairing the fiber with epoxy to create
a matrix. Currently there are many applications including bicycles, sporting
goods such as tennis racquets and golf clubs, commercial and military aircraft,
high-end automobiles and their components, and applications in the
transportation and aerospace industry. The focus of the research reported here
is of fiber-epoxy composites used in the transportation and aerospace industries.
Carbon fiber-epoxy composites are a type of composite over-wrapped
pressure vessels (COPV) and are commonly used as the wrapping material of
lightweight hydrogen fuel tanks. The carbon fiber/epoxy matrix composite over-
wraps a metal or plastic liner and takes the load when the vessels are
pressurized. The composite material may be exposed to prolonged periods of
stress and environmental degradation. These stresses and degradation are

2
typically not visible and a (Non-destructive Evaluation) NDE method to asses the
vessels is needed. Currently these COPVs must be monitored using life cycles
and temperature limits. The use of these pressure vessels will likely increase as
the hydrogen economy is expanding as a possible cleaner and cheaper solution
for fuel. These vessels will be present in hydrogen vehicles and their supporting
facilities such as fueling stations, storage containers, and pipelines. Additionally,
vessels of this type are present on NASA vehicles due to their high strength to
weight ratio and as research increases, these vessels should be a solution for
high performance materials. There are currently few methods to evaluate these
materials non-destructively except for the human eye.
1.2 Goal
The goal of this project is to examine the potential of Raman spectroscopy
to be used as a non-destructive means of condition assessment for carbon fiber
composite material. Raman spectroscopy uses light scattering to investigate
material at their molecular interaction level. In many fields Raman spectroscopy
is a powerful materials characterization tool, and with new, more compact
technologies and testing methods, its range of applications will likely increase.
Previous research on carbon fiber and carbon materials in general have provided
insight as to relating distinct features in Raman measurements to carbon-carbon
bond interaction. Investigating differences in Raman spectra could give
information about fiber material characteristics such as modulus and tensile
strength, as well as the amount of stress the composite material is under.
3
1.3 Objectives
There are a number of objectives in this project.
Measure different types of raw carbon fiber and to characterize their
Raman spectra produced, highlighting active Raman bands.
Investigate the sensitivity of peak location shifting with applied strain
on the fibers.
Further analyze Raman band characteristics with applied strain by
looking at relative band intensity ratios and full-width-at-half-maximum
(FWHM) ratios.
Characterize the spectra of composite materials and investigate their
strain sensitivity.
Determine the Raman potential of making measurements on material
directly from COPVs and the ability to penetrate different
surfaces/coatings for these measurements.
These exploratory tests on carbon fibers and their composites will provide a
basis for further investigation utilizing Raman spectroscopy as tool for condition
assessment.
1.4 Scope
Both pitch and Polyacrylonitrile (PAN)-based carbon fibers are
investigated at different incident laser wavelengths in order to develop ideal
testing scenarios. This process was also carried out for the carbon fiber
composite material; both fiber/epoxy strands and material ripped directly from
COPVs. The composite material is more difficult to work with due to the added
4
complexity of the material but is more indicative of materials being used in the
field today.
In addition to acquiring spectra for the materials, strain testing was carried
out for all the raw fibers and the composites materials that were able to be placed
in a load frame. The load frame is able to apply uniaxial tension in the direction
of the fiber axis. Spectra were obtained at various strain levels within the elastic
range of the materials to investigate the potential peak location shift with applied
tensile strain. The fibers and composites are evaluated not only with respect to
their Raman band location, but also their full-width-at-half-maximum and intensity
ratios of the Raman bands relative to a reference Raman band. These two
properties allow for quantifiable analysis of the Raman bands beyond just that of
peak location.
For materials provided from failed COPVs it is of importance to investigate
the potential for Raman spectroscopy to penetrate the outer coating of the
material to look at the spectra of the fiber component underneath the surface.
Laser wavelengths and accumulation parameters can be adjusted in many ways
to develop a potential non-destructive method to analyze these composite
materials.
5
2 BACKGROUND
2.1 Carbon Fiber
2.1.1 Overview
Carbon fibers are thin fibers smaller than a human hair, ranging from 5 to
10 microns in diameter that contain at least 92% carbon by weight. The structure
of a carbon fiber can be crystalline, amorphous, or a combination of both.
Carbon atoms have an ability to form bonds between atoms to create stable
compounds in the forms of chains and rings. Graphite and diamond are the two
most common allotropes of carbon and are able to form into effectively infinite
networks of atoms. For most carbon fiber, the structure consists of layers of one-
atom-thick sp2-bonded carbon atoms organized hexagonally (honeycomb crystal
lattice) known as graphene layers, with van der Waals bonding between layers to
make a three dimensional structure. Figure 2.1 shows a graphene layer. Carbon
fibers are able to achieve their high modulus because the honeycomb carbon
layers are oriented parallel to the fiber axis. Fibers generally have a much higher
modulus and strength in the direction of the fiber axis than perpendicular to the it
[1]. Differences in structure and material composition depend on production
methods and the type of precursor used for the fiber, which will be discussed
later.

6
Figure 2-1. Graphene layer in which carbon atoms are organized in a hexagonal lattice.
The first high-performance carbon fibers were graphite whiskers
developed in 1958 by Union Carbide scientists in Cleveland, OH. The fibers were
derived using Rayon as a precursor and only contained 20% carbon [2].
Graphite whiskers have the carbon layer rolled up like a scroll and are derived
from a single crystal. Graphite whiskers are near flaw-free and very high in
strength, but are not commercially relevant due to their low production yield [1].
Fibers today, and those investigated in this report, are typically polyacrylonitrile
(PAN) and pitch-based carbon fibers. Typical high-performance fibers today,
such as Toray’s T1000® PAN-based fiber, can have a Young’s modulus of 300
gigapascals (GPa) and a tensile strength of 7 GPa. In addition to their high
strength to weight ratio, carbon fibers have many desirable qualities including low
7
thermal expansion, low electrical resistivity, high creep resistance, high thermal
conductivity, and corrosion resistance. One downside of carbon fibers is their
low ductility, which is a larger concern the higher modulus the fibers. Historically
carbon fiber has not been as developed as other technologies due to the high
manufacturing costs, but recently with the increase in applications and market
size the prices of carbon fibers have lowered.
2.1.2 PAN-based
Polyacrylonitrile (PAN) based fibers are currently the most popular type of
carbon fiber used today. PAN is an organic polymer composed of a mixture of
acrylonitrile (CH2=CHCN) as the main component, mixed with other monomers.
PAN contains a continuous carbon backbone that is ideal for the processes
required to convert PAN to the final product of carbon fiber. [3]
Converting PAN to carbon fibers is a multi-step process that can be
altered to manufacture fibers of desired specifications. The PAN is first
fabricated into shape by wet spinning techniques. Then, generally, the next step
is to oxidize the PAN by heating it to about 300 °C in air. Acrylonitrile has a
carbon content of 67.9%, allowing for PAN precursors to have a carbon yield of
50-55% after the initial heating that eliminates hydrogen and adds less volatile
oxygen to the PAN. During this process the polymer changes from a long chain
form of polyacrylonitrile known as a ladder to more stable ring structures. The
oxidized PAN is then heated in a chamber along with an inert gas such as argon
to temperatures as high as 3000 °C in a process called graphitization.
Graphitization changes the molecular structure by burning off non-carbon
8
material, and as the level of graphitization increases, non-crystalline carbon
layers stack onto the crystalline regions. The higher the level of graphitization,
the higher the amount of ordered, crystalline carbon, allowing for higher grade
fiber to be produced [4]. Under ideal conditions the carbon content can reach 93-
95% for carbon fibers, and 99% to be classified a graphite fiber. PAN based
fibers are able to achieve high modulus, high strength characteristics [3].
2.1.3 Pitch-based
Pitch is a resinous liquid that appears as a solid that can be made from
petroleum products, coal, or plants. Pitch-based fibers have a smaller market
share than PAN-based fibers, but it is currently increasing due to the lower
cost/carbon content when compared to PAN-based. Pitch based carbon fibers
have a higher carbon yield and molecular orientation in the direction of the fiber
axis, giving the ability to produce much stiffer fibers. These fibers generally have
a lower tensile strength than the PAN-based carbon fibers, partially due to their
higher stiffness [1].
The process for making pitch fibers is very similar to the process for PAN
fibers. The fibers are first produced during a process called melt spinning.
During this spinning process the viscosity of the pitch is critical and very
dependant on the spinning temperature [3]. After being spun the fibers go
through the same stages of oxidation, carbonization, and graphitization as in the
PAN-based fibers.

9
2.1.4 Carbon Fiber Composites
Carbon fibers are most commonly used as the reinforcement component
of a composite material. Composite materials refer to any engineered material
using two or more materials with different physical properties. Carbon fibers high
tensile strength and low density give them an exceptional ability to be used in
composite materials.
One application for carbon fiber is the wrapping material in composite
over-wrapped pressure vessels (COPVs) as shown in Figure 2-2. For this
product, carbon fiber in long spools is mechanically wrapped around a bladder
(usually metallic or polymer in nature) with viscous epoxy resin being applied at
the same time. The result is a lightweight, polymer reinforcement with extremely
high pressure ratings. Consumer COPVs can range as high as 10,000 psi, with
specially engineered ones exceeding that.
Figure 2-2. Commercially available tough shell COPVs for gas storage manufactured by Lincoln Composites and published on the Lincoln Composites
website.
10
2.1.5 Environmental Damage
As discussed in the goals of this project, there is a need for non-
destructive evaluation (NDE) techniques for condition assessment of carbon fiber
composite materials. While some failures will be obvious to the human eye,
these materials can undergo long lifetime of service without any visual indication
of wear and tear. Many environmental factors can lead to a reduction in strength
properties in carbon fiber composites and service life of the material. Internally,
composite materials have a complex matrix that is difficult to investigate with
non-destructive methods. An NDE method of measuring the level of stress in
carbon fiber composites would help in safety and engineering of these materials.
After a high impact collision of a composite material with a foreign object it
may visually look in working condition, when in fact inside the polymeric matrix
there are high amounts of damage. Impact damage to a composite material can
crack composite matrix which can lead to fiber debonding from the epoxy
material. When a fiber breaks, the load it carried is passed to adjacent fibers,
sometimes causing them to fail in a chain reaction leading to catastrophic failure.
Another visually undetectable failure mechanism for composite materials
is stress rupture. Stress rupture is a phenomenon in which the material has a
large reduction in strength with a seemingly small addition of stress. The stress
could come from an increase in COPV pressure or even from thermal loading, or
a combination of the two. With long periods of sustained loading and cyclic
loadings, COPVs are a composite material particularly prone to stress rupture
and creep.
11
Polymeric materials can also be damaged by outside environmental
conditions that induce changes to the structural integrity of the material.
Exposure to ultraviolet radiation can change the molecular structure of the
material and thus its strength characteristics. Hazardous chemicals can degrade
the surface treatment and performance characteristics of the material. Finally,
extreme temperatures can be very harmful to composite materials because they
lead to residual strains from thermal expansion between the fibers and epoxy
matrix.[3]
2.2 Raman Spectroscopy
Raman spectroscopy is a laser-induced technique that measures the
intensity and frequency of inelastically scattered light and is used to study
vibrational, rotational, and other low-frequency modes of interaction between
molecules. The technique is named after Sir C.V. Raman, an Indian physicist
who in 1928 discovered that inelastically scattered sunlight would change
frequency as it passes through crossed filters [5]. From the Planck-Einstein
equation, frequency is related to the energy of a particle by:
where:
E = energy of a photon (m2 kg / s2)
h = Planck’s constant (6.626 x 10⁻³⁴ m2 kg / s)
f = frequency of a photon (Hz)
12
Frequency and wavelength are inversely proportional to each other and
related by the following equation:
where:
f = frequency of a photon (Hz) or (1/s)
v = wave speed (m/s)
λ = wavelength (m)
In Raman spectroscopy, an incident laser sends photons (energy) to the
material to be tested. Some photons scatter elastically (Rayleigh scattering) with
the energy of the photons unchanged, while others shift wavelength and scatter
inelastically (Raman scattering). The majority of photons are Rayleigh scattered,
while typically the Raman scattering occurs weakly at an intensity of ~10-5 the
incident beam [5]. During Raman scattering there is an energy transfer between
the incident photons and the molecules, with the energy difference equal to the
difference in the vibrational and rotational energy level between the incident
photon and the material being tested. Figure 2.3 shows an incident photon
interacting with a diatomic molecule and physically what happens during the
Raman scattering process.

13
Figure 2-3. A diatomic molecule showing the Raman scattering process. Energy (via a photon) interacts with the molecule and is scattered at a different energy
level.
Raman scattering can be divided into two types, Stokes and anti-Stokes.
In Stokes scattering the material absorbs energy, thus resulting in photons of
lower energy and a decrease in measured frequency. For anti-Stokes scattering
the material loses energy and the photons are shifted to a higher energy level
and frequency. The majority of materials absorb the induced photon energy and
therefore Stokes scattering is typically at higher intensities then that of anti-
Stokes [6]. Since both scattering types give the same information it is customary
to measure only the Stokes side of the spectrum because of their stronger
intensities [5]. Figure 2-4 shows the different types of scattering and their energy
states.

14
Figure 2-4. An energy level diagram of different energy types of scattering during the Raman process.
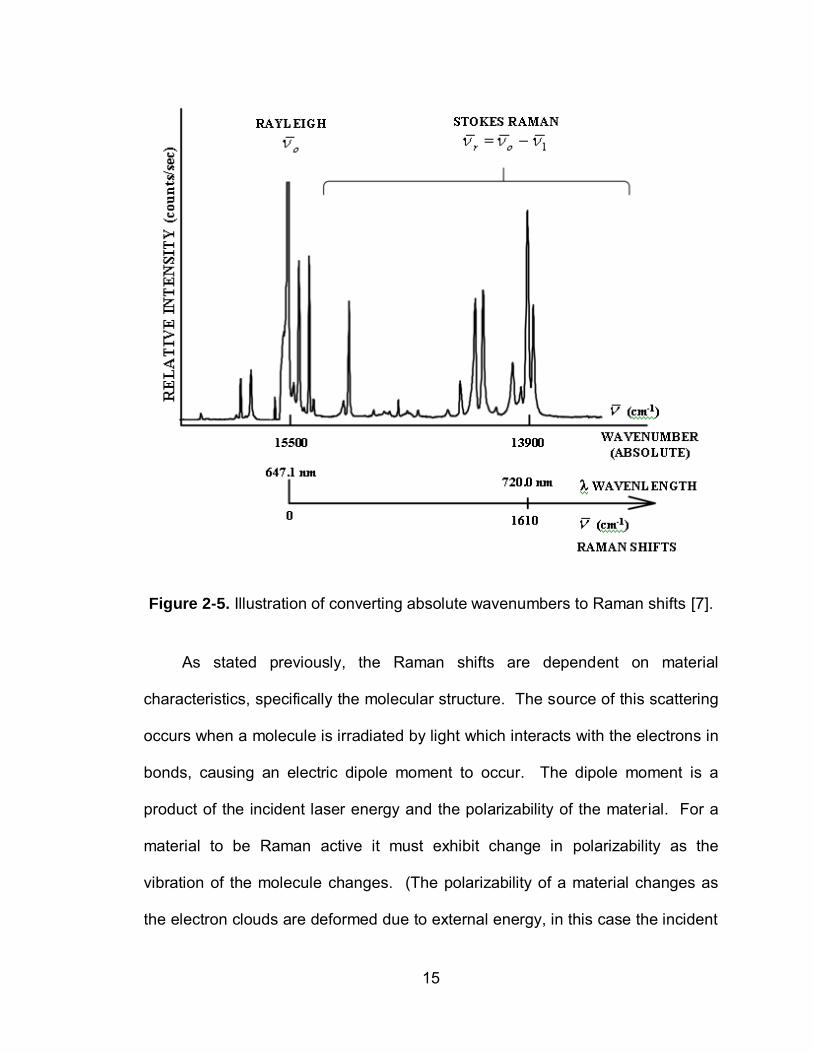
In Raman spectroscopy a measurement of the vibrational frequency, as a
shift from the incident beam frequency, is made. These frequencies are usually
reported in wavenumbers as shown in Figure 2-5. The inelastically scattered
light, v1, is subtracted from the incident light, v0, to calculate a relative
wavenumber, vr. The equation for Stokes scattering is vr = v0 – v1, while the
equation for Anti-Stokes is vr = v0 + v1.
15
Figure 2-5. Illustration of converting absolute wavenumbers to Raman shifts [7].
As stated previously, the Raman shifts are dependent on material
characteristics, specifically the molecular structure. The source of this scattering
occurs when a molecule is irradiated by light which interacts with the electrons in
bonds, causing an electric dipole moment to occur. The dipole moment is a
product of the incident laser energy and the polarizability of the material. For a
material to be Raman active it must exhibit change in polarizability as the
vibration of the molecule changes. (The polarizability of a material changes as
the electron clouds are deformed due to external energy, in this case the incident
16
light from the laser source.) The electric dipole excites molecules from an
electronic ground state to a virtual energy state and back to a relaxed vibrational
energy state as shown in Figure 2-4 [5]. These changes in energy, and thus
frequency and wavelength, of the incident light when interacting with the material
produce changes in the vibrational energy, producing Raman scattering. For
example, vibrational frequencies associated with carbon-carbon double bonds
produces specific Raman lines at well-defined frequencies relative to that of the
incident radiation. Individual peaks can be associated with specific vibrational
modes for molecules.
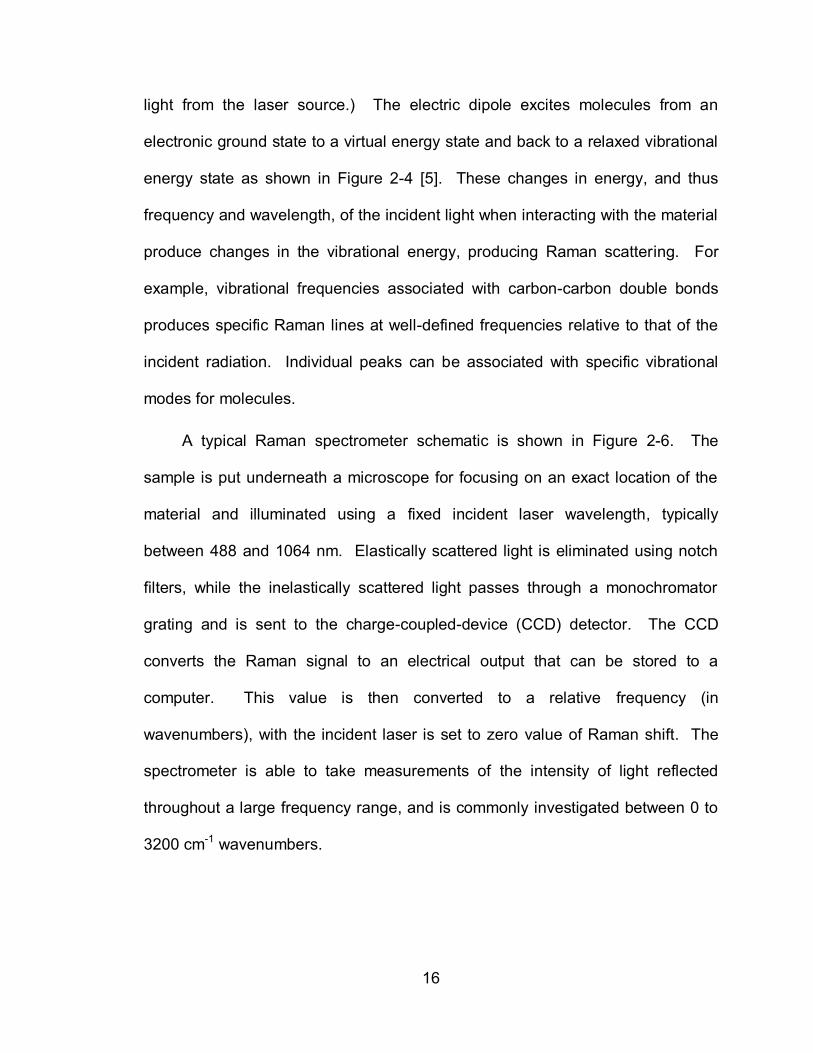
A typical Raman spectrometer schematic is shown in Figure 2-6. The
sample is put underneath a microscope for focusing on an exact location of the
material and illuminated using a fixed incident laser wavelength, typically
between 488 and 1064 nm. Elastically scattered light is eliminated using notch
filters, while the inelastically scattered light passes through a monochromator
grating and is sent to the charge-coupled-device (CCD) detector. The CCD
converts the Raman signal to an electrical output that can be stored to a
computer. This value is then converted to a relative frequency (in
wavenumbers), with the incident laser is set to zero value of Raman shift. The
spectrometer is able to take measurements of the intensity of light reflected
throughout a large frequency range, and is commonly investigated between 0 to
3200 cm-1 wavenumbers.
17
Figure 2-6. Schematic of a typical Raman spectrometer.
2.3 Raman Spectroscopy of Carbon Fiber
2.3.1 Raman Bands
Raman bands are sharp peaks that can be associated with vibration
modes at a molecular level. Early studies on graphite materials revealed that a
Raman band at the ~1585 cm-1 can be related to the vibration mode denoted by
the symmetry classification E2g of a graphite cell restricting motion of the atoms
to the plane of carbon atoms. This band is attributed to the virtually infinite
hexagonally organized carbon-carbon bonded lattice structure of the graphene
layers and is present in all carbon fibers. Another band in polycrystalline graphite
was found at ~1355 cm-1, and can be related to the A1g vibration mode of the
graphite plane and can be attribute to the symmetric boundaries of the graphite
18
crystals. Thus the ~1355 cm-1 band can be related to particle size and a
structural disorder effect [8]. It is also found that the ~1355 cm-1 band is
associated with poorly graphitized fibers and the band intensity will lower with
fibers that have higher graphitization temperatures. This Raman band is
commonly known as the “disorder” induced line and is more prevalent in low
modulus/low heat treated fibers [9]. The letter designations of A1g and E2g are
known as symmetric vibrational modes.
From literature there are several more Raman bands found in carbon fiber
depending on the level of graphitization, laser power and wavelength, and source
of material. For convenience, a letter notation is used to refer to the bands. The
~1355 and ~1585 cm-1 are assigned as D and G-lines respectively. The strong
G-line is present due to the hexagonal ring structure with E2G symmetry of
graphite crystal. The weak D-line is of A1G symmetry and is present in disordered
forms of carbon. At low firing temperatures, the D band will exhibit broad lines
[10, 11]. For non-graphitized fibers, a D’-line is present at ~1620 cm-1. At higher
firing temperatures it can be detected as a shoulder of the G-line. An overtone of
the D-line is present at ~2720 as the G’-line. Although it is present as an
overtone of the D-line, it is more closely linked to Raman characteristics such as
intensity and FWHM to the G-line [9]. Another band present is the G’’-line at
~2950 cm-1, often referred to as a combination band, at a frequency roughly the
sum of the D and G-lines is likely a combination of the two [12]. As previously
stated, different fibers and composites will contain additional bands due to their
material characteristics.
19
Table 2-1. Location and details of major Raman bands associated with carbon fiber.
~ Peak Location (cm-1) Notes
1355, D-band Breakdown of lattice symmetry with A1g vibrational mode of the graphite plane
1585, G-band Single graphite crystals with E2g vibrational mode of the graphite cell
1620, D’-band Non-graphitized fibers and detected as a shoulder of the G-band
2720, G’-band Overtone of the D-band 2950, G’’-band Overtone combination of both the D and G-
bands
Figure 2-7. Raman spectra of carbon fiber showing the G-band attributed to a single graphite crystal and the D-band associated with structural disorder of the
crystal lattice.
1000 1500 2000 2500 3000
Re
lati
ve
Inte
ns
ity (a
rbit
rary
un
its
)
Wavenumber (cm-1)
D - Band G - Band
20
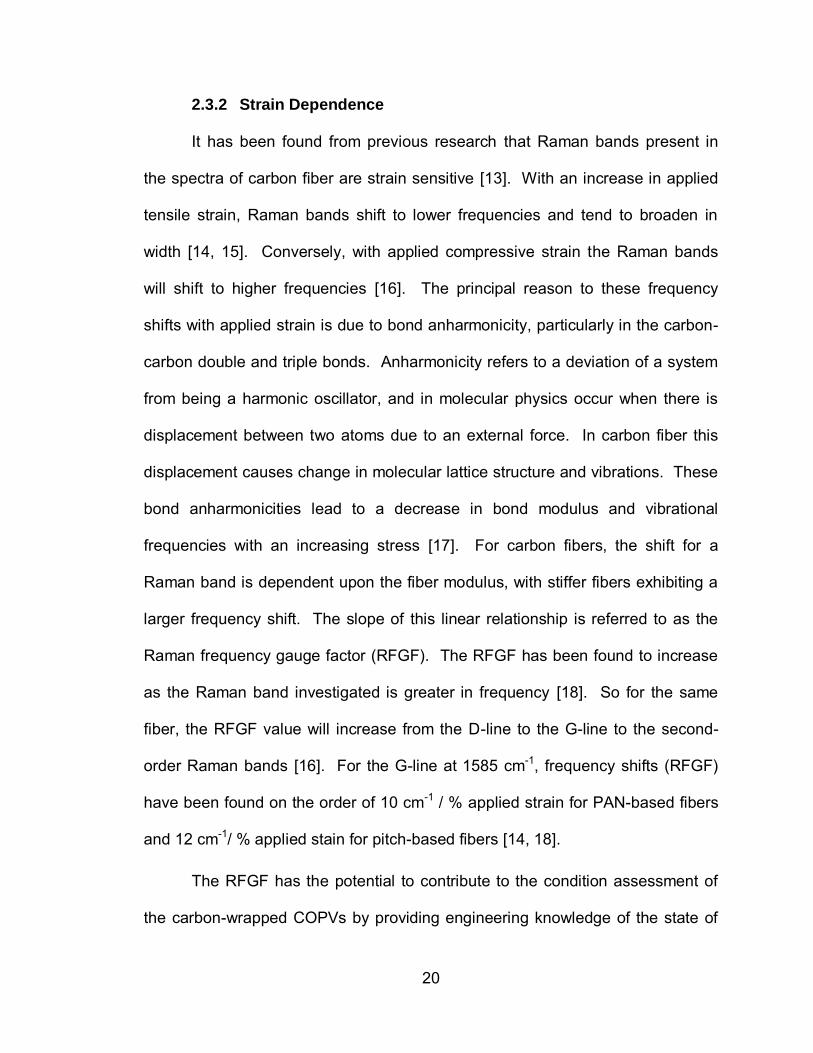
2.3.2 Strain Dependence
It has been found from previous research that Raman bands present in
the spectra of carbon fiber are strain sensitive [13]. With an increase in applied
tensile strain, Raman bands shift to lower frequencies and tend to broaden in
width [14, 15]. Conversely, with applied compressive strain the Raman bands
will shift to higher frequencies [16]. The principal reason to these frequency
shifts with applied strain is due to bond anharmonicity, particularly in the carbon-
carbon double and triple bonds. Anharmonicity refers to a deviation of a system
from being a harmonic oscillator, and in molecular physics occur when there is
displacement between two atoms due to an external force. In carbon fiber this
displacement causes change in molecular lattice structure and vibrations. These
bond anharmonicities lead to a decrease in bond modulus and vibrational
frequencies with an increasing stress [17]. For carbon fibers, the shift for a
Raman band is dependent upon the fiber modulus, with stiffer fibers exhibiting a
larger frequency shift. The slope of this linear relationship is referred to as the
Raman frequency gauge factor (RFGF). The RFGF has been found to increase
as the Raman band investigated is greater in frequency [18]. So for the same
fiber, the RFGF value will increase from the D-line to the G-line to the second-
order Raman bands [16]. For the G-line at 1585 cm-1, frequency shifts (RFGF)
have been found on the order of 10 cm-1 / % applied strain for PAN-based fibers
and 12 cm-1/ % applied stain for pitch-based fibers [14, 18].
The RFGF has the potential to contribute to the condition assessment of
the carbon-wrapped COPVs by providing engineering knowledge of the state of
21
stress in the surface of COPVs as a means of detecting damage or degradation
of the COPV. Initial measurements are reported here to provide foundational
data on the Raman response of commercially available fibers in their as-
marketed conditions.
22
3 EXPERIMENTAL
3.1 Instrumentation
The Raman spectra in this report are measured using two different
Renishaw micro-Raman systems and a Fourier Transform (FT) Raman system.
The variation of the systems allowed for measurements to be taken at 488, 514,
647, 752, and 1064nm incident wavelengths. The use of different wavelengths
allows for different sample penetration abilities when taking measurements.
For the Renishaw micro-Raman systems, the incident wavelength is
focused on the fiber/composite using a 20x, 25x, or 50x microscope. The Raman
spectra of the illuminated fibers are collected over a time period using a CCD to
collect the intensity of light reflected from the surface of the fibers over a range of
wavelengths. The range of wavelengths collected was typically from 1000 to
3000 cm-1 over a time period of at least 50 seconds and multiple accumulations
for high sensitivity. The spectral resolution of the system varies from 1.0 - 1.7cm-1
depending on the incident laser and optical alignments. The Renishaw
spectrometers are calibrated using a silicon sample due to its well defined peak
at 520 cm-1.
23
Figure 3-1. Multi-laser Renishaw Raman spectrometer.
Figure 3-2. Fourier Transform (FT) Raman spectrometer.
24
3.2 Materials Tested
3.2.1 Raw Fibers
For the exclusive characterization of the carbon fiber’s Raman spectra,
many raw fibers were evaluated. Raw carbon fibers were supplied from various
sources and manufacturers and include both PAN and pitch based fibers. Table
3-1 lists each of the fibers tested and their critical properties.
Table 3-1. Mechanical Properties of Carbon Fibers tested.
Fiber Type Tensile Modulus Tensile Strength Elongation Density
GPa Msi MPa Ksi % g/cm^3 Nippon (pitch)
YS-95A 905 131 3497 505 0.3 2.20 CN-90 861 125 3384 489 0.4 2.19 CN-80 794 115 3138 453 0.5 2.17 CN-60 635 92 3189 460 0.6 2.12
Toray (PAN) T700 230 33.4 4900 711 2.1 1.80
T1000 294 42.7 6370 924 2.2 1.80 Cytec (PAN)
T300 231 33.5 3650 529 1.4 1.76
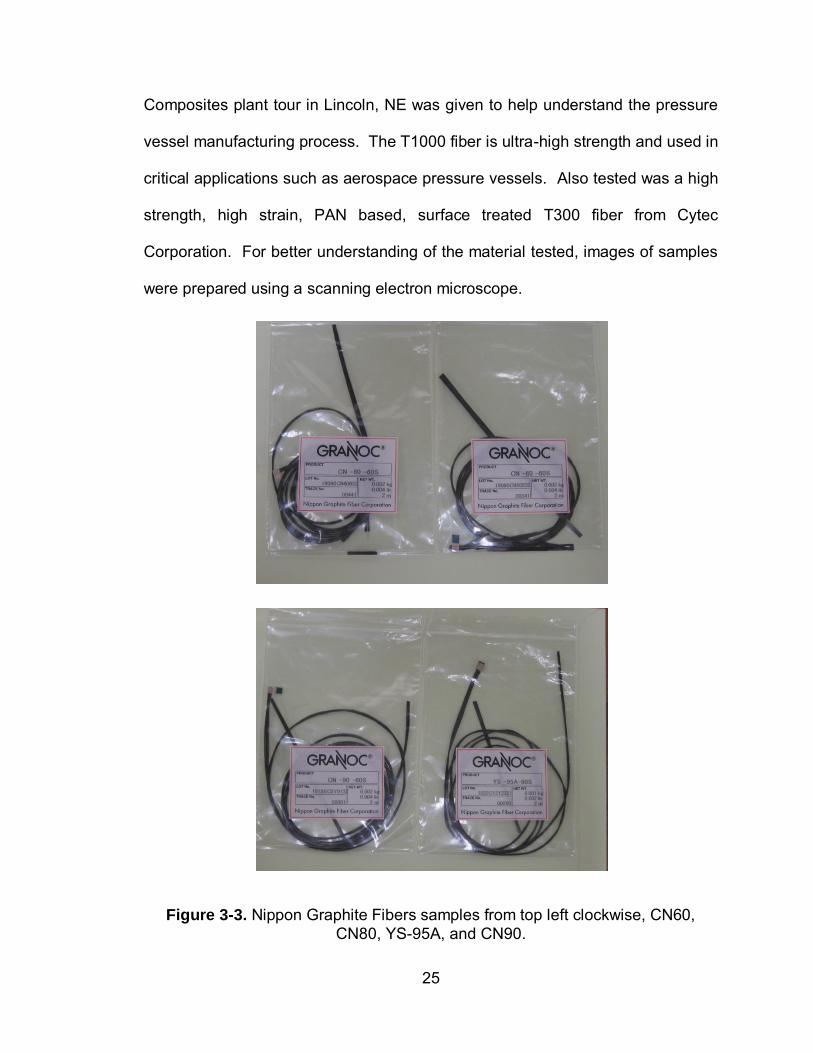
The Nippon Graphite Fiber Corporation supplied fibers are high-modulus
pitch based carbon fibers. The fibers from Nippon are technically graphite fibers
due to their material composition being 99% or above carbon. The fibers high
ordered carbon content is very crystalline and gives the product high stiffness.
The Toray Carbon Fiber samples are PAN-based fibers. The T700S fiber is a
high strength, standard modulus fiber typically used in pressure vessels. The
T700S fiber was provided by Lincoln Composites, manufacturers of commercial
TuffShell fuel tanks used for hydrogen and natural gas storage. A Lincoln
25
Composites plant tour in Lincoln, NE was given to help understand the pressure
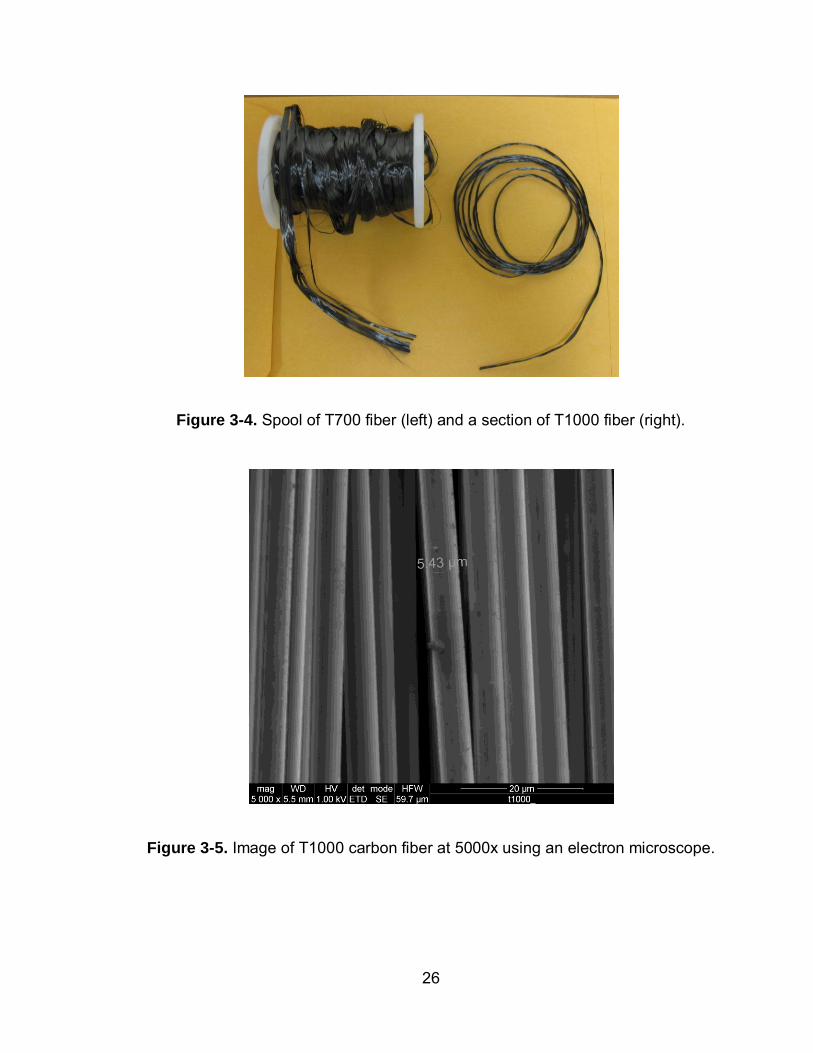
vessel manufacturing process. The T1000 fiber is ultra-high strength and used in
critical applications such as aerospace pressure vessels. Also tested was a high
strength, high strain, PAN based, surface treated T300 fiber from Cytec
Corporation. For better understanding of the material tested, images of samples
were prepared using a scanning electron microscope.
Figure 3-3. Nippon Graphite Fibers samples from top left clockwise, CN60, CN80, YS-95A, and CN90.
26
Figure 3-4. Spool of T700 fiber (left) and a section of T1000 fiber (right).
Figure 3-5. Image of T1000 carbon fiber at 5000x using an electron microscope.
27
Figure 3-6. Image of T1000 carbon fiber at 4860x using an electron microscope.
Figure 3-7. Image of T1000 carbon fiber at 300x using an electron microscope.
28
3.2.2 Fiber/Epoxy Composites
In addition to raw fiber samples, fiber/epoxy composite samples were
tested. It is important to be able to measure the Raman spectra of carbon fiber
in-situ, so the first step is to establish the ability to measure them in their
composite application form. These composites range from pre-preg strands from
the manufacturers to in-house made fiber/epoxy composite strands. Table 3-2
lists the composite materials tested. The Toray T1000/epoxy pre-preg and
Hexcel IM7/epoxy pre-preg samples were sent along with burst COPVs (to be
discussed in following section) as a sample of the material used in wrapping the
COPVs. Pre-preg materials are large groupings of fibers with epoxy matrix
material on the material that activates when heated up to bond the fibers and
form a composite material. The Hexcel AS4 was sent as a manufactured
fiber/epoxy strand. For the Nippon Graphite fibers, strand was made in-house
using a Devco brand quick-epoxy.
Table 3-2. Types of Fiber/Epoxy composites tested.
Sample Type Notes
Toray T1000/epoxy pre-preg control sample for burst tank Hexcel IM7/epoxy pre-preg control sample for burst tank
Hexcel AS4 manufactured strand Nippon Graphite Fibers/quick epoxy in-house manufactured strand

29
Figure 3-8. Image of Hexcel IM-7 spool (top) and Toray T1000 spool (bottom).
3.2.3 Composites from Burst Tanks
The composite materials tested from burst tanks were provided by NASA
in the form of small sample pieces and also two separate failed tanks
themselves. Samples of T-40 Fiber/Epoxy matrix wrapping ripped from a burst
tank were sent for measurement. The T-40 fiber is a fiber with enhanced tensile
strength and modulus specifically designed for aerospace applications. Two
different types of burst (failed) COPVs were supplied for testing the ability of
Raman to penetrate coatings. One tank is a T1000/epoxy wrapping that is shiny
in exterior appearance that is shown in Figures 3-9 and 3-10. The other tank is
an IM7/epoxy composite with a peal-ply treatment on the outside of the tank and
is shown in Figures 3-11 and 3-12. Peal-ply is an adhesive polymer material that
is put on the outer surface of a tank and then ripped off to leave a uniform finish
and get rid of discontinuities that may arise during the fiber wrapping and epoxy
coating process. The tanks were cut into small pieces that could be set
30
underneath the Raman laser. Investigation of both the outer surface of the tanks
and the inner fiber/epoxy matrix parts was conducted.
Table 3-3. Types of composites tested from burst tanks.
Sample Type Notes
T-40 fiber/epoxy Pieces ripped from burst tank T1000 fiber/epoxy burst tank Samples cut from burst tank
IM7 fiber/epoxy with Peal-Ply burst tank Samples cut from burst tank
Figure 3-9. Image of T1000/epoxy burst COPV.
31
Figure 3-10. Zoom-in image of T1000/epoxy wrapping material of COPV.
Figure 3-11. Zoom-in image of burst tank with IM7/epoxy with peal-ply treatment on the outer surface.
32
Figure 3-12. Zoom-in image showing peal-ply treatment.
Figure 3-13. Image of T1000/epoxy piece from a burst COPV at 149x using an electron microscope.
Reflective outer surface
Edge
33
Figure 3-14. Image of T1000/Epoxy piece from a burst COPV at 165x using an electron microscope.
Reflective outer surface
Exposed fiber/epoxy
34
Figure 3-15. Image of IM7/epoxy outer surface with peal-ply material imprint on a burst COPV at 50x using an electron microscope.
3.3 Testing Methods
3.3.1 Set-up and Procedure
The carbon fibers and carbon fiber composite materials were tested using
a variation of parameters to find optimal measurement conditions. Fibers were
set underneath the laser of a certain known incident wavelength and power
setting (schematic and Raman spectrometer physics were discussed in 2.2) and
focused on the desired location using the built-in microscope. The microscope is
able to focus on a circle with a diameter of as small as one micron.
Measurements are taken over a specified range of wavenumbers in a specified
number and lengths of accumulation. Generally, the higher the accumulation
number and time the higher the sensitivity, or signal-to-noise-ratio, of the
measurements taken. Higher power is also able to produce a cleaner signal,
35
but is very difficult to produce measurements at high power due to the likelyhood
of fiber burnout, as shown in Figure 3-17, or saturation of the spectra produced
resulting in extremely high intensities, weakening the relative sharpness of the
Raman bands produced. For our samples typical spectral acquisition settings
would be 2 accumulations of 50 seconds each at 10% power.
Figure 3-16. Image of T1000/epoxy matrix using a 50x microscope to focus on individual fibers.
Figure 3-17. Image of IM7/epoxy with peal-ply treatment outer using a 50x microscope showing fiber burnout due to high power.
Fiber burnout due to sample over-exposure
36
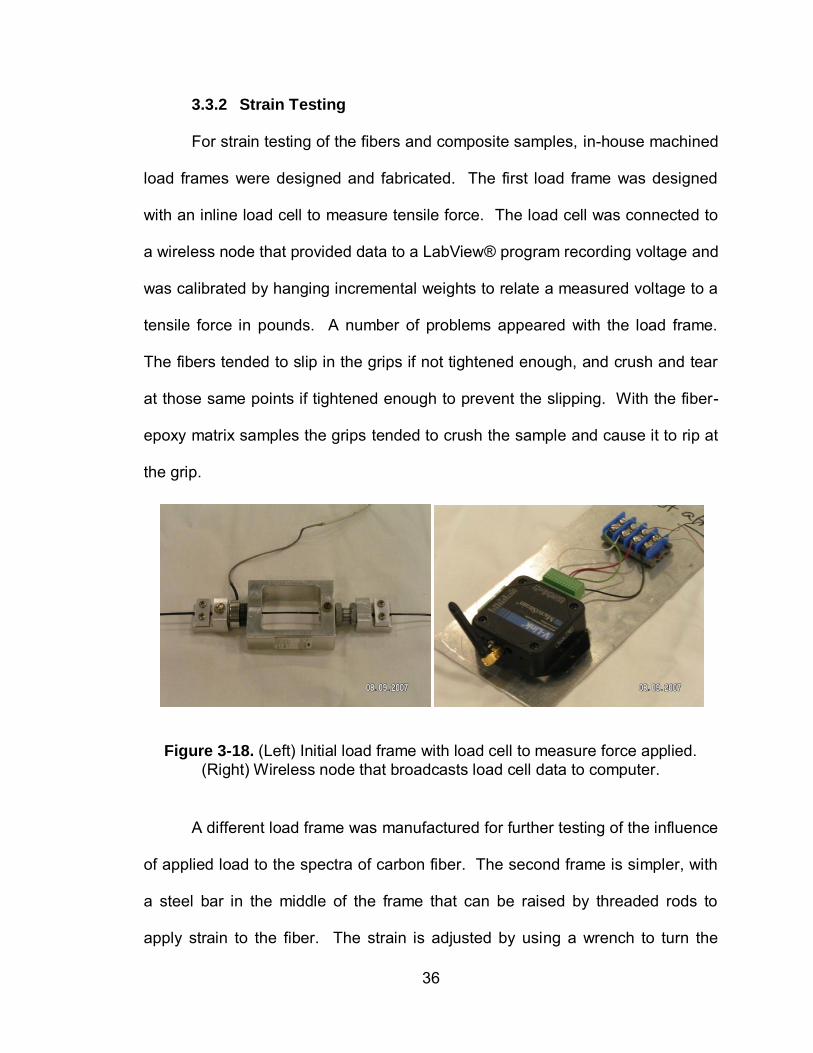
3.3.2 Strain Testing
For strain testing of the fibers and composite samples, in-house machined
load frames were designed and fabricated. The first load frame was designed
with an inline load cell to measure tensile force. The load cell was connected to
a wireless node that provided data to a LabView® program recording voltage and
was calibrated by hanging incremental weights to relate a measured voltage to a
tensile force in pounds. A number of problems appeared with the load frame.
The fibers tended to slip in the grips if not tightened enough, and crush and tear
at those same points if tightened enough to prevent the slipping. With the fiber-
epoxy matrix samples the grips tended to crush the sample and cause it to rip at
the grip.
Figure 3-18. (Left) Initial load frame with load cell to measure force applied. (Right) Wireless node that broadcasts load cell data to computer.
A different load frame was manufactured for further testing of the influence
of applied load to the spectra of carbon fiber. The second frame is simpler, with
a steel bar in the middle of the frame that can be raised by threaded rods to
apply strain to the fiber. The strain is adjusted by using a wrench to turn the
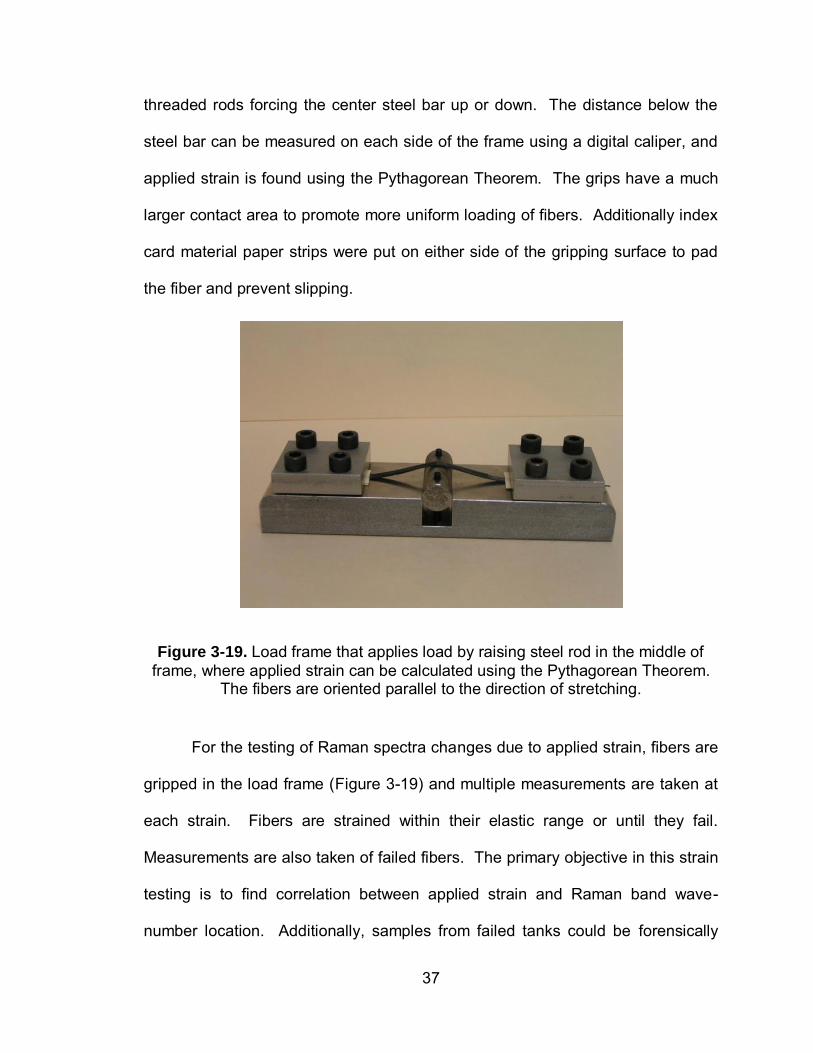
37
threaded rods forcing the center steel bar up or down. The distance below the
steel bar can be measured on each side of the frame using a digital caliper, and
applied strain is found using the Pythagorean Theorem. The grips have a much
larger contact area to promote more uniform loading of fibers. Additionally index
card material paper strips were put on either side of the gripping surface to pad
the fiber and prevent slipping.
Figure 3-19. Load frame that applies load by raising steel rod in the middle of frame, where applied strain can be calculated using the Pythagorean Theorem.
The fibers are oriented parallel to the direction of stretching.
For the testing of Raman spectra changes due to applied strain, fibers are
gripped in the load frame (Figure 3-19) and multiple measurements are taken at
each strain. Fibers are strained within their elastic range or until they fail.
Measurements are also taken of failed fibers. The primary objective in this strain
testing is to find correlation between applied strain and Raman band wave-
number location. Additionally, samples from failed tanks could be forensically
38
analyzed to find their stress state at the time of failure. Comparison of the
spectrum produced by the failed tank and that of a virgin tank could be made by
looking at peak locations, and correlating that to calibrated stress/strain-peak
location information.
39
4 RESULTS
4.1 Spectra of Carbon Fibers and Composites
4.1.1 Carbon Fibers
Although carbon fibers are typically used as part of a composite material,
it is necessary to investigate the spectra of the carbon fibers by themselves. The
spectra produced by solely carbon fibers are more manageable to investigate
because there are less Raman bands due to the less complex material
composition. Additionally, spectra produced by just the carbon fiber can allow for
deeper analysis of Raman carbon bands shifts with applied strain. Raman
spectra of the carbon fibers listed in Section 3.2.1 were tested using a variety of
incident lasers and measurement settings.
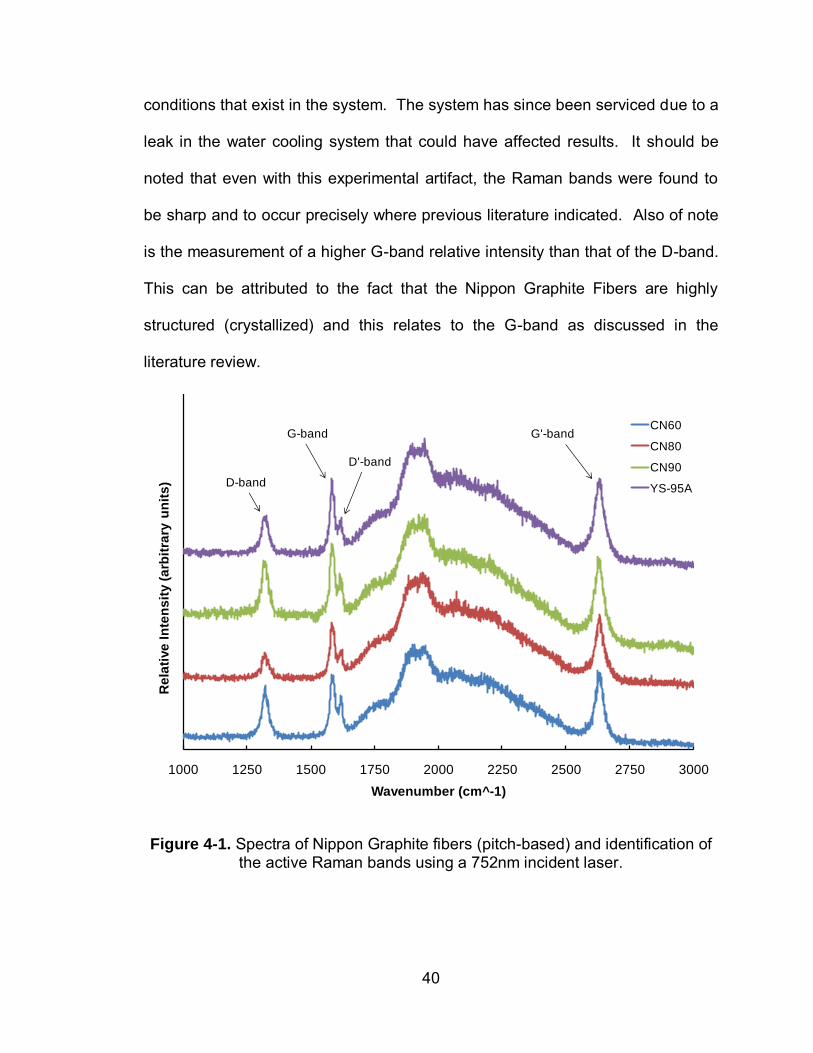
The pitch-based fibers CN60, CN80, CN90, and YS-95A from Nippon
Graphite Fibers spectra are shown in Figure 4-1 using a 752nm incident laser.
The response clearly shows the Raman D, G, D’, and G’ bands as discussed in
previous literature, and these particular fibers have very sharp Raman bands as
a result of their high level of graphitization during production. The hump that
appears in the spectra in the 1700-2500 cm-1 range is prevalent in all data
collected on the Raman system using the 752 nm laser. It is hypothesized that
this is an experimental artifact and could be a factor of optical alignment or other
40
conditions that exist in the system. The system has since been serviced due to a
leak in the water cooling system that could have affected results. It should be
noted that even with this experimental artifact, the Raman bands were found to
be sharp and to occur precisely where previous literature indicated. Also of note
is the measurement of a higher G-band relative intensity than that of the D-band.
This can be attributed to the fact that the Nippon Graphite Fibers are highly
structured (crystallized) and this relates to the G-band as discussed in the
literature review.
Figure 4-1. Spectra of Nippon Graphite fibers (pitch-based) and identification of the active Raman bands using a 752nm incident laser.
1000 1250 1500 1750 2000 2250 2500 2750 3000
Re
lati
ve
In
ten
sit
y (
arb
itra
ry u
nit
s)
Wavenumber (cm^-1)
CN60
CN80
CN90
YS-95AD-band
G-band
D'-band
G'-band
41
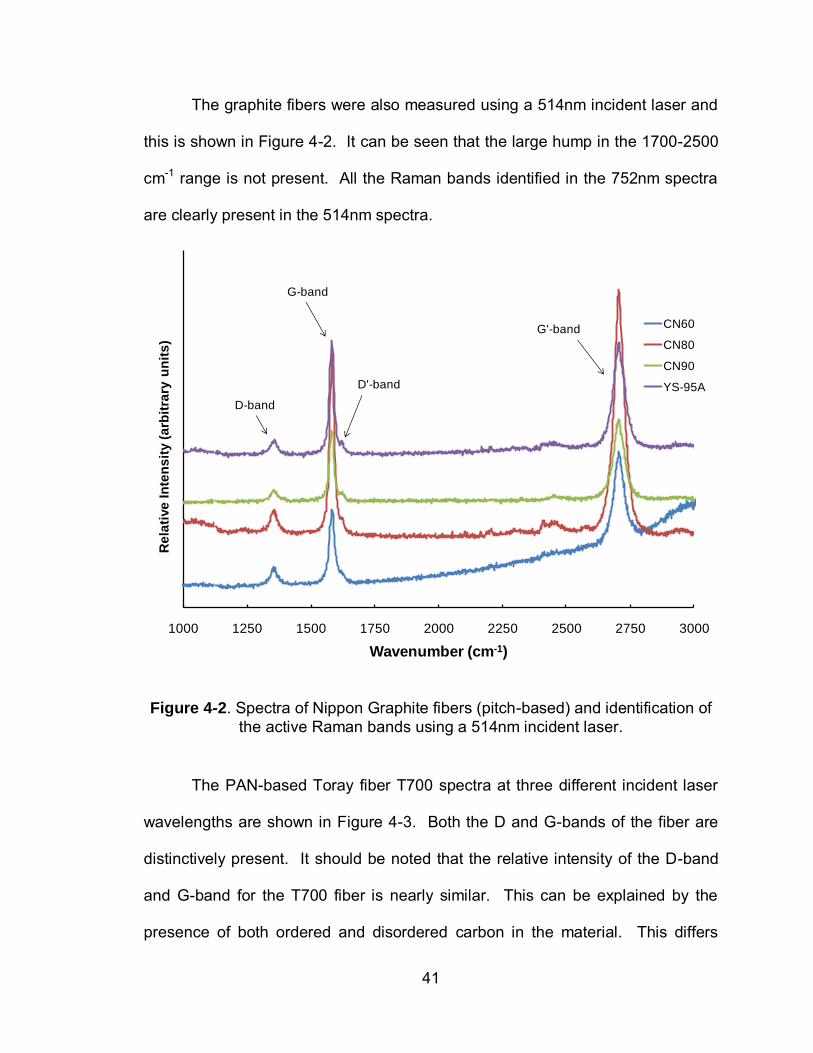
The graphite fibers were also measured using a 514nm incident laser and
this is shown in Figure 4-2. It can be seen that the large hump in the 1700-2500
cm-1 range is not present. All the Raman bands identified in the 752nm spectra
are clearly present in the 514nm spectra.
Figure 4-2. Spectra of Nippon Graphite fibers (pitch-based) and identification of the active Raman bands using a 514nm incident laser.
The PAN-based Toray fiber T700 spectra at three different incident laser
wavelengths are shown in Figure 4-3. Both the D and G-bands of the fiber are
distinctively present. It should be noted that the relative intensity of the D-band
and G-band for the T700 fiber is nearly similar. This can be explained by the
presence of both ordered and disordered carbon in the material. This differs
1000 1250 1500 1750 2000 2250 2500 2750 3000
Re
lati
ve
In
ten
sit
y (
arb
itra
ry u
nit
s)
Wavenumber (cm-1)
CN60
CN80
CN90
YS-95A
D-band
G-band
D'-band
G'-band

42
from the previous mentioned (Nippon Graphite Fibers) samples that had a much
higher intensity G-band from their higher percentage of ordered carbon in the
material.
Figure 4-3. Spectra of Toray T700 fiber (PAN-based) and identification of the active Raman bands using incident lasers of 488, 647, and 752 nm.
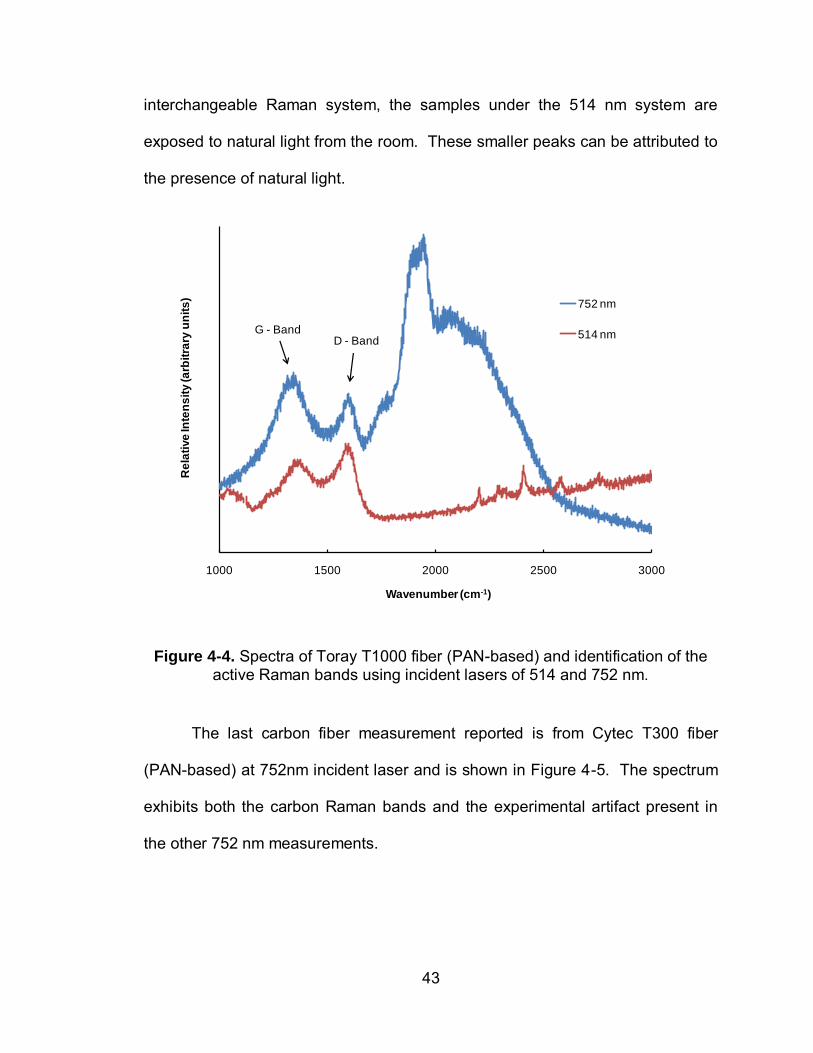
Figure 4-4 shows spectra of Toray T1000 fiber at both 752 and 514 nm
incident laser wavelengths. Due to longer accumulation times during
measurement, the spectra of the T1000 produced is much cleaner (higher signal-
to-noise-ratio) than the spectra acquired of the T700 fiber. Also of note, are the
various smaller peaks in the 514 nm spectra in the region between 2200 and
2800 cm-1. Unlike the closed sample container for the 488, 647, and 752 nm
800 1000 1200 1400 1600
Re
lati
ve
In
ten
sit
y (
arb
itra
ry u
nit
s)
Wavenumber (cm-1)
752 nm
647 nm
488 nm
D - Band G - Band
43
interchangeable Raman system, the samples under the 514 nm system are
exposed to natural light from the room. These smaller peaks can be attributed to
the presence of natural light.
Figure 4-4. Spectra of Toray T1000 fiber (PAN-based) and identification of the active Raman bands using incident lasers of 514 and 752 nm.
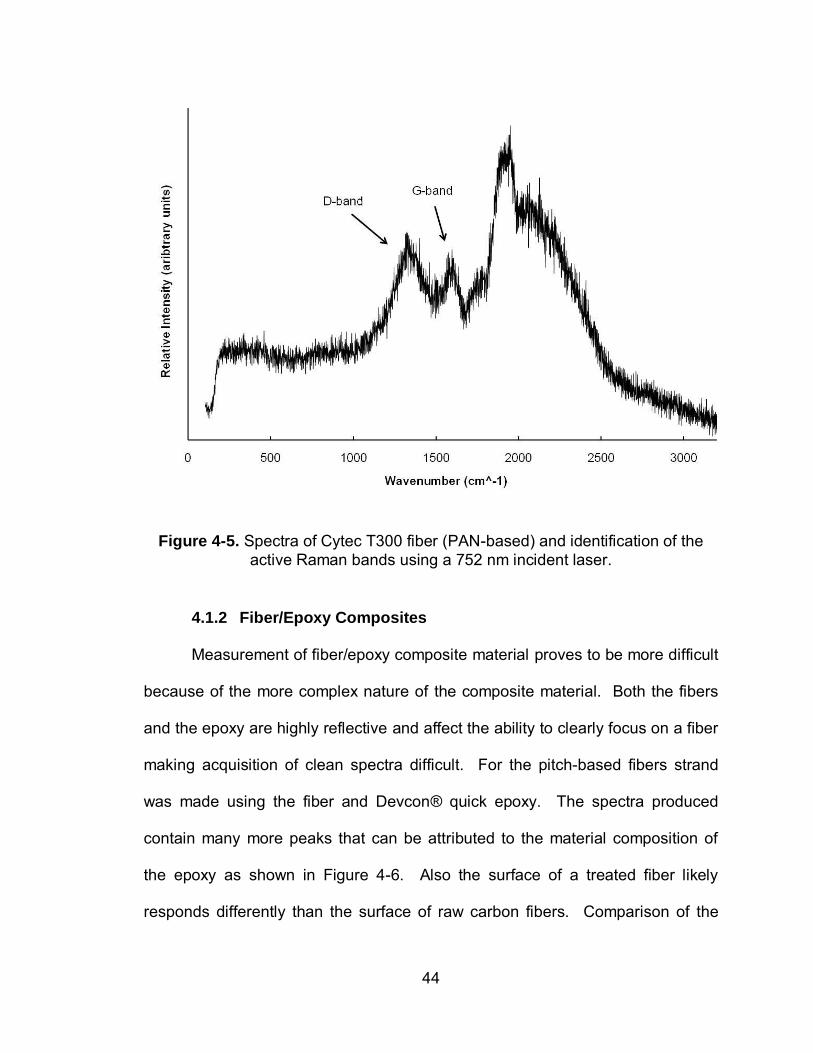
The last carbon fiber measurement reported is from Cytec T300 fiber
(PAN-based) at 752nm incident laser and is shown in Figure 4-5. The spectrum
exhibits both the carbon Raman bands and the experimental artifact present in
the other 752 nm measurements.
1000 1500 2000 2500 3000
Re
lati
ve
Inte
ns
ity (a
rbit
rary
un
its
)
Wavenumber (cm-1)
752 nm
514 nmD - Band
G - Band
44
Figure 4-5. Spectra of Cytec T300 fiber (PAN-based) and identification of the active Raman bands using a 752 nm incident laser.
4.1.2 Fiber/Epoxy Composites
Measurement of fiber/epoxy composite material proves to be more difficult
because of the more complex nature of the composite material. Both the fibers
and the epoxy are highly reflective and affect the ability to clearly focus on a fiber
making acquisition of clean spectra difficult. For the pitch-based fibers strand
was made using the fiber and Devcon® quick epoxy. The spectra produced
contain many more peaks that can be attributed to the material composition of
the epoxy as shown in Figure 4-6. Also the surface of a treated fiber likely
responds differently than the surface of raw carbon fibers. Comparison of the
45
raw fiber spectra to the spectra produced by a fiber/epoxy composite is shown in
Figure 4-7.
Figure 4-6. Spectra of Nippon Graphite Fibers/Epoxy strand using a 752nm incident laser.
1000 1500 2000 2500 3000
Re
lati
ve
Inte
ns
ity (a
rbit
rary
un
its
)
Wavenumber (cm-1)
CN60/Epoxy
CN80/Epoxy
CN90/Epoxy
46
Figure 4-7. Raman spectra of CN-60 Nippon Graphite fiber and CN-60/Quick Epoxy Matrix using a 752nm incident laser.
4.1.3 Spectral Processing and Comparison
To analyze the spectra produced from the carbon fiber, commercial
software PeakFit® was used. This peak processing software is important to
assist in finding exact peak locations of the Raman bands and other critical peak
and overall spectral characteristics. The software enables the user to shape
functions to the peaks produced by the spectra and remove or filter errant data
from the spectra. For most peaks, deconvolution with a quadratic or linear base
line and a 95% filter fit to a Lorentzian amplitude was used to focus on only the
distinct peaks that relate to the known Raman bands produced. Deconvolution is
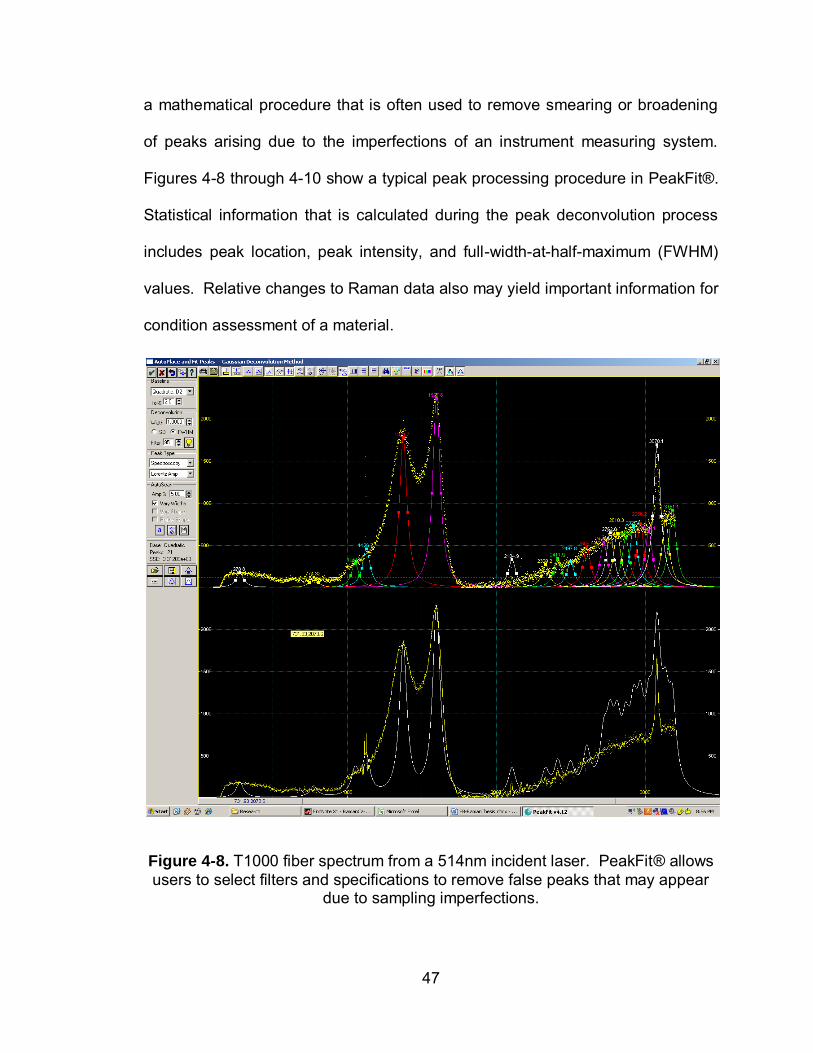
47
a mathematical procedure that is often used to remove smearing or broadening
of peaks arising due to the imperfections of an instrument measuring system.
Figures 4-8 through 4-10 show a typical peak processing procedure in PeakFit®.
Statistical information that is calculated during the peak deconvolution process
includes peak location, peak intensity, and full-width-at-half-maximum (FWHM)
values. Relative changes to Raman data also may yield important information for
condition assessment of a material.
Figure 4-8. T1000 fiber spectrum from a 514nm incident laser. PeakFit® allows users to select filters and specifications to remove false peaks that may appear
due to sampling imperfections.
48
Figure 4-9. Spectrum after deconvolution and errant peak removal.
Figure 4-10. Numerical analysis that PeakFit® provides after processing.
49
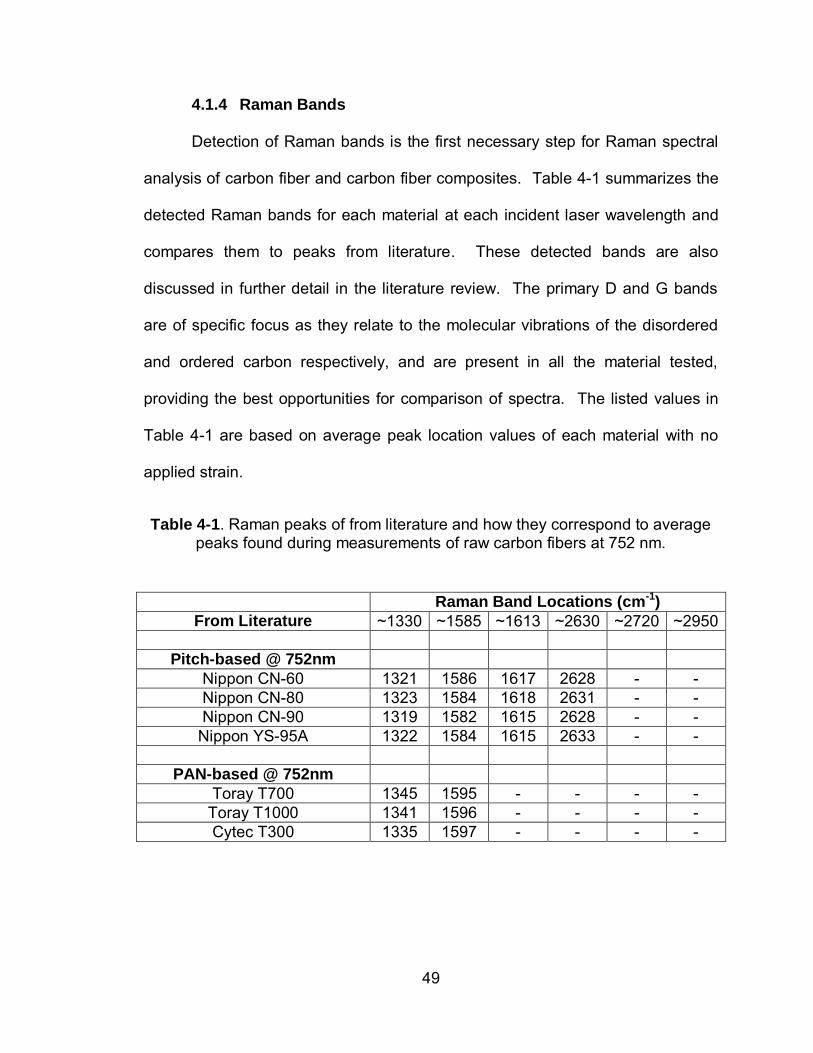
4.1.4 Raman Bands
Detection of Raman bands is the first necessary step for Raman spectral
analysis of carbon fiber and carbon fiber composites. Table 4-1 summarizes the
detected Raman bands for each material at each incident laser wavelength and
compares them to peaks from literature. These detected bands are also
discussed in further detail in the literature review. The primary D and G bands
are of specific focus as they relate to the molecular vibrations of the disordered
and ordered carbon respectively, and are present in all the material tested,
providing the best opportunities for comparison of spectra. The listed values in
Table 4-1 are based on average peak location values of each material with no
applied strain.
Table 4-1. Raman peaks of from literature and how they correspond to average peaks found during measurements of raw carbon fibers at 752 nm.
Raman Band Locations (cm-1)
From Literature ~1330 ~1585 ~1613 ~2630 ~2720 ~2950
Pitch-based @ 752nm Nippon CN-60 1321
1586 1617 2628 - - Nippon CN-80 1323 1584 1618 2631 - - Nippon CN-90 1319 1582 1615 2628 - -
Nippon YS-95A 1322 1584 1615 2633 - -
PAN-based @ 752nm Toray T700 1345 1595 - - - -
Toray T1000 1341 1596 - - - - Cytec T300 1335 1597 - - - -

50
4.2 Strain Testing Results
4.2.1 Peak Shift
The specific peak location can be examined for each spectrum based on
statistical analysis from PeakFit® as described in the spectral processing section.
It is found that for some types of fiber and also documented in previous literature
that peak locations for a given Raman band decrease as a function of increased
applied strain. The pitch-based fibers did not exhibit this peak shift when
undergoing strain testing. One reason for the pitch-fibers not exhibiting a peak
shift is that the pitch-fibers tested are much stiffer (higher modulus) than the
PAN-based fibers tested. This stiffness decreases the possible elongation and
elastic range of the fibers making testing strain within the elastic range very
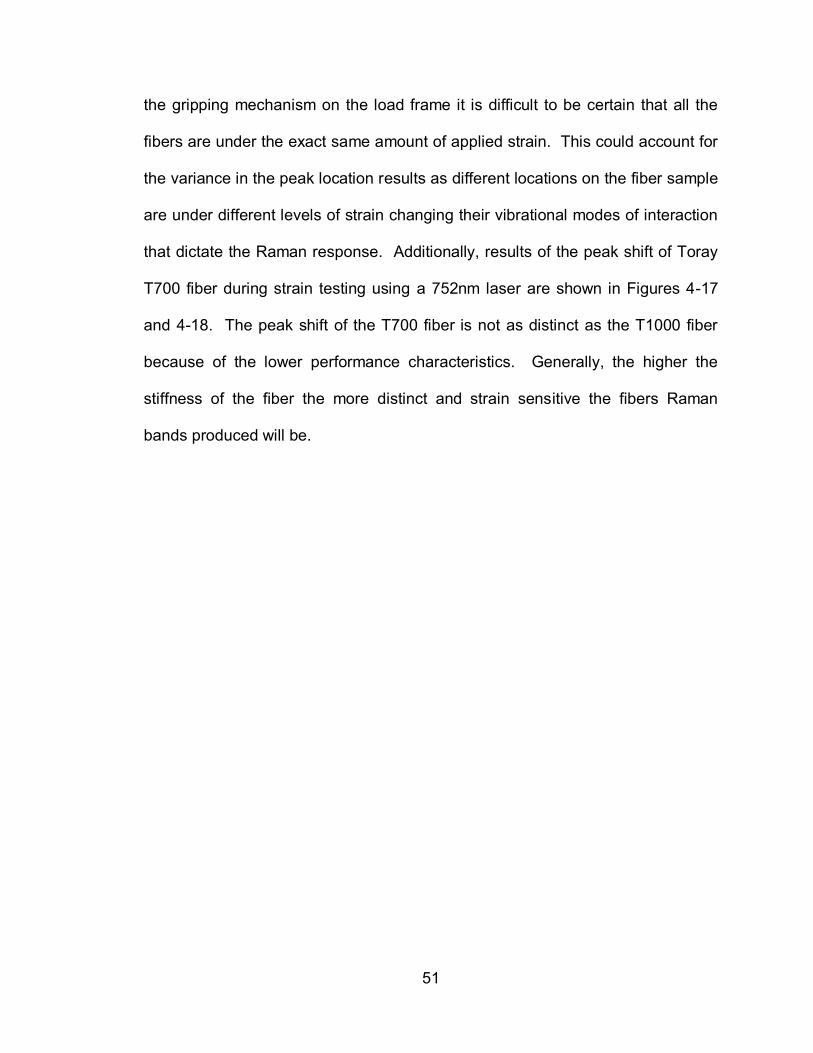
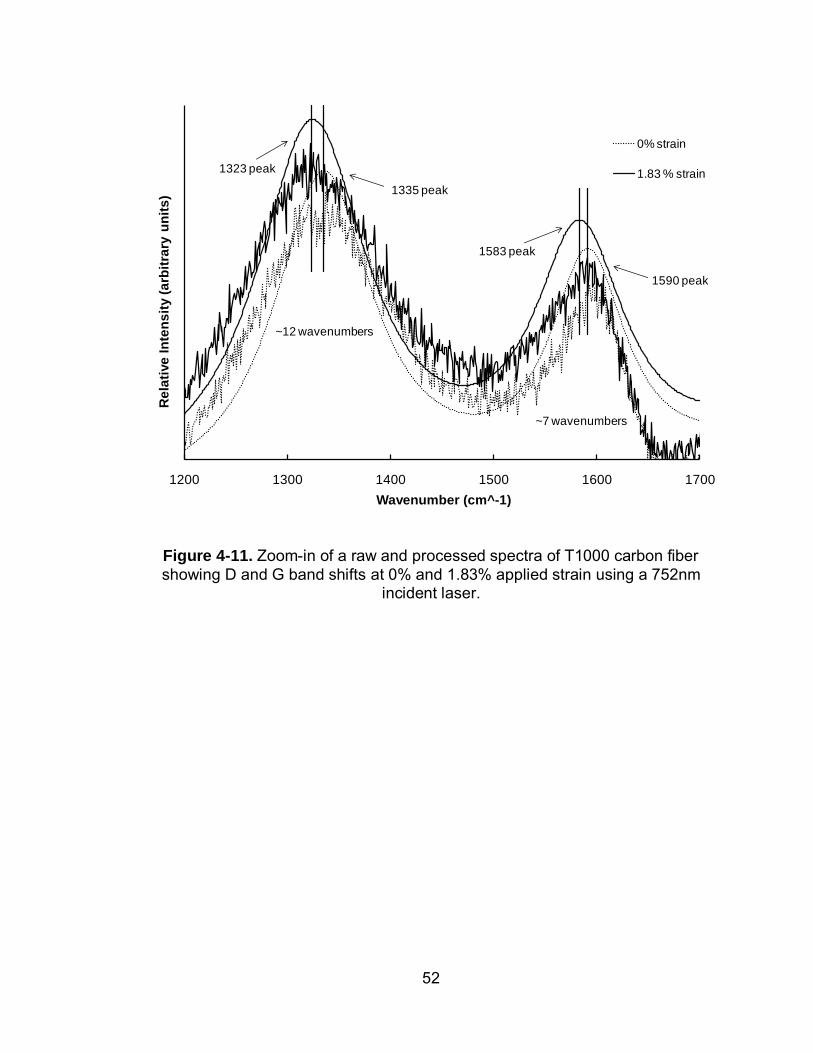
difficult. For the PAN fibers tested, Toray T1000 fiber exhibited the most
consistent peak shift as strain was applied to the fibers. Examples of Raman
peak shift of the T1000 fiber using a 752 nm and 514 nm incident laser
wavelength are shown in Figures 4-11 and 4-12 respectively. From large
amounts of data collected during strain testing, relationships have been
developed for peak shift as a function of applied stress. These relationships are
shown in Figures 4-13 thru 4-16 for the both the D and G Raman bands at 752
nm and 514 nm incident laser. The T1000 had the most consistent and
observable peak shift of the fibers tested. This can be attributed to the high
stiffness of this fiber type when comparing it to other PAN-based fibers. For the
T1000 fiber the peaks appear to shift at least 5 wavenumbers / percent applied
strain. In some instances and in some other literature this shift is higher. Due to
51
the gripping mechanism on the load frame it is difficult to be certain that all the
fibers are under the exact same amount of applied strain. This could account for
the variance in the peak location results as different locations on the fiber sample
are under different levels of strain changing their vibrational modes of interaction
that dictate the Raman response. Additionally, results of the peak shift of Toray
T700 fiber during strain testing using a 752nm laser are shown in Figures 4-17
and 4-18. The peak shift of the T700 fiber is not as distinct as the T1000 fiber
because of the lower performance characteristics. Generally, the higher the
stiffness of the fiber the more distinct and strain sensitive the fibers Raman
bands produced will be.
52
Figure 4-11. Zoom-in of a raw and processed spectra of T1000 carbon fiber showing D and G band shifts at 0% and 1.83% applied strain using a 752nm
incident laser.
1200 1300 1400 1500 1600 1700
Re
lati
ve
In
ten
sit
y (
arb
itra
ry u
nit
s)
Wavenumber (cm^-1)
0% strain
1.83 % strain
~12 wavenumbers
~7 wavenumbers
1335 peak
1323 peak
1590 peak
1583 peak
53
Figure 4-12. Zoom-in of a raw and processed spectra of T1000 carbon fiber showing D and G band shifts at 0% and 1.68% applied strain using a 514nm
incident laser.
1200 1300 1400 1500 1600 1700
Re
lati
ve
In
ten
sit
y (
arb
itra
ry u
nit
s)
Wavenumber (cm^-1)
0% strain
1.68 % strain
~15 wavenumbers
~16 wavenumbers
1366 peak
1351 peak
1594 peak
1578 peak
54
Figure 4-13. Peak shift of 1330 cm-1 peak for T1000 fiber using a 752 nm incident laser. Each value is an average of 3 measurements, except for the last
data point which is singular.
y = -5.4861x + 1332.5R² = 0.8883
1320
1325
1330
1335
1340
0 0.25 0.5 0.75 1 1.25 1.5 1.75 2
Pe
ak
Lo
ca
tio
n (c
m-1
)
Applied Strain (%)
Fiber failed in load frame @ 1.98% strain
55
Figure 4-14. Peak shift of 1585 cm-1 peak for T1000 fiber using a 752 nm incident laser. Each value is an average of 3 measurements, except for the last
data point which is singular.
y = -8.8136x + 1594.8R² = 0.9231
1575
1580
1585
1590
1595
1600
0 0.25 0.5 0.75 1 1.25 1.5 1.75 2
Pe
ak
loc
ati
on
(c
m-1
)
Applied Strain (%)
Fiber failed in load frame @ 1.98% strain

56
Figure 4-15. Peak shift of 1360 cm-1 peak for T1000 fiber using a 514 nm incident laser. Each value is an average of 4 measurements.
y = -8.2326x + 1373.1R² = 0.8004
1350
1355
1360
1365
1370
1375
1380
1385
0.0 0.5 1.0 1.5 2.0
Pe
ak
Po
sit
ion
(c
m-1
)
Applied Strain (%)
57
Figure 4-16. Peak shift of 1585 cm-1 peak for T1000 fiber using a 514 nm incident laser. Each value is an average of 4 measurements.
y = -6.6726x + 1596.7R² = 0.8092
1582
1584
1586
1588
1590
1592
1594
1596
1598
1600
0.0 0.5 1.0 1.5 2.0
Pe
ak
Po
sit
ion
(c
m-1
)
Applied Strain (%)
58
Figure 4-17. Peak shift of 1340 cm-1 peak for T700 fiber using a 752 nm incident laser. Each measurement is based off an average of 3 values, except for the last
data point which is singular.
y = -3.9399x + 1343.2R² = 0.4618
1325
1330
1335
1340
1345
1350
0 0.5 1 1.5 2 2.5
Wa
ve
nu
mb
er (c
m-1
)
Applied Strain (%)
59
Figure 4-18. Peak shift of 1590 cm-1 peak for T700 fiber using a 752 nm incident laser. Each measurement is based off an average of 3 values, except for the last
data point which is singular.
Strain testing was also conducted on the T-40 composite strand ripped
from a tank sent from NASA. As previously mentioned in the experimental
section this material is typical of wrapping in COPVs that NASA uses for gas
storage on shuttles. Testing the composite materials is more difficult due to the
additional material present making focusing on fibers more difficult and a higher
variance in the results. The stiffness of the material is also much greater, but in
theory the fibers should work as more of a system due to the addition of
epoxy/fiber composite interaction and be more likely to be under the same
y = -0.3426x + 1592.9R² = 0.0115
1586
1588
1590
1592
1594
1596
1598
1600
1602
1604
1606
0 0.5 1 1.5 2 2.5
Wa
ve
nu
mb
er (c
m-1
)
Applied Strain (%)
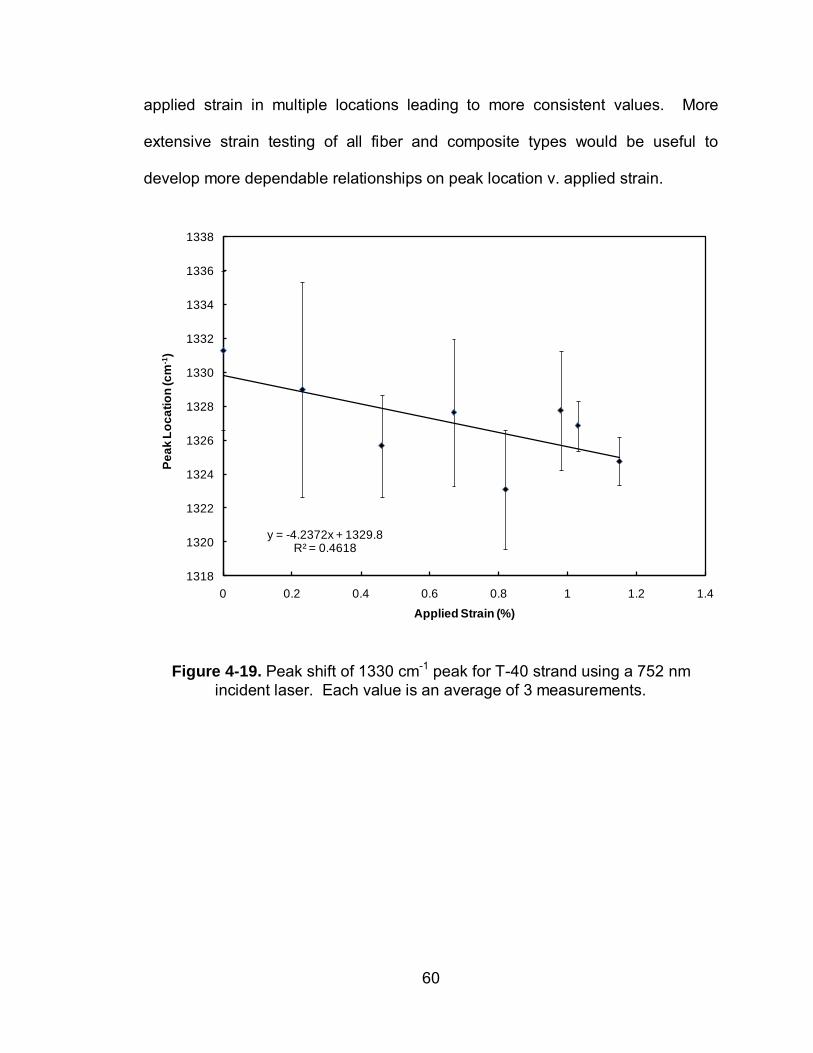
60
applied strain in multiple locations leading to more consistent values. More
extensive strain testing of all fiber and composite types would be useful to
develop more dependable relationships on peak location v. applied strain.
Figure 4-19. Peak shift of 1330 cm-1 peak for T-40 strand using a 752 nm incident laser. Each value is an average of 3 measurements.
y = -4.2372x + 1329.8R² = 0.4618
1318
1320
1322
1324
1326
1328
1330
1332
1334
1336
1338
0 0.2 0.4 0.6 0.8 1 1.2 1.4
Pe
ak
Lo
ca
tio
n (c
m-1
)
Applied Strain (%)
61
Figure 4-20. Peak shift of 1590 cm-1 peak for T-40 strand using a 752 nm incident laser. Each value is an average of 3 measurements.
4.2.2 Full-width-at-half-maximum
Besides peak location, other comparisons must be able to be made
between different acquired spectra. One such geometric value is the Full-width-
at-half-maximum value (FWHM). This value is a numerical value relating to the
width at half the maximum value of each peak. As part of the deconvolution of
peaks, Peak-Fit calculates the FWHM of each peak. In order to understand how
this value is useful it is necessary to normalize this using one of the peaks as a
reference. This is done by establishing a ratio of FWHM of each peak compared
to FWHM of a reference peak. For analysis the reference peak chosen was that
y = -8.0633x + 1596.3R² = 0.8161
1580
1582
1584
1586
1588
1590
1592
1594
1596
1598
1600
1602
0 0.2 0.4 0.6 0.8 1 1.2 1.4
Pe
ak
Lo
ca
tio
n (c
m^
-1)
Applied Strain (%)
62
of the D-band that is present between 1330 and 1360 cm-1 and can be detected
in all material tested.
Figures 4-21 and 4-22 show the FWHM ratio of the T1000 fiber samples
using 752 and 514nm incident lasers respectively. From these figures it can be
seen that generally as the applied strain increases, the FWHM ratio of the G-
band relative to the D-band decreases in value. Of note is the failed fiber that
produced nearly the same result as the fiber with 0% strain in Figure 4-21. This
is to be expected as the measurement of the failed fiber should be similar to that
of fibers with no strain since the fibers have failed at the point of stress
concentration leaving the rest of the fibers to go back to their relaxed state at 0%
applied strain. Theoretically the fibers should not undergo damage at a
molecular level if they have amounts of strain applied only within their elastic
region.
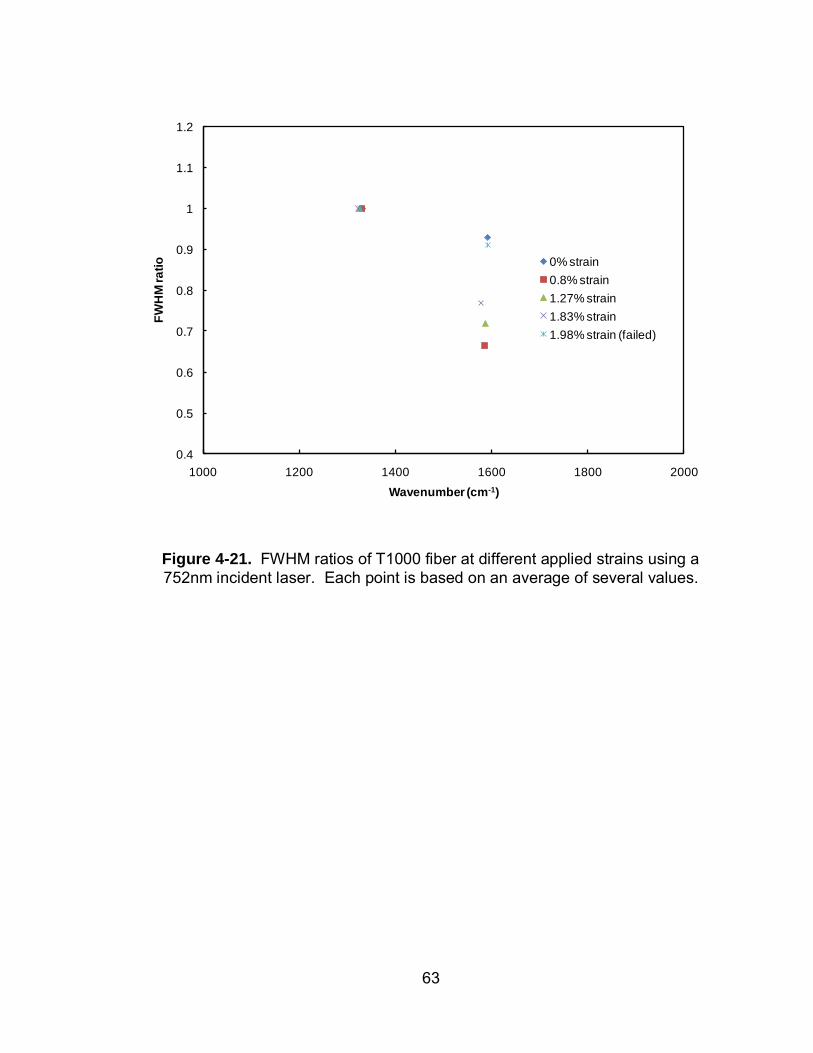
63
Figure 4-21. FWHM ratios of T1000 fiber at different applied strains using a 752nm incident laser. Each point is based on an average of several values.
0.4
0.5
0.6
0.7
0.8
0.9
1
1.1
1.2
1000 1200 1400 1600 1800 2000
FW
HM
ra
tio
Wavenumber (cm-1)
0% strain
0.8% strain
1.27% strain
1.83% strain
1.98% strain (failed)
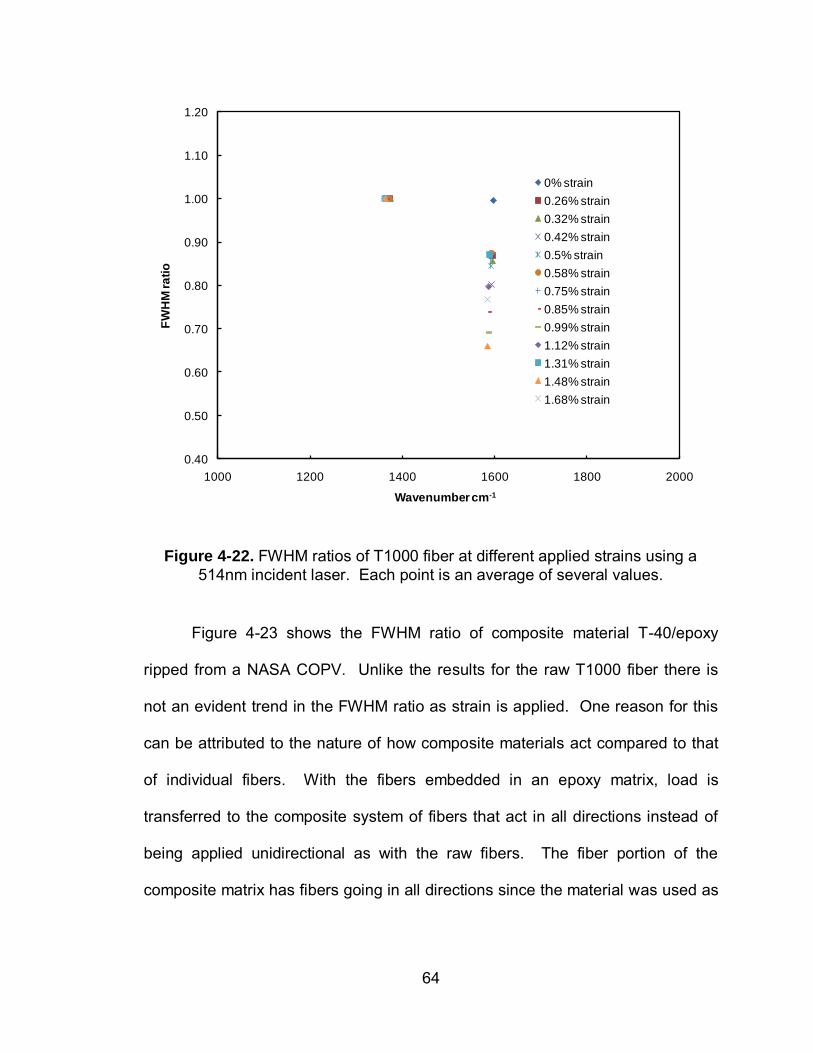
64
Figure 4-22. FWHM ratios of T1000 fiber at different applied strains using a 514nm incident laser. Each point is an average of several values.
Figure 4-23 shows the FWHM ratio of composite material T-40/epoxy
ripped from a NASA COPV. Unlike the results for the raw T1000 fiber there is
not an evident trend in the FWHM ratio as strain is applied. One reason for this
can be attributed to the nature of how composite materials act compared to that
of individual fibers. With the fibers embedded in an epoxy matrix, load is
transferred to the composite system of fibers that act in all directions instead of
being applied unidirectional as with the raw fibers. The fiber portion of the
composite matrix has fibers going in all directions since the material was used as
0.40
0.50
0.60
0.70
0.80
0.90
1.00
1.10
1.20
1000 1200 1400 1600 1800 2000
FW
HM
ra
tio
Wavenumber cm-1
0% strain
0.26% strain
0.32% strain
0.42% strain
0.5% strain
0.58% strain
0.75% strain
0.85% strain
0.99% strain
1.12% strain
1.31% strain
1.48% strain
1.68% strain
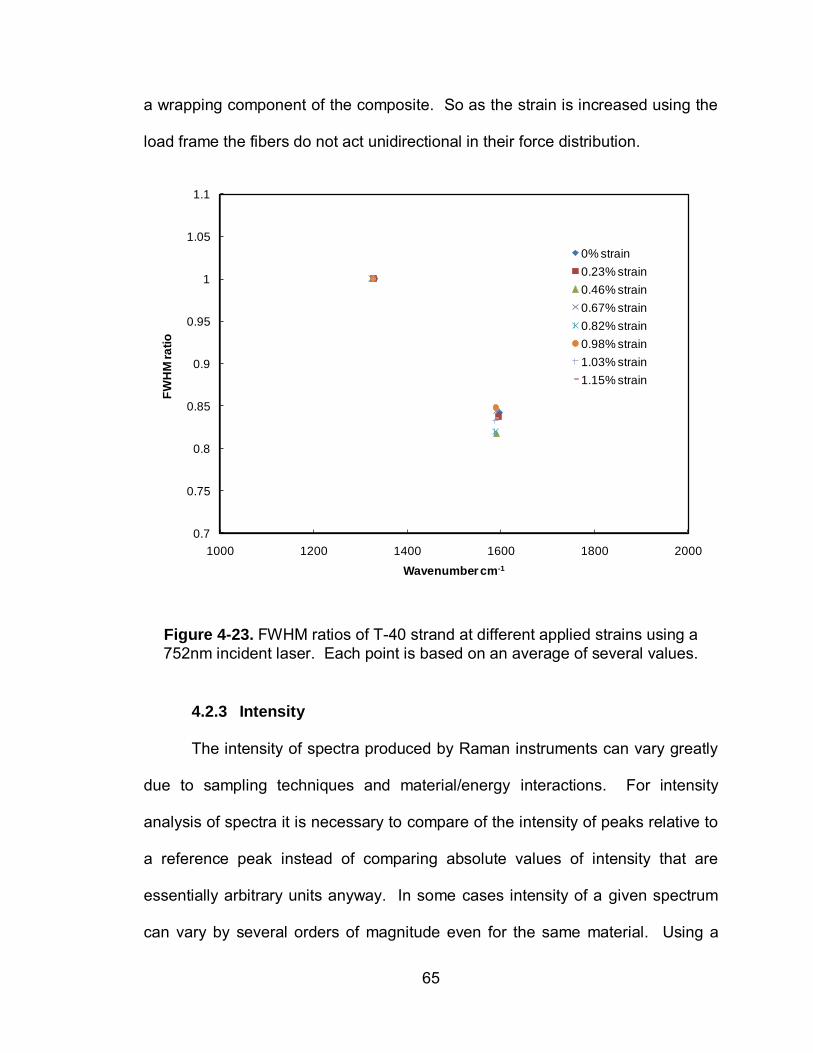
65
a wrapping component of the composite. So as the strain is increased using the
load frame the fibers do not act unidirectional in their force distribution.
Figure 4-23. FWHM ratios of T-40 strand at different applied strains using a 752nm incident laser. Each point is based on an average of several values.
4.2.3 Intensity
The intensity of spectra produced by Raman instruments can vary greatly
due to sampling techniques and material/energy interactions. For intensity
analysis of spectra it is necessary to compare of the intensity of peaks relative to
a reference peak instead of comparing absolute values of intensity that are
essentially arbitrary units anyway. In some cases intensity of a given spectrum
can vary by several orders of magnitude even for the same material. Using a
0.7
0.75
0.8
0.85
0.9
0.95
1
1.05
1.1
1000 1200 1400 1600 1800 2000
FW
HM
ra
tio
Wavenumber cm-1
0% strain
0.23% strain
0.46% strain
0.67% strain
0.82% strain
0.98% strain
1.03% strain
1.15% strain
66
relative intensity approach is also another way to quantify the geometric changes
occurring in the spectra produced. For this analysis the intensity ratios were
established relative to the D-band associated with disordered forms of carbon.
Figures 4-24 and 4-25 show the intensity ratio at different strain levels for
T1000 fiber at both 752 and 514nm. Generally the intensity ratio of the D-band
relative to the G-band decreases as the strain increases. The intensity of the D-
band is associated with ordered forms of the carbon hexagonal lattice structure.
This can be explained since as the fibers are strained the molecular structure will
become stressed and failure of carbon-carbon bonds at points within the lattice
structure will lead to a higher portion of disordered carbon. Of note is the fact
that the intensity ratios of the D-band relative to the G-band using the 514nm
incident laser are much higher than that of the 752nm laser. As stated before,
the intensity of a spectrum is not nearly as important or informative as the relative
changes that occur within it. The data for the 514nm and 752nm incident lasers
was collected using a different optic system with separate calibrations and
operating conditions. Despite the different specific value of ratios, the trend for
both incident lasers is the same with a decreasing G-band intensity as strain
level increases.
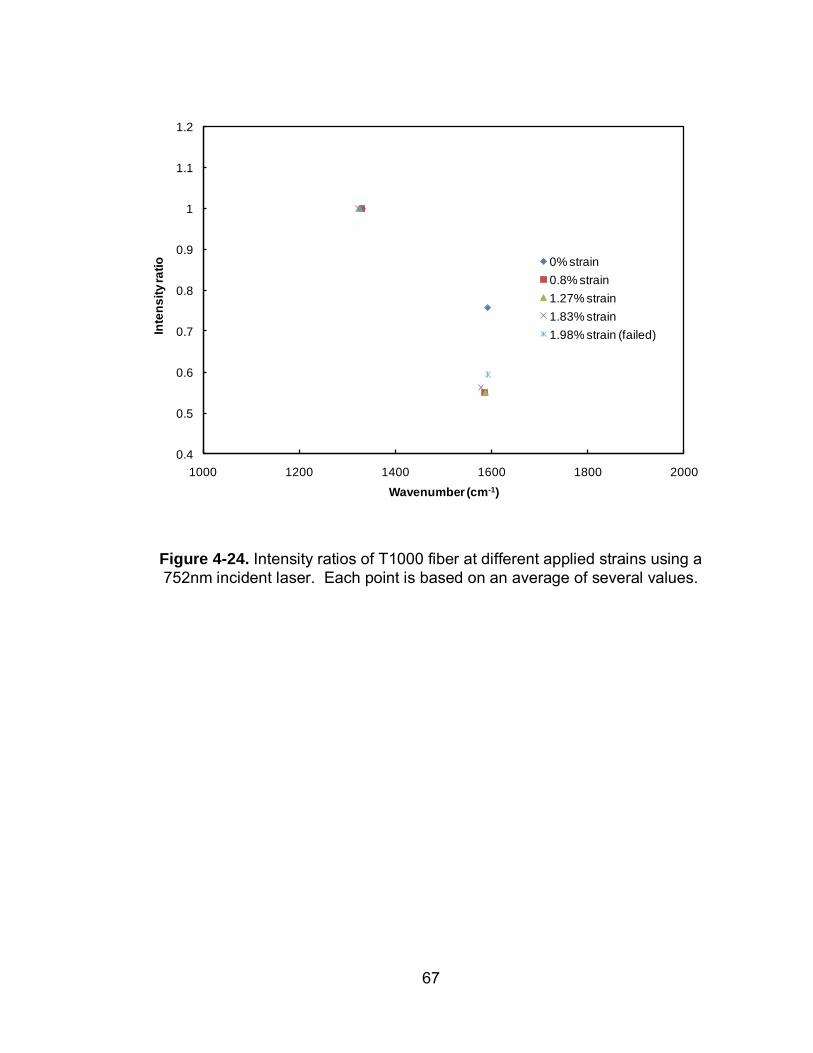
67
Figure 4-24. Intensity ratios of T1000 fiber at different applied strains using a 752nm incident laser. Each point is based on an average of several values.
0.4
0.5
0.6
0.7
0.8
0.9
1
1.1
1.2
1000 1200 1400 1600 1800 2000
Inte
ns
ity ra
tio
Wavenumber (cm-1)
0% strain
0.8% strain
1.27% strain
1.83% strain
1.98% strain (failed)
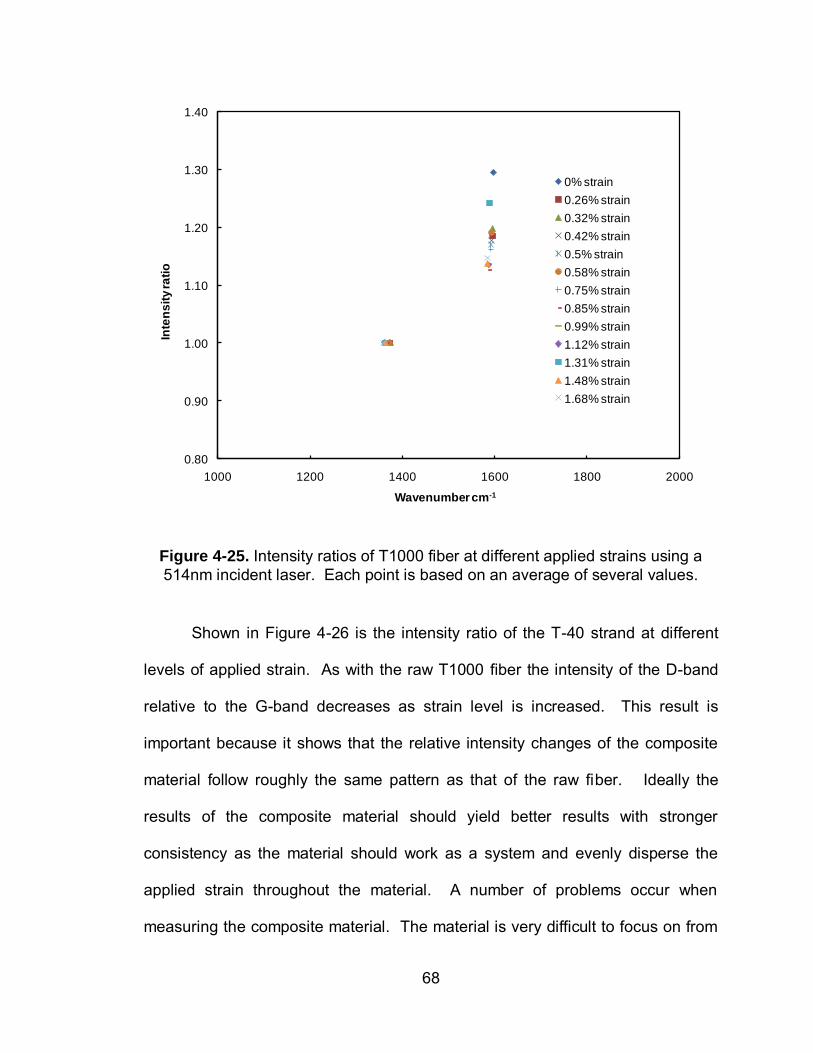
68
Figure 4-25. Intensity ratios of T1000 fiber at different applied strains using a 514nm incident laser. Each point is based on an average of several values.
Shown in Figure 4-26 is the intensity ratio of the T-40 strand at different
levels of applied strain. As with the raw T1000 fiber the intensity of the D-band
relative to the G-band decreases as strain level is increased. This result is
important because it shows that the relative intensity changes of the composite
material follow roughly the same pattern as that of the raw fiber. Ideally the
results of the composite material should yield better results with stronger
consistency as the material should work as a system and evenly disperse the
applied strain throughout the material. A number of problems occur when
measuring the composite material. The material is very difficult to focus on from
0.80
0.90
1.00
1.10
1.20
1.30
1.40
1000 1200 1400 1600 1800 2000
Inte
ns
ity ra
tio
Wavenumber cm-1
0% strain
0.26% strain
0.32% strain
0.42% strain
0.5% strain
0.58% strain
0.75% strain
0.85% strain
0.99% strain
1.12% strain
1.31% strain
1.48% strain
1.68% strain

69
the outer side because of the reflective nature of the epoxy. Another issue is that
the orientation of the fibers are not in-line with the uniaxial applied strain because
the fiber portion of the composite material is wrapped in all directions.
Figure 4-26. Intensity ratios of T-40 strand at different applied strains using a 752nm incident laser. Each point is based on an average of several values.
4.3 Composite Material from Tanks
The composite materials provided from the burst tanks as shown in
images in the experimental section have a distinctively different spectrum on the
outer and inner sides of the samples. The inner portion of the samples can be
focused on an individual carbon fiber due to the exposure of the fiber/epoxy
matrix. The outer portion of the samples is difficult to focus on an individual fiber
0.7
0.75
0.8
0.85
0.9
0.95
1
1.05
1.1
1000 1200 1400 1600 1800 2000
Inte
ns
ity ra
tio
Wavenumber cm-1
0% strain
0.23% strain
0.46% strain
0.67% strain
0.82% strain
0.98% strain
1.03% strain
1.15% strain

70
due to the reflective nature or protective coating on the outside of the tanks. The
response from the outside is similar to that of the carbon fiber and epoxy
composites discussed in the previous section.
The response of the T-40 sample at 752 nm incident laser is shown in
Figure 4-27. It is noted that the inner portion of the sample was focused on a
single carbon fiber and resulted in the typical D and G-bands in addition to the
large experimental artifact hump present in the other 752 nm results. The outer
measurement contains the spectra of the fiber and the epoxy material as well as
the artifact between 1700 and 2400 cm-1 of the 752 nm system.
Figure 4-27. Raman spectra of T-40/epoxy ripped strand from a burst tank using a 752 nm incident laser.
0 500 1000 1500 2000 2500 3000
Re
lati
ve
Inte
ns
ity (a
rbit
rary
un
its
)
Wavenumber (cm-1)
T40/epoxy outer
T140 fiber inner
71
The sectioned pieces from the two burst tanks sent to us were tested at
488, 514 and 752 nm incident laser wavelengths. For both laser wavelengths the
distinct D and G carbon bands can be identified from measuring the outer or
inner portion of the sample. The 488 and 514nm lasers are less sensitive than
the 752nm because there is less sample penetration, a function of wavelength.
With the shorter wavelength lasers almost all of the light is reflected back with
only small amounts penetrating through the coating to find the active Raman
bands. For both the T1000/epoxy sample and the IM7/epoxy with peal-ply
treatment the outside spectra can be more clearly identified using the results
from the 752 nm laser. Figures 4-28 thru 4-33 show the response of the burst
tank samples at each wavelength. Further studies on the Raman response of
the epoxy materials used would be useful.
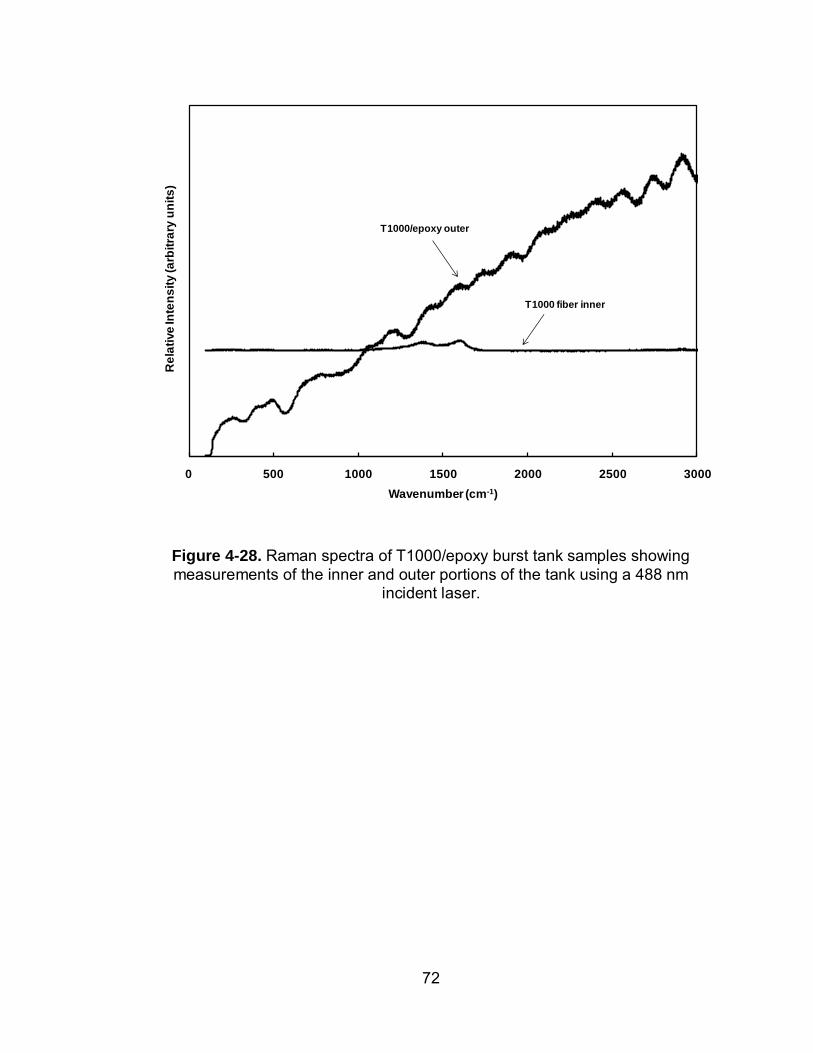
72
Figure 4-28. Raman spectra of T1000/epoxy burst tank samples showing measurements of the inner and outer portions of the tank using a 488 nm
incident laser.
0 500 1000 1500 2000 2500 3000
Re
lati
ve
Inte
ns
ity (a
rbit
rary
un
its
)
Wavenumber (cm-1)
T1000/epoxy outer
T1000 fiber inner
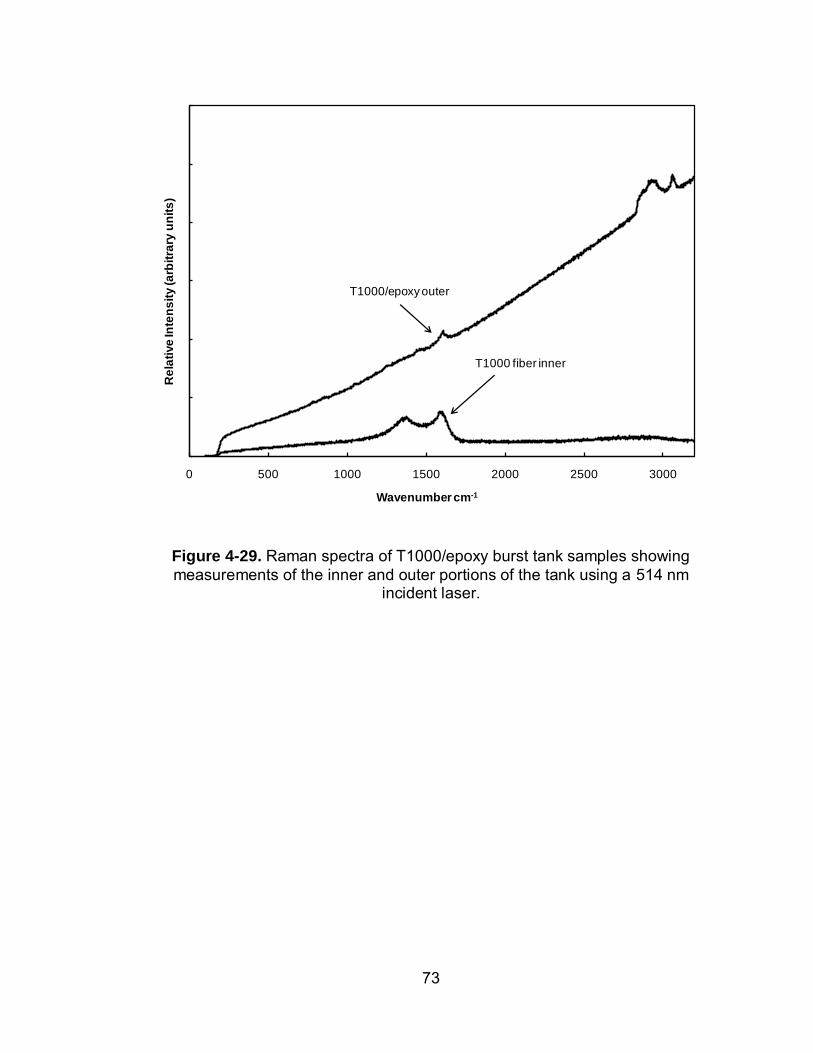
73
Figure 4-29. Raman spectra of T1000/epoxy burst tank samples showing measurements of the inner and outer portions of the tank using a 514 nm
incident laser.
0 500 1000 1500 2000 2500 3000
Re
lati
ve
Inte
ns
ity (a
rbit
rary
un
its
)
Wavenumber cm-1
T1000/epoxy outer
T1000 fiber inner
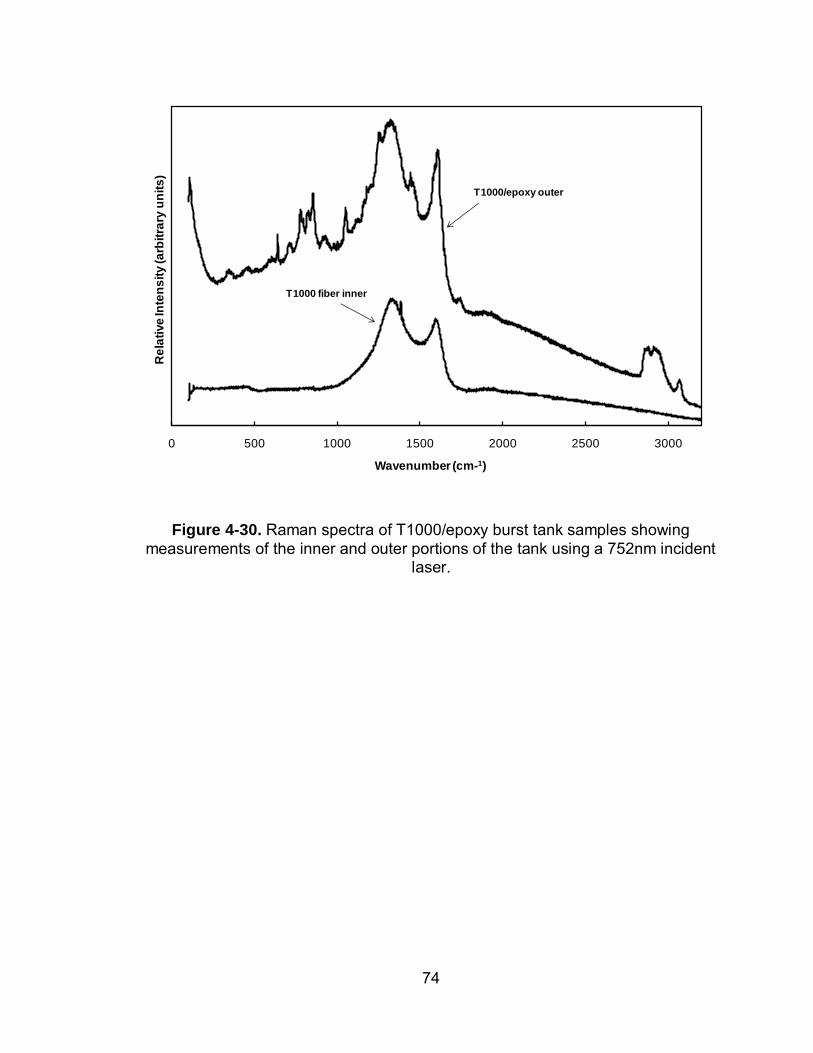
74
Figure 4-30. Raman spectra of T1000/epoxy burst tank samples showing measurements of the inner and outer portions of the tank using a 752nm incident
laser.
0 500 1000 1500 2000 2500 3000
Re
lati
ve
Inte
ns
ity (a
rbit
rary
un
its
)
Wavenumber (cm-1)
T1000/epoxy outer
T1000 fiber inner
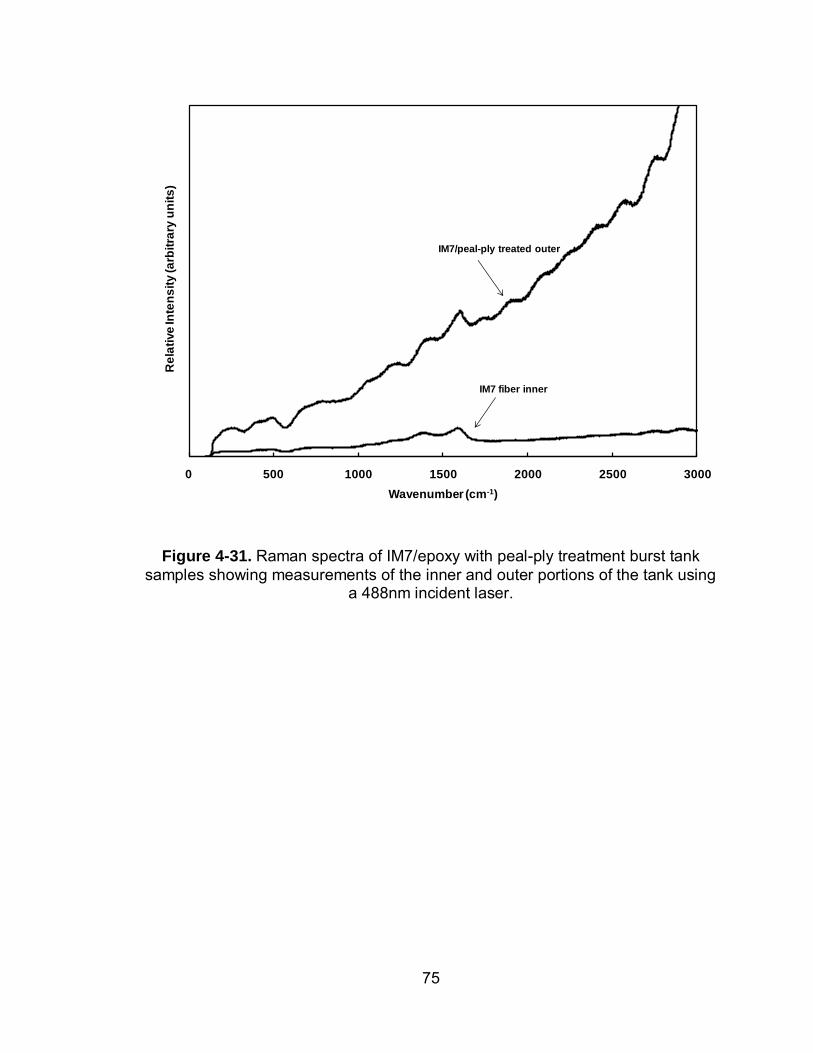
75
Figure 4-31. Raman spectra of IM7/epoxy with peal-ply treatment burst tank samples showing measurements of the inner and outer portions of the tank using
a 488nm incident laser.
0 500 1000 1500 2000 2500 3000
Re
lati
ve
Inte
ns
ity (a
rbit
rary
un
its
)
Wavenumber (cm-1)
IM7/peal-ply treated outer
IM7 fiber inner

76
Figure 4-32. Raman spectra of IM7/epoxy with peal-ply treatment burst tank samples showing measurements of the inner and outer portions of the tank using
a 514nm incident laser.
0 500 1000 1500 2000 2500 3000
Re
lati
ve
Inte
ns
ity (a
rbit
rary
un
its
)
Wavenumber cm-1
IM7 fiber inner
IM7 fiber/peal-ply treated outer
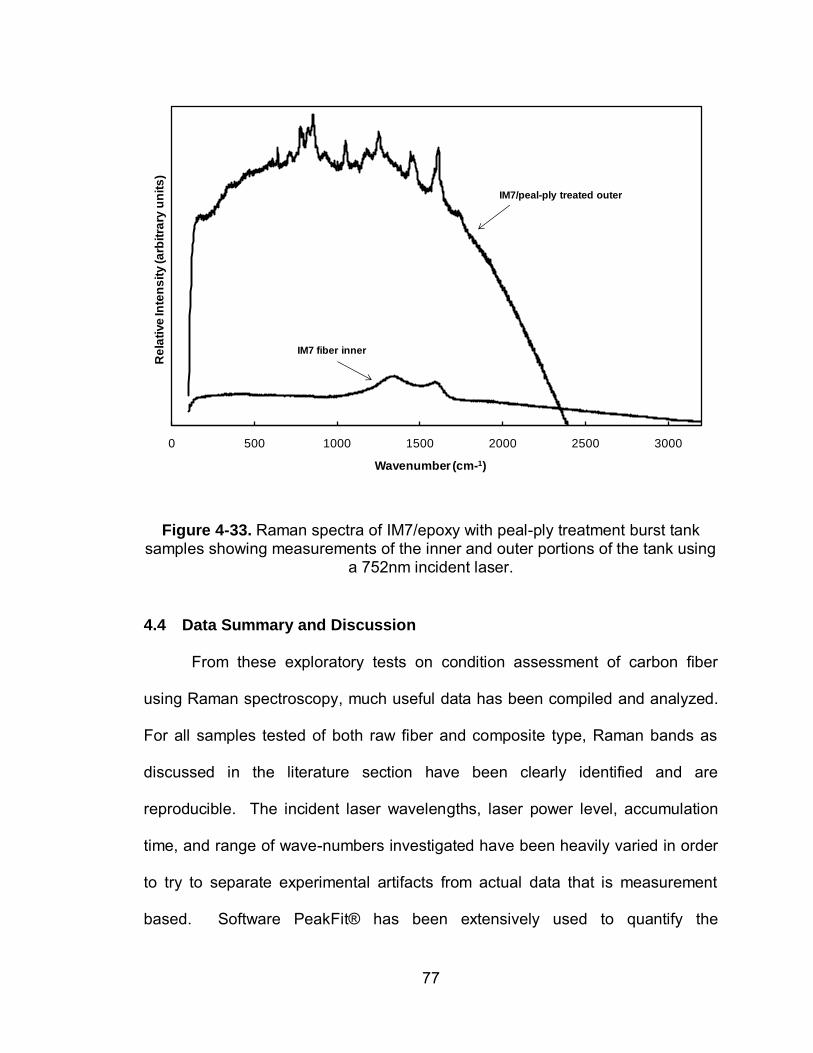
77
Figure 4-33. Raman spectra of IM7/epoxy with peal-ply treatment burst tank samples showing measurements of the inner and outer portions of the tank using
a 752nm incident laser.
4.4 Data Summary and Discussion
From these exploratory tests on condition assessment of carbon fiber
using Raman spectroscopy, much useful data has been compiled and analyzed.
For all samples tested of both raw fiber and composite type, Raman bands as
discussed in the literature section have been clearly identified and are
reproducible. The incident laser wavelengths, laser power level, accumulation
time, and range of wave-numbers investigated have been heavily varied in order
to try to separate experimental artifacts from actual data that is measurement
based. Software PeakFit® has been extensively used to quantify the
0 500 1000 1500 2000 2500 3000
Re
lati
ve
Inte
ns
ity (a
rbit
rary
un
its
)
Wavenumber (cm-1)
IM7/peal-ply treated outer
IM7 fiber inner
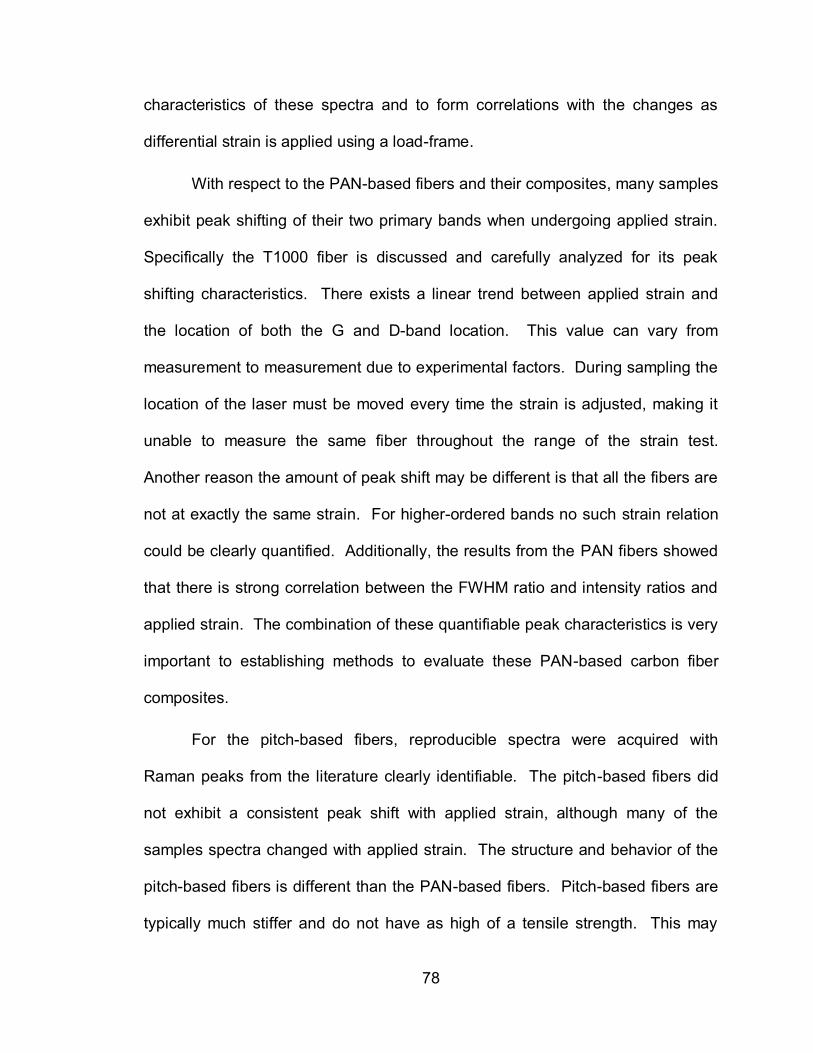
78
characteristics of these spectra and to form correlations with the changes as
differential strain is applied using a load-frame.
With respect to the PAN-based fibers and their composites, many samples
exhibit peak shifting of their two primary bands when undergoing applied strain.
Specifically the T1000 fiber is discussed and carefully analyzed for its peak
shifting characteristics. There exists a linear trend between applied strain and
the location of both the G and D-band location. This value can vary from
measurement to measurement due to experimental factors. During sampling the
location of the laser must be moved every time the strain is adjusted, making it
unable to measure the same fiber throughout the range of the strain test.
Another reason the amount of peak shift may be different is that all the fibers are
not at exactly the same strain. For higher-ordered bands no such strain relation
could be clearly quantified. Additionally, the results from the PAN fibers showed
that there is strong correlation between the FWHM ratio and intensity ratios and
applied strain. The combination of these quantifiable peak characteristics is very
important to establishing methods to evaluate these PAN-based carbon fiber
composites.
For the pitch-based fibers, reproducible spectra were acquired with
Raman peaks from the literature clearly identifiable. The pitch-based fibers did
not exhibit a consistent peak shift with applied strain, although many of the
samples spectra changed with applied strain. The structure and behavior of the
pitch-based fibers is different than the PAN-based fibers. Pitch-based fibers are
typically much stiffer and do not have as high of a tensile strength. This may
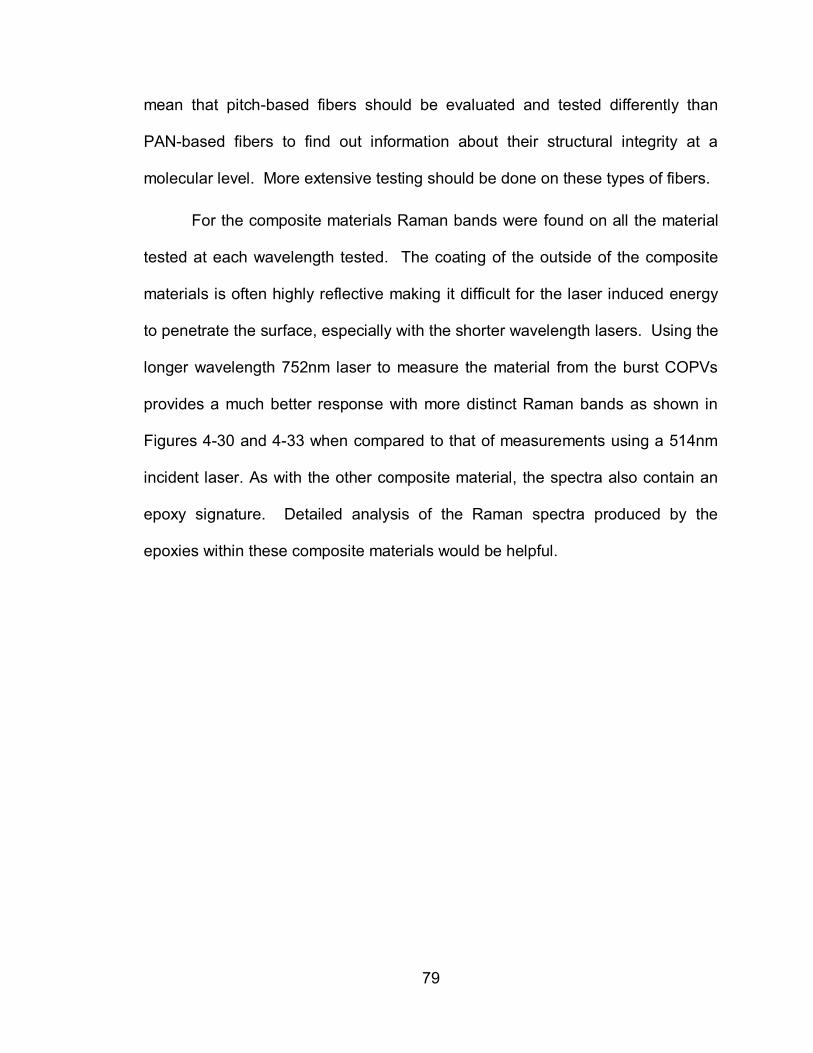
79
mean that pitch-based fibers should be evaluated and tested differently than
PAN-based fibers to find out information about their structural integrity at a
molecular level. More extensive testing should be done on these types of fibers.
For the composite materials Raman bands were found on all the material
tested at each wavelength tested. The coating of the outside of the composite
materials is often highly reflective making it difficult for the laser induced energy
to penetrate the surface, especially with the shorter wavelength lasers. Using the
longer wavelength 752nm laser to measure the material from the burst COPVs
provides a much better response with more distinct Raman bands as shown in
Figures 4-30 and 4-33 when compared to that of measurements using a 514nm
incident laser. As with the other composite material, the spectra also contain an
epoxy signature. Detailed analysis of the Raman spectra produced by the
epoxies within these composite materials would be helpful.
80
5 CONCLUSIONS
5.1 Conclusions
Carbon fibers of pitch and PAN-based origins have been measured using
a variety of incident lasers between 488 and 752 nm. For all materials tested,
the D and G Raman bands can clearly be identified with each laser, with other
fibers also having the D’, and G’ identified. Strain dependence of the D and G
bands is demonstrated for the PAN-based fibers. Both the D and G bands have
been found to decrease in resonance frequency as applied tensile strain
increases. This observation is also supported in the literature by previous
research in this field. From the initial results it appeared that the peak frequency
decreased approximately 10 wave-numbers / percent applied strain.
Additionally, from our results higher modulus and tensile strength PAN-based
fibers exhibit a higher peak shift with applied strain. In our case the T1000 fiber
typically had the highest peak shift. This is due to the higher degree of
graphitization as previously discussed. The fibers that exhibited a peak shift also
exhibited a decrease in FWHM and intensity ratio as strain level increases.
All the composite materials tested exhibited the D and G bands, as well as
distinct epoxy signatures. This is important because it confirms that a Raman
spectrometer with optimized system parameters has the ability to penetrate the
81
reflective coating on the outside of many composite materials. This is especially
true at higher incident wavelengths because the laser has a greater penetration
depth producing better results with more definite peaks. The future NDE
applications in this field will likely be in the area of in situ Raman testing of the
COPVs. This would be a practical and realistic approach for condition
assessment of these materials.
In summary this project has come to the following conclusions.
Raman spectroscopy has the ability to make measurements and
detect distinct Raman bands related to molecular structure of the
material on carbon fiber and carbon fiber composite materials.
For some fiber and composite materials tested it is found that there
is a peak shift with applied strain. Raman bands decrease in
wavenumber with an increase in strain. In addition to shifting of
Raman band location, relative FWHM and intensity ratios of fibers
appear to decrease with an increase in applied strain.
Raman spectroscopy can penetrate outer coatings of COPVs to
make measurements detecting active Raman bands of carbon fiber
and an epoxy matrix signature.
From this research and previous literature it is apparent that Raman
spectroscopy has the ability to make measurements on carbon fiber and carbon
fiber composites and could prove to be a valuable NDE tool for condition
assessment of these materials.
82
5.2 Future Work
This project has made exploratory non-destructive attempts at
characterizing and analyzing carbon fibers using Raman spectroscopy. The
scope of this project mainly investigated PAN-based fibers and their Raman band
location shifting with applied strain. Detailed strain testing should also be done
on pitch-based carbon fibers, a more difficult process due to the stiffer nature of
the material. The composites tested in this project all have an epoxy portion of
their spectra, and detailed analysis of the Raman response of these epoxies
would prove to be valuable for future advancements. The ability to quickly
differentiate the carbon fiber and epoxy components of a spectrum would be
beneficial for more analysis. Separating the carbon fiber portion of the spectrum
out to analyze its bands would be most critical for monitoring structural integrity
of composite materials.
83
REFERENCES
1. Chung, D., Carbon Fiber Composites. 1994, Newton, MA: Butterworh-Heinemann. 215.
2. Bacon, R., Growth, Structure, and Properties of Graphite Whiskers. Journal of Applied Physics, 1960. 31(2): p. 283-290.
3. Morgan, P., Carbon Fibers and their Composites. 1 ed. 2005, Boca Raton, FL: CRC Press.
4. Tse-Hao, K., Raman spectrum of modified PAN-based carbon fibers during graphitization. Journal of Applied Polymer Science, 1996. 59(4): p. 577-580.
5. Ferrar, J.R. and K. Nakamoto, Introductory Raman Spectroscopy. 1994, Boston: Academic Press, Inc. 370.
6. Weber, W.H. and R. Merlin, Raman Scattering in Materials Science. 1 ed. 2000, New York: Springer-Verlag. 492.
7. Brooks, T., Condition Assesment of Kevlar Composite Materials using Raman Spectroscopy, in Department of Civil and Environmental Engineering. 2007, University of Missouri: Columbia. p. 68.
8. Tuinstra, F., Raman Spectrum of Graphite. Journal of Chemical Physics, The, 1970. 53(3): p. 1126.
9. Melanitis, N., Characterization of PAN-based carbon fibres with laser Raman spectroscopy. Journal of Materials Science (full set), 1996. 31(4): p. 851.
10. Chaudhuri, S.N., et al., Raman spectroscopy for characterization of interfacial debonds between carbon fibers and polymer matrices. Composite Structures, 2006. 76(4): p. 375-387.
11. Galiotis, C., Strain dependences of the first-and second-order Raman spectra of carbon fibres. Journal of Materials Science Letters, 1988. 7(5): p. 545.
12. Wang, Y., D.C. Alsmeyer, and R.L. McCreery, Raman spectroscopy of carbon materials: structural basis of observed spectra. Chem. Mater., 1990. 2(5): p. 557-563.
13. Washer, G. and F. Blum, Raman Spectroscopy for the Nondestructive Testing of Carbon Fiber. Research Letters in Materials Science, 2008.
84
14. Robinson, I.M., Strain dependence of the Raman frequencies for different types of carbon fibres. Journal of Materials Science Letters, 1987. 6(10): p. 1212.
15. Sakata, H., Effect of uniaxial stress on the Raman spectra of graphite fibers. Journal of Applied Physics, 1988. 63(8): p. 2769.
16. Amer, M.S., Stress concentration phenomenon in graphite/epoxy composites: Tension/compression effects. Composites Science and Technology, 1997. 57(8): p. 1129.
17. Mitra, V.K., William M. Risen, Jr., and H.B. Ray, A laser Raman study of the stress dependence of vibrational frequencies of a monocrystalline polydiacetylene. The Journal of Chemical Physics, 1977. 66(6): p. 2731-2736.
18. Wagner, H.D., Residual Compression Stress Profile in High-Modulus Carbon Fiber Embedded in Isotactic Polypropylene by Micro-Raman Spectroscopy. Applied Composite Materials, 2000. 7(4): p. 209.