Louisiana coastal master plan
45
Imagine the result High Performance Computing for the 2017 Louisiana Coastal Master Plan Z. Cobell
-
Upload
inside-bigdatacom -
Category
Technology
-
view
411 -
download
0
Transcript of Louisiana coastal master plan

Imagine the result
High Performance Computing for the 2017 Louisiana Coastal Master Plan
Z. Cobell
9 September 20152
Acknowledgements
*This project was funded by The Water Institute of the Gulf under project award number
CPRA-2012-TO3-EM. The views expressed in this publication are those of the author
and do not necessarily represent the views of The Water Institute of the Gulf
9 September 20153
Acknowledgements
9 September 20154
Motivation • Coastal Louisiana is in a land loss crisis.
• 4800 sq km lost since 1930*
• 4500 sq km potential loss by 2060*
• More loss, more damage
• $23 billion additional damage from storm surge due to
loss by 2060*
*Peyronnin et al, 2013, Louisiana’s 2012 Coastal Master Plan: Overview of a Science-
Based and Publicly Informed Decision-Making Process

9 September 20155
Agenda • Numerical Models Employed
• 2007 LACPR
• 2012 Master Plan
• 2017 Master Plan
• Conclusions

6 9 September 2015
Numerical Models

9 September 20157
Numerical Models
• ADCIRC
• Circulation model
• Solves shallow water equations
• Unstructured finite element mesh
• Serial or MPI
• SWAN
• Spectral wave model
• Solves action density equation for non-stationary waves
• Unstructured, curvilinear, or structured mesh
• Serial, OpenMP, or MPI

9 September 20158
METIS Decomposition

9 September 20159
Model Communication

9 September 201510
Coupled Simulation Schematic
Fx Fyζ u v
wx wy
ADCIRC
UnSWAN
0 600 1200
TIME
Note: This is a single model run
9 September 201511
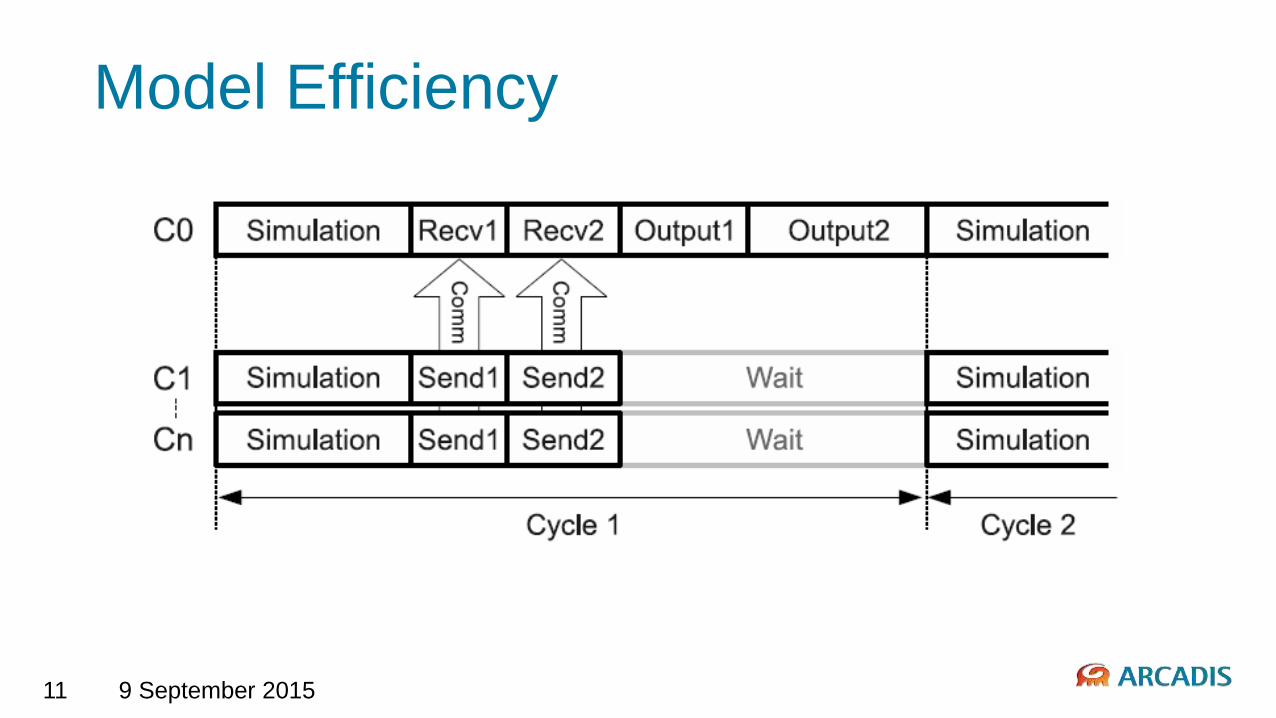
Model Efficiency

9 September 201512
Model Efficiency

9 September 201513
Model Efficiency

9 September 201514
Model Efficiency

9 September 201515
Model Domain

9 September 201516
Model Domain
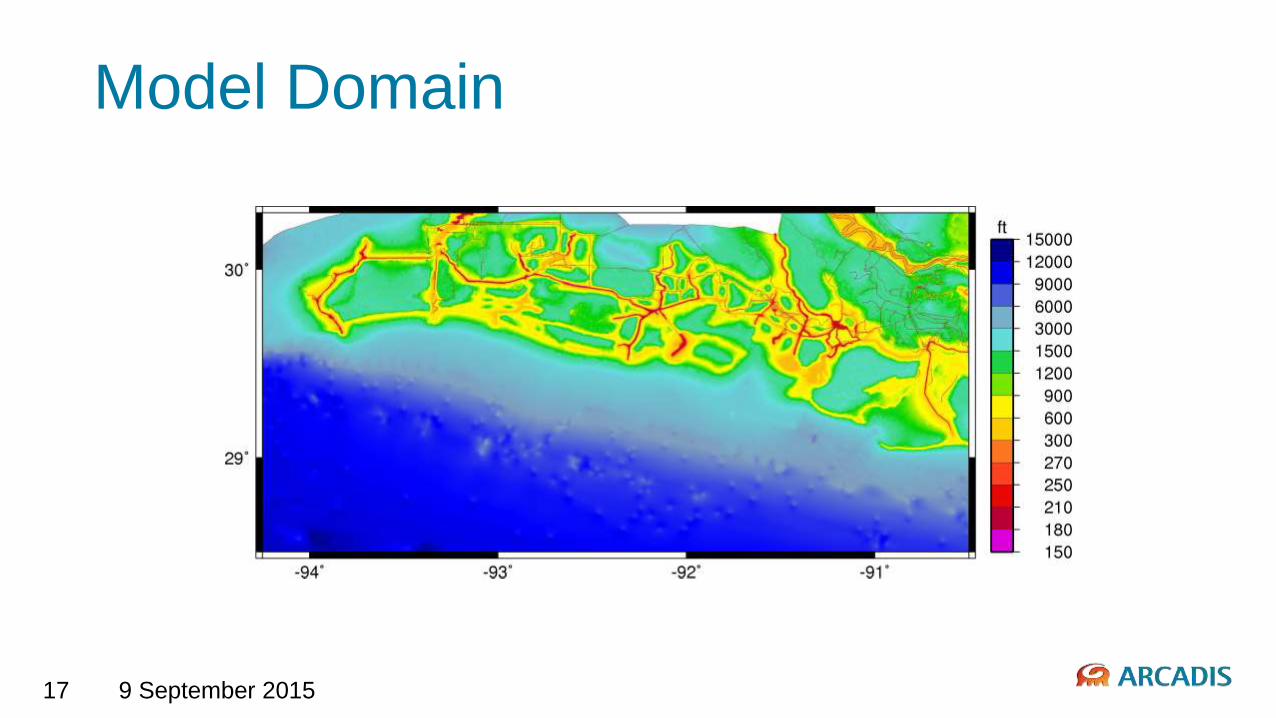
9 September 201517
Model Domain

9 September 201518
Model Validation

9 September 201519
Model Validation

20 9 September 2015
LACPR 2007
9 September 201521
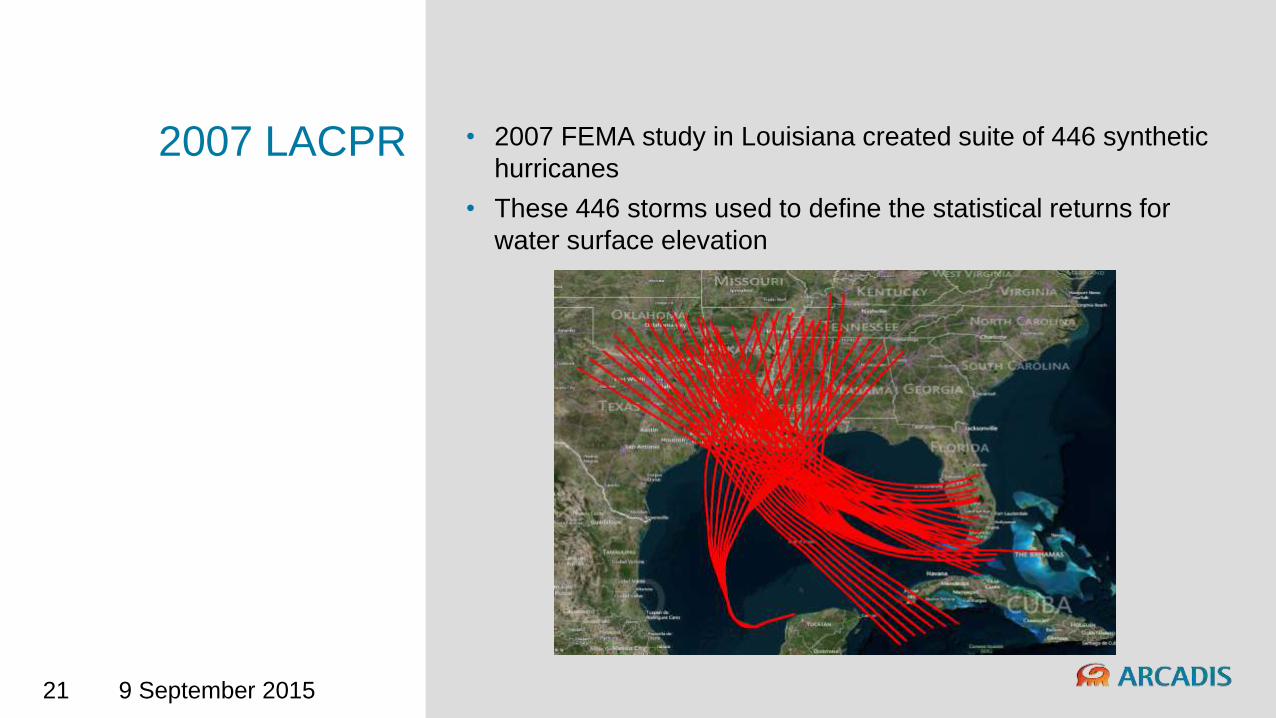
2007 LACPR • 2007 FEMA study in Louisiana created suite of 446 synthetic
hurricanes
• These 446 storms used to define the statistical returns for
water surface elevation

9 September 201522
2007 LACPR • One of the first studies of its kind
• Developed methods still used today
• Computers simply unable to analyze large numbers of
projects
• Large storm set
• Computational time required per simulation
• Conducted at USACE supercomputing facilities

23 9 September 2015
2012 Master Plan Framework

9 September 201524
2012 Master Plan Framework
• Framework to analyze proposed restoration projects
• How do these projects effect the landscape?
• How do these projects effect each other?
• How do these projects reduce damage during storms?

9 September 201525
2012 Master Plan Framework
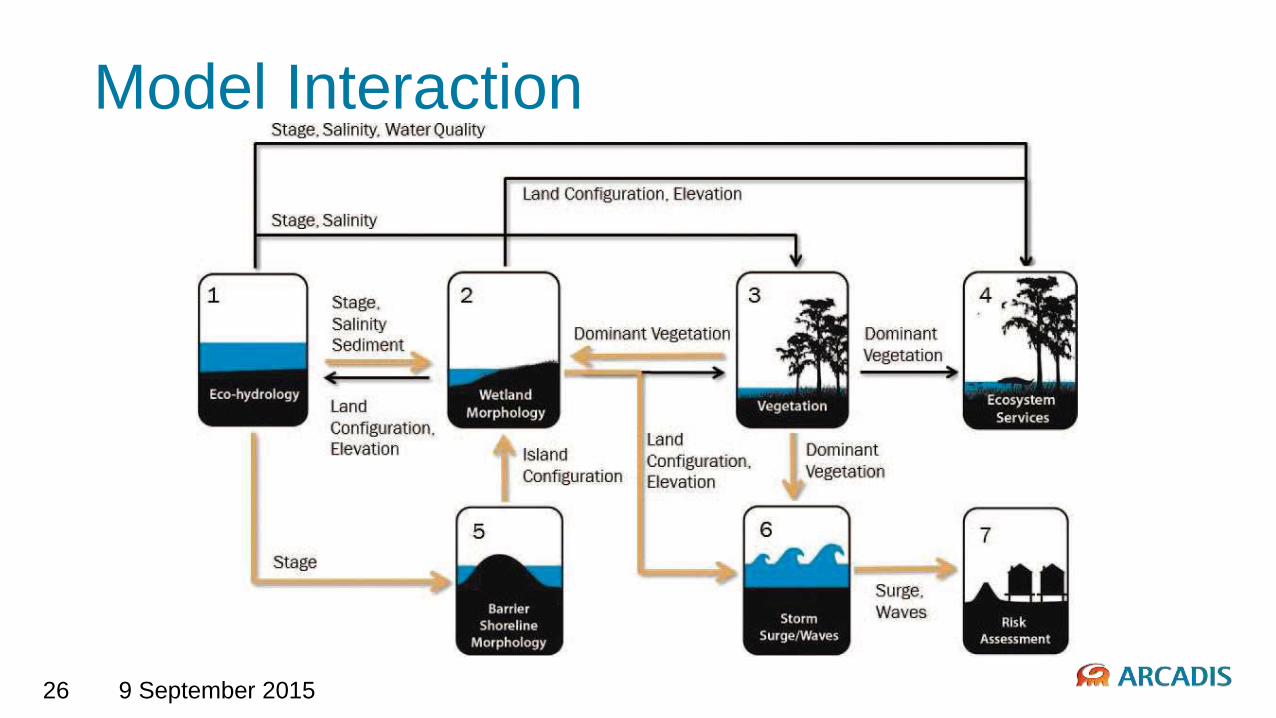
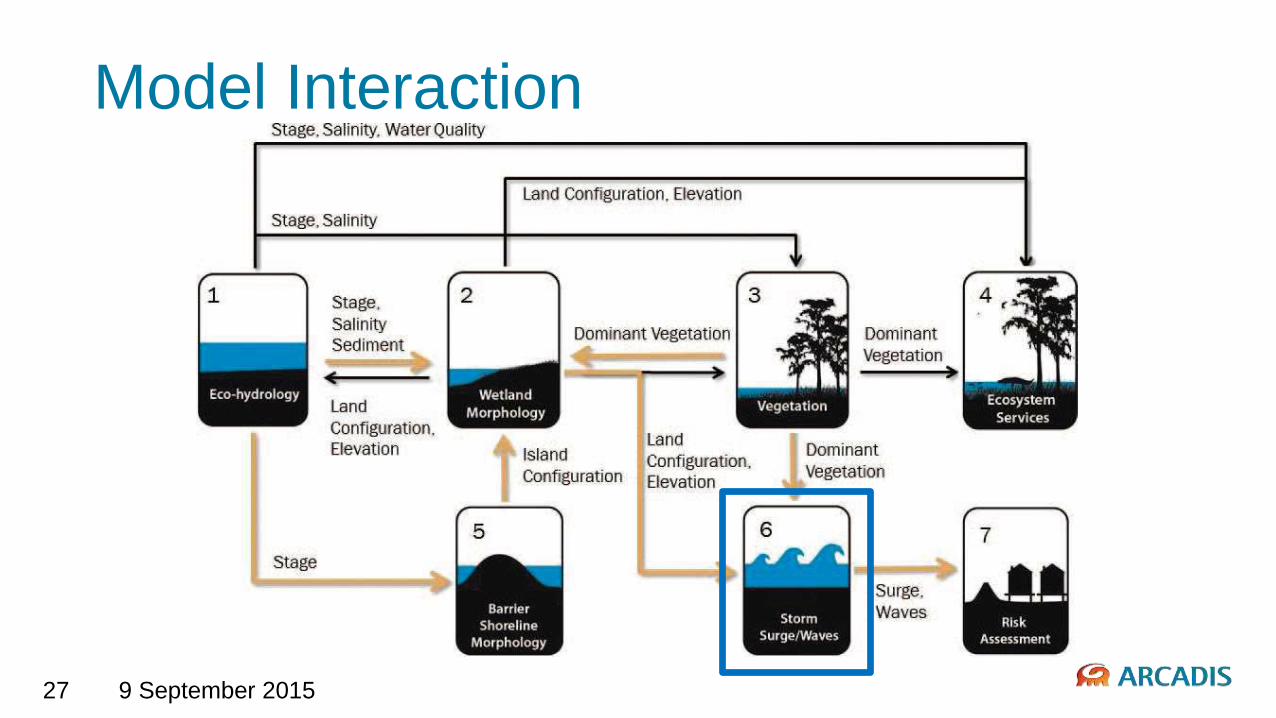
• Modeling system developed to aid in project selection
process
• Includes models for:
• Vegetation
• Water Quality
• Ecology/Hydrology
• Wetland Morphology
• Barrier Island Morphology
• Fish/Wildlife
• Storm Surge/Waves
• Damage/Risk Analysis
9 September 201526
Model Interaction
9 September 201527
Model Interaction

9 September 201528
2012 Master Plan
• Premise of analyzing large number of projects and large
number of environmental scenarios
• Storm suite reduced while maintaining acceptable levels of
accuracy

9 September 201529
2012 Master Plan
• 2012
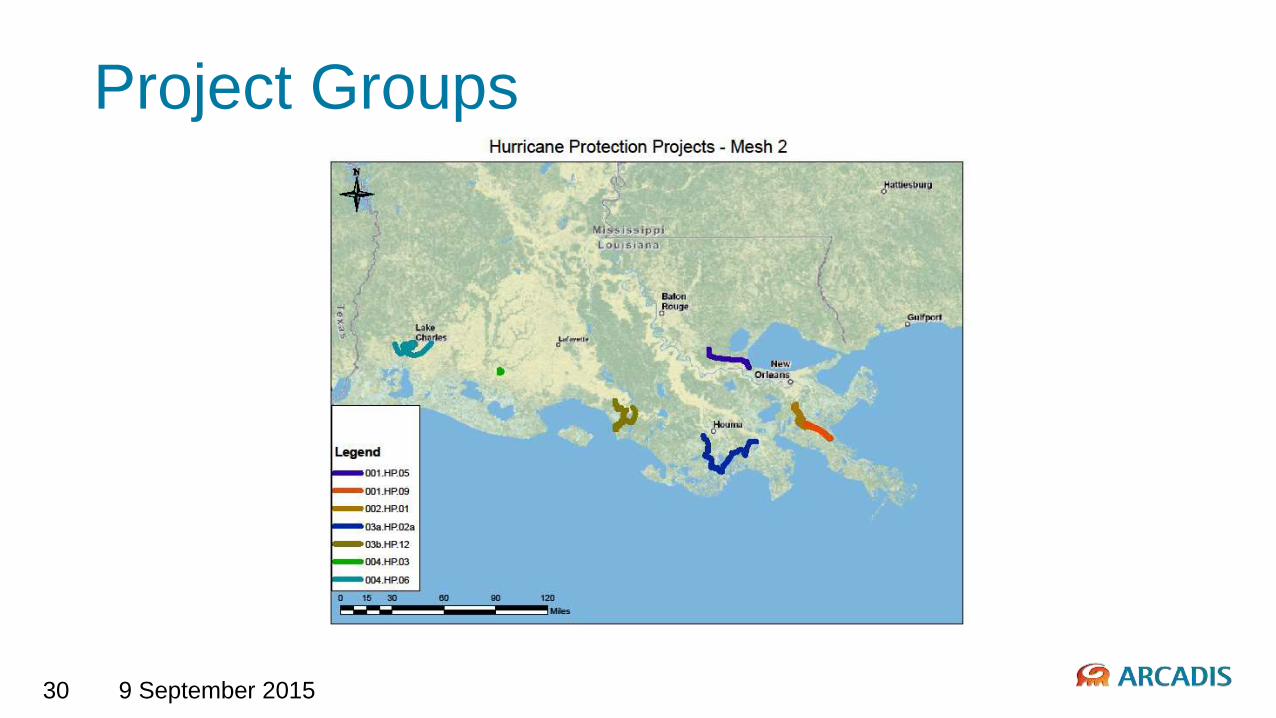
• Project level screening analysis – 40 storm suite
• 34 hurricane protection projects analyzed
• Projects grouped into 7 non-interacting groups to
isolate impacts
9 September 201530
Project Groups
9 September 201531
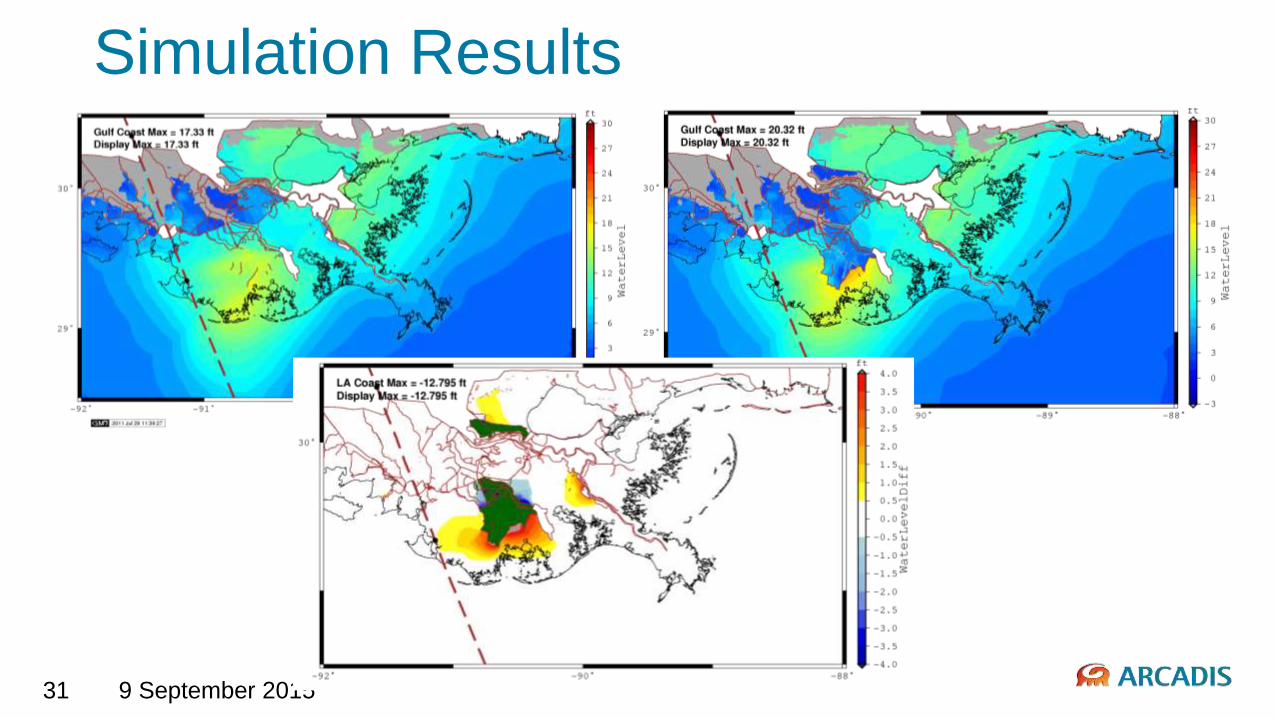
Simulation Results

9 September 201532
2012 Master Plan
• 2012
• Project level screening analysis – 40 storm suite
• 34 hurricane protection projects analyzed
• Projects grouped into non-interacting groups to isolate
impacts
• 7 groupings and base condition
• Portfolio analysis – 40 storm suite
• Future conditions with different suites of projects
implemented

9 September 201533
Model Interaction

9 September 201534
2012 Master Plan
• 2012
• Project level screening analysis – 40 storm suite
• 34 hurricane protection projects analyzed
• Projects grouped into non-interacting groups to isolate
impacts
• 7 groupings and base condition
• Portfolio analysis – 40 storm suite
• Future conditions with different suites of projects
implemented

9 September 201535
Simulation Results

9 September 201536
2012 Master Plan
• 2012
• Total simulations conducted:
• Project Level
40 storms
8 groupings (7+1 base condition)
3 scenarios
840 simulations
• Alternative Level
40 storms
3 groupings
3 scenarios
2* time levels (0*, 25, 50 years)
800 simulations
1640 simulations
~6MM CPU Hours

37 9 September 2015
2017 Master Plan

9 September 201538
2017 Simulation Suite
• 2017 – In progress
• Number of storms increased
• 60 storm project screening level suite
– 3 time levels
– 3 scenarios
• 154 storm alternatives analysis suite
– 3 time levels
– 3 scenarios
• Total planned simulations: 7712
• Total planned CPU hours: ~10MM

39 9 September 2015
Computational Resources

9 September 201540
Computational Resources
• 2007 LACPR Resource – USACE “Sapphire”
• Cray XT3
• Dual AMD Opteron Processors @ 2.6GHz
• 8192 total cores
• Shared government resource
• 2012 Master Plan Resource – “Athos”
• Online 2010
• Dual 6 core Nehalem Processors @ 2.67GHz
• Qlogic QDR Infiniband, 2:1 Oversubscription
• 996 total cores
• Dedicated resource
• 2017 Master Plan Resource – “Aegaeon”
• Online 2015
• Dual 12 core Sandy Bridge Processors @ 2.5GHz
• Mellanox FDR Infiniband, 2:1 Oversubscription
• 1488 total cores
• Dedicated resource
9 September 201541
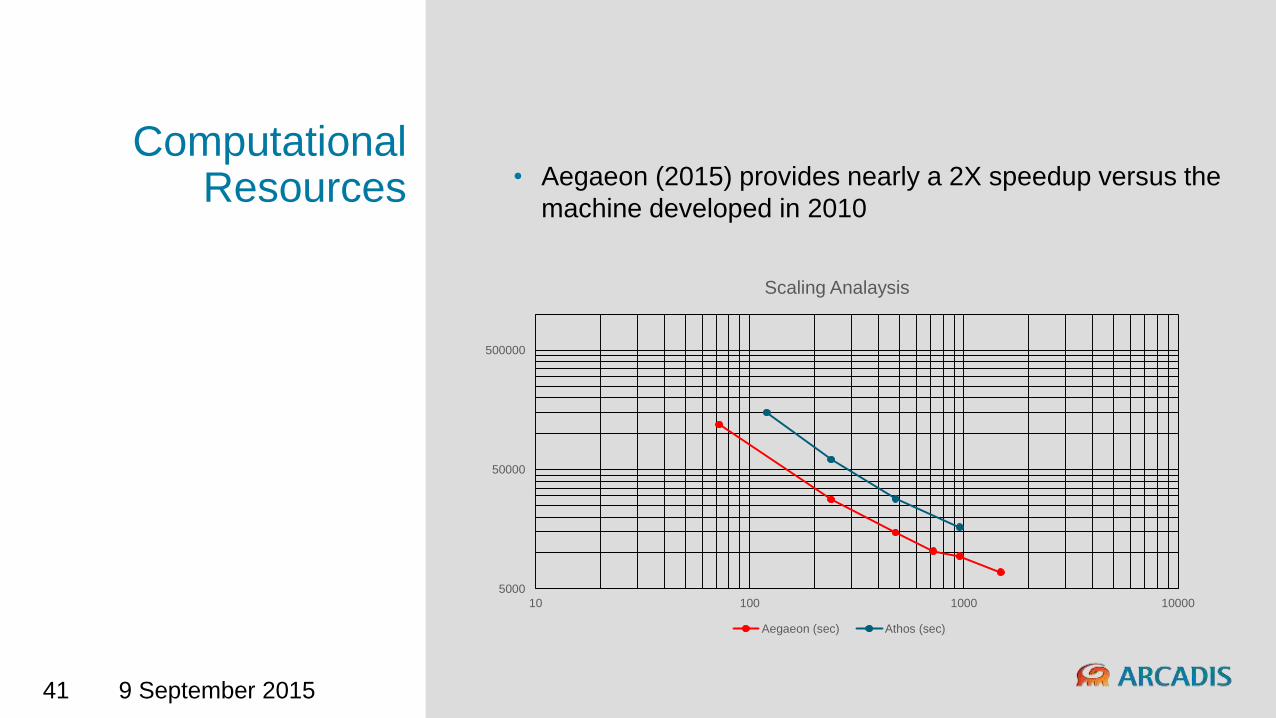
Computational Resources • Aegaeon (2015) provides nearly a 2X speedup versus the
machine developed in 2010
5000
50000
500000
10 100 1000 10000
Scaling Analaysis
Aegaeon (sec) Athos (sec)

9 September 201542
Conclusions
9 September 201543
Conclusions • 2007 – 446 simulations
• 2012 – 1640 simulations (x3.6) – 4MM CPU
• 2017 – 7712 simulations (x4.7) – 8MM CPU
• The number of simulations that can be reasonably completed
has grown drastically
• CPUs, Interconnects, Storage, Availability
• The “value” of a CPU hour has increased
• These simulations heavily influence policy decisions
• The computational power we can harness, the more detail we
can provide to policy makers

9 September 201544
Conclusions • Computer speed has increased to allow high performance
models to derive forecasts

Imagine the result