Land Area Changes in Coastal Louisiana After … Area Changes in Coastal Louisiana After Hurricanes...
16
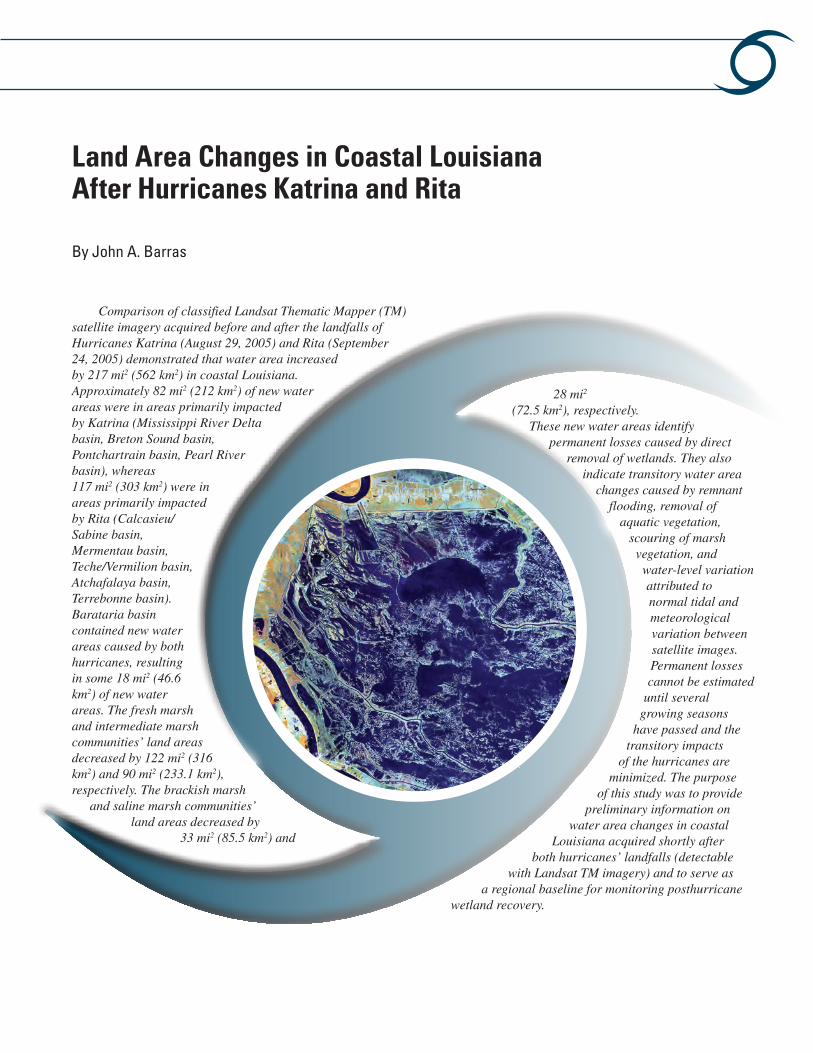
Land Area Changes in Coastal Louisiana After Hurricanes Katrina and Rita By John A. Barras Comparison of classified Landsat Thematic Mapper (TM) satellite imagery acquired before and after the landfalls of Hurricanes Katrina (August 29, 2005) and Rita (September 24, 2005) demonstrated that water area increased by 217 mi 2 (562 km 2 ) in coastal Louisiana. Approximately 82 mi 2 (212 km 2 ) of new water areas were in areas primarily impacted by Katrina (Mississippi River Delta basin, Breton Sound basin, Pontchartrain basin, Pearl River basin), whereas 117 mi 2 (303 km 2 ) were in areas primarily impacted by Rita (Calcasieu/ Sabine basin, Mermentau basin, Teche/Vermilion basin, Atchafalaya basin, Terrebonne basin). Barataria basin contained new water areas caused by both hurricanes, resulting in some 18 mi 2 (46.6 km 2 ) of new water areas. The fresh marsh and intermediate marsh communities’ land areas decreased by 122 mi 2 (316 km 2 ) and 90 mi 2 (233.1 km 2 ), respectively. The brackish marsh and saline marsh communities’ land areas decreased by 33 mi 2 (85.5 km 2 ) and 28 mi 2 (72.5 km 2 ), respectively. These new water areas identify permanent losses caused by direct removal of wetlands. They also indicate transitory water area changes caused by remnant flooding, removal of aquatic vegetation, scouring of marsh vegetation, and water-level variation attributed to normal tidal and meteorological variation between satellite images. Permanent losses cannot be estimated until several growing seasons have passed and the transitory impacts of the hurricanes are minimized. The purpose of this study was to provide preliminary information on water area changes in coastal Louisiana acquired shortly after both hurricanes’ landfalls (detectable with Landsat TM imagery) and to serve as a regional baseline for monitoring posthurricane wetland recovery.
Transcript of Land Area Changes in Coastal Louisiana After … Area Changes in Coastal Louisiana After Hurricanes...
Land Area Changes in Coastal Louisiana After Hurricanes Katrina and Rita
By John A. Barras
Comparison of classified Landsat Thematic Mapper (TM) satellite imagery acquired before and after the landfalls of Hurricanes Katrina (August 29, 2005) and Rita (September 24, 2005) demonstrated that water area increased by 217 mi2 (562 km2) in coastal Louisiana. Approximately 82 mi2 (212 km2) of new water areas were in areas primarily impacted by Katrina (Mississippi River Delta basin, Breton Sound basin, Pontchartrain basin, Pearl River basin), whereas 117 mi2 (303 km2) were in areas primarily impacted by Rita (Calcasieu/Sabine basin, Mermentau basin, Teche/Vermilion basin, Atchafalaya basin, Terrebonne basin). Barataria basin contained new water areas caused by both hurricanes, resulting in some 18 mi2 (46.6 km2) of new water areas. The fresh marsh and intermediate marsh communities’ land areas decreased by 122 mi2 (316 km2) and 90 mi2 (233.1 km2), respectively. The brackish marsh
and saline marsh communities’ land areas decreased by
33 mi2 (85.5 km2) and
28 mi2 (72.5 km2), respectively.
These new water areas identify permanent losses caused by direct
removal of wetlands. They also indicate transitory water area
changes caused by remnant flooding, removal of
aquatic vegetation, scouring of marsh vegetation, and water-level variation attributed to normal tidal and meteorological variation between satellite images. Permanent losses cannot be estimated
until several growing seasons
have passed and the transitory impacts
of the hurricanes are minimized. The purpose
of this study was to provide preliminary information on
water area changes in coastal Louisiana acquired shortly after
both hurricanes’ landfalls (detectable with Landsat TM imagery) and to serve as
a regional baseline for monitoring posthurricane wetland recovery.

98 Science and the Storms: the USGS Response to the Hurricanes of 2005
IntroductionThe U.S. Geological Survey’s (USGS) National Wetlands
Research Center analyzed land loss or change to water immediately after Hurricanes Katrina and Rita. Analysis was based on USGS Earth Resources Observation and Science (EROS) Data Center’s multiple Landsat TM satellite images of coastal Louisiana acquired immediately before and after the landfalls of Katrina and Rita. A series of seven Landsat TM scenes acquired between October 16 and October 25, 2005, provided a snapshot of land-water area changes after the storms. Total water area increased by 217 mi2 (562 km2) after the hurricanes according to a comparison of the 2004 and 2005 classified imagery.
The 217 mi2 (562 km2) of new water area occurring after the hurricanes contains losses caused by direct removal of wetlands as well as transitory water area changes caused by remnant flooding, removal of aquatic vegetation, scouring of marsh vegetation, and water-level variation caused by normal tidal and meteorological variation between images.
Estimation of permanent losses cannot be made until several growing seasons have passed and the transitory impacts of the hurricanes are minimized.
MethodsLandsat TM imagery is used for Earth-imaging
applications. The satellite acquires a 115 mi (185 km) by 106 mi (170 km) scene of coastal Louisiana every 16 days at approximately 9:30 a.m. Central Standard Time in the visible, near-infrared, and mid-infrared spectral wavelengths. The satellite’s spatial resolution of 98 ft (30 m) is sufficient to reliably identify features several acres (hectares) in size, and the mid-infrared band is particularly useful for identifying land and water changes occurring in wetlands (Braud and Feng, 1998). Recent identification of new water areas relies on visual assessments of imagery, image classification to determine land-water areas by date, and spatial-temporal comparison of the resultant classified land-water data sets to identify changes in water area after the hurricanes. The persistent appearance of new water bodies on multiple poststorm images under varying water-level conditions indicates that the marsh was probably removed by the storm surge or wind-induced wave erosion, and it is less likely that the images represent flooded land.
Complete coverage of coastal Louisiana was obtained by acquiring four adjacent, north-south image paths, each covering one-quarter of coastal Louisiana. Between-path images are acquired within 1 week, with a side-lap of approximately 22 percent. Ten days are required to obtain complete coverage of coastal Louisiana, given optimal, cloud-free weather conditions. Each path contained two images acquired contemporaneously except for the westernmost image. Twenty-one scenes were acquired, classified, and
then mosaicked together by year to represent fall 2001, fall 2004, and fall 2005 land-water conditions by using a standard land-water classification methodology developed for prior land-water assessments in coastal Louisiana (Barras and others, 2003; Morton and others, 2005; Barras, 2006). Classified scene mosaicking for each time period was ordered from east to west, based on visual assessment of scene water-level conditions, assessment of water-level gage readings (when available), and the ability to discern aquatic vegetation over the scene. Classified land-water data based on scenes acquired under moderate water-level conditions and with easily identifiable aquatic vegetation were allowed to overlay adjacent scenes during the mosaicking process. Scene mosaicking order from October 16 to October 25, 2005, was based on scenes possessing greater posthurricane landfall acquisition periods overlaying scenes with lesser posthurricane acquisition periods.
Using fall data for land-water classification and comparison minimized marsh seasonal variation. The land-water mosaics were masked to match the Louisiana Coastal Area (LCA) boundary to provide spatial consistency with prior land-water change assessments (Barras and others, 2003). The masked coastal land-water data sets were then combined with the 2001 marsh community types data set for identifying new water area changes by marsh communities (Chabreck and others, unpub. data, 2001) following a similar methodology used to integrate marsh type information with classified land-water data for the LCA effort (Twilley and Barras, 2003).
The southeastern Louisiana images were acquired 8 weeks after Katrina’s landfall and 4 weeks after Rita’s landfall, providing adequate time for most storm-surge-flooded areas to drain. Water levels within the comparison were considered normal in southeastern Louisiana, although some remnant flooding remained in a few leveed areas outside of the comparison area.
The southwestern Louisiana images were acquired 3 and 4 weeks after Rita’s landfall, when portions of southwestern Louisiana were still partially flooded from storm surge. The 2001 marsh community types, “other” class, and multiple Landsat scenes were used to identify flooded agricultural/pasture land as well as flooded developed areas occurring within the southwest portion of the study area. An additional 16 mi2 (41 km2) of flooded agricultural area occurring within the LCA trend area was identified by using TM imagery bracketing Rita’s landfall and was added to the flooded land class.
Marsh burning through either natural or human-induced means is quite common throughout coastal Louisiana and is readily apparent on TM imagery. The burns often reduce vegetation to stubble. Slight increases in water levels will inundate the stubble, causing the burned marsh to appear as a pond or lake, confounding land-water interpretation and classification. A flooded burned marsh class was created to minimize confusion of flooded burned marsh with storm-removed and flooded marsh. Two Landsat scenes acquired on
Land Area Changes in Coastal Louisiana After Hurricanes Katrina and Rita 99
September 9 and September 21, 2005, were used to identify fresh marsh burns that were later flooded by Rita’s surge, which separated known temporarily flooded areas from existing water, direct storm impacts, and flooded marsh. Some areas of persistent flooding in southwest Louisiana were identified as new water areas even after flooded lands and burned marsh were identified. The ability to identify removed marsh versus flooded marsh is limited in these areas until subsequent imagery is obtained under lower water- level conditions.
Posthurricane imagery was used to visually assess land-water variation caused by remnant flooding from the hurricanes, normal tidal and meteorological variation between images, and aquatic vegetation fluctuations. Water level conditions for southeastern Louisiana were also compared against daily and 7-day water-level averages obtained from the National Oceanic and Atmospheric Administration’s (NOAA) National Ocean Service’s (NOS) Grand Isle, La., tide gage (NOS no. 8761724) readings as applied by Bernier and others (2006), Morton and others (2005) and from review of USGS Louisiana Hydrowatch water elevation data (Louisiana District Webmaster, 2004). Interpretation of water-level conditions was based on prior TM land-water classifications (Morton and others, 2005; Bernier and others 2006). The latest available October 2005 images for southwestern Louisiana were used to minimize post-Rita marsh flooding, to reduce misclassification of flooded marsh with classified water, and to provide contemporaneous imagery with southeastern Louisiana.
Land-water Change QuantificationQuantification of land-water changes was based on
comparison of the fall 2004 land-water mosaic with the fall 2005 mosaic. “Fastlands” are developed and agricultural areas surrounded by levees that are generally considered nonwetlands in Louisiana (Louisiana Office of the State Registrar, 2002). All LCA-designated fastland areas, including flooded fastland areas, were excluded from the land-water area comparison. The land-water classifications from fall 2001 and fall 2004 were used to provide prehurricane land-water area variability estimates. Data areas were summarized by major hydrologic basin as defined by the Coastal Wetlands Planning, Protection and Restoration Act (CWPPRA) (1993) and then by physiographic provinces for presentation. These provinces subdivide coastal Louisiana into the Deltaic Plain on the east, the Marginal Deltaic Plain between the Atchafalaya River and Freshwater Bayou, and the Chenier Plain to the west of Freshwater Bayou (fig. 1).
Total water area increased by 217 mi2 (562 km2) between fall 2004 and mid-October 2005 within the 12,918 mi2 (33,458 km2) LCA trend area, excluding flooded lands in southwestern Louisiana (table 1). Total unadjusted water area change after the hurricanes was 300 mi2 (777 km2). After adjusting for
flooded lands in south-central and southwest Louisiana, the changes were 119 mi2 (218 km2) in southeastern Louisiana followed by 85 mi2 (308 km2) in southwestern Louisiana. The unadjusted water area for southwestern Louisiana was 181 mi2
(469 km2), however, indicating the extent of surge-induced flooding within the LCA trend area.
The 16 mi2 (41 km2) increase in water area between 2001 and 2004 should not be interpreted as an indicator of the accuracy of the 2001 and 2004 land-water data sets but rather as an indicator of the variability in land-water classification between typical fall coastal Louisiana Landsat TM data sets. The minimal total water area increase between the two dates is atypical for an area as large as coastal Louisiana. Examination of the 2001 and 2004 land-water data sets show some distinct differences in water area spatial distribution, although the numerical comparison reflects a slight total area difference. Similarly, the 0 mi2 (0 km2) land-water change in the Marginal Deltaic Plain between 2001 and 2004 is a summary artifact of combining land-water changes in the Atchafalaya and Teche-Vermilion basins.
Morton and others (2005) examined 23 classified Landsat TM land-water data points obtained between 1983 and 2004 for a 259 mi2 (671 km2) study area in the Deltaic Plain and found that land-water classification varied by 5 percent over periods of a few years, with some differences as high as 10 percent between extreme high and low water events.
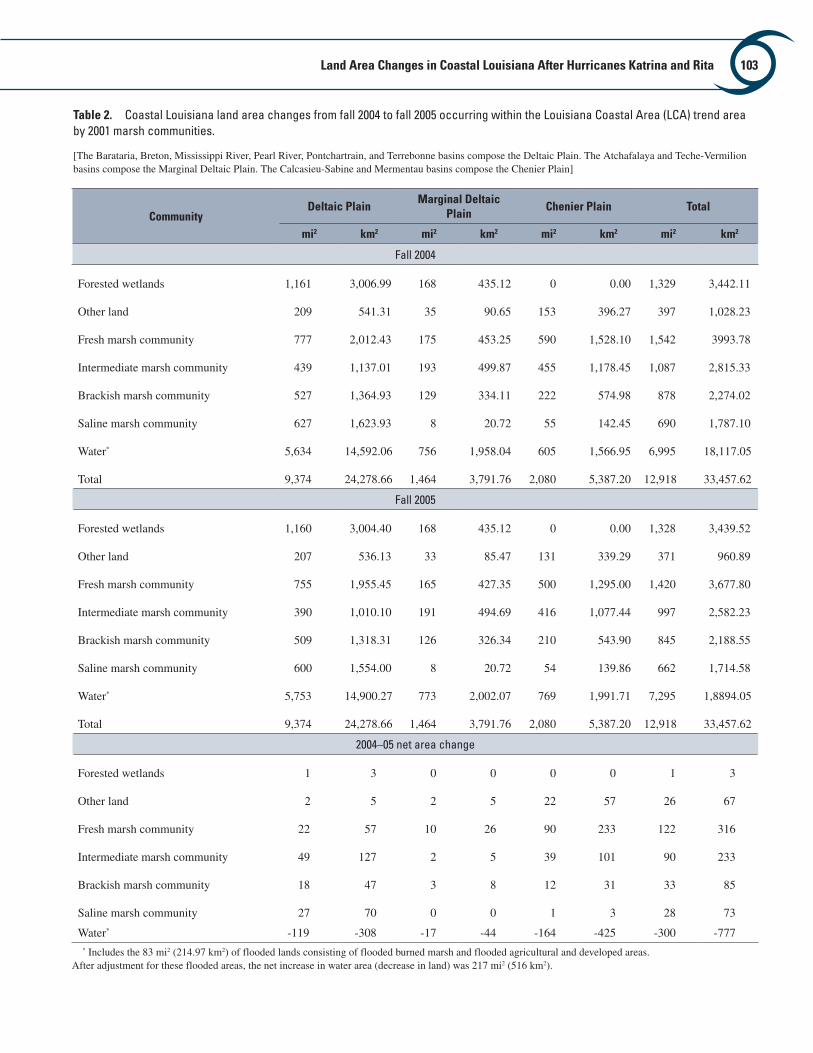
Review of the 2001 marsh communities’ changes by physiographic province show that 71 percent of the coastwide water area increase occurred within the fresh and intermediate marsh communities, whereas 20 percent occurred within the brackish and saline zones (fig. 2; table 2). Over 72 percent of the water area increase within the fresh marsh community occurred in the Chenier Plain and is primarily indicative of remnant flooding in the interior fresh marshes located between Freshwater Bayou and Calcasieu Lake. The water area increase in the intermediate marsh community was greater in the Deltaic Plain; primarily because of the large-scale marsh shearing and scouring that occurred in upper Breton Sound basin from Katrina’s surge. The Chenier Plain contained shearing as well as remnant flooding within the intermediate marsh community. The brackish and saline marsh communities accounted for 11 percent and 10 percent of the new water area increase coastwide. Saline marsh community water area increases were greater on the Deltaic Plain than were those on the Chenier Plain, possibly because of the limited extent of saline marshes on the Chenier Plain and normal tidal water level fluctuations partially covering low elevation saline marshes in the Deltaic Plain. Total water area increase in the Marginal Deltaic Plain was small compared to that of either the Deltaic Plain or the Chenier Plain. The relatively large increase of 11 mi2 (28 km2) in the fresh marsh community was caused primarily by the removal of aquatic vegetation in the fresh marsh zone located between the Atchafalaya River Delta and East Cote Blanche Bay by Rita’s surge.

100 Science and the Storms: the USGS Response to the Hurricanes of 2005
Figu
re 1
. L
and
Are
a C
hang
e in
Coa
stal
Lou
isia
na A
fter
the
2005
Hur
rica
nes:
Ove
rvie
w
100
1020
3040
Mile
s
Scal
e 1:
1,90
0,00
0
200
2040
6080
Kilo
met
ers
Fast
land
s: A
gric
ultu
ral, d
evel
oped
, and
upl
and
area
s sur
roun
ded
by le
vees
that
are
gen
eral
ly co
nsid
ered
non
-wet
land
s (LO
SR, 2
002)
and
that
are
exc
lude
d fro
m c
alcu
latio
ns o
f net
land
are
a ch
ange
.20
04 to
2005
New
Wat
er A
reas
(Dec
reas
ed La
nd A
reas
)* : Inc
lude
s flo
oded
mar
sh, s
hear
ed m
arsh
, ero
ded
mar
sh,
and
scou
red
mar
sh.
2005
Wat
er20
05 La
nd
2004
to 20
05 N
ew La
nd A
reas
* : Inc
lude
s wra
ck, c
ompr
esse
d m
arsh
, and
aqu
atic
vege
tatio
n th
at is
pos
sibly
misc
lass
ified
. The
se a
reas
are
incl
uded
in c
alcu
latio
ns o
f net
land
are
a ch
ange
.20
05 Fl
oode
d Bu
rned
Mar
sh A
reas
: Bas
ed o
n im
ager
y rev
iew
of a
reas
cla
ssifi
ed a
s bur
ned
mar
sh w
ithin
a m
onth
to a
few
wee
ks o
f Hu
rrica
ne R
ita’s
land
fall.
2005
Floo
ded
Agric
ultu
ral a
nd D
evel
oped
Are
as: B
ased
on
imag
ery r
evie
w o
f new
wat
er a
reas
occ
urrin
g w
ithin
the
“oth
er la
nd” c
lass
of
Cha
brec
k and
Lins
com
be’s
mar
sh c
omm
unity
type
s (un
pub.
dat
a, 20
01).
Basin
Bou
ndar
y: Th
ese
boun
darie
s inc
lude
the
shar
ed a
rea
betw
een
the
hydr
olog
ic b
asin
s def
ined
by C
WPP
RA (1
993)
and
the
boun
dary
of
the
LCA
stud
y (Ba
rras a
nd o
ther
s, 20
03).
Hurri
cane
Trac
k* Da
ta w
ere
filte
red
to d
epic
t are
as o
f los
s and
gai
n gr
eate
r tha
n 2.7
acr
es (1
.1 ha
) in
size
to re
mov
e ba
ckgr
ound
noi
se a
nd to
incr
ease
con
fiden
ce in
the
depi
cted
tren
ds.
Katrina Aug. 29, 2005
Sept. 24, 2005
Rita
Land
Are
a Ch
ange
in C
oast
al L
ouis
iana
Afte
r the
200
5 H
urri
cane
s: O
verv
iew
Chen
ier P
lain
Mar
gina
l Del
taic
Pla
in
Delta
ic P
lain
Terre
bonn
eBa
sin
Pont
char
train
Bas
in
Bret
on S
ound
Basi
n
Mis
siss
ippi
Riv
erDe
lta B
asin
Bara
taria
Basi
n
Atch
afal
aya
Basi
n
Tech
e/Ve
rmili
onBa
sin
Mer
men
tau
Basi
n
Calc
asie
u/Sa
bine
Basi
n
Pear
l Riv
erBa
sin
Lake
Borg
ne
Lake
Pon
tcha
rtrai
n
Lake
Mau
repa
s
Bret
on S
ound
Bara
taria
Bay
Terre
bonn
e Ba
y
Atch
afal
aya
Bay
Miss
issip
pi S
ound
Chandeleur Islands
Chan
dele
urSo
und
Wes
t Cot
e B
lanc
he B
ay
Verm
ilion
Bay
Whi
teLa
ke
Gran
dLa
ke
Calcasi
eu Lake
Sabine Lake
Lake
Salva
dor
East
Bay
Wes
tBa
y
Lake
Bo
udre
aux
Atchafalaya River
Wax Lake
Freshwater B
ayou
Figu
re 1
. Ov
ervi
ew o
f lan
d ar
ea c
hang
e in
coa
stal
Lou
isia
na a
fter t
he 2
005
hurr
ican
es (B
arra
s, 2
006)
.

Land Area Changes in Coastal Louisiana After Hurricanes Katrina and Rita 101
Table 1. Land area changes in coastal Louisiana after Hurricanes Katrina and Rita occurring within the Louisiana Coastal Area (LCA) trend area in 2005.
[The Barataria, Breton, Mississippi River, Pearl River, Pontchartrain, and Terrebonne basins compose the Deltaic Plain. The Atchafalaya and Teche-Vermilion basins compose the Marginal Deltaic Plain. The Calcasieu-Sabine and Mermentau basins compose the Chenier Plain. ag, agricultural]
Period Deltaic Plain Marginal Deltaic Plain Chenier Plain Total
mi2 km2 mi2 km2 mi2 km2 mi2 km2
Fall 2001
Land 3,768 9,759.12 708 1,833.72 1,463 3,789.17 5,939 15,382.01
Water 5,606 14,519.54 756 1,958.04 617 1,598.03 6,979 18,075.61
Total 9,374 24,278.66 1,464 3,791.76 2,080 5,387.20 12,918 33,457.62
Fall 2004
Land 3,740 9,686.60 708 1,833.72 1,475 3,820.25 5,923 15,340.57
Water 5,634 14,592.06 756 1,958.04 605 1,566.95 6,995 18,117.05
Total 9,374 24,278.66 1,464 3,791.76 2,080 5,387.20 12,918 33,457.62
Fall 2005
Land 3,621 9,378.39 691 1,789.69 1,311 3,395.49 5,623 14,563.57
Water 5,753 14,900.27 770 1,994.30 689 1,784.51 7,212 18,679.08
Flooded burned marsh 0 0.00 0 0.00 43 111.37 43 111.37
Flooded ag/pasture impoundment 0 0.00 3 7.77 37 95.83 40 103.60
Total 9,374 24,278.66 1,464 3,791.76 2,080 5,387.20 12,918 33,457.62
2001–04 land area change
Net land area change -28 -72.52 0 0.00 12 31.08 -16 -41.44
2004–05 land area change
Net land area change -119 -308.21 -17 -44.03 -164 -424.76 -300 -777.00
Flooded lands* 0 0.00 3 7.77 80 207.20 83 214.97
Adjusted land area change -119 -308.21 -14 -36.26 -84 -217.56 -217 -562.03
* Includes flooded burned marsh and flooded agricultural and developed areas.

102 Science and the Storms: the USGS Response to the Hurricanes of 2005
Figu
re 2
. La
nd a
rea
chan
ge in
coa
stal
Lou
isia
na a
fter t
he 2
005
hurr
ican
es: m
arsh
com
mun
ities
(Bar
ras,
200
6).
Land Area Changes in Coastal Louisiana After Hurricanes Katrina and Rita 103
Table 2. Coastal Louisiana land area changes from fall 2004 to fall 2005 occurring within the Louisiana Coastal Area (LCA) trend area by 2001 marsh communities.
[The Barataria, Breton, Mississippi River, Pearl River, Pontchartrain, and Terrebonne basins compose the Deltaic Plain. The Atchafalaya and Teche-Vermilion basins compose the Marginal Deltaic Plain. The Calcasieu-Sabine and Mermentau basins compose the Chenier Plain]
CommunityDeltaic Plain
Marginal Deltaic Plain
Chenier Plain Total
mi2 km2 mi2 km2 mi2 km2 mi2 km2
Fall 2004
Forested wetlands 1,161 3,006.99 168 435.12 0 0.00 1,329 3,442.11
Other land 209 541.31 35 90.65 153 396.27 397 1,028.23
Fresh marsh community 777 2,012.43 175 453.25 590 1,528.10 1,542 3993.78
Intermediate marsh community 439 1,137.01 193 499.87 455 1,178.45 1,087 2,815.33
Brackish marsh community 527 1,364.93 129 334.11 222 574.98 878 2,274.02
Saline marsh community 627 1,623.93 8 20.72 55 142.45 690 1,787.10
Water* 5,634 14,592.06 756 1,958.04 605 1,566.95 6,995 18,117.05
Total 9,374 24,278.66 1,464 3,791.76 2,080 5,387.20 12,918 33,457.62
Fall 2005
Forested wetlands 1,160 3,004.40 168 435.12 0 0.00 1,328 3,439.52
Other land 207 536.13 33 85.47 131 339.29 371 960.89
Fresh marsh community 755 1,955.45 165 427.35 500 1,295.00 1,420 3,677.80
Intermediate marsh community 390 1,010.10 191 494.69 416 1,077.44 997 2,582.23
Brackish marsh community 509 1,318.31 126 326.34 210 543.90 845 2,188.55
Saline marsh community 600 1,554.00 8 20.72 54 139.86 662 1,714.58
Water* 5,753 14,900.27 773 2,002.07 769 1,991.71 7,295 1,8894.05
Total 9,374 24,278.66 1,464 3,791.76 2,080 5,387.20 12,918 33,457.62
2004–05 net area change
Forested wetlands 1 3 0 0 0 0 1 3
Other land 2 5 2 5 22 57 26 67
Fresh marsh community 22 57 10 26 90 233 122 316
Intermediate marsh community 49 127 2 5 39 101 90 233
Brackish marsh community 18 47 3 8 12 31 33 85
Saline marsh community 27 70 0 0 1 3 28 73
Water* -119 -308 -17 -44 -164 -425 -300 -777* Includes the 83 mi2 (214.97 km2) of flooded lands consisting of flooded burned marsh and flooded agricultural and developed areas.
After adjustment for these flooded areas, the net increase in water area (decrease in land) was 217 mi2 (516 km2).

104 Science and the Storms: the USGS Response to the Hurricanes of 2005
After the hurricanes the classified land-water datasets were spatially compared to produce an output change data set identifying the locations of new water and land areas occurring by fall 2005. The land-water change data set was filtered to remove changes below 2.7 acres (0.01 km2), to remove “noise,” and to provide a more accurate change interpretation. The new water area changes were displayed over the 2005 land-water marsh community type data sets to assist in identifying, interpreting, and verifying persistent water areas caused by storm impacts.
VerificationChanges in water area that were identified by Landsat
were verified by review of multidate, multiresolution imagery bracketing the hurricanes; by small plane overflight of TM-identified new water bodies located in southeastern and south-central Louisiana on November 18 and December 9, 2005; and by limited field investigations. The imagery review indicated origin, variability, and duration of new water bodies. The small plane overflights provided a quick and efficient way to verify the existence of new or expanded water bodies over southeastern Louisiana. Field investigations provided water-depth information for selected new water bodies adjacent to Lake Lery, within the Breton Sound basin. According to the NOS Grand Isle gage, daily average water levels during both verification flights were within 2.4 inches (6.1 cm) of water levels shown on the October 25, 2005, Landsat image that covered the majority of the southeastern Louisiana study area.
Shear DefinitionA host of terms is used to describe hurricane impacts
on wetlands, such as rolled marsh, compressed marsh, inverted marsh, flipped marsh, folded marsh, ripped marsh, scoured marsh, and marsh balls. This report defines areas of persistent new water bodies occurring after the hurricanes where marsh vegetation was either completely or partially removed as “shears.” Shears may include features defined by the other terms listed above, but the key characteristic is the presence of persistent new water bodies that appear in multiple posthurricane images acquired over a period of a few months to a year after the storm’s landfall. The hurricanes’ surge also expanded existing ponds in fresh, intermediate (less saline than brackish), and brackish marshes with some limited expansion in saline marshes. These features are defined as shear-expanded ponds and may contain compressed, rolled, or inverted marsh, as well as scoured marsh and direct shoreline erosion. For example, shears in fresh marshes tend to compress or fold perpendicular to the surge’s direction if located in a storm’s northwest quadrant, forming northwest to southeast trending ponds. Existing ponds may be expanded
to the northwest by compression of the marsh forming the pond’s northwestern shoreline. Shears in brackish and saline marshes tend to remove vegetation to the underlying clay and/or to the root map, forming an intertwined mosaic of removed and partially removed marsh. Shears in intermediate marshes may contain folding and compression as well as the scouring prevalent in the brackish and saline marshes. These conditions vary, even within shear complexes, and require verification by small plane overflight, by examination of high-resolution imagery, and by field investigations to provide a final shear classification (fig. 3).
Southeastern Louisiana (Deltaic Plain)New water bodies and expanded water bodies formed
on the eastern side of the Mississippi River basin; the northwestern portion of the Breton Sound basin, from Delacroix to Caernarvon (Barras, 2007, fig. 7A); the northern and eastern shorelines of Lake Borgne; and along the north shore of Lake Pontchartrain from Mandeville to the Mississippi border, including extensive impacts in the Pearl River basin (fig. 1). Some expanded ponds and limited shoreline erosion were identified in the Labranche wetlands located east of the Mississippi River, between Laplace and Kenner (Barras, 2007, figs. 12A, 12B, and 12C). The smallest new water body identified with TM imagery and verified by small plane overflight was approximately 4 acres (0.02 km2) in the saline Bayou Biloxi marsh (Barras, 2007, figs. 4A and 4B). The largest new lake was approximately 1,200 acres (4.86 km2) located in the intermediate marsh of upper Breton Sound basin (Barras, 2007, fig. 7B), and a 570-acre (2.31-km2) shear was located in the fresh marsh adjacent to the east bank of South Pass (Barras, 2007, fig. 3C) in the Mississippi River basin (Barras, 2007, fig. 3A). Visual observations based on small plane overflight confirmed that some of the new water areas consist of shallow ponds where the marsh surface has been sheared or ripped to the root mat or to the underlying firm substrate of clay by storm surge (Barras, 2007, fig. 7S).
The shears in upper Breton Sound basin ranged in depth from 1 inch (2.54 cm) to 3 ft (91.44 cm) based on field investigations (G. Steyer, USGS, oral commun., 2006). Imagery review of this basin reveals large shallow mudflats bordering exposed marsh spoil banks and other elevated features. Slight variations in water level exposed large areas of flats between subsequent followup images. A March 2, 2006, Landsat 5 scene revealed some revegetation occurring on the shallow flats. Field investigations conducted in early March of 2006 indicated that annuals yellowcress (Rorippa palustris) and butterweed (Packera glabella), as well as algae, colonized some of the flats (B. Perez, USGS, oral commun., 2006). Another scene acquired on June 6, 2006, revealed expanded revegetation of the shallow flat areas bordering exposed marsh as well as the presence of potential aquatic vegetation. Most

Land Area Changes in Coastal Louisiana After Hurricanes Katrina and Rita 105
WN
W
Grand Lake
Scoured marsh
Eroded shoreline
Eroded shoreline
Remnant marsh surface
Orange Bayou
Scoured marsh
Grand Lake
Ora
nge
Bay
ou
Fall 2004 CIR DOQQ
Solid marsh surface
Figure 3. Example of marsh shearing after Hurricanes Katrina and Rita in the intermediate marsh community of upper Breton Sound to the southwest of Delacroix, La.
WN
W
Grand Lake
Scoured marsh
Eroded shoreline
Eroded shoreline
Remnant marsh surface
Orange Bayou
Scoured marsh
Grand Lake
Ora
nge
Bayo
u
Fall 2004 CIR DOQQ
Solid marsh surface

106 Science and the Storms: the USGS Response to the Hurricanes of 2005
of the exposed marsh areas occurring within the fresh and intermediate marsh community types located in the northwest portion of the basin were reflecting strongly in the near-infrared, indicating vegetative growth. Field investigations are required to identify the type of vegetation growing in this area.
The submerged marsh surface is visible in other areas (fig. 3). Remnant marsh balls and other debris, not large enough to be identified with TM imagery, litter some of the sheared areas, while other areas appear as large shallow ponds or lakes with large areas of exposed mud flats that vary depending on water level. Groups of small, interconnected ponds have been expanded in some areas by the shearing of the intervening marsh.
Areas of floating fresh marsh (C. Sasser, Louisiana State University, oral commun., 2006) and some scrub/shrub were completely removed in the northern Pearl River basin (Barras, 2007, fig. 5B), while a series of shears was cut across the southern portion of the basin (Barras, 2007, fig. 5A). The fresh and intermediate marshes in northwestern Breton Sound basin were completely rearranged, displaying multiple large northwest to southeast trending shears (Barras, 2007, fig. 7A). Large deposits of wrack accumulated adjacent to and/or on top of spoil banks and natural distributary channels and often completely surrounded black willow (Salix nigra) and shrubs (Barras, 2007, fig. 7H). Shallow mudflats, peppered by marsh balls and other debris, were present throughout the area. Ninety percent (37 mi2 of the 41 mi2 (96 km2 of the 106 km2)) of new water area appearing after the hurricanes in Breton Sound basin occurred within the 2001 intermediate marsh community.
The more mineral-rich brackish and saline marshes fared better, as indicated by the lack of large new water areas in central Breton Sound basin and the Bayou Biloxi marsh. Examination of high-resolution color infrared digital orthophoto quarter quadrangles (DOQQs) acquired in late October 2005 shows the presence of small shears, below the detectable spatial resolution of TM imagery present in these marshes.
Fringing shoreline erosion and the formation of small ponds were observed in the brackish-saline marshes, but the greatest impacts occurred in the more organic fresh and intermediate marshes of the eastern Mississippi River basin (Barras, 2007, fig. 3A), upper Breton Sound basin, and Pearl River basin (Barras, 2007, fig. 5A). Compression features of 1 mi (1.6 km) or more long were observed in upper Breton Sound basin. Smaller but distinct compression features of 0.5 mi (0.8 km) in length were also observed in the North Shore marsh (Barras, 2007, figs. 8A and 8C). The eastern Mississippi River basin also suffered some impacts from Hurricane Ivan (September 16, 2004), as observed when comparing the fall 2001 to the fall 2004 imagery. The Chandeleur Islands’ land area decreased from 5.6 mi2 (14.50 km2) from fall 2004 to 2 mi2 (5.18 km2) by fall 2005 (Barras, 2007, fig. 1).
Areas west of the Mississippi River were impacted more by Rita than by Katrina, as observed by comparison of Landsat
imagery acquired on September 15, 2005, after Katrina but before Rita’s landfall. Areas of significant shoreline erosion, possibly caused by wave action from Katrina’s northwesterly winds were, however, detected along the southern shorelines of Lake Salvador and Little Lake in central Barataria basin, 35 mi (56 km) east of Katrina’s track (Barras, 2007, figs. 11A and 11B). Similar lakes located 60–70 mi (97–113 km) west of Katrina’s track in Terrebonne basin did not display similar erosion along their southern shorelines.
Rita’s surge rearranged Katrina’s wrack in upper Breton basin and caused the formation of limited new ponds and some expanded ponds from central Barataria basin across the Terrebonne basin to the Atchafalaya River. These impacts occurred primarily in fresh and intermediate marshes, although similar effects were observed in brackish marshes. Rita reactivated some shears originally formed by Hurricane Andrew and later reactivated by Hurricane Lili in western Terrebonne basin.
Areas of submerged and floating aquatic vegetation were shifted or removed by Rita’s surge. Some of the changes in water and land area in the floating fresh marshes of the Barataria and Terrebonne basins were caused by the removal of floating and submerged aquatic vegetation by storm surge. Other land-water area changes were caused by normal changes in aquatic vegetation distribution between the fall 2004 and fall 2005 imagery. Review of multiple Landsat images was used to identify areas where land-water changes were caused by storm surge rather than by normal distribution changes. The fresh and intermediate marshes often contain extensive floating and submerged aquatic vegetation in October and November, and identification of these areas with Landsat imagery varies between excellent and poor, depending on vegetation reflectance characteristics. Surge removal of submerged and floating aquatic vegetation was noticeable west of Bayou Dularge and south of Bayou Penchant in the western Terrebonne basin (Barras, 2007, figs. 15A, 15B, and 18A).
Water level effects are also noticeable in the marshes north of Lake Boudreaux, as evidenced by exposure of low-elevation marsh and flats during low water-level conditions on the October 25, 2005, image versus higher water levels on the November 7, 2004, image (fig. 1).
Representative examples of before and after Landsat imagery and oblique photography used to identify and verify new water areas caused by storm impacts in south Louisiana are available in Barras, 2007.
South-central Louisiana (Marginal Deltaic Plain)
Primary impacts from Rita’s surge to Louisiana’s south-central coast were the removal of floating and submerged aquatic vegetation from the Atchafalaya River west to East Cote Blanche Bay (fig. 2). The surge basically removed

Land Area Changes in Coastal Louisiana After Hurricanes Katrina and Rita 107
vegetation from the Atchafalaya River and Wax Lake Deltas, existing ponds, lakes, and bayous, as well as expanded some existing ponds (Barras, 2007, fig. 19A). Surge impacts increased to the west. Rita’s surge expanded some shears formed by Hurricane Lili (October 3, 2002) near Marone Point (Barras, 2007, fig. 19B). Marsh scouring and some small shears were present in the southeast quadrant of Marsh Island. Some new shears and surge-expanded ponds ranging from 4.94 to 70 acres (0.02 to 0.28 km2) were present in the intermediate and brackish marsh communities east of Freshwater Bayou (Barras, 2007, fig. 21A). Accumulated wrack was evident along southeastern-facing spoil banks. Some flooding of impounded agricultural areas and fresh and intermediate marshes occurred east of Intracoastal City.
Southwestern Louisiana (Chenier Plain)
Rita’s surge and flooding impacts were greater west of Freshwater Bayou. Review of recent Landsat scenes indicate that persistent flooding of impounded marsh and agricultural areas continued from October 2005 through early April 2006 between Freshwater Bayou and Calcasieu Lake to the west (Barras, 2007, fig. 20). Areas with particularly persistent flooding included the fresh marsh community located along the eastern shoreline of White Lake and between White Lake and Pecan Island; the intermediate marsh located southwest of Grand Lake; the intermediate and brackish marshes bordering the east-central and southeastern Calcasieu Lake shoreline; and the fresh marsh just to the northwest of West Cove in Calcasieu Lake. Wrack was present along most south and southeasterly facing canal and pipeline spoil banks as well as along impoundment levees throughout the Chenier Plain, with a few wrack accumulations exceeding 100 acres (0.40 km2) just north of Johnsons Bayou and south of the Sabine National Wildlife Refuge (NWR).
Surge-created shears were present over the entire Chenier Plain. Over 1,200 acres (4.86 km2) of intermediate marsh contained within the southern portion of the Freshwater Bayou Wetlands restoration project were removed by Rita’s surge (Vincent and others, 2000). A series of north-south trending shears located in the brackish marsh south of Pecan Island were identified bordering the southern extent of the Pecan Island Gas Field (with one shear exceeding 300 acres (1.21 km2)) and forming between parallel north-south pipeline canals approximately 2,200 ft (0.67 km) apart (Barras, 2007, fig. 21A). Another 350-acre (1.42-km2) shear was identified in intermediate marsh 1.6 mi (2.57 km) to the east of Deep Lake in Rockefeller Wildlife Refuge (Barras, 2007, fig. 23). A brackish marsh peninsula, surrounded by Mud Lake a few miles east of Johnsons Bayou, contained a 70-acre (0.28-km2) shear, while the marsh 2 mi (3.22 km) due north of the peninsula contained another 140-acre (0.57-km2) shear
(Barras, 2007, fig. 25). The largest shears were located in intermediate marsh 2 mi (3.22 km) north of Johnsons Bayou and south of the Sabine NWR, 11 mi (17.70 km) east of Rita’s landfall at Sabine Pass. The total marsh area removed exceeded 2,600 acres (10.52 km2). Large wrack accumulations were located along the Sabine NWR Freshwater Pool southern levee system, immediately north of the Johnsons Bayou shear. Several narrow linear north-northwest by south-southeast oriented shears, as much as a mile (1.6 km) or more in length, extended from a large 200-acre (0.81-km2) shear located in the intermediate marsh bordering the east side of the Sabine NWR Freshwater Pool. Large accumulations of wrack were visible between the linear shears.
The fresh and intermediate marsh communities south of Sweet Lake, located inland 12 mi (19.3 km) from the Gulf of Mexico, contained a few shears as large as 200 acres (0.81 km2) and significant areas where floating aquatic and submerged aquatic vegetation were removed (Barras, 2007, fig. 24). Large accumulations of wrack were found along south-facing spoil banks and along the southern bank of the Gulf Intracoastal Waterway (GIWW).
Persistent flooding of impounded marsh, impounded agricultural areas, and burned marsh areas through April 2006 caused by Rita’s surge confounds southwestern Louisiana land-loss area estimates. Some of the persistent flooded marsh areas identified as new water areas in the fall 2005 dataset were drained by May 2006 but also contained large new burned marsh areas (Barras, 2007, figs. 22A and 22D). Comparison of February, March, April, and May 2006 images showed that some of the drained areas were partially reflooded at later dates (Barras, 2007, figs. 22B, 22C, and 22D). Many of the drained areas occurring in persistently flooded areas from October 2005 through February 2006 appeared similar to exposed mudflats, which indicates that these areas were lower than surrounding marsh because of vegetation collapse or removal and were likely to retain water and appear as ponds under wetter conditions. The drought conditions from the fall of 2005 through the spring of 2006 across coastal Louisiana further complicate land-water interpretations since the post-Rita vegetation recovery is not representative of normal precipitation conditions. Some areas of surge-flooded marsh appeared similar to bare earth or dry mudflats rather than resembling growing vegetation by May 2006. Other areas appeared to be growing, particularly where Rita’s surge quickly drained from the marsh, similar to surge-residence patterns in southeastern Louisiana. These areas were located east of Freshwater Bayou and west of Johnsons Bayou, adjacent to the eastern shoreline of Sabine Lake, and brackish and saline marshes appeared to be growing within 1–2 mi (1.6–3.2 km) of the gulf shoreline. Some of the shears south of Pecan Island were partially drained, whereas others remained as ponds, indicating varying shear depths on the same May 2006 image.

108 Science and the Storms: the USGS Response to the Hurricanes of 2005
of western Terrebonne basin, bordering the Atchafalaya River (Barras, 2007, fig. 16C). Impacts from Andrew’s surge were detected 85 mi (137 km) to the east in central Barataria basin near Bayou Rigolettes, increasing in frequency and magnitude toward Andrew’s landfall near Morgan City, La. Hurricane Lili’s landfall (October 3, 2002), near the mouth of Freshwater Bayou, created a series of northeast to southwest trending shears in the contiguous fresh and intermediate marsh west of Bayou Sale 30 mi (48.28 km) to the east (Barras, 2003, 2007, fig. 19C). The largest shear was 175 acres (0.71 km2) with the marsh completely removed to the underlying clay. Significant internal marsh shearing was not observed in the marsh adjacent to Freshwater Bayou. Lili’s surge caused detectable impacts 95 mi (153 km) to the east, north of Wonder Lake in central Terrebonne basin, and caused some expansion of older Andrew shears as well as created some smaller new shears in western Terrebonne basin (Barras, 2007, fig. 16B). Lili’s surge removed and rearranged floating and aquatic vegetation within fresh and intermediate marsh communities across the entire impact area, including the Atchafalaya River and Wax Lake Deltas with rack visible east to Lake Boudreaux. Observed impact severity increased westward towards Lili’s landfall.
Either Lili or Tropical Storm Isadore (September 26, 2002) caused a series of small northwest to southeast trending shears in the intermediate marsh of upper Breton Sound basin in an area that was completely rearranged by Katrina’s surge north of Lake Lery (Barras, 2007, fig. 9). The largest detected shear was 55 acres (0.22 km2) with several smaller shears concentrated within an 8-mi-wide (12.9-km-wide) swath, indicating that the fresh and intermediate marshes located there were susceptible to storm surge. The eye of Hurricane Ivan passed approximately 60 mi (97 km) to the east of the Mississippi River Delta on September 16, 2004, before making landfall near Pensacola, Fla., later that day. Significant shoreline erosion was observed on the eastern side of the delta on both southeasterly and northern facing shorelines (Barras, 2007, fig. 3D). No significant internal marsh shearing was observed, but wrack was dispersed along the eastern side of the active delta. The Chandeleur Islands suffered some overwashing and cutting from Ivan’s surge.
Many of Andrew’s shears were revegetated by the time that Lili impacted the western Terrebonne and Atchafalaya basins. Some of the larger shears remained as ponds or lakes, but they were often partially or entirely covered with vegetation. Several smaller new shears ranging from 10 to 30 acres (0.04 to 0.12 km2) were created by Lili’s surge in the fresh marshes bordering Atchafalaya Bay, between East Cote Blanche Bay and the Atchafalaya River (Barras, 2007, fig. 18B). Some of the shears appeared to result from removal or flipping of shrub/scrub vegetation, typically wax myrtle (Morella cerifera). Both the Atchafalaya River and Wax Lake Deltas were choked with aquatic vegetation by the fall of 2003. The shears 10 mi (16 km) further east, located closer to the historical wetland loss areas, remained partially open (Barras, 2007, fig. 16B). Only Lili’s larger shears remained
Historical ComparisonThe distribution of Katrina’s and Rita’s new water areas
varied coastwide. Shears were often located in marshes fringing 1956–2000 loss areas, but they were also distributed in historically stable areas such as upper Breton Sound basin and the lower Pearl River basin (fig. 4; Barras, 2007, figs. 5C, 5D, and 7G). Land loss is occurring in these areas, but at low rates when compared to higher land-loss rate areas such as those in the Barataria and Terrebonne basins. The 1956–2004 loss for Breton Sound basin was 67 mi2 (173.53 km2). The 2004–05 increase in water area after Katrina and Rita was 41 mi2 (106 km2), a 61 percent increase in water area. The total water area increase between 2004 and 2005 for east of the Mississippi River was 79 mi2 (205 km2), exceeding the projected 2000–2050 rate of 61 mi2 (158 km2) based on comparison of 1978–2000 loss and gain trends (Barras and others, 2003).
Rita’s surge removed remnant marsh located within historical land-loss areas that collapsed rapidly during the mid-1960s to the mid-1970s in western Barataria basin and eastern Terrebonne basin (Morton and others, 2005; Barras, 2007, figs. 13A, 13C, 14A, 14C, and 15B). Katrina’s surge did the same in historical land-loss areas of the Pontchartrain basin, along the north shore of Lake Pontchartrain, and in the Labranche wetlands (Barras, 2007, figs. 10B, 12A, and 12D). Shears and scoured marsh were present between the GIWW and the west shoreline of Lake Borgne, however, just east of Alligator Point, a historically stable area (Barras, 2007, figs. 6A and 6C). Remnant contiguous marsh, located between historical loss areas and the Gulf of Mexico shoreline on the eastern side of the Mississippi River Delta was removed by Katrina’s surge. The distribution of new water areas in southwestern Louisiana followed a similar pattern. Shears often occurred in marshes fringing historical loss areas or in remnant marshes occurring within areas with historical loss but also occurred in historically stable areas. Shears in stable marsh areas were often associated with expansion of existing small ponds but were also observed in areas of contiguous marsh where vegetation was either partially or completely removed. The flooding present on the Chenier Plain in the fall of 2005 precludes definitive quantitative comparison with historical losses, although selected areas of potential loss could be identified and quantified by imagery review.
Comparison of Prior Hurricane ImpactsThe combined impacts of Katrina and Rita on land area
changes (identified by using Landsat TM imagery from 1983 to the present) exceeded impacts from other hurricanes in coastal Louisiana (including Andrew). Prior Landsat-based assessments identified shears as large as 800 acres (3.24 km2) from Andrew (August 26, 1992) in the fresh marsh community

Land Area Changes in Coastal Louisiana After Hurricanes Katrina and Rita 109
100
1020
3040
Mile
s
Scal
e 1:
1,90
0,00
0
200
2040
6080
Kilo
met
ers
Katrina Aug. 29, 2005
Sept. 24, 2005
Rita
Land
Are
a Ch
ange
in C
oast
al L
ouis
iana
Afte
r the
200
5 Hu
rric
anes
: A
Hist
oric
al P
ersp
ectiv
e (fr
om 1
956)
Fast
land
s: A
gric
ultu
ral, d
evel
oped
, and
upl
and
area
s sur
roun
ded
by le
vees
that
are
gen
eral
ly co
nsid
ered
no
n-w
etla
nds (
LOSR
, 200
2) a
nd th
at a
re e
xclu
ded
from
cal
cula
tions
of n
et la
nd a
rea
chan
ge.
LCA
Area
Not
Incl
uded
in th
e 19
56 D
ata
Cove
rage
1956
Wat
er19
56 La
nd
2004
to 20
05 N
ew W
ater
Are
as (D
ecre
ased
Land
Are
as)**
: Inc
lude
s flo
oded
mar
sh, s
hear
ed m
arsh
, ero
ded
mar
sh, a
nd sc
oure
d m
arsh
.20
04 to
2005
New
Land
Are
as**
: Inc
lude
s wra
ck, c
ompr
esse
d m
arsh
, and
aqu
atic
vege
tatio
n th
at is
pos
sibly
misc
lass
ified
.Th
ese
area
s are
incl
uded
in c
alcu
latio
ns o
f net
land
are
a ch
ange
.
1956
to 20
04 La
nd Lo
ss* : B
ased
on
dire
ct c
ompa
rison
of 1
956 a
nd 20
04 la
nd-w
ater
dat
a.
1956
to 20
04 La
nd G
ain* : B
ased
on
dire
ct c
ompa
rison
of 1
956 a
nd 20
04 la
nd-w
ater
dat
a.
2005
Floo
ded
Burn
ed M
arsh
Are
as: B
ased
on
imag
ery r
evie
w o
f are
as c
lass
ified
as b
urne
d m
arsh
with
in a
mon
th to
a
few
wee
ks b
efor
e Hu
rrica
ne R
ita’s
land
fall.
2005
Floo
ded
Agric
ultu
ral a
nd D
evel
oped
Are
as: B
ased
on
imag
ery r
evie
w o
f new
wat
er a
reas
occ
urrin
g w
ithin
the
“oth
er la
nd” c
lass
of C
habr
eck a
nd Li
nsco
mbe
’s m
arsh
com
mun
ity ty
pes (
unpu
b. d
ata,
2001
).
Basin
Bou
ndar
y: Th
ese
boun
darie
s inc
lude
the
shar
ed a
rea
betw
een
the
hydr
olog
ic b
asin
s def
ined
by C
WPP
RA (1
993)
and
the
boun
dary
of t
he LC
A st
udy (
Barra
s and
oth
ers,
2003
).Hu
rrica
ne Tr
ack
* Data
wer
e fil
tere
d to
dep
ict l
arge
r are
as o
f los
s and
gai
n gr
eate
r tha
n 3.5
acr
es (1
.4 ha
) in
size
and
to re
mov
e no
ise a
nd in
crea
se th
e co
nfid
ence
of t
he d
epic
ted
trend
s. **
Data
wer
e fil
tere
d to
dep
ict a
reas
of l
oss a
nd g
ain
grea
ter t
han
2.7 a
cres
(1.1
ha) i
n siz
e to
rem
ove
noise
and
to in
crea
se c
onfid
ence
in th
e de
pict
ed tr
ends
.
Chen
ier P
lain
Mar
gina
l Del
taic
Pla
in
Delta
ic P
lain
Terre
bonn
eBa
sin
Pont
char
train
Bas
in
Bret
on S
ound
Basin
Miss
issip
pi R
iver
Delta
Bas
in
Bara
taria
Basin
Atch
afal
aya
Basin
Tech
e/Ve
rmili
onBa
sin
Mer
men
tau
Basin
Calca
sieu/
Sabi
neBa
sin
Pear
l Rive
rBa
sin
Lake
Borg
ne
Lake
Pon
tcha
rtrai
n
Lake
Mau
repa
s
Bret
on S
ound
Bara
taria
Bay
Terre
bonn
e Ba
y
Atch
afal
aya
Bay
Miss
issipp
i Sou
nd
Chandeleur Islands
Chan
dele
urSo
und
Wes
t Cot
e B
lanc
he B
ay
Verm
ilion
Bay
Whi
teLa
ke
Gran
dLa
ke
Calcasi
eu Lake
Sabine Lake
Lake
Salva
dor
East
Bay
Wes
tBa
y
Lake
Bo
udre
aux
Atchafalaya River
Wax Lake
Freshwater B
ayou
Figu
re 4
. L
and
Are
a C
hang
e in
Coa
stal
Lou
isia
na A
fter
the
2005
Hur
rica
nes:
A H
isto
rica
l Per
spec
tive
(fro
m 1
956)
Figu
re 4
. La
nd a
rea
chan
ge in
coa
stal
Lou
isia
na a
fter t
he 2
005
hurr
ican
es: a
his
toric
al p
ersp
ectiv
e (B
arra
s, 2
006)
.

110 Science and the Storms: the USGS Response to the Hurricanes of 2005
November 29, 1992After Hurricane Andrew (August 26, 1992)
October 11, 1991
October 16, 2005After Hurricane Rita (September 24, 2005)
October 16, 2002After Hurricane Lili (October 3, 2002)
Big Hog Bayou, LouisianaComparison of Marsh Shears After Hurricanes Andrew, Lili, and Rita
(Landsat 5 Thematic Mapper Satellite Imagery)Fresh Marsh Community Type
Produced by: U.S. Department of the InteriorU.S. Geological SurveyNational Wetlands Research Center, Lafayette, La.
Map ID: USGS-NWRC 2006-11-0452Map Date: June 26, 2006
Image Source:Landsat 5 Thematic Mapper Satellite Imagery is provided by the USGS EROS Data Center. Bands 4 (near-ir), 5 (mid-ir), and 3 (visible red) are displayed.
Big Doctor’s Bayou
Atchafalaya Bay
Big Hog Bayou
Big Doctor’s Bayou
Big Hog Bayou
Big Doctor’s Bayou
Atchafalaya Bay
Atchafalaya Bay
Atchafalaya Bay
Big Hog Bayou
Big Doctor’s Bayou
Big Hog Bayou
ShearLocations
Surge-removed Vegetation andShear-expanded Pond Locations
B
eetttation
ShearLocations
B
Surge-removed Vegetation andShear-expanded Pond Locations
Surge-removed Vegetation andShear-expanded Pond Locations
Wrack
WrackWW
Figure 5. Big Hog Bayou multiple hurricane impacts.

110 Science and the Storms: the USGS Response to the Hurricanes of 2005 Land Area Changes in Coastal Louisiana After Hurricanes Katrina and Rita 111
open near Marone Point and the Wax Lake Delta by the fall of 2004. Some of these shears were either covered or partially covered by wrack from Rita’s surge, whereas other existing shears were expanded (fig. 5; Barras, 2007, figs. 19A and 19B). The smaller shears north of Lake Lery were partially covered with aquatic vegetation, but they were still clearly visible in fall of 2004 until either being removed or obscured by wrack from Katrina’s surge. Rita’s surge expanded shears originally formed by Andrew and later expanded by Lili, in western Terrebonne but also partially covered existing shears with wrack deposits (Barras, 2007, figs. 16A and 18A).
ConclusionsThe magnitude and distribution of new water areas
caused by Katrina and Rita exceed prior hurricane impacts detected with Landsat TM Imagery since 1983. Katrina’s impacts were identified east of central Barataria basin to the Louisiana-Mississippi border. Rita’s impacts were identified from Breton Sound basin west to the Louisiana-Texas border. Fresh and intermediate marsh community types located near or to the east of hurricane landfalls may experience detectable shearing at Landsat TM spatial resolutions. Brackish and saline marsh communities appear to be more resilient to shearing than are fresh and intermediate marsh communities. The spatial distribution and magnitude of shears are dependent on hurricane landfall orientation, surge coverage area and duration, and marsh community type. Natural and artificial barriers facing storm surge accumulate wrack and may reduce surge shearing for areas located behind them.
The 217 mi2 (562 km2) of new water area contains (1) land losses that may be permanent, caused by direct removal of wetlands by storm surge; and (2) transitory water area increases caused by the following: (a) remnant flooding of marsh and impounded areas, including agricultural and developed areas; (b) removal of floating and submerged aquatic vegetation; (c) scouring of marsh vegetation; and (d) water-level variations caused by normal tidal and meteorological variation between images. The new land occurring after the hurricanes contains land gains caused by the following: (1) wrack deposition, (2) rearrangement of existing marsh areas moved by storm surge, (3) aquatic vegetation that is possibly misclassified, and (4) water-level variations caused by normal tidal and meteorological variation between images. These transitory gains and losses are included in calculations of net land area change. New water areas occurred in both stable regions and in areas of historical loss. Probable losses east of the Mississippi River may approach projected losses from 2000 through 2050 based on 1978–2000 historical losses. Based on imagery of prior hurricane impacts, some of the transitory impacts may revegetate quickly in sediment-rich environments, given a paucity of recurrent storms. Hurricane surge impacts reactivate and widen existing
ponds created by prior storm surges. Land-water patterns in some areas reflect cumulative hurricane impacts.
Estimates of permanent coastwide loss will not be available for at least one or two growing seasons given the 5 months of remnant flooding that occurred in southwest Louisiana after Rita’s landfall and the persistent dry weather from October through May 2006.
The combined land loss and changes observed from Katrina and Rita occurring within 1 month of each other could potentially be the greatest observed in southern Louisiana. Coastal Louisiana may have incurred multiple hurricane impacts within a month’s span in the past, and our current coastal land-water configuration most likely bears the scars of prior storm impacts, some of which may have occurred prior to European colonization. The current annual projected 2000–2050 land loss estimate of 10.3 mi2 (26.68 km2) was based on 1978–2000 historical rates (Barras and others, 2003). Perhaps hurricanes play a greater role in shaping the coast than previously assumed, and we lack the information to conclude how these storms sculpt the Louisiana coast over time periods greater than a few decades. Our ability to quickly assess hurricane impacts has greatly improved over the past decade. The ongoing acquisition and analysis of moderate-resolution satellite imagery and available high-resolution imagery coupled with field investigations will provide a clearer picture of wetland recovery and loss in coastal Louisiana after Katrina and Rita.
Acknowledgment
The LCA Science and Technology Program partially funded part of this work.
References
Barras, J., 2003, Changes to Cote Blanche Hydrologic Restoration (TV-04) area after Hurricane Lili: U.S. Geological Survey, National Wetlands Research Center, Map ID USGS NWRC 2003-11-112, http://www.nwrc.usgs.gov/special/2003-11-112
Barras, J.A., 2006, Land area change in coastal Louisiana after the 2005 hurricanes—a series of three maps: U.S. Geological Survey Open-File Report 2006-1274, http://pubs.usgs.gov/of/2006/1274/
Barras, J.A., 2007, Satellite images and aerial photographs of the effects of Hurricanes Katrina and Rita on coastal Louisiana: U.S. Geological Survey Data Series 281, at http://pubs.usgs.gov/ds/2007/281.

113 Report Title113 Report Title112 Science and the Storms: the USGS Response to the Hurricanes of 2005
Barras, J., Beville, S., Britsch, D., Hartley, S., Hawes, S., Johnston, J., Kemp, P., Kinler, Q., Martucci, A., Porthouse, J., Reed, D., Roy, K., Sapkota, S., and Suhayda, J., 2003, Historical and projected coastal Louisiana land changes—1978-2050: U.S. Geological Survey Open-File Report 2003-334, 39 p., http://pubs.er.usgs.gov/usgspubs/ofr/ofr03334
Bernier, J.C., Morton, R.A., and Barras, J.A., 2006, Constraining rates and trends of historical wetland loss, Mississippi River delta plain, south-central Louisiana, in Xu, Y.J., and Singh, V.P., eds., Coastal environment and water quality. Proceedings of the AIH 25th Anniversary Meeting and International Conference—Challenges in Coastal Hydrology and Water Quality: Highlands Ranch, Colo., Water Resources Publications, LLC p. 371–373, http://coastal.er.usgs.gov/gc-subsidence/historical-wetland-loss.html
Braud, D.H., and Feng, W., 1998, Semi-automated construction of the Louisiana coastline digital land/water boundary using Landsat Thematic Mapper satellite imagery: Baton Rouge, Louisiana State University, Department of Geography and Anthropology, Louisiana Oil Spill Research and Development Program, technical report series 97-002.
Coastal Wetlands, Planning, Protection and Restoration Act, 1993, Reports—Louisiana coastal wetlands restoration plan: Lafayette, La., U.S. Geological Survey, National Wetlands Research Center, http://www.lacoast.gov/reports/cwcrp/1993/index.htm, accessed February 4, 2006.
Louisiana District Webmaster, 2004, Louisiana Hydrowatch, U.S. Geological Survey, http://la.water.usgs.gov/hydrowatch.htm, accessed November 7, 2006.
Louisiana Office of the State Registrar, 2002, Title 43, Part I of the Titles of the Louisiana Administrative Code: Baton Rouge, La., http://www.state.la.us/osr/lac/lactitle.htm, accessed August 9, 2006.
Morton, R., Bernier, J., Barras, J., and Fernia, N., 2005, Rapid subsidence and historical wetland loss in the Mississippi Delta Plain, likely causes and future implications: U.S. Geological Survey Open-File Report 2005-1216, 42 p., http://pubs.usgs.gov/of/2005/1216/
Twilley, R.R., and Barras, J., 2003, Formulation of the Louisiana Coastal Area Ecosystem Model, in Twilley, R.R., ed., LCA Ecosystem Restoration Plan, appendix E, p. 22–41, http://data.lca.gov/Ivan6/app/app_c_ch2.pdf.
Vincent, K.A., Aucoin, L.T., and Clark, N.S., 2000, Freshwater Bayou Wetlands (ME-04) phase 1, progress report no. 5. Open-file monitoring series ME04-MSPR-1099-5, for the period January 31, 1995, to October 10, 1999: Baton Rouge, Louisiana Department of Natural Resources, Coastal Restoration Division, http://data.lacoast.gov/reports/pr/ME04prg5.pdf
Contact InformationJohn Barras, Geographer ([email protected])U.S. Department of the InteriorU.S. Geological SurveyNational Wetlands Research CenterCoastal Restoration Field StationLouisiana State University212 Parker ColiseumBaton Rouge, LA 70894

![2012 Louisiana Coastal Master Plan [1]](https://static.fdocuments.us/doc/165x107/553390a94a79599f5e8b497e/2012-louisiana-coastal-master-plan-1.jpg)