Los Angeles County comprehensive California annual...
154
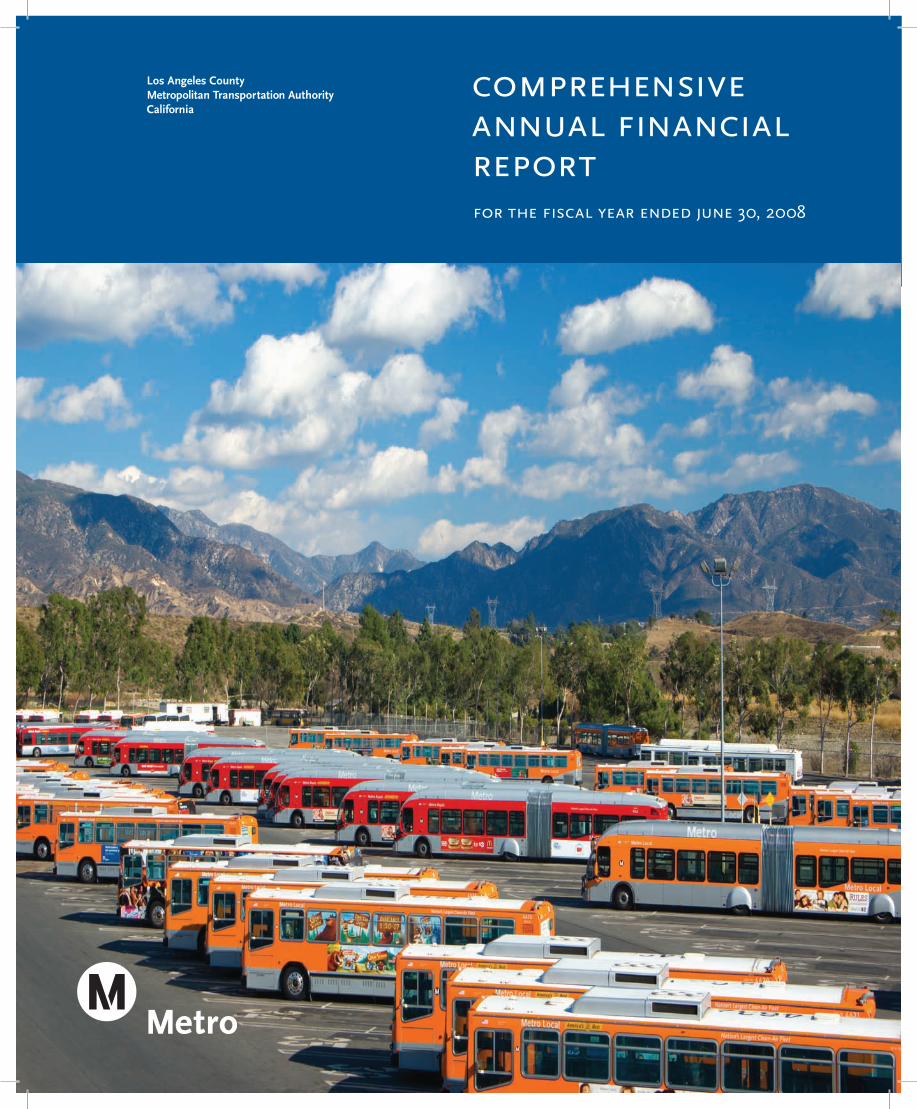
comprehensive annual financial report Los Angeles County Metropolitan Transportation Authority California for the fiscal year ended june 30, 2008
Transcript of Los Angeles County comprehensive California annual...
comprehensiveannual financialreport
Los Angeles County Metropolitan Transportation Authority California
for the fiscal year ended june 30, 2008
Los Angeles County Metropolitan Transportation Authority
California
COMPREHENSIVE ANNUAL FINANCIAL REPORT For the Fiscal Year Ended June 30, 2008
Submitted by the Accounting Department Josephine V. Nicasio, Controller Terry Matsumoto, Chief Financial Services Officer and Treasurer
i continued
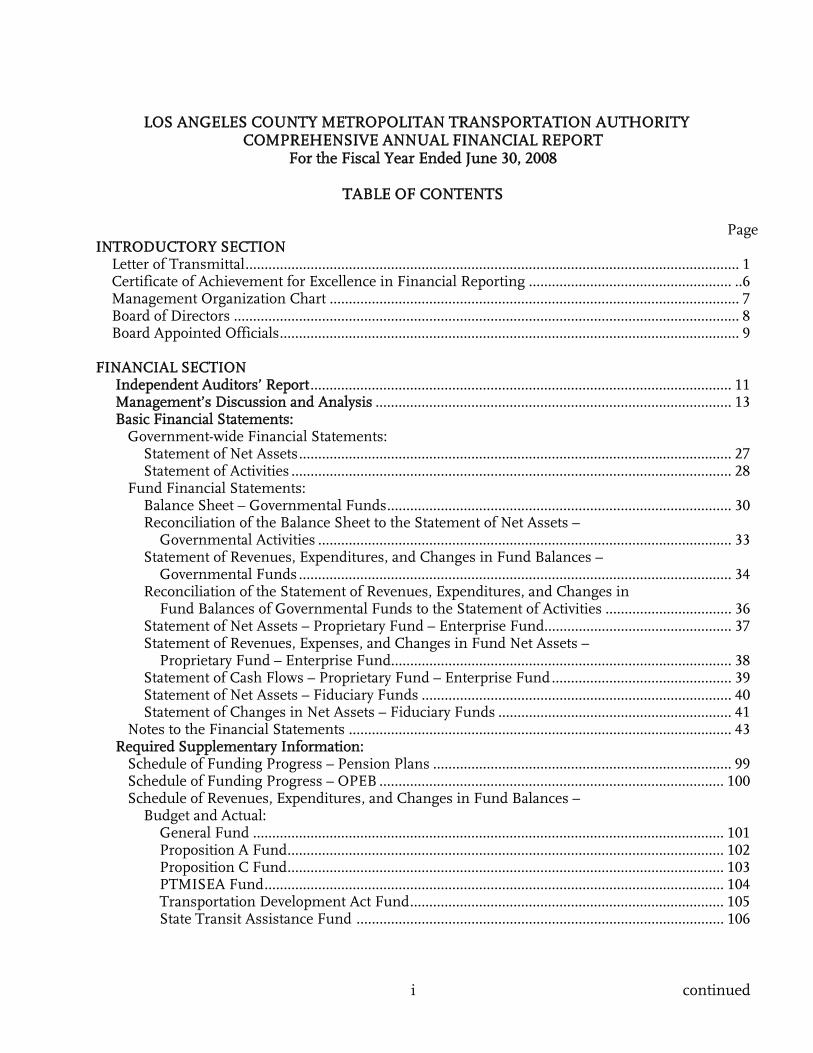
LOS ANGELES COUNTY METROPOLITAN TRANSPORTATION AUTHORITY
COMPREHENSIVE ANNUAL FINANCIAL REPORT For the Fiscal Year Ended June 30, 2008
TABLE OF CONTENTS
Page INTRODUCTORY SECTION
Letter of Transmittal................................................................................................................................. 1 Certificate of Achievement for Excellence in Financial Reporting ..................................................... ..6 Management Organization Chart ........................................................................................................... 7 Board of Directors .................................................................................................................................... 8 Board Appointed Officials........................................................................................................................ 9
FINANCIAL SECTION
Independent Auditors’ Report.............................................................................................................. 11 Management’s Discussion and Analysis ............................................................................................. 13 Basic Financial Statements:
Government-wide Financial Statements: Statement of Net Assets................................................................................................................. 27 Statement of Activities ................................................................................................................... 28
Fund Financial Statements: Balance Sheet – Governmental Funds.......................................................................................... 30 Reconciliation of the Balance Sheet to the Statement of Net Assets –
Governmental Activities ............................................................................................................ 33 Statement of Revenues, Expenditures, and Changes in Fund Balances –
Governmental Funds ................................................................................................................. 34 Reconciliation of the Statement of Revenues, Expenditures, and Changes in
Fund Balances of Governmental Funds to the Statement of Activities ................................. 36 Statement of Net Assets – Proprietary Fund – Enterprise Fund................................................. 37 Statement of Revenues, Expenses, and Changes in Fund Net Assets –
Proprietary Fund – Enterprise Fund......................................................................................... 38 Statement of Cash Flows – Proprietary Fund – Enterprise Fund............................................... 39 Statement of Net Assets – Fiduciary Funds ................................................................................. 40 Statement of Changes in Net Assets – Fiduciary Funds ............................................................. 41
Notes to the Financial Statements .................................................................................................... 43 Required Supplementary Information:
Schedule of Funding Progress – Pension Plans .............................................................................. 99 Schedule of Funding Progress – OPEB .......................................................................................... 100 Schedule of Revenues, Expenditures, and Changes in Fund Balances –
Budget and Actual: General Fund ........................................................................................................................... 101 Proposition A Fund.................................................................................................................. 102 Proposition C Fund.................................................................................................................. 103 PTMISEA Fund........................................................................................................................ 104 Transportation Development Act Fund.................................................................................. 105 State Transit Assistance Fund ................................................................................................ 106

ii
LOS ANGELES COUNTY METROPOLITAN TRANSPORTATION AUTHORITY COMPREHENSIVE ANNUAL FINANCIAL REPORT
For the Fiscal Year Ended June 30, 2008
TABLE OF CONTENTS
Other Supplementary Information Combining and Individual Fund Statements, Schedules and Supplementary Information:
Combining Balance Sheet – Nonmajor Governmental Funds ................................................. 107 Combining Statement of Revenues, Expenditures, and Changes in Fund Balances –
Nonmajor Governmental Funds............................................................................................. 108 Schedule of Revenues, Expenditures, and Changes in Fund Balances –
Nonmajor Governmental Funds – Budget and Actual: Traffic Congestion Relief Program Fund ................................................................................... 109 Service Authority for Freeway Emergency Fund ....................................................................... 110
Propositions A and C, TDA Administration Fund......................................................................111 Other Special Revenue Funds ..................................................................................................... 112
Combining Statement of Fiduciary Net Assets – Employee Retirement Trust Funds............................................................................................. 113
Combining Statement of Changes in Fiduciary Net Assets – Employee Retirement Trust Funds............................................................................................. 114
Statement of Changes in Assets and Liabilities – Agency Funds – Benefit Assessment Districts........................................................................... 115
STATISTICAL SECTION
Net Assets by Component (Table 1) ................................................................................................... 118 Changes in Net Assets (Table 2) ......................................................................................................... 119 Fund Balances of Governmental Funds (Table 3)............................................................................. 120 Changes in Fund Balances of Governmental Funds (Table 4)......................................................... 121 Governmental Activities – Sales Tax Revenues by Source (Table 5) ................................................ 122 Operating Revenues by Source (Bus and Rail) (Table 6) .................................................................. 123 Farebox Recovery Percentage by Mode (Table 7)............................................................................... 124 Ratio of Annual Debt Service Expenditures for General Bonded Debt to Total General Expenditures (Table 8)............................................................................................... 125 Historical Debt Service Coverage Ratios – Propositions A and C (Table 9) .................................... 126 Graphical Presentation of Table 9 – Propositions A and C Debt Service Coverage Ratios ............ 127 Ratios of Outstanding Debt by Type (Table 10)................................................................................. 128 Demographic and Economic Statistics (Table 11)............................................................................. 129 Los Angeles County Taxable Transactions by Type of Business (Table 12) .................................... 130 Business-type Activities – Transit Operations:
Operating Indicators by Mode (Table 13) ....................................................................................... 131 Graphical Presentation of Table 13 – Passenger Fares and Operating Expenses by Mode ......... 132 Passenger Boardings by Mode (Table 14) ....................................................................................... 133 Operating Expenses by Function (Bus and Rail) (Table 15)........................................................... 134 Full-Time Equivalent Employees by Function (Table 16)............................................................... 135
Revenues and Operating Assistance – Comparison to Transit Industry Trend (Table 17)...........136 Operating Expenses by Function – Comparison to Transit Industry Trend (Table 18).................137
Cost Per Revenue Service Hours by Mode ...................................................................................... 138 Schedule of Sources and Uses of Propositions A and C, TDA Administration Fund ................... 142
1
January 9, 2009 The Board of Directors Los Angeles County Metropolitan Transportation Authority Los Angeles, California Dear Honorable Board of Directors: Subject: Comprehensive Annual Financial Report The Comprehensive Annual Financial Report for the Los Angeles County Metropolitan Transportation Authority (LACMTA) for the fiscal year ended June 30, 2008, is submitted herewith. Responsibility for the accuracy of the data and the completeness and fairness of the presentation, including all disclosures, rests with LACMTA’s management. All material disclosures necessary to enable the reader to gain an understanding of LACMTA’s financial activities have been included. LACMTA is required to undergo an annual Single Audit in conformity with the provisions of the Single Audit Act of 1984 and the U.S. Office of Management and Budget Circular A-133, Audits of States, Local Governments and Non-Profit Organizations. Information related to the Single Audit, including the schedule of federal financial assistance, findings and recommendations, and auditor’s reports on the internal control structure and compliance with applicable laws and regulations are set forth in a separate Single Audit report. KPMG LLP, a firm of licensed certified public accountants, has issued an unqualified (“clean”) opinion on LACMTA’s financial statements for the fiscal year ended June 30, 2008. The independent auditors’ report is located at the front of the financial section of this report. Management assumes full responsibility for the completeness and reliability of information contained in this report, based upon a comprehensive framework of internal control. Because the cost of internal control should not exceed anticipated benefits, the objective of the controls is to provide reasonable, rather than absolute, assurance that the financial statements are free of any material misstatements. The management’s discussion and analysis (MD&A), shown on pages 13 to 25, provides a narrative introduction, overview, and analysis of the basic financial statements. The MD&A complements this letter of transmittal and should be read in conjunction with it.
2
Profile of the Government LACMTA was created by State of California Assembly Bill 152, Los Angeles County Metropolitan Transportation Authority Reform Act of 1992, which became effective on February 1, 1993. LACMTA is unique among the nation’s transportation agencies. It serves as transportation planner and coordinator, designer, builder and operator of one of the country’s largest and most populous counties. More than 10 million people, nearly one-third of California’s residents, live, work, and play within its 1,433-square-mile service area. As one of the largest providers of public transportation in the United States, LACMTA’s coordinated systems have nearly half a billion bus and rail boardings a year. LACMTA’s financial reports include the activities of the Public Transportation Service Corporation (PTSC), Exposition Metro Line Construction Authority (EXPO), the Service Authority for Freeway Emergencies (SAFE), and the LACMTA Leasing Authority. Although they are legally separated entities, their activities are reported as blended component units in LACMTA’s financial statements. Balancing LACMTA’s FY09 Budget – LACMTA began this process after adoption of the FY08 budget. The first step in the process was to revise the Ten-Year Forecast using known parameters and future assumptions agreed to by the Executive Management. The Ten-Year Forecast included revenue and expense forecasts and trend analysis for all funds and major programs. The Ten-Year Forecast identified potential situations where deficits might be experienced and the trend indicated that expenses will be increasing at a greater rate than revenues. The $3.4 billion FY09 adopted budget is $268 million or 8.5% more than LACMTA FY08 budget. The increase is largely for transportation subsidies for municipal bus operators, paratransit service, Metrolink commuter rail, preparation to start the new Metro Gold Line service to East Los Angeles and rehabilitation of older Metro rail cars. Budgetary Controls – LACMTA’s legal level of budgetary control is at the fund level. Comprehensive multi-year plans are adopted when major capital projects are approved and provide life-of-project budgetary control. The portion of costs expected to be incurred on each project during the fiscal year is included in annual appropriations. LACMTA maintains an encumbrance accounting system as another tool of budgetary control. The Board approves the budget by June 30 of each fiscal year. The annual budget establishes the legal level of appropriation. The budget includes operating, capital, regional funding and other components necessary to implement the policy directions contained in previously Board adopted long-term plans such as the Long Range Transportation Plan (LRTP) and the more detailed Short Range Transportation Plan (SRTP).
3
Local Economy Los Angeles County covers a geographical area of 4,084 square miles, and had a June 30, 2008 estimated population of 10.4 million; an increase of 16% since 1990. California is the nation’s most populous state and about 28% of the state’s population lives in Los Angeles County. Economy - The economy of Los Angeles County (“County”) is technology driven, including bio-medical, digital information, and environmental technology. Creativity is another key driver when fused with technology creates a vibrant industrial environment. The gross product of the County in 2007 was $464.4 billion which makes the County 18th largest national economy in the world if the County were a country. There is a diverse economic base in the County. The leading industries with their respective jobs are: 1) Business & Professional Services, 194,200; 2) Creative Industries, 346,003; 3) Financial Services, 84,800; 4) Health Services/Bio-Med, 323,400; 5) Motion Picture/TV Production, 163,000; 6) Technology, 215,000; 7) Wholesale Trade/Logistics, 135,200; and, 8) Tourism, 54,800. Los Angeles is the largest major manufacturing center in the U.S., with 446,484 workers in these activities in 2007. International trade is also a major component of the area’s economy. Major investments are being made in port and transportation facilities. Transportation service in the County is extensive. Besides the extensive freeway system, there is an array of mass transit options including various bus operators, Amtrak, Metrolink (commuter rail), and Metro Rail (subway and light rail). The County continues to face challenging economic conditions. The economic growth for California was recently stymied by the sub-prime meltdown that set off record mortgage foreclosures. The latest report for the County shows a reduction of 61.2% in single and 39.3% in multifamily housing construction permits from the prior year. Business investment in nonresidential structures has been growing but at a decelerating rate. Projects in the private sector include the “LA Live” with the Convention Center hotel in downtown Los Angeles and the W Hotel project in Hollywood. Some new attractions include the “Simpson’s” ride at Universal Studios and the Grammy Museum at “LA Live”. The “Grand Avenue Plan” is also scheduled for construction by early 2009 if funding is available. Nonfarm employment in the County realized a modest performance in 2008 and expected to improve slightly in 2009. The largest job losses in 2008 have been concentrated in construction with a loss of 10,000 jobs, finance and insurance with a loss of 5,000 jobs, and manufacturing with a loss of 5,000 jobs. Employment gains are expected to be recognized in health services with a gain of 8,500 jobs, government with a gain of 6,000 jobs, and professional, scientific and technical services with a gain of 5,000 jobs. The Consumer Price Index (CPI) for the Los Angeles-Riverside-Orange County areas for June 2008 rose by 1.1% over May in a one-month period while the CPI for June 2008 relative to June 2007 rose by 5%. The on-going fluctuation in energy prices will continue to reflect the prevailing conditions of the economy.
4
The total personal income in the County should grow by 5.0% in 2009, compared with the 3.8% increase in the consumer price index for the area. Per capita personal income in 2008 is expected to be $39,636, which would rank fourth in the region. The retail environment will remain difficult with a 1.1% decline in sales volume in 2008 and continue to decline through 2009. Long-term Financial Planning Long-term financial planning is accomplished in three stages at LACMTA: the Long Range Transportation Plan (LRTP), the Short Range Transportation Plan (SRTP), and the Ten-Year Forecast. The LRTP is a 25-year plan that is updated every 5-7 years. The LRTP is adopted by the Board and prioritizes the infrastructure projects (highway and transit) and transit services for the entire region. The SRTP is a five year plan that is updated periodically (the last being in 2003) and is also adopted by the Board. The SRTP refines the schedules and budgets for adopted LRTP projects that are occurring in the nearer term. The Ten-Year Forecast is updated annually using the current year budget as the baseline year. The LRTP and the SRTP use the most recent Ten-Year Forecast as the baseline for the period covered in those plans.
Relevant Financial Policies The Board reviews and approves an update of the financial policies each year as part of the annual budget and financial planning process. The Financial Stability Policy is divided into three sections: Goals, Strategies, and General Fiscal Policies. The purpose of the policy is to ensure that LACMTA prudently manages its financial affairs and establishes appropriate cash reserves to be able to meet its future financial commitments. Also included in the policy are Business Planning Parameters and Debt Financial Standards. The purpose of the Business Planning Parameters is to provide management with a framework for developing the following year’s budget and other LACMTA financial plans and to establish future business targets for management to achieve. The purpose of the Debt Financial Standards is to limit the level of debt that may be incurred and to ensure that debt assumptions used in financial planning are based on financial parameters similar to or more conservative than those that would be placed on LACMTA by the financial marketplace. These standards are consistent with the Board-approved Debt Policy.
Major Initiatives
In FY09, LACMTA is budgeted to buy CNG fueled high capacity buses and expects to receive130 new buses in this fiscal year and an additional 130 in FY10. These new buses will be putinto service to complete the "New Service Program", a program of 28 Rapid Bus linesthroughout the County. The final six lines operated by LACMTA will complete their first fullyear of operation in FY09 along some of the County's heaviest traveled transportationcorridors. Three additional lines will be put into service by municipal bus operators beforeJune 2009. By then, 500 Rapid buses will serve 28 transit corridors covering 420 route milesand 35 cities throughout the County.
Another major initiative for FY09 is the opening of the Gold Line Eastside extension and theextensive safety training for the community along the new rail lines.
LACMTA will continue to fund a variety of highway and other regional transportationprograms such as construction of freeway carpool lanes, freeway sound walls, streetwidening, better traffic signal coordination, grade separation at railroad crossings, bikeways,ride-sharing incentives, shuttles, and Freeway Service Patrol to help stranded motorists.
Awards
The Government Finance Officers Association of the United States and Canada (GFOA)awarded a Certificate of Achievement for Excellence in Financial Reporting to the LosAngeles County Metropolitan Transportation Authority for its comprehensive annualfinancial report for the fiscal year ended June 30, 2007. This was the ninth consecutive yearthat LACMTA has received this prestigious award. The Certificate of Achievement is thehighest form of recognition for excellence in state and local government financial reporting.
The Certificate of Achievement is valid for a period of one year only. We believe LACMTA'scurrent report continues to conform to the Certificate of Achievement programrequirements and will be submitted to the GFOA for consideration.
Acknowledgments
I wish to thank the entire staff of the Accounting Department and our fellow staff for theirdedicated service and assistance that made the preparation of this report possible.
Respectfully submitted,
atsumotoinancial Services Officer and Treasurer
5

6
7
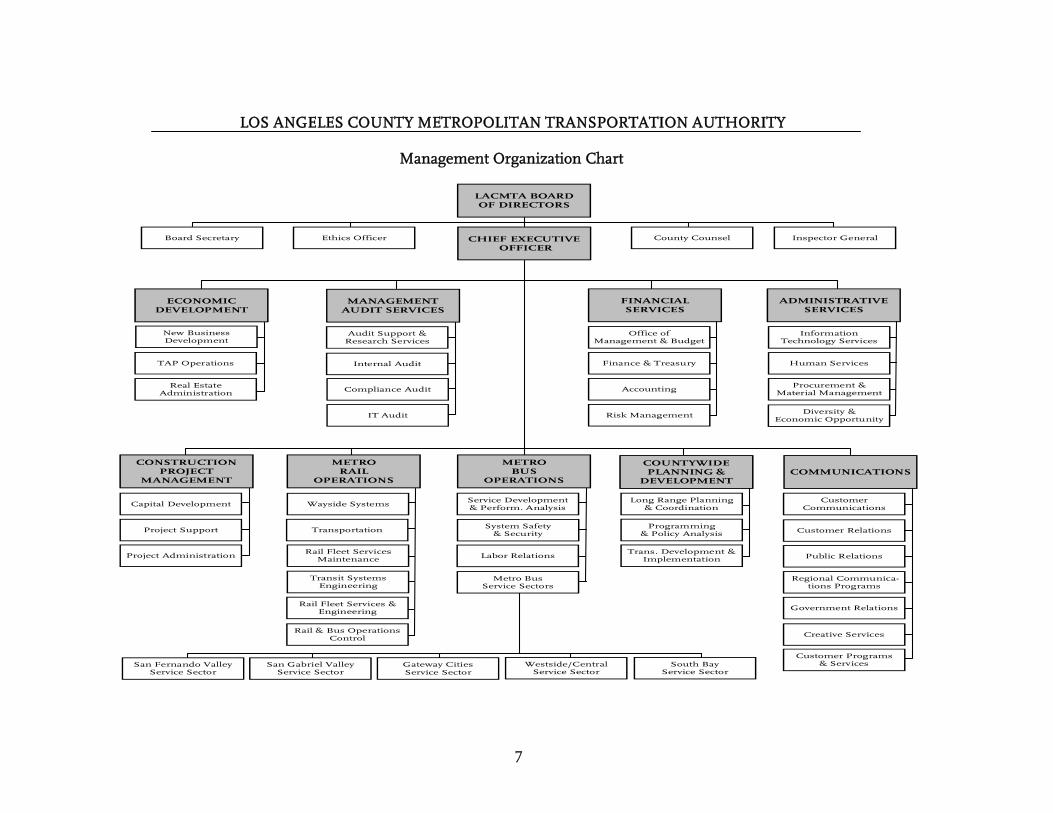
LOS ANGELES COUNTY METROPOLITAN TRANSPORTATION AUTHORITY Management Organization Chart
LACMTA BOARD OF DIRECTORS
CHIEF EXECUTIVE OFFICER
Board Secretary Ethics Officer County Counsel Inspector General
MANAGEMENT AUDIT SERVICES
FINANCIAL SERVICES
ADMINISTRATIVE SERVICES
Audit Support & Research Services
IT Audit
Finance & Treasury
Accounting
Risk Management
Compliance Audit
Internal Audit
Office of Management & Budget
Human Services
Procurement & Material Management
Information Technology Services
METRO BUS
OPERATIONS
METRO RAIL
OPERATIONS COMMUNICATIONS
CONSTRUCTION PROJECT
MANAGEMENT
COUNTYWIDE PLANNING &
DEVELOPMENT
System Safety & Security
Service Development & Perform. Analysis
Labor Relations
Rail Fleet Services & Engineering
Wayside Systems
Transportation
Rail Fleet Services Maintenance
Transit Systems Engineering
Long Range Planning & Coordination
Trans. Development & Implementation
Programming & Policy Analysis
Customer Communications
Customer Relations
Customer Programs & Services
Creative Services
Public Relations
Regional Communica-tions Programs
Government Relations
Capital Development
Project Support
Project Administration
ECONOMIC DEVELOPMENT
New Business Development
TAP Operations
Real Estate Administration
Metro Bus Service Sectors
Diversity & Economic Opportunity
San Fernando Valley Service Sector
San Gabriel Valley Service Sector
Gateway Cities Service Sector
South Bay Service Sector
Westside/Central Service Sector
Rail & Bus Operations Control

8
LOS ANGELES COUNTY METROPOLITAN TRANSPORTATION AUTHORITY
Board of Directors
(Updated as of July 2008)
Antonio R. Villaraigosa Chairman of the Board
Mayor, City of Los Angeles
Don Knabe
1st Vice Chair LA County Supervisor
4th Supervisorial District
Ara Najarian
2nd Vice Chair City Council Member
City of Glendale
Michael D. Antonovich LA County Supervisor
5th Supervisorial District
Yvonne B. Burke
LA County Supervisor 2nd Supervisorial District
John Fasana
City Council Member City of Duarte
David W. Fleming Mayor Appointee
City of Los Angeles
Richard Katz
Mayor Appointee City of Los Angeles
Bonnie Lowenthal
City Council Member City of Long Beach
Gloria Molina
LA County Supervisor 1st Supervisorial District
Pam O’Connor
City Council Member City of Santa Monica
Bernard Parks
Mayor Appointee City of Los Angeles
Zev Yaroslavsky
LA County Supervisor 3rd Supervisorial District
Douglas Failing
Ex-officio Member Appointed by Governor
9
LOS ANGELES COUNTY METROPOLITAN TRANSPORTATION AUTHORITY
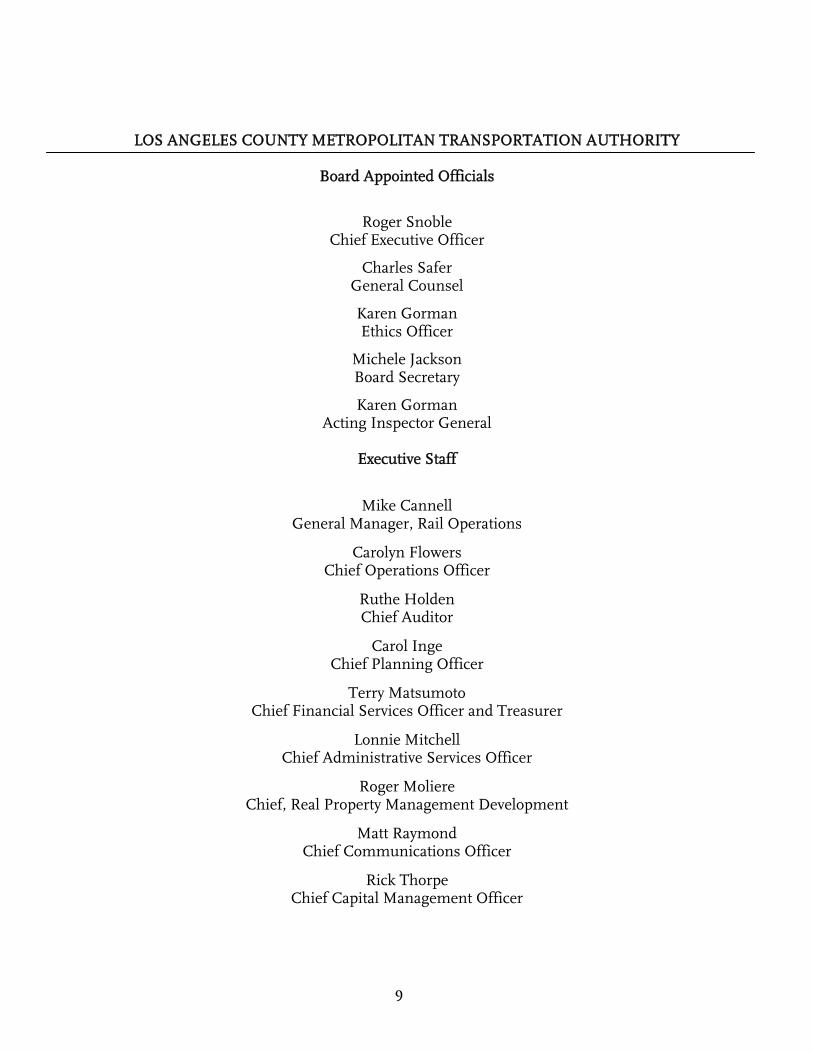
Board Appointed Officials
Roger Snoble Chief Executive Officer
Charles Safer General Counsel
Karen Gorman Ethics Officer
Michele Jackson Board Secretary
Karen Gorman Acting Inspector General
Executive Staff
Mike Cannell General Manager, Rail Operations
Carolyn Flowers Chief Operations Officer
Ruthe Holden Chief Auditor
Carol Inge Chief Planning Officer
Terry Matsumoto Chief Financial Services Officer and Treasurer
Lonnie Mitchell Chief Administrative Services Officer
Roger Moliere Chief, Real Property Management Development
Matt Raymond Chief Communications Officer
Rick Thorpe Chief Capital Management Officer

10
THIS PAGE INTENTIONALLY LEFT BLANK
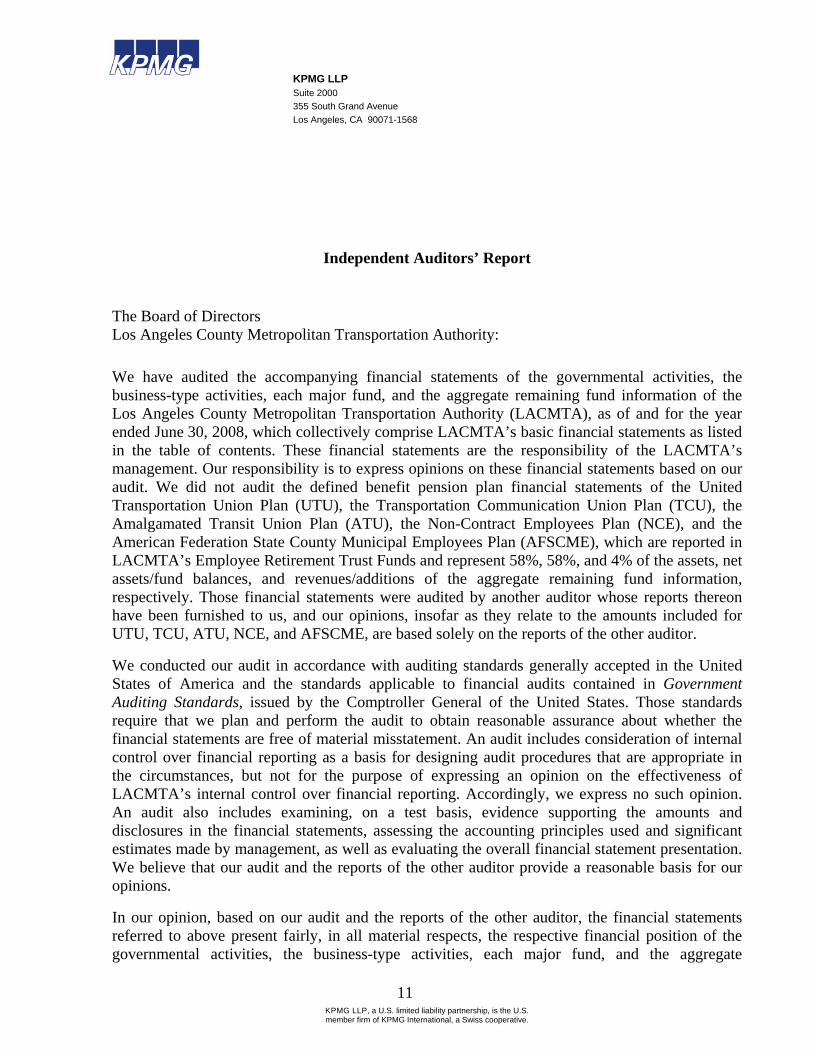
KPMG LLP Suite 2000 355 South Grand Avenue Los Angeles, CA 90071-1568
KPMG LLP, a U.S. limited liability partnership, is the U.S. member firm of KPMG International, a Swiss cooperative.
11
Independent Auditors’ Report
The Board of Directors Los Angeles County Metropolitan Transportation Authority:
We have audited the accompanying financial statements of the governmental activities, the business-type activities, each major fund, and the aggregate remaining fund information of the Los Angeles County Metropolitan Transportation Authority (LACMTA), as of and for the year ended June 30, 2008, which collectively comprise LACMTA’s basic financial statements as listed in the table of contents. These financial statements are the responsibility of the LACMTA’s management. Our responsibility is to express opinions on these financial statements based on our audit. We did not audit the defined benefit pension plan financial statements of the United Transportation Union Plan (UTU), the Transportation Communication Union Plan (TCU), the Amalgamated Transit Union Plan (ATU), the Non-Contract Employees Plan (NCE), and the American Federation State County Municipal Employees Plan (AFSCME), which are reported in LACMTA’s Employee Retirement Trust Funds and represent 58%, 58%, and 4% of the assets, net assets/fund balances, and revenues/additions of the aggregate remaining fund information, respectively. Those financial statements were audited by another auditor whose reports thereon have been furnished to us, and our opinions, insofar as they relate to the amounts included for UTU, TCU, ATU, NCE, and AFSCME, are based solely on the reports of the other auditor.
We conducted our audit in accordance with auditing standards generally accepted in the United States of America and the standards applicable to financial audits contained in Government Auditing Standards, issued by the Comptroller General of the United States. Those standards require that we plan and perform the audit to obtain reasonable assurance about whether the financial statements are free of material misstatement. An audit includes consideration of internal control over financial reporting as a basis for designing audit procedures that are appropriate in the circumstances, but not for the purpose of expressing an opinion on the effectiveness of LACMTA’s internal control over financial reporting. Accordingly, we express no such opinion. An audit also includes examining, on a test basis, evidence supporting the amounts and disclosures in the financial statements, assessing the accounting principles used and significant estimates made by management, as well as evaluating the overall financial statement presentation. We believe that our audit and the reports of the other auditor provide a reasonable basis for our opinions.
In our opinion, based on our audit and the reports of the other auditor, the financial statements referred to above present fairly, in all material respects, the respective financial position of the governmental activities, the business-type activities, each major fund, and the aggregate
12
remaining fund information of the Los Angeles County Metropolitan Transportation Authority, as of June 30, 2008, and the respective changes in financial position, and where applicable, cash flows thereof for the year then ended in conformity with U.S. generally accepted accounting principles.
As discussed in note U in the notes to the financial statements, the LACMTA adopted the provisions of Governmental Accounting Standards Board (GASB) Statement No. 43, Financial Reporting for Postemployment Benefit Plans Other Than Pension Plans, Statement No. 45, Accounting and Financial Reporting by Employers for Postemployment Benefits Other Than Pensions, and Statement No. 50, Pension Disclosures an amendment of GASB Statements No. 25 and No. 27, effective July 1, 2007.
In accordance with Government Auditing Standards, we have also issued our report dated January 9, 2009 on our consideration of LACMTA’s internal control over financial reporting and on our tests of its compliance with certain provisions of laws, regulations, contracts, and grant agreements and other matters. The purpose of that report is to describe the scope of our testing of internal control over financial reporting and compliance and the results of that testing, and not to provide an opinion on the internal control over financial reporting or on compliance. That report is an integral part of an audit performed in accordance with Government Auditing Standards and should be considered in assessing the results of our audit.
The management’s discussion and analysis on pages 13 through 25, the schedule of funding progress for pension plans and other postemployment benefits on pages 99 and 100, respectively, and the budgetary comparison information on pages 101 through 106 are not a required part of the basic financial statements but are supplementary information required by U.S. generally accepted accounting principles. We have applied certain limited procedures, which consisted principally of inquiries of management regarding the methods of measurement and presentation of the required supplementary information. However, we did not audit the information and express no opinion on it.
Our audit was conducted for the purpose of forming opinions on the financial statements that collectively comprise LACMTA’s basic financial statements. The accompanying introductory section, statistical section and the other supplementary information on pages 107 through 143 are presented for purposes of additional analysis and are not a required part of the basic financial statements. The combining and individual fund financial statements and schedules have been subjected to the auditing procedures applied in the audit of the basic financial statements and, in our opinion, are fairly stated in all material respects in relation to the basic financial statements taken as a whole. The introductory and statistical sections have not been subjected to the auditing procedures applied in the audit of the basic financial statements, and accordingly, we express no opinion on them.
January 9, 2009
MANAGEMENT’S DISCUSSION AND ANALYSIS
13
As management of the Los Angeles County Metropolitan Transportation Authority (LACMTA), we offer readers of our financial statements this narrative overview and analysis. It is designed to:
• Provide an overview of LACMTA’s financial activities; • Highlight significant financial issues; • Discuss changes in LACMTA’s financial position; • Explain any material deviations from the approved budget; and • Identify individual fund issues.
We encourage readers to consider information presented here in conjunction with the letter of transmittal (beginning on page 1) and the financial statements (beginning on page 27). All dollar amounts are expressed in thousands unless otherwise indicated.
Financial Highlights
• LACMTA’s total assets exceeded its liabilities as of June 30, 2008 by $6,657,713. Of
this amount, $208,604 is reported as unrestricted net assets. • Total net assets increased by $225,822 (3.5 percent) this year over last year. Business-
type net assets increased by $237,193 (5.8 percent) and governmental net assets decreased by $11,371 (0.5 percent). The increase in the business-type activities net assets is primarily due to implementation of GASB 45 (OPEB), increase in passenger fare revenues and operating subsidies. Net assets in the governmental activities decreased due to write off of investment in other agencies.
• At year-end, the governmental funds reported fund balances totaling $1,605,095. Of
this amount, $659,697 is reserved for encumbrances and other commitments, and $945,398 is unreserved fund balance available for spending at LACMTA’s discretion.
• LACMTA’s total liabilities decreased by $259,488 (4.7 percent) during the year. The
decrease in liabilities is primarily due to implementation of GASB 45 (OPEB) and redemption and payment of bonds.
Overview of the Financial Statements
This discussion and analysis is intended to serve as an introduction to LACMTA’s basic financial statements. LACMTA’s basic financial statements comprise three components: (1) the government-wide financial statements; (2) the fund financial statements; and (3) notes to the financial statements. This report also contains other supplementary information in addition to the basic financial statements.
14
Government-wide Financial Statements The government-wide financial statements provide a broad overview of LACMTA’s finances in a manner similar to private-sector entities. The statement of net assets (page 27) presents information on all of LACMTA’s assets and liabilities, with the difference between the two being reported as net assets. Trends of increasing or decreasing net assets may serve as useful indicators of financial health. The statement of activities (pages 28 to 29) shows how net assets changed during the year. It reports these changes when the underlying event occurs (total economic resources measurement focus) regardless of the timing of related cash flows. It shows the gross and net costs of LACMTA’s functions. Both of the government-wide financial statements distinguish between those functions that are intended to recover a significant portion of their costs from user fees and charges (business-type activities) and those functions that are principally supported by intergovernmental revenues (governmental activities). The government-wide financial statements include LACMTA and its legally separate entities that are financially accountable to LACMTA. Since they are in substance part of LACMTA’s operations, their information has been blended with LACMTA’s information. These entities include Public Transportation Services Corporation (PTSC), the Service Authority for Freeway Emergencies (SAFE), the LACMTA Leasing Authority, and the Exposition Metro Line Construction Authority (EXPO). Fund Financial Statements A fund is a group of related accounts that is distinguished by specific activities or objectives in accordance with special regulations or restrictions. LACMTA uses fund accounting to ensure and demonstrate compliance with legal requirements. All of LACMTA’s funds are divided into three categories: proprietary, governmental, and fiduciary. Proprietary Funds LACMTA maintains only one type of proprietary fund: the Enterprise fund. All transit-related transactions, including support services, capital and related debt transactions are in the Enterprise fund. The Enterprise fund is used to report the type of functions presented in the business-type activities in the government-wide financial statements. LACMTA uses the Enterprise fund to account for its transit operations: bus, rail, and regional programs. The basic proprietary fund financial statements are on pages 37 to 39.
15
Governmental Funds Governmental funds are used to account for the functions reported as governmental activities in the government-wide financial statements. Unlike the government-wide financial statements, governmental funds use the current financial resources measurement focus. Thus, they report near term inflows, outflows, and balances of spendable resources. The basic governmental fund financial statements are on pages 30 to 31 and 34 to 35. Since the focus of governmental funds is narrower than that of the government-wide financial statements, it is useful to compare the information presented for governmental funds with similar information provided for governmental activities in the government-wide financial statements. As a result, readers may better understand the long-term impact of the government’s near-term financing decisions. Reconciliation statements on pages 33 and 36 are shown to facilitate the comparison between the government funds and the government-wide financials. LACMTA maintains ten individual governmental funds, six of which are considered major funds. Individual fund data for the major funds are presented in the governmental fund balance sheet and governmental fund statement of revenues, expenditures, and changes in fund balances. Individual fund data for the non-major governmental funds are presented on pages 107 to 108. LACMTA adopts a spending plan each year. Budgetary comparison schedules are provided for the General fund and for each major special revenue fund on pages 101-106, and for each non-major fund on pages 109 to 111 and the aggregate remaining special revenue funds on page 112. Fiduciary Funds Fiduciary funds are used to account for assets held by LACMTA in a trustee capacity or as an agent. Since these assets are not available to fund LACMTA’s programs, they are excluded from the government-wide financial statements. The basic fiduciary fund statements can be found on pages 40 to 41. They include the five employee pension funds administered by LACMTA, the Other Postemployment Benefits Trust Fund and two Benefit Assessment Districts, which were formed to assist in the financing of a portion of the countywide rail rapid transit system. Notes to the Financial Statements Various disclosures accompany the government-wide and fund financial statements in order to provide a full understanding of LACMTA’s finances. The notes to the financial statements are on pages 43 to 98.
16
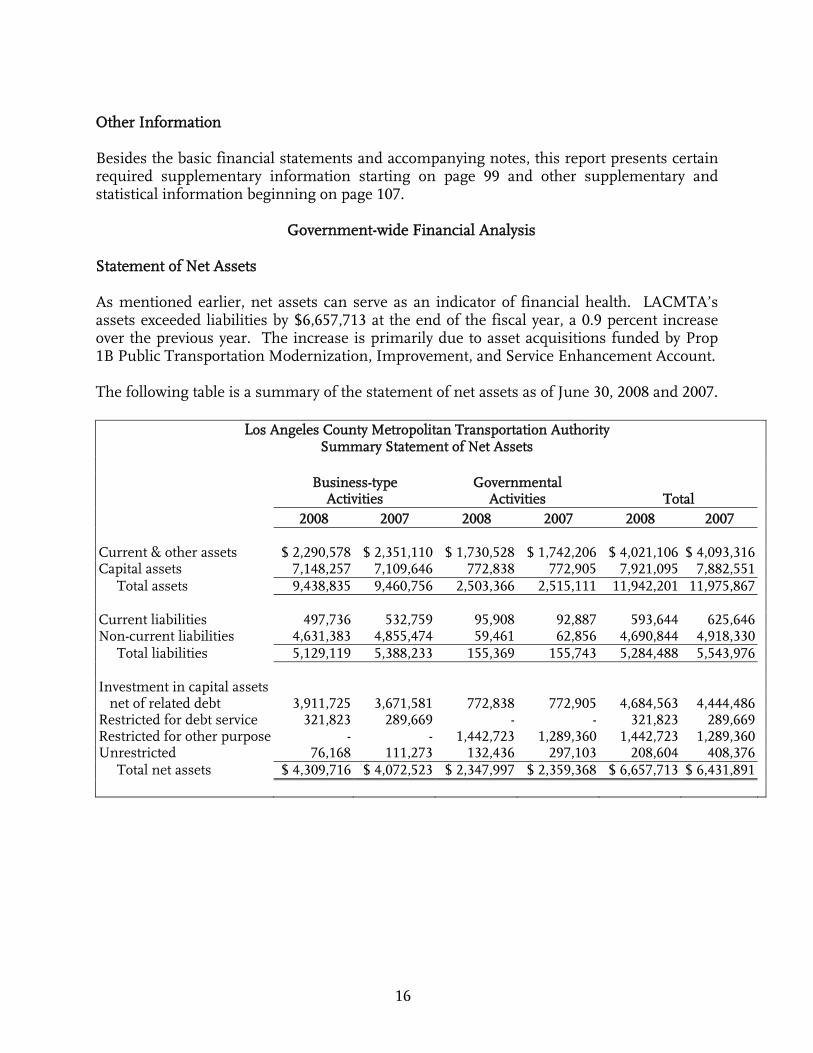
Other Information Besides the basic financial statements and accompanying notes, this report presents certain required supplementary information starting on page 99 and other supplementary and statistical information beginning on page 107. Government-wide Financial Analysis Statement of Net Assets As mentioned earlier, net assets can serve as an indicator of financial health. LACMTA’s assets exceeded liabilities by $6,657,713 at the end of the fiscal year, a 0.9 percent increase over the previous year. The increase is primarily due to asset acquisitions funded by Prop 1B Public Transportation Modernization, Improvement, and Service Enhancement Account. The following table is a summary of the statement of net assets as of June 30, 2008 and 2007.
Los Angeles County Metropolitan Transportation Authority Summary Statement of Net Assets
Business-type
Activities Governmental
Activities Total 2008 2007 2008 2007 2008 2007
Current & other assets $ 2,290,578 $ 2,351,110 $ 1,730,528 $ 1,742,206 $ 4,021,106 $ 4,093,316 Capital assets 7,148,257 7,109,646 772,838 772,905 7,921,095 7,882,551 Total assets 9,438,835 9,460,756 2,503,366 2,515,111 11,942,201 11,975,867 Current liabilities 497,736 532,759 95,908 92,887 593,644 625,646 Non-current liabilities 4,631,383 4,855,474 59,461 62,856 4,690,844 4,918,330 Total liabilities 5,129,119 5,388,233 155,369 155,743 5,284,488 5,543,976 Investment in capital assets net of related debt 3,911,725 3,671,581 772,838 772,905 4,684,563 4,444,486 Restricted for debt service 321,823 289,669 - - 321,823 289,669 Restricted for other purpose - - 1,442,723 1,289,360 1,442,723 1,289,360 Unrestricted 76,168 111,273 132,436 297,103 208,604 408,376 Total net assets $ 4,309,716 $ 4,072,523 $ 2,347,997 $ 2,359,368 $ 6,657,713 $ 6,431,891
17
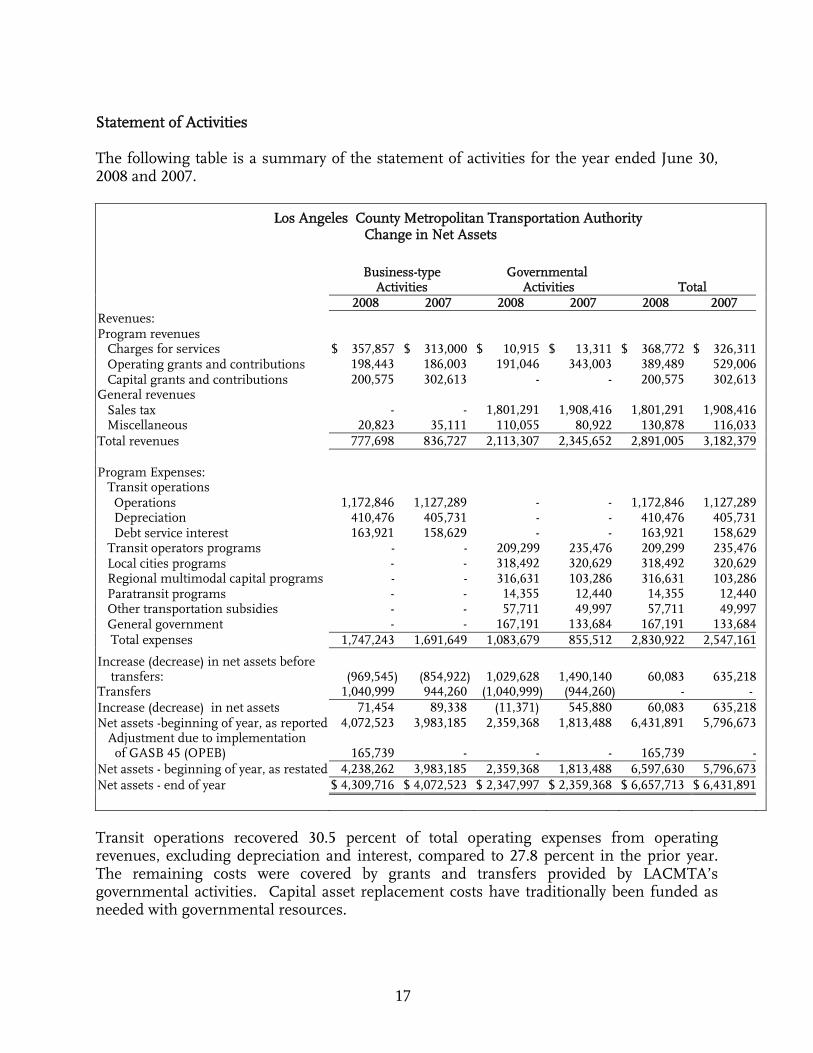
Statement of Activities The following table is a summary of the statement of activities for the year ended June 30, 2008 and 2007.
Los Angeles County Metropolitan Transportation Authority Change in Net Assets
Business-type
Activities Governmental
Activities Total 2008 2007 2008 2007 2008 2007
Revenues: Program revenues Charges for services $ 357,857 $ 313,000 $ 10,915 $ 13,311 $ 368,772 $ 326,311 Operating grants and contributions 198,443 186,003 191,046 343,003 389,489 529,006 Capital grants and contributions 200,575 302,613 - - 200,575 302,613 General revenues Sales tax - - 1,801,291 1,908,416 1,801,291 1,908,416 Miscellaneous 20,823 35,111 110,055 80,922 130,878 116,033 Total revenues 777,698 836,727 2,113,307 2,345,652 2,891,005 3,182,379 Program Expenses: Transit operations Operations 1,172,846 1,127,289 - - 1,172,846 1,127,289 Depreciation 410,476 405,731 - - 410,476 405,731 Debt service interest 163,921 158,629 - - 163,921 158,629 Transit operators programs - - 209,299 235,476 209,299 235,476 Local cities programs - - 318,492 320,629 318,492 320,629 Regional multimodal capital programs - - 316,631 103,286 316,631 103,286 Paratransit programs - - 14,355 12,440 14,355 12,440 Other transportation subsidies - - 57,711 49,997 57,711 49,997 General government - - 167,191 133,684 167,191 133,684 Total expenses 1,747,243 1,691,649 1,083,679 855,512 2,830,922 2,547,161
Increase (decrease) in net assets before transfers: (969,545) (854,922) 1,029,628 1,490,140 60,083 635,218 Transfers 1,040,999 944,260 (1,040,999) (944,260) - - Increase (decrease) in net assets 71,454 89,338 (11,371) 545,880 60,083 635,218 Net assets -beginning of year, as reported 4,072,523 3,983,185 2,359,368 1,813,488 6,431,891 5,796,673 Adjustment due to implementation of GASB 45 (OPEB) 165,739 - - - 165,739 - Net assets - beginning of year, as restated 4,238,262 3,983,185 2,359,368 1,813,488 6,597,630 5,796,673 Net assets - end of year $ 4,309,716 $ 4,072,523 $ 2,347,997 $ 2,359,368 $ 6,657,713 $ 6,431,891 Transit operations recovered 30.5 percent of total operating expenses from operating revenues, excluding depreciation and interest, compared to 27.8 percent in the prior year. The remaining costs were covered by grants and transfers provided by LACMTA’s governmental activities. Capital asset replacement costs have traditionally been funded as needed with governmental resources.
18
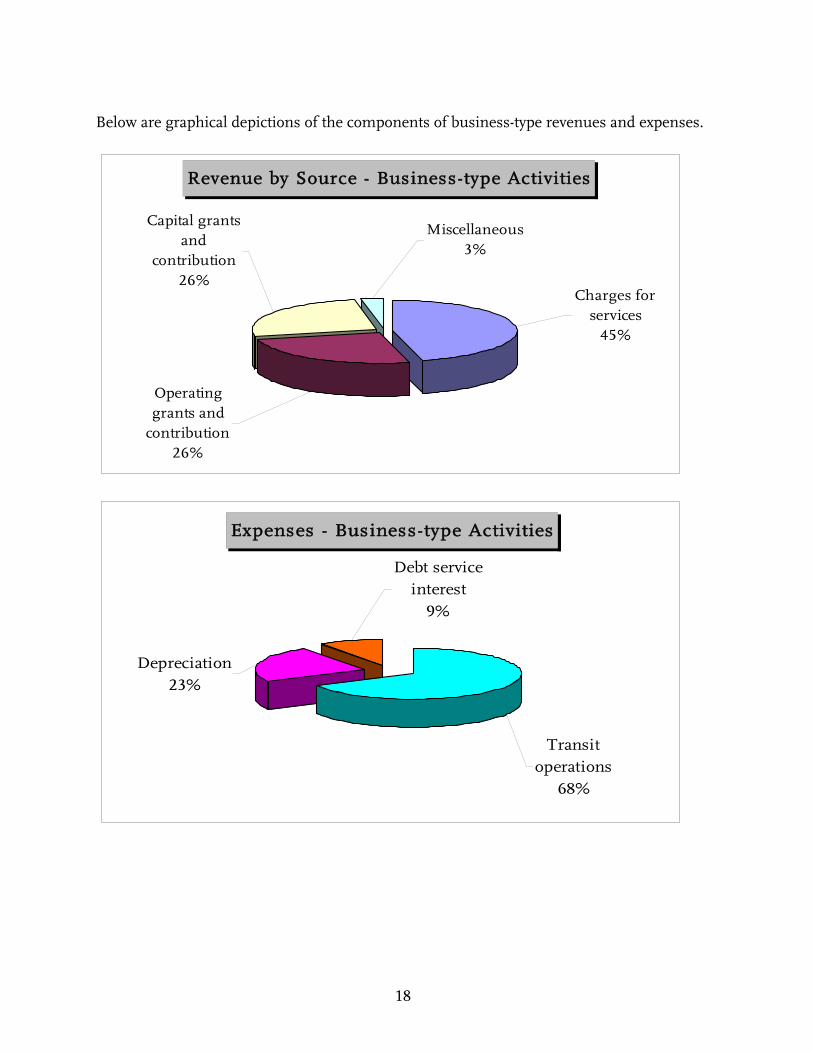
Below are graphical depictions of the components of business-type revenues and expenses.
Revenue by Source - Business-type Activities
Capital grants and
contribution26%
Operating grants and
contribution26%
Charges for services
45%
Miscellaneous3%
Expenses - Business-type Activities
Transit operations
68%
Depreciation23%
Debt service interest
9%

19
Governmental activities decreased LACMTA’s net assets by $11,371. Most of the governmental activities are subsidies related to countywide transportation planning and development programs. These programs are primarily funded by local sales tax. Subsidies totaling $916,488 to other agencies represented the largest governmental expenses, and consisted of the pass-through of state and local funding to other agencies in Los Angeles County for public transit, transportation demand management, bikeways, and highway projects. Additionally, the increase in regional multimodal capital program expenses is the result of LACMTA’s writing-off its investments in other agencies during fiscal year 2008 given potential contingencies associated with rail accidents of the Southern California Regional Rail Authority. Below are graphical depictions of the components of governmental revenues and expenses.
Revenue by Source - Governmental Activities
Sales tax85%
Operating grants and
contributions9%
Charges for services
1%
Miscellaneous5%
Expenses - Governmental Activities
General government
16%
Other transportation
subsidies5%
Paratransit program
1%
Regional multimodal
capital programs
29%
Local cities programs
30%
Transit operators program
19%
20
Financial Analysis of LACMTA’s Funds
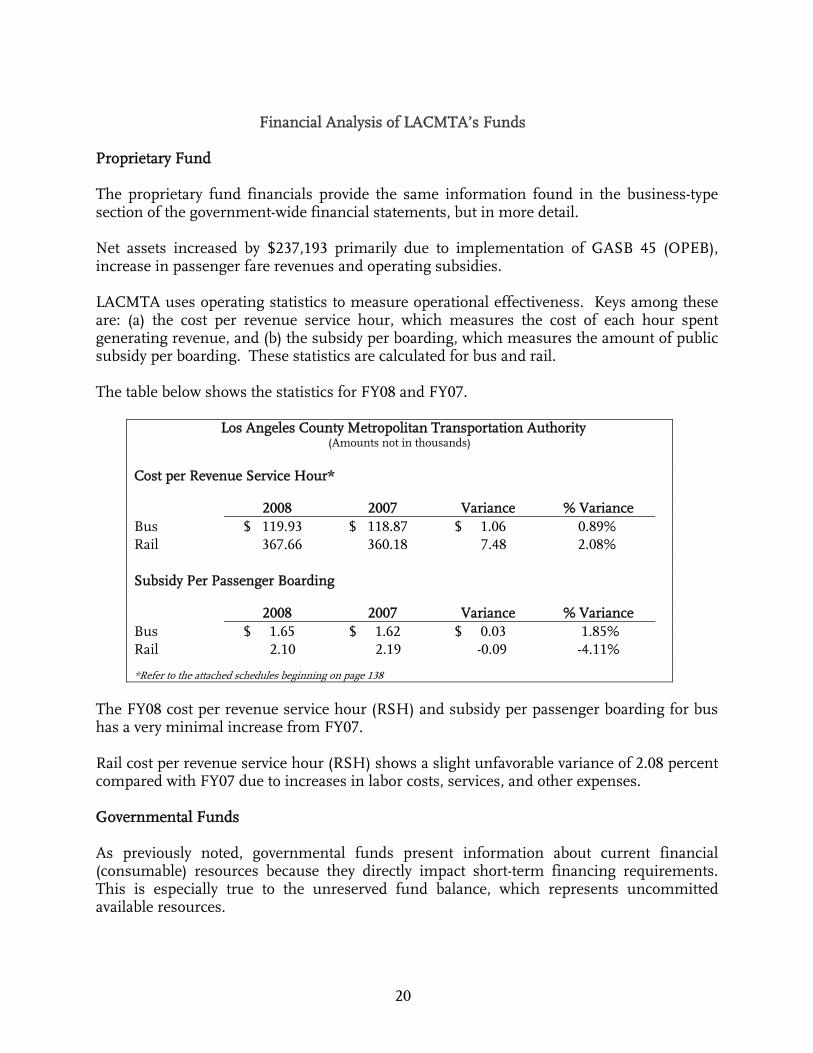
Proprietary Fund The proprietary fund financials provide the same information found in the business-type section of the government-wide financial statements, but in more detail. Net assets increased by $237,193 primarily due to implementation of GASB 45 (OPEB), increase in passenger fare revenues and operating subsidies. LACMTA uses operating statistics to measure operational effectiveness. Keys among these are: (a) the cost per revenue service hour, which measures the cost of each hour spent generating revenue, and (b) the subsidy per boarding, which measures the amount of public subsidy per boarding. These statistics are calculated for bus and rail. The table below shows the statistics for FY08 and FY07.
Los Angeles County Metropolitan Transportation Authority (Amounts not in thousands)
Cost per Revenue Service Hour* 2008 2007 Variance % Variance Bus $ 119.93 $ 118.87 $ 1.06 0.89% Rail 367.66 360.18 7.48 2.08% Subsidy Per Passenger Boarding 2008 2007 Variance % Variance Bus $ 1.65 $ 1.62 $ 0.03 1.85% Rail 2.10 2.19 -0.09 -4.11% *Refer to the attached schedules beginning on page 138
The FY08 cost per revenue service hour (RSH) and subsidy per passenger boarding for bus has a very minimal increase from FY07. Rail cost per revenue service hour (RSH) shows a slight unfavorable variance of 2.08 percent compared with FY07 due to increases in labor costs, services, and other expenses. Governmental Funds As previously noted, governmental funds present information about current financial (consumable) resources because they directly impact short-term financing requirements. This is especially true to the unreserved fund balance, which represents uncommitted available resources.
21
LACMTA’s governmental funds ended the fiscal year with $1,605,095 in total fund balances. Approximately 41.1 percent of this amount has been committed to future programs. The major governmental funds are discussed below. General fund balance decreased by $6,639 primarily due to increased funding for bus operations, bus and facilities maintenance. During the fiscal year, $5,280 in professional service was spent in administering the Rideshare Services program. Proposition A fund balance decreased by $108,067 mainly due to increased funding for bus and rail capital and operating expenses. Of the $196,639 fund balance, $76,562 is reserved for future programs. Proposition C fund balance increased by $189,793 primarily due to funds received from Proposition A and reduced funding for bus and rail capital and operating expenses. Of the $578,028 fund balance, $338,445 is reserved for future programs. Proposition 1B Public Transportation Modernization, Improvement and Service Enhancement Account (PTMISEA) funding became available this fiscal year. Initial funds received from the State amounted to $161,771 inclusive of interest income earned. The fund provided $69,378 for bus procurement and rehabilitation, and $39,751 for the Exposition Light Rail Project. $52,624 remains in the fund balance at the end of the year. The TDA fund balance increased by $28,342 as expenditures for administration of bus operations and the bus midlife program were lower than planned due to project delays. Approximately 91.3 percent of the $201,386 fund balance is reserved for future projects. The STA fund balance decreased by $25,640 because of lower sales tax remittances received from the State. Approximately 82.7 percent of the $44,436 fund balance is reserved for future projects. STA sales tax revenues were under budget by $35,084 due to a delay by the State in distributing the last quarter allocation. General Fund Budgetary Highlights The general fund includes activities associated with government that are not legally or otherwise required to be accounted for in another fund. It accounts for only 2.6 percent of LACMTA’s total governmental funds revenues, while expenditures represent 2.2 percent of total governmental funds expenditures. During the year, the original budget was increased by $384. The components of the budget increase were $200 for Transit Planning and $184 for Employee Activities. Revenues The primary sources of revenues are the federal alternative fuel tax credit receipts, rental income from inactive rights-of-way, joint development projects, investment income, Federal, State, and local grants, and high occupancy vehicles (HOV) lane fines.
22
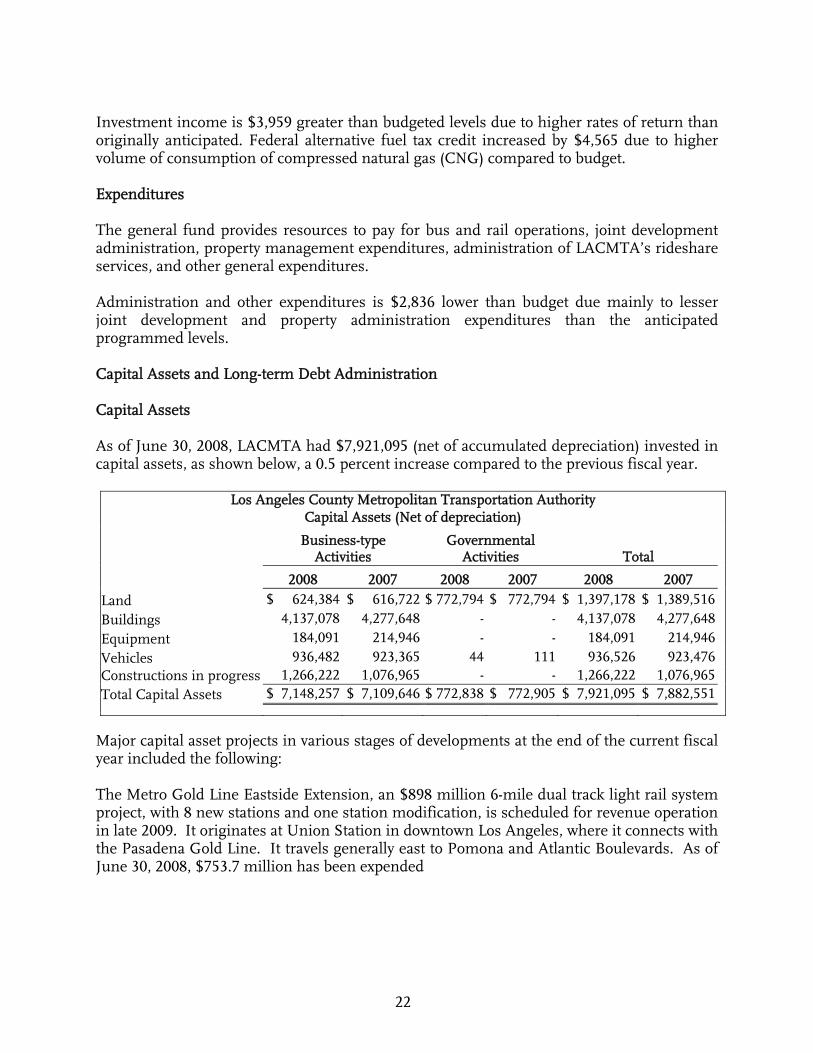
Investment income is $3,959 greater than budgeted levels due to higher rates of return than originally anticipated. Federal alternative fuel tax credit increased by $4,565 due to higher volume of consumption of compressed natural gas (CNG) compared to budget. Expenditures The general fund provides resources to pay for bus and rail operations, joint development administration, property management expenditures, administration of LACMTA’s rideshare services, and other general expenditures. Administration and other expenditures is $2,836 lower than budget due mainly to lesser joint development and property administration expenditures than the anticipated programmed levels. Capital Assets and Long-term Debt Administration Capital Assets As of June 30, 2008, LACMTA had $7,921,095 (net of accumulated depreciation) invested in capital assets, as shown below, a 0.5 percent increase compared to the previous fiscal year.
Los Angeles County Metropolitan Transportation Authority Capital Assets (Net of depreciation)
Business-type Activities
Governmental Activities Total
2008 2007 2008 2007 2008 2007 Land $ 624,384 $ 616,722 $ 772,794 $ 772,794 $ 1,397,178 $ 1,389,516 Buildings 4,137,078 4,277,648 - - 4,137,078 4,277,648 Equipment 184,091 214,946 - - 184,091 214,946 Vehicles 936,482 923,365 44 111 936,526 923,476 Constructions in progress 1,266,222 1,076,965 - - 1,266,222 1,076,965 Total Capital Assets $ 7,148,257 $ 7,109,646 $ 772,838 $ 772,905 $ 7,921,095 $ 7,882,551
Major capital asset projects in various stages of developments at the end of the current fiscal year included the following: The Metro Gold Line Eastside Extension, an $898 million 6-mile dual track light rail system project, with 8 new stations and one station modification, is scheduled for revenue operation in late 2009. It originates at Union Station in downtown Los Angeles, where it connects with the Pasadena Gold Line. It travels generally east to Pomona and Atlantic Boulevards. As of June 30, 2008, $753.7 million has been expended
23
The Exposition Light Rail Project is an $862 million project. The project is approximately 8.6 miles long, extending from Downtown Los Angeles to Culver City. It will operate in a dual track configuration on Flower Street and the Exposition Boulevard right-of-way corridor. It will have 10 stations, consisting of two existing stations and eight new stations. Two of the new stations will be aerial. The project is electrically powered from overhead power lines. As of June 30, 2008, $158.2 million has been expended. The Universal Fare System (UFS) is a $97.6 million project designed to improve LACMTA’s fare collection on the bus and rail systems. Installation of UFS fareboxes and ticket vending machines on LACMTA was completed. Other transit operators will operate the UFS equipment as part of the regional system known as TAP (Transit Access Pass). TAP will utilize non-contact smart cards to provide seamless fare collection among the region’s transit operators. As of June 30, 2008, all equipment and communication infrastructure are fully in placed and functional. LACMTA entered into a $68 million contract to enhance UFS operation by adding an advanced gating system and related services to deter fare evasion, improve system security and capture ridership data. Design and preliminary engineering work for the gating project started in February 2008. As of June 30, 2008, $600 thousand has been expended. A major bus acquisition project during FY08 was the purchase of 95 60-foot CNG high capacity articulated buses. All buses were received and put into service as of June 30, 2008. As of June 30, 2008, $85.5 million has been expended. LACMTA entered into a Light Rail Vehicle Base Contract to acquire fifty (50) light rail vehicles (LRV), including spare parts, special tools and equipment. As of June 30, 2008, eleven (11) vehicles were received and four (4) were already in revenue service. As of June 30, 2008, $65.3 million has been expended. LACMTA started the Solar Panel Energy project, a 417 (not in thousands) kilowatt solar panel system with an estimated 1,600 (not in thousands) individual solar panels. At the completion of this energy saving project, LACMTA will receive a rebate of $1.6 million from the Gas Company. As of June 30, 2008, $3.3 million has been expended. Additional information on capital assets can be found on page 61.
24
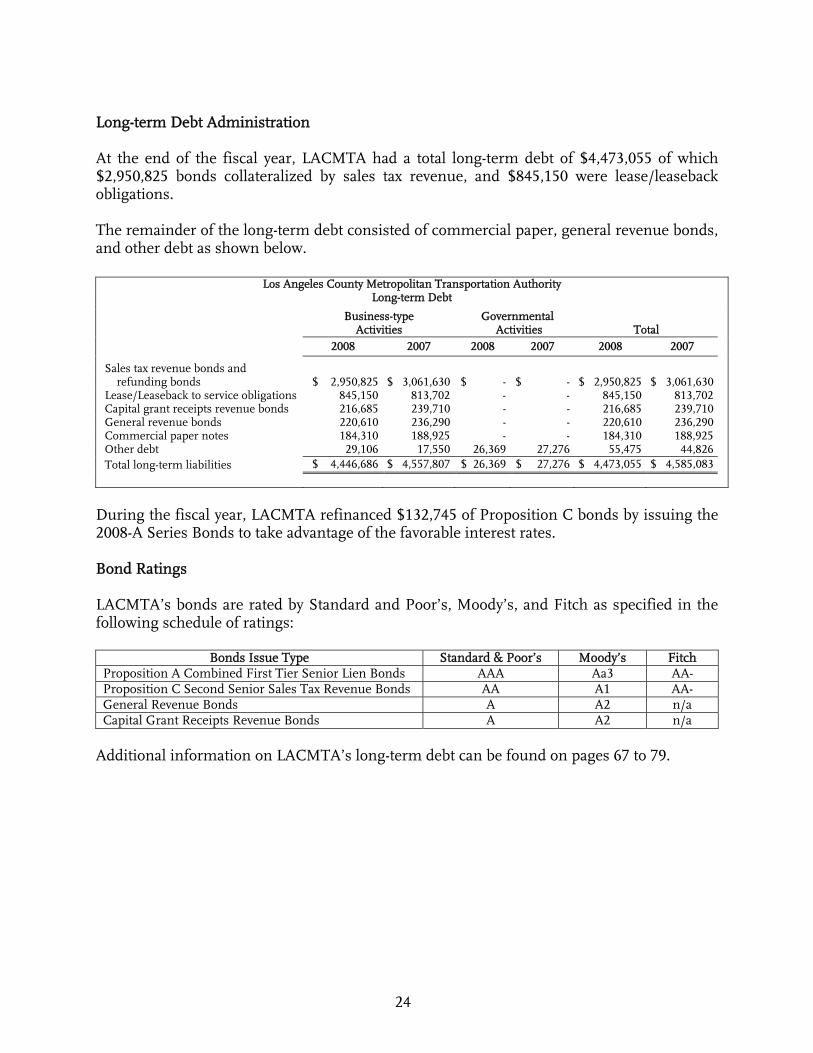
Long-term Debt Administration At the end of the fiscal year, LACMTA had a total long-term debt of $4,473,055 of which $2,950,825 bonds collateralized by sales tax revenue, and $845,150 were lease/leaseback obligations. The remainder of the long-term debt consisted of commercial paper, general revenue bonds, and other debt as shown below.
Los Angeles County Metropolitan Transportation Authority Long-term Debt
Business-type Activities
Governmental Activities Total
2008 2007 2008 2007 2008 2007
Sales tax revenue bonds and refunding bonds $ 2,950,825 $ 3,061,630 $ - $ - $ 2,950,825 $ 3,061,630 Lease/Leaseback to service obligations 845,150 813,702 - - 845,150 813,702 Capital grant receipts revenue bonds 216,685 239,710 - - 216,685 239,710 General revenue bonds 220,610 236,290 - - 220,610 236,290 Commercial paper notes 184,310 188,925 - - 184,310 188,925 Other debt 29,106 17,550 26,369 27,276 55,475 44,826 Total long-term liabilities $ 4,446,686 $ 4,557,807 $ 26,369 $ 27,276 $ 4,473,055 $ 4,585,083
During the fiscal year, LACMTA refinanced $132,745 of Proposition C bonds by issuing the 2008-A Series Bonds to take advantage of the favorable interest rates. Bond Ratings LACMTA’s bonds are rated by Standard and Poor’s, Moody’s, and Fitch as specified in the following schedule of ratings:
Bonds Issue Type Standard & Poor’s Moody’s Fitch Proposition A Combined First Tier Senior Lien Bonds AAA Aa3 AA- Proposition C Second Senior Sales Tax Revenue Bonds AA A1 AA- General Revenue Bonds A A2 n/a Capital Grant Receipts Revenue Bonds A A2 n/a
Additional information on LACMTA’s long-term debt can be found on pages 67 to 79.
25
Economic Factors and Next Year’s Budget The main economic factors affecting LACMTA’s financial capacity to deliver transportation programs and projects include:
• Economic conditions influencing local sales tax revenues • Interest rate fluctuations • Fuel and labor costs • Capital grant revenue availability
LACMTA uses forecasts from various governmental sources as a basis of its future funding assumptions. The budget for FY09 takes into account challenges and opportunities in a sluggish economy. Local sales tax comprises the single largest revenue sources for LACMTA, and represents 64 percent of LACMTA’s total FY09 estimated revenues. Sales tax revenues are budgeted to increase by 1.1 percent, which is the 20-year historical average for sales tax growth in Los Angeles County. From this revenue base, LACMTA constructs a budget that balances anticipated revenues with area transportation needs. Further Information This report has been designed to provide our stakeholders with a general overview of LACMTA’s financial condition and related issues. Inquiries should be directed to the Chief Financial Services Officer and Treasurer, One Gateway Plaza, Mail Stop 99-25-7, Los Angeles, CA, 90012-2952. A

26
THIS PAGE INTENTIONALLY LEFT BLANK
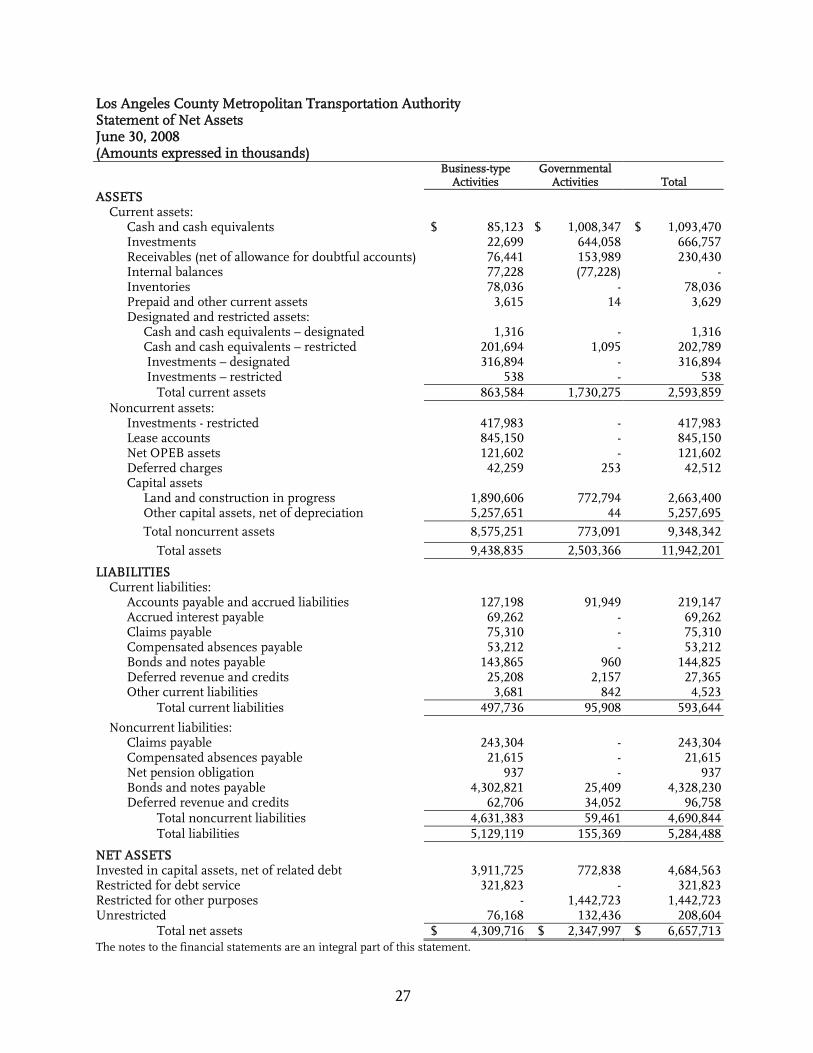
Los Angeles County Metropolitan Transportation Authority Statement of Net Assets June 30, 2008 (Amounts expressed in thousands)
27
Business-type Activities
Governmental Activities
Total
ASSETS Current assets: Cash and cash equivalents $ 85,123 $ 1,008,347 $ 1,093,470 Investments 22,699 644,058 666,757 Receivables (net of allowance for doubtful accounts) 76,441 153,989 230,430 Internal balances 77,228 (77,228) - Inventories 78,036 - 78,036 Prepaid and other current assets 3,615 14 3,629 Designated and restricted assets: Cash and cash equivalents – designated 1,316 - 1,316 Cash and cash equivalents – restricted 201,694 1,095 202,789 Investments – designated 316,894 - 316,894 Investments – restricted 538 - 538 Total current assets 863,584 1,730,275 2,593,859 Noncurrent assets: Investments - restricted 417,983 - 417,983 Lease accounts 845,150 - 845,150 Net OPEB assets 121,602 - 121,602 Deferred charges 42,259 253 42,512 Capital assets Land and construction in progress 1,890,606 772,794 2,663,400 Other capital assets, net of depreciation 5,257,651 44 5,257,695 Total noncurrent assets 8,575,251 773,091 9,348,342 Total assets 9,438,835 2,503,366 11,942,201
LIABILITIES Current liabilities: Accounts payable and accrued liabilities 127,198 91,949 219,147 Accrued interest payable 69,262 - 69,262 Claims payable 75,310 - 75,310 Compensated absences payable 53,212 - 53,212 Bonds and notes payable 143,865 960 144,825 Deferred revenue and credits 25,208 2,157 27,365 Other current liabilities 3,681 842 4,523 Total current liabilities 497,736 95,908 593,644
Noncurrent liabilities: Claims payable 243,304 - 243,304 Compensated absences payable 21,615 - 21,615 Net pension obligation 937 - 937 Bonds and notes payable 4,302,821 25,409 4,328,230 Deferred revenue and credits 62,706 34,052 96,758 Total noncurrent liabilities 4,631,383 59,461 4,690,844 Total liabilities 5,129,119 155,369 5,284,488
NET ASSETS Invested in capital assets, net of related debt 3,911,725 772,838 4,684,563 Restricted for debt service 321,823 - 321,823 Restricted for other purposes - 1,442,723 1,442,723 Unrestricted 76,168 132,436 208,604 Total net assets $ 4,309,716 $ 2,347,997 $ 6,657,713 The notes to the financial statements are an integral part of this statement.

Los Angeles County Metropolitan Transportation Authority Statement of Activities For the Year Ended June 30, 2008 (Amounts expressed in thousands)
28
Program Revenues Charges for Operating Grants Expenses Services and Contributions Functions/Programs Business-type activities: Transit operations $ 1,747,243 $ 357,857 $ 198,443 Total business-type activities 1,747,243 357,857 198,443 Governmental activities: Transit operators programs 209,299 - - Local cities programs 318,492 - - Regional multimodal capital programs 316,631 - 166,744 Paratransit programs 14,355 - - Other transportation subsidies 57,711 - 1,482 General government 167,191 10,915 22,820 Total governmental activities 1,083,679 10,915 191,046 Total $ 2,830,922 $ 368,772 $ 389,489 General revenues: Sales tax Investment income Miscellaneous Transfers Total general revenues Change in net assets Net assets – beginning of year, as previously reported Adjustment due to implementation of GASB 45 (OPEB) Net assets – beginning of year, as restated Net assets – end of year
The notes to the financial statements are an integral part of this statement.
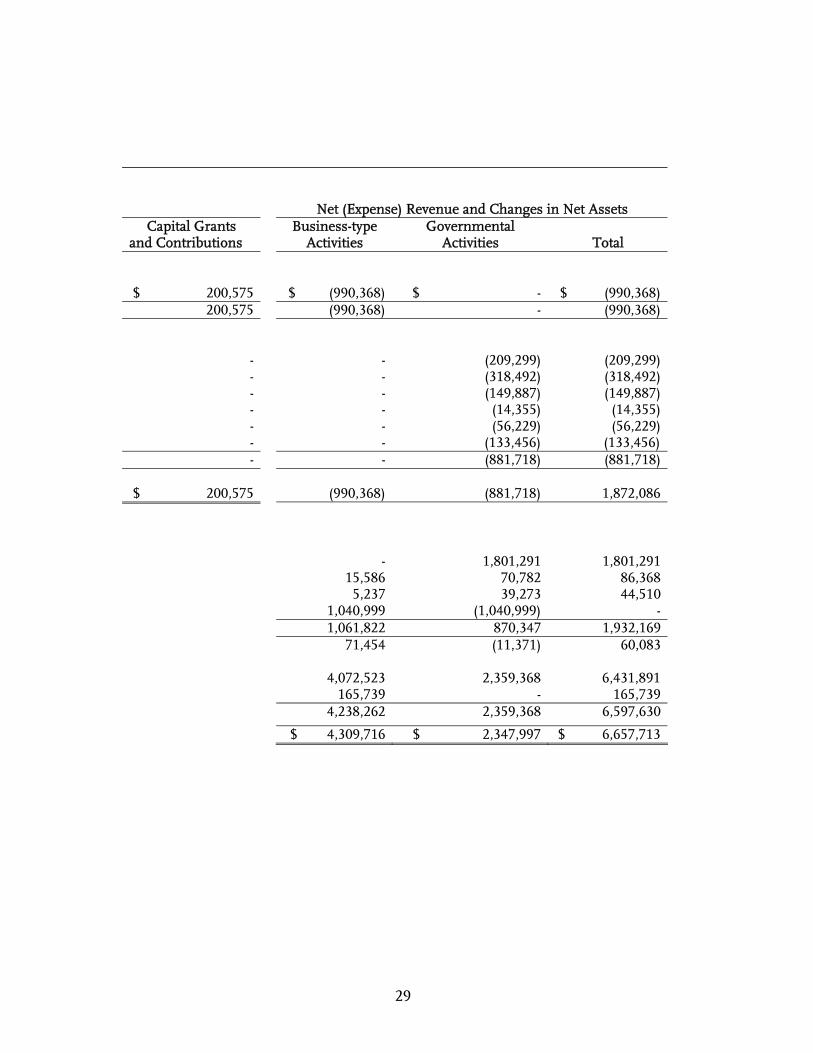
Los Angeles County Metropolitan Transportation Authority Statement of Activities For the Year ended June 30, 2008 (Amounts expressed in thousands
29
Net (Expense) Revenue and Changes in Net Assets
Capital Grants Business-type Governmental and Contributions Activities Activities Total $ 200,575 $ (990,368) $ - $ (990,368)
200,575 (990,368) - (990,368)
- - (209,299) (209,299) - - (318,492) (318,492) - - (149,887) (149,887) - - (14,355) (14,355) - - (56,229) (56,229) - - (133,456) (133,456) - - (881,718) (881,718)
$ 200,575 (990,368) (881,718) 1,872,086 - 1,801,291 1,801,291 15,586 70,782 86,368 5,237 39,273 44,510 1,040,999 (1,040,999) - 1,061,822 870,347 1,932,169 71,454 (11,371) 60,083 4,072,523 2,359,368 6,431,891 165,739 - 165,739 4,238,262 2,359,368 6,597,630 $ 4,309,716 $ 2,347,997 $ 6,657,713
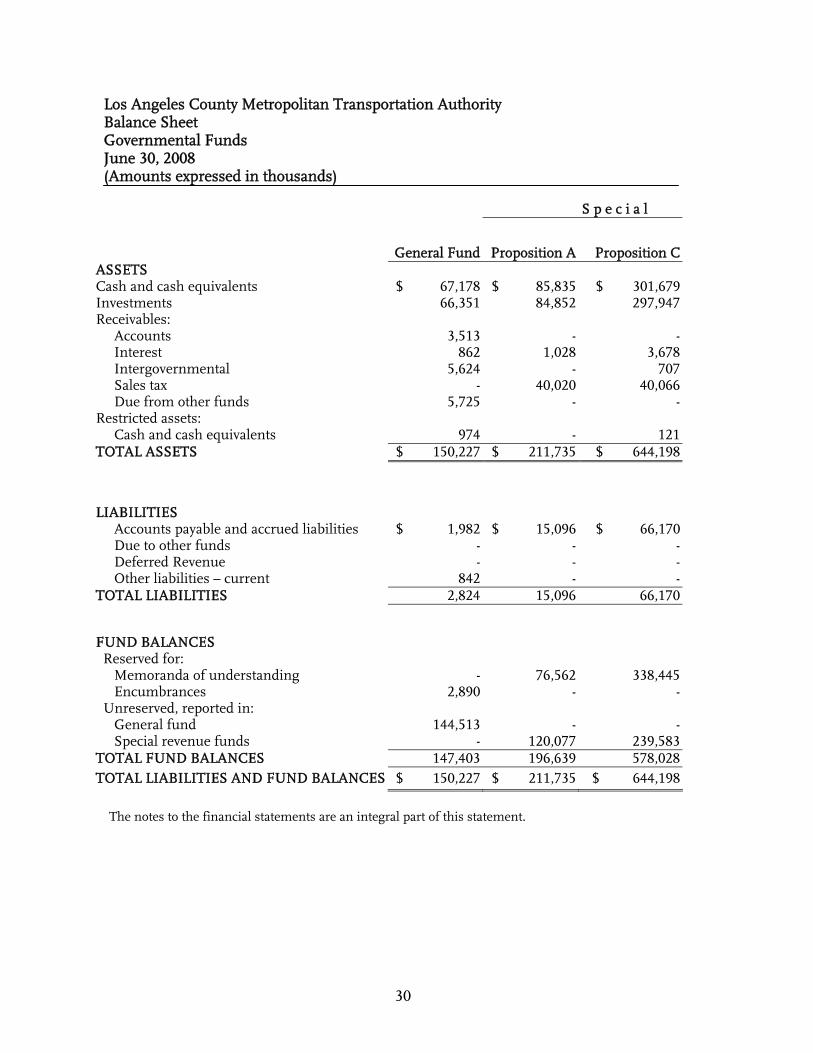
Los Angeles County Metropolitan Transportation Authority Balance Sheet Governmental Funds June 30, 2008 (Amounts expressed in thousands)
30
The notes to the financial statements are an integral part of this statement.
S p e c i a l
General Fund Proposition A Proposition C ASSETS Cash and cash equivalents $ 67,178 $ 85,835 $ 301,679 Investments 66,351 84,852 297,947 Receivables: Accounts 3,513 - - Interest 862 1,028 3,678 Intergovernmental 5,624 - 707 Sales tax - 40,020 40,066 Due from other funds 5,725 - - Restricted assets: Cash and cash equivalents 974 - 121 TOTAL ASSETS $ 150,227 $ 211,735 $ 644,198
LIABILITIES
Accounts payable and accrued liabilities $ 1,982 $ 15,096 $ 66,170 Due to other funds - - - Deferred Revenue - - - Other liabilities – current 842 - - TOTAL LIABILITIES 2,824 15,096 66,170
FUND BALANCES
Reserved for: Memoranda of understanding - 76,562 338,445 Encumbrances 2,890 - - Unreserved, reported in: General fund 144,513 - - Special revenue funds - 120,077 239,583 TOTAL FUND BALANCES 147,403 196,639 578,028 TOTAL LIABILITIES AND FUND BALANCES $ 150,227 $ 211,735 $ 644,198
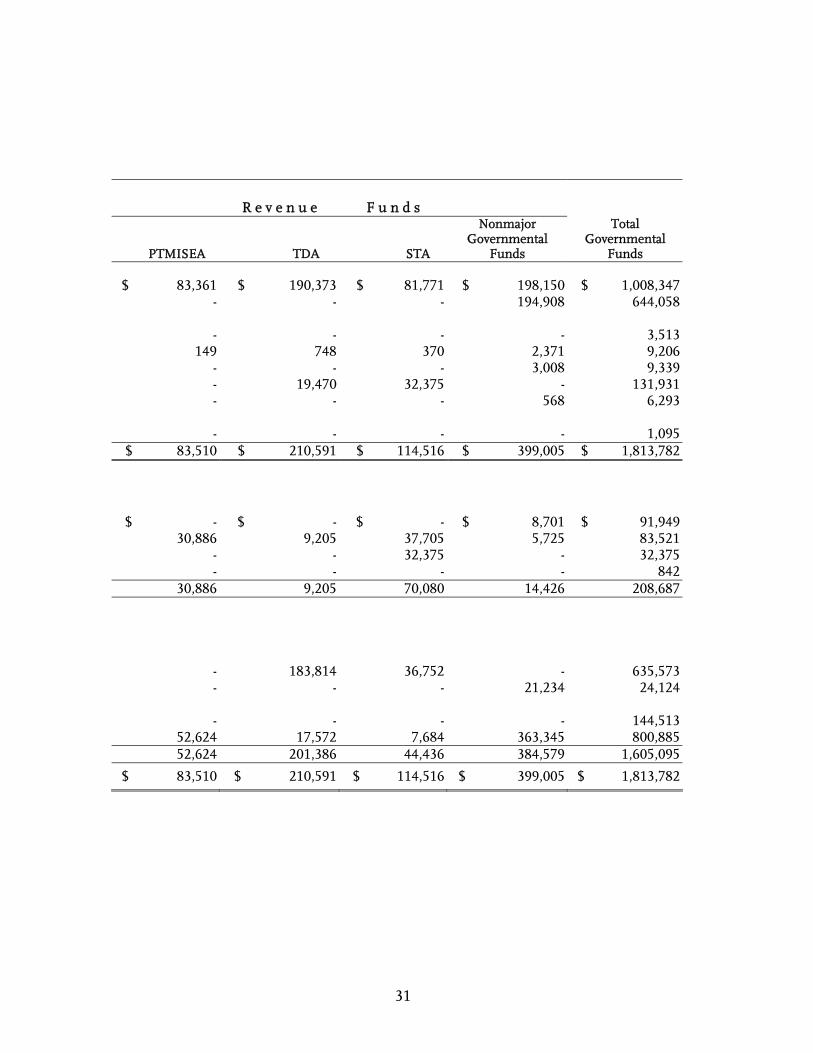
Los Angeles County Metropolitan Transportation Authority Balance Sheet Governmental Funds June 30, 2008 ds expressed in thousands)
31
R e v e n u e F u n d s
PTMISEA TDA STA
Nonmajor Governmental
Funds
Total Governmental
Funds
$ 83,361 $ 190,373 $ 81,771 $ 198,150 $ 1,008,347 - - - 194,908 644,058
- - - - 3,513 149 748 370 2,371 9,206 - - - 3,008 9,339 - 19,470 32,375 - 131,931 - - - 568 6,293 - - - - 1,095
$ 83,510 $ 210,591 $ 114,516 $ 399,005 $ 1,813,782
$ - $ - $ - $ 8,701 $ 91,949 30,886 9,205 37,705 5,725 83,521 - - 32,375 - 32,375 - - - - 842 30,886 9,205 70,080 14,426 208,687
- 183,814 36,752 - 635,573 - - - 21,234 24,124 - - - - 144,513
52,624 17,572 7,684 363,345 800,885 52,624 201,386 44,436 384,579 1,605,095
$ 83,510 $ 210,591 $ 114,516 $ 399,005 $ 1,813,782

32
THIS PAGE INTENTIONALLY LEFT BLANK
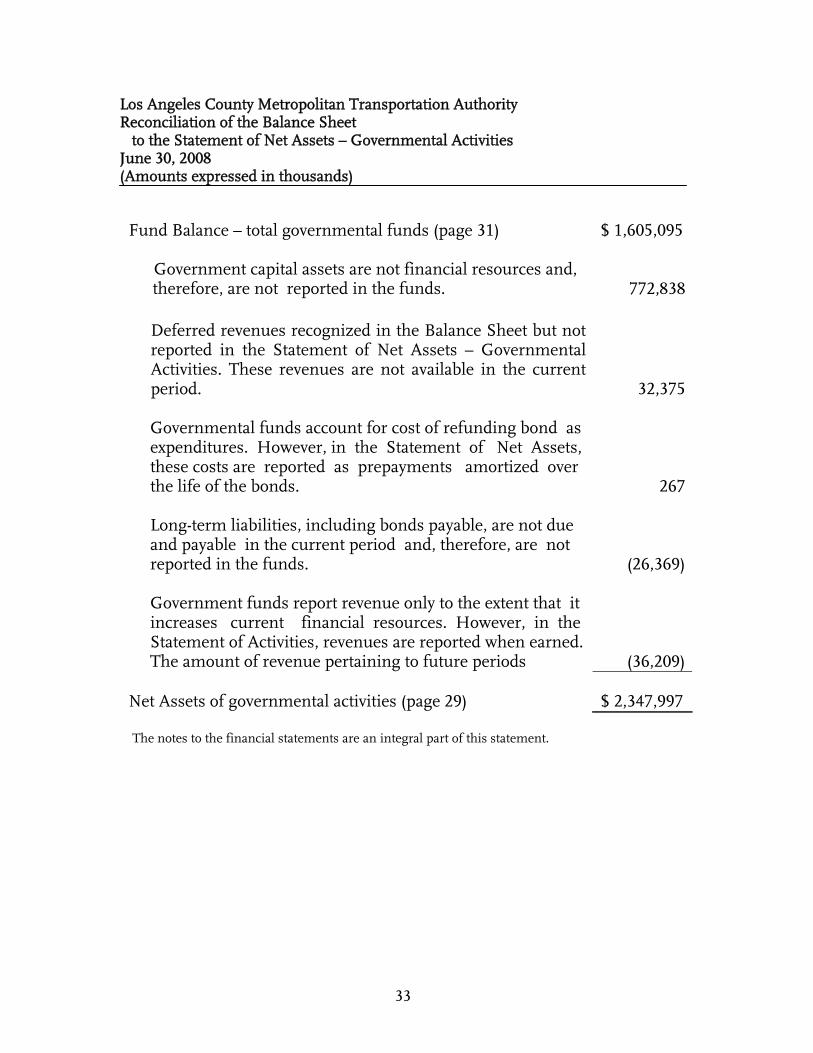
Los Angeles County Metropolitan Transportation Authority Reconciliation of the Balance Sheet to the Statement of Net Assets – Governmental Activities June 30, 2008 (Amounts expressed in thousands)
33
The notes to the financial statements are an integral part of this statement.
Fund Balance – total governmental funds (page 31) $ 1,605,095 Government capital assets are not financial resources and,
therefore, are not reported in the funds.
772,838
Deferred revenues recognized in the Balance Sheet but not reported in the Statement of Net Assets – Governmental Activities. These revenues are not available in the current period.
32,375
Governmental funds account for cost of refunding bond as expenditures. However, in the Statement of Net Assets, these costs are reported as prepayments amortized over the life of the bonds. 267
Long-term liabilities, including bonds payable, are not due and payable in the current period and, therefore, are not reported in the funds. (26,369)
Government funds report revenue only to the extent that it increases current financial resources. However, in the Statement of Activities, revenues are reported when earned. The amount of revenue pertaining to future periods (36,209) Net Assets of governmental activities (page 29) $ 2,347,997
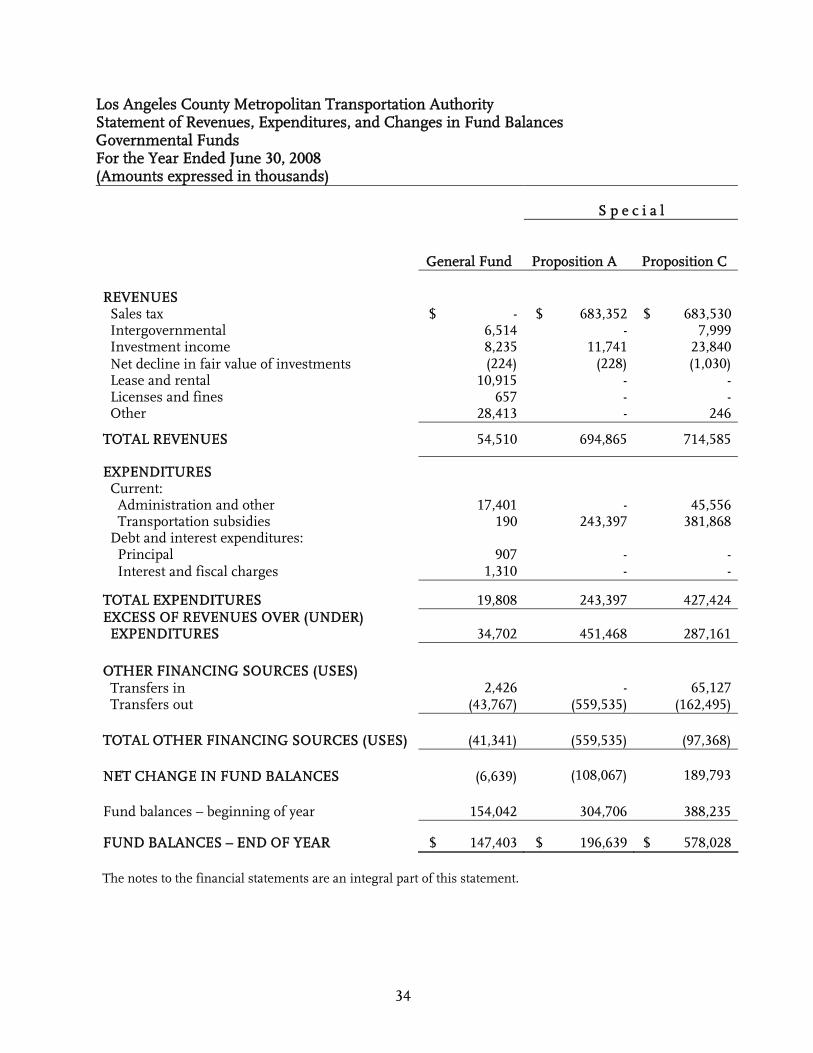
Los Angeles County Metropolitan Transportation Authority Statement of Revenues, Expenditures, and Changes in Fund Balances Governmental Funds For the Year Ended June 30, 2008 (Amounts expressed in thousands)
34
S p e c i a l
General Fund Proposition A Proposition C
REVENUES Sales tax $ - $ 683,352 $ 683,530 Intergovernmental 6,514 - 7,999 Investment income 8,235 11,741 23,840 Net decline in fair value of investments (224) (228) (1,030) Lease and rental 10,915 - - Licenses and fines 657 - - Other 28,413 - 246
TOTAL REVENUES 54,510 694,865 714,585
EXPENDITURES Current: Administration and other 17,401 - 45,556 Transportation subsidies 190 243,397 381,868 Debt and interest expenditures: Principal 907 - - Interest and fiscal charges 1,310 - -
TOTAL EXPENDITURES 19,808 243,397 427,424 EXCESS OF REVENUES OVER (UNDER) EXPENDITURES 34,702 451,468 287,161
OTHER FINANCING SOURCES (USES)
Transfers in 2,426 - 65,127 Transfers out (43,767) (559,535) (162,495)
TOTAL OTHER FINANCING SOURCES (USES)
(41,341) (559,535) (97,368)
NET CHANGE IN FUND BALANCES (6,639)
(108,067)
189,793
Fund balances – beginning of year 154,042 304,706 388,235
FUND BALANCES – END OF YEAR $ 147,403 $ 196,639 $ 578,028 The notes to the financial statements are an integral part of this statement.
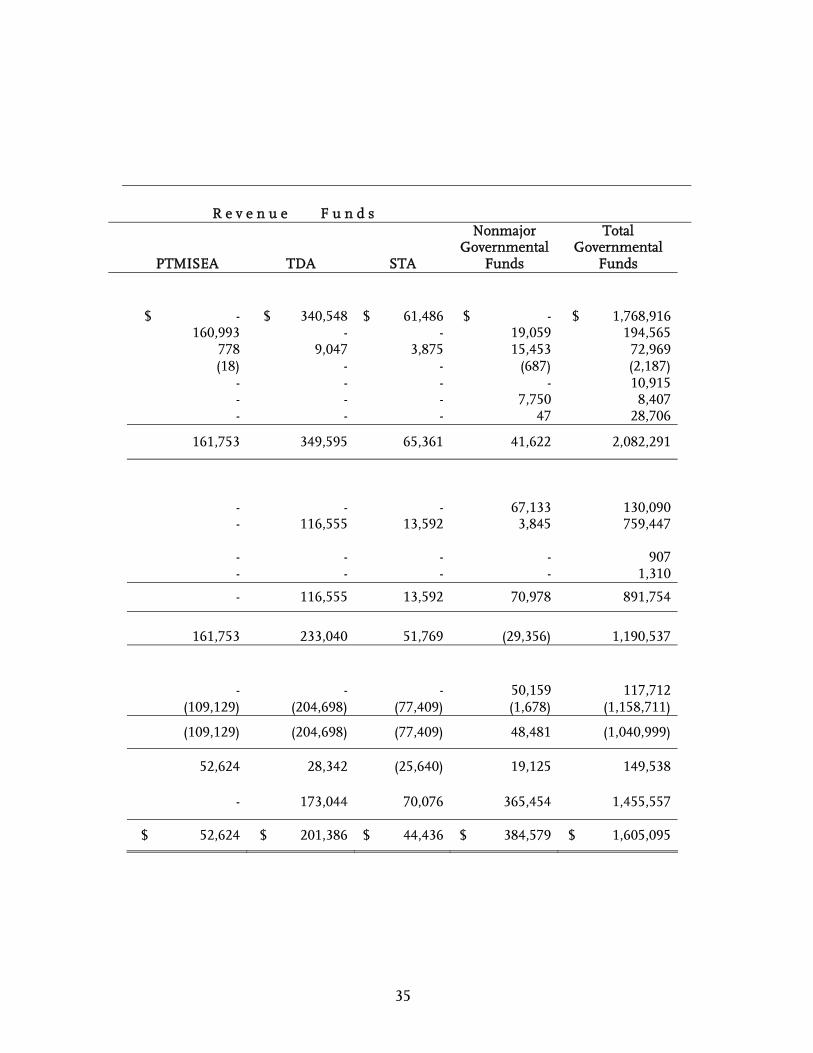
Los Angeles County Metropolitan Transportation Authority Statement of Revenues, Expenditures, and Changes in Fund Balances Government Funds For the Year Ended June 30, 2008 (Amount expressed in thousands
35
R e v e n u e F u n d s
PTMISEA TDA STA
Nonmajor Governmental
Funds
Total Governmental
Funds
$ - $ 340,548 $ 61,486 $ - $ 1,768,916 160,993 - - 19,059 194,565 778 9,047 3,875 15,453 72,969 (18) - - (687) (2,187)
- - - - 10,915 - - - 7,750 8,407 - - - 47 28,706
161,753 349,595 65,361 41,622 2,082,291
- - - 67,133 130,090 - 116,555 13,592 3,845 759,447 - - - - 907 - - - - 1,310
- 116,555 13,592 70,978 891,754
161,753 233,040 51,769 (29,356) 1,190,537
- - - 50,159 117,712 (109,129) (204,698) (77,409) (1,678) (1,158,711)
(109,129) (204,698) (77,409) 48,481 (1,040,999)
52,624 28,342 (25,640) 19,125 149,538
- 173,044 70,076 365,454 1,455,557
$ 52,624 $ 201,386 $ 44,436 $ 384,579 $ 1,605,095
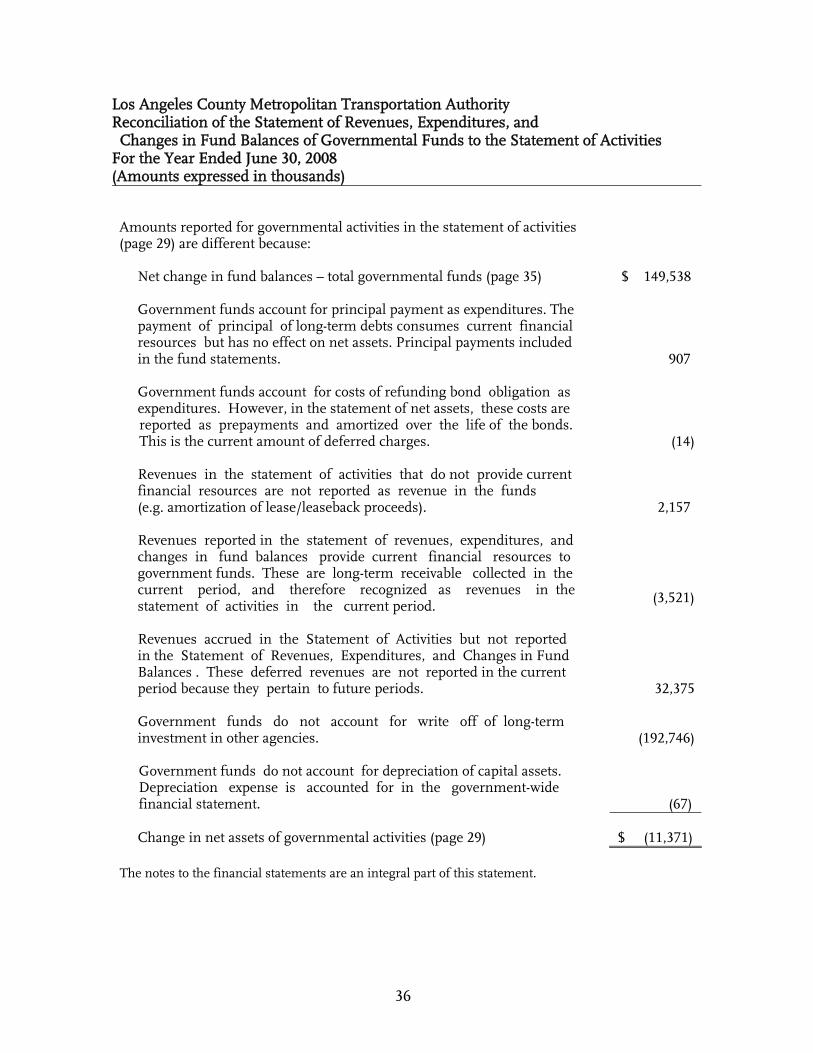
Los Angeles County Metropolitan Transportation Authority Reconciliation of the Statement of Revenues, Expenditures, and Changes in Fund Balances of Governmental Funds to the Statement of Activities For the Year Ended June 30, 2008 (Amounts expressed in thousands)
36
Amounts reported for governmental activities in the statement of activities (page 29) are different because:
Net change in fund balances – total governmental funds (page 35) $ 149,538
Government funds account for principal payment as expenditures. The payment of principal of long-term debts consumes current financial resources but has no effect on net assets. Principal payments included in the fund statements. 907
Government funds account for costs of refunding bond obligation as expenditures. However, in the statement of net assets, these costs are
reported as prepayments and amortized over the life of the bonds. This is the current amount of deferred charges. (14)
Revenues in the statement of activities that do not provide current financial resources are not reported as revenue in the funds (e.g. amortization of lease/leaseback proceeds). 2,157
Revenues reported in the statement of revenues, expenditures, and changes in fund balances provide current financial resources to government funds. These are long-term receivable collected in the current period, and therefore recognized as revenues in the statement of activities in the current period.
(3,521)
Revenues accrued in the Statement of Activities but not reported in the Statement of Revenues, Expenditures, and Changes in Fund Balances . These deferred revenues are not reported in the current period because they pertain to future periods. 32,375 Government funds do not account for write off of long-term investment in other agencies. (192,746)
Government funds do not account for depreciation of capital assets. Depreciation expense is accounted for in the government-wide financial statement. (67)
Change in net assets of governmental activities (page 29) $ (11,371)
The notes to the financial statements are an integral part of this statement.
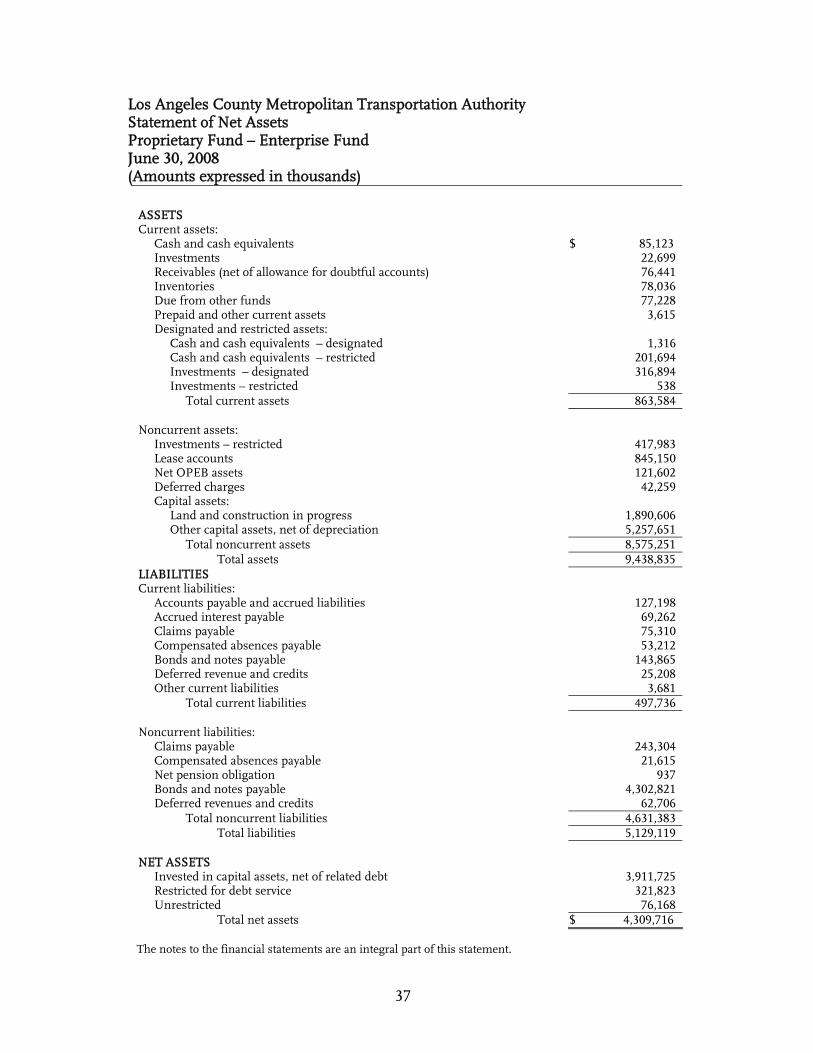
Los Angeles County Metropolitan Transportation Authority Statement of Net Assets
Proprietary Fund – Enterprise Fund June 30, 2008 (Amounts expressed in thousands)
37
ASSETS Current assets: Cash and cash equivalents $ 85,123 Investments 22,699 Receivables (net of allowance for doubtful accounts) 76,441 Inventories 78,036 Due from other funds 77,228 Prepaid and other current assets 3,615 Designated and restricted assets: Cash and cash equivalents – designated 1,316 Cash and cash equivalents – restricted 201,694 Investments – designated 316,894 Investments – restricted 538 Total current assets 863,584 Noncurrent assets: Investments – restricted 417,983 Lease accounts 845,150 Net OPEB assets 121,602 Deferred charges 42,259 Capital assets: Land and construction in progress 1,890,606 Other capital assets, net of depreciation 5,257,651 Total noncurrent assets 8,575,251 Total assets 9,438,835 LIABILITIES Current liabilities: Accounts payable and accrued liabilities 127,198 Accrued interest payable 69,262 Claims payable 75,310 Compensated absences payable 53,212 Bonds and notes payable 143,865 Deferred revenue and credits 25,208 Other current liabilities 3,681 Total current liabilities 497,736 Noncurrent liabilities: Claims payable 243,304 Compensated absences payable 21,615 Net pension obligation 937 Bonds and notes payable 4,302,821 Deferred revenues and credits 62,706 Total noncurrent liabilities 4,631,383 Total liabilities 5,129,119 NET ASSETS Invested in capital assets, net of related debt 3,911,725 Restricted for debt service 321,823 Unrestricted 76,168 Total net assets $ 4,309,716
The notes to the financial statements are an integral part of this statement.
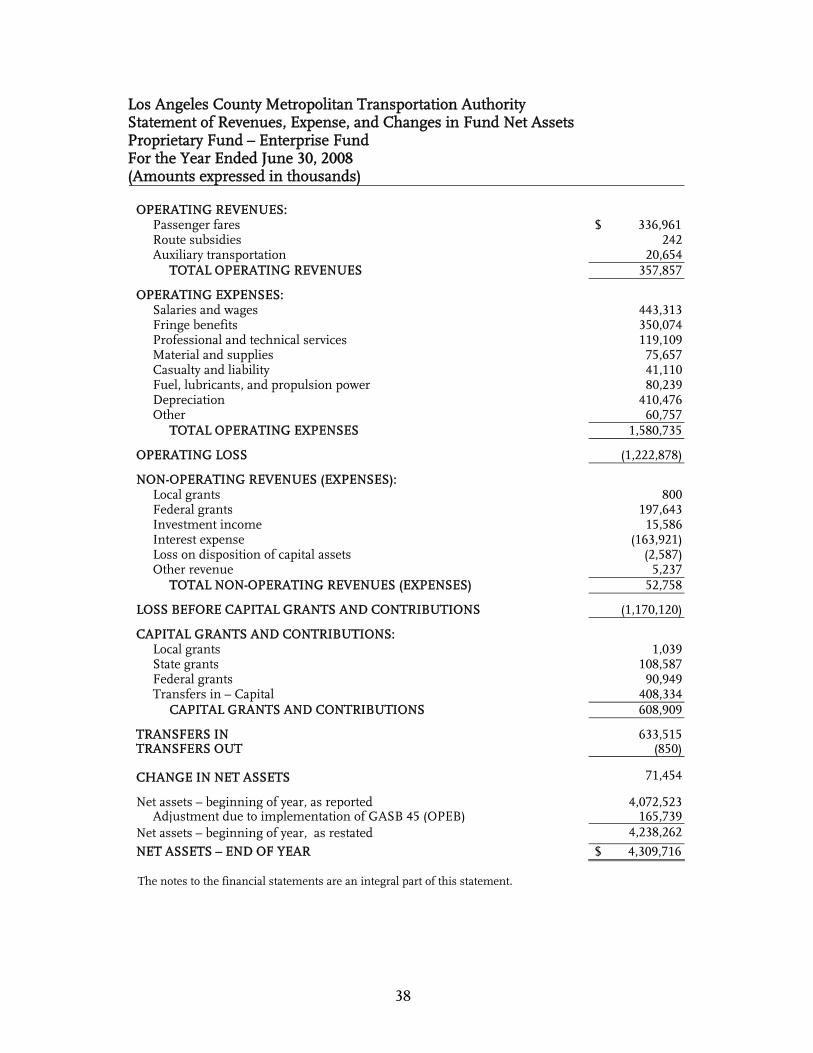
Los Angeles County Metropolitan Transportation Authority Statement of Revenues, Expense, and Changes in Fund Net Assets Proprietary Fund – Enterprise Fund For the Year Ended June 30, 2008 (Amounts expressed in thousands)
38
OPERATING REVENUES: Passenger fares $ 336,961 Route subsidies 242 Auxiliary transportation 20,654 TOTAL OPERATING REVENUES 357,857 OPERATING EXPENSES: Salaries and wages 443,313 Fringe benefits 350,074 Professional and technical services 119,109 Material and supplies 75,657 Casualty and liability 41,110 Fuel, lubricants, and propulsion power 80,239 Depreciation 410,476 Other 60,757 TOTAL OPERATING EXPENSES 1,580,735 OPERATING LOSS (1,222,878) NON-OPERATING REVENUES (EXPENSES): Local grants 800 Federal grants 197,643 Investment income 15,586 Interest expense (163,921) Loss on disposition of capital assets (2,587) Other revenue 5,237 TOTAL NON-OPERATING REVENUES (EXPENSES) 52,758 LOSS BEFORE CAPITAL GRANTS AND CONTRIBUTIONS (1,170,120) CAPITAL GRANTS AND CONTRIBUTIONS: Local grants 1,039 State grants 108,587 Federal grants 90,949 Transfers in – Capital 408,334 CAPITAL GRANTS AND CONTRIBUTIONS 608,909 TRANSFERS IN 633,515 TRANSFERS OUT (850) CHANGE IN NET ASSETS 71,454 Net assets – beginning of year, as reported 4,072,523 Adjustment due to implementation of GASB 45 (OPEB) 165,739 Net assets – beginning of year, as restated 4,238,262 NET ASSETS – END OF YEAR $ 4,309,716
The notes to the financial statements are an integral part of this statement.
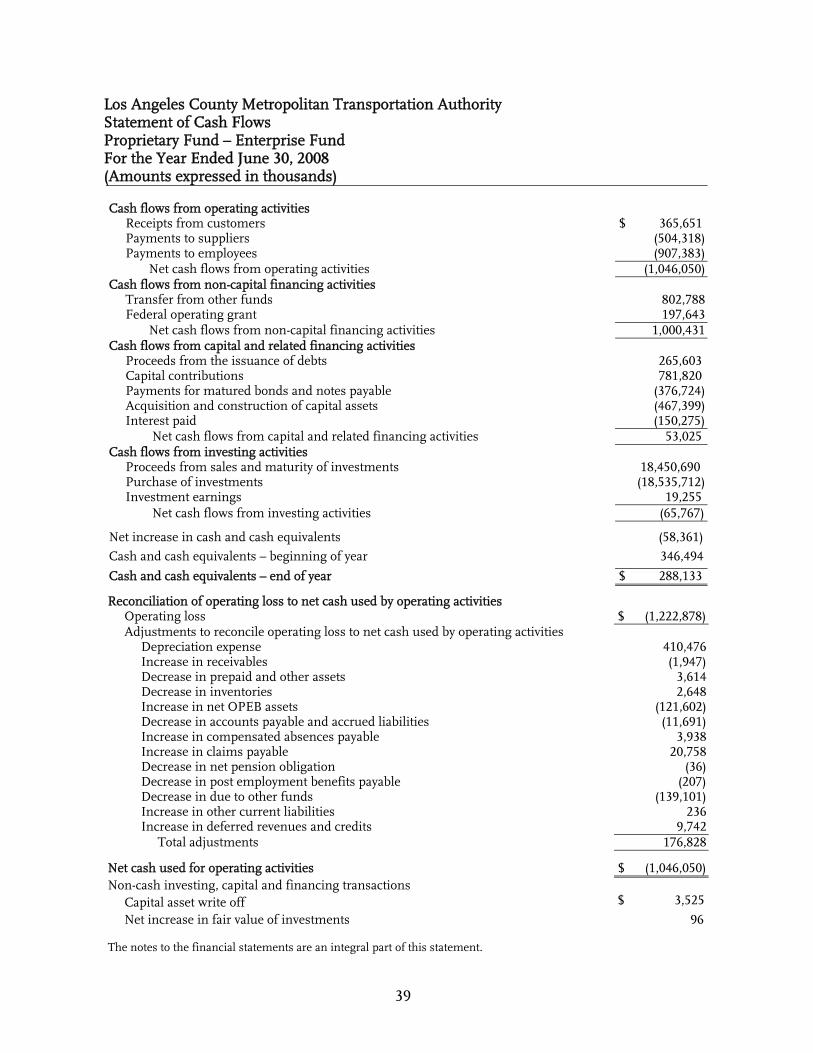
Los Angeles County Metropolitan Transportation Authority Statement of Cash Flows Proprietary Fund – Enterprise Fund For the Year Ended June 30, 2008 (Amounts expressed in thousands)
39
Cash flows from operating activities Receipts from customers $ 365,651 Payments to suppliers (504,318) Payments to employees (907,383) Net cash flows from operating activities (1,046,050) Cash flows from non-capital financing activities Transfer from other funds 802,788 Federal operating grant 197,643 Net cash flows from non-capital financing activities 1,000,431 Cash flows from capital and related financing activities Proceeds from the issuance of debts 265,603 Capital contributions 781,820 Payments for matured bonds and notes payable (376,724) Acquisition and construction of capital assets (467,399) Interest paid (150,275) Net cash flows from capital and related financing activities 53,025 Cash flows from investing activities Proceeds from sales and maturity of investments 18,450,690 Purchase of investments (18,535,712) Investment earnings 19,255 Net cash flows from investing activities (65,767)
Net increase in cash and cash equivalents (58,361) Cash and cash equivalents – beginning of year 346,494
Cash and cash equivalents – end of year $ 288,133
Reconciliation of operating loss to net cash used by operating activities Operating loss $ (1,222,878) Adjustments to reconcile operating loss to net cash used by operating activities Depreciation expense 410,476 Increase in receivables (1,947) Decrease in prepaid and other assets 3,614 Decrease in inventories 2,648 Increase in net OPEB assets (121,602) Decrease in accounts payable and accrued liabilities (11,691) Increase in compensated absences payable 3,938 Increase in claims payable 20,758 Decrease in net pension obligation (36) Decrease in post employment benefits payable (207) Decrease in due to other funds (139,101) Increase in other current liabilities 236 Increase in deferred revenues and credits 9,742 Total adjustments 176,828
Net cash used for operating activities $ (1,046,050) Non-cash investing, capital and financing transactions Capital asset write off $ 3,525 Net increase in fair value of investments 96
The notes to the financial statements are an integral part of this statement.
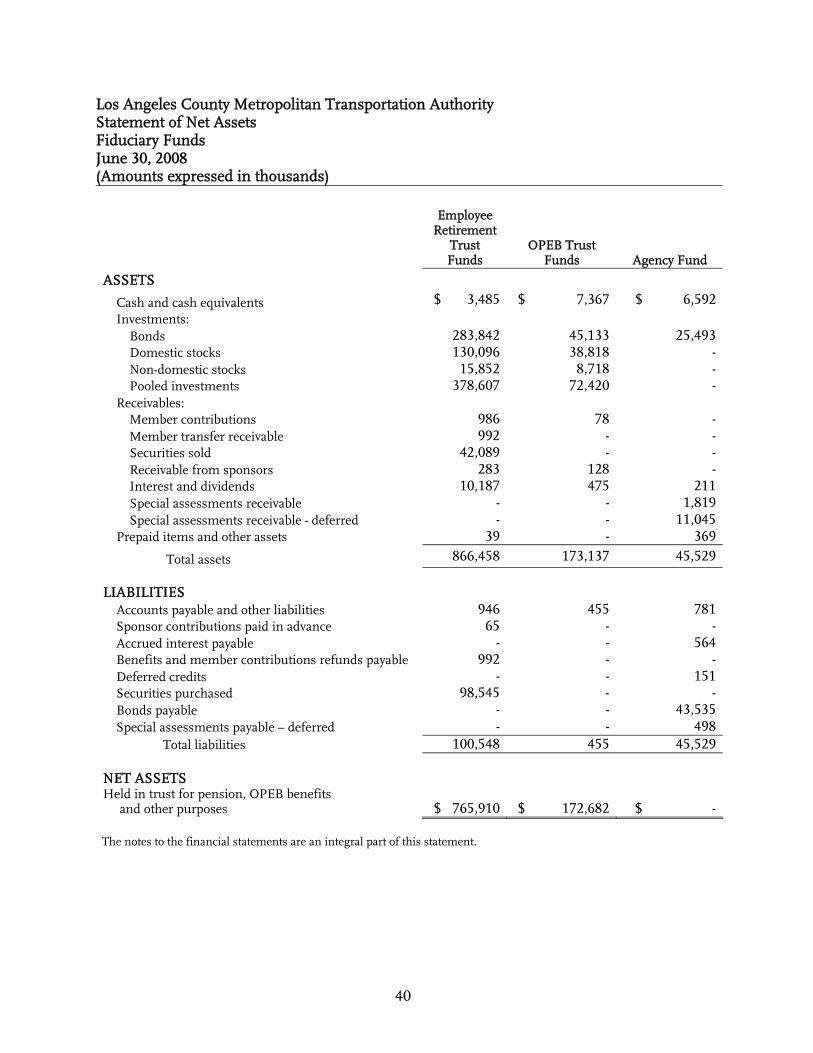
Los Angeles County Metropolitan Transportation Authority Statement of Net Assets Fiduciary Funds June 30, 2008 (Amounts expressed in thousands)
40
Employee
Retirement Trust Funds
OPEB Trust Funds Agency Fund
ASSETS
Cash and cash equivalents $ 3,485 $ 7,367 $ 6,592 Investments: Bonds 283,842 45,133 25,493 Domestic stocks 130,096 38,818 - Non-domestic stocks 15,852 8,718 - Pooled investments 378,607 72,420 - Receivables: Member contributions 986 78 - Member transfer receivable 992 - - Securities sold 42,089 - - Receivable from sponsors 283 128 - Interest and dividends 10,187 475 211 Special assessments receivable - - 1,819 Special assessments receivable - deferred - - 11,045 Prepaid items and other assets 39 - 369
Total assets 866,458 173,137 45,529 LIABILITIES
Accounts payable and other liabilities 946 455 781 Sponsor contributions paid in advance 65 - - Accrued interest payable - - 564 Benefits and member contributions refunds payable 992 - - Deferred credits - - 151 Securities purchased 98,545 - - Bonds payable - - 43,535 Special assessments payable – deferred - - 498 Total liabilities 100,548 455 45,529 NET ASSETS Held in trust for pension, OPEB benefits and other purposes $ 765,910 $ 172,682 $ -
The notes to the financial statements are an integral part of this statement.
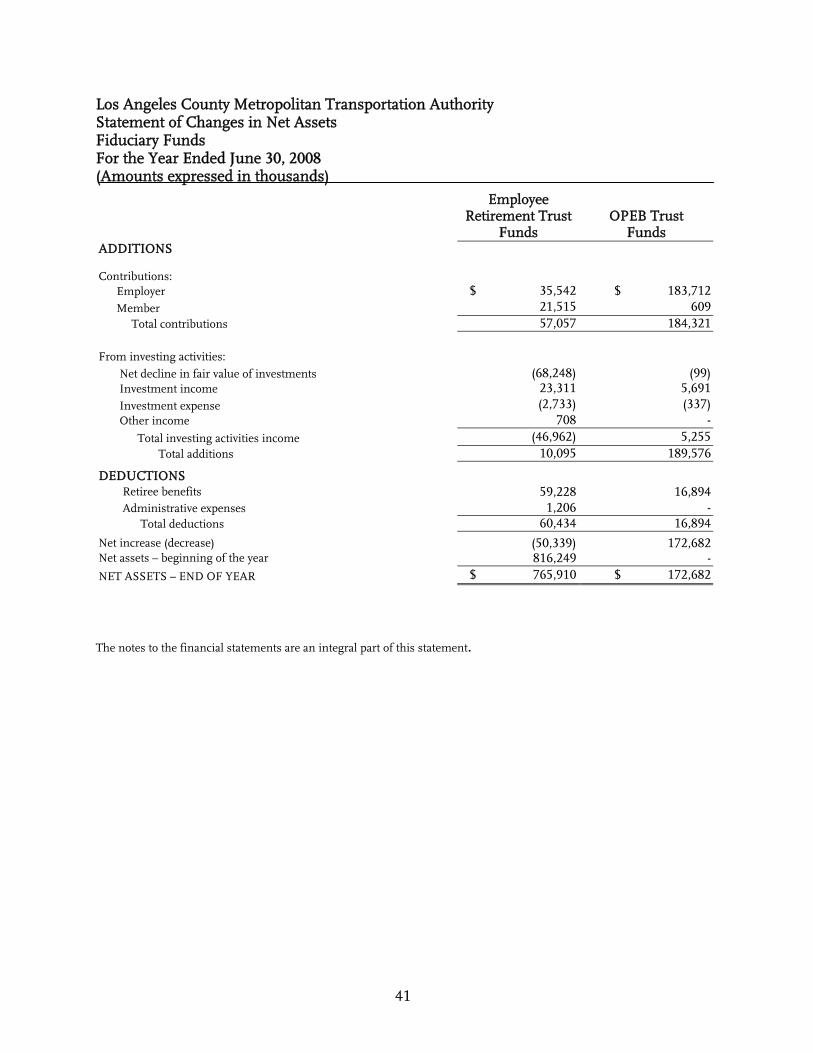
Los Angeles County Metropolitan Transportation Authority Statement of Changes in Net Assets Fiduciary Funds For the Year Ended June 30, 2008 (Amounts expressed in thousands)
41
The notes to the financial statements are an integral part of this statement.
Employee Retirement Trust
Funds OPEB Trust
Funds ADDITIONS
Contributions: Employer $ 35,542 $ 183,712 Member 21,515 609 Total contributions 57,057 184,321 From investing activities: Net decline in fair value of investments (68,248) (99) Investment income 23,311 5,691 Investment expense (2,733) (337) Other income 708 - Total investing activities income (46,962) 5,255 Total additions 10,095 189,576
DEDUCTIONS Retiree benefits 59,228 16,894 Administrative expenses 1,206 - Total deductions 60,434 16,894 Net increase (decrease) (50,339) 172,682 Net assets – beginning of the year 816,249 - NET ASSETS – END OF YEAR $ 765,910 $ 172,682

42
THIS PAGE INTENTIONALLY LEFT BLANK
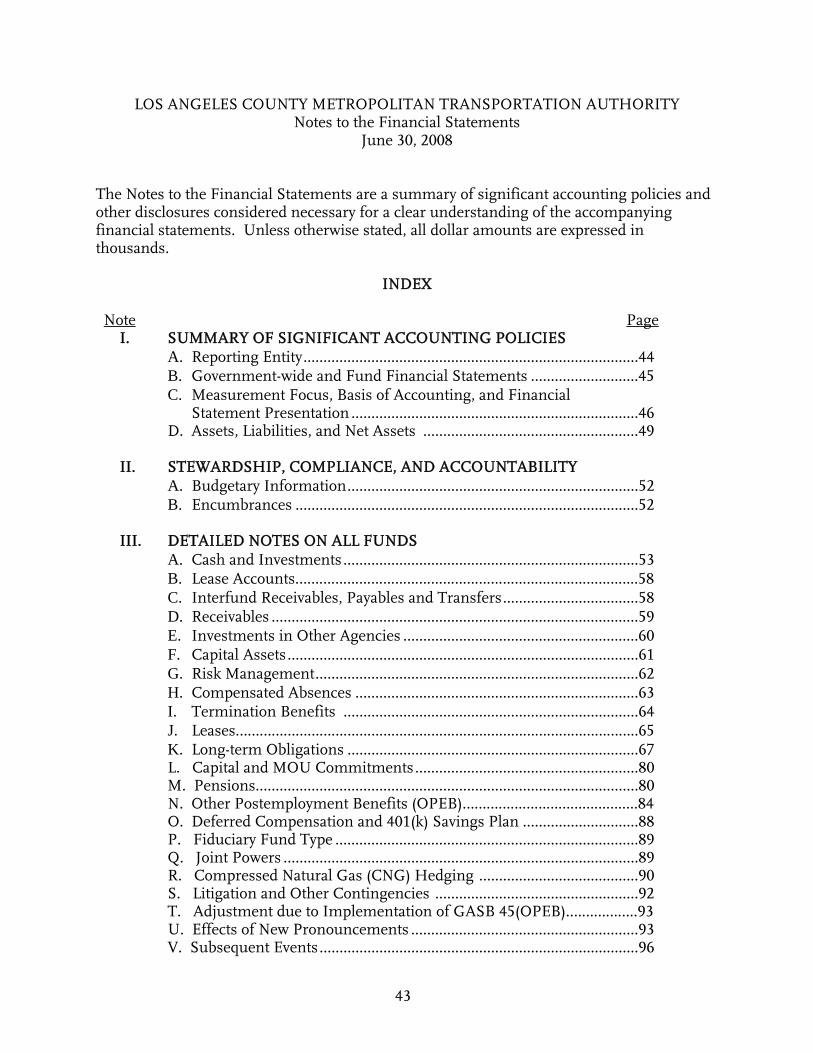
LOS ANGELES COUNTY METROPOLITAN TRANSPORTATION AUTHORITY Notes to the Financial Statements
June 30, 2008
43
The Notes to the Financial Statements are a summary of significant accounting policies and other disclosures considered necessary for a clear understanding of the accompanying financial statements. Unless otherwise stated, all dollar amounts are expressed in thousands.
INDEX Note Page
I. SUMMARY OF SIGNIFICANT ACCOUNTING POLICIES A. Reporting Entity....................................................................................44 B. Government-wide and Fund Financial Statements ...........................45 C. Measurement Focus, Basis of Accounting, and Financial Statement Presentation ........................................................................46 D. Assets, Liabilities, and Net Assets ......................................................49
II. STEWARDSHIP, COMPLIANCE, AND ACCOUNTABILITY A. Budgetary Information.........................................................................52 B. Encumbrances ......................................................................................52
III. DETAILED NOTES ON ALL FUNDS A. Cash and Investments..........................................................................53 B. Lease Accounts…………………………………………………………………………..58 C. Interfund Receivables, Payables and Transfers..................................58 D. Receivables ............................................................................................59 E. Investments in Other Agencies ...........................................................60 F. Capital Assets........................................................................................61 G. Risk Management.................................................................................62 H. Compensated Absences .......................................................................63 I. Termination Benefits ..........................................................................64 J. Leases………………………………………………………………………………………..65 K. Long-term Obligations .........................................................................67 L. Capital and MOU Commitments........................................................80 M. Pensions................................................................................................80 N. Other Postemployment Benefits (OPEB)………………………………….....84 O. Deferred Compensation and 401(k) Savings Plan .............................88 P. Fiduciary Fund Type ............................................................................89 Q. Joint Powers .........................................................................................89 R. Compressed Natural Gas (CNG) Hedging ........................................90 S. Litigation and Other Contingencies ...................................................92 T. Adjustment due to Implementation of GASB 45(OPEB).……………..93 U. Effects of New Pronouncements .........................................................93 V. Subsequent Events................................................................................96

LOS ANGELES COUNTY METROPOLITAN TRANSPORTATION AUTHORITY Notes to the Financial Statements
June 30, 2008
44
I. SUMMARY OF SIGNIFICANT ACCOUNTING POLICIES A. Reporting Entity The Los Angeles County Metropolitan Transportation Authority (LACMTA) is governed by a 14-member Board of Directors (Board). The Board is composed of five members of the County Board of Supervisors, the Mayor of the City of Los Angeles, three members appointed by the Mayor, four members who are either mayors or members of a city council and have been appointed by the Los Angeles County City Selection Committee to represent the other cities in the County, and a non-voting member appointed by the Governor of the State of California. Management has prepared LACMTA’s financial statements and those of its blended component units. The blended component units discussed below are included as part of the reporting entity because they are financially dependent upon LACMTA and because LACMTA’s approval is needed for the units to expend their budgets or charges, and issue long-term debt. Although they are legally separate entities, the blended component units are in substance part of LACMTA’s operations, and data from these units are combined with LACMTA’s financial data. LACMTA administers the activities of the Public Transportation Service Corporation (PTSC), the LACMTA Leasing Authority, the Service Authority for Freeway Emergencies (SAFE), and the Exposition Metro Line Construction Authority (EXPO), and therefore includes the activities of these organizations in the accompanying financial statements. PTSC, LACMTA Leasing Authority, and EXPO provide services exclusively to LACMTA, and LACMTA shares its governing board with SAFE. These entities are presented as blended component units, with PTSC, LACMTA Leasing Authority, and EXPO reported in the proprietary fund type, and SAFE reported in the governmental fund type. Additional detailed financial information for each of these entities can be obtained from LACMTA’s Accounting Department, One Gateway Plaza, Los Angeles, CA 90012-2952. PTSC was created in August 1997 to conduct activities essential to the provision of public transportation in and around Los Angeles County. To achieve this goal, LACMTA entered into an Acquisition Agreement under which the planning, programming, administrative, operational management, and construction functions of LACMTA were transferred to and acquired by PTSC. Under this agreement, these functions are provided by PTSC and funded by LACMTA.
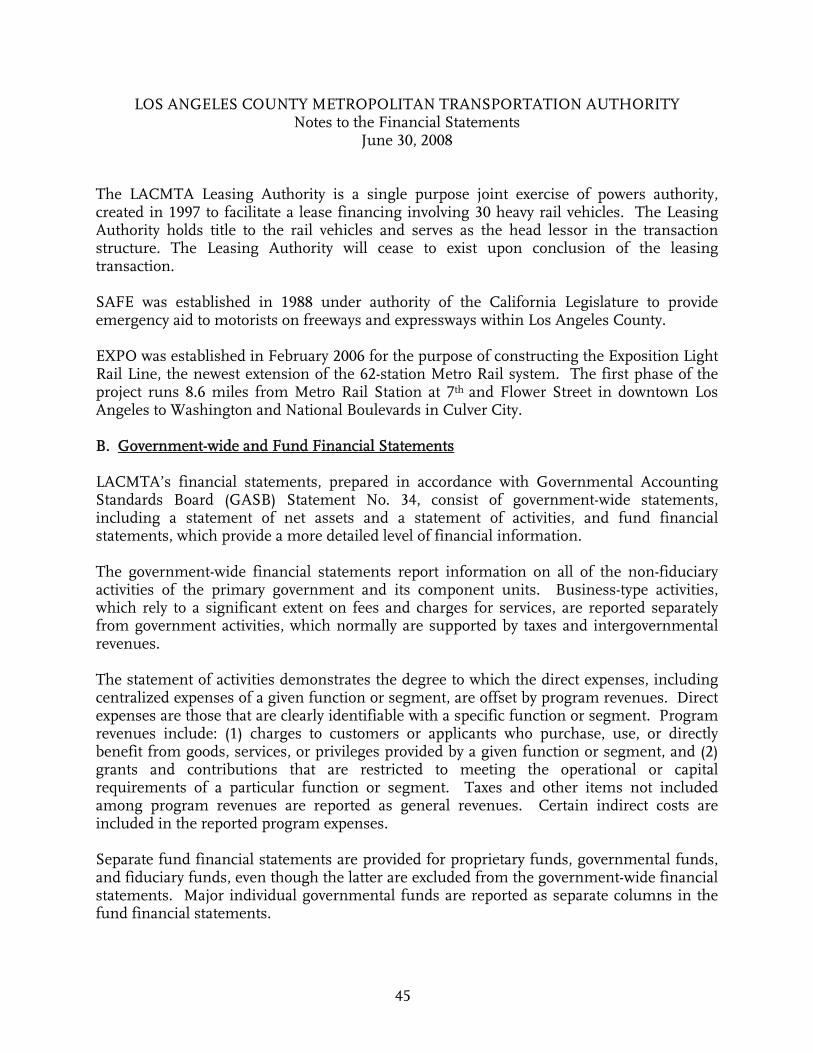
LOS ANGELES COUNTY METROPOLITAN TRANSPORTATION AUTHORITY Notes to the Financial Statements
June 30, 2008
45
The LACMTA Leasing Authority is a single purpose joint exercise of powers authority, created in 1997 to facilitate a lease financing involving 30 heavy rail vehicles. The Leasing Authority holds title to the rail vehicles and serves as the head lessor in the transaction structure. The Leasing Authority will cease to exist upon conclusion of the leasing transaction. SAFE was established in 1988 under authority of the California Legislature to provide emergency aid to motorists on freeways and expressways within Los Angeles County. EXPO was established in February 2006 for the purpose of constructing the Exposition Light Rail Line, the newest extension of the 62-station Metro Rail system. The first phase of the project runs 8.6 miles from Metro Rail Station at 7th and Flower Street in downtown Los Angeles to Washington and National Boulevards in Culver City. B. Government-wide and Fund Financial Statements LACMTA’s financial statements, prepared in accordance with Governmental Accounting Standards Board (GASB) Statement No. 34, consist of government-wide statements, including a statement of net assets and a statement of activities, and fund financial statements, which provide a more detailed level of financial information. The government-wide financial statements report information on all of the non-fiduciary activities of the primary government and its component units. Business-type activities, which rely to a significant extent on fees and charges for services, are reported separately from government activities, which normally are supported by taxes and intergovernmental revenues. The statement of activities demonstrates the degree to which the direct expenses, including centralized expenses of a given function or segment, are offset by program revenues. Direct expenses are those that are clearly identifiable with a specific function or segment. Program revenues include: (1) charges to customers or applicants who purchase, use, or directly benefit from goods, services, or privileges provided by a given function or segment, and (2) grants and contributions that are restricted to meeting the operational or capital requirements of a particular function or segment. Taxes and other items not included among program revenues are reported as general revenues. Certain indirect costs are included in the reported program expenses. Separate fund financial statements are provided for proprietary funds, governmental funds, and fiduciary funds, even though the latter are excluded from the government-wide financial statements. Major individual governmental funds are reported as separate columns in the fund financial statements.

LOS ANGELES COUNTY METROPOLITAN TRANSPORTATION AUTHORITY Notes to the Financial Statements
June 30, 2008
46
C. Measurement Focus, Basis of Accounting, and Financial Statement Presentation The government-wide and the proprietary fund financial statements are reported using the economic resources measurement focus and the accrual basis of accounting. Revenues are recorded when earned and expenses are recorded when a liability is incurred, regardless of the timing of related cash flows. Grants and contributions are recognized as revenues as soon as all eligibility requirements imposed by the provider have been met. The fiduciary fund financial statements also use the accrual basis of accounting and are reported using the economics resources measurement focus. Governmental fund financial statements are reported using the current financial resources measurement focus and the modified accrual basis of accounting. Revenues are recognized as soon as they are both measurable and available. Revenues are considered to be available when they are collectible within the current period or soon enough thereafter to pay liabilities of the current period. For this purpose, LACMTA considers revenues to be available if they are collected within 90 days of the end of the current fiscal period. Expenditures generally are recorded when a liability is incurred and a valid claim is presented. However, long-tem debts are recorded only when payment is due. Interest associated with the current fiscal period are subject to accrual and have been recognized as revenues of the current fiscal period. Private-sector standards of accounting and financial reporting issued prior to December 1, 1989, generally are followed in both the government-wide and proprietary fund financial statements to the extent that those standards do not conflict with or contradict guidance of the GASB. LACMTA also has the option of following subsequent private-sector guidance for their business-type activities and enterprise funds, subject to the same limitation. LACMTA has elected not to follow subsequent private-sector guidance. The effect of interfund activity has been eliminated from the government-wide financial statements. However, intra-activity billing for services provided and used are not eliminated in the process of consolidation. Amounts reported as program revenues include: (1) charges to customers of transit services or privileges provided, (2) operating grants and contributions, and (3) capital grants and contributions. General revenues include all taxes, investment, and miscellaneous revenues.
LOS ANGELES COUNTY METROPOLITAN TRANSPORTATION AUTHORITY Notes to the Financial Statements
June 30, 2008
47
Proprietary funds distinguish operating revenues and expenses from non-operating items. Operating revenues and expenses generally result from providing services and producing and delivering goods in connection with a proprietary fund’s principal ongoing operations. The principal operating revenues of LACMTA’s enterprise fund are charges to customers for services. Operating expenses include the cost of services, administrative expenses and depreciation on capital assets. All revenues and expenses not meeting this definition are reported as non-operating revenues and expenses. When both restricted and unrestricted resources are available for use, it is LACMTA’s policy to use restricted resources first. Unrestricted resources are used as they are needed. Fund Accounting
LACMTA utilizes fund accounting to report its financial position and the results of its operations. Fund accounting is designed to demonstrate legal compliance and to aid financial management by segregating transactions related to certain governmental functions or activities. A fund is a separate accounting entity with a self-balancing set of accounts. Funds are classified into three categories: proprietary, governmental, and fiduciary, as described below. The Proprietary fund is used to account for LACMTA’s ongoing operations and activities similar to those found in the private sector where the determination of net income is necessary or useful to provide sound financial administration. The Enterprise fund is LACMTA’s only proprietary fund. LACMTA’s Enterprise fund is used to account for operations that are financed and operated in a manner similar to private businesses where the intent is that costs, including depreciation, of providing goods or services to the general public on a continuing basis be recovered primarily through user charges and governmental transfers. LACMTA reports all operations-related transactions, including capital and related debt, in the Enterprise fund. All major transit operations capital projects are partially funded by proceeds from debt secured by sales tax revenue, State and Federal grants, and contributions from the governmental funds. Sales tax secured debt is reported as liabilities in the enterprise fund. The financial resources used to pay the debt principal and interests are reported as contributions from the governmental funds.
LOS ANGELES COUNTY METROPOLITAN TRANSPORTATION AUTHORITY Notes to the Financial Statements
June 30, 2008
48
Governmental funds are used to account for LACMTA’s governmental activities. The measurement focus is the determination of changes in financial position, rather than net income determination. LACMTA uses the following governmental fund types: General fund is used to account for those financial resources that are not required to be accounted for in another fund. The general fund is one of LACMTA’s major governmental funds. Special revenue funds are used to account for proceeds of specific revenue sources including sales tax that are legally restricted to expenditures for specified purposes. The following are LACMTA’s other major governmental funds:
Proposition A – This fund is used to account for the proceeds of the voter-approved one-half percent sales tax that became effective on July 1, 1982. Revenues collected are to be allocated: 25 percent to local jurisdictions for local transit; 35 percent to be used for construction and operation of rail rapid transit systems; and 40 percent is allocated at the discretion of LACMTA. Proposition C – The “Los Angeles County Anti-Gridlock Transit Improvement Fund” is used to account for the proceeds of the voter-approved one-half percent sales tax that became effective on April 1, 1991. Revenues collected are to be allocated: 5 percent to improve and expand rail and bus security; 10 percent for Commuter Rail and construction of transit centers, park-and-ride lots and freeway bus stops; 20 percent to local jurisdictions for public transit, and related services; 25 percent for essential county-wide transit-related improvements to freeways and state highways; and 40 percent to improve and expand rail and bus transit county-wide. Public Transportation Modernization, Improvement and Service Enhancement Account (PTMISEA) - This fund is part of the Highway Safety, Traffic Reduction, Air Quality, and Port Security Bond Act of 2006. This fund is intended to fund projects, to protect the environment and public health, conserve energy, reduce congestion, and to provide alternative mobility and access choices for Californians. Transportation Development Act (TDA) – This fund is used to account for revenues received from the State as part of the Transportation Development Act and are paid out to various transit operators, including LACMTA, for operating and capital uses. State Transit Assistance (STA) – This fund is used to account for revenue received from the State Assistance Program of the Transportation Development Act, which provides formulas to determine the uses of the proceeds.
LOS ANGELES COUNTY METROPOLITAN TRANSPORTATION AUTHORITY Notes to the Financial Statements
June 30, 2008
49
The LACMTA also has the following nonmajor special revenue funds: Traffic Congestion Relief Program (TCRP) – This fund is used to account for revenue received from the State for projects that relieve congestion, provide for the safe and efficient movement of goods, and provide inter-modal connectivity of transportation systems throughout California. Service Authority for Freeway Emergencies (SAFE) – This fund is used to account for revenues received from the State Department of Motor Vehicles, generated by a $1 per car registration fee in Los Angeles County to improve freeway emergency responses program, including call box operations. Propositions A and C, TDA Administration – This fund is used strictly to account for administrative activities, including planning, execution, use and conduct of projects and programs, funded by Propositions A and C and TDA.
Fiduciary funds are used to account for assets held by LACMTA in a trustee capacity or as an agent for individuals, private organizations, other governmental units, or other funds. Fiduciary funds include the following fund types:
Pension trust funds account for the assets of the five defined benefit pension plans that LACMTA administers, and are accounted for in essentially the same manner as the proprietary funds. Other Postemployment Benefits (OPEB) trust funds account for the resources held in trust by LACMTA for the benefits of members and beneficiaries not offered as an integral part of a pension plan. Agency funds are custodial in nature and do not present results of operations. These include two benefit assessment districts.
D. Assets, Liabilities, and Net Assets
Deposits and Investments LACMTA’s cash and cash equivalents include cash on hand, demand deposits, and short-term investments with original maturities of 90 days or less at the date of acquisition. Investments include instruments or deposits beyond the 90-day original maturities. State statutes and LACMTA’s policy allows LACMTA to invest in US Treasury, commercial paper, repurchase agreements, and the State Treasurer’s Investment pool. LACMTA’s investments are reported at fair value which is the quoted market price.
LOS ANGELES COUNTY METROPOLITAN TRANSPORTATION AUTHORITY Notes to the Financial Statements
June 30, 2008
50
Receivables and Payables Activities between funds that are representative of lending/borrowing arrangements outstanding at the end of the fiscal year are referred to as due to/from other funds. Any residual balance outstanding between the governmental activities is reported in the government-wide financial statements as internal balances. All receivables are shown net of allowance for doubtful accounts. Inventories and Prepaid Items Inventories, consisting primarily of bus and rail vehicle parts, are valued at weighted average cost. Inventory items of governmental funds are recorded as expenditures when consumed. Certain payments to vendors applicable to future accounting periods are recorded as prepaid items. Restricted and Designated Assets Certain cash, cash equivalents, and investments are classified as designated or restricted assets on the statement of net assets and balance sheets. Restricted assets are maintained in separate accounts and their use is externally restricted for debt service, construction, and asset acquisitions. Designated assets are separate unrestricted funds designated by management to pay for self-insurance claims related to public liability and property damages, and workers’ compensation liabilities. Capital Assets Capital assets are reported in the applicable business-type or governmental activities in the government-wide financial statements. Capital assets are defined by LACMTA as assets with an initial individual cost of more than $2,500 (amount not in thousands). Such assets are recorded at historical cost if purchased or constructed. If donated, capital assets are recorded at estimated fair market value at the date of donation. The cost of normal maintenance and repairs that do not add to the value of the asset or materially extend the asset’s life are expensed. Capital assets in the proprietary funds are recorded at cost.
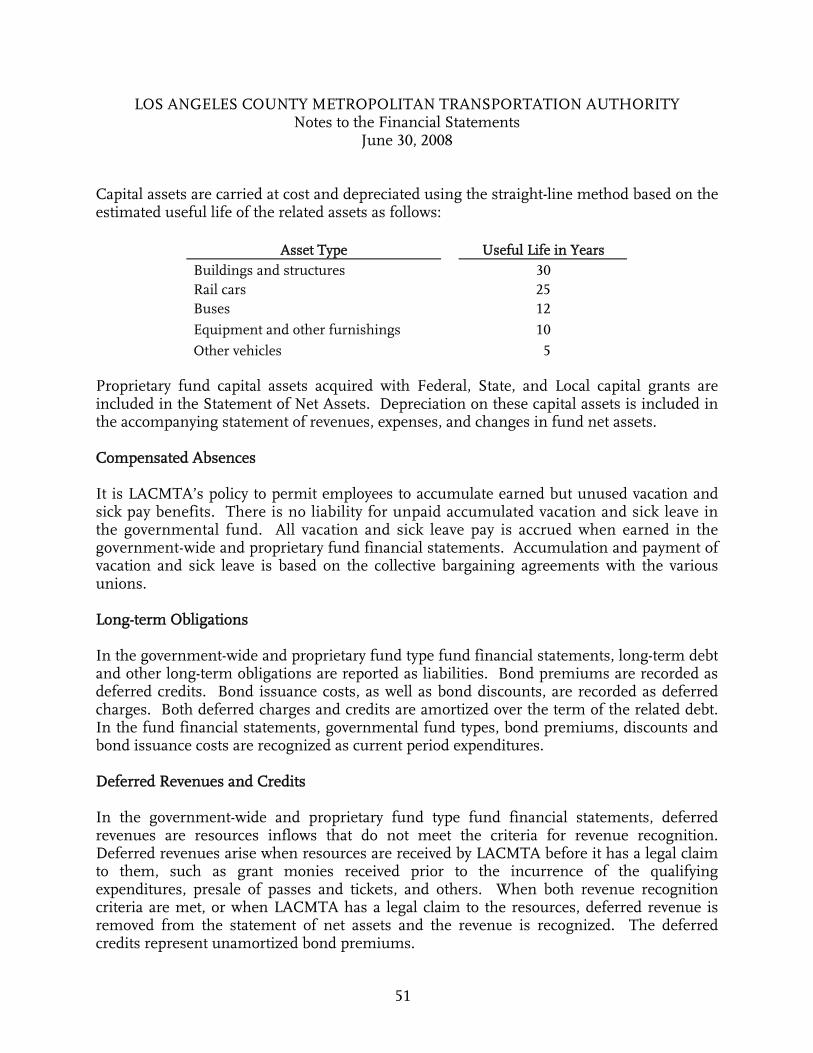
LOS ANGELES COUNTY METROPOLITAN TRANSPORTATION AUTHORITY Notes to the Financial Statements
June 30, 2008
51
Capital assets are carried at cost and depreciated using the straight-line method based on the estimated useful life of the related assets as follows:
Asset Type Useful Life in Years Buildings and structures 30 Rail cars 25 Buses 12 Equipment and other furnishings 10 Other vehicles 5
Proprietary fund capital assets acquired with Federal, State, and Local capital grants are included in the Statement of Net Assets. Depreciation on these capital assets is included in the accompanying statement of revenues, expenses, and changes in fund net assets. Compensated Absences It is LACMTA’s policy to permit employees to accumulate earned but unused vacation and sick pay benefits. There is no liability for unpaid accumulated vacation and sick leave in the governmental fund. All vacation and sick leave pay is accrued when earned in the government-wide and proprietary fund financial statements. Accumulation and payment of vacation and sick leave is based on the collective bargaining agreements with the various unions. Long-term Obligations In the government-wide and proprietary fund type fund financial statements, long-term debt and other long-term obligations are reported as liabilities. Bond premiums are recorded as deferred credits. Bond issuance costs, as well as bond discounts, are recorded as deferred charges. Both deferred charges and credits are amortized over the term of the related debt. In the fund financial statements, governmental fund types, bond premiums, discounts and bond issuance costs are recognized as current period expenditures. Deferred Revenues and Credits In the government-wide and proprietary fund type fund financial statements, deferred revenues are resources inflows that do not meet the criteria for revenue recognition. Deferred revenues arise when resources are received by LACMTA before it has a legal claim to them, such as grant monies received prior to the incurrence of the qualifying expenditures, presale of passes and tickets, and others. When both revenue recognition criteria are met, or when LACMTA has a legal claim to the resources, deferred revenue is removed from the statement of net assets and the revenue is recognized. The deferred credits represent unamortized bond premiums.
LOS ANGELES COUNTY METROPOLITAN TRANSPORTATION AUTHORITY Notes to the Financial Statements
June 30, 2008
52
II. STEWARDSHIP, COMPLIANCE, AND ACCOUNTABILITY
A. Budgetary Information In February of each year, all LACMTA departments submit requests for appropriations to management so that an operational and capital projects budget can be prepared. The proposed budgets are submitted to the Board in May for review. Prior to adoption, the Board conducts public hearings for discussion of the proposed annual budgets. The Board adopts the final budget at the conclusion of the hearings, which is planned to occur no later than June 30. Enabling legislation and adopted policies and procedures provide that LACMTA’s Board approve an annual budget. Annual budgets are adopted on a basis consistent with generally accepted accounting principles for all governmental and proprietary funds. The Board also approves the life of project budget whenever new capital projects are approved. All non-capital appropriations lapse at fiscal year-end. The appropriated budget is prepared by fund, cost center, expense type, and project. The legal level of control is at the fund level and the Board must approve additional appropriations. By policy, the Board has provided procedures for management to make revisions within operational or project budgets only when there is no net dollar impact to the total appropriations at the fund level. Quarterly updates for operating and capital expenditures are submitted to the Board. Budget amendments are made when needed. LACMTA employs the following practices and procedures in establishing budgetary data on a basis consistent with GAAP as reflected in the basic financial statements. B. Encumbrances Encumbrance accounting is employed in the general and special revenue funds. Under this method, purchase orders, contracts, Memoranda of Understanding (MOU), and other commitments outstanding at year-end are reported as reservations of fund balances since they do not constitute expenditures or liabilities. These commitments will be recognized in subsequent years’ appropriations.
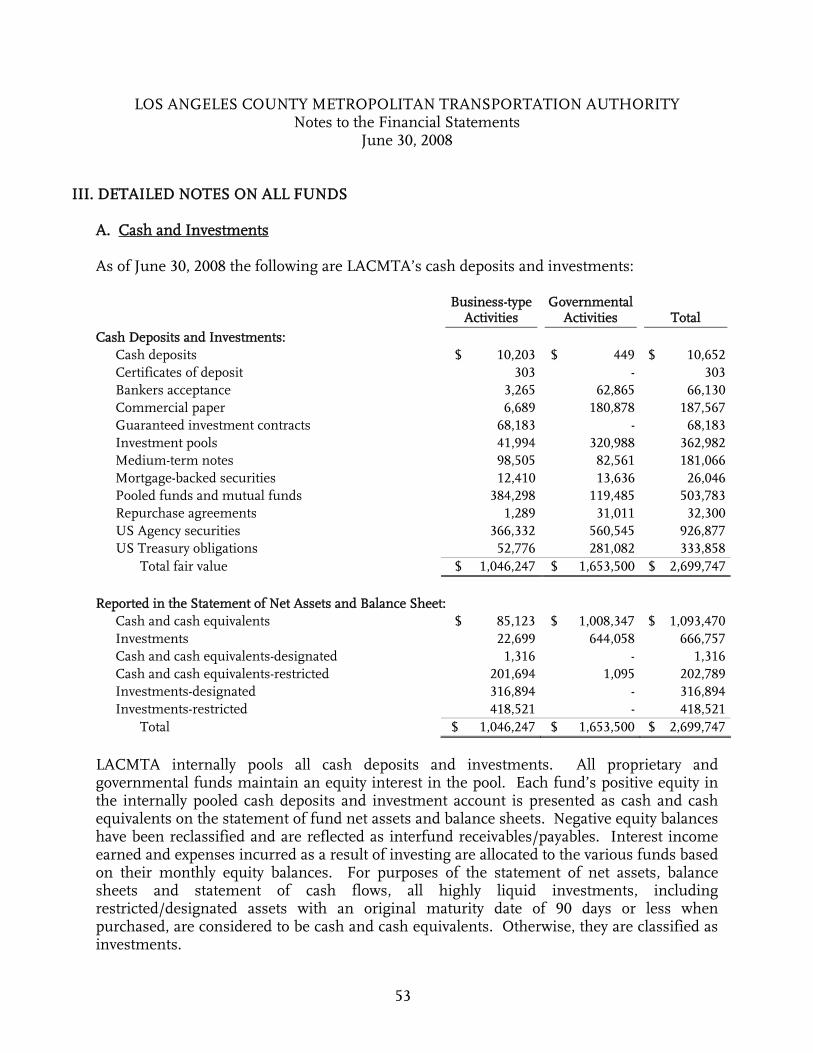
LOS ANGELES COUNTY METROPOLITAN TRANSPORTATION AUTHORITY Notes to the Financial Statements
June 30, 2008
53
III. DETAILED NOTES ON ALL FUNDS A. Cash and Investments As of June 30, 2008 the following are LACMTA’s cash deposits and investments:
Business-type
Activities Governmental
Activities Total Cash Deposits and Investments: Cash deposits $ 10,203 $ 449 $ 10,652 Certificates of deposit 303 - 303 Bankers acceptance 3,265 62,865 66,130 Commercial paper 6,689 180,878 187,567 Guaranteed investment contracts 68,183 - 68,183 Investment pools 41,994 320,988 362,982 Medium-term notes 98,505 82,561 181,066 Mortgage-backed securities 12,410 13,636 26,046 Pooled funds and mutual funds 384,298 119,485 503,783 Repurchase agreements 1,289 31,011 32,300 US Agency securities 366,332 560,545 926,877 US Treasury obligations 52,776 281,082 333,858 Total fair value $ 1,046,247 $ 1,653,500 $ 2,699,747 Reported in the Statement of Net Assets and Balance Sheet: Cash and cash equivalents $ 85,123 $ 1,008,347 $ 1,093,470 Investments 22,699 644,058 666,757 Cash and cash equivalents-designated 1,316 - 1,316 Cash and cash equivalents-restricted 201,694 1,095 202,789 Investments-designated 316,894 - 316,894 Investments-restricted 418,521 - 418,521 Total $ 1,046,247 $ 1,653,500 $ 2,699,747
LACMTA internally pools all cash deposits and investments. All proprietary and governmental funds maintain an equity interest in the pool. Each fund’s positive equity in the internally pooled cash deposits and investment account is presented as cash and cash equivalents on the statement of fund net assets and balance sheets. Negative equity balances have been reclassified and are reflected as interfund receivables/payables. Interest income earned and expenses incurred as a result of investing are allocated to the various funds based on their monthly equity balances. For purposes of the statement of net assets, balance sheets and statement of cash flows, all highly liquid investments, including restricted/designated assets with an original maturity date of 90 days or less when purchased, are considered to be cash and cash equivalents. Otherwise, they are classified as investments.
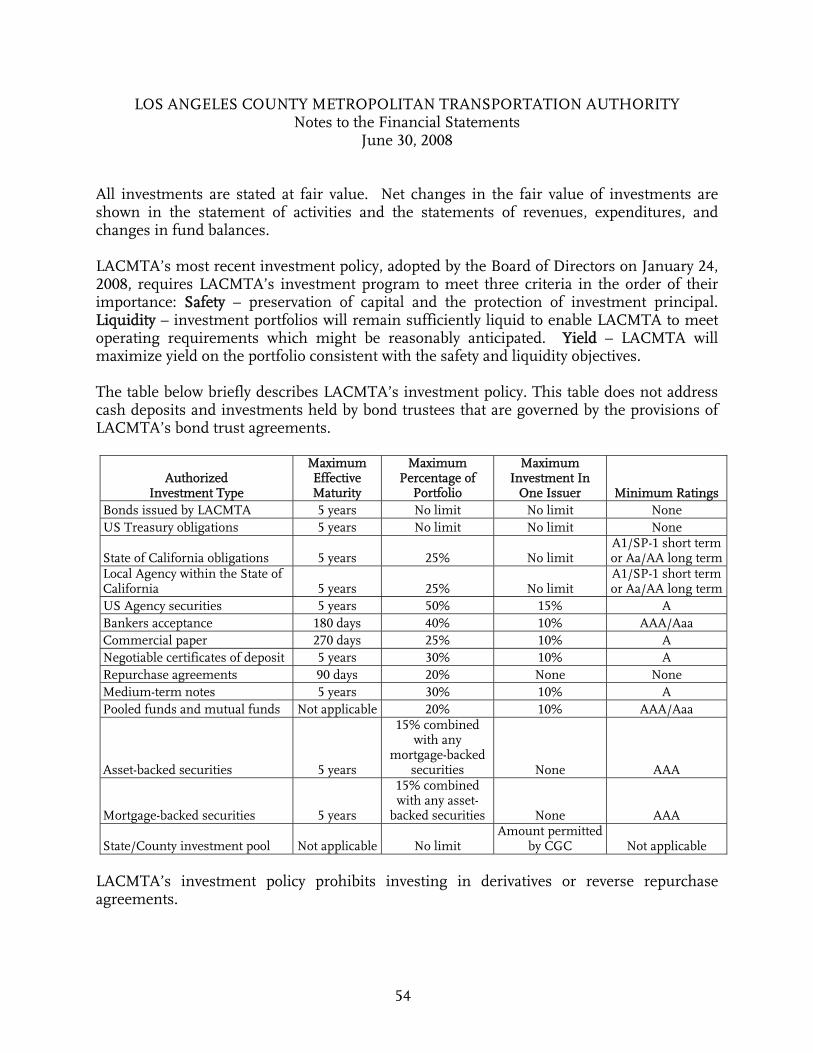
LOS ANGELES COUNTY METROPOLITAN TRANSPORTATION AUTHORITY Notes to the Financial Statements
June 30, 2008
54
All investments are stated at fair value. Net changes in the fair value of investments are shown in the statement of activities and the statements of revenues, expenditures, and changes in fund balances.
LACMTA’s most recent investment policy, adopted by the Board of Directors on January 24, 2008, requires LACMTA’s investment program to meet three criteria in the order of their importance: Safety – preservation of capital and the protection of investment principal. Liquidity – investment portfolios will remain sufficiently liquid to enable LACMTA to meet operating requirements which might be reasonably anticipated. Yield – LACMTA will maximize yield on the portfolio consistent with the safety and liquidity objectives. The table below briefly describes LACMTA’s investment policy. This table does not address cash deposits and investments held by bond trustees that are governed by the provisions of LACMTA’s bond trust agreements.
Authorized Investment Type
Maximum Effective Maturity
Maximum Percentage of
Portfolio
Maximum Investment In
One Issuer Minimum Ratings Bonds issued by LACMTA 5 years No limit No limit None US Treasury obligations 5 years No limit No limit None
State of California obligations 5 years 25% No limit A1/SP-1 short term or Aa/AA long term
Local Agency within the State of California 5 years 25% No limit
A1/SP-1 short term or Aa/AA long term
US Agency securities 5 years 50% 15% A Bankers acceptance 180 days 40% 10% AAA/Aaa Commercial paper 270 days 25% 10% A Negotiable certificates of deposit 5 years 30% 10% A Repurchase agreements 90 days 20% None None Medium-term notes 5 years 30% 10% A Pooled funds and mutual funds Not applicable 20% 10% AAA/Aaa
Asset-backed securities 5 years
15% combined with any
mortgage-backed securities None AAA
Mortgage-backed securities 5 years
15% combined with any asset-
backed securities None AAA
State/County investment pool Not applicable No limit Amount permitted
by CGC Not applicable LACMTA’s investment policy prohibits investing in derivatives or reverse repurchase agreements.
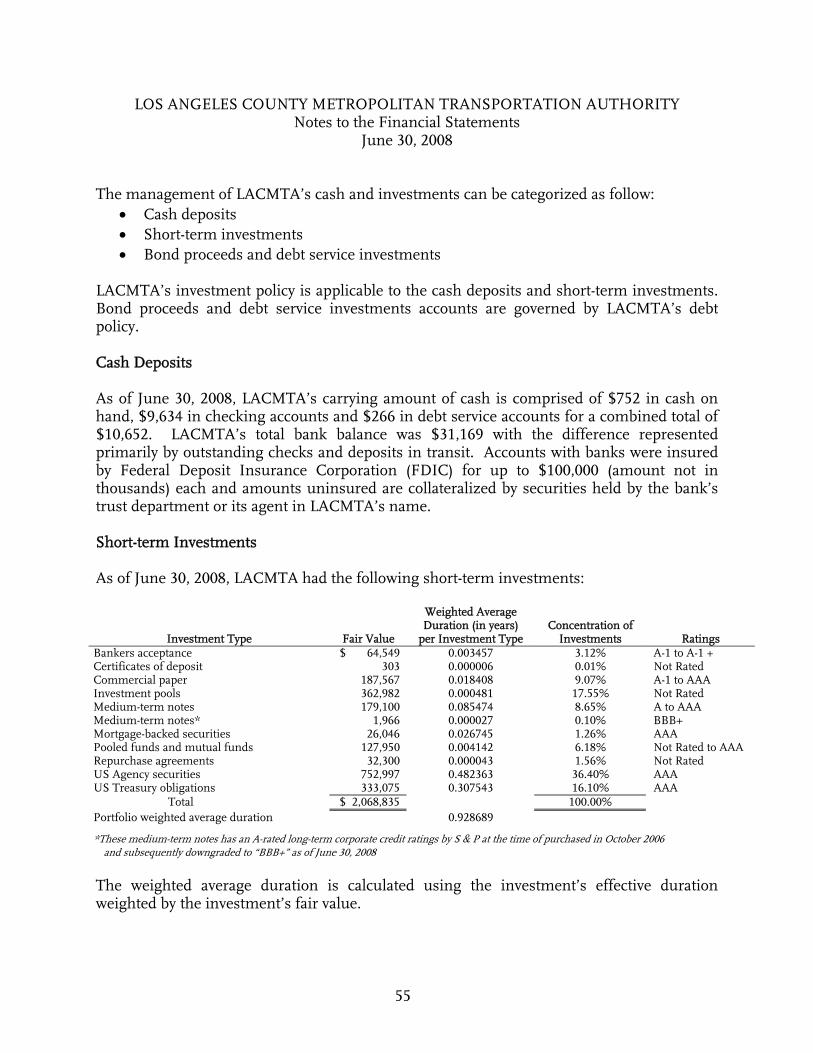
LOS ANGELES COUNTY METROPOLITAN TRANSPORTATION AUTHORITY Notes to the Financial Statements
June 30, 2008
55
The management of LACMTA’s cash and investments can be categorized as follow: • Cash deposits • Short-term investments • Bond proceeds and debt service investments
LACMTA’s investment policy is applicable to the cash deposits and short-term investments. Bond proceeds and debt service investments accounts are governed by LACMTA’s debt policy. Cash Deposits As of June 30, 2008, LACMTA’s carrying amount of cash is comprised of $752 in cash on hand, $9,634 in checking accounts and $266 in debt service accounts for a combined total of $10,652. LACMTA’s total bank balance was $31,169 with the difference represented primarily by outstanding checks and deposits in transit. Accounts with banks were insured by Federal Deposit Insurance Corporation (FDIC) for up to $100,000 (amount not in thousands) each and amounts uninsured are collateralized by securities held by the bank’s trust department or its agent in LACMTA’s name. Short-term Investments As of June 30, 2008, LACMTA had the following short-term investments:
Investment Type Fair Value
Weighted Average Duration (in years)
per Investment Type Concentration of
Investments Ratings Bankers acceptance $ 64,549 0.003457 3.12% A-1 to A-1 + Certificates of deposit 303 0.000006 0.01% Not Rated Commercial paper 187,567 0.018408 9.07% A-1 to AAA Investment pools 362,982 0.000481 17.55% Not Rated Medium-term notes 179,100 0.085474 8.65% A to AAA Medium-term notes* 1,966 0.000027 0.10% BBB+ Mortgage-backed securities 26,046 0.026745 1.26% AAA Pooled funds and mutual funds 127,950 0.004142 6.18% Not Rated to AAA Repurchase agreements 32,300 0.000043 1.56% Not Rated US Agency securities 752,997 0.482363 36.40% AAA US Treasury obligations 333,075 0.307543 16.10% AAA Total $ 2,068,835 100.00% Portfolio weighted average duration 0.928689 *These medium-term notes has an A-rated long-term corporate credit ratings by S & P at the time of purchased in October 2006
and subsequently downgraded to “BBB+” as of June 30, 2008
The weighted average duration is calculated using the investment’s effective duration weighted by the investment’s fair value.
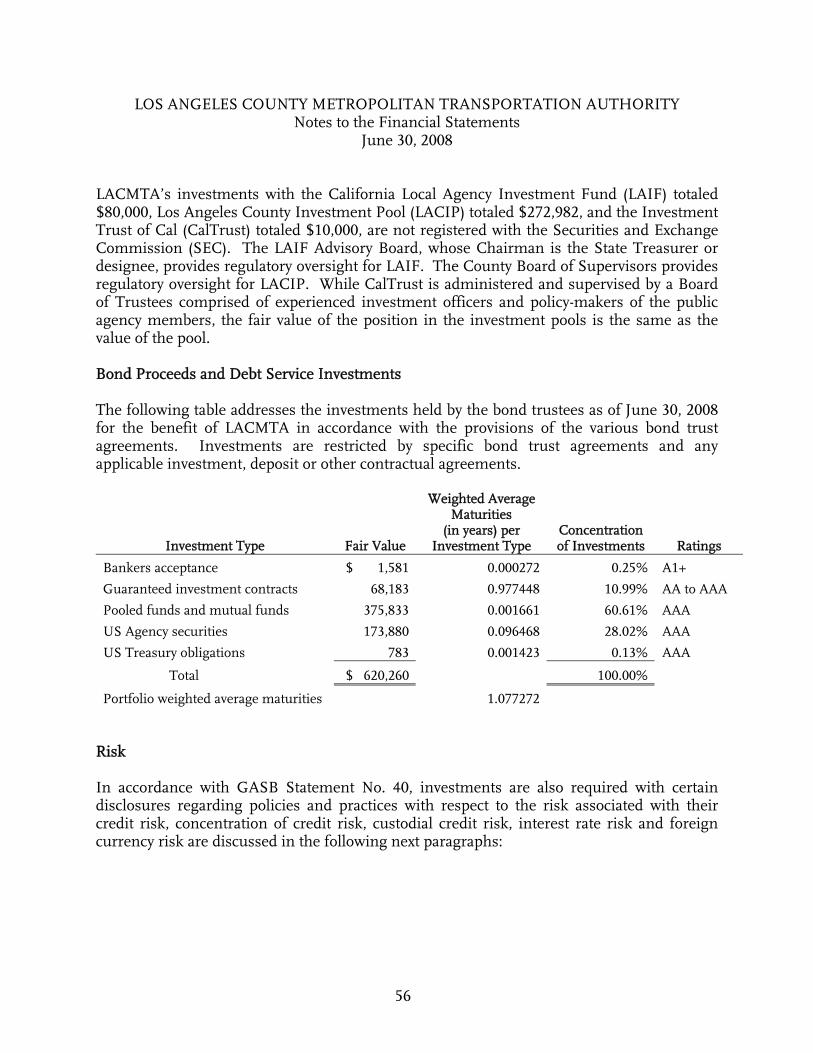
LOS ANGELES COUNTY METROPOLITAN TRANSPORTATION AUTHORITY Notes to the Financial Statements
June 30, 2008
56
LACMTA’s investments with the California Local Agency Investment Fund (LAIF) totaled $80,000, Los Angeles County Investment Pool (LACIP) totaled $272,982, and the Investment Trust of Cal (CalTrust) totaled $10,000, are not registered with the Securities and Exchange Commission (SEC). The LAIF Advisory Board, whose Chairman is the State Treasurer or designee, provides regulatory oversight for LAIF. The County Board of Supervisors provides regulatory oversight for LACIP. While CalTrust is administered and supervised by a Board of Trustees comprised of experienced investment officers and policy-makers of the public agency members, the fair value of the position in the investment pools is the same as the value of the pool. Bond Proceeds and Debt Service Investments The following table addresses the investments held by the bond trustees as of June 30, 2008 for the benefit of LACMTA in accordance with the provisions of the various bond trust agreements. Investments are restricted by specific bond trust agreements and any applicable investment, deposit or other contractual agreements.
Investment Type Fair Value
Weighted Average Maturities
(in years) per Investment Type
Concentration of Investments Ratings
Bankers acceptance $ 1,581 0.000272 0.25% A1+
Guaranteed investment contracts 68,183 0.977448 10.99% AA to AAA
Pooled funds and mutual funds 375,833 0.001661 60.61% AAA
US Agency securities 173,880 0.096468 28.02% AAA
US Treasury obligations 783 0.001423 0.13% AAA
Total $ 620,260 100.00%
Portfolio weighted average maturities 1.077272
Risk In accordance with GASB Statement No. 40, investments are also required with certain disclosures regarding policies and practices with respect to the risk associated with their credit risk, concentration of credit risk, custodial credit risk, interest rate risk and foreign currency risk are discussed in the following next paragraphs:
LOS ANGELES COUNTY METROPOLITAN TRANSPORTATION AUTHORITY Notes to the Financial Statements
June 30, 2008
57
Credit Risk Investments are subject to credit risk, which is the chance that an issuer will fail to pay principal or interest in a timely manner, or that negative perceptions of the issuer’s ability to make these payments will cause price to decline. The tables above for short-term investments and bond proceeds and debt service investments summarized the market value of investment and the related credit ratings. LACMTA maintains policies to manage credit risk which include requiring minimum credit ratings issued by nationally recognized statistical rating organizations for its investments.
Concentration of Credit Risk
Concentration of credit risk is the risk associated with a lack of diversification or having too much invested in a few individual shares. As disclosed above, LACMTA maintains investment policies that establish thresholds for holdings of individual securities. LACMTA does not have any holdings meeting or exceeding these threshold levels. As of June 30, 2008, LACMTA doesn’t have any investments with more than 5 percent of the total investments under one issuer.
Custodial Credit Risk LACMTA has no known custodial credit risk for deposits as financial institutions are required by The California Government Code to collateralize deposits of public funds by pledging government securities as collateral. Such collateralization of public funds is accomplished by pooling. The market value of pledged securities must be in accordance with the Government Code for the State of California. California law also allows financial institutions to collateralize public fund deposits by governmental securities with a value of 110 percent of the deposit or by pledging first trust deed mortgage notes having a value of 150 percent of a governmental unit’s total deposits. LACMTA may waive collateral requirements for deposits that are fully insured up to $100,000 (amount not in thousands) by the FDIC. All investment securities purchased were held and registered in LACMTA’s name and maintained for the benefit of the LACMTA in the trust department or safekeeping department of a financial institution as established by a written third party safekeeping agreement between LACMTA and the financial institution.
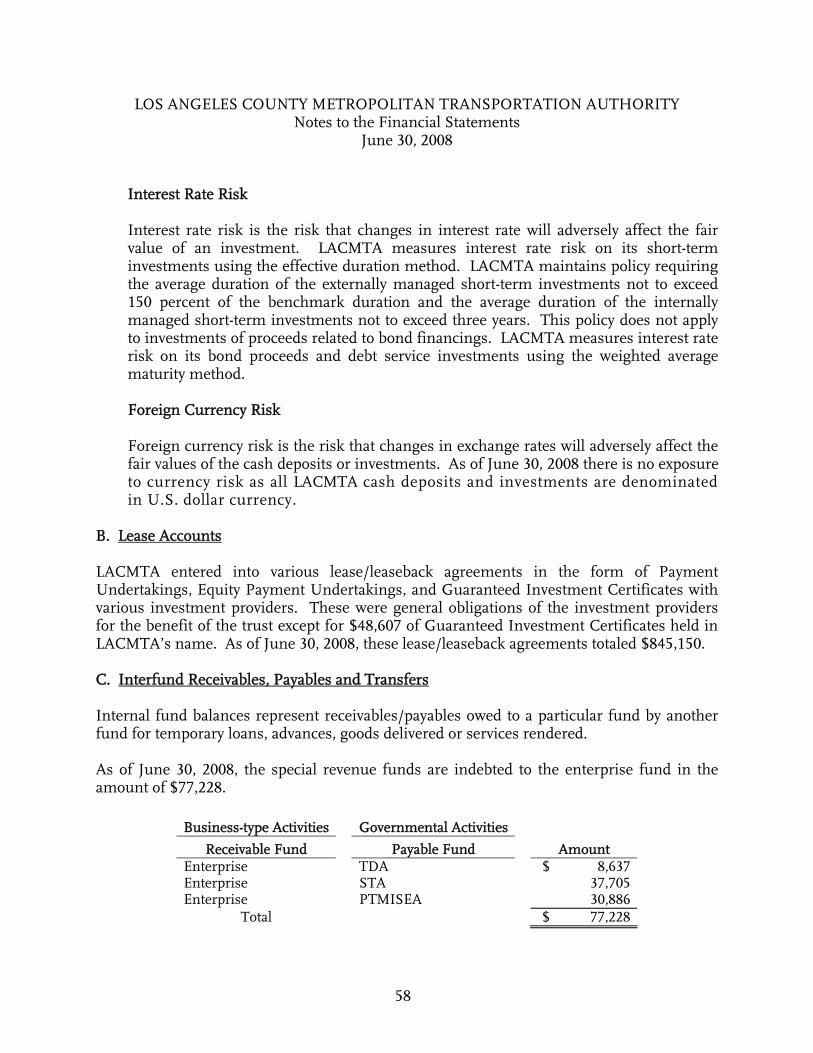
LOS ANGELES COUNTY METROPOLITAN TRANSPORTATION AUTHORITY Notes to the Financial Statements
June 30, 2008
58
Interest Rate Risk Interest rate risk is the risk that changes in interest rate will adversely affect the fair value of an investment. LACMTA measures interest rate risk on its short-term investments using the effective duration method. LACMTA maintains policy requiring the average duration of the externally managed short-term investments not to exceed 150 percent of the benchmark duration and the average duration of the internally managed short-term investments not to exceed three years. This policy does not apply to investments of proceeds related to bond financings. LACMTA measures interest rate risk on its bond proceeds and debt service investments using the weighted average maturity method.
Foreign Currency Risk
Foreign currency risk is the risk that changes in exchange rates will adversely affect the fair values of the cash deposits or investments. As of June 30, 2008 there is no exposure to currency risk as all LACMTA cash deposits and investments are denominated in U.S. dollar currency.
B. Lease Accounts LACMTA entered into various lease/leaseback agreements in the form of Payment Undertakings, Equity Payment Undertakings, and Guaranteed Investment Certificates with various investment providers. These were general obligations of the investment providers for the benefit of the trust except for $48,607 of Guaranteed Investment Certificates held in LACMTA’s name. As of June 30, 2008, these lease/leaseback agreements totaled $845,150. C. Interfund Receivables, Payables and Transfers Internal fund balances represent receivables/payables owed to a particular fund by another fund for temporary loans, advances, goods delivered or services rendered. As of June 30, 2008, the special revenue funds are indebted to the enterprise fund in the amount of $77,228.
Business-type Activities Governmental Activities
Receivable Fund Payable Fund Amount Enterprise TDA $ 8,637 Enterprise STA 37,705 Enterprise PTMISEA 30,886
Total $ 77,228

LOS ANGELES COUNTY METROPOLITAN TRANSPORTATION AUTHORITY Notes to the Financial Statements
June 30, 2008
59
Transfers in and out by fund are as follows:
* Enterprise fund bond proceeds are used to finance HOV lane improvements on various major highway projects.
Transfers represent permanent, legally authorized transfers from a fund receiving revenue to the fund through which resources are to be expended. These transfers represent operating and capital subsidies given out from one fund to another fund. D. Receivables Receivables as of June 30, 2008, as shown in the government-wide financial statements, in the aggregate, including the applicable allowance for doubtful accounts, are as follows:
Business-type Governmental
Receivables Activities Activities Total
Accounts $ 24,330 $ 3,513 $ 27,843 Notes 726 - 726 Interest 5,505 9,206 14,711 Intergovernmental 49,105 9,339 58,444 Sales Tax - 131,931 131,931
Gross Receivables 79,666 153,989 233,655 Less: Allowances for doubtful accounts (3,225) - (3,225)
Net Receivables $ 76,441 $ 153,989 $ 230,430
Transfers In
Transfers Out Enterprise
Fund General
Fund Proposition C
Fund Other Special
Revenue Funds Total General Fund $ 43,237 $ - $ 530 $ - $ 43,767 Prop A 462,544 2,265 61,911 32,815 559,535 Prop C 150,358 161 - 11,976 162,495 PTMISEA 109,087 - 42 - 109,129 TDA 199,214 - 116 5,368 204,698 STA 77,409 - - - 77,409 Other Special Revenue - - 1,678 - 1,678 Enterprise Fund (850)* - 850 - -
Total $ 1,040,999 $ 2,426 $ 65,127 $ 50,159 $ 1,158,711
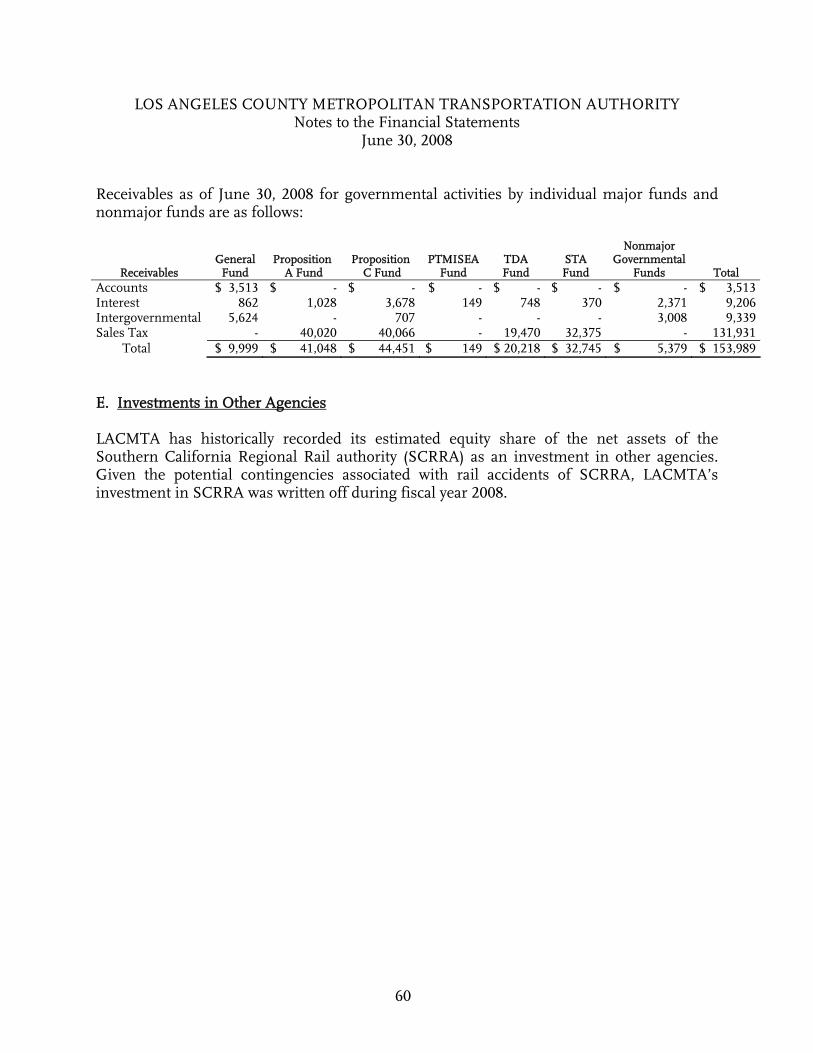
LOS ANGELES COUNTY METROPOLITAN TRANSPORTATION AUTHORITY Notes to the Financial Statements
June 30, 2008
60
Receivables as of June 30, 2008 for governmental activities by individual major funds and nonmajor funds are as follows:
Receivables General
Fund Proposition
A Fund Proposition
C Fund PTMISEA
Fund TDA Fund
STA Fund
Nonmajor Governmental
Funds Total Accounts $ 3,513 $ - $ - $ - $ - $ - $ - $ 3,513 Interest 862 1,028 3,678 149 748 370 2,371 9,206 Intergovernmental 5,624 - 707 - - - 3,008 9,339 Sales Tax - 40,020 40,066 - 19,470 32,375 - 131,931 Total $ 9,999 $ 41,048 $ 44,451 $ 149 $ 20,218 $ 32,745 $ 5,379 $ 153,989 E. Investments in Other Agencies LACMTA has historically recorded its estimated equity share of the net assets of the Southern California Regional Rail authority (SCRRA) as an investment in other agencies. Given the potential contingencies associated with rail accidents of SCRRA, LACMTA’s investment in SCRRA was written off during fiscal year 2008.
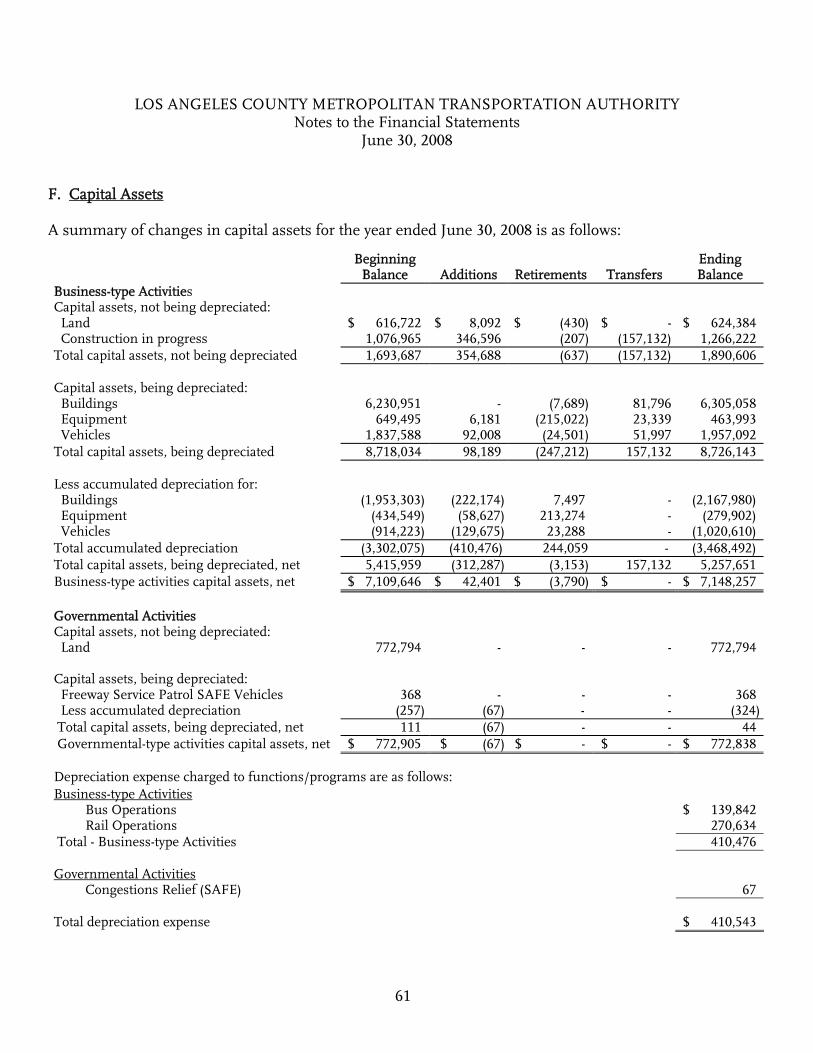
LOS ANGELES COUNTY METROPOLITAN TRANSPORTATION AUTHORITY Notes to the Financial Statements
June 30, 2008
61
F. Capital Assets A summary of changes in capital assets for the year ended June 30, 2008 is as follows:
Beginning Balance Additions Retirements Transfers
Ending Balance
Business-type Activities Capital assets, not being depreciated: Land $ 616,722 $ 8,092 $ (430) $ - $ 624,384 Construction in progress 1,076,965 346,596 (207) (157,132) 1,266,222 Total capital assets, not being depreciated 1,693,687 354,688 (637) (157,132) 1,890,606
Capital assets, being depreciated: Buildings 6,230,951 - (7,689) 81,796 6,305,058 Equipment 649,495 6,181 (215,022) 23,339 463,993 Vehicles 1,837,588 92,008 (24,501) 51,997 1,957,092 Total capital assets, being depreciated 8,718,034 98,189 (247,212) 157,132 8,726,143
Less accumulated depreciation for: Buildings (1,953,303) (222,174) 7,497 - (2,167,980) Equipment (434,549) (58,627) 213,274 - (279,902) Vehicles (914,223) (129,675) 23,288 - (1,020,610) Total accumulated depreciation (3,302,075) (410,476) 244,059 - (3,468,492) Total capital assets, being depreciated, net 5,415,959 (312,287) (3,153) 157,132 5,257,651 Business-type activities capital assets, net $ 7,109,646 $ 42,401 $ (3,790) $ - $ 7,148,257
Governmental Activities Capital assets, not being depreciated: Land 772,794 - - - 772,794
Capital assets, being depreciated: Freeway Service Patrol SAFE Vehicles 368 - - - 368 Less accumulated depreciation (257) (67) - - (324) Total capital assets, being depreciated, net 111 (67) - - 44 Governmental-type activities capital assets, net $ 772,905 $ (67) $ - $ - $ 772,838 Depreciation expense charged to functions/programs are as follows: Business-type Activities Bus Operations $ 139,842 Rail Operations 270,634 Total - Business-type Activities 410,476 Governmental Activities Congestions Relief (SAFE) 67 Total depreciation expense $ 410,543
LOS ANGELES COUNTY METROPOLITAN TRANSPORTATION AUTHORITY Notes to the Financial Statements
June 30, 2008
62
G. Risk Management The primary emphasis of risk management activities at LACMTA is to prevent or minimize the risk of injury to persons and damage to, or loss of property. Where losses cannot be prevented, LACMTA endeavors to self-insure or to assume such losses as it may deem advisable and economical, giving due consideration to the frequency and severity of probable losses. The consideration of the effect of potential self-insured or assumed losses is part of LACMTA’s financial planning process. For its construction projects, LACMTA currently makes provisions to avoid the risk of accidental loss from construction through a contractor controlled insurance program (CCIP). These policies provide property, liability, and workers’ compensation insurance and cover many of the risks arising from the work of contractors and subcontractors on LACMTA construction projects. Operations The reserves for the workers’ compensation and the public liability and property damage claims are actuarially determined and subject to periodic adjustment as conditions warrant. The reserves are discounted using an average rate of return of 3.0 percent. LACMTA believes that the estimated liability for self-insured claims as of June 30, 2008 will be sufficient to cover any costs arising from claims filed or to be filed for incidents that occurred through that date. The liability is based, in part, upon an independent actuarial estimate of reserves required for unsettled claims including losses that have been incurred but not reported and legal expenses but excluding direct administration costs both by LACMTA employees and third party administrators. Prior to September 1, 1998, LACMTA was fully self-insured for workers’ compensation claims and administered by a third party administrator. Between September 1, 1998, and August 31, 2001, an outside insurance carrier insured LACMTA for workers’ compensation claims. Effective September 1, 2001, the workers’ compensation program is both self-insured and self-administered by LACMTA. As of June 30, 2008, a designated investment has been set aside in the amount of $220,022 equal to the workers’ compensation liabilities. LACMTA is partially self-insured for public liability and property damage for non-construction activities up to $4,500 per occurrence. LACMTA has acquired outside insurance coverage for losses of $95,500 in excess of self-insurance retentions for every policy year. LACMTA is self-insured for losses in excess of $95,500 for each policy year. As of June 30, 2008, a designated investment has been set aside in the amount of $98,592, equal to the property and casualty liabilities.
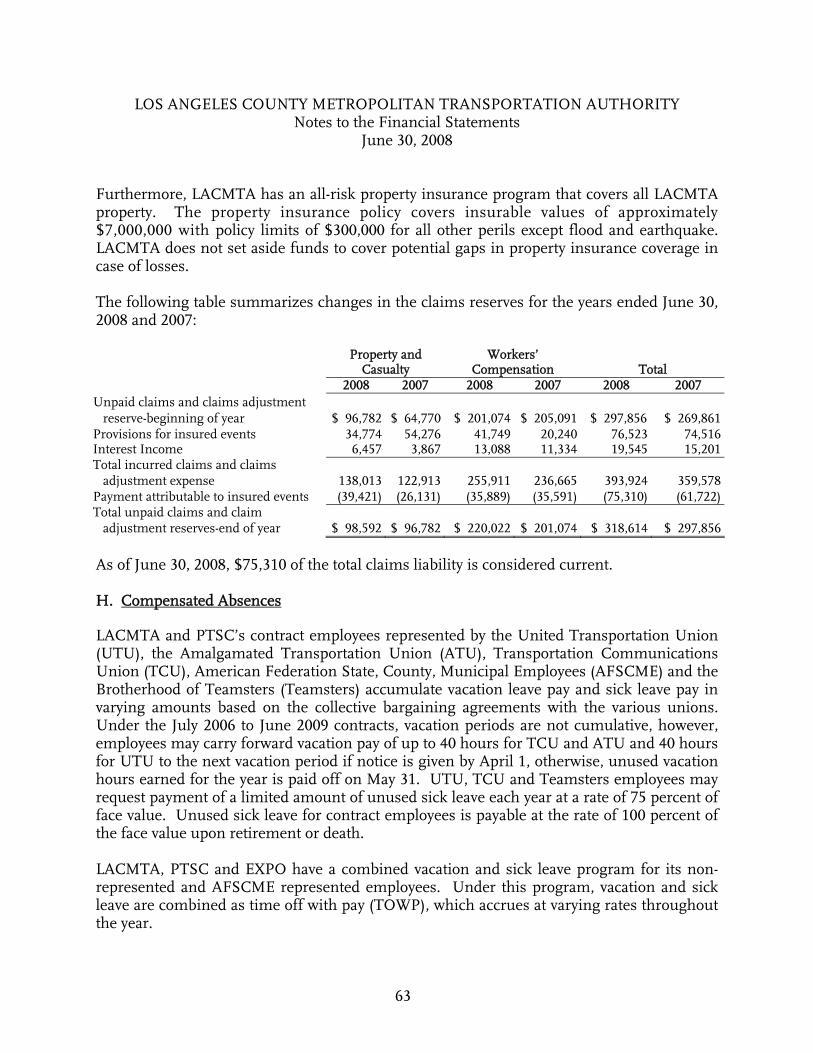
LOS ANGELES COUNTY METROPOLITAN TRANSPORTATION AUTHORITY Notes to the Financial Statements
June 30, 2008
63
Furthermore, LACMTA has an all-risk property insurance program that covers all LACMTA property. The property insurance policy covers insurable values of approximately $7,000,000 with policy limits of $300,000 for all other perils except flood and earthquake. LACMTA does not set aside funds to cover potential gaps in property insurance coverage in case of losses. The following table summarizes changes in the claims reserves for the years ended June 30, 2008 and 2007: Property and
Casualty Workers’
Compensation Total 2008 2007 2008 2007 2008 2007 Unpaid claims and claims adjustment reserve-beginning of year $ 96,782 $ 64,770 $ 201,074 $ 205,091 $ 297,856 $ 269,861 Provisions for insured events 34,774 54,276 41,749 20,240 76,523 74,516 Interest Income 6,457 3,867 13,088 11,334 19,545 15,201 Total incurred claims and claims adjustment expense 138,013 122,913 255,911 236,665 393,924 359,578 Payment attributable to insured events (39,421) (26,131) (35,889) (35,591) (75,310) (61,722) Total unpaid claims and claim adjustment reserves-end of year $ 98,592 $ 96,782 $ 220,022 $ 201,074 $ 318,614 $ 297,856 As of June 30, 2008, $75,310 of the total claims liability is considered current. H. Compensated Absences LACMTA and PTSC’s contract employees represented by the United Transportation Union (UTU), the Amalgamated Transportation Union (ATU), Transportation Communications Union (TCU), American Federation State, County, Municipal Employees (AFSCME) and the Brotherhood of Teamsters (Teamsters) accumulate vacation leave pay and sick leave pay in varying amounts based on the collective bargaining agreements with the various unions. Under the July 2006 to June 2009 contracts, vacation periods are not cumulative, however, employees may carry forward vacation pay of up to 40 hours for TCU and ATU and 40 hours for UTU to the next vacation period if notice is given by April 1, otherwise, unused vacation hours earned for the year is paid off on May 31. UTU, TCU and Teamsters employees may request payment of a limited amount of unused sick leave each year at a rate of 75 percent of face value. Unused sick leave for contract employees is payable at the rate of 100 percent of the face value upon retirement or death. LACMTA, PTSC and EXPO have a combined vacation and sick leave program for its non-represented and AFSCME represented employees. Under this program, vacation and sick leave are combined as time off with pay (TOWP), which accrues at varying rates throughout the year.
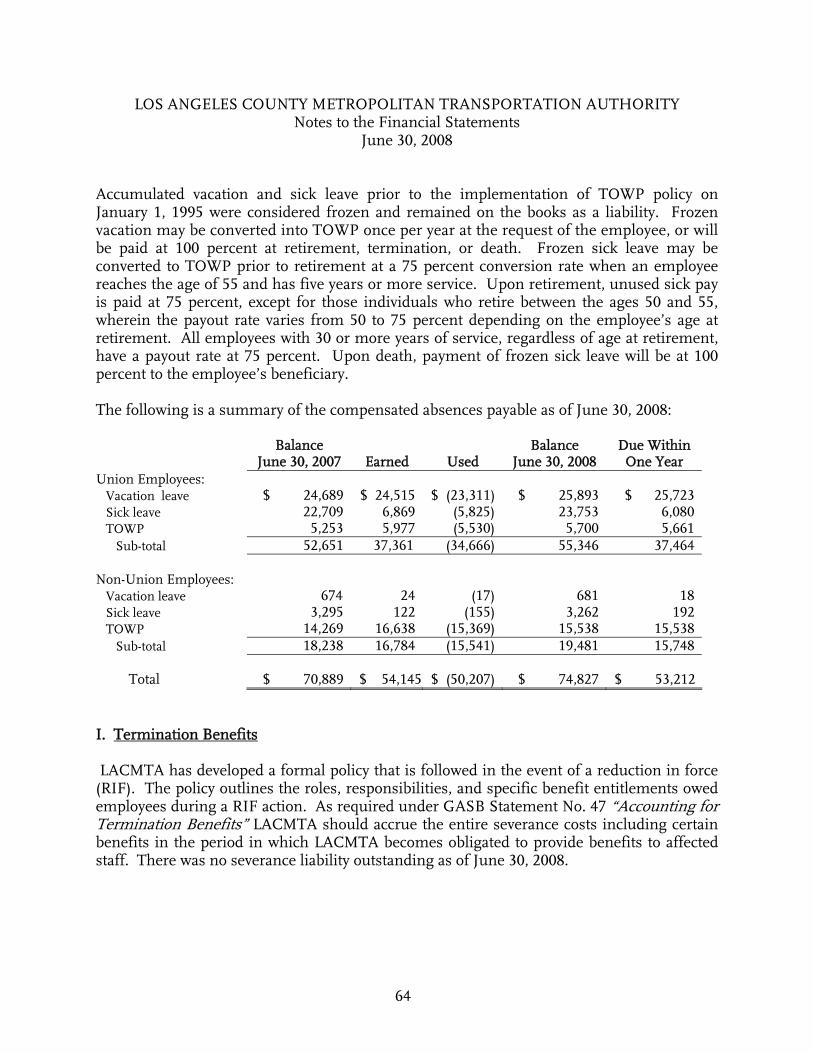
LOS ANGELES COUNTY METROPOLITAN TRANSPORTATION AUTHORITY Notes to the Financial Statements
June 30, 2008
64
Accumulated vacation and sick leave prior to the implementation of TOWP policy on January 1, 1995 were considered frozen and remained on the books as a liability. Frozen vacation may be converted into TOWP once per year at the request of the employee, or will be paid at 100 percent at retirement, termination, or death. Frozen sick leave may be converted to TOWP prior to retirement at a 75 percent conversion rate when an employee reaches the age of 55 and has five years or more service. Upon retirement, unused sick pay is paid at 75 percent, except for those individuals who retire between the ages 50 and 55, wherein the payout rate varies from 50 to 75 percent depending on the employee’s age at retirement. All employees with 30 or more years of service, regardless of age at retirement, have a payout rate at 75 percent. Upon death, payment of frozen sick leave will be at 100 percent to the employee’s beneficiary. The following is a summary of the compensated absences payable as of June 30, 2008:
Balance
June 30, 2007 Earned Used Balance
June 30, 2008 Due Within
One Year Union Employees: Vacation leave $ 24,689 $ 24,515 $ (23,311) $ 25,893 $ 25,723 Sick leave 22,709 6,869 (5,825) 23,753 6,080 TOWP 5,253 5,977 (5,530) 5,700 5,661 Sub-total 52,651 37,361 (34,666) 55,346 37,464 Non-Union Employees: Vacation leave 674 24 (17) 681 18 Sick leave 3,295 122 (155) 3,262 192 TOWP 14,269 16,638 (15,369) 15,538 15,538 Sub-total 18,238 16,784 (15,541) 19,481 15,748 Total $ 70,889 $ 54,145 $ (50,207) $ 74,827 $ 53,212 I. Termination Benefits LACMTA has developed a formal policy that is followed in the event of a reduction in force (RIF). The policy outlines the roles, responsibilities, and specific benefit entitlements owed employees during a RIF action. As required under GASB Statement No. 47 “Accounting for Termination Benefits” LACMTA should accrue the entire severance costs including certain benefits in the period in which LACMTA becomes obligated to provide benefits to affected staff. There was no severance liability outstanding as of June 30, 2008.
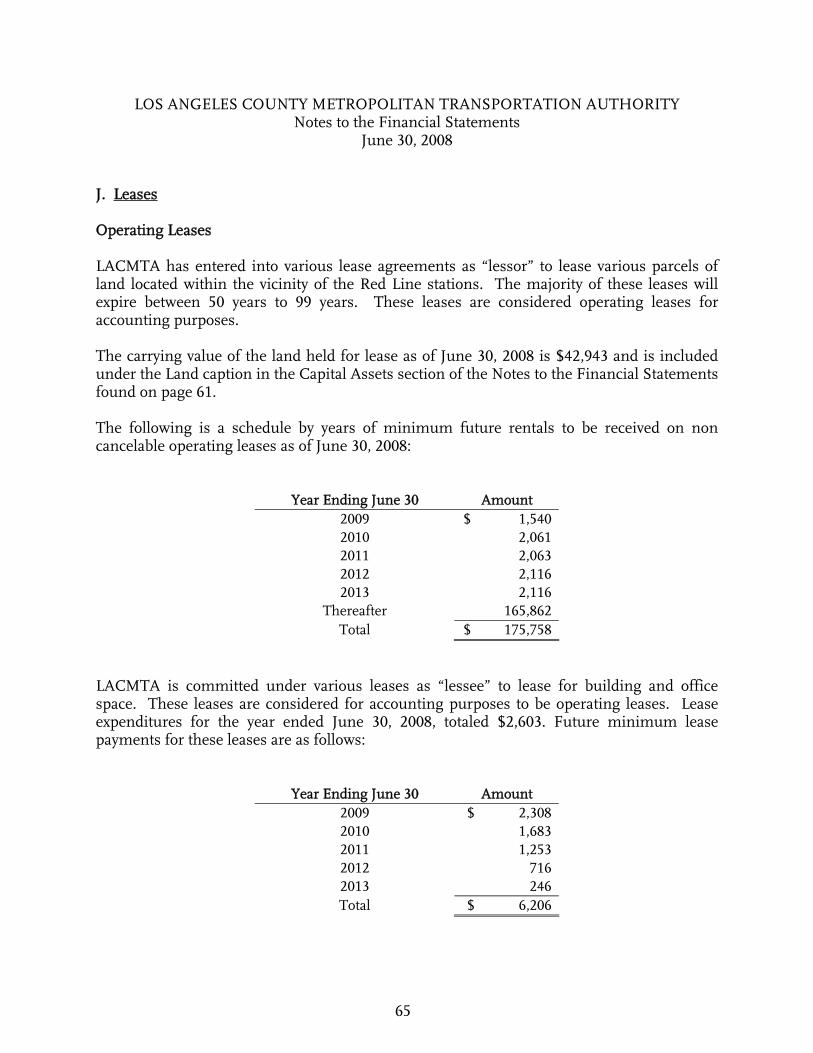
LOS ANGELES COUNTY METROPOLITAN TRANSPORTATION AUTHORITY Notes to the Financial Statements
June 30, 2008
65
J. Leases Operating Leases LACMTA has entered into various lease agreements as “lessor” to lease various parcels of land located within the vicinity of the Red Line stations. The majority of these leases will expire between 50 years to 99 years. These leases are considered operating leases for accounting purposes. The carrying value of the land held for lease as of June 30, 2008 is $42,943 and is included under the Land caption in the Capital Assets section of the Notes to the Financial Statements found on page 61. The following is a schedule by years of minimum future rentals to be received on non cancelable operating leases as of June 30, 2008:
Year Ending June 30 Amount 2009 $ 1,540 2010 2,061 2011 2,063 2012 2,116 2013 2,116
Thereafter 165,862 Total $ 175,758
LACMTA is committed under various leases as “lessee” to lease for building and office space. These leases are considered for accounting purposes to be operating leases. Lease expenditures for the year ended June 30, 2008, totaled $2,603. Future minimum lease payments for these leases are as follows:
Year Ending June 30 Amount 2009 $ 2,308 2010 1,683 2011 1,253 2012 716 2013 246 Total $ 6,206
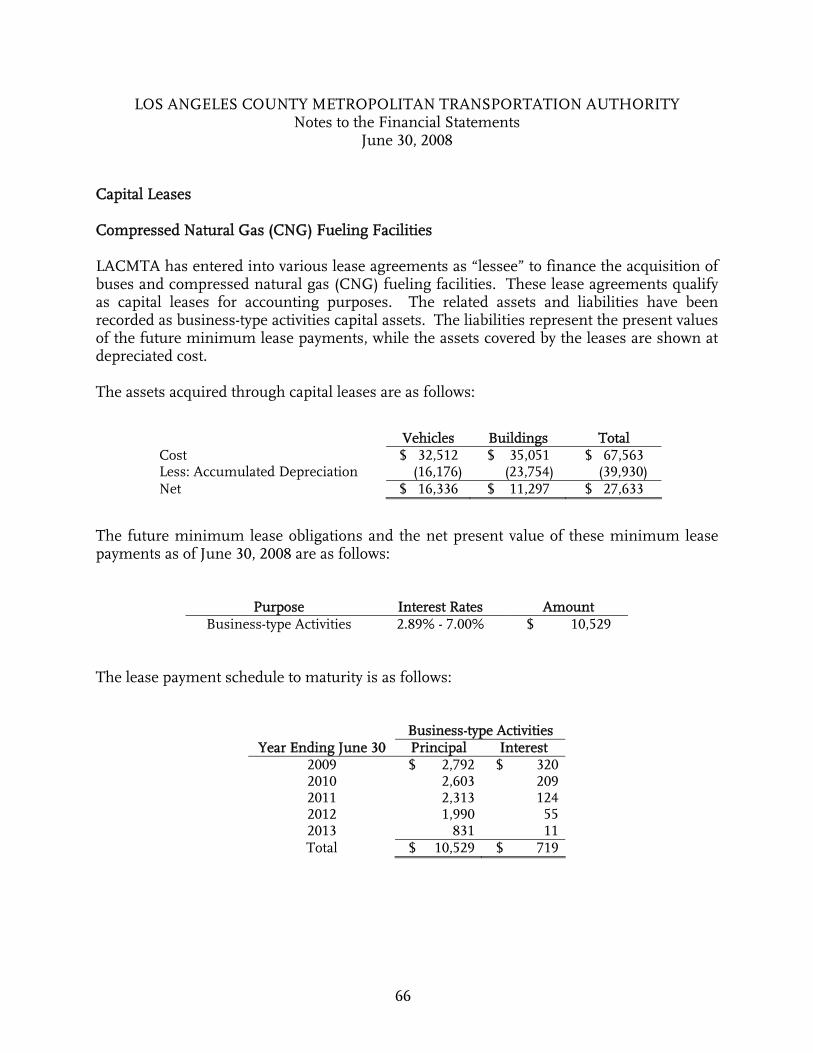
LOS ANGELES COUNTY METROPOLITAN TRANSPORTATION AUTHORITY Notes to the Financial Statements
June 30, 2008
66
Capital Leases Compressed Natural Gas (CNG) Fueling Facilities LACMTA has entered into various lease agreements as “lessee” to finance the acquisition of buses and compressed natural gas (CNG) fueling facilities. These lease agreements qualify as capital leases for accounting purposes. The related assets and liabilities have been recorded as business-type activities capital assets. The liabilities represent the present values of the future minimum lease payments, while the assets covered by the leases are shown at depreciated cost. The assets acquired through capital leases are as follows: The future minimum lease obligations and the net present value of these minimum lease payments as of June 30, 2008 are as follows:
Purpose Interest Rates Amount Business-type Activities 2.89% - 7.00% $ 10,529
The lease payment schedule to maturity is as follows:
Business-type Activities Year Ending June 30 Principal Interest
2009 $ 2,792 $ 320 2010 2,603 209 2011 2,313 124 2012 1,990 55 2013 831 11 Total $ 10,529 $ 719
Vehicles Buildings Total Cost $ 32,512 $ 35,051 $ 67,563 Less: Accumulated Depreciation (16,176) (23,754) (39,930) Net $ 16,336 $ 11,297 $ 27,633
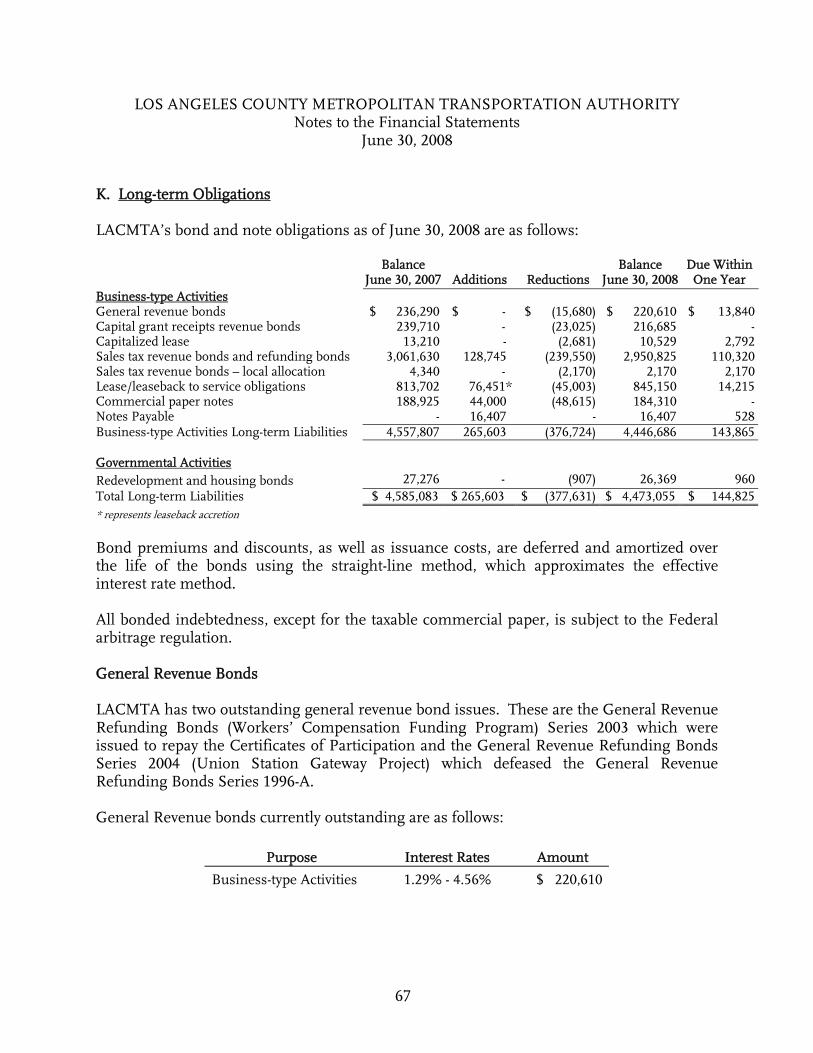
LOS ANGELES COUNTY METROPOLITAN TRANSPORTATION AUTHORITY Notes to the Financial Statements
June 30, 2008
67
K. Long-term Obligations LACMTA’s bond and note obligations as of June 30, 2008 are as follows:
Balance
June 30, 2007 Additions Reductions Balance
June 30, 2008 Due Within
One Year Business-type Activities General revenue bonds $ 236,290 $ - $ (15,680) $ 220,610 $ 13,840 Capital grant receipts revenue bonds 239,710 - (23,025) 216,685 - Capitalized lease 13,210 - (2,681) 10,529 2,792 Sales tax revenue bonds and refunding bonds 3,061,630 128,745 (239,550) 2,950,825 110,320 Sales tax revenue bonds – local allocation 4,340 - (2,170) 2,170 2,170 Lease/leaseback to service obligations 813,702 76,451* (45,003) 845,150 14,215 Commercial paper notes 188,925 44,000 (48,615) 184,310 - Notes Payable - 16,407 - 16,407 528 Business-type Activities Long-term Liabilities 4,557,807 265,603 (376,724) 4,446,686 143,865 Governmental Activities Redevelopment and housing bonds 27,276 - (907) 26,369 960 Total Long-term Liabilities $ 4,585,083 $ 265,603 $ (377,631) $ 4,473,055 $ 144,825 * represents leaseback accretion Bond premiums and discounts, as well as issuance costs, are deferred and amortized over the life of the bonds using the straight-line method, which approximates the effective interest rate method. All bonded indebtedness, except for the taxable commercial paper, is subject to the Federal arbitrage regulation. General Revenue Bonds LACMTA has two outstanding general revenue bond issues. These are the General Revenue Refunding Bonds (Workers’ Compensation Funding Program) Series 2003 which were issued to repay the Certificates of Participation and the General Revenue Refunding Bonds Series 2004 (Union Station Gateway Project) which defeased the General Revenue Refunding Bonds Series 1996-A. General Revenue bonds currently outstanding are as follows:
Purpose Interest Rates Amount
Business-type Activities 1.29% - 4.56% $ 220,610
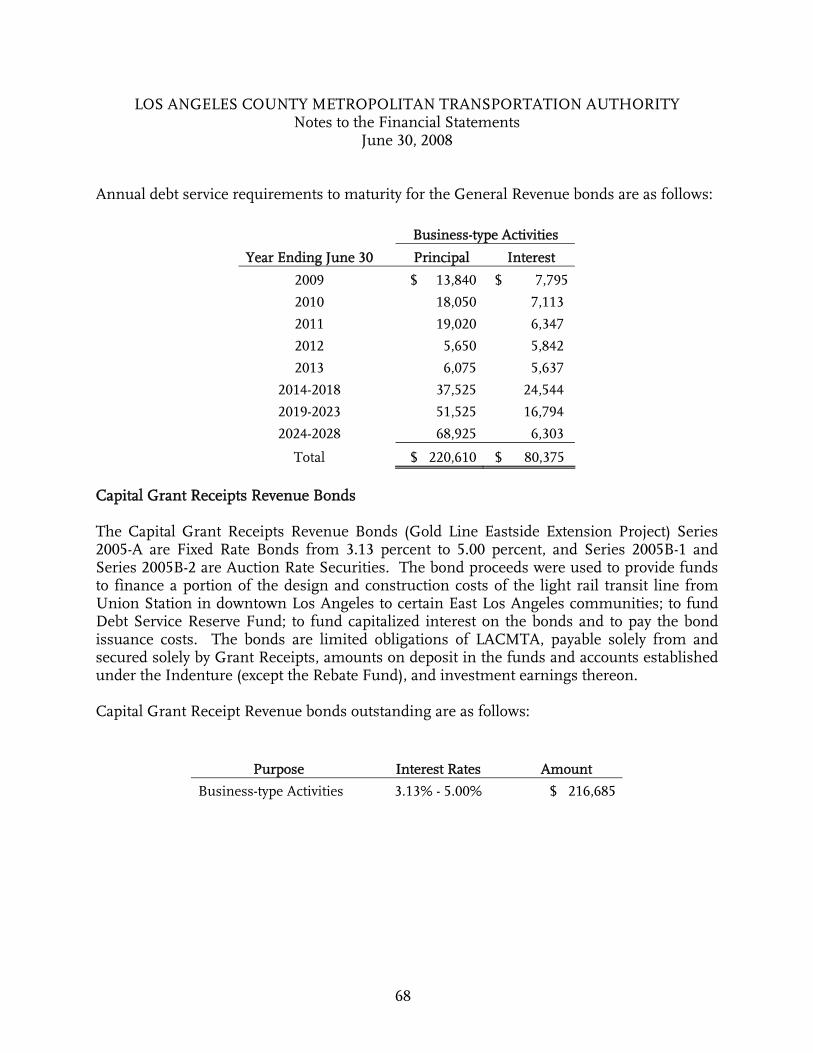
LOS ANGELES COUNTY METROPOLITAN TRANSPORTATION AUTHORITY Notes to the Financial Statements
June 30, 2008
68
Annual debt service requirements to maturity for the General Revenue bonds are as follows:
Business-type Activities
Year Ending June 30 Principal Interest
2009 $ 13,840 $ 7,795
2010 18,050 7,113
2011 19,020 6,347
2012 5,650 5,842
2013 6,075 5,637
2014-2018 37,525 24,544
2019-2023 51,525 16,794
2024-2028 68,925 6,303
Total $ 220,610 $ 80,375
Capital Grant Receipts Revenue Bonds The Capital Grant Receipts Revenue Bonds (Gold Line Eastside Extension Project) Series 2005-A are Fixed Rate Bonds from 3.13 percent to 5.00 percent, and Series 2005B-1 and Series 2005B-2 are Auction Rate Securities. The bond proceeds were used to provide funds to finance a portion of the design and construction costs of the light rail transit line from Union Station in downtown Los Angeles to certain East Los Angeles communities; to fund Debt Service Reserve Fund; to fund capitalized interest on the bonds and to pay the bond issuance costs. The bonds are limited obligations of LACMTA, payable solely from and secured solely by Grant Receipts, amounts on deposit in the funds and accounts established under the Indenture (except the Rebate Fund), and investment earnings thereon. Capital Grant Receipt Revenue bonds outstanding are as follows:
Purpose Interest Rates Amount
Business-type Activities 3.13% - 5.00% $ 216,685
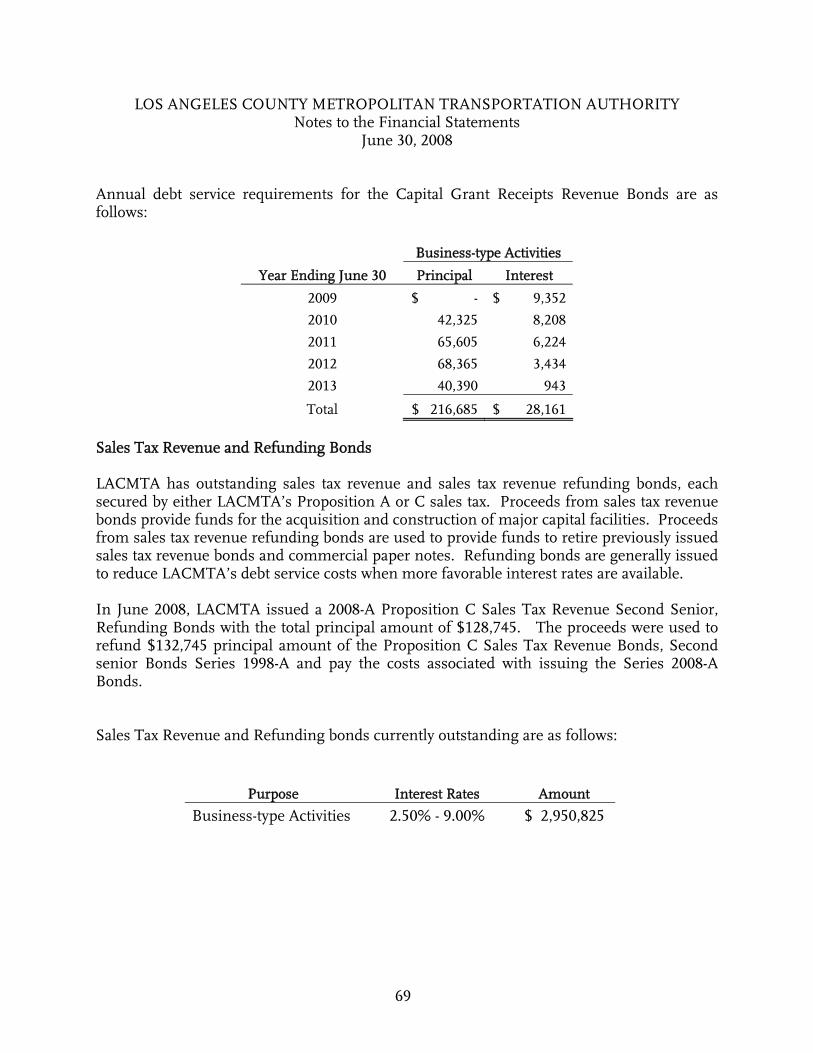
LOS ANGELES COUNTY METROPOLITAN TRANSPORTATION AUTHORITY Notes to the Financial Statements
June 30, 2008
69
Annual debt service requirements for the Capital Grant Receipts Revenue Bonds are as follows:
Business-type Activities
Year Ending June 30 Principal Interest
2009 $ - $ 9,352
2010 42,325 8,208
2011 65,605 6,224
2012 68,365 3,434
2013 40,390 943
Total $ 216,685 $ 28,161
Sales Tax Revenue and Refunding Bonds LACMTA has outstanding sales tax revenue and sales tax revenue refunding bonds, each secured by either LACMTA’s Proposition A or C sales tax. Proceeds from sales tax revenue bonds provide funds for the acquisition and construction of major capital facilities. Proceeds from sales tax revenue refunding bonds are used to provide funds to retire previously issued sales tax revenue bonds and commercial paper notes. Refunding bonds are generally issued to reduce LACMTA’s debt service costs when more favorable interest rates are available. In June 2008, LACMTA issued a 2008-A Proposition C Sales Tax Revenue Second Senior, Refunding Bonds with the total principal amount of $128,745. The proceeds were used to refund $132,745 principal amount of the Proposition C Sales Tax Revenue Bonds, Second senior Bonds Series 1998-A and pay the costs associated with issuing the Series 2008-A Bonds. Sales Tax Revenue and Refunding bonds currently outstanding are as follows:
Purpose Interest Rates Amount
Business-type Activities 2.50% - 9.00% $ 2,950,825
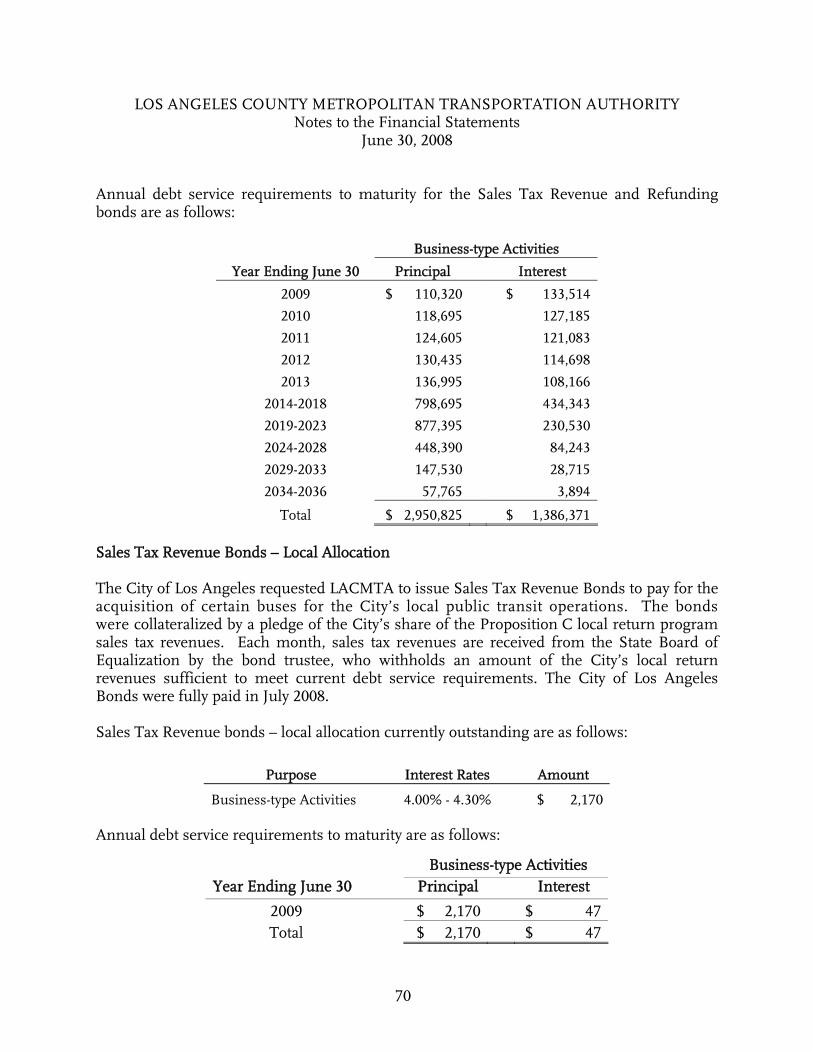
LOS ANGELES COUNTY METROPOLITAN TRANSPORTATION AUTHORITY Notes to the Financial Statements
June 30, 2008
70
Annual debt service requirements to maturity for the Sales Tax Revenue and Refunding bonds are as follows:
Business-type Activities
Year Ending June 30 Principal Interest
2009 $ 110,320 $ 133,514
2010 118,695 127,185
2011 124,605 121,083
2012 130,435 114,698
2013 136,995 108,166
2014-2018 798,695 434,343
2019-2023 877,395 230,530
2024-2028 448,390 84,243
2029-2033 147,530 28,715
2034-2036 57,765 3,894
Total $ 2,950,825 $ 1,386,371 Sales Tax Revenue Bonds – Local Allocation The City of Los Angeles requested LACMTA to issue Sales Tax Revenue Bonds to pay for the acquisition of certain buses for the City’s local public transit operations. The bonds were collateralized by a pledge of the City’s share of the Proposition C local return program sales tax revenues. Each month, sales tax revenues are received from the State Board of Equalization by the bond trustee, who withholds an amount of the City’s local return revenues sufficient to meet current debt service requirements. The City of Los Angeles Bonds were fully paid in July 2008. Sales Tax Revenue bonds – local allocation currently outstanding are as follows:
Purpose Interest Rates Amount
Business-type Activities 4.00% - 4.30% $ 2,170 Annual debt service requirements to maturity are as follows:
Business-type Activities Year Ending June 30 Principal Interest
2009 $ 2,170 $ 47 Total $ 2,170 $ 47
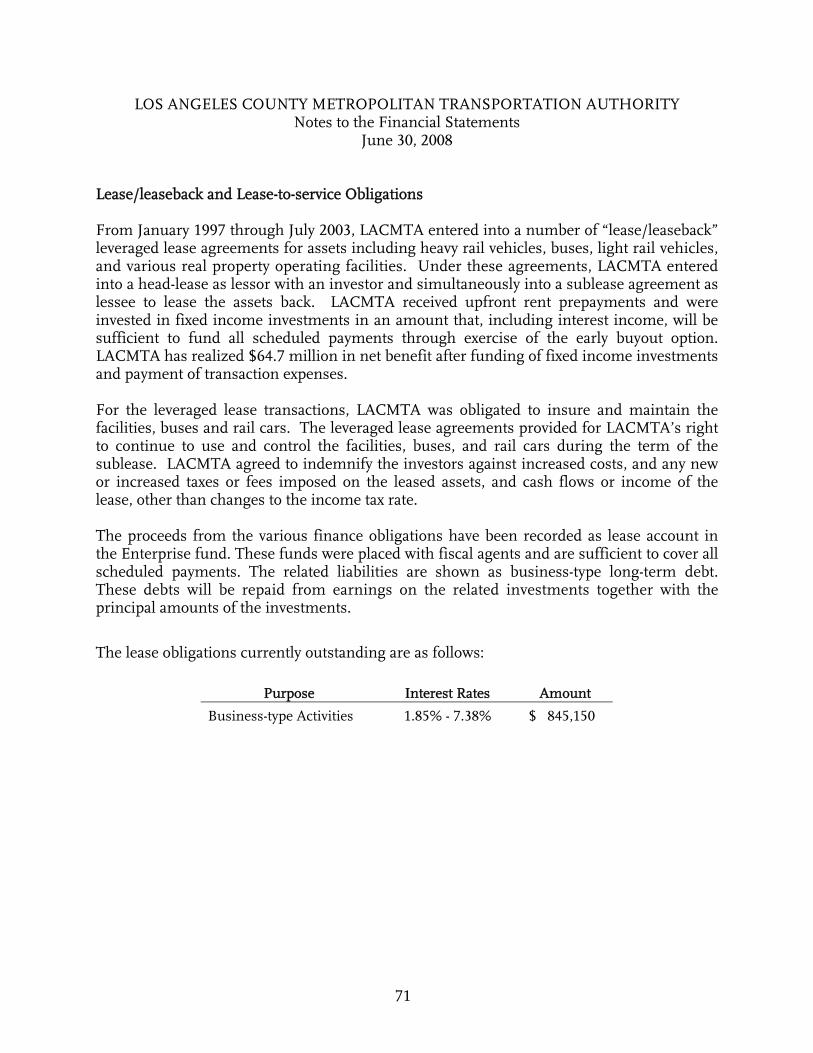
LOS ANGELES COUNTY METROPOLITAN TRANSPORTATION AUTHORITY Notes to the Financial Statements
June 30, 2008
71
Lease/leaseback and Lease-to-service Obligations From January 1997 through July 2003, LACMTA entered into a number of “lease/leaseback” leveraged lease agreements for assets including heavy rail vehicles, buses, light rail vehicles, and various real property operating facilities. Under these agreements, LACMTA entered into a head-lease as lessor with an investor and simultaneously into a sublease agreement as lessee to lease the assets back. LACMTA received upfront rent prepayments and were invested in fixed income investments in an amount that, including interest income, will be sufficient to fund all scheduled payments through exercise of the early buyout option. LACMTA has realized $64.7 million in net benefit after funding of fixed income investments and payment of transaction expenses. For the leveraged lease transactions, LACMTA was obligated to insure and maintain the facilities, buses and rail cars. The leveraged lease agreements provided for LACMTA’s right to continue to use and control the facilities, buses, and rail cars during the term of the sublease. LACMTA agreed to indemnify the investors against increased costs, and any new or increased taxes or fees imposed on the leased assets, and cash flows or income of the lease, other than changes to the income tax rate. The proceeds from the various finance obligations have been recorded as lease account in the Enterprise fund. These funds were placed with fiscal agents and are sufficient to cover all scheduled payments. The related liabilities are shown as business-type long-term debt. These debts will be repaid from earnings on the related investments together with the principal amounts of the investments.
The lease obligations currently outstanding are as follows:
Purpose Interest Rates Amount
Business-type Activities 1.85% - 7.38% $ 845,150

LOS ANGELES COUNTY METROPOLITAN TRANSPORTATION AUTHORITY Notes to the Financial Statements
June 30, 2008
72
Annual debt service requirements to maturity for the lease obligations are as follows:
Business-type Activities
Year Ending June 30 Principal Interest
2009 $ 14,215 $ 6,824
2010 49,265 34,031
2011 71,992 18,829
2012 42,514 17,328
2013 5,909 14,934
2014-2018 340,839 192,406
2019-2023 76,334 307,606
2024-2028 90,513 160,642
2029-2032 153,569 217,603
Total $ 845,150 $ 970,203
Commercial Paper Notes LACMTA operates two commercial paper (CP) programs to maintain access to a low cost, flexible source of capital financing. Commercial paper notes (CPN), taxable and tax-exempt, are issued by LACMTA with maturity dates ranging from 1 to 270 days at various interest rates. Under the terms of the programs, maturing principal amounts can be rolled-over by issuing new notes. It is the intention of LACMTA to pay the accrued interest and reissue the principal amounts as they mature. The proceeds from the CPNs have been used to provide interim financing for construction and acquisition activities, including construction of rail capital projects and rail right of way acquisitions. LACMTA periodically retires CPN by issuing long-term, fixed rate bonds. The taxable and tax-exempt commercial paper programs are supported by direct-pay irrevocable letters of credit. The letters of credit are issued by a single bank for the taxable CPN program and a team of two banks for the tax-exempt CPN program. Each bank is required to have a credit rating of at least “AA-”. The letters of credit are drawn upon at each note maturity to pay the principal and interest due. Principal that has been advanced by the banks and paid to the holders of the matured notes is reimbursed to the banks either by issuing new notes or by direct payment from LACMTA. Interest is reimbursed to the banks on a current basis from sales tax revenues. In the event that the CPN dealers are unable to remarket the commercial paper and/or LACMTA is unable to repay interest or principal, the banks will incur an unreimbursed draw on the letters of credit. Unreimbursed draws are converted to term loans following a specified period of time. The term loans are repayable over a period of three years with equal semi-annual principal payments. Interest is charged
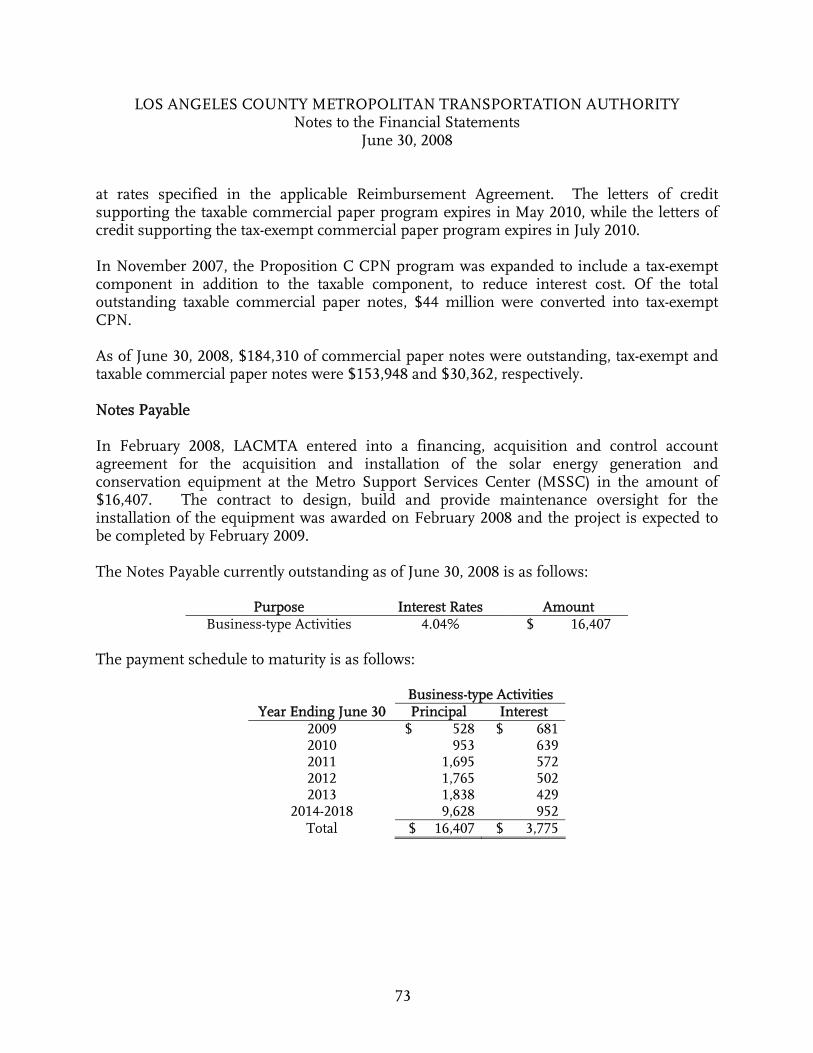
LOS ANGELES COUNTY METROPOLITAN TRANSPORTATION AUTHORITY Notes to the Financial Statements
June 30, 2008
73
at rates specified in the applicable Reimbursement Agreement. The letters of credit supporting the taxable commercial paper program expires in May 2010, while the letters of credit supporting the tax-exempt commercial paper program expires in July 2010. In November 2007, the Proposition C CPN program was expanded to include a tax-exempt component in addition to the taxable component, to reduce interest cost. Of the total outstanding taxable commercial paper notes, $44 million were converted into tax-exempt CPN. As of June 30, 2008, $184,310 of commercial paper notes were outstanding, tax-exempt and taxable commercial paper notes were $153,948 and $30,362, respectively. Notes Payable In February 2008, LACMTA entered into a financing, acquisition and control account agreement for the acquisition and installation of the solar energy generation and conservation equipment at the Metro Support Services Center (MSSC) in the amount of $16,407. The contract to design, build and provide maintenance oversight for the installation of the equipment was awarded on February 2008 and the project is expected to be completed by February 2009. The Notes Payable currently outstanding as of June 30, 2008 is as follows:
Purpose Interest Rates Amount Business-type Activities 4.04% $ 16,407
The payment schedule to maturity is as follows:
Business-type Activities Year Ending June 30 Principal Interest
2009 $ 528 $ 681 2010 953 639 2011 1,695 572 2012 1,765 502 2013 1,838 429
2014-2018 9,628 952 Total $ 16,407 $ 3,775
LOS ANGELES COUNTY METROPOLITAN TRANSPORTATION AUTHORITY Notes to the Financial Statements
June 30, 2008
74
Redevelopment and Housing Bonds LACMTA entered into an agreement with the Community Redevelopment Financing Authority (CRFA) of the Community Redevelopment Agency (CRA) of the City of Los Angeles to assist in the financing of the Grand Central Square Multifamily Housing and Redevelopment Project. Under this agreement, housing and redevelopment bonds were issued by CRA. The 2007-A multifamily housing refunding bonds were issued to redeem the 1993 Series that funded the development in a historic central location in downtown Los Angeles served by and accessible to the Metro Red Line. The 2002-A redevelopment bonds were issued to refund the 1993-A bonds that assisted in the financing of the CRA’s Redevelopment Plan for its Central Business District Redevelopment Project, also located in downtown Los Angeles, which borders the Bunker Hill Project and is accessible to the Metro Red Line. Both projects were undertaken with a commitment to promote the use of mass transit and reduce traffic congestion. The projects were completed and LACMTA is making debt service payments related to these bonds. Under a reimbursement agreement collateralized by real property of the Grand Central Square Housing Project, the developer issued two promissory notes with a combined value of $41,112 due in fiscal year 2027. Housing and Redevelopment bonds currently outstanding are as follows:
Purpose Interest Rates Amount
Governmental Activities 2.50% - 5.38% $ 26,369
LOS ANGELES COUNTY METROPOLITAN TRANSPORTATION AUTHORITY Notes to the Financial Statements
June 30, 2008
75
Annual debt service requirements to maturity for the Housing and Redevelopment bonds are as follows:
Governmental Activities
Year Ending June 30 Principal Interest
2009 $ 960 $ 1,293
2010 654 1,252
2011 1,050 1,208
2012 1,015 1,163
2013 1,060 1,117
2014-2018 6,100 4,769
2019-2023 7,755 3,060
2024-2027 7,775 833
Total $ 26,369 $ 14,695
Interest Rate Swap Agreements LACMTA has entered into various interest swap agreements in conjunction with the issuance of variable rate bonds. In these transactions, LACMTA makes a fixed rate payment to the counterparty and receives a variable rate payment in order to achieve a synthetic fixed rate for the bonds and hedge exposure to variable interest rates. LACMTA has entered into these swap agreements at a cost anticipated to be less than what LACMTA would have paid to issue fixed-rate debt. As of June 30, 2008, LACMTA had seven (7) outstanding interest rate swaps found on page 77. LACMTA’s Board annually adopts an Interest Rate Swap Policy that governs the use and management of interest rate swaps as they are used in conjunction with debt issues. The policy establishes guidelines to be used when considering the use of swaps, as well as in the ongoing management of existing swaps. Guidance is provided specifying appropriate uses; selection of acceptable swap products, swap providers and swap advisors; negotiation of favorable terms and conditions; and, stipulating annual surveillance of the swaps and the providers. LACMTA’s Interest Rate Swap Policy specifies that interest rate swaps may be used to lock-in a fixed rate or to create additional variable rate exposure. Interest rate swaps may be used to produce interest rate savings, limit or hedge variable rate payments, alter the pattern of debt service payments, or for asset/liability matching purposes.
LOS ANGELES COUNTY METROPOLITAN TRANSPORTATION AUTHORITY Notes to the Financial Statements
June 30, 2008
76
The following risks are generally associated with swap agreements.
Credit Risk – The counterparty could experience weakening financial condition or insolvency, which could affect its ability to perform its financial obligations. In the event of deterioration in the credit ratings of the counterparty, the swap agreement may require that collateral be posted to secure the party’s obligations under the swap agreement. Further ratings deterioration by either party below levels agreed-to in each swap agreement could result in a termination event requiring a cash settlement. See “Termination Risk” below. To mitigate credit risk, LACMTA monitors the credit ratings of the counterparties on a quarterly basis. In addition, if the outstanding ratings of the counterparties fall to certain levels, the counterparties must post collateral with a third-party custodian to secure their potential termination payments above certain threshold amounts. Collateral must be cash, US Government or certain federal agency securities. As of June 30, 2008, no collateral was required to be posted by LACMTA or any of its counterparty. Basis Risk – The variable interest rate paid by the counterparty under the swap agreement and the variable interest rate paid by LACMTA on the associated bonds may not be equal. If the counterparty’s rate under the swap is lower than the bond interest rate, then the counterparty’s payment under the swap agreement would not fully reimburse LACMTA for its interest payment on the associated bonds. Conversely, if the bond interest rate is lower than the counterparty’s rate on the swap, there would be a net benefit to LACMTA. Prior to entering into an interest rate swap, LACMTA and its swap advisor need to review the historical trading differentials between LACMTA’s outstanding variable rate bonds and the proposed index. This would allow LACMTA to structure its interest rate swaps to minimize basis risk. In addition, LACMTA should monitor the basis differential for its existing swaps on a monthly basis.
Termination Risk – Under certain conditions, the swap agreement could be terminated and depending on current market interest rates, either LACMTA or the counterparty could be required to make a termination payment. LACMTA’s swap agreements only permit the counterparty to terminate if an Event of Default or a Termination Event has occurred. Events of Default include non-payment, false or misleading representations, or the bankruptcy of LACMTA or the counterparty. Termination Events include: a downgrade of LACMTA’s rating to below “BBB,” an event of taxability, a liquidity facility put, or conversion of bonds to fixed rate. As of June 30, 2008, LACMTA is not aware of any event that has occurred that would lead to a termination event with respect to any of its existing swaps. In addition, LACMTA calculates its termination exposure for all existing and proposed swaps at market value quarterly. A contingency plan is periodically updated identifying alternatives to finance a termination payment and/or replace the hedge.
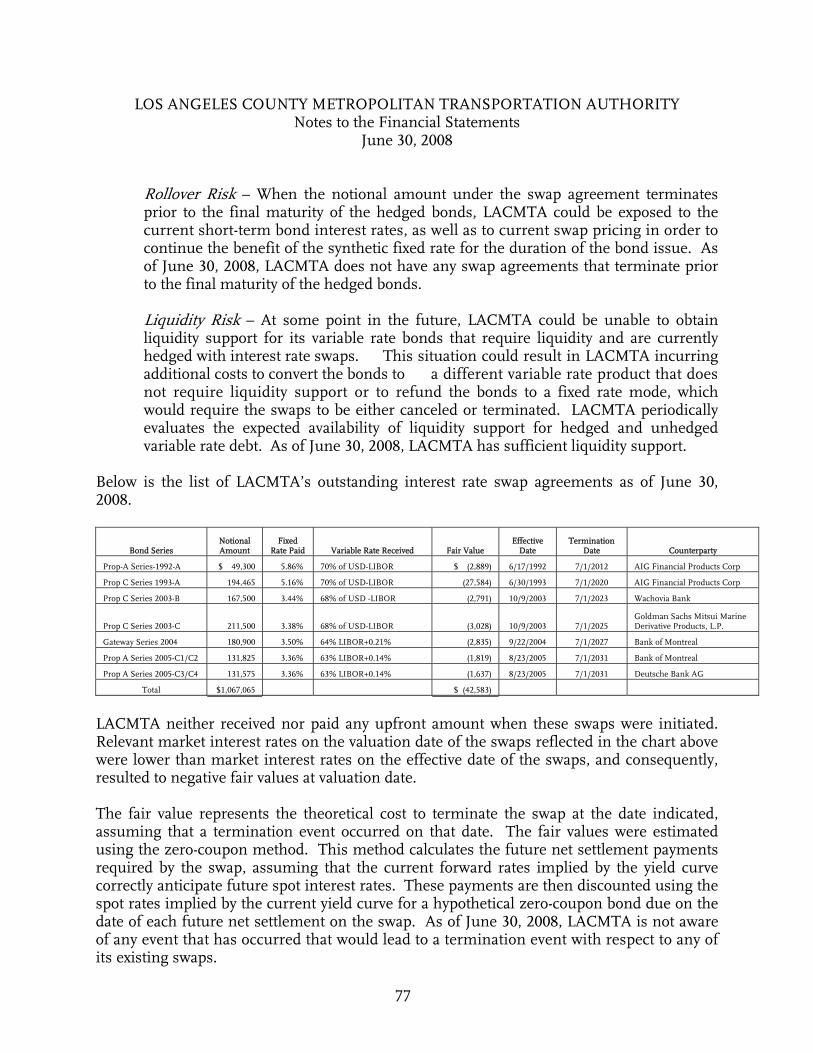
LOS ANGELES COUNTY METROPOLITAN TRANSPORTATION AUTHORITY Notes to the Financial Statements
June 30, 2008
77
Rollover Risk – When the notional amount under the swap agreement terminates prior to the final maturity of the hedged bonds, LACMTA could be exposed to the current short-term bond interest rates, as well as to current swap pricing in order to continue the benefit of the synthetic fixed rate for the duration of the bond issue. As of June 30, 2008, LACMTA does not have any swap agreements that terminate prior to the final maturity of the hedged bonds. Liquidity Risk – At some point in the future, LACMTA could be unable to obtain liquidity support for its variable rate bonds that require liquidity and are currently hedged with interest rate swaps. This situation could result in LACMTA incurring additional costs to convert the bonds to a different variable rate product that does not require liquidity support or to refund the bonds to a fixed rate mode, which would require the swaps to be either canceled or terminated. LACMTA periodically evaluates the expected availability of liquidity support for hedged and unhedged variable rate debt. As of June 30, 2008, LACMTA has sufficient liquidity support.
Below is the list of LACMTA’s outstanding interest rate swap agreements as of June 30, 2008.
Bond Series Notional Amount
Fixed Rate Paid Variable Rate Received Fair Value
Effective Date
Termination Date Counterparty
Prop-A Series-1992-A $ 49,300 5.86% 70% of USD-LIBOR $ (2,889) 6/17/1992 7/1/2012 AIG Financial Products Corp
Prop C Series 1993-A 194,465 5.16% 70% of USD-LIBOR (27,584) 6/30/1993 7/1/2020 AIG Financial Products Corp
Prop C Series 2003-B 167,500 3.44% 68% of USD -LIBOR (2,791) 10/9/2003 7/1/2023 Wachovia Bank
Prop C Series 2003-C 211,500 3.38% 68% of USD-LIBOR (3,028) 10/9/2003 7/1/2025 Goldman Sachs Mitsui Marine Derivative Products, L.P.
Gateway Series 2004 180,900 3.50% 64% LIBOR+0.21% (2,835) 9/22/2004 7/1/2027 Bank of Montreal
Prop A Series 2005-C1/C2 131,825 3.36% 63% LIBOR+0.14% (1,819) 8/23/2005 7/1/2031 Bank of Montreal
Prop A Series 2005-C3/C4 131,575 3.36% 63% LIBOR+0.14% (1,637) 8/23/2005 7/1/2031 Deutsche Bank AG
Total $1,067,065
$ (42,583)
LACMTA neither received nor paid any upfront amount when these swaps were initiated. Relevant market interest rates on the valuation date of the swaps reflected in the chart above were lower than market interest rates on the effective date of the swaps, and consequently, resulted to negative fair values at valuation date. The fair value represents the theoretical cost to terminate the swap at the date indicated, assuming that a termination event occurred on that date. The fair values were estimated using the zero-coupon method. This method calculates the future net settlement payments required by the swap, assuming that the current forward rates implied by the yield curve correctly anticipate future spot interest rates. These payments are then discounted using the spot rates implied by the current yield curve for a hypothetical zero-coupon bond due on the date of each future net settlement on the swap. As of June 30, 2008, LACMTA is not aware of any event that has occurred that would lead to a termination event with respect to any of its existing swaps.
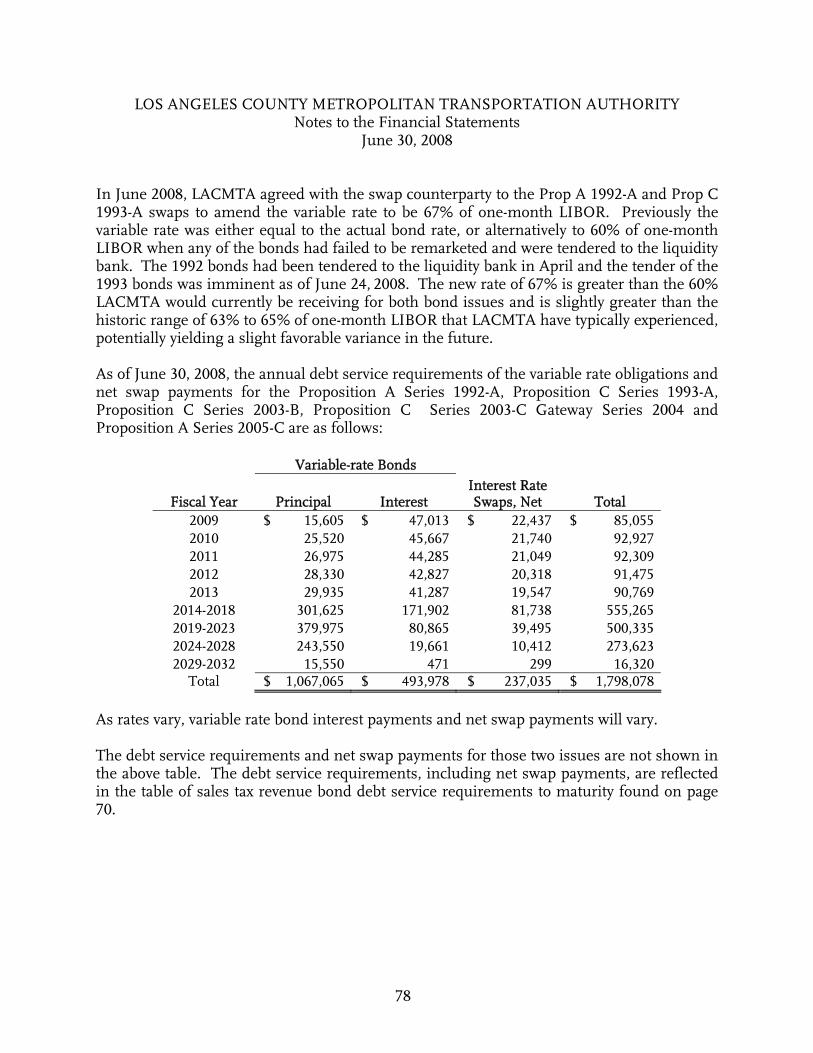
LOS ANGELES COUNTY METROPOLITAN TRANSPORTATION AUTHORITY Notes to the Financial Statements
June 30, 2008
78
In June 2008, LACMTA agreed with the swap counterparty to the Prop A 1992-A and Prop C 1993-A swaps to amend the variable rate to be 67% of one-month LIBOR. Previously the variable rate was either equal to the actual bond rate, or alternatively to 60% of one-month LIBOR when any of the bonds had failed to be remarketed and were tendered to the liquidity bank. The 1992 bonds had been tendered to the liquidity bank in April and the tender of the 1993 bonds was imminent as of June 24, 2008. The new rate of 67% is greater than the 60% LACMTA would currently be receiving for both bond issues and is slightly greater than the historic range of 63% to 65% of one-month LIBOR that LACMTA have typically experienced, potentially yielding a slight favorable variance in the future. As of June 30, 2008, the annual debt service requirements of the variable rate obligations and net swap payments for the Proposition A Series 1992-A, Proposition C Series 1993-A, Proposition C Series 2003-B, Proposition C Series 2003-C Gateway Series 2004 and Proposition A Series 2005-C are as follows:
Variable-rate Bonds
Fiscal Year Principal Interest Interest Rate Swaps, Net Total
2009 $ 15,605 $ 47,013 $ 22,437 $ 85,055 2010 25,520 45,667 21,740 92,927 2011 26,975 44,285 21,049 92,309 2012 28,330 42,827 20,318 91,475 2013 29,935 41,287 19,547 90,769
2014-2018 301,625 171,902 81,738 555,265 2019-2023 379,975 80,865 39,495 500,335 2024-2028 243,550 19,661 10,412 273,623 2029-2032 15,550 471 299 16,320
Total $ 1,067,065 $ 493,978 $ 237,035 $ 1,798,078 As rates vary, variable rate bond interest payments and net swap payments will vary. The debt service requirements and net swap payments for those two issues are not shown in the above table. The debt service requirements, including net swap payments, are reflected in the table of sales tax revenue bond debt service requirements to maturity found on page 70.
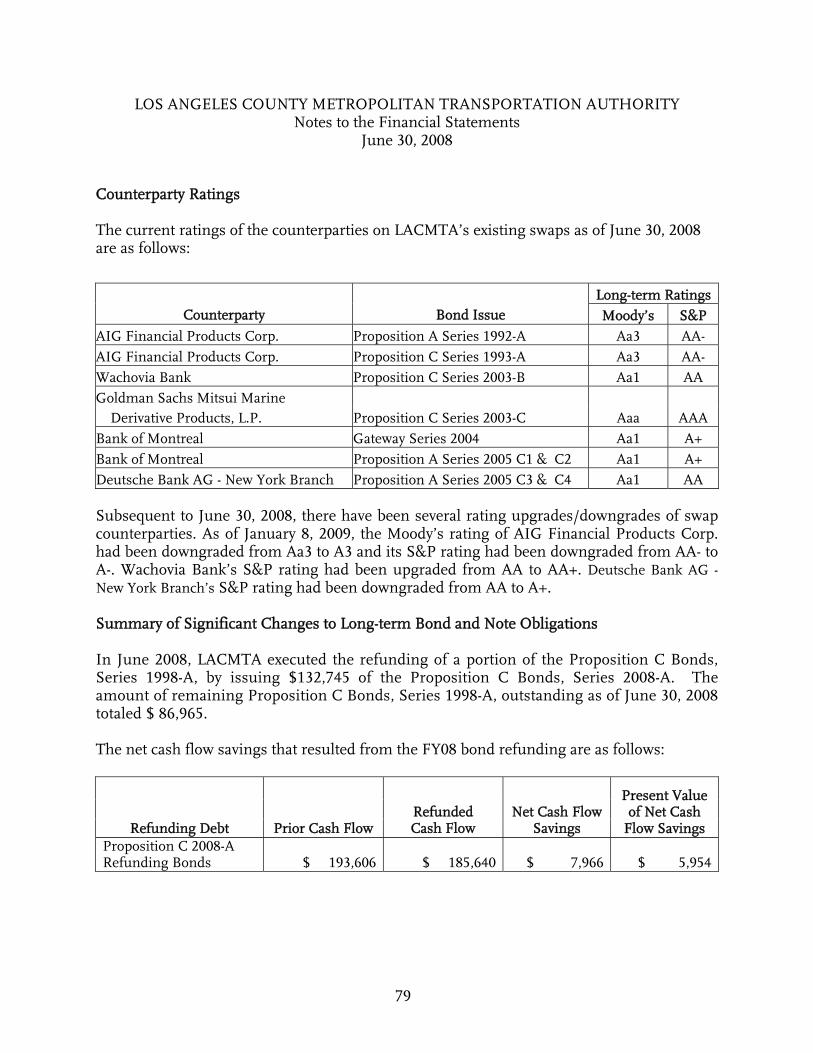
LOS ANGELES COUNTY METROPOLITAN TRANSPORTATION AUTHORITY Notes to the Financial Statements
June 30, 2008
79
Counterparty Ratings The current ratings of the counterparties on LACMTA’s existing swaps as of June 30, 2008 are as follows:
Long-term Ratings Counterparty Bond Issue Moody’s S&P
AIG Financial Products Corp. Proposition A Series 1992-A Aa3 AA- AIG Financial Products Corp. Proposition C Series 1993-A Aa3 AA- Wachovia Bank Proposition C Series 2003-B Aa1 AA Goldman Sachs Mitsui Marine
Derivative Products, L.P. Proposition C Series 2003-C Aaa AAA Bank of Montreal Gateway Series 2004 Aa1 A+ Bank of Montreal Proposition A Series 2005 C1 & C2 Aa1 A+ Deutsche Bank AG - New York Branch Proposition A Series 2005 C3 & C4 Aa1 AA Subsequent to June 30, 2008, there have been several rating upgrades/downgrades of swap counterparties. As of January 8, 2009, the Moody’s rating of AIG Financial Products Corp. had been downgraded from Aa3 to A3 and its S&P rating had been downgraded from AA- to A-. Wachovia Bank’s S&P rating had been upgraded from AA to AA+. Deutsche Bank AG - New York Branch’s S&P rating had been downgraded from AA to A+. Summary of Significant Changes to Long-term Bond and Note Obligations In June 2008, LACMTA executed the refunding of a portion of the Proposition C Bonds, Series 1998-A, by issuing $132,745 of the Proposition C Bonds, Series 2008-A. The amount of remaining Proposition C Bonds, Series 1998-A, outstanding as of June 30, 2008 totaled $ 86,965. The net cash flow savings that resulted from the FY08 bond refunding are as follows:
Refunding Debt Prior Cash Flow Refunded Cash Flow
Net Cash Flow Savings
Present Value of Net Cash
Flow Savings Proposition C 2008-A Refunding Bonds $ 193,606 $ 185,640 $ 7,966 $ 5,954
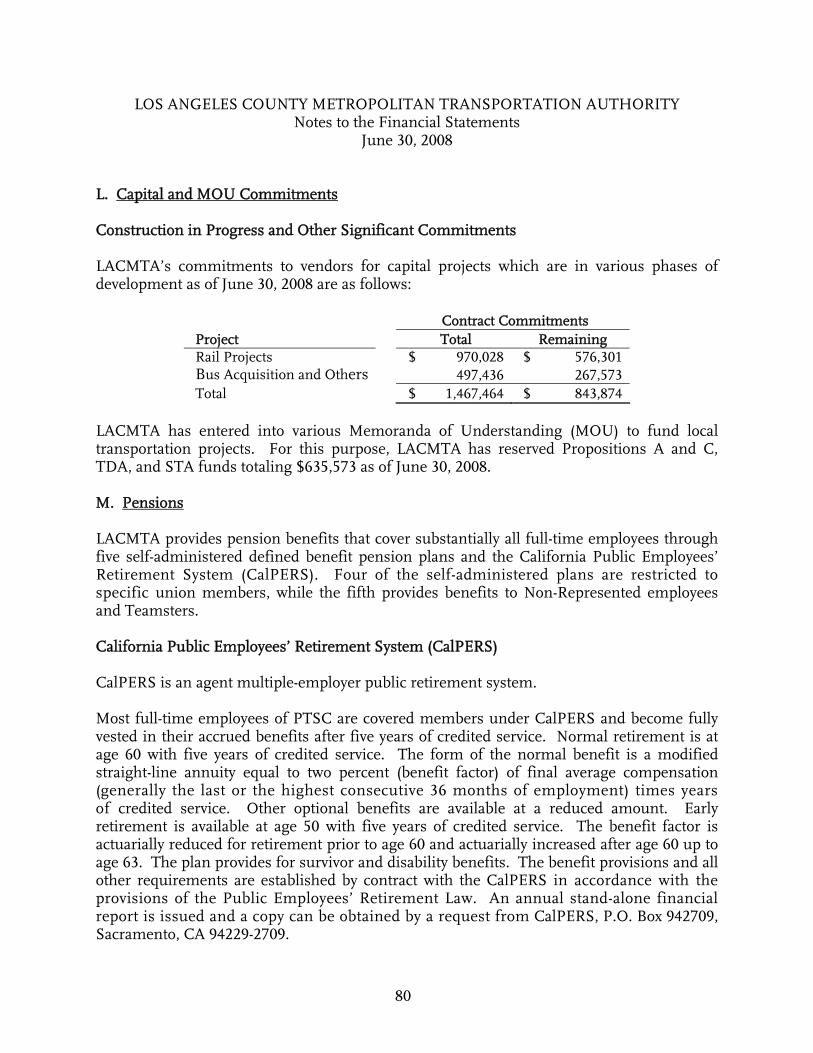
LOS ANGELES COUNTY METROPOLITAN TRANSPORTATION AUTHORITY Notes to the Financial Statements
June 30, 2008
80
L. Capital and MOU Commitments Construction in Progress and Other Significant Commitments LACMTA’s commitments to vendors for capital projects which are in various phases of development as of June 30, 2008 are as follows:
Contract Commitments
Project Total Remaining Rail Projects $ 970,028 $ 576,301 Bus Acquisition and Others 497,436 267,573 Total $ 1,467,464 $ 843,874
LACMTA has entered into various Memoranda of Understanding (MOU) to fund local transportation projects. For this purpose, LACMTA has reserved Propositions A and C, TDA, and STA funds totaling $635,573 as of June 30, 2008. M. Pensions LACMTA provides pension benefits that cover substantially all full-time employees through five self-administered defined benefit pension plans and the California Public Employees’ Retirement System (CalPERS). Four of the self-administered plans are restricted to specific union members, while the fifth provides benefits to Non-Represented employees and Teamsters. California Public Employees’ Retirement System (CalPERS) CalPERS is an agent multiple-employer public retirement system. Most full-time employees of PTSC are covered members under CalPERS and become fully vested in their accrued benefits after five years of credited service. Normal retirement is at age 60 with five years of credited service. The form of the normal benefit is a modified straight-line annuity equal to two percent (benefit factor) of final average compensation (generally the last or the highest consecutive 36 months of employment) times years of credited service. Other optional benefits are available at a reduced amount. Early retirement is available at age 50 with five years of credited service. The benefit factor is actuarially reduced for retirement prior to age 60 and actuarially increased after age 60 up to age 63. The plan provides for survivor and disability benefits. The benefit provisions and all other requirements are established by contract with the CalPERS in accordance with the provisions of the Public Employees’ Retirement Law. An annual stand-alone financial report is issued and a copy can be obtained by a request from CalPERS, P.O. Box 942709, Sacramento, CA 94229-2709.
LOS ANGELES COUNTY METROPOLITAN TRANSPORTATION AUTHORITY Notes to the Financial Statements
June 30, 2008
81
The employer and employee contributions are a percentage of the employee’s compensation. The rates are defined by law and are based on the employer’s benefit formula as determined by periodic actuarial valuations. These contributions are deposited in a fund established for each entity for the purpose of creating actuarial reserves for future benefits. For the year ended June 30, 2008, the contribution rate of covered payroll was 14.64 percent. This rate includes the mandatory employee contribution of 7.0 percent that is currently paid by PTSC. Total Annual Required Contributions (ARC) for the years ended June 30, 2008, 2007, and 2006 were $17,468, $18,026, and $17,299, respectively, all of which were attributable to the PTSC and paid in full. Such contributions were made in accordance with the latest CalPERS actuarial valuation. These pension contributions for normal costs include the employees’ portion, and for the years ended June 30, 2008, 2007, and 2006, were $8,353, $8,567, and $8,013, respectively. At June 30, 2008, 2007, and 2006, there was no Net Pension Obligations (NPO). The valuation date was June 30, 2006 and the individual entry age normal cost was the actuarial cost method used to determine the ARC. The smoothing of market value method was used to determine the actuarial value of assets, which was set to be no less than 80% of market value for the purpose of determining 2007/2008 employer contributions. Initial unfunded liabilities are amortized over a closed period with subsequent plan amendments amortized as a level percentage of pay over a closed 20-year period. The actuarial assumptions are 7.75 percent investment rate of return; an inflation rate of 3.0 percent; and projected salary increases of 3.25% to 14.5% dependent on age, service, and type of employment. LACMTA-administered Plans LACMTA has a single-employer public employees retirement system that includes five defined benefit pension plans (Plans) covering substantially all employees, providing retirement, disability, and death benefits. Generally, employees’ rights to retirement benefits vest after five (5) years for non-represented, Teamster, and AFSCME employees while its ten (10) years for UTU, ATU, and TCU employees. All contract and non-contract retirement benefits are based on the individual employee’s years of service, age, final compensation, bargaining units, and disability status. The benefit provisions and all other requirements are established by state statute, ordinance, collective bargaining agreements, or Board of Directors’ actions. An annual stand-alone financial report is issued for the plans and can be obtained by requesting a copy from the Accounting Department, One Gateway Plaza, Los Angeles, CA 90012-2952.
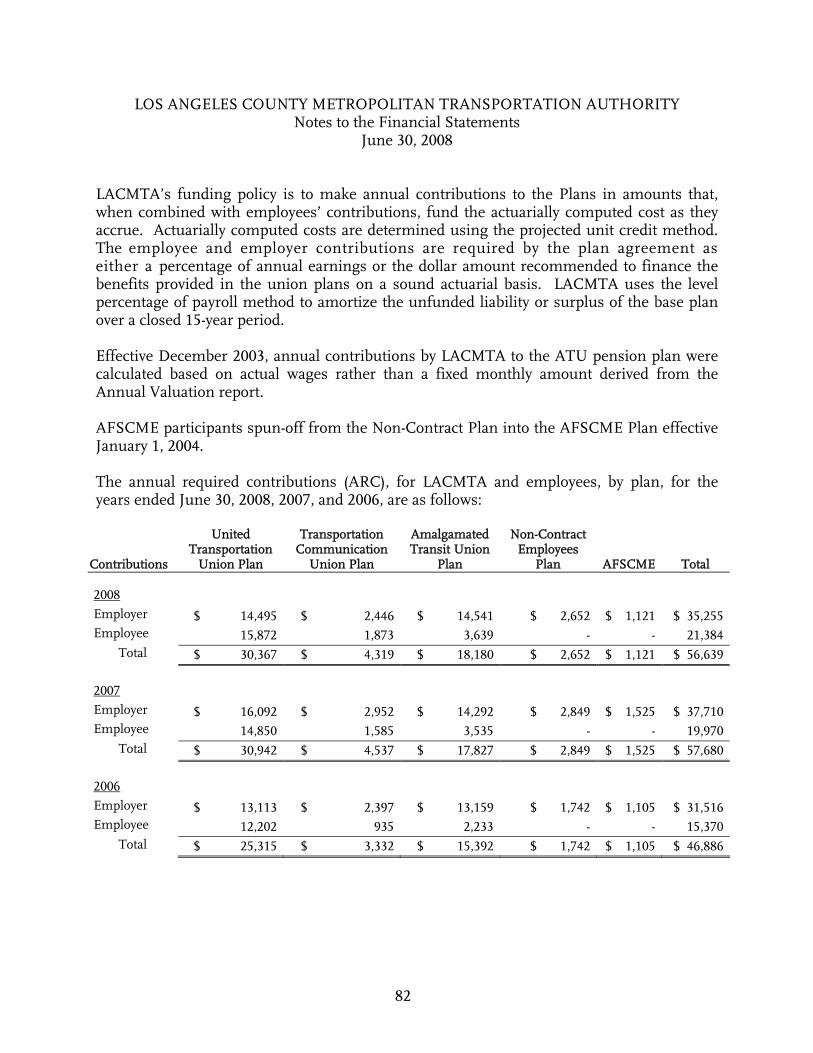
LOS ANGELES COUNTY METROPOLITAN TRANSPORTATION AUTHORITY Notes to the Financial Statements
June 30, 2008
82
LACMTA’s funding policy is to make annual contributions to the Plans in amounts that, when combined with employees’ contributions, fund the actuarially computed cost as they accrue. Actuarially computed costs are determined using the projected unit credit method. The employee and employer contributions are required by the plan agreement as either a percentage of annual earnings or the dollar amount recommended to finance the benefits provided in the union plans on a sound actuarial basis. LACMTA uses the level percentage of payroll method to amortize the unfunded liability or surplus of the base plan over a closed 15-year period. Effective December 2003, annual contributions by LACMTA to the ATU pension plan were calculated based on actual wages rather than a fixed monthly amount derived from the Annual Valuation report. AFSCME participants spun-off from the Non-Contract Plan into the AFSCME Plan effective January 1, 2004. The annual required contributions (ARC), for LACMTA and employees, by plan, for the years ended June 30, 2008, 2007, and 2006, are as follows:
Contributions
United Transportation
Union Plan
Transportation Communication
Union Plan
Amalgamated Transit Union
Plan
Non-Contract Employees
Plan
AFSCME
Total
2008 Employer $ 14,495 $ 2,446 $ 14,541 $ 2,652 $ 1,121 $ 35,255 Employee 15,872 1,873 3,639 - - 21,384
Total $ 30,367 $ 4,319 $ 18,180 $ 2,652 $ 1,121 $ 56,639 2007 Employer $ 16,092 $ 2,952 $ 14,292 $ 2,849 $ 1,525 $ 37,710 Employee 14,850 1,585 3,535 - - 19,970
Total $ 30,942 $ 4,537 $ 17,827 $ 2,849 $ 1,525 $ 57,680 2006 Employer $ 13,113 $ 2,397 $ 13,159 $ 1,742 $ 1,105 $ 31,516 Employee 12,202 935 2,233 - - 15,370
Total $ 25,315 $ 3,332 $ 15,392 $ 1,742 $ 1,105 $ 46,886
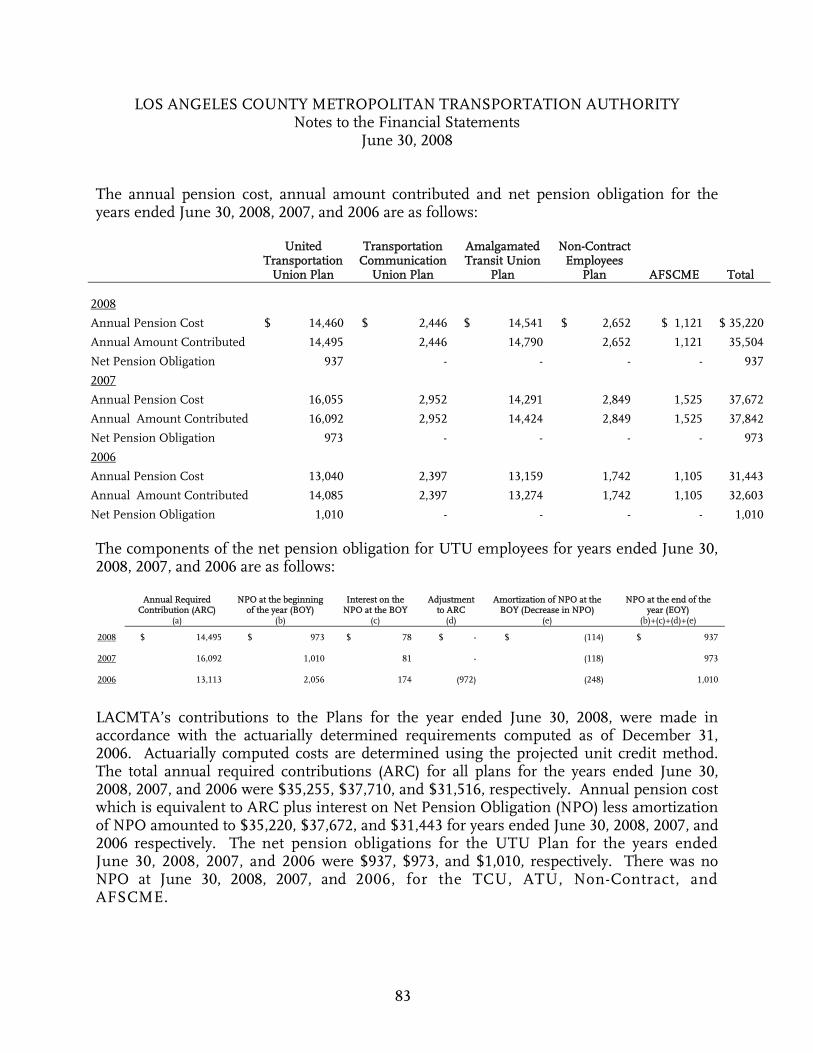
LOS ANGELES COUNTY METROPOLITAN TRANSPORTATION AUTHORITY Notes to the Financial Statements
June 30, 2008
83
The annual pension cost, annual amount contributed and net pension obligation for the years ended June 30, 2008, 2007, and 2006 are as follows:
United Transportation
Union Plan
Transportation Communication
Union Plan
Amalgamated Transit Union
Plan
Non-Contract Employees
Plan
AFSCME
Total
2008
Annual Pension Cost $ 14,460 $ 2,446 $ 14,541 $ 2,652 $ 1,121 $ 35,220
Annual Amount Contributed 14,495 2,446 14,790 2,652 1,121 35,504
Net Pension Obligation 937 - - - - 937
2007
Annual Pension Cost 16,055 2,952 14,291 2,849 1,525 37,672
Annual Amount Contributed 16,092 2,952 14,424 2,849 1,525 37,842
Net Pension Obligation 973 - - - - 973
2006
Annual Pension Cost 13,040 2,397 13,159 1,742 1,105 31,443
Annual Amount Contributed 14,085 2,397 13,274 1,742 1,105 32,603
Net Pension Obligation 1,010 - - - - 1,010 The components of the net pension obligation for UTU employees for years ended June 30, 2008, 2007, and 2006 are as follows:
Annual Required
Contribution (ARC) NPO at the beginning
of the year (BOY) Interest on the
NPO at the BOY Adjustment
to ARC Amortization of NPO at the
BOY (Decrease in NPO) NPO at the end of the
year (EOY) (a) (b) (c) (d) (e) (b)+(c)+(d)+(e)
2008 $ 14,495 $ 973 $ 78 $ - $ (114) $ 937
2007 16,092 1,010 81 - (118) 973
2006 13,113 2,056 174 (972) (248) 1,010
LACMTA’s contributions to the Plans for the year ended June 30, 2008, were made in accordance with the actuarially determined requirements computed as of December 31, 2006. Actuarially computed costs are determined using the projected unit credit method. The total annual required contributions (ARC) for all plans for the years ended June 30, 2008, 2007, and 2006 were $35,255, $37,710, and $31,516, respectively. Annual pension cost which is equivalent to ARC plus interest on Net Pension Obligation (NPO) less amortization of NPO amounted to $35,220, $37,672, and $31,443 for years ended June 30, 2008, 2007, and 2006 respectively. The net pension obligations for the UTU Plan for the years ended June 30, 2008, 2007, and 2006 were $937, $973, and $1,010, respectively. There was no NPO at June 30, 2008, 2007, and 2006, for the TCU, ATU, Non-Contract, and AFSCME.
LOS ANGELES COUNTY METROPOLITAN TRANSPORTATION AUTHORITY Notes to the Financial Statements
June 30, 2008
84
The required contribution rate by employees for years ended June 30, 2008, 2007, and 2006, were between 0 and 8.51 percent, 0 and 8.49 percent, and 0 and 7.06 percent, respectively, of their annual wages. The employer rate is equal to the ARC. The method of ½ book value + ½ market value was used to determine the actuarial value of assets. Unfunded liabilities are amortized at the assumed investment rate of return, over a fixed period of either 15 years or a period that declines by 1 year every year (currently 15 years for fiscal year ending June 30, 2008). The key actuarial assumptions are: 8.0 percent investment rate of return including a 3.0 percent rate for inflation; projected salary increases tied to age-based rates and no postemployment benefit increases. N. Other Postemployment Benefits (OPEB) LACMTA has implemented the new reporting requirements of GASB 45, “Accounting and Financial Reporting by Employers for Postemployment Benefits Other Than Pensions (OPEB)” for the fiscal year ended June 30, 2008. Prior to the implementation of GASB 45, LACMTA restricted the cash required to cover the present value of future health care and life insurance benefits for employees projected to retire in the current fiscal year. Expenses for the current fiscal year were met on a pay-as-you-go basis. With the implementation of GASB 45, the $165 million accumulated for postemployment benefits was used to establish an OPEB trust (see note T). The OPEB trust was established effective August 1, 2007, with the intent to accumulate funds to fulfill future OPEB obligations under all retiree medical and life insurance programs, including future contractual contributions to the three union trusts that provide benefits to LACMTA employees. Similar to pension fund assets, the OPEB trust is invested in equity securities, long-term fixed income investments and real estate, and accordingly is expected to generate higher investment earnings than previously earned in the Enterprise Fund. Plan Description On February 22, 2007, the Board adopted a resolution authorizing the establishment of an irrevocable Retiree Health Care and Welfare Benefits Trust (“Plan”). The Plan is a single-employer, defined benefit plan administered by LACMTA to provide OPEB benefits, such as medical, dental, vision, life insurance, and similar benefits offered by LACMTA to its active and retired employees. The Plan covers benefits administered by LACMTA to Non-contract employees and employees represented by AFSCME and the Teamsters and the contractual obligations to the respective Union Health & Welfare Trusts for employees represented by ATU, TCU and UTU. Generally, eligibility for coverage is based on employee’s service and age. An annual stand-alone financial report is issued for the Plan and can be obtained by requesting a copy from the Accounting Department, LACMTA, One Gateway Plaza, Los Angeles, CA 90012-2952.
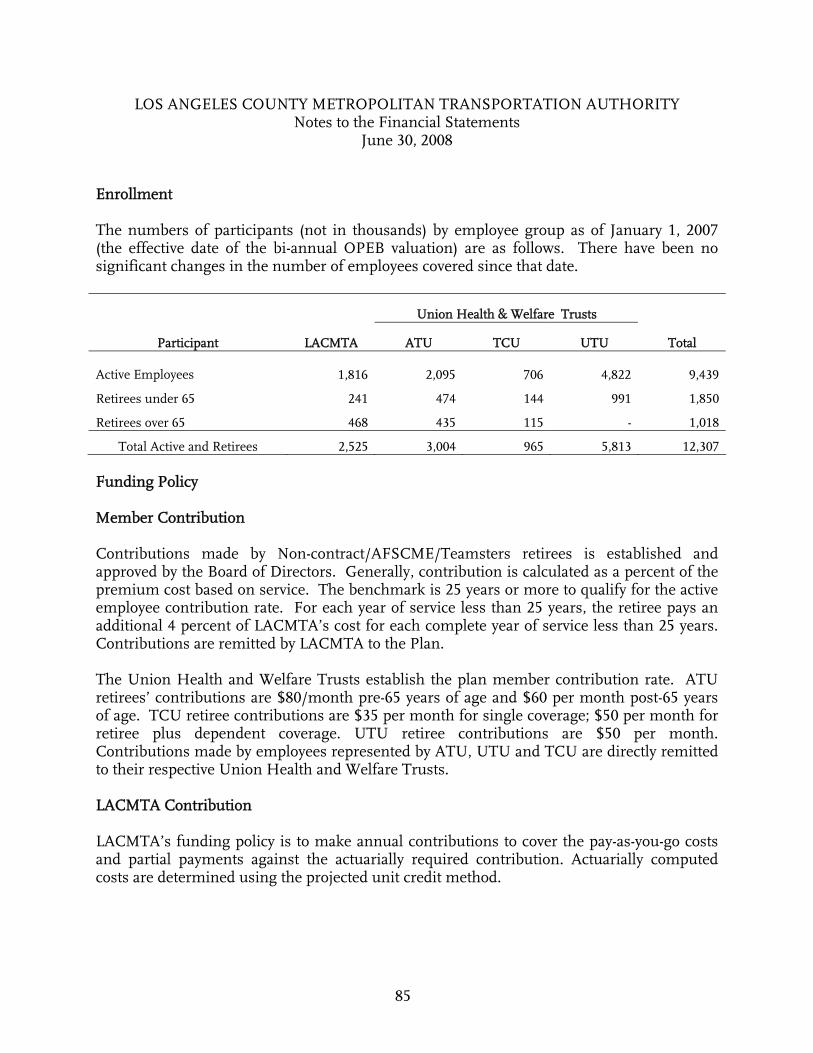
LOS ANGELES COUNTY METROPOLITAN TRANSPORTATION AUTHORITY Notes to the Financial Statements
June 30, 2008
85
Enrollment The numbers of participants (not in thousands) by employee group as of January 1, 2007 (the effective date of the bi-annual OPEB valuation) are as follows. There have been no significant changes in the number of employees covered since that date.
Union Health & Welfare Trusts
Participant LACMTA ATU TCU UTU Total
Active Employees 1,816 2,095 706 4,822 9,439
Retirees under 65 241 474 144 991 1,850
Retirees over 65 468 435 115 - 1,018
Total Active and Retirees 2,525 3,004 965 5,813 12,307
Funding Policy Member Contribution Contributions made by Non-contract/AFSCME/Teamsters retirees is established and approved by the Board of Directors. Generally, contribution is calculated as a percent of the premium cost based on service. The benchmark is 25 years or more to qualify for the active employee contribution rate. For each year of service less than 25 years, the retiree pays an additional 4 percent of LACMTA’s cost for each complete year of service less than 25 years. Contributions are remitted by LACMTA to the Plan. The Union Health and Welfare Trusts establish the plan member contribution rate. ATU retirees’ contributions are $80/month pre-65 years of age and $60 per month post-65 years of age. TCU retiree contributions are $35 per month for single coverage; $50 per month for retiree plus dependent coverage. UTU retiree contributions are $50 per month. Contributions made by employees represented by ATU, UTU and TCU are directly remitted to their respective Union Health and Welfare Trusts.
LACMTA Contribution LACMTA’s funding policy is to make annual contributions to cover the pay-as-you-go costs and partial payments against the actuarially required contribution. Actuarially computed costs are determined using the projected unit credit method.
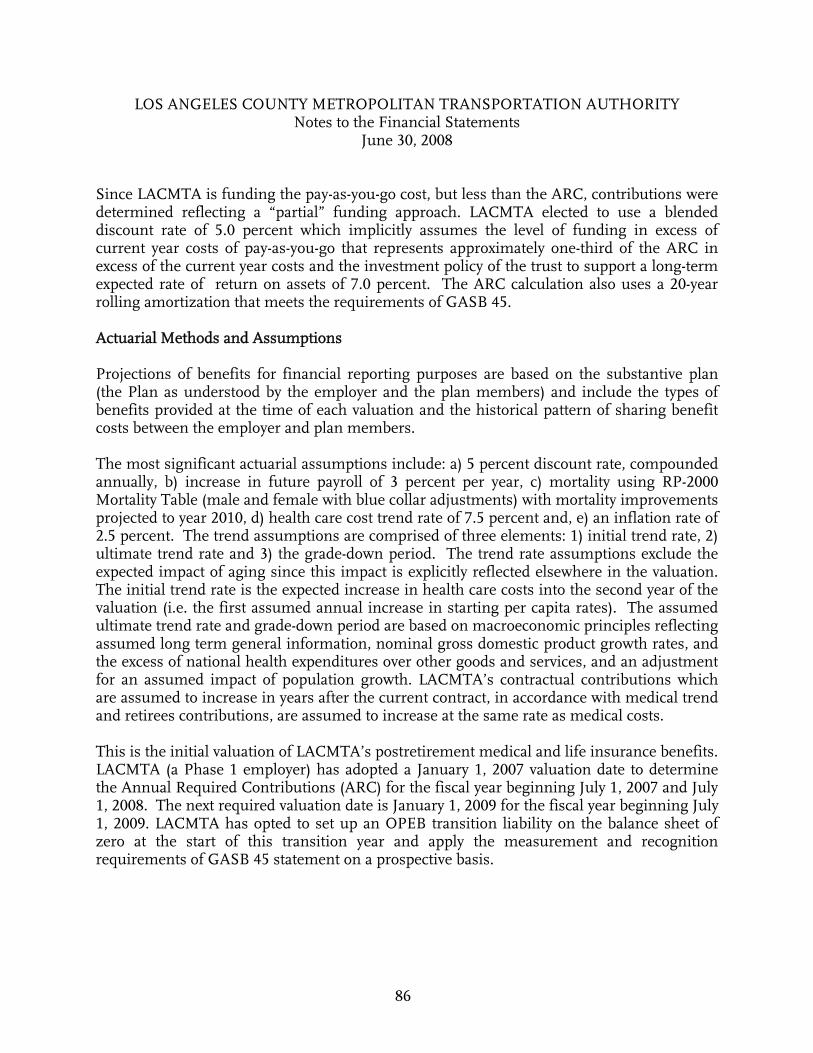
LOS ANGELES COUNTY METROPOLITAN TRANSPORTATION AUTHORITY Notes to the Financial Statements
June 30, 2008
86
Since LACMTA is funding the pay-as-you-go cost, but less than the ARC, contributions were determined reflecting a “partial” funding approach. LACMTA elected to use a blended discount rate of 5.0 percent which implicitly assumes the level of funding in excess of current year costs of pay-as-you-go that represents approximately one-third of the ARC in excess of the current year costs and the investment policy of the trust to support a long-term expected rate of return on assets of 7.0 percent. The ARC calculation also uses a 20-year rolling amortization that meets the requirements of GASB 45. Actuarial Methods and Assumptions Projections of benefits for financial reporting purposes are based on the substantive plan (the Plan as understood by the employer and the plan members) and include the types of benefits provided at the time of each valuation and the historical pattern of sharing benefit costs between the employer and plan members. The most significant actuarial assumptions include: a) 5 percent discount rate, compounded annually, b) increase in future payroll of 3 percent per year, c) mortality using RP-2000 Mortality Table (male and female with blue collar adjustments) with mortality improvements projected to year 2010, d) health care cost trend rate of 7.5 percent and, e) an inflation rate of 2.5 percent. The trend assumptions are comprised of three elements: 1) initial trend rate, 2) ultimate trend rate and 3) the grade-down period. The trend rate assumptions exclude the expected impact of aging since this impact is explicitly reflected elsewhere in the valuation. The initial trend rate is the expected increase in health care costs into the second year of the valuation (i.e. the first assumed annual increase in starting per capita rates). The assumed ultimate trend rate and grade-down period are based on macroeconomic principles reflecting assumed long term general information, nominal gross domestic product growth rates, and the excess of national health expenditures over other goods and services, and an adjustment for an assumed impact of population growth. LACMTA’s contractual contributions which are assumed to increase in years after the current contract, in accordance with medical trend and retirees contributions, are assumed to increase at the same rate as medical costs. This is the initial valuation of LACMTA’s postretirement medical and life insurance benefits. LACMTA (a Phase 1 employer) has adopted a January 1, 2007 valuation date to determine the Annual Required Contributions (ARC) for the fiscal year beginning July 1, 2007 and July 1, 2008. The next required valuation date is January 1, 2009 for the fiscal year beginning July 1, 2009. LACMTA has opted to set up an OPEB transition liability on the balance sheet of zero at the start of this transition year and apply the measurement and recognition requirements of GASB 45 statement on a prospective basis.
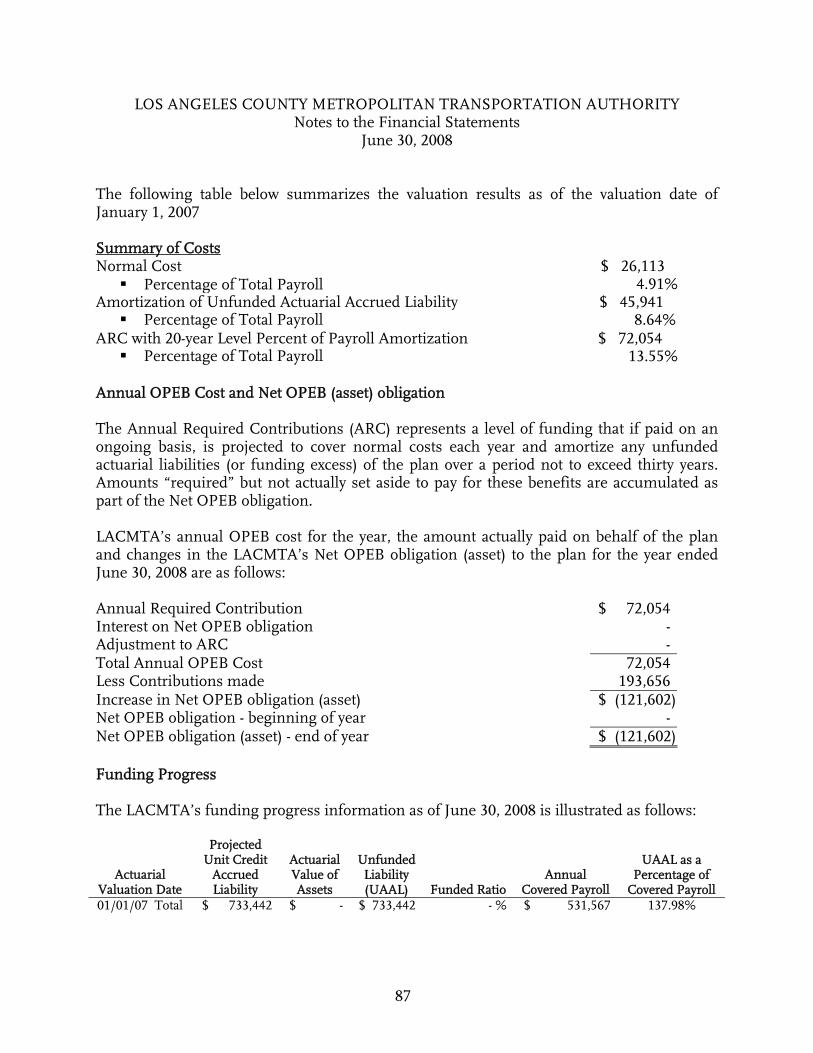
LOS ANGELES COUNTY METROPOLITAN TRANSPORTATION AUTHORITY Notes to the Financial Statements
June 30, 2008
87
The following table below summarizes the valuation results as of the valuation date of January 1, 2007 Summary of Costs Normal Cost $ 26,113
Percentage of Total Payroll 4.91% Amortization of Unfunded Actuarial Accrued Liability $ 45,941
Percentage of Total Payroll 8.64% ARC with 20-year Level Percent of Payroll Amortization $ 72,054
Percentage of Total Payroll 13.55% Annual OPEB Cost and Net OPEB (asset) obligation The Annual Required Contributions (ARC) represents a level of funding that if paid on an ongoing basis, is projected to cover normal costs each year and amortize any unfunded actuarial liabilities (or funding excess) of the plan over a period not to exceed thirty years. Amounts “required” but not actually set aside to pay for these benefits are accumulated as part of the Net OPEB obligation. LACMTA’s annual OPEB cost for the year, the amount actually paid on behalf of the plan and changes in the LACMTA’s Net OPEB obligation (asset) to the plan for the year ended June 30, 2008 are as follows: Annual Required Contribution $ 72,054 Interest on Net OPEB obligation - Adjustment to ARC - Total Annual OPEB Cost 72,054 Less Contributions made 193,656 Increase in Net OPEB obligation (asset) $ (121,602) Net OPEB obligation - beginning of year - Net OPEB obligation (asset) - end of year $ (121,602) Funding Progress The LACMTA’s funding progress information as of June 30, 2008 is illustrated as follows:
Actuarial Valuation Date
Projected Unit Credit
Accrued Liability
Actuarial Value of Assets
Unfunded Liability (UAAL)
Funded Ratio Annual
Covered Payroll
UAAL as a Percentage of
Covered Payroll 01/01/07 Total $ 733,442 $ - $ 733,442 - % $ 531,567 137.98%

LOS ANGELES COUNTY METROPOLITAN TRANSPORTATION AUTHORITY Notes to the Financial Statements
June 30, 2008
88
O. Deferred Compensation and 401(k) Savings Plan Deferred Compensation Plan LACMTA has a deferred compensation plan for all employees established in accordance with IRC Section 457, which permits employees to defer a portion of their current salary to future years. Under this plan, employees may contribute up to a lesser of $15,500 (not in thousands) or 100 percent of their earnings in calendar year 2008. A special provision in the law allows an additional $5,000 (not in thousands) if you are a “Baby Boomer” (age 50 or greater by December 31, 2008), and employees eligible for retirement within three years can avail of the “catch up provision”, totaling $31,000 (not in thousands). The plan is managed by a third party plan administrator and trustee. Employee deferrals can be allocated among several investment options as directed by the employee. Although the employee is always 100 percent vested in the plan, withdrawals are not available to employee until termination, retirement, death, or unforeseeable emergency. In the opinion of management, LACMTA has no liability for any losses under the plans, but does have the fiduciary responsibility of due professional care that would be required from a prudent investor. Accordingly, the assets of the deferred compensation plan and the related liability to employees are not reported in the fiduciary fund. LACMTA does not match employees’ contribution to the deferred compensation plan. As of June 30, 2008, the deferred compensation plans had assets (at fair value) totaling $195,892. 401 (k) Savings Plan LACMTA also offers a deferred savings plan to all employees created in accordance with IRC Section 401(k). Under this plan, employees may contribute up to the lesser of $15,500 (not in thousands) or 100 percent of their earnings in calendar year 2008. A special provision in the law allows an additional $5,000 (not in thousands) if you are a “Baby Boomer” (age 50 or greater by December 31, 2008). The Savings Plan is managed by a third party plan administrator, and the participants can direct the plan administrator to allocate their deferral based on several investment options. Plan benefits are based solely on amounts contributed by employees to their own accounts. Withdrawals are not available to employees until termination, retirement, age 59-1/2, death, or unforeseen emergency. In the opinion of management, LACMTA has no liability for any losses under the plans, but does have the fiduciary responsibility of due professional care that would be required from a prudent investor. Accordingly, the plan’s assets and liability to employees are not reported in the fiduciary fund. LACMTA does not match employees’ contribution to the 401(k) savings plan. As of June 30, 2008, the 401(k) savings plan had assets (at fair value) totaling $236,056.
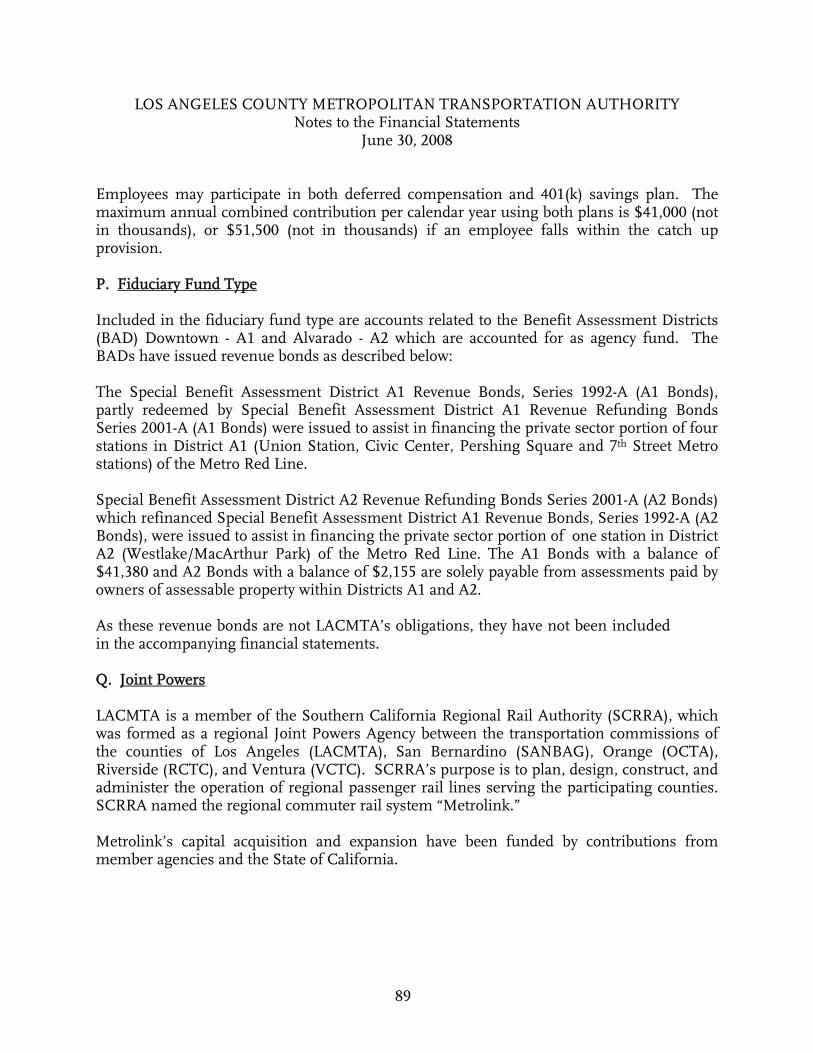
LOS ANGELES COUNTY METROPOLITAN TRANSPORTATION AUTHORITY Notes to the Financial Statements
June 30, 2008
89
Employees may participate in both deferred compensation and 401(k) savings plan. The maximum annual combined contribution per calendar year using both plans is $41,000 (not in thousands), or $51,500 (not in thousands) if an employee falls within the catch up provision. P. Fiduciary Fund Type Included in the fiduciary fund type are accounts related to the Benefit Assessment Districts (BAD) Downtown - A1 and Alvarado - A2 which are accounted for as agency fund. The BADs have issued revenue bonds as described below: The Special Benefit Assessment District A1 Revenue Bonds, Series 1992-A (A1 Bonds), partly redeemed by Special Benefit Assessment District A1 Revenue Refunding Bonds Series 2001-A (A1 Bonds) were issued to assist in financing the private sector portion of four stations in District A1 (Union Station, Civic Center, Pershing Square and 7th Street Metro stations) of the Metro Red Line. Special Benefit Assessment District A2 Revenue Refunding Bonds Series 2001-A (A2 Bonds) which refinanced Special Benefit Assessment District A1 Revenue Bonds, Series 1992-A (A2 Bonds), were issued to assist in financing the private sector portion of one station in District A2 (Westlake/MacArthur Park) of the Metro Red Line. The A1 Bonds with a balance of $41,380 and A2 Bonds with a balance of $2,155 are solely payable from assessments paid by owners of assessable property within Districts A1 and A2. As these revenue bonds are not LACMTA’s obligations, they have not been included in the accompanying financial statements. Q. Joint Powers LACMTA is a member of the Southern California Regional Rail Authority (SCRRA), which was formed as a regional Joint Powers Agency between the transportation commissions of the counties of Los Angeles (LACMTA), San Bernardino (SANBAG), Orange (OCTA), Riverside (RCTC), and Ventura (VCTC). SCRRA’s purpose is to plan, design, construct, and administer the operation of regional passenger rail lines serving the participating counties. SCRRA named the regional commuter rail system “Metrolink.” Metrolink’s capital acquisition and expansion have been funded by contributions from member agencies and the State of California.
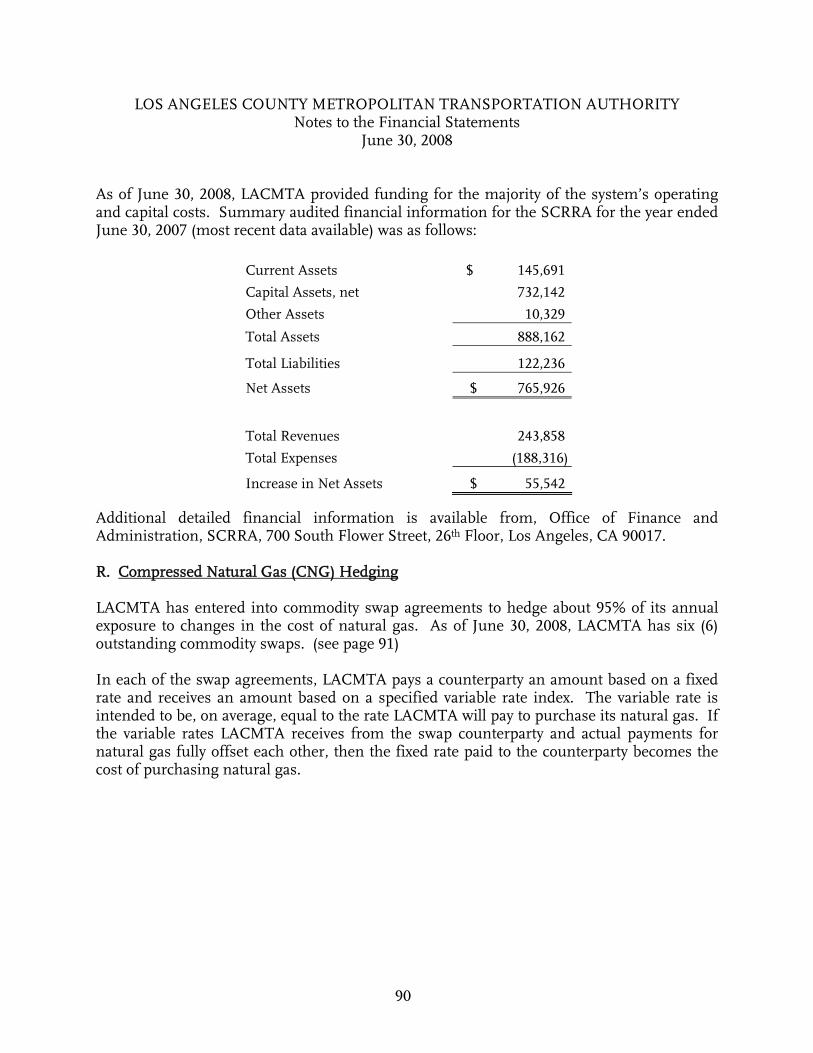
LOS ANGELES COUNTY METROPOLITAN TRANSPORTATION AUTHORITY Notes to the Financial Statements
June 30, 2008
90
As of June 30, 2008, LACMTA provided funding for the majority of the system’s operating and capital costs. Summary audited financial information for the SCRRA for the year ended June 30, 2007 (most recent data available) was as follows: Additional detailed financial information is available from, Office of Finance and Administration, SCRRA, 700 South Flower Street, 26th Floor, Los Angeles, CA 90017. R. Compressed Natural Gas (CNG) Hedging LACMTA has entered into commodity swap agreements to hedge about 95% of its annual exposure to changes in the cost of natural gas. As of June 30, 2008, LACMTA has six (6) outstanding commodity swaps. (see page 91) In each of the swap agreements, LACMTA pays a counterparty an amount based on a fixed rate and receives an amount based on a specified variable rate index. The variable rate is intended to be, on average, equal to the rate LACMTA will pay to purchase its natural gas. If the variable rates LACMTA receives from the swap counterparty and actual payments for natural gas fully offset each other, then the fixed rate paid to the counterparty becomes the cost of purchasing natural gas.
Current Assets $ 145,691
Capital Assets, net 732,142
Other Assets 10,329
Total Assets 888,162
Total Liabilities 122,236
Net Assets $ 765,926
Total Revenues 243,858
Total Expenses (188,316)
Increase in Net Assets $ 55,542
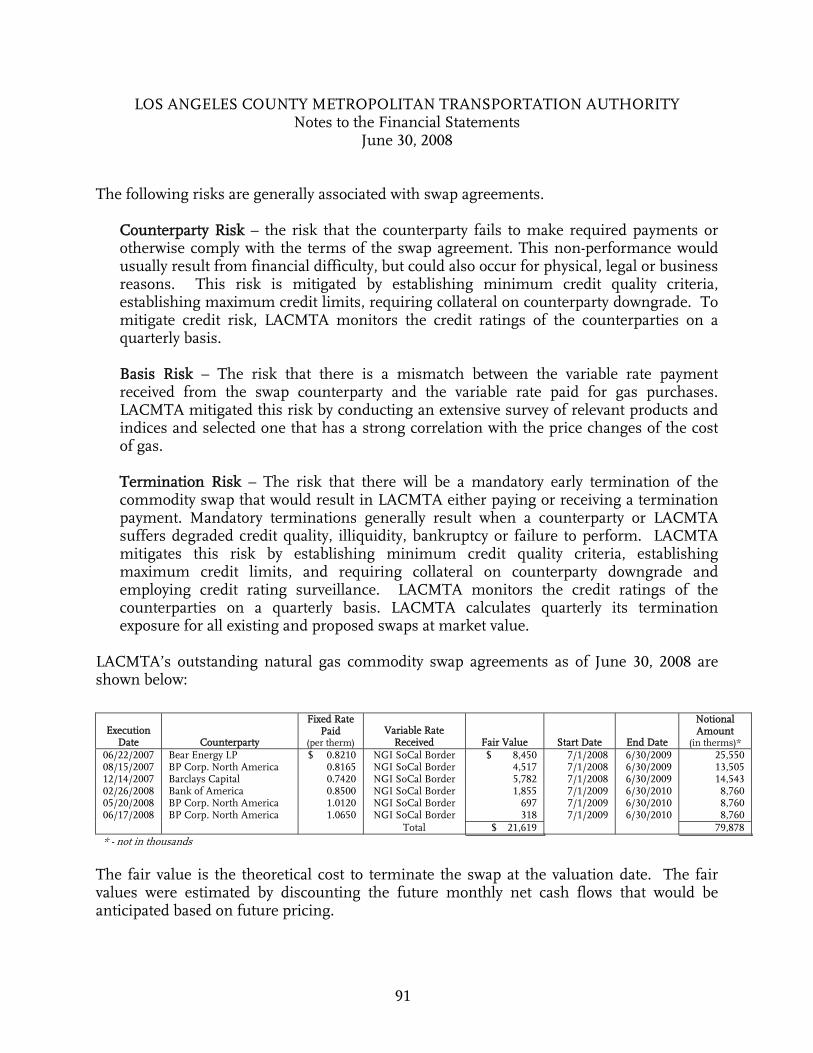
LOS ANGELES COUNTY METROPOLITAN TRANSPORTATION AUTHORITY Notes to the Financial Statements
June 30, 2008
91
The following risks are generally associated with swap agreements.
Counterparty Risk – the risk that the counterparty fails to make required payments or otherwise comply with the terms of the swap agreement. This non-performance would usually result from financial difficulty, but could also occur for physical, legal or business reasons. This risk is mitigated by establishing minimum credit quality criteria, establishing maximum credit limits, requiring collateral on counterparty downgrade. To mitigate credit risk, LACMTA monitors the credit ratings of the counterparties on a quarterly basis.
Basis Risk – The risk that there is a mismatch between the variable rate payment received from the swap counterparty and the variable rate paid for gas purchases. LACMTA mitigated this risk by conducting an extensive survey of relevant products and indices and selected one that has a strong correlation with the price changes of the cost of gas.
Termination Risk – The risk that there will be a mandatory early termination of the commodity swap that would result in LACMTA either paying or receiving a termination payment. Mandatory terminations generally result when a counterparty or LACMTA suffers degraded credit quality, illiquidity, bankruptcy or failure to perform. LACMTA mitigates this risk by establishing minimum credit quality criteria, establishing maximum credit limits, and requiring collateral on counterparty downgrade and employing credit rating surveillance. LACMTA monitors the credit ratings of the counterparties on a quarterly basis. LACMTA calculates quarterly its termination exposure for all existing and proposed swaps at market value.
LACMTA’s outstanding natural gas commodity swap agreements as of June 30, 2008 are shown below:
The fair value is the theoretical cost to terminate the swap at the valuation date. The fair values were estimated by discounting the future monthly net cash flows that would be anticipated based on future pricing.
Execution Date Counterparty
Fixed Rate Paid
(per therm) Variable Rate
Received Fair Value Start Date End Date
Notional Amount
(in therms)* 06/22/2007 Bear Energy LP $ 0.8210 NGI SoCal Border $ 8,450 7/1/2008 6/30/2009 25,550 08/15/2007 BP Corp. North America 0.8165 NGI SoCal Border 4,517 7/1/2008 6/30/2009 13,505 12/14/2007 Barclays Capital 0.7420 NGI SoCal Border 5,782 7/1/2008 6/30/2009 14,543 02/26/2008 Bank of America 0.8500 NGI SoCal Border 1,855 7/1/2009 6/30/2010 8,760 05/20/2008 BP Corp. North America 1.0120 NGI SoCal Border 697 7/1/2009 6/30/2010 8,760 06/17/2008 BP Corp. North America 1.0650 NGI SoCal Border 318 7/1/2009 6/30/2010 8,760
Total $ 21,619 79,878 * - not in thousands

LOS ANGELES COUNTY METROPOLITAN TRANSPORTATION AUTHORITY Notes to the Financial Statements
June 30, 2008
92
Counterparty Ratings The current ratings of the counterparties on LACMTA’s existing natural gas commodity swaps as of June 30, 2008 were as follows:
Long-term Ratings Counterparty or Guarantor Moody’s S&P Fitch Bank of America, N.A Aaa AA+ AA+ Barclays Bank PLC Aa1 AA AA Bear Energy/ JP Morgan Aa2 AA- AA- BP Corp. Aa2 AA+ AA+
Subsequent to June 30, 2008, there have been several rating downgrades of the counterparties. As of January 8, 2009, Bank of America, N.A., Moody’s rating had been downgraded from Aaa to Aa1 and its Fitch rating had been downgraded from AA+ to AA-; Barclays Bank PLC, S&P rating had been downgraded from AA to AA- and BP Corp., S&P rating had been downgraded from AA+ to AA. S. Litigation and Other Contingencies Litigation LACMTA is named as a defendant in various lawsuits. Although the outcome of these lawsuits is not presently determinable, in the opinion of management, the resolution of these matters will not have a materially adverse effect on the financial condition of LACMTA. Federal, State and Other Governmental Funding LACMTA receives significant funding from Federal, State, and other governmental grant funds as reimbursement for costs incurred. Such grants are subject to review and audit by the grantor agencies. These audits could result in disallowed expenditures under the terms of the grant or in reductions of future grant monies. Based on prior experience, LACMTA’s management believes that costs ultimately disallowed, if any, would not materially affect the financial condition of LACMTA.
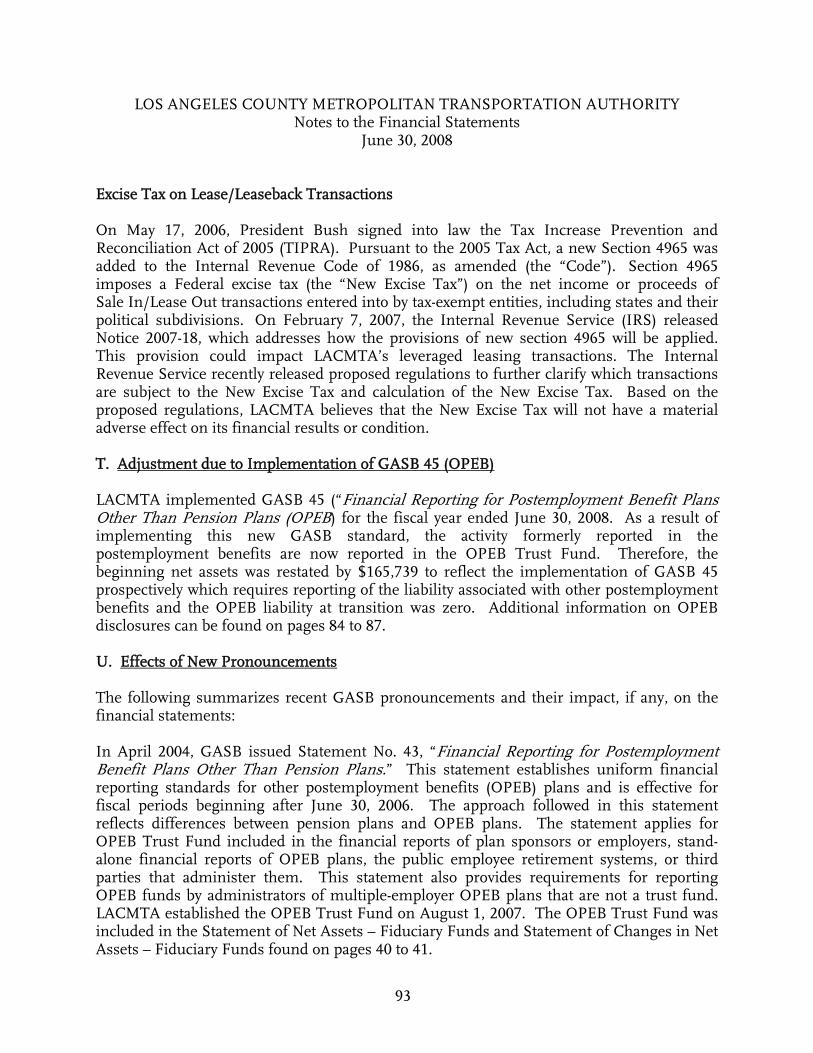
LOS ANGELES COUNTY METROPOLITAN TRANSPORTATION AUTHORITY Notes to the Financial Statements
June 30, 2008
93
Excise Tax on Lease/Leaseback Transactions On May 17, 2006, President Bush signed into law the Tax Increase Prevention and Reconciliation Act of 2005 (TIPRA). Pursuant to the 2005 Tax Act, a new Section 4965 was added to the Internal Revenue Code of 1986, as amended (the “Code”). Section 4965 imposes a Federal excise tax (the “New Excise Tax”) on the net income or proceeds of Sale In/Lease Out transactions entered into by tax-exempt entities, including states and their political subdivisions. On February 7, 2007, the Internal Revenue Service (IRS) released Notice 2007-18, which addresses how the provisions of new section 4965 will be applied. This provision could impact LACMTA’s leveraged leasing transactions. The Internal Revenue Service recently released proposed regulations to further clarify which transactions are subject to the New Excise Tax and calculation of the New Excise Tax. Based on the proposed regulations, LACMTA believes that the New Excise Tax will not have a material adverse effect on its financial results or condition. T. Adjustment due to Implementation of GASB 45 (OPEB) LACMTA implemented GASB 45 (“Financial Reporting for Postemployment Benefit Plans Other Than Pension Plans (OPEB) for the fiscal year ended June 30, 2008. As a result of implementing this new GASB standard, the activity formerly reported in the postemployment benefits are now reported in the OPEB Trust Fund. Therefore, the beginning net assets was restated by $165,739 to reflect the implementation of GASB 45 prospectively which requires reporting of the liability associated with other postemployment benefits and the OPEB liability at transition was zero. Additional information on OPEB disclosures can be found on pages 84 to 87. U. Effects of New Pronouncements The following summarizes recent GASB pronouncements and their impact, if any, on the financial statements: In April 2004, GASB issued Statement No. 43, “Financial Reporting for Postemployment Benefit Plans Other Than Pension Plans.” This statement establishes uniform financial reporting standards for other postemployment benefits (OPEB) plans and is effective for fiscal periods beginning after June 30, 2006. The approach followed in this statement reflects differences between pension plans and OPEB plans. The statement applies for OPEB Trust Fund included in the financial reports of plan sponsors or employers, stand-alone financial reports of OPEB plans, the public employee retirement systems, or third parties that administer them. This statement also provides requirements for reporting OPEB funds by administrators of multiple-employer OPEB plans that are not a trust fund. LACMTA established the OPEB Trust Fund on August 1, 2007. The OPEB Trust Fund was included in the Statement of Net Assets – Fiduciary Funds and Statement of Changes in Net Assets – Fiduciary Funds found on pages 40 to 41.

LOS ANGELES COUNTY METROPOLITAN TRANSPORTATION AUTHORITY Notes to the Financial Statements
June 30, 2008
94
In July 2004, GASB issued Statement No. 45, “Accounting and Financial Reporting by Employers for Postemployment Benefits Other than Pensions.” This statement addresses how the State and local governments should account for and report costs and obligations related to postemployment healthcare and other non-pension benefits and is effective for fiscal periods beginning after December 15, 2006. Annual OPEB cost for most employers will be based on actuarially determined amounts that, if paid on an ongoing basis, generally would provide sufficient resources to pay benefits as they come due. This statement’s provisions may be applied prospectively and do not require governments to fund their OPEB plans. This statement also establishes disclosure requirements for information about the plans in which an employer participates, the funding policy followed, the actuarial valuation process and assumptions, and for certain employers, the extent to which the plan has been funded over time. LACMTA implemented GASB 45 for the fiscal year ended June 30, 2008. In September 2006, GASB issued Statement No. 48 “Sales and Pledges of Receivables and Future Revenues and Intra-Entity Transfers of Assets and Future Revenues”. This statement establishes criteria that government will use to ascertain whether the proceeds received should be reported as revenue or as a liability. The criteria should be use to determine the extent to which a transferor government either retains or relinquishes control over the receivables or future revenues through its continuing involvement with those receivables or future revenues. The disclosures pertaining to future revenues that have been pledged or sold are intended to provide financial statement users with information about which revenues will be unavailable for other purposes and how long they will continue to be so. The requirements of this statement are effective for periods beginning after December 15, 2006. LACMTA has not engaged in any transactions as described in GASB 48. In November 2006, GASB issued Statement No. 49 “Accounting and Financial Reporting for Pollution Remediation Obligations”. This statement addresses accounting and financial reporting standards for pollution remediation obligations. Pollution remediation obligations generally will result in recognition and reporting of pollution remediation liabilities, or in other instance, an obligation to participate in pollution remediation activities will result in recognition and reporting of capital assets transactions at the time those assets are acquired. The requirements of this statement are effective for financial statements for periods beginning after December 15, 2007. LACMTA plans to implement the new reporting requirement for fiscal year ending June 30, 2009. In May 2007, GASB issued Statement No. 50 “Pension Disclosures – An Amendment of GASB Statements No. 25 and No. 27”. This statement more closely aligns the financial reporting requirements for pensions with those for Other Postemployment Benefits (OPEB) and, in doing so, enhances information disclosed in notes to financial statements or presented as required supplementary information (RSI) by pension plans and by employers that provide pension benefits. This statement is effective for periods beginning after June 15, 2007. LACMTA implemented GASB 50 for the fiscal year ended June 30, 2008.
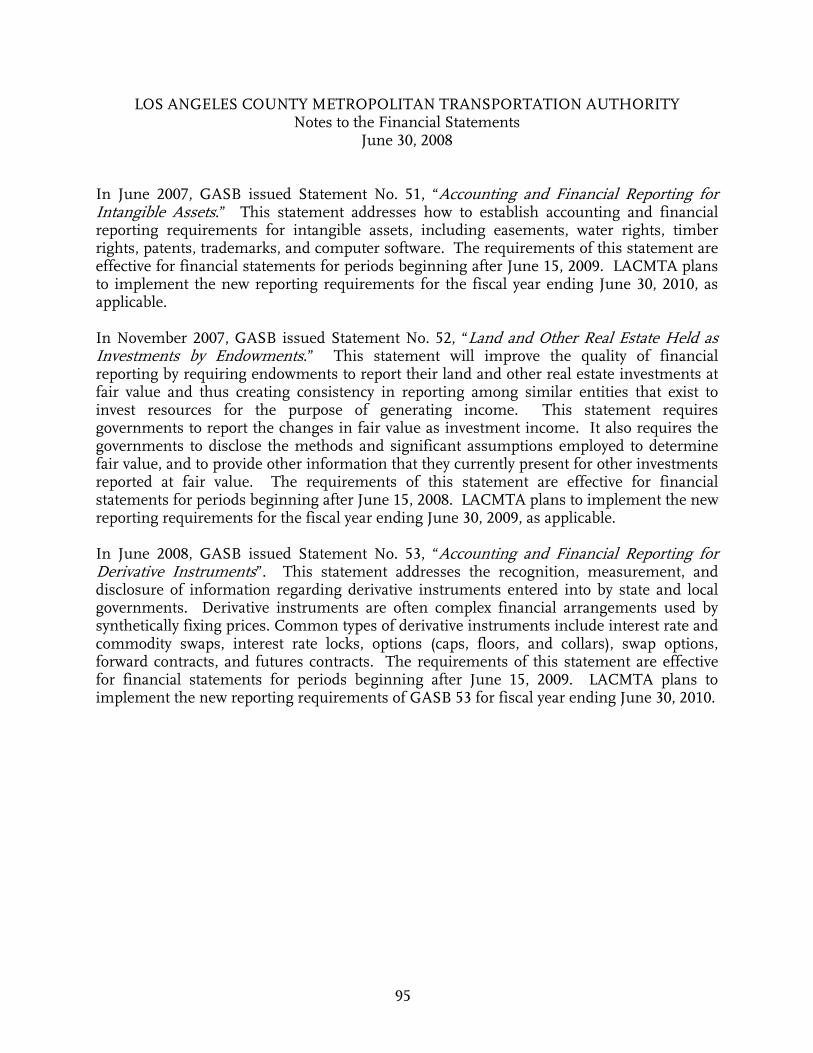
LOS ANGELES COUNTY METROPOLITAN TRANSPORTATION AUTHORITY Notes to the Financial Statements
June 30, 2008
95
In June 2007, GASB issued Statement No. 51, “Accounting and Financial Reporting for Intangible Assets.” This statement addresses how to establish accounting and financial reporting requirements for intangible assets, including easements, water rights, timber rights, patents, trademarks, and computer software. The requirements of this statement are effective for financial statements for periods beginning after June 15, 2009. LACMTA plans to implement the new reporting requirements for the fiscal year ending June 30, 2010, as applicable. In November 2007, GASB issued Statement No. 52, “Land and Other Real Estate Held as Investments by Endowments.” This statement will improve the quality of financial reporting by requiring endowments to report their land and other real estate investments at fair value and thus creating consistency in reporting among similar entities that exist to invest resources for the purpose of generating income. This statement requires governments to report the changes in fair value as investment income. It also requires the governments to disclose the methods and significant assumptions employed to determine fair value, and to provide other information that they currently present for other investments reported at fair value. The requirements of this statement are effective for financial statements for periods beginning after June 15, 2008. LACMTA plans to implement the new reporting requirements for the fiscal year ending June 30, 2009, as applicable. In June 2008, GASB issued Statement No. 53, “Accounting and Financial Reporting for Derivative Instruments”. This statement addresses the recognition, measurement, and disclosure of information regarding derivative instruments entered into by state and local governments. Derivative instruments are often complex financial arrangements used by synthetically fixing prices. Common types of derivative instruments include interest rate and commodity swaps, interest rate locks, options (caps, floors, and collars), swap options, forward contracts, and futures contracts. The requirements of this statement are effective for financial statements for periods beginning after June 15, 2009. LACMTA plans to implement the new reporting requirements of GASB 53 for fiscal year ending June 30, 2010.
LOS ANGELES COUNTY METROPOLITAN TRANSPORTATION AUTHORITY Notes to the Financial Statements
June 30, 2008
96
V. Subsequent Events New Transportation Sales Tax Measure R was approved by 2/3 of the Los Angeles County voters in the November 2008 election. Measure R is an ordinance authorizing an additional 1/2 of 1% sales tax to fund traffic relief and rail expansion according to an expenditure plan contained in the ordinance. The Measure R sales tax will become effective July 1, 2009 and remain in effect for 30 years. Lease/leaseback and Lease-to-service Obligations American International Group (AIG) provided a fixed income investment product known as a payment undertaking agreement that was used in seven of the lease transactions in order to invest proceeds to fund all the scheduled rent payments and early buyout option payments. Under the leveraged lease documents, AIG is required to be replaced or credit enhanced if any of its credit ratings fall below either Aa2/AA or A2/A, depending on the transaction. AIG also provided credit support in the form of letters of credit for three transactions and are required to be replaced if any of its credit ratings fall below either A2or A. On September 15, 2008 AIG was downgraded to “A-” by S&P, requiring replacement of the payment undertaking agreements and credit enhancement, as appropriate, and in two instances required AIG to post collateral. For five of the transactions collateral was posted at inception. Most products specified in the documents as acceptable replacement facilities are not available in the current market. Since LACMTA was unable to provide acceptable replacement facilities within either 30 or 60 days, as applicable, the investor then has the option to exercise any of several remedies, including termination of the lease in which case LACMTA would be required to pay a termination amount that may be substantial. If termination payments were due on each of the seven leases the total payment is estimated to be as much as $166 million, plus legal costs. LACMTA is taking steps to locate qualifying replacement facilities and also to reach an agreement with each investor to implement alternative strategies to replace or provide credit enhancement for the AIG facilities, or to terminate on cost neutral terms. LACMTA is also pursuing Federal legislative or administrative solutions. As part of a nationwide coalition comprised of over 30 transit agencies affected by similar lease transactions, LACMTA is seeking either a Federal legislative or administrative solution. Such a solution would be implemented by the Federal Reserve or U.S. Treasury to provide a guaranty of the performance of the providers of the payment agreements and credit support facilities in the lease transactions. A guaranty program could be implemented under existing authority or as part of any new bailout or economic stimulus legislation.
LOS ANGELES COUNTY METROPOLITAN TRANSPORTATION AUTHORITY Notes to the Financial Statements
June 30, 2008
97
Long-term Debt In September 2008, LACMTA issued a $289,150 Proposition A Sales Tax Revenue Refunding Bonds, Series 2008-A and 2008-B. The proceeds were used to: (a) refund all of the outstanding Proposition A Sales Tax Revenue Refunding Bonds Series 2005-C1, 2005-C2, 2005-C3, and 2005-C4, which were outstanding in the aggregate principal amount of $263,075; (b) make a deposit to the Reserve Fund and pay the premium for the municipal bond debt service reserve policy provided by Financial Security Assurance Inc.; and (c) pay the cost of issuing the Series 2008-A and 2008-B Bonds. In October 2008, LACMTA redeemed $ 31,575 of the Capital Grant Receipts Revenue Bonds Series 2005 B1 and $31,550 Series 2005 B2 for the total amount of $63,125. A mandatory redemption of $42,325, and $20,800, would have been required in December 2009 and December 2010, respectively. LACMTA redeemed the bonds earlier to reduce its future debt service requirements. Impact of Bond Insurer Rating Downgrades on LACMTA’s Auction Rate Securities and Variable Rate Demand Bonds Beginning in February 2008, the auction rate securities market and the variable rate demand bond market experienced increased volatility due to, among other things, the deteriorating financial strength and credit ratings downgrades of virtually all of the previously AAA-rated monoline bond insurers. The credit ratings downgrades resulted from the significant actual and potential losses of the insurers resulting from their exposure to sub-prime mortgage securities. LACMTA had approximately $1.1 billion of auction rate securities and variable rate demand bonds outstanding as of November 1, 2008, all of which have experienced increased rates. Approximately $263,075 of auction rate securities were refunded through the issuance of Proposition A Sales Tax Revenue Refunding Bonds, Series 2008-A and 2008-B. Another $21,100 of auction rate securities was refunded through the issuance of the 13th Sub-series of the Proposition A commercial paper program. LACMTA is actively pursuing alternative options to restructure the balance of the affected bonds. LACMTA is re-evaluating its restructuring alternatives following a number of potential liquidity providers pulling out of the market in October 2008. The current plan anticipates that the restructuring activities will have been substantially completed by the end of June 2009. The scheduled restructuring could be delayed unless there are some improvements in the availability of bank liquidity facilities or lowering of yields on fixed rate municipal bonds. LACMTA has included increased estimates of interest expense in its adopted budget for Fiscal Year 2009, in order to account for continued higher interest rates in the auction rate securities and variable rate demand bond markets.
LOS ANGELES COUNTY METROPOLITAN TRANSPORTATION AUTHORITY Notes to the Financial Statements
June 30, 2008
98
Recent Changes in the Economic Environment and its Impact to LACMTA The sub-prime mortgage market collapse triggered the breakdown of many financial institutions such as the American International Group Inc. (AIG), Lehman Brothers Holdings, Inc., and Washington Mutual Bank. The financial crisis ultimately exposed investors to lose holdings with various ailing financial institutions. The federal government quickly stepped in by taking control and enacted the Emergency Economic Stabilization Act of 2008 that infused $700 billion into various failing financial institutions. These steps taken by the government alleviated the viability of troubled financial institutions and to some degree also secured the assets of investors. LACMTA’s investment portfolio is reasonably diversified. While LACMTA is susceptible to the current global financial crisis, a majority of its investments have minimal exposure to credit, market, and liquidity risks. In the opinion of management, the current financial crisis has limited effect on LACMTA’s financial condition.
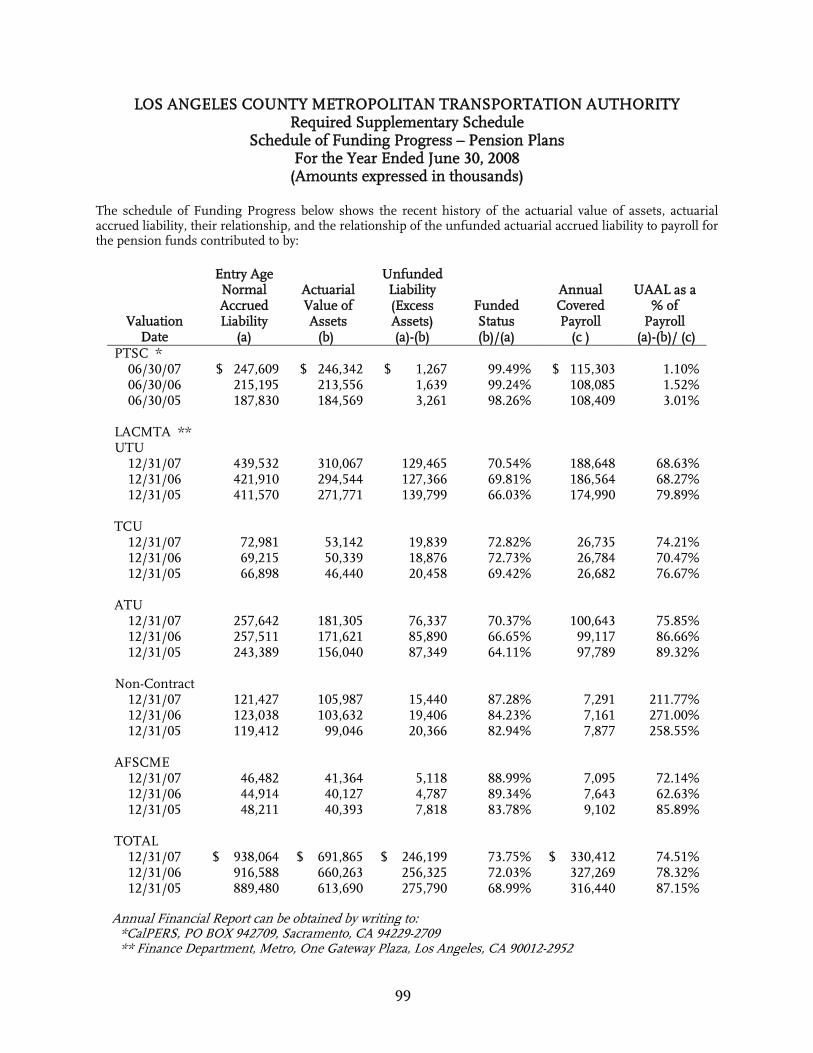
LOS ANGELES COUNTY METROPOLITAN TRANSPORTATION AUTHORITY Required Supplementary Schedule
Schedule of Funding Progress – Pension Plans For the Year Ended June 30, 2008
(Amounts expressed in thousands)
99
The schedule of Funding Progress below shows the recent history of the actuarial value of assets, actuarial accrued liability, their relationship, and the relationship of the unfunded actuarial accrued liability to payroll for the pension funds contributed to by:
Valuation Date
Entry Age Normal Accrued Liability
(a)
Actuarial Value of Assets
(b)
Unfunded Liability (Excess Assets) (a)-(b)
Funded Status (b)/(a)
Annual Covered Payroll
(c )
UAAL as a % of
Payroll (a)-(b)/ (c)
PTSC * 06/30/07 $ 247,609 $ 246,342 $ 1,267 99.49% $ 115,303 1.10% 06/30/06 215,195 213,556 1,639 99.24% 108,085 1.52% 06/30/05 187,830 184,569 3,261 98.26% 108,409 3.01%
LACMTA ** UTU
12/31/07 439,532 310,067 129,465 70.54% 188,648 68.63% 12/31/06 421,910 294,544 127,366 69.81% 186,564 68.27% 12/31/05 411,570 271,771 139,799 66.03% 174,990 79.89%
TCU
12/31/07 72,981 53,142 19,839 72.82% 26,735 74.21% 12/31/06 69,215 50,339 18,876 72.73% 26,784 70.47% 12/31/05 66,898 46,440 20,458 69.42% 26,682 76.67%
ATU
12/31/07 257,642 181,305 76,337 70.37% 100,643 75.85% 12/31/06 257,511 171,621 85,890 66.65% 99,117 86.66% 12/31/05 243,389 156,040 87,349 64.11% 97,789 89.32%
Non-Contract
12/31/07 121,427 105,987 15,440 87.28% 7,291 211.77% 12/31/06 123,038 103,632 19,406 84.23% 7,161 271.00% 12/31/05 119,412 99,046 20,366 82.94% 7,877 258.55%
AFSCME
12/31/07 46,482 41,364 5,118 88.99% 7,095 72.14% 12/31/06 44,914 40,127 4,787 89.34% 7,643 62.63% 12/31/05 48,211 40,393 7,818 83.78% 9,102 85.89%
TOTAL
12/31/07 $ 938,064 $ 691,865 $ 246,199 73.75% $ 330,412 74.51% 12/31/06 916,588 660,263 256,325 72.03% 327,269 78.32% 12/31/05 889,480 613,690 275,790 68.99% 316,440 87.15%
Annual Financial Report can be obtained by writing to:
*CalPERS, PO BOX 942709, Sacramento, CA 94229-2709 ** Finance Department, Metro, One Gateway Plaza, Los Angeles, CA 90012-2952

LOS ANGELES COUNTY METROPOLITAN TRANSPORTATION AUTHORITY Required Supplementary Schedule
Schedule of Funding Progress – OPEB For the Year Ended June 30, 2008
(Amounts expressed in thousands)
100
The schedule of Funding Progress below shows the first year actuarial value of assets, actuarial accrued liability, their relationship, and the relationship of the unfunded actuarial accrued liability to payroll for the OPEB fund established by LACMTA.
Projected Unit Credit
Accrued Liability
Actuarial Value of Assets
Unfunded Liability (UAAL)
Funded Ratio Annual
Covered Payroll
UAAL as a Percentage of
Covered Payroll Actuarial Valuation Date (a) (b) (a)-(b) (b)/(a) (c) (a)-(b)/(c)
LACMTA 01/01/07 $ 104,433 $ - $ 104,433 - % $ 144,609 72.22%
ATU 01/01/07 351,541 - 351,541 - % 122,385 287.24%
TCU 01/01/07 62,883 - 62,883 - % 31,242 201.28%
UTU 01/01/07 214,585 - 214,585 - % 233,331 91.97%
Total $ 733,442 $ - $ 733,442 - % $ 531,567 137.98%
Annual Financial Report can be obtained by writing to: Finance Department, METRO, One Gateway Plaza, Los Angeles, CA 90012-2952
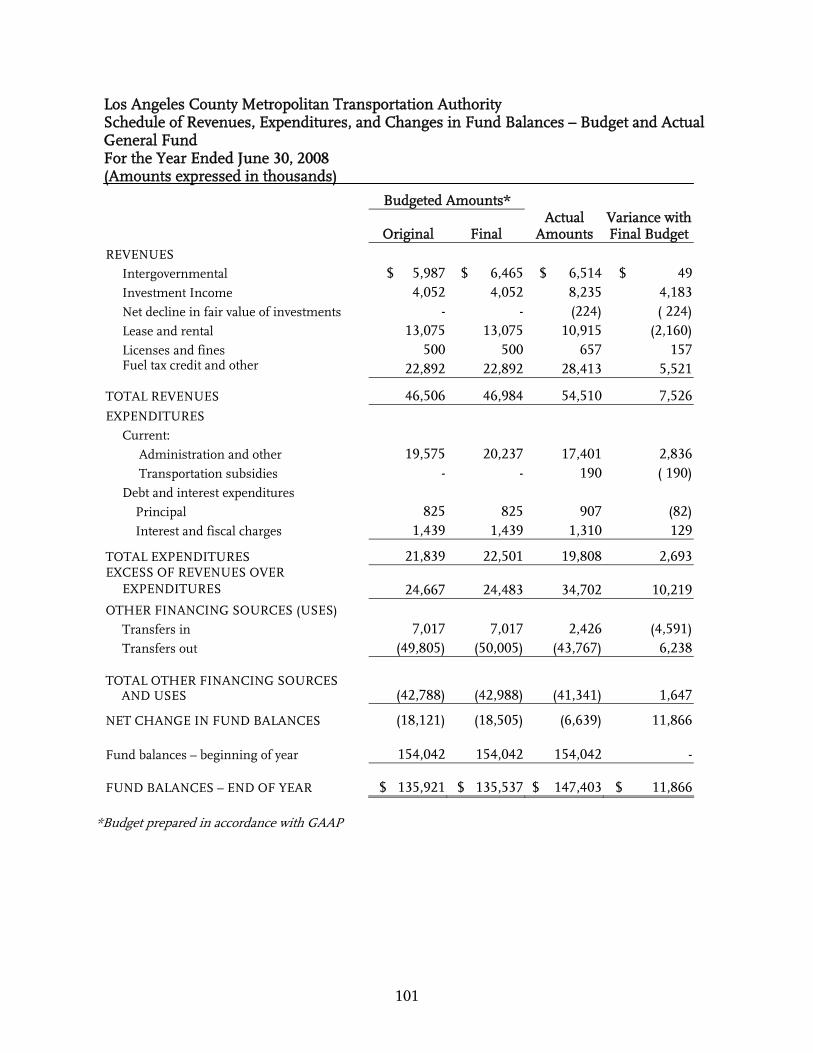
Los Angeles County Metropolitan Transportation Authority Schedule of Revenues, Expenditures, and Changes in Fund Balances – Budget and Actual General Fund For the Year Ended June 30, 2008 (Amounts expressed in thousands)
101
*Budget prepared in accordance with GAAP
Budgeted Amounts*
Original Final Actual
Amounts Variance with Final Budget
REVENUES Intergovernmental $ 5,987 $ 6,465 $ 6,514 $ 49 Investment Income 4,052 4,052 8,235 4,183 Net decline in fair value of investments - - (224) ( 224) Lease and rental 13,075 13,075 10,915 (2,160) Licenses and fines 500 500 657 157 Fuel tax credit and other 22,892 22,892 28,413 5,521
TOTAL REVENUES 46,506 46,984 54,510 7,526 EXPENDITURES Current: Administration and other 19,575 20,237 17,401 2,836 Transportation subsidies - - 190 ( 190) Debt and interest expenditures Principal 825 825 907 (82) Interest and fiscal charges 1,439 1,439 1,310 129
TOTAL EXPENDITURES 21,839 22,501 19,808 2,693 EXCESS OF REVENUES OVER EXPENDITURES 24,667 24,483 34,702 10,219 OTHER FINANCING SOURCES (USES) Transfers in 7,017 7,017 2,426 (4,591) Transfers out (49,805) (50,005) (43,767) 6,238 TOTAL OTHER FINANCING SOURCES
AND USES (42,788) (42,988) (41,341) 1,647
NET CHANGE IN FUND BALANCES (18,121) (18,505) (6,639) 11,866
Fund balances – beginning of year 154,042 154,042 154,042 -
FUND BALANCES – END OF YEAR $ 135,921 $ 135,537 $ 147,403 $ 11,866
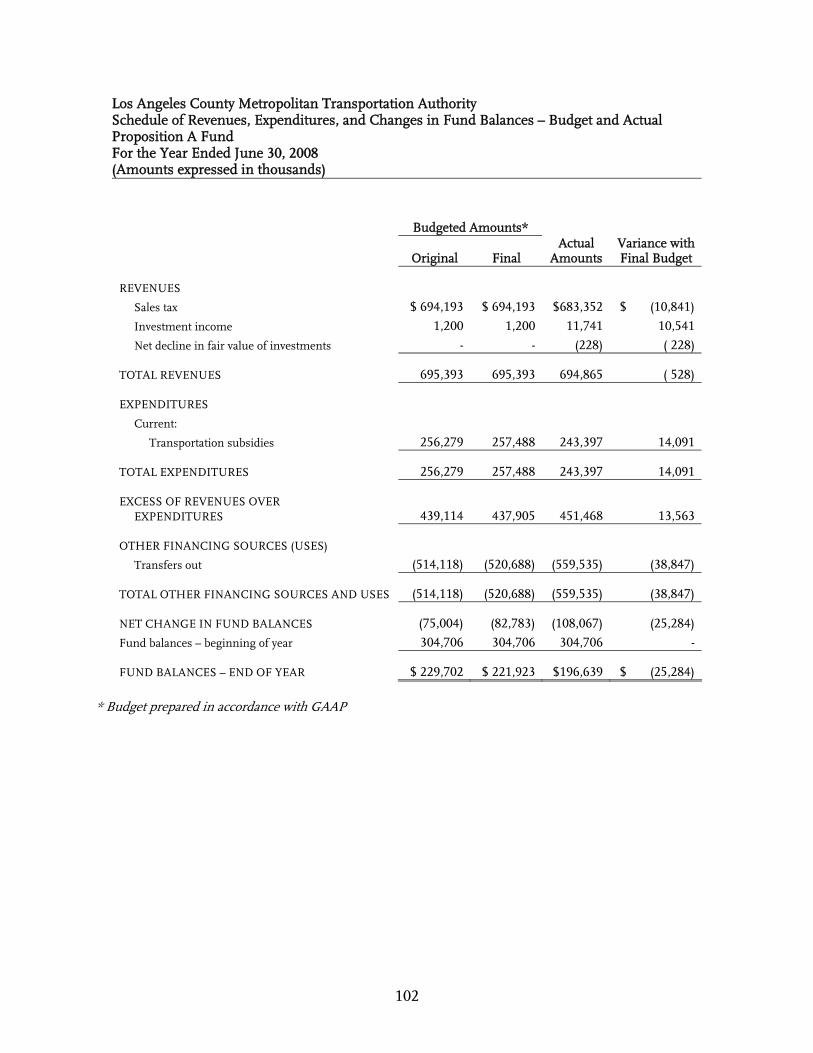
Los Angeles County Metropolitan Transportation Authority Schedule of Revenues, Expenditures, and Changes in Fund Balances – Budget and Actual Proposition A Fund For the Year Ended June 30, 2008 (Amounts expressed in thousands)
102
Budgeted Amounts*
Original Final Actual
Amounts Variance with Final Budget
REVENUES Sales tax $ 694,193 $ 694,193 $683,352 $ (10,841) Investment income 1,200 1,200 11,741 10,541 Net decline in fair value of investments - - (228) ( 228)
TOTAL REVENUES 695,393 695,393 694,865 ( 528)
EXPENDITURES Current: Transportation subsidies 256,279 257,488 243,397 14,091
TOTAL EXPENDITURES 256,279 257,488 243,397 14,091
EXCESS OF REVENUES OVER EXPENDITURES 439,114 437,905 451,468 13,563
OTHER FINANCING SOURCES (USES) Transfers out (514,118) (520,688) (559,535) (38,847)
TOTAL OTHER FINANCING SOURCES AND USES (514,118) (520,688) (559,535) (38,847)
NET CHANGE IN FUND BALANCES (75,004) (82,783) (108,067) (25,284) Fund balances – beginning of year 304,706 304,706 304,706 -
FUND BALANCES – END OF YEAR $ 229,702 $ 221,923 $196,639 $ (25,284) * Budget prepared in accordance with GAAP
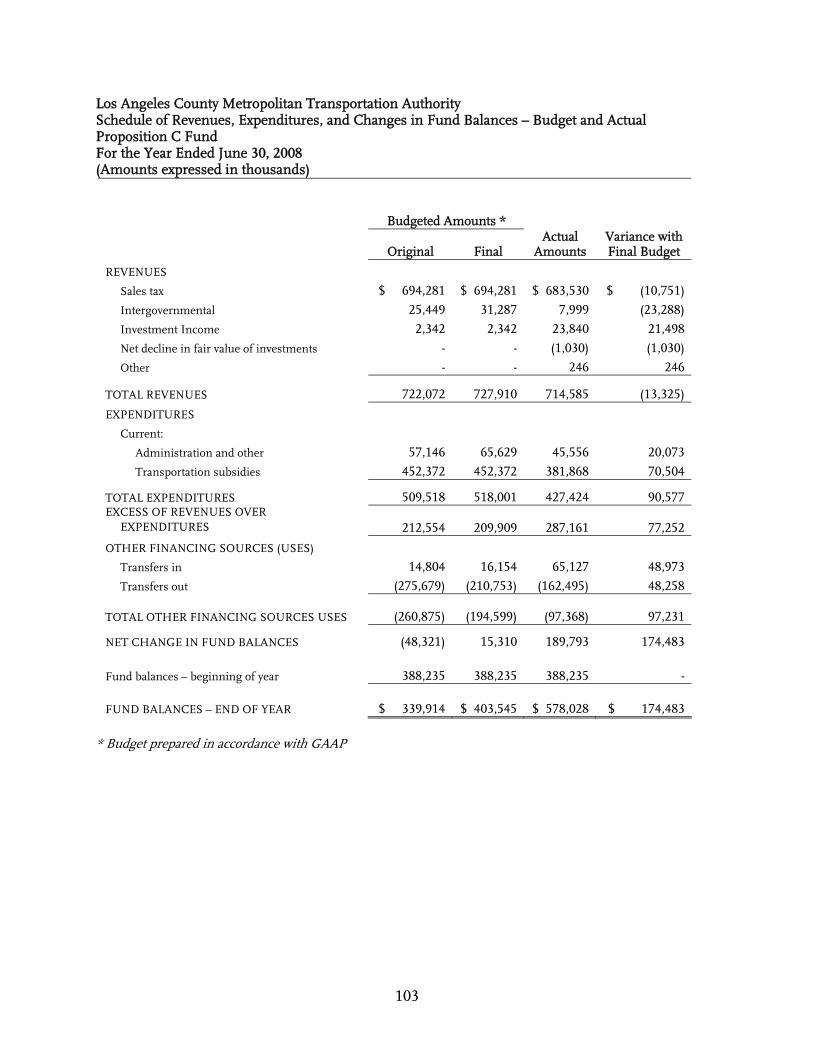
Los Angeles County Metropolitan Transportation Authority Schedule of Revenues, Expenditures, and Changes in Fund Balances – Budget and Actual Proposition C Fund For the Year Ended June 30, 2008 (Amounts expressed in thousands)
103
Budgeted Amounts *
Original Final
Actual Amounts
Variance with Final Budget
REVENUES Sales tax $ 694,281 $ 694,281 $ 683,530 $ (10,751) Intergovernmental 25,449 31,287 7,999 (23,288) Investment Income 2,342 2,342 23,840 21,498 Net decline in fair value of investments - - (1,030) (1,030) Other - - 246 246
TOTAL REVENUES 722,072 727,910 714,585 (13,325)
EXPENDITURES Current: Administration and other 57,146 65,629 45,556 20,073 Transportation subsidies 452,372 452,372 381,868 70,504
TOTAL EXPENDITURES 509,518 518,001 427,424 90,577 EXCESS OF REVENUES OVER EXPENDITURES 212,554 209,909 287,161 77,252
OTHER FINANCING SOURCES (USES) Transfers in 14,804 16,154 65,127 48,973 Transfers out (275,679) (210,753) (162,495) 48,258 TOTAL OTHER FINANCING SOURCES USES (260,875) (194,599) (97,368) 97,231
NET CHANGE IN FUND BALANCES (48,321) 15,310 189,793 174,483
Fund balances – beginning of year 388,235 388,235 388,235 -
FUND BALANCES – END OF YEAR $ 339,914 $ 403,545 $ 578,028 $ 174,483 * Budget prepared in accordance with GAAP
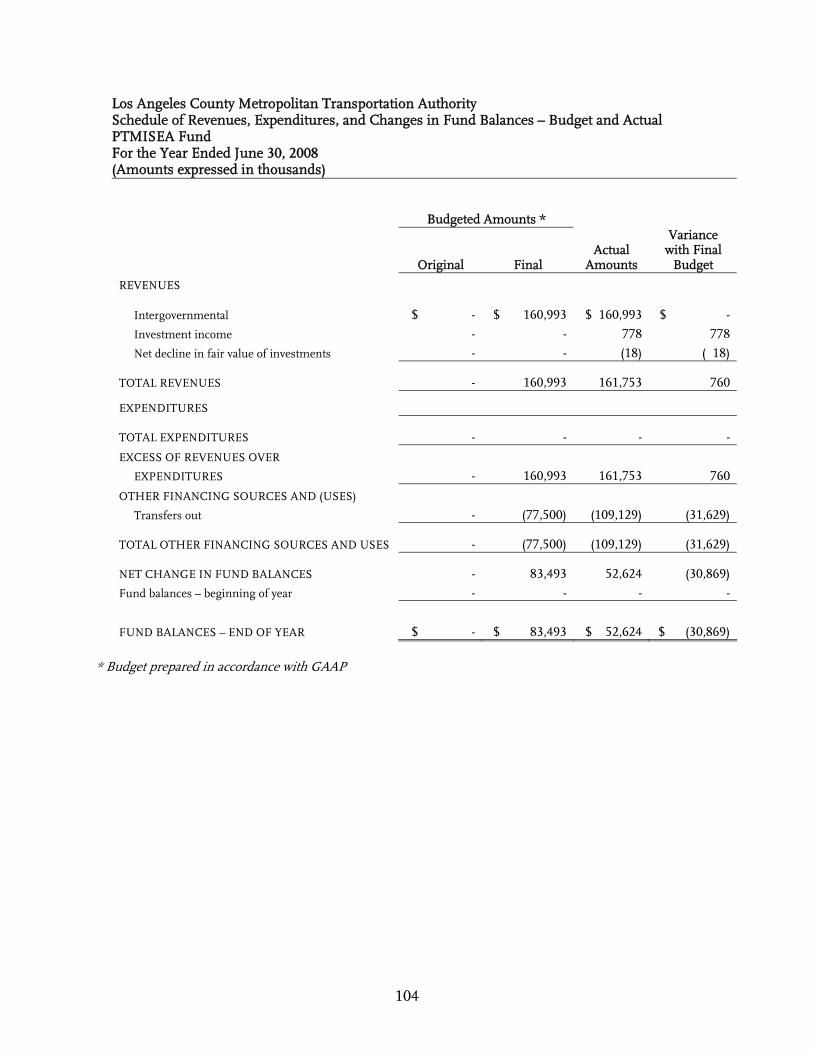
Los Angeles County Metropolitan Transportation Authority Schedule of Revenues, Expenditures, and Changes in Fund Balances – Budget and Actual PTMISEA Fund For the Year Ended June 30, 2008 (Amounts expressed in thousands)
104
Budgeted Amounts *
Original Final Actual
Amounts
Variance with Final
Budget
REVENUES
Intergovernmental
$ - $ 160,993 $ 160,993 $ - Investment income - - 778 778 Net decline in fair value of investments - - (18) ( 18)
TOTAL REVENUES - 160,993 161,753 760
EXPENDITURES
TOTAL EXPENDITURES - - - -
EXCESS OF REVENUES OVER EXPENDITURES - 160,993 161,753 760
OTHER FINANCING SOURCES AND (USES) Transfers out - (77,500) (109,129) (31,629)
TOTAL OTHER FINANCING SOURCES AND USES - (77,500) (109,129) (31,629)
NET CHANGE IN FUND BALANCES - 83,493 52,624 (30,869) Fund balances – beginning of year - - - -
FUND BALANCES – END OF YEAR
$ - $ 83,493 $ 52,624 $ (30,869) * Budget prepared in accordance with GAAP
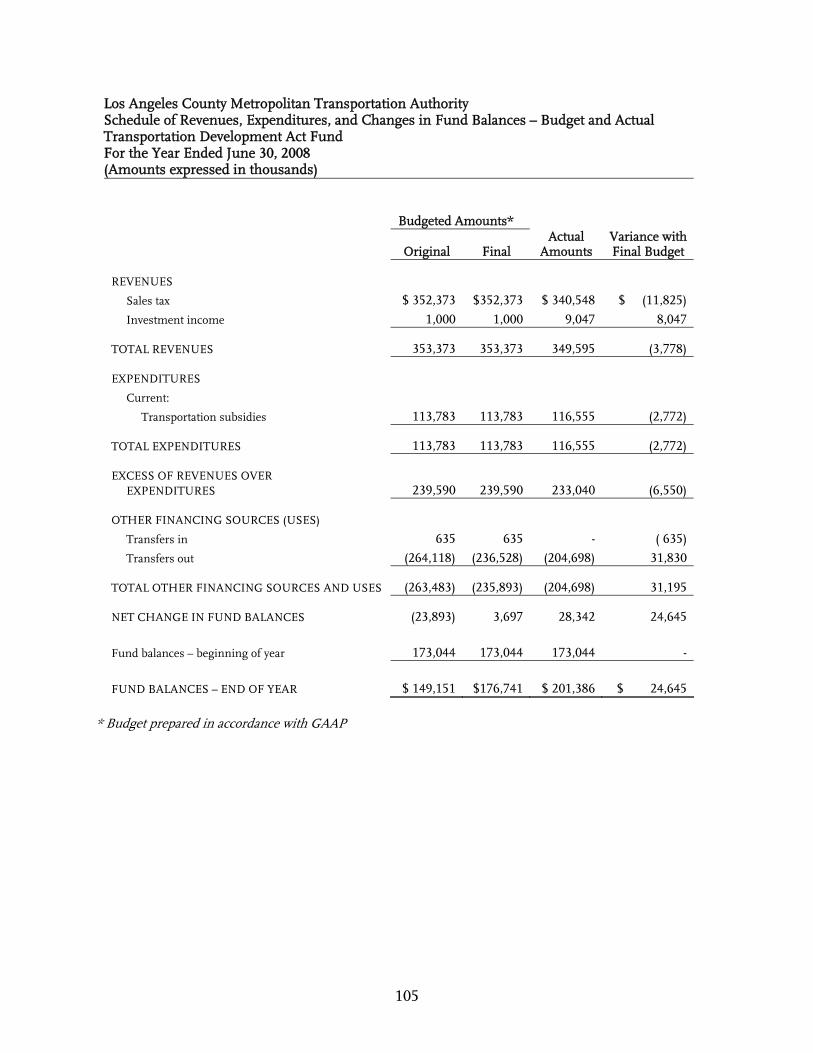
Los Angeles County Metropolitan Transportation Authority Schedule of Revenues, Expenditures, and Changes in Fund Balances – Budget and Actual Transportation Development Act Fund For the Year Ended June 30, 2008 (Amounts expressed in thousands)
105
Budgeted Amounts*
Original Final
Actual Amounts
Variance with Final Budget
REVENUES Sales tax $ 352,373 $352,373 $ 340,548 $ (11,825) Investment income 1,000 1,000 9,047 8,047
TOTAL REVENUES 353,373 353,373 349,595 (3,778)
EXPENDITURES Current: Transportation subsidies 113,783 113,783 116,555 (2,772)
TOTAL EXPENDITURES 113,783 113,783 116,555 (2,772)
EXCESS OF REVENUES OVER EXPENDITURES 239,590 239,590 233,040 (6,550)
OTHER FINANCING SOURCES (USES) Transfers in 635 635 - ( 635) Transfers out (264,118) (236,528) (204,698) 31,830
TOTAL OTHER FINANCING SOURCES AND USES (263,483) (235,893) (204,698) 31,195
NET CHANGE IN FUND BALANCES (23,893) 3,697 28,342 24,645
Fund balances – beginning of year 173,044 173,044 173,044 -
FUND BALANCES – END OF YEAR $ 149,151 $176,741 $ 201,386 $ 24,645 * Budget prepared in accordance with GAAP
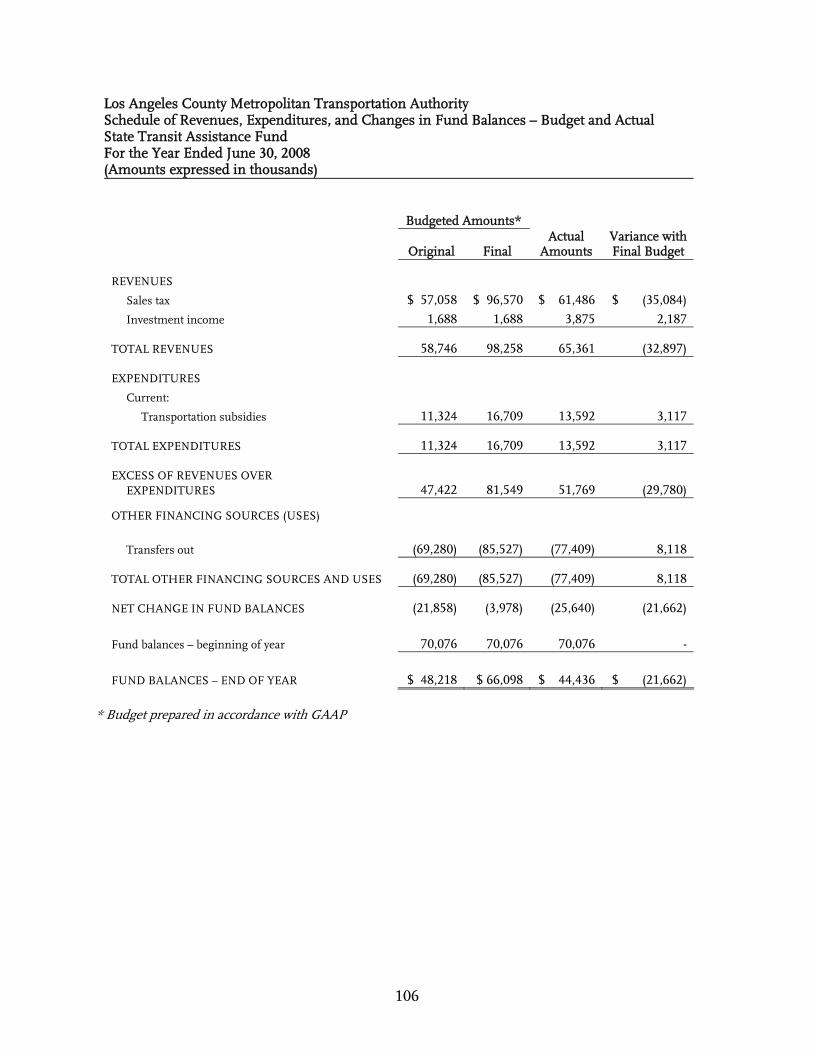
Los Angeles County Metropolitan Transportation Authority Schedule of Revenues, Expenditures, and Changes in Fund Balances – Budget and Actual State Transit Assistance Fund For the Year Ended June 30, 2008 (Amounts expressed in thousands)
106
Budgeted Amounts*
Original Final
Actual Amounts
Variance with Final Budget
REVENUES Sales tax $ 57,058 $ 96,570 $ 61,486 $ (35,084) Investment income 1,688 1,688 3,875 2,187
TOTAL REVENUES 58,746 98,258 65,361 (32,897)
EXPENDITURES Current: Transportation subsidies 11,324 16,709 13,592 3,117
TOTAL EXPENDITURES 11,324 16,709 13,592 3,117
EXCESS OF REVENUES OVER EXPENDITURES 47,422 81,549 51,769 (29,780)
OTHER FINANCING SOURCES (USES) Transfers out (69,280) (85,527) (77,409) 8,118
TOTAL OTHER FINANCING SOURCES AND USES (69,280) (85,527) (77,409) 8,118
NET CHANGE IN FUND BALANCES (21,858) (3,978) (25,640) (21,662)
Fund balances – beginning of year 70,076 70,076 70,076 -
FUND BALANCES – END OF YEAR $ 48,218 $ 66,098 $ 44,436 $ (21,662) * Budget prepared in accordance with GAAP
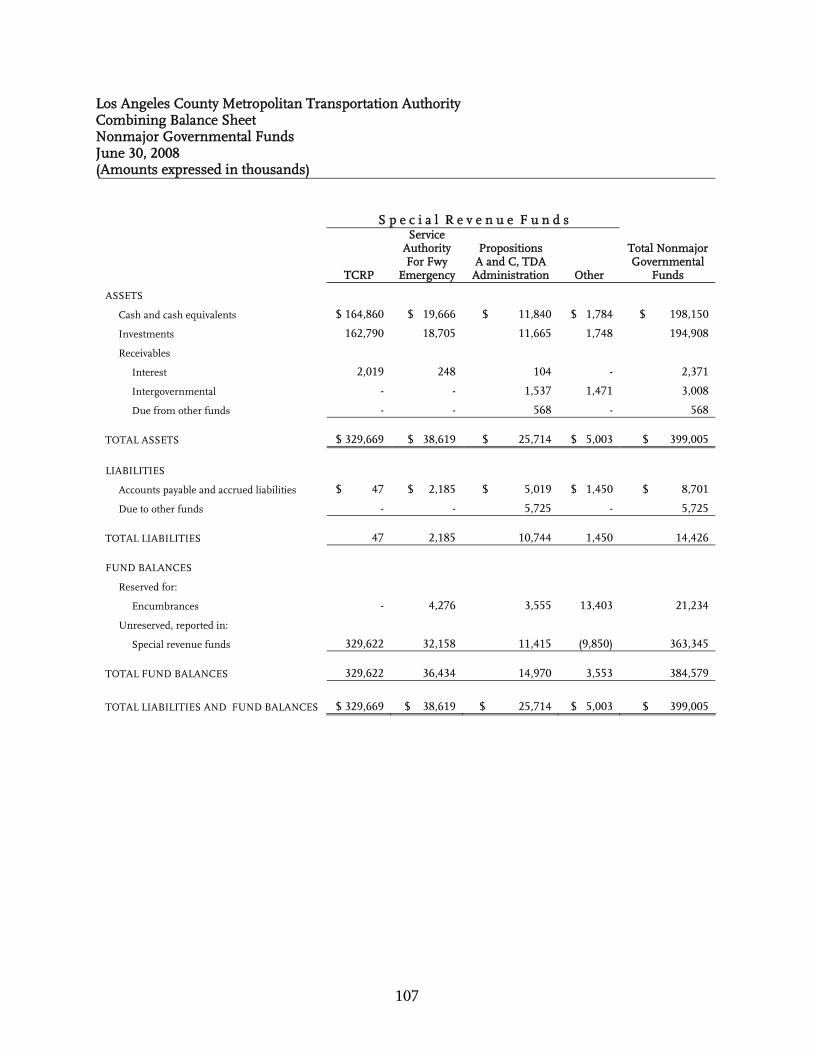
Los Angeles County Metropolitan Transportation Authority Combining Balance Sheet Nonmajor Governmental Funds June 30, 2008 (Amounts expressed in thousands)
107
S p e c i a l R e v e n u e F u n d s
TCRP
Service Authority For Fwy
Emergency
Propositions A and C, TDA
Administration Other
Total Nonmajor Governmental
Funds
ASSETS
Cash and cash equivalents $ 164,860 $ 19,666 $ 11,840 $ 1,784 $ 198,150
Investments 162,790 18,705 11,665 1,748 194,908
Receivables
Interest 2,019 248 104 - 2,371
Intergovernmental - - 1,537 1,471 3,008
Due from other funds - - 568 - 568
TOTAL ASSETS $ 329,669 $ 38,619 $ 25,714 $ 5,003 $ 399,005
LIABILITIES
Accounts payable and accrued liabilities $ 47 $ 2,185 $ 5,019 $ 1,450 $ 8,701
Due to other funds - - 5,725 - 5,725
TOTAL LIABILITIES 47 2,185 10,744 1,450 14,426
FUND BALANCES
Reserved for:
Encumbrances - 4,276 3,555 13,403 21,234
Unreserved, reported in:
Special revenue funds 329,622 32,158 11,415 (9,850) 363,345
TOTAL FUND BALANCES 329,622 36,434 14,970 3,553 384,579
TOTAL LIABILITIES AND FUND BALANCES $ 329,669 $ 38,619 $ 25,714 $ 5,003 $ 399,005
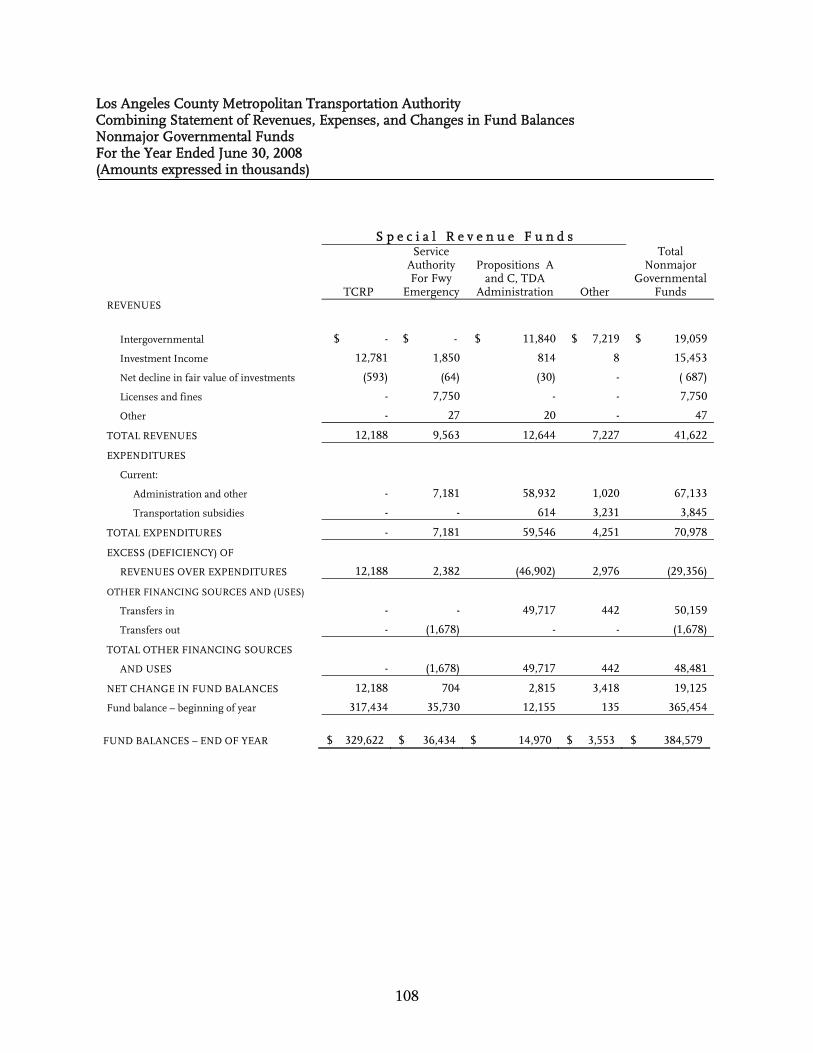
Los Angeles County Metropolitan Transportation Authority Combining Statement of Revenues, Expenses, and Changes in Fund Balances Nonmajor Governmental Funds For the Year Ended June 30, 2008 (Amounts expressed in thousands)
108
S p e c i a l R e v e n u e F u n d s
TCRP
Service Authority For Fwy
Emergency
Propositions A and C, TDA
Administration Other
Total Nonmajor
Governmental Funds
REVENUES
Intergovernmental $ - $ - $ 11,840 $ 7,219 $ 19,059
Investment Income 12,781 1,850 814 8 15,453
Net decline in fair value of investments (593) (64) (30) - ( 687)
Licenses and fines - 7,750 - - 7,750
Other - 27 20 - 47
TOTAL REVENUES 12,188 9,563 12,644 7,227 41,622
EXPENDITURES
Current:
Administration and other - 7,181 58,932 1,020 67,133
Transportation subsidies - - 614 3,231 3,845
TOTAL EXPENDITURES - 7,181 59,546 4,251 70,978
EXCESS (DEFICIENCY) OF
REVENUES OVER EXPENDITURES 12,188 2,382 (46,902) 2,976 (29,356)
OTHER FINANCING SOURCES AND (USES)
Transfers in - - 49,717 442 50,159
Transfers out - (1,678) - - (1,678)
TOTAL OTHER FINANCING SOURCES
AND USES - (1,678) 49,717 442 48,481
NET CHANGE IN FUND BALANCES 12,188 704 2,815 3,418 19,125
Fund balance – beginning of year 317,434 35,730 12,155 135 365,454
FUND BALANCES – END OF YEAR $ 329,622 $ 36,434 $ 14,970 $ 3,553 $ 384,579

Los Angeles County Metropolitan Transportation Authority Schedule of Revenues, Expenditures, and Changes in Fund Balances – Budget and Actual Traffic Congestion Relief Program Fund For the Year Ended June 30, 2008 (Amounts expressed in thousands)
109
Original &
Final Budgeted Amounts
Actual Amounts
Variance with Final
Budget
REVENUES Investment income $ - $ 12,781 $ 12,781 Net decline in fair value of investments - (593) ( 593)
TOTAL REVENUES - 12,188 12,188
EXPENDITURES - - -
TOTAL EXPENDITURES - - -
EXCESS OF REVENUES OVER EXPENDITURES - 12,188 12,188
NET CHANGE IN FUND BALANCES - 12,188 12,188 Fund balances – beginning of year - 317,434 317,434
FUND BALANCES – END OF YEAR $ - $ 329,622 $ 329,622
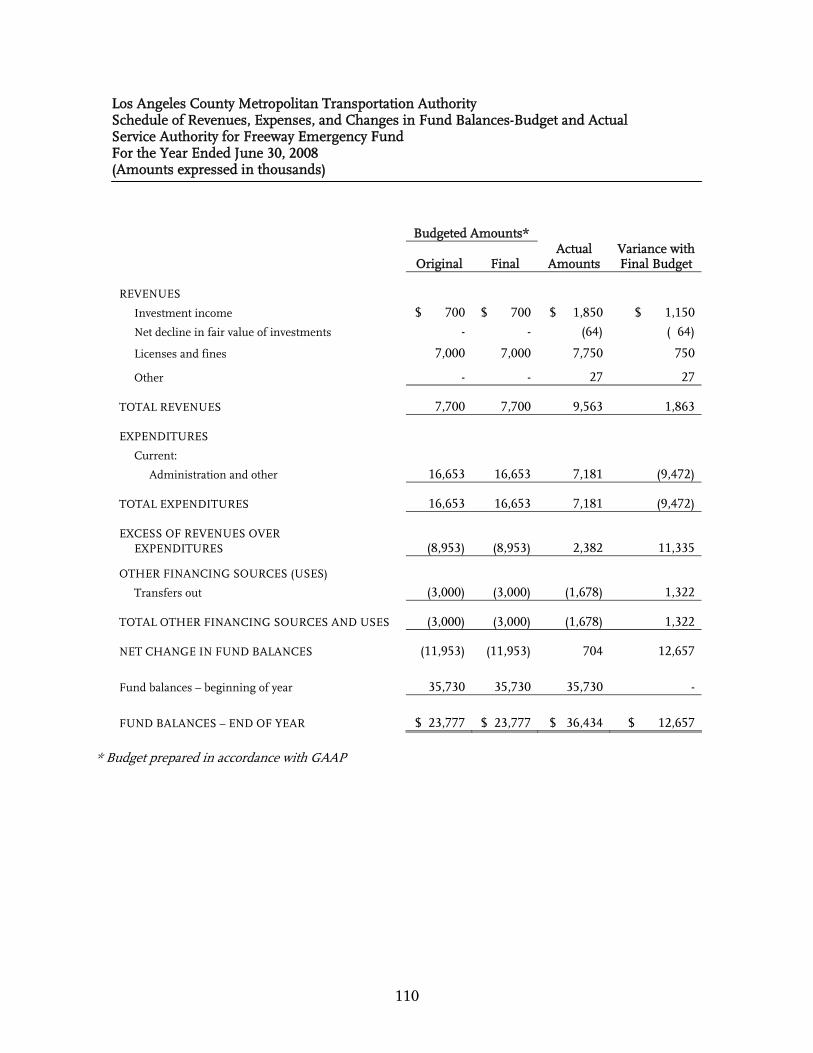
Los Angeles County Metropolitan Transportation Authority Schedule of Revenues, Expenses, and Changes in Fund Balances-Budget and Actual Service Authority for Freeway Emergency Fund For the Year Ended June 30, 2008 (Amounts expressed in thousands)
110
Budgeted Amounts*
Original Final
Actual Amounts
Variance with Final Budget
REVENUES Investment income $ 700 $ 700 $ 1,850 $ 1,150 Net decline in fair value of investments - - (64) ( 64)
Licenses and fines 7,000 7,000 7,750 750
Other - - 27 27
TOTAL REVENUES 7,700 7,700 9,563 1,863
EXPENDITURES Current: Administration and other 16,653 16,653 7,181 (9,472)
TOTAL EXPENDITURES 16,653 16,653 7,181 (9,472)
EXCESS OF REVENUES OVER EXPENDITURES (8,953) (8,953) 2,382 11,335
OTHER FINANCING SOURCES (USES) Transfers out (3,000) (3,000) (1,678) 1,322
TOTAL OTHER FINANCING SOURCES AND USES (3,000) (3,000) (1,678) 1,322
NET CHANGE IN FUND BALANCES (11,953) (11,953) 704 12,657
Fund balances – beginning of year 35,730 35,730 35,730 -
FUND BALANCES – END OF YEAR $ 23,777 $ 23,777 $ 36,434 $ 12,657 * Budget prepared in accordance with GAAP
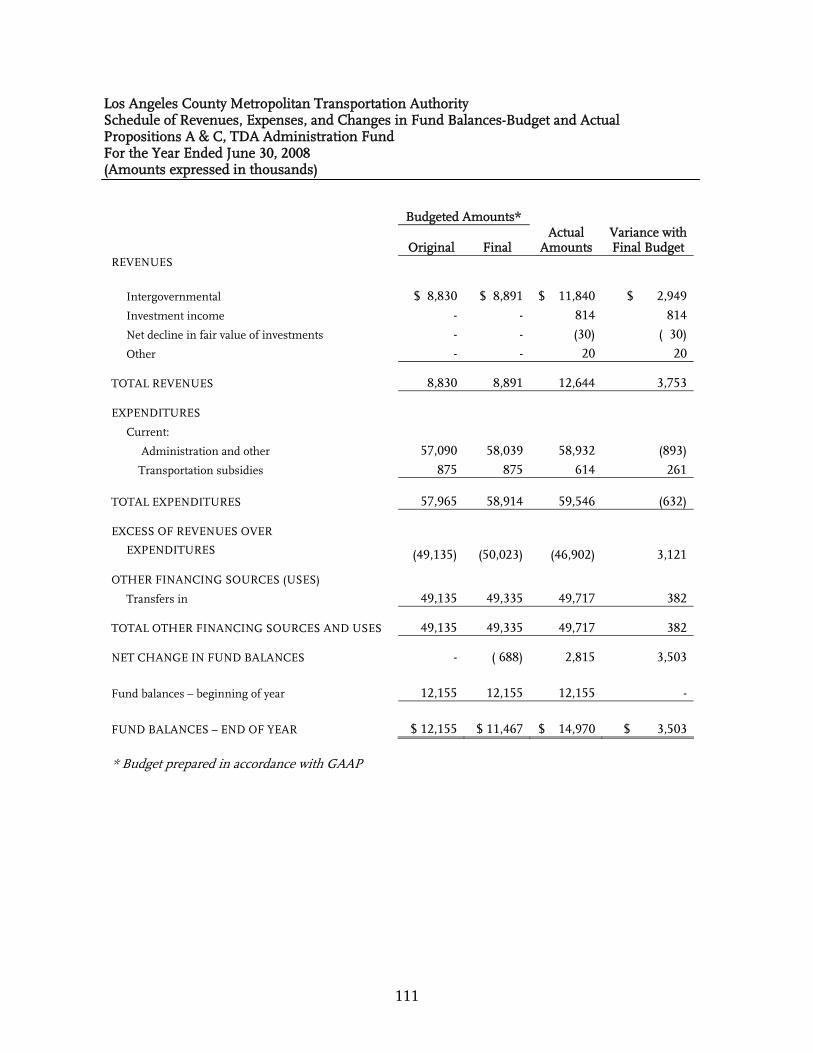
Los Angeles County Metropolitan Transportation Authority Schedule of Revenues, Expenses, and Changes in Fund Balances-Budget and Actual Propositions A & C, TDA Administration Fund For the Year Ended June 30, 2008 (Amounts expressed in thousands)
111
Budgeted Amounts*
Original Final
Actual Amounts
Variance with Final Budget
REVENUES
Intergovernmental $ 8,830 $ 8,891 $ 11,840 $ 2,949 Investment income - - 814 814 Net decline in fair value of investments - - (30) ( 30) Other - - 20 20
TOTAL REVENUES 8,830 8,891 12,644 3,753
EXPENDITURES Current: Administration and other 57,090 58,039 58,932 (893) Transportation subsidies 875 875 614 261
TOTAL EXPENDITURES 57,965 58,914 59,546 (632)
EXCESS OF REVENUES OVER EXPENDITURES (49,135) (50,023) (46,902) 3,121
OTHER FINANCING SOURCES (USES) Transfers in 49,135 49,335 49,717 382
TOTAL OTHER FINANCING SOURCES AND USES 49,135 49,335 49,717 382
NET CHANGE IN FUND BALANCES - ( 688) 2,815 3,503
Fund balances – beginning of year 12,155 12,155 12,155 -
FUND BALANCES – END OF YEAR $ 12,155 $ 11,467 $ 14,970 $ 3,503
* Budget prepared in accordance with GAAP
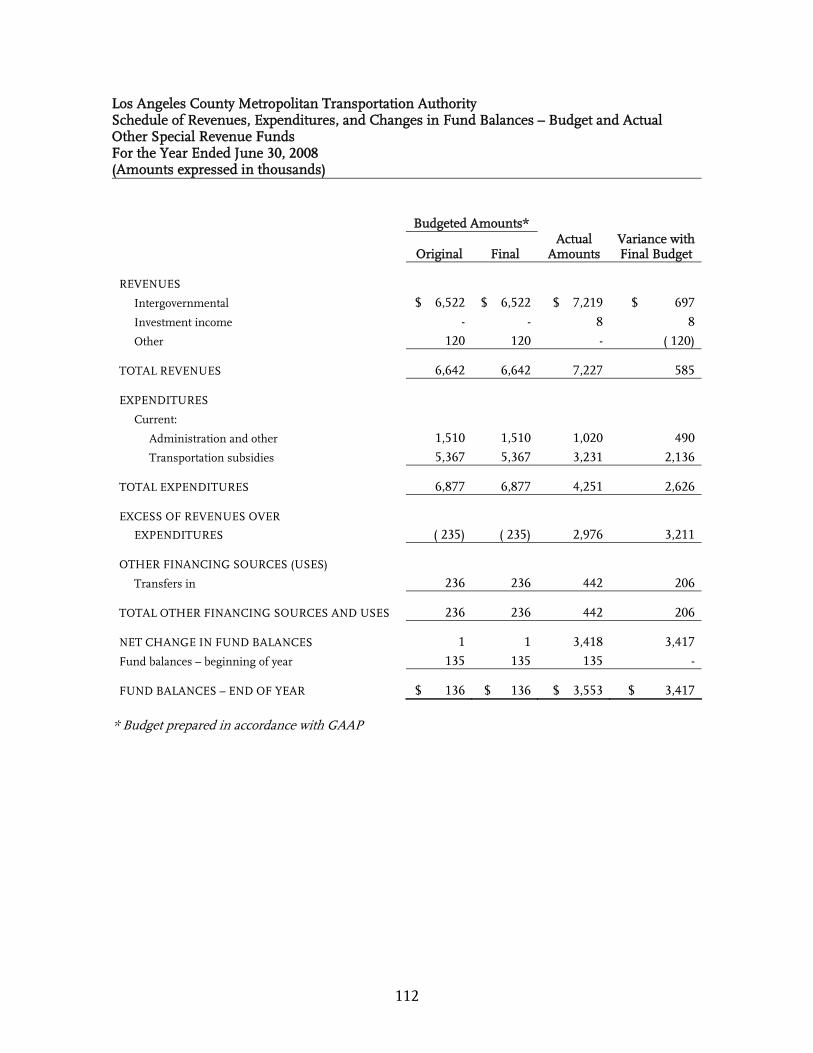
Los Angeles County Metropolitan Transportation Authority Schedule of Revenues, Expenditures, and Changes in Fund Balances – Budget and Actual Other Special Revenue Funds For the Year Ended June 30, 2008 (Amounts expressed in thousands)
112
Budgeted Amounts*
Original Final
Actual Amounts
Variance with Final Budget
REVENUES Intergovernmental $ 6,522 $ 6,522 $ 7,219 $ 697 Investment income - - 8 8 Other 120 120 - ( 120)
TOTAL REVENUES 6,642 6,642 7,227 585
EXPENDITURES Current: Administration and other 1,510 1,510 1,020 490 Transportation subsidies 5,367 5,367 3,231 2,136
TOTAL EXPENDITURES 6,877 6,877 4,251 2,626
EXCESS OF REVENUES OVER EXPENDITURES ( 235) ( 235) 2,976 3,211
OTHER FINANCING SOURCES (USES) Transfers in 236 236 442 206
TOTAL OTHER FINANCING SOURCES AND USES 236 236 442 206
NET CHANGE IN FUND BALANCES 1 1 3,418 3,417 Fund balances – beginning of year 135 135 135 -
FUND BALANCES – END OF YEAR $ 136 $ 136 $ 3,553 $ 3,417 * Budget prepared in accordance with GAAP
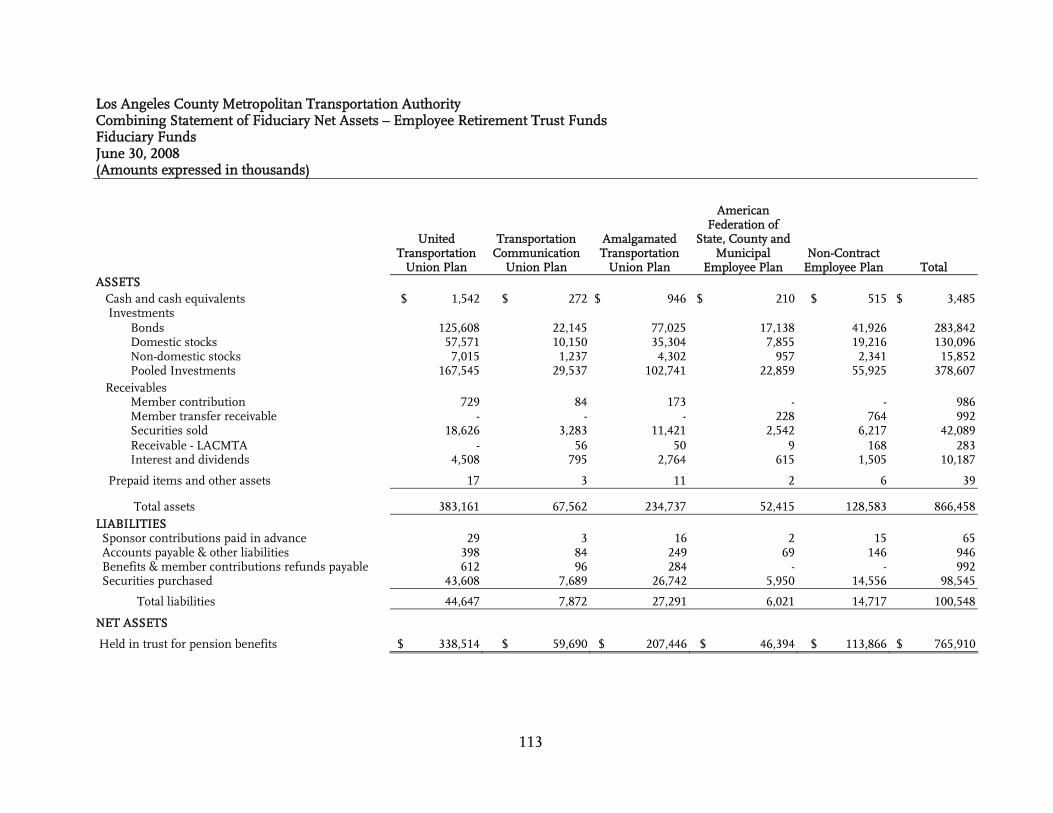
Los Angeles County Metropolitan Transportation Authority Combining Statement of Fiduciary Net Assets – Employee Retirement Trust Funds Fiduciary Funds June 30, 2008 (Amounts expressed in thousands)
113
United Transportation
Union Plan
Transportation Communication
Union Plan
Amalgamated Transportation
Union Plan
American Federation of
State, County and Municipal
Employee Plan Non-Contract
Employee Plan Total ASSETS Cash and cash equivalents $ 1,542 $ 272 $ 946 $ 210 $ 515 $ 3,485 Investments Bonds 125,608 22,145 77,025 17,138 41,926 283,842 Domestic stocks 57,571 10,150 35,304 7,855 19,216 130,096 Non-domestic stocks 7,015 1,237 4,302 957 2,341 15,852 Pooled Investments 167,545 29,537 102,741 22,859 55,925 378,607 Receivables Member contribution 729 84 173 - - 986 Member transfer receivable - - - 228 764 992 Securities sold 18,626 3,283 11,421 2,542 6,217 42,089 Receivable - LACMTA - 56 50 9 168 283 Interest and dividends 4,508 795 2,764 615 1,505 10,187
Prepaid items and other assets 17 3 11 2 6 39
Total assets 383,161 67,562 234,737 52,415 128,583 866,458 LIABILITIES Sponsor contributions paid in advance 29 3 16 2 15 65 Accounts payable & other liabilities 398 84 249 69 146 946 Benefits & member contributions refunds payable 612 96 284 - - 992 Securities purchased 43,608 7,689 26,742 5,950 14,556 98,545
Total liabilities 44,647 7,872 27,291 6,021 14,717 100,548
NET ASSETS
Held in trust for pension benefits $ 338,514 $ 59,690 $ 207,446 $ 46,394 $ 113,866 $ 765,910
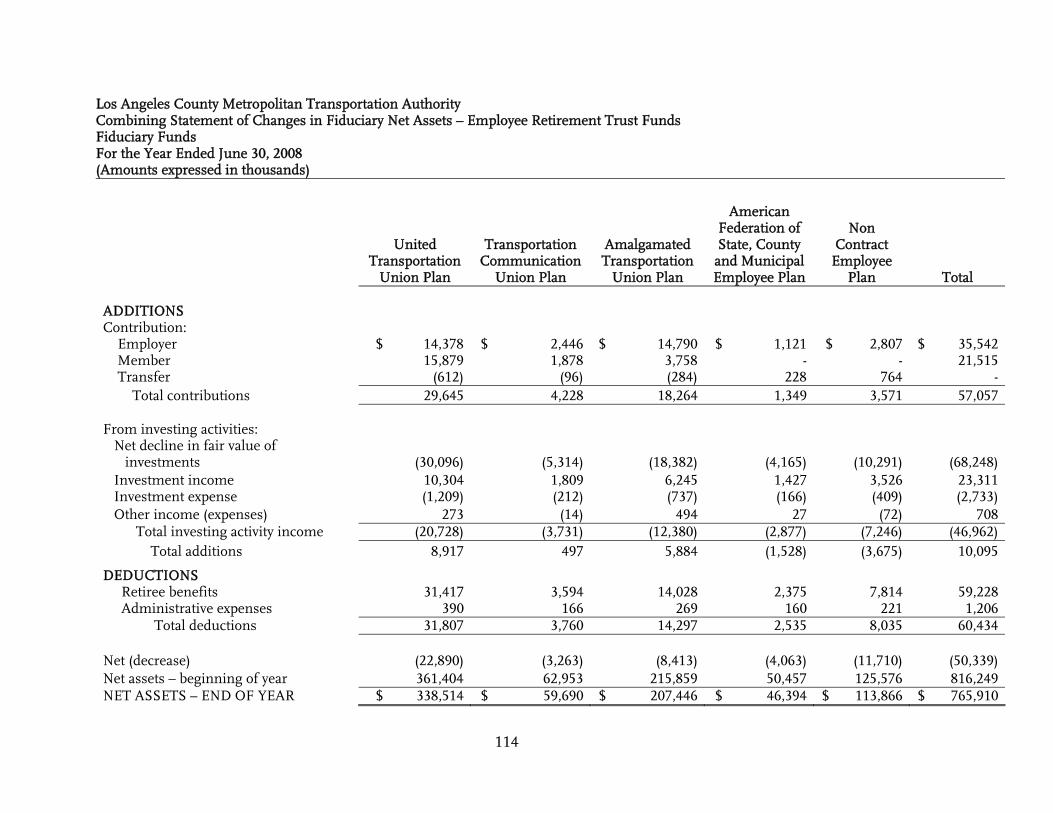
Los Angeles County Metropolitan Transportation Authority Combining Statement of Changes in Fiduciary Net Assets – Employee Retirement Trust Funds Fiduciary Funds For the Year Ended June 30, 2008 (Amounts expressed in thousands)
114
United Transportation
Union Plan
Transportation Communication
Union Plan
Amalgamated Transportation
Union Plan
American Federation of State, County and Municipal Employee Plan
Non Contract
Employee Plan Total
ADDITIONS Contribution: Employer $ 14,378 $ 2,446 $ 14,790 $ 1,121 $ 2,807 $ 35,542 Member 15,879 1,878 3,758 - - 21,515 Transfer (612) (96) (284) 228 764 - Total contributions 29,645 4,228 18,264 1,349 3,571 57,057 From investing activities: Net decline in fair value of investments (30,096) (5,314) (18,382) (4,165) (10,291) (68,248) Investment income 10,304 1,809 6,245 1,427 3,526 23,311 Investment expense (1,209) (212) (737) (166) (409) (2,733) Other income (expenses) 273 (14) 494 27 (72) 708 Total investing activity income (20,728) (3,731) (12,380) (2,877) (7,246) (46,962) Total additions 8,917 497 5,884 (1,528) (3,675) 10,095 DEDUCTIONS Retiree benefits 31,417 3,594 14,028 2,375 7,814 59,228 Administrative expenses 390 166 269 160 221 1,206 Total deductions 31,807 3,760 14,297 2,535 8,035 60,434 Net (decrease) (22,890) (3,263) (8,413) (4,063) (11,710) (50,339) Net assets – beginning of year 361,404 62,953 215,859 50,457 125,576 816,249 NET ASSETS – END OF YEAR $ 338,514 $ 59,690 $ 207,446 $ 46,394 $ 113,866 $ 765,910
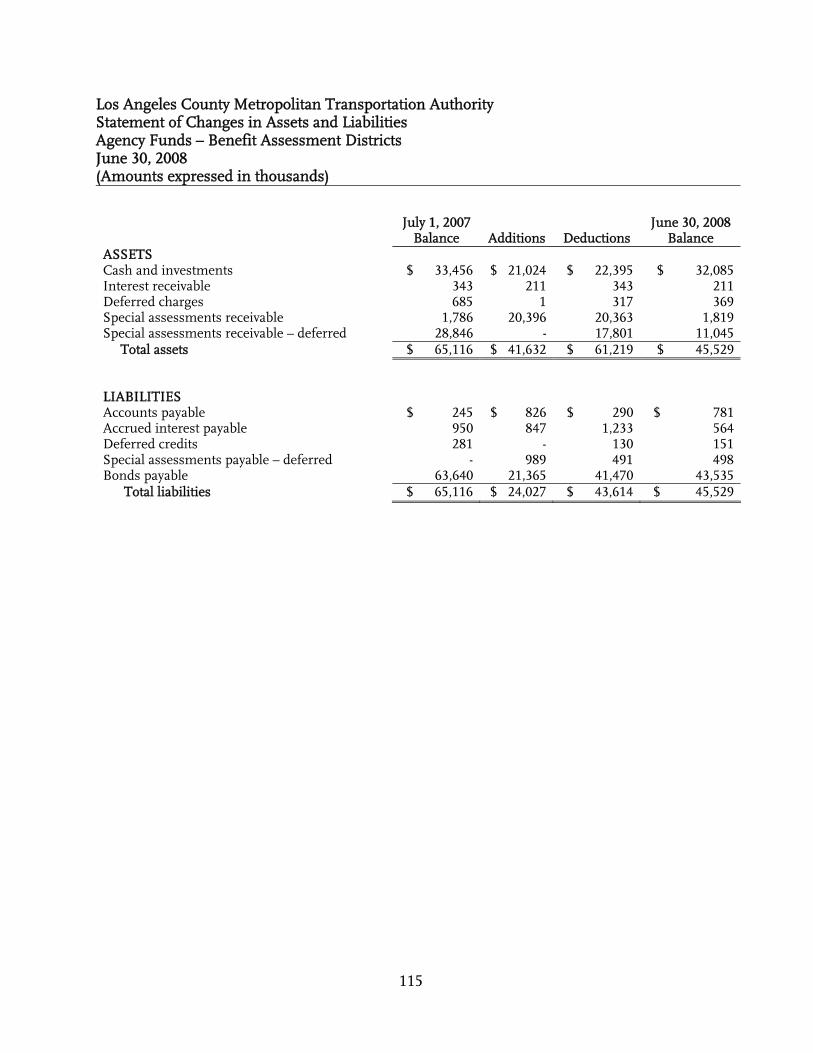
Los Angeles County Metropolitan Transportation Authority Statement of Changes in Assets and Liabilities Agency Funds – Benefit Assessment Districts June 30, 2008 (Amounts expressed in thousands)
115
July 1, 2007 June 30, 2008 Balance Additions Deductions Balance
ASSETS Cash and investments $ 33,456 $ 21,024 $ 22,395 $ 32,085 Interest receivable 343 211 343 211 Deferred charges 685 1 317 369 Special assessments receivable 1,786 20,396 20,363 1,819 Special assessments receivable – deferred 28,846 - 17,801 11,045
$ 65,116 $ 41,632 $ 61,219 $ 45,529
Total assets LIABILITIES Accounts payable $ 245 $ 826 $ 290 $ 781 Accrued interest payable 950 847 1,233 564 Deferred credits 281 - 130 151 Special assessments payable – deferred - 989 491 498 Bonds payable 63,640 21,365 41,470 43,535 Total liabilities $ 65,116 $ 24,027 $ 43,614 $ 45,529

116
THIS PAGE INTENTIONALLY LEFT BLANK
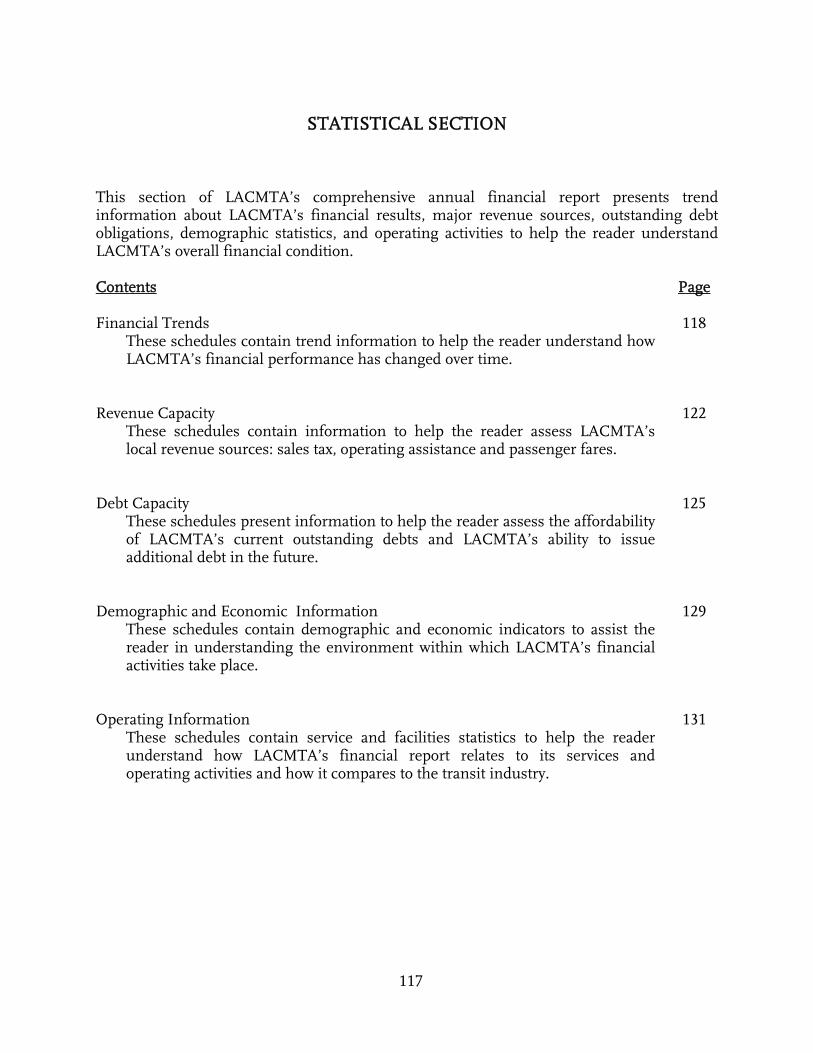
117
STATISTICAL SECTION This section of LACMTA’s comprehensive annual financial report presents trend information about LACMTA’s financial results, major revenue sources, outstanding debt obligations, demographic statistics, and operating activities to help the reader understand LACMTA’s overall financial condition. Contents Page Financial Trends 118
These schedules contain trend information to help the reader understand how LACMTA’s financial performance has changed over time.
Revenue Capacity 122
These schedules contain information to help the reader assess LACMTA’s local revenue sources: sales tax, operating assistance and passenger fares.
Debt Capacity 125
These schedules present information to help the reader assess the affordability of LACMTA’s current outstanding debts and LACMTA’s ability to issue additional debt in the future.
Demographic and Economic Information 129
These schedules contain demographic and economic indicators to assist the reader in understanding the environment within which LACMTA’s financial activities take place.
Operating Information 131
These schedules contain service and facilities statistics to help the reader understand how LACMTA’s financial report relates to its services and operating activities and how it compares to the transit industry.
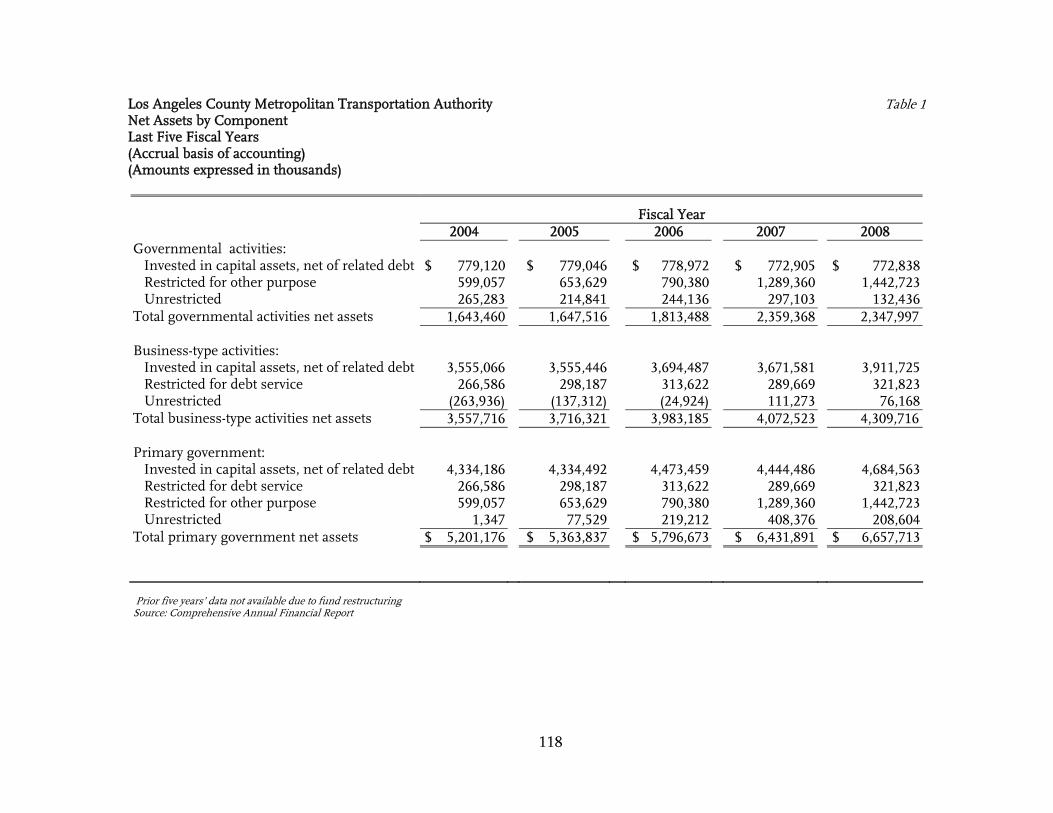
Los Angeles County Metropolitan Transportation Authority Table 1 Net Assets by Component Last Five Fiscal Years (Accrual basis of accounting) (Amounts expressed in thousands)
118
Fiscal Year
2004 2005 2006 2007 2008 Governmental activities: Invested in capital assets, net of related debt $ 779,120 $ 779,046 $ 778,972 $ 772,905 $ 772,838 Restricted for other purpose 599,057 653,629 790,380 1,289,360 1,442,723 Unrestricted 265,283 214,841 244,136 297,103 132,436 Total governmental activities net assets 1,643,460 1,647,516 1,813,488 2,359,368 2,347,997 Business-type activities: Invested in capital assets, net of related debt 3,555,066 3,555,446 3,694,487 3,671,581 3,911,725 Restricted for debt service 266,586 298,187 313,622 289,669 321,823 Unrestricted (263,936) (137,312) (24,924) 111,273 76,168 Total business-type activities net assets 3,557,716 3,716,321 3,983,185 4,072,523 4,309,716 Primary government: Invested in capital assets, net of related debt 4,334,186 4,334,492 4,473,459 4,444,486 4,684,563 Restricted for debt service 266,586 298,187 313,622 289,669 321,823 Restricted for other purpose 599,057 653,629 790,380 1,289,360 1,442,723 Unrestricted 1,347 77,529 219,212 408,376 208,604 Total primary government net assets $ 5,201,176 $ 5,363,837 $ 5,796,673 $ 6,431,891 $ 6,657,713 Prior five years’ data not available due to fund restructuring
Source: Comprehensive Annual Financial Report

Los Angeles County Metropolitan Transportation Authority Table 2 Changes in Net Assets Last Five Fiscal Years (Accrual basis of accounting) (Amounts expressed in thousands)
119
Prior five years’ data not available due to fund restructuring
Source: Comprehensive Annual Financial Report
Fiscal Year Expenses 2004 2005 2006 2007 2008 Governmental activities:
$ 169,882 $ 221,400 $ 202,964 $ 235,476 $ 209,299 271,007 303,969 306,532 320,629 318,492 69,393 60,619 117,483 103,286 316,631 66,913 35,010 11,397 12,440 14,355 49,335 55,471 66,234 49,997 57,711
600 1,540 1,505 1,456 1,408
Transit operators programs Local cities programs Regional multimodal capital programs Paratransit programs Other transportation subsidies Interest General government 95,553 101,610 119,157 132,228 165,783 Total governmental activities expenditures 722,683 779,619 825,272 855,512 1,083,679 Business-type activities:
904,920 987,462 1,053,637 1,136,625 1,183,138 347,629 335,533 345,980 405,731 410,476
Transit operations Depreciation Interest 177,935 148,544 167,852 149,293 153,629 Total business-type activities expenses 1,430,484 1,471,539 1,567,469 1,691,649 1,747,243 Total primary government expenses $ 2,153,167 $ 2,251,158 $ 2,392,741 $ 2,547,161 $ 2,830,922 Program Revenues Governmental activities:
$ 64,132 $ 20,054 $ 30,477 $ 343,003 $ 191,046 Operating grants and contributions Charges for services 10,963 10,945 12,742 13,311 10,915 Total governmental activities program revenues 75,095 30,999 43,219 356,314 201,961 Business-type activities:
233,757 284,682 299,966 313,000 357,857 116,201 217,043 207,683 186,003 198,443
Charges for services Operating grants and contributions Capital grants and contributions 470,393 245,860 467,665 302,613 200,575 Total business-type activities program revenues 820,351 747,585 975,314 801,616 756,875 Total primary government program revenues $ 895,446 $ 778,584 $ 1,018,533 $ 1,157,930 $ 958,836 Net (expense)/revenue: Governmental activities $ (647,588) $ (748,620) $ (782,053) $ (499,198) $ (881,718) Business-type activities (610,133) (723,954) (592,155) (890,033) (990,368) Total primary government net expense $ (1,257,721) $ (1,472,574) $ (1,374,208) $ (1,389,231) $ (1,872,086) General Revenues and Other Changes In Net Assets Governmental activities:
$ 1,478,408 $ 1,587,517 $ 1,738,996 $ 1,908,416 $ 1,801,291 5,352 14,886 32,764 51,186 70,782
19,288 12,847 13,484 29,736 39,273
Sales taxes Investment income Miscellaneous Transfers (885,345) (862,574) (837,219) (944,260) (1,040,999) Total governmental activities 617,703 752,676 948,025 1,045,078 870,347 Business-type activities:
12,495 15,525 17,418 29,282 15,586 209 4,460 4,382 5,829 5,237
Investment income Miscellaneous Transfers 885,345 862,574 837,219 944,260 1,040,999 Total business-type activities 898,049 882,559 859,019 979,371 1,061,822 Total primary government $ 1,515,752 $ 1,635,235 $ 1,807,044 $ 2,024,449 $ 1,932,169 Change in Net Assets
$ (29,885) $ 4,056 $ 165,972 $ 545,880 $ (11,371) 287,916 158,605 266,864 89,338 71,454
Governmental activities Business-type activities Total primary government $ 258,031 $ 162,661 $ 432,836 $ 635,218 $ 60,083
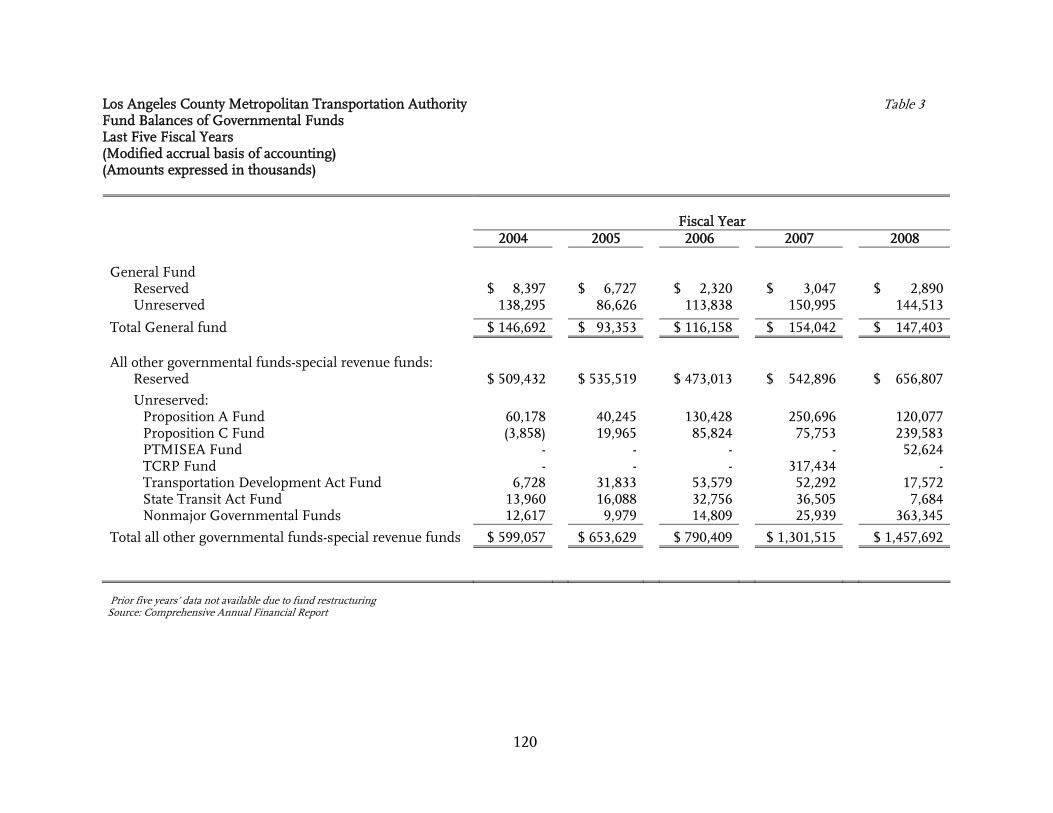
Los Angeles County Metropolitan Transportation Authority Table 3 Fund Balances of Governmental Funds Last Five Fiscal Years (Modified accrual basis of accounting) (Amounts expressed in thousands)
120
Fiscal Year
2004 2005 2006 2007 2008 General Fund Reserved $ 8,397 $ 6,727 $ 2,320 $ 3,047 $ 2,890 Unreserved 138,295 86,626 113,838 150,995 144,513 Total General fund $ 146,692 $ 93,353 $ 116,158 $ 154,042 $ 147,403 All other governmental funds-special revenue funds: Reserved $ 509,432 $ 535,519 $ 473,013 $ 542,896 $ 656,807 Unreserved: Proposition A Fund 60,178 40,245 130,428 250,696 120,077 Proposition C Fund (3,858) 19,965 85,824 75,753 239,583 PTMISEA Fund - - - - 52,624 TCRP Fund - - - 317,434 - Transportation Development Act Fund 6,728 31,833 53,579 52,292 17,572 State Transit Act Fund 13,960 16,088 32,756 36,505 7,684 Nonmajor Governmental Funds 12,617 9,979 14,809 25,939 363,345 Total all other governmental funds-special revenue funds $ 599,057 $ 653,629 $ 790,409 $ 1,301,515 $ 1,457,692
Prior five years’ data not available due to fund restructuring
Source: Comprehensive Annual Financial Report
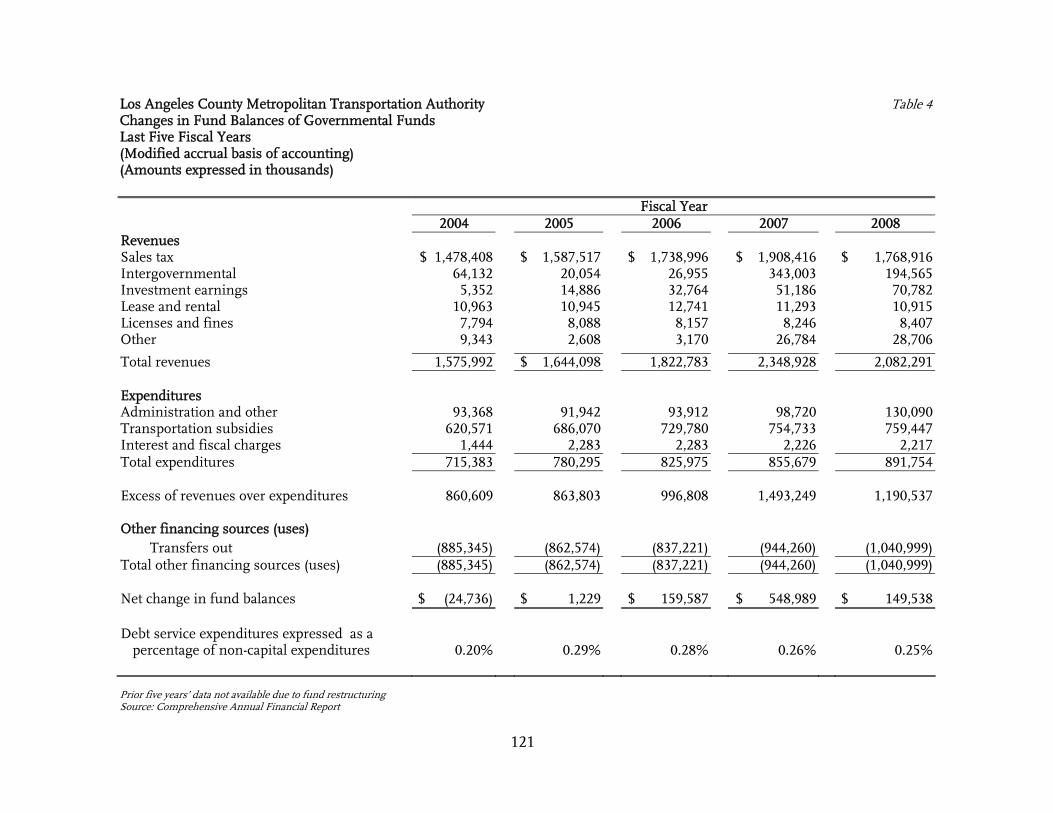
Los Angeles County Metropolitan Transportation Authority Table 4 Changes in Fund Balances of Governmental Funds Last Five Fiscal Years (Modified accrual basis of accounting) (Amounts expressed in thousands)
121
Fiscal Year 2004 2005 2006 2007 2008 Revenues Sales tax $ 1,478,408 $ 1,587,517 $ 1,738,996 $ 1,908,416 $ 1,768,916 Intergovernmental 64,132 20,054 26,955 343,003 194,565 Investment earnings 5,352 14,886 32,764 51,186 70,782 Lease and rental 10,963 10,945 12,741 11,293 10,915 Licenses and fines 7,794 8,088 8,157 8,246 8,407 Other 9,343 2,608 3,170 26,784 28,706 Total revenues 1,575,992 $ 1,644,098 1,822,783 2,348,928 2,082,291 Expenditures Administration and other 93,368 91,942 93,912 98,720 130,090 Transportation subsidies 620,571 686,070 729,780 754,733 759,447 Interest and fiscal charges 1,444 2,283 2,283 2,226 2,217 Total expenditures 715,383 780,295 825,975 855,679 891,754 Excess of revenues over expenditures 860,609 863,803 996,808 1,493,249 1,190,537 Other financing sources (uses)
Transfers out (885,345) (862,574) (837,221) (944,260) (1,040,999) Total other financing sources (uses) (885,345) (862,574) (837,221) (944,260) (1,040,999) Net change in fund balances $ (24,736) $ 1,229 $ 159,587 $ 548,989 $ 149,538 Debt service expenditures expressed as a
percentage of non-capital expenditures 0.20% 0.29% 0.28% 0.26% 0.25% Prior five years’ data not available due to fund restructuring Source: Comprehensive Annual Financial Report
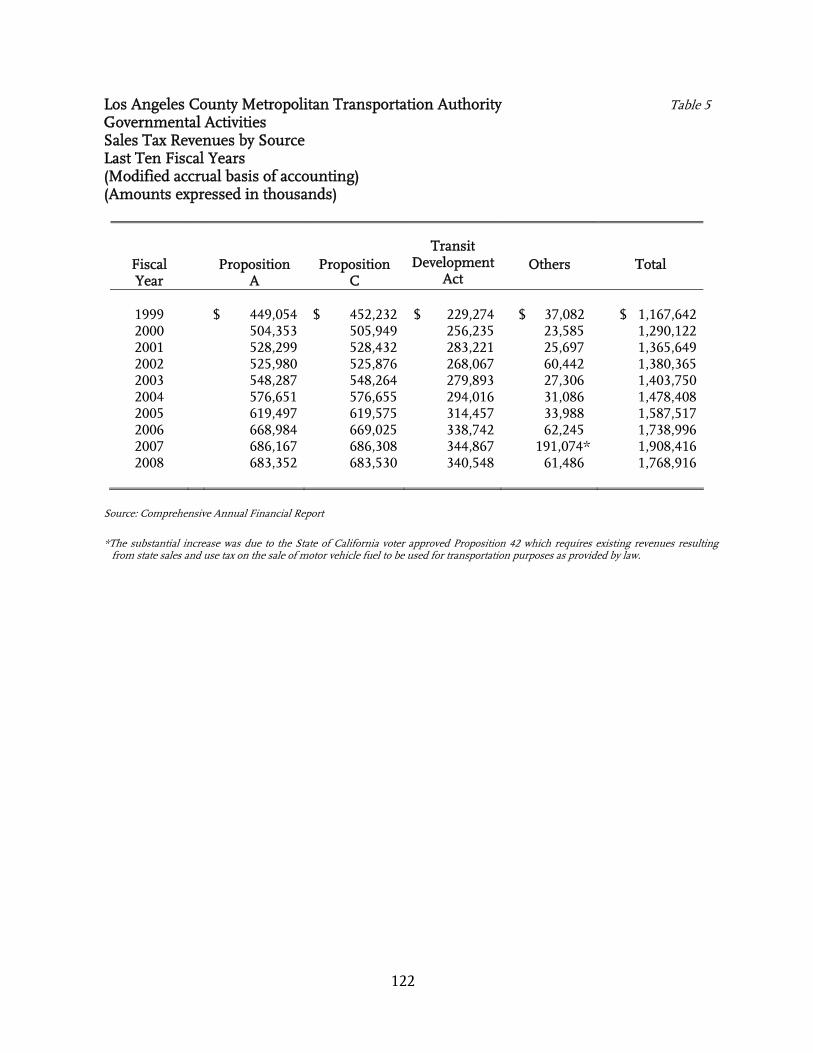
Los Angeles County Metropolitan Transportation Authority Table 5 Governmental Activities Sales Tax Revenues by Source Last Ten Fiscal Years (Modified accrual basis of accounting) (Amounts expressed in thousands)
122
Fiscal Year
Proposition A
Proposition C
Transit Development
Act Others Total
1999 $ 449,054 $ 452,232 $ 229,274 $ 37,082 $ 1,167,642 2000 504,353 505,949 256,235 23,585 1,290,122 2001 528,299 528,432 283,221 25,697 1,365,649 2002 525,980 525,876 268,067 60,442 1,380,365 2003 548,287 548,264 279,893 27,306 1,403,750 2004 576,651 576,655 294,016 31,086 1,478,408 2005 619,497 619,575 314,457 33,988 1,587,517 2006 668,984 669,025 338,742 62,245 1,738,996 2007 686,167 686,308 344,867 191,074* 1,908,416 2008 683,352 683,530 340,548 61,486 1,768,916
Source: Comprehensive Annual Financial Report
*The substantial increase was due to the State of California voter approved Proposition 42 which requires existing revenues resulting
from state sales and use tax on the sale of motor vehicle fuel to be used for transportation purposes as provided by law.
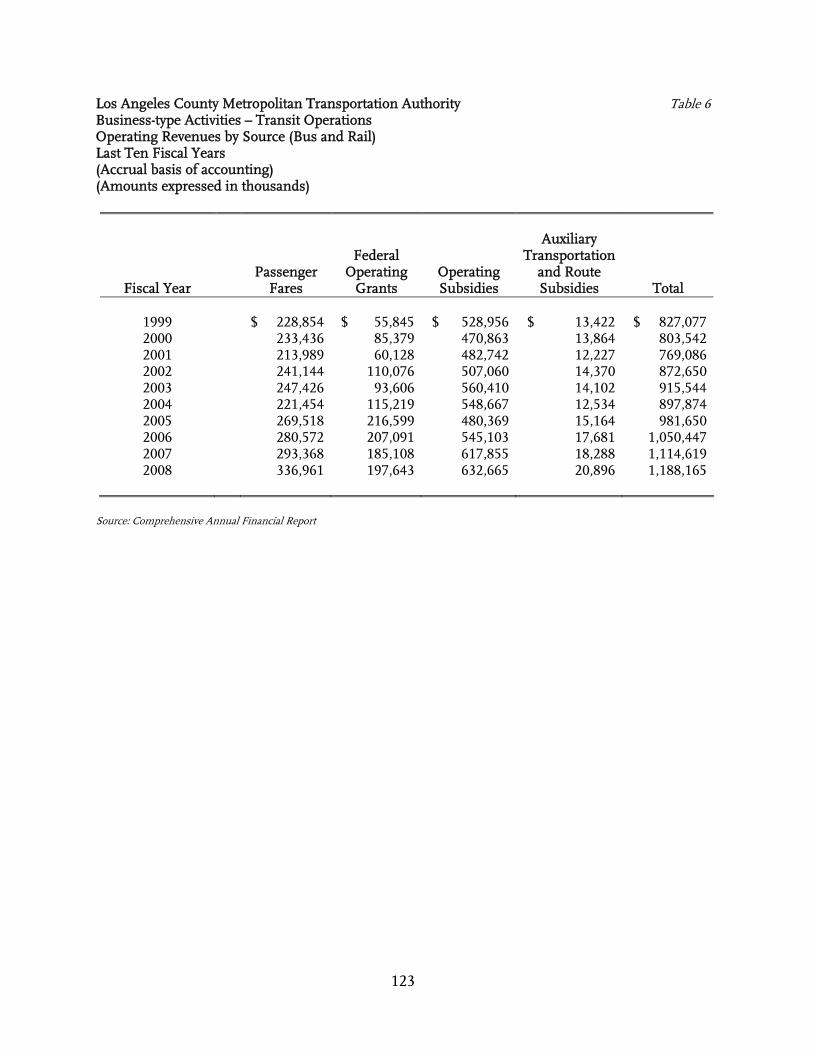
Los Angeles County Metropolitan Transportation Authority Table 6 Business-type Activities – Transit Operations Operating Revenues by Source (Bus and Rail) Last Ten Fiscal Years (Accrual basis of accounting) (Amounts expressed in thousands)
123
Auxiliary
Federal Transportation Passenger Operating Operating and Route
Fiscal Year Fares Grants Subsidies Subsidies Total
1999 $ 228,854 $ 55,845 $ 528,956 $ 13,422 $ 827,077 2000 233,436 85,379 470,863 13,864 803,542 2001 213,989 60,128 482,742 12,227 769,086 2002 241,144 110,076 507,060 14,370 872,650 2003 247,426 93,606 560,410 14,102 915,544 2004 221,454 115,219 548,667 12,534 897,874 2005 269,518 216,599 480,369 15,164 981,650 2006 280,572 207,091 545,103 17,681 1,050,447 2007 293,368 185,108 617,855 18,288 1,114,619 2008 336,961 197,643 632,665 20,896 1,188,165
Source: Comprehensive Annual Financial Report
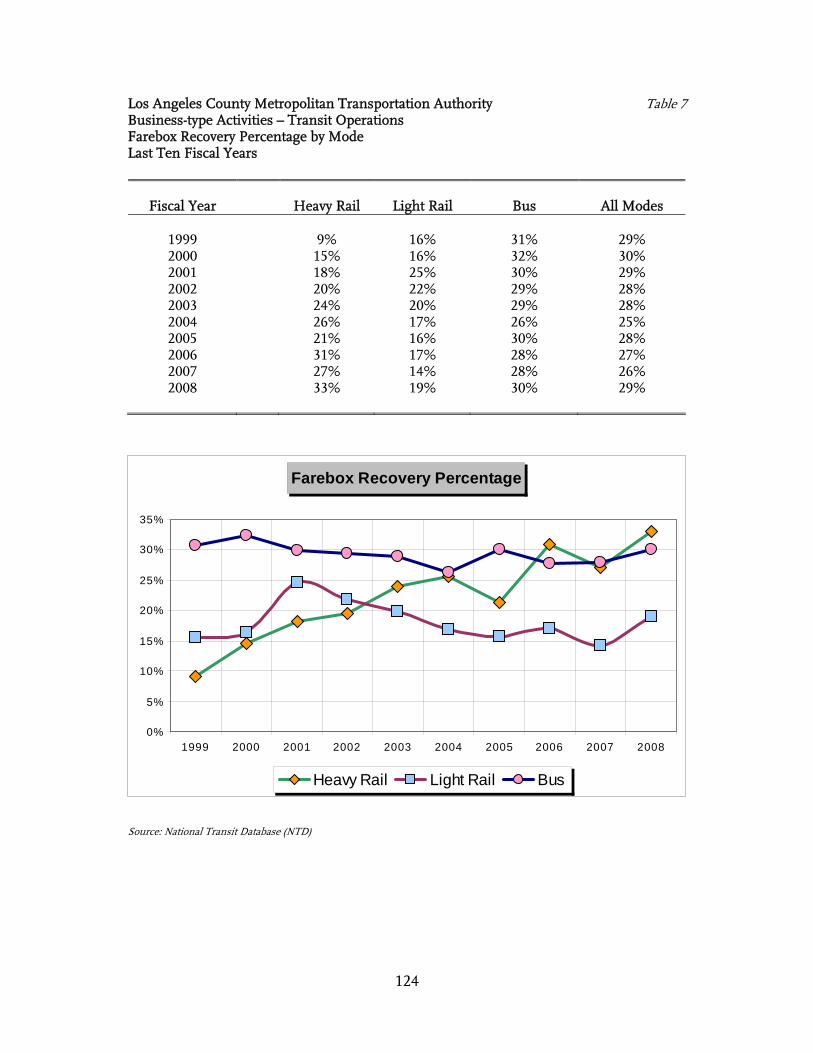
Los Angeles County Metropolitan Transportation Authority Table 7 Business-type Activities – Transit Operations Farebox Recovery Percentage by Mode Last Ten Fiscal Years
124
Fiscal Year Heavy Rail Light Rail Bus All Modes
1999 9% 16% 31% 29% 2000 15% 16% 32% 30% 2001 18% 25% 30% 29% 2002 20% 22% 29% 28% 2003 24% 20% 29% 28% 2004 26% 17% 26% 25% 2005 21% 16% 30% 28% 2006 31% 17% 28% 27% 2007 27% 14% 28% 26% 2008 33% 19% 30% 29%
Farebox Recovery Percentage
0%
5%
10%
15%
20%
25%
30%
35%
1999 2000 2001 2002 2003 2004 2005 2006 2007 2008
Heavy Rail Light Rail Bus
Source: National Transit Database (NTD)
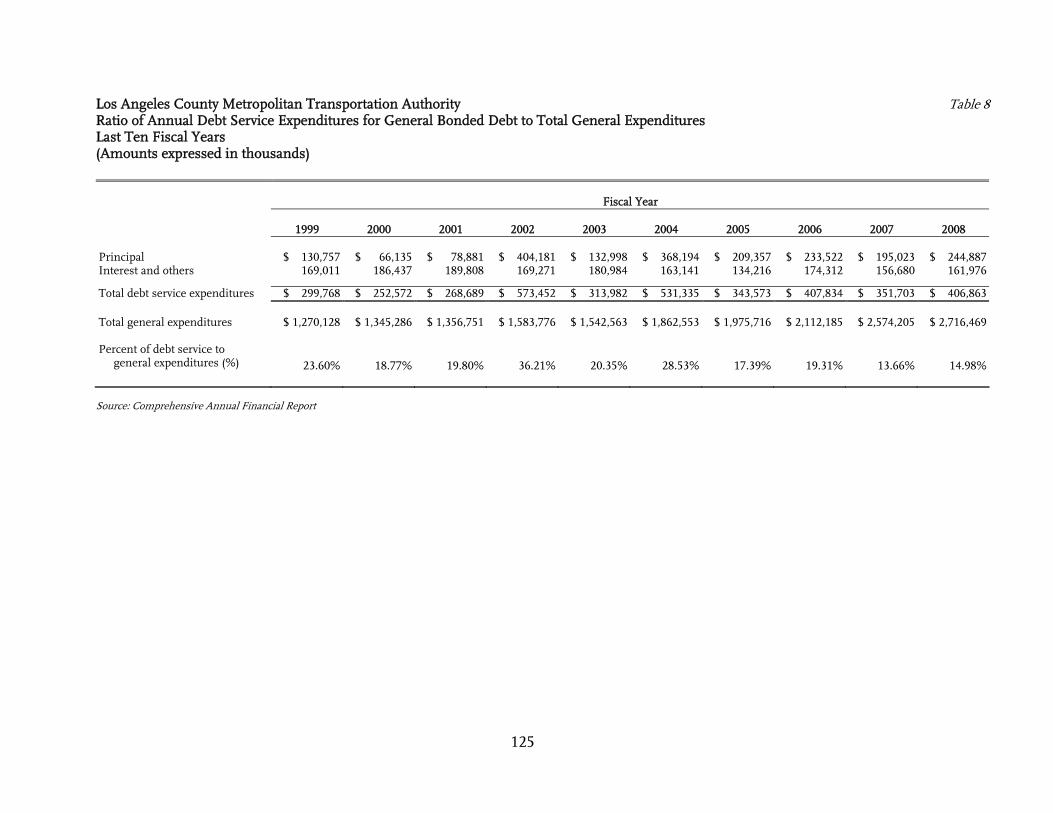
Los Angeles County Metropolitan Transportation Authority Table 8 Ratio of Annual Debt Service Expenditures for General Bonded Debt to Total General Expenditures Last Ten Fiscal Years (Amounts expressed in thousands)
125
Fiscal Year
1999 2000 2001 2002 2003 2004 2005 2006 2007 2008
Principal $ 130,757 $ 66,135 $ 78,881 $ 404,181 $ 132,998 $ 368,194 $ 209,357 $ 233,522 $ 195,023 $ 244,887 Interest and others 169,011 186,437 189,808 169,271 180,984 163,141 134,216 174,312 156,680 161,976 Total debt service expenditures $ 299,768 $ 252,572 $ 268,689 $ 573,452 $ 313,982 $ 531,335 $ 343,573 $ 407,834 $ 351,703 $ 406,863 Total general expenditures $ 1,270,128 $ 1,345,286 $ 1,356,751 $ 1,583,776 $ 1,542,563 $ 1,862,553 $ 1,975,716 $ 2,112,185 $ 2,574,205 $ 2,716,469 Percent of debt service to general expenditures (%) 23.60% 18.77% 19.80% 36.21% 20.35% 28.53% 17.39% 19.31% 13.66% 14.98%
Source: Comprehensive Annual Financial Report
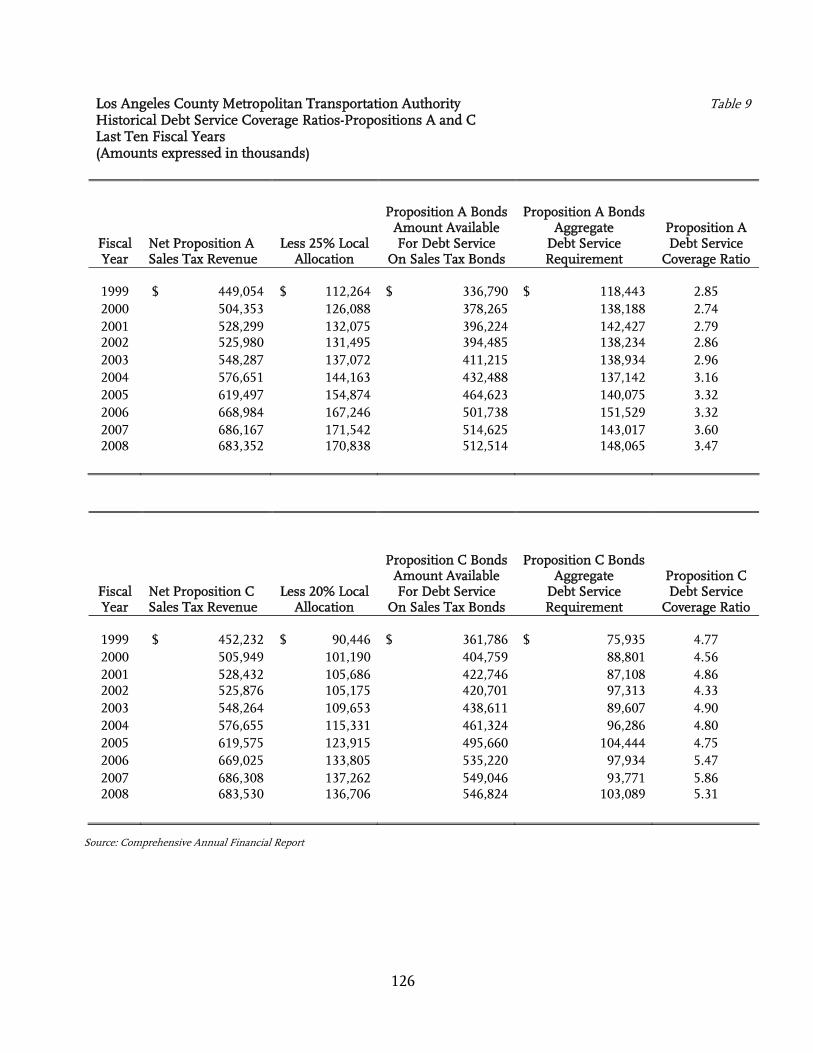
Los Angeles County Metropolitan Transportation Authority Table 9 Historical Debt Service Coverage Ratios-Propositions A and C Last Ten Fiscal Years (Amounts expressed in thousands)
126
Fiscal Year
Net Proposition A Sales Tax Revenue
Less 25% Local Allocation
Proposition A Bonds Amount Available For Debt Service
On Sales Tax Bonds
Proposition A Bonds Aggregate
Debt Service Requirement
Proposition A Debt Service
Coverage Ratio 1999 $ 449,054 $ 112,264 $ 336,790 $ 118,443 2.85 2000 504,353 126,088 378,265 138,188 2.74 2001 528,299 132,075 396,224 142,427 2.79 2002 525,980 131,495 394,485 138,234 2.86 2003 548,287 137,072 411,215 138,934 2.96 2004 576,651 144,163 432,488 137,142 3.16 2005 619,497 154,874 464,623 140,075 3.32 2006 668,984 167,246 501,738 151,529 3.32 2007 686,167 171,542 514,625 143,017 3.60 2008 683,352 170,838 512,514 148,065 3.47
Fiscal Year
Net Proposition C Sales Tax Revenue
Less 20% Local Allocation
Proposition C Bonds Amount Available For Debt Service
On Sales Tax Bonds
Proposition C Bonds Aggregate
Debt Service Requirement
Proposition C Debt Service
Coverage Ratio 1999 $ 452,232 $ 90,446 $ 361,786 $ 75,935 4.77 2000 505,949 101,190 404,759 88,801 4.56 2001 528,432 105,686 422,746 87,108 4.86 2002 525,876 105,175 420,701 97,313 4.33 2003 548,264 109,653 438,611 89,607 4.90 2004 576,655 115,331 461,324 96,286 4.80 2005 619,575 123,915 495,660 104,444 4.75 2006 669,025 133,805 535,220 97,934 5.47 2007 686,308 137,262 549,046 93,771 5.86 2008 683,530 136,706 546,824 103,089 5.31
Source: Comprehensive Annual Financial Report
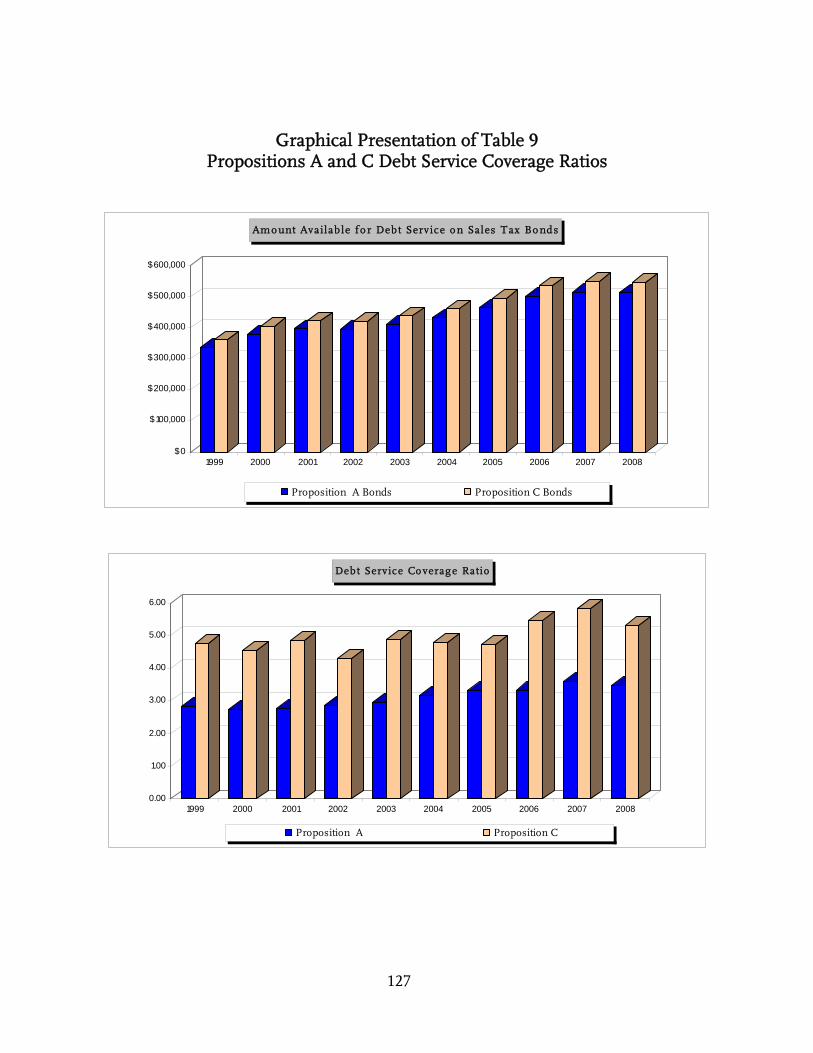
127
Graphical Presentation of Table 9 Propositions A and C Debt Service Coverage Ratios
$0
$100,000
$200,000
$300,000
$400,000
$500,000
$600,000
1999 2000 2001 2002 2003 2004 2005 2006 2007 2008
Amo unt Availab le f o r Debt Service o n Sales T ax Bo nds
Proposition A Bonds Proposition C Bonds
0.00
1.00
2.00
3.00
4.00
5.00
6.00
1999 2000 2001 2002 2003 2004 2005 2006 2007 2008
Debt Service Co verag e Ratio
Proposition A Proposition C
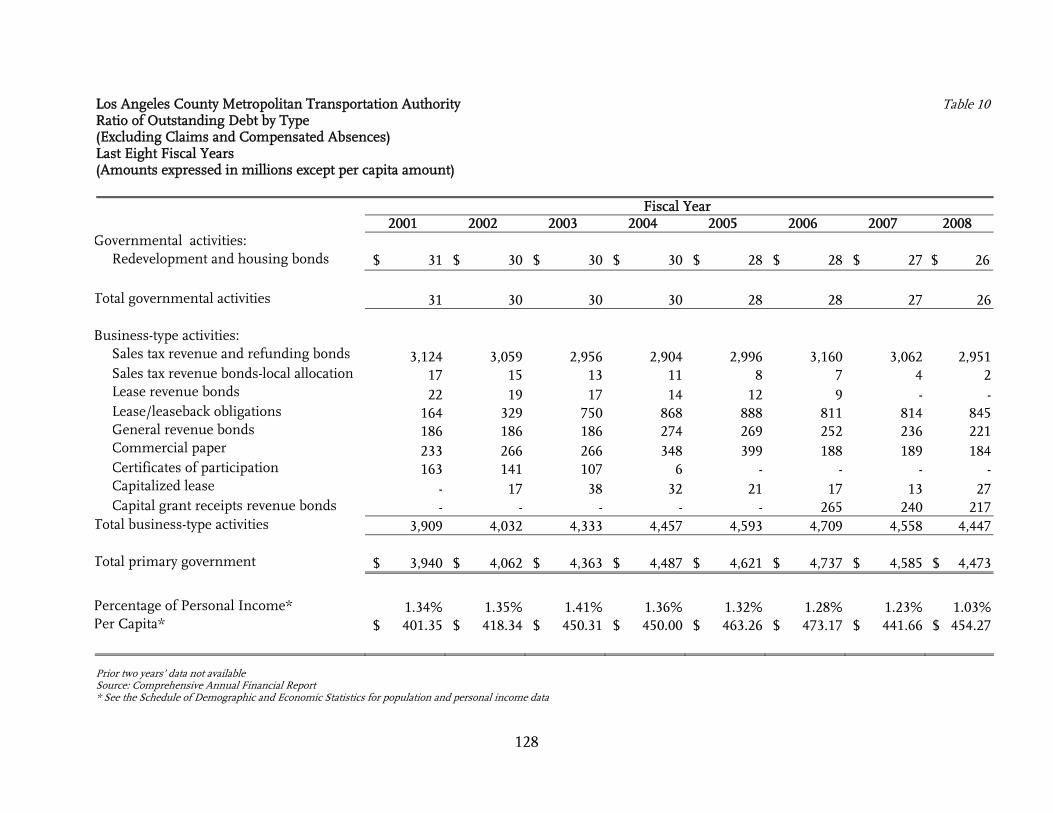
Los Angeles County Metropolitan Transportation Authority Table 10 Ratio of Outstanding Debt by Type (Excluding Claims and Compensated Absences) Last Eight Fiscal Years (Amounts expressed in millions except per capita amount)
128
Fiscal Year 2001 2002 2003 2004 2005 2006 2007 2008
Governmental activities: Redevelopment and housing bonds $ 31 $ 30 $ 30 $ 30 $ 28 $ 28 $ 27 $ 26 Total governmental activities 31 30 30 30 28 28 27 26 Business-type activities: Sales tax revenue and refunding bonds 3,124 3,059 2,956 2,904 2,996 3,160 3,062 2,951 Sales tax revenue bonds-local allocation 17 15 13 11 8 7 4 2 Lease revenue bonds 22 19 17 14 12 9 - - Lease/leaseback obligations 164 329 750 868 888 811 814 845 General revenue bonds 186 186 186 274 269 252 236 221 Commercial paper 233 266 266 348 399 188 189 184 Certificates of participation 163 141 107 6 - - - - Capitalized lease - 17 38 32 21 17 13 27 Capital grant receipts revenue bonds - - - - - 265 240 217 Total business-type activities 3,909 4,032 4,333 4,457 4,593 4,709 4,558 4,447 Total primary government $ 3,940 $ 4,062 $ 4,363 $ 4,487 $ 4,621 $ 4,737 $ 4,585 $ 4,473 Percentage of Personal Income* 1.34% 1.35% 1.41% 1.36% 1.32% 1.28% 1.23% 1.03% Per Capita* $ 401.35 $ 418.34 $ 450.31 $ 450.00 $ 463.26 $ 473.17 $ 441.66 $ 454.27 Prior two years’ data not available Source: Comprehensive Annual Financial Report * See the Schedule of Demographic and Economic Statistics for population and personal income data
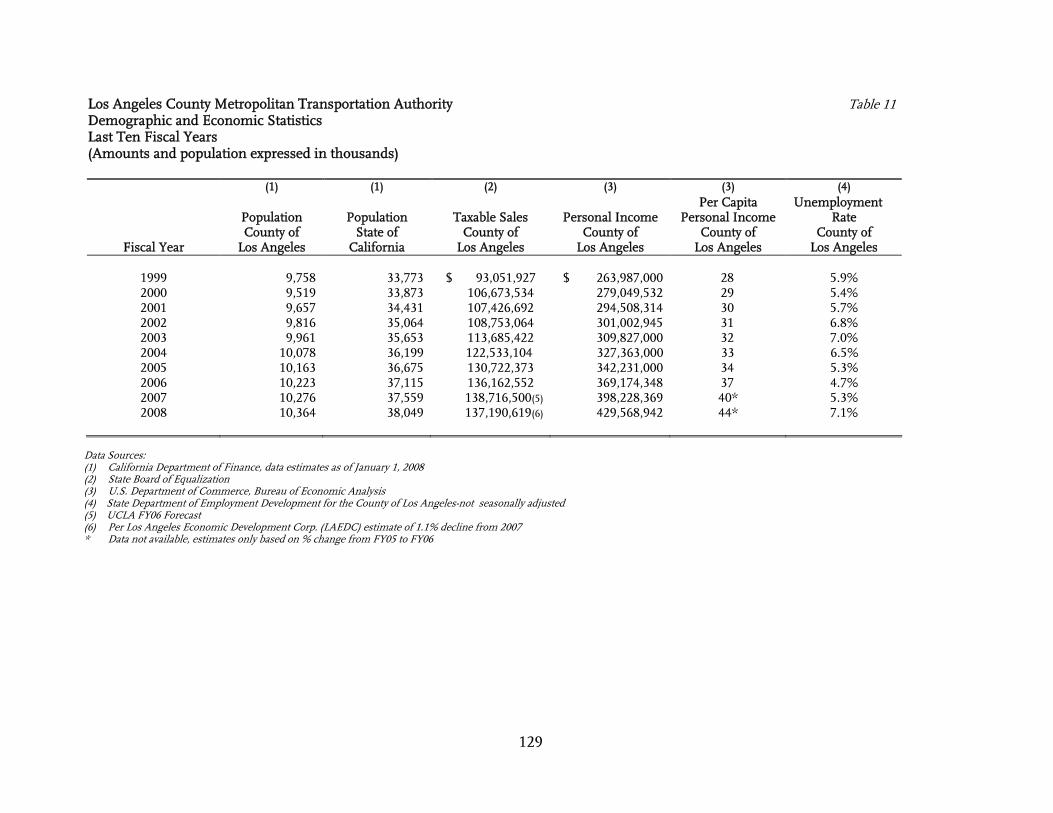
Los Angeles County Metropolitan Transportation Authority Table 11 Demographic and Economic Statistics Last Ten Fiscal Years (Amounts and population expressed in thousands)
129
Data Sources: (1) California Department of Finance, data estimates as of January 1, 2008 (2) State Board of Equalization (3) U.S. Department of Commerce, Bureau of Economic Analysis (4) State Department of Employment Development for the County of Los Angeles-not seasonally adjusted (5) UCLA FY06 Forecast (6) Per Los Angeles Economic Development Corp. (LAEDC) estimate of 1.1% decline from 2007 * Data not available, estimates only based on % change from FY05 to FY06
(1) (1) (2) (3) (3) (4) Per Capita Unemployment
Population Population Taxable Sales Personal Income Personal Income Rate County of State of County of County of County of County of
Fiscal Year Los Angeles California Los Angeles Los Angeles Los Angeles Los Angeles
1999 9,758 33,773 $ 93,051,927 $ 263,987,000 28 5.9% 2000 9,519 33,873 106,673,534 279,049,532 29 5.4% 2001 9,657 34,431 107,426,692 294,508,314 30 5.7% 2002 9,816 35,064 108,753,064 301,002,945 31 6.8% 2003 9,961 35,653 113,685,422 309,827,000 32 7.0% 2004 10,078 36,199 122,533,104 327,363,000 33 6.5% 2005 10,163 36,675 130,722,373 342,231,000 34 5.3% 2006 10,223 37,115 136,162,552 369,174,348 37 4.7% 2007 10,276 37,559 138,716,500(5) 398,228,369 40* 5.3% 2008 10,364 38,049 137,190,619(6) 429,568,942 44* 7.1%
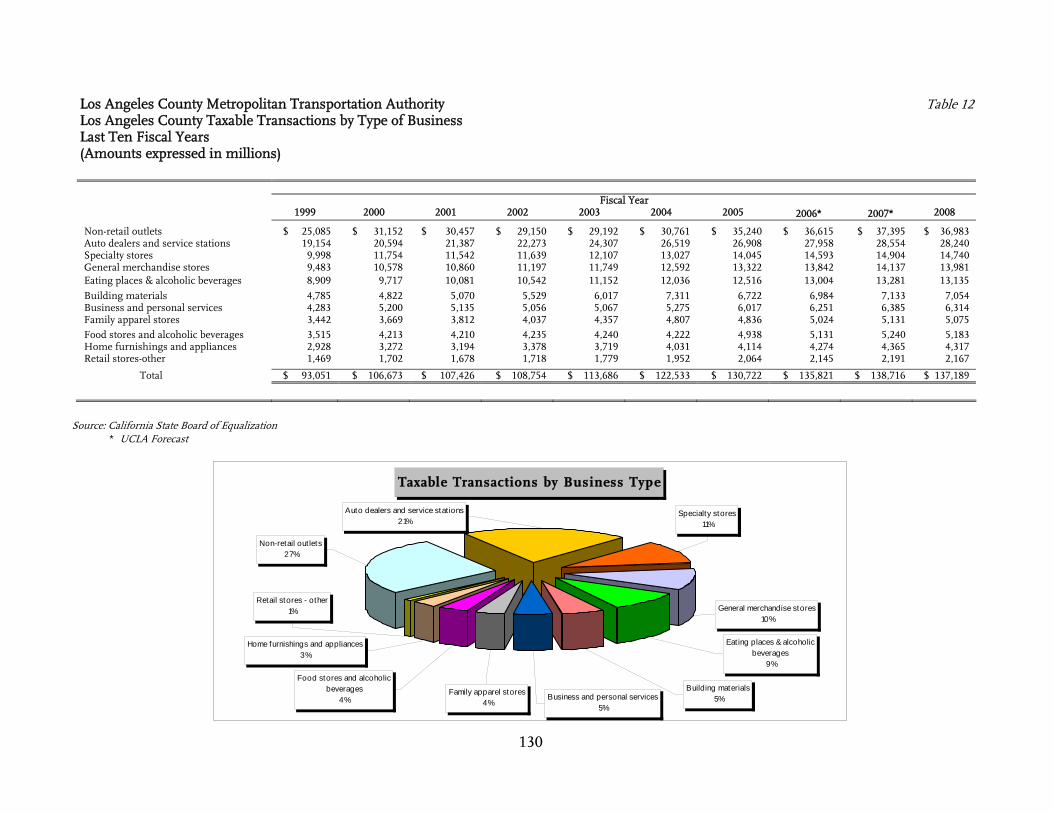
Los Angeles County Metropolitan Transportation Authority Table 12 Los Angeles County Taxable Transactions by Type of Business Last Ten Fiscal Years (Amounts expressed in millions)
130
Fiscal Year
1999 2000 2001 2002 2003 2004 2005 2006* 2007* 2008 Non-retail outlets $ 25,085 $ 31,152 $ 30,457 $ 29,150 $ 29,192 $ 30,761 $ 35,240 $ 36,615 $ 37,395 $ 36,983 Auto dealers and service stations 19,154 20,594 21,387 22,273 24,307 26,519 26,908 27,958 28,554 28,240 Specialty stores 9,998 11,754 11,542 11,639 12,107 13,027 14,045 14,593 14,904 14,740 General merchandise stores 9,483 10,578 10,860 11,197 11,749 12,592 13,322 13,842 14,137 13,981 Eating places & alcoholic beverages 8,909 9,717 10,081 10,542 11,152 12,036 12,516 13,004 13,281 13,135 Building materials 4,785 4,822 5,070 5,529 6,017 7,311 6,722 6,984 7,133 7,054 Business and personal services 4,283 5,200 5,135 5,056 5,067 5,275 6,017 6,251 6,385 6,314 Family apparel stores 3,442 3,669 3,812 4,037 4,357 4,807 4,836 5,024 5,131 5,075 Food stores and alcoholic beverages 3,515 4,213 4,210 4,235 4,240 4,222 4,938 5,131 5,240 5,183 Home furnishings and appliances 2,928 3,272 3,194 3,378 3,719 4,031 4,114 4,274 4,365 4,317 Retail stores-other 1,469 1,702 1,678 1,718 1,779 1,952 2,064 2,145 2,191 2,167
Total $ 93,051 $ 106,673 $ 107,426 $ 108,754 $ 113,686 $ 122,533 $ 130,722 $ 135,821 $ 138,716 $ 137,189
Source: California State Board of Equalization * UCLA Forecast
Taxable Transactions by Business Type
Food stores and alcoholic beverages
4%Family apparel stores
4%
Home furnishings and appliances3%
Retail stores - other1%
Business and personal services5%
Building materials5%
Eat ing places & alcoholic beverages
9%
General merchandise stores10%
Specialty stores11%
Auto dealers and service stat ions21%
Non-retail out lets27%
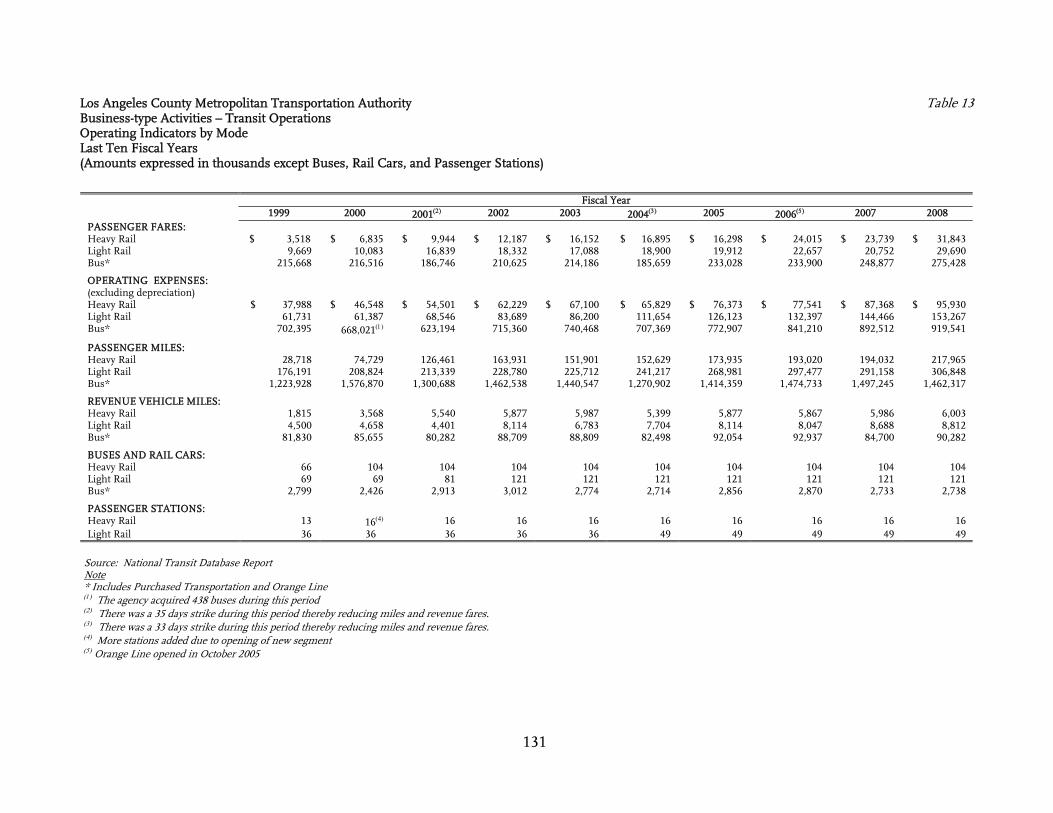
Los Angeles County Metropolitan Transportation Authority Table 13 Business-type Activities – Transit Operations Operating Indicators by Mode Last Ten Fiscal Years (Amounts expressed in thousands except Buses, Rail Cars, and Passenger Stations)
131
Source: National Transit Database Report Note * Includes Purchased Transportation and Orange Line (1) The agency acquired 438 buses during this period (2) There was a 35 days strike during this period thereby reducing miles and revenue fares. (3) There was a 33 days strike during this period thereby reducing miles and revenue fares. (4) More stations added due to opening of new segment (5) Orange Line opened in October 2005
Fiscal Year 1999 2000 2001(2) 2002 2003 2004(3) 2005 2006(5) 2007 2008
PASSENGER FARES: Heavy Rail $ 3,518 $ 6,835 $ 9,944 $ 12,187 $ 16,152 $ 16,895 $ 16,298 $ 24,015 $ 23,739 $ 31,843 Light Rail 9,669 10,083 16,839 18,332 17,088 18,900 19,912 22,657 20,752 29,690 Bus* 215,668 216,516 186,746 210,625 214,186 185,659 233,028 233,900 248,877 275,428 OPERATING EXPENSES: (excluding depreciation)
Heavy Rail $ 37,988 $ 46,548 $ 54,501 $ 62,229 $ 67,100 $ 65,829 $ 76,373 $ 77,541 $ 87,368 $ 95,930 Light Rail 61,731 61,387 68,546 83,689 86,200 111,654 126,123 132,397 144,466 153,267 Bus* 702,395 668,021(1) 623,194 715,360 740,468 707,369 772,907 841,210 892,512 919,541 PASSENGER MILES: Heavy Rail 28,718 74,729 126,461 163,931 151,901 152,629 173,935 193,020 194,032 217,965 Light Rail 176,191 208,824 213,339 228,780 225,712 241,217 268,981 297,477 291,158 306,848 Bus* 1,223,928 1,576,870 1,300,688 1,462,538 1,440,547 1,270,902 1,414,359 1,474,733 1,497,245 1,462,317 REVENUE VEHICLE MILES: Heavy Rail 1,815 3,568 5,540 5,877 5,987 5,399 5,877 5,867 5,986 6,003 Light Rail 4,500 4,658 4,401 8,114 6,783 7,704 8,114 8,047 8,688 8,812 Bus* 81,830 85,655 80,282 88,709 88,809 82,498 92,054 92,937 84,700 90,282 BUSES AND RAIL CARS: Heavy Rail 66 104 104 104 104 104 104 104 104 104 Light Rail 69 69 81 121 121 121 121 121 121 121 Bus* 2,799 2,426 2,913 3,012 2,774 2,714 2,856 2,870 2,733 2,738 PASSENGER STATIONS: Heavy Rail 13 16(4) 16 16 16 16 16 16 16 16 Light Rail 36 36 36 36 36 49 49 49 49 49
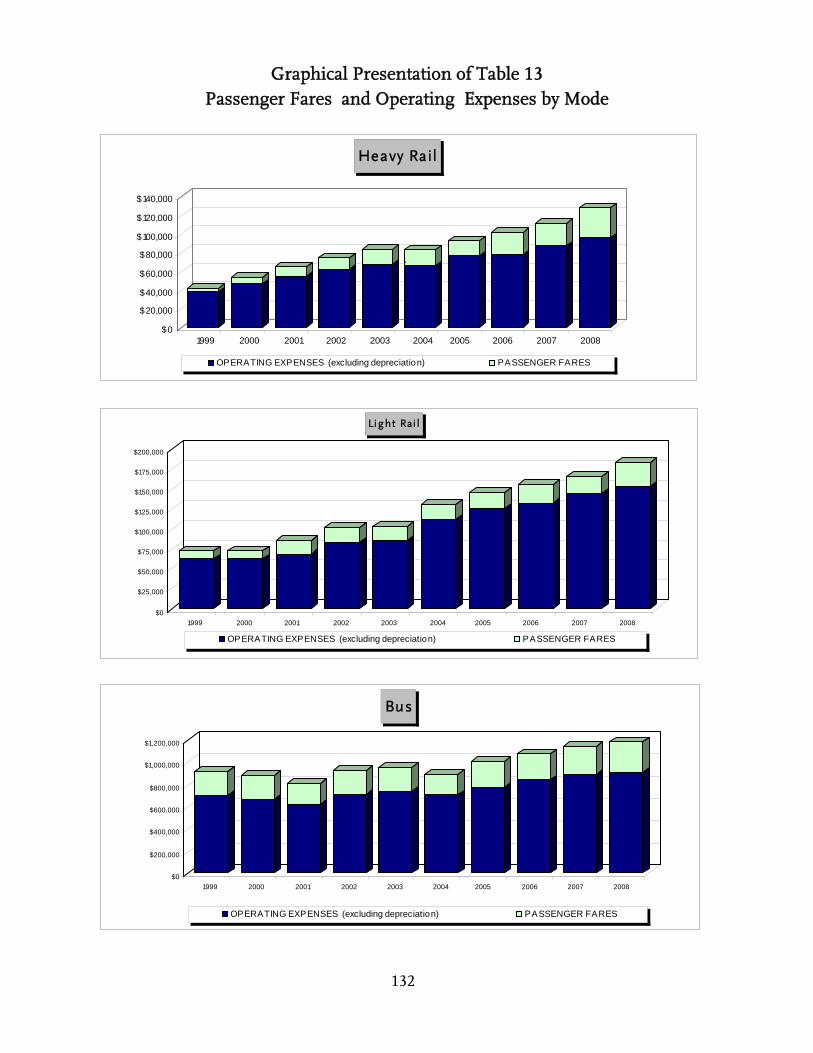
132
$0
$20,000
$40,000
$60,000
$80,000
$100,000
$120,000
$140,000
1999 2000 2001 2002 2003 2004 2005 2006 2007 2008
Heavy Rail
OPERATING EXPENSES (excluding depreciation) PASSENGER FARES
`
$0
$25,000
$50,000
$75,000
$100,000
$125,000
$150,000
$175,000
$200,000
1999 2000 2001 2002 2003 2004 2005 2006 2007 2008
Lig ht Rai l
OPERATING EXPENSES (excluding depreciation) PASSENGER FARES
$0
$200,000
$400,000
$600,000
$800,000
$1,000,000
$1,200,000
1999 2000 2001 2002 2003 2004 2005 2006 2007 2008
Bus
OPERATING EXPENSES (excluding depreciation) PASSENGER FARES
Graphical Presentation of Table 13 Passenger Fares and Operating Expenses by Mode
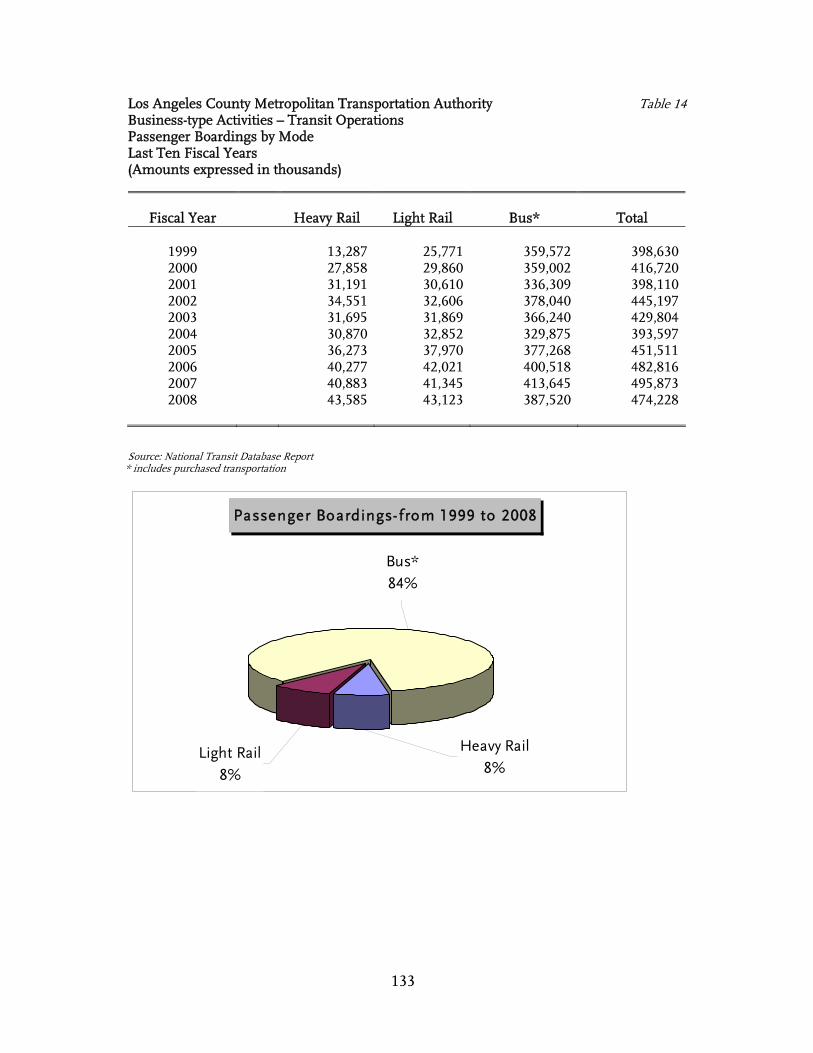
Los Angeles County Metropolitan Transportation Authority Table 14 Business-type Activities – Transit Operations Passenger Boardings by Mode Last Ten Fiscal Years (Amounts expressed in thousands)
133
Source: National Transit Database Report * includes purchased transportation
Passenger Boardings- from 1999 to 2008
Light Rail8%
Heavy Rail8%
Bus*84%
Fiscal Year Heavy Rail Light Rail Bus* Total
1999 13,287 25,771 359,572 398,630 2000 27,858 29,860 359,002 416,720 2001 31,191 30,610 336,309 398,110 2002 34,551 32,606 378,040 445,197 2003 31,695 31,869 366,240 429,804 2004 30,870 32,852 329,875 393,597 2005 36,273 37,970 377,268 451,511 2006 40,277 42,021 400,518 482,816 2007 40,883 41,345 413,645 495,873 2008 43,585 43,123 387,520 474,228
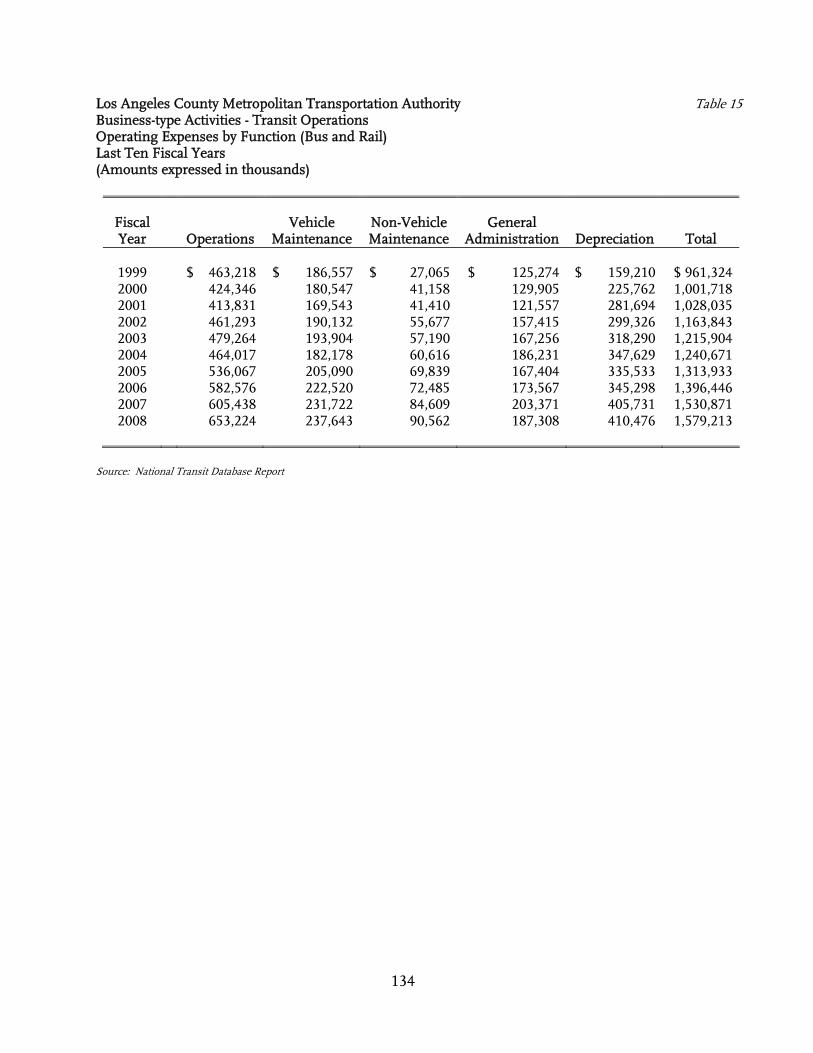
Los Angeles County Metropolitan Transportation Authority Table 15 Business-type Activities - Transit Operations Operating Expenses by Function (Bus and Rail) Last Ten Fiscal Years (Amounts expressed in thousands)
134
Fiscal Vehicle Non-Vehicle General Year Operations Maintenance Maintenance Administration Depreciation Total
1999 $ 463,218 $ 186,557 $ 27,065 $ 125,274 $ 159,210 $ 961,324 2000 424,346 180,547 41,158 129,905 225,762 1,001,718 2001 413,831 169,543 41,410 121,557 281,694 1,028,035 2002 461,293 190,132 55,677 157,415 299,326 1,163,843 2003 479,264 193,904 57,190 167,256 318,290 1,215,904 2004 464,017 182,178 60,616 186,231 347,629 1,240,671 2005 536,067 205,090 69,839 167,404 335,533 1,313,933 2006 582,576 222,520 72,485 173,567 345,298 1,396,446 2007 605,438 231,722 84,609 203,371 405,731 1,530,871 2008 653,224 237,643 90,562 187,308 410,476 1,579,213
Source: National Transit Database Report
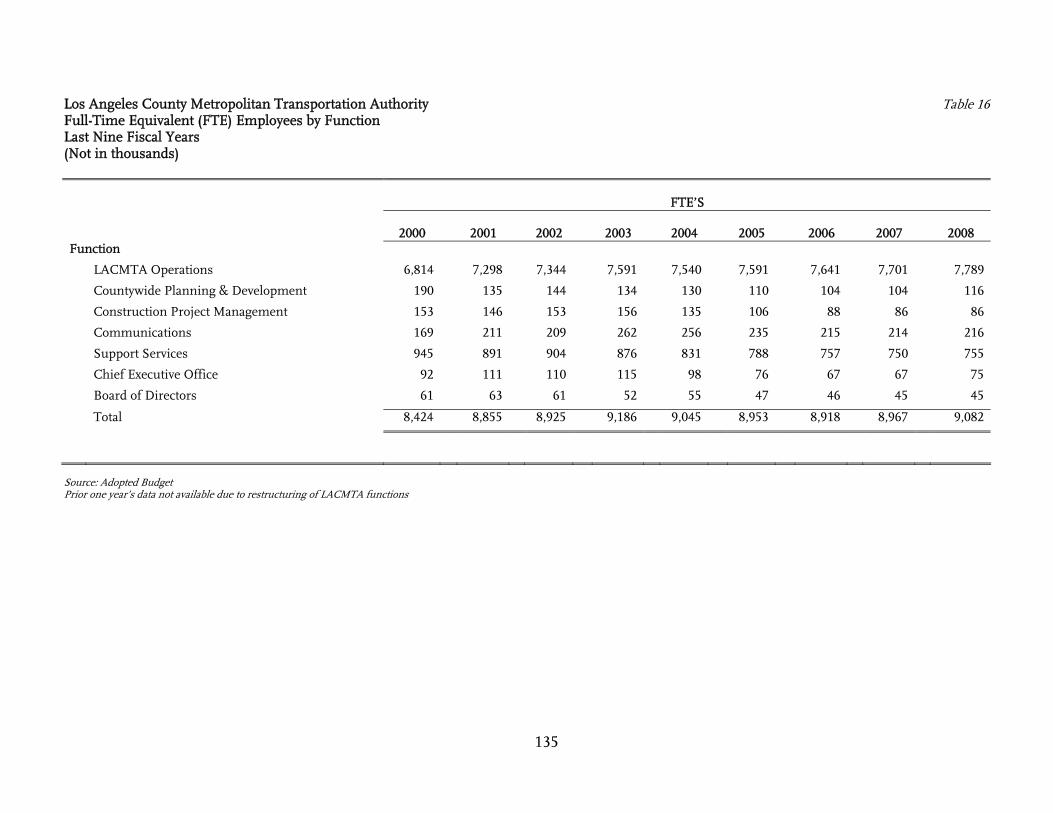
Los Angeles County Metropolitan Transportation Authority Table 16 Full-Time Equivalent (FTE) Employees by Function Last Nine Fiscal Years (Not in thousands)
135
FTE’S
2000 2001 2002 2003 2004 2005 2006 2007 2008 Function
LACMTA Operations 6,814 7,298 7,344 7,591 7,540 7,591 7,641 7,701 7,789
Countywide Planning & Development 190 135 144 134 130 110 104 104 116
Construction Project Management 153 146 153 156 135 106 88 86 86
Communications 169 211 209 262 256 235 215 214 216
Support Services 945 891 904 876 831 788 757 750 755
Chief Executive Office 92 111 110 115 98 76 67 67 75
Board of Directors 61 63 61 52 55 47 46 45 45
Total 8,424 8,855 8,925 9,186 9,045 8,953 8,918 8,967 9,082
Source: Adopted Budget Prior one year’s data not available due to restructuring of LACMTA functions

Los Angeles County Metropolitan Transportation Authority Table 17 Business-type Activities – Transit Operations Revenues and Operating Assistance Comparison to Transit Industry Trend Percent to Total Last Ten Fiscal Years
136
Operations Operating Assistance
Passenge Fiscal Year Fares Other Sub-total Local State Federal Subtotal TOTAL
Transportation Industry (1)
1999 37% 16% 53% 21% 22% 4% 47% 100% 2000 36% 17% 53% 22% 21% 4% 47% 100% 2001 35% 14% 49% 24% 23% 4% 51% 100% 2002 33% 17% 50% 20% 25% 5% 50% 100% 2003 33% 18% 51% 20% 23% 6% 49% 100% 2004 33% 17% 50% 21% 22% 7% 50% 100% 2005 32% 16% 48% 21% 24% 7% 52% 100% P 2006 * * * * * * * * 2007 * * * * * * * * 2008 * * * * * * * *
LACMTA (2)
1999 28% 3% 31% 59% 3% 7% 69% 100% 2000 29% 3% 32% 55% 2% 11% 68% 100% 2001 28% 3% 31% 60% 2% 7% 69% 100% 2002 27% 3% 30% 55% 3% 12% 70% 100% 2003 27% 2% 29% 60% 1% 10% 71% 100% 2004 24% 2% 26% 61% 1% 12% 74% 100% 2005 24% 2% 26% 54% 1% 19% 74% 100% 2006 23% 2% 25% 55% 3% 17% 75% 100% 2007 25% 3% 28% 43% 13% 16% 72% 100% 2008 28% 3% 31% 46% 6% 17% 69% 100%
(1) APTA 2007 Public Transportation Fact Book – Table 52, p. 38 (2) National Transit Database Report * data not available P preliminary
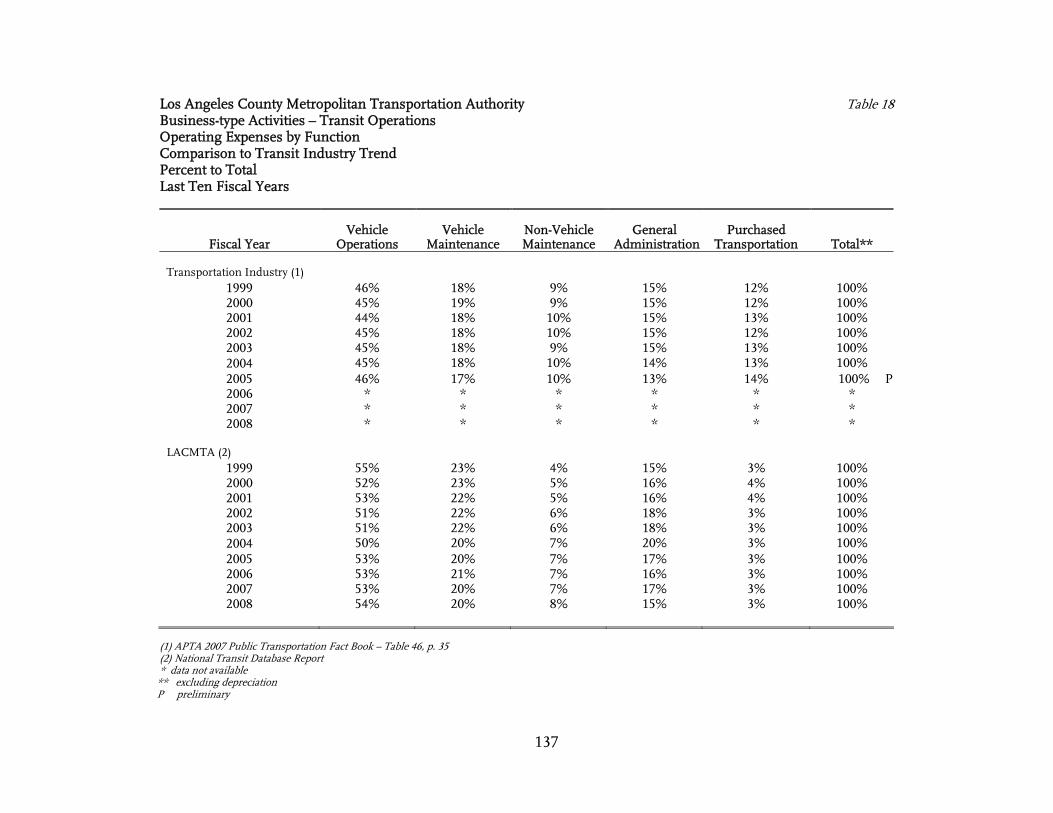
Los Angeles County Metropolitan Transportation Authority Table 18 Business-type Activities – Transit Operations Operating Expenses by Function Comparison to Transit Industry Trend Percent to Total Last Ten Fiscal Years
137
Vehicle Vehicle Non-Vehicle General Purchased
Fiscal Year Operations Maintenance Maintenance Administration Transportation Total**
Transportation Industry (1) 1999 46% 18% 9% 15% 12% 100% 2000 45% 19% 9% 15% 12% 100% 2001 44% 18% 10% 15% 13% 100% 2002 45% 18% 10% 15% 12% 100% 2003 45% 18% 9% 15% 13% 100% 2004 45% 18% 10% 14% 13% 100% 2005 46% 17% 10% 13% 14% 100% P 2006 * * * * * * 2007 * * * * * * 2008 * * * * * *
LACMTA (2)
1999 55% 23% 4% 15% 3% 100% 2000 52% 23% 5% 16% 4% 100% 2001 53% 22% 5% 16% 4% 100% 2002 51% 22% 6% 18% 3% 100% 2003 51% 22% 6% 18% 3% 100% 2004 50% 20% 7% 20% 3% 100% 2005 53% 20% 7% 17% 3% 100% 2006 53% 21% 7% 16% 3% 100% 2007 53% 20% 7% 17% 3% 100% 2008 54% 20% 8% 15% 3% 100%
(1) APTA 2007 Public Transportation Fact Book – Table 46, p. 35 (2) National Transit Database Report * data not available
** excluding depreciation P preliminary
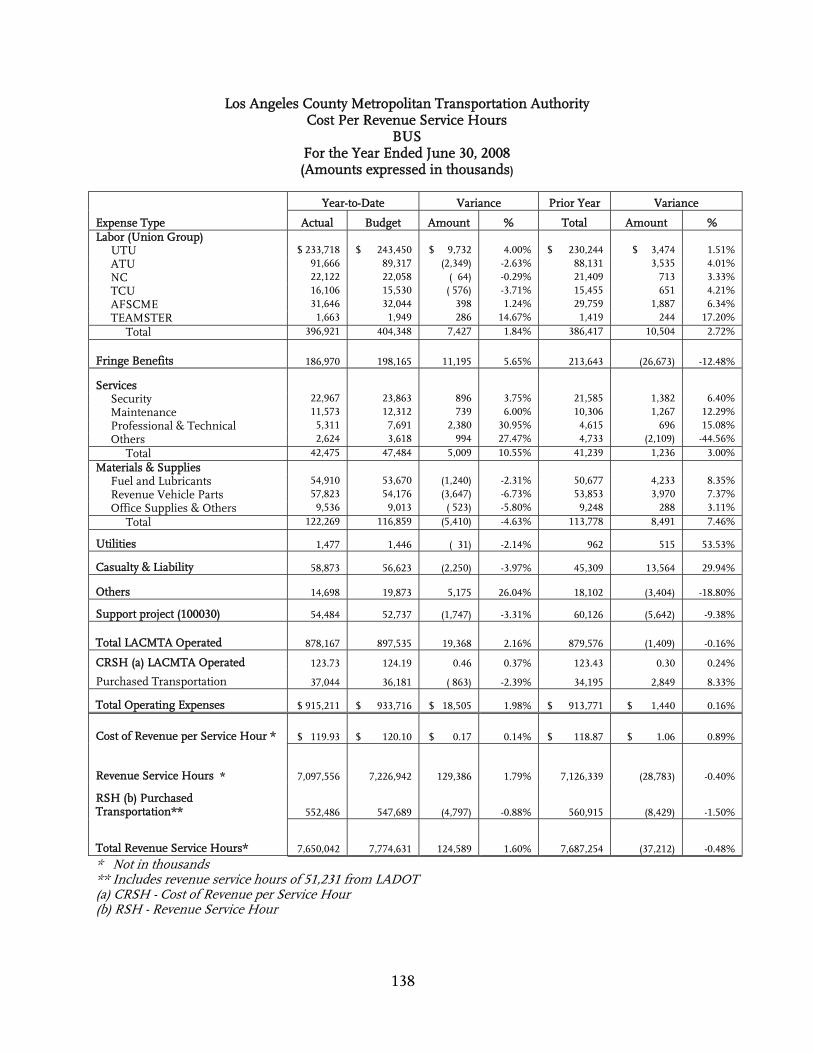
Los Angeles County Metropolitan Transportation Authority Cost Per Revenue Service Hours
BUS For the Year Ended June 30, 2008 (Amounts expressed in thousands)
138
Year-to-Date Variance Prior Year Variance
Expense Type Actual Budget Amount % Total Amount % Labor (Union Group) UTU $ 233,718 $ 243,450 $ 9,732 4.00% $ 230,244 $ 3,474 1.51% ATU 91,666 89,317 (2,349) -2.63% 88,131 3,535 4.01% NC 22,122 22,058 ( 64) -0.29% 21,409 713 3.33% TCU 16,106 15,530 ( 576) -3.71% 15,455 651 4.21% AFSCME 31,646 32,044 398 1.24% 29,759 1,887 6.34% TEAMSTER 1,663 1,949 286 14.67% 1,419 244 17.20% Total 396,921 404,348 7,427 1.84% 386,417 10,504 2.72%
Fringe Benefits 186,970 198,165 11,195 5.65% 213,643 (26,673) -12.48%
Services Security 22,967 23,863 896 3.75% 21,585 1,382 6.40% Maintenance 11,573 12,312 739 6.00% 10,306 1,267 12.29% Professional & Technical 5,311 7,691 2,380 30.95% 4,615 696 15.08% Others 2,624 3,618 994 27.47% 4,733 (2,109) -44.56% Total 42,475 47,484 5,009 10.55% 41,239 1,236 3.00% Materials & Supplies Fuel and Lubricants 54,910 53,670 (1,240) -2.31% 50,677 4,233 8.35% Revenue Vehicle Parts 57,823 54,176 (3,647) -6.73% 53,853 3,970 7.37% Office Supplies & Others 9,536 9,013 ( 523) -5.80% 9,248 288 3.11% Total 122,269 116,859 (5,410) -4.63% 113,778 8,491 7.46%
Utilities 1,477 1,446 ( 31) -2.14% 962 515 53.53%
Casualty & Liability 58,873 56,623 (2,250) -3.97% 45,309 13,564 29.94%
Others 14,698 19,873 5,175 26.04% 18,102 (3,404) -18.80%
Support project (100030) 54,484 52,737 (1,747) -3.31% 60,126 (5,642) -9.38%
Total LACMTA Operated 878,167 897,535 19,368 2.16% 879,576 (1,409) -0.16%
CRSH (a) LACMTA Operated 123.73 124.19 0.46 0.37% 123.43 0.30 0.24%
Purchased Transportation 37,044 36,181 ( 863) -2.39% 34,195 2,849 8.33%
Total Operating Expenses $ 915,211 $ 933,716 $ 18,505 1.98% $ 913,771 $ 1,440 0.16%
Cost of Revenue per Service Hour * $ 119.93 $ 120.10 $ 0.17 0.14% $ 118.87 $ 1.06 0.89%
Revenue Service Hours * 7,097,556 7,226,942 129,386 1.79% 7,126,339 (28,783) -0.40%
RSH (b) Purchased Transportation** 552,486 547,689 (4,797) -0.88% 560,915 (8,429) -1.50%
Total Revenue Service Hours* 7,650,042 7,774,631 124,589 1.60% 7,687,254 (37,212) -0.48%
* Not in thousands ** Includes revenue service hours of 51,231 from LADOT (a) CRSH - Cost of Revenue per Service Hour (b) RSH - Revenue Service Hour
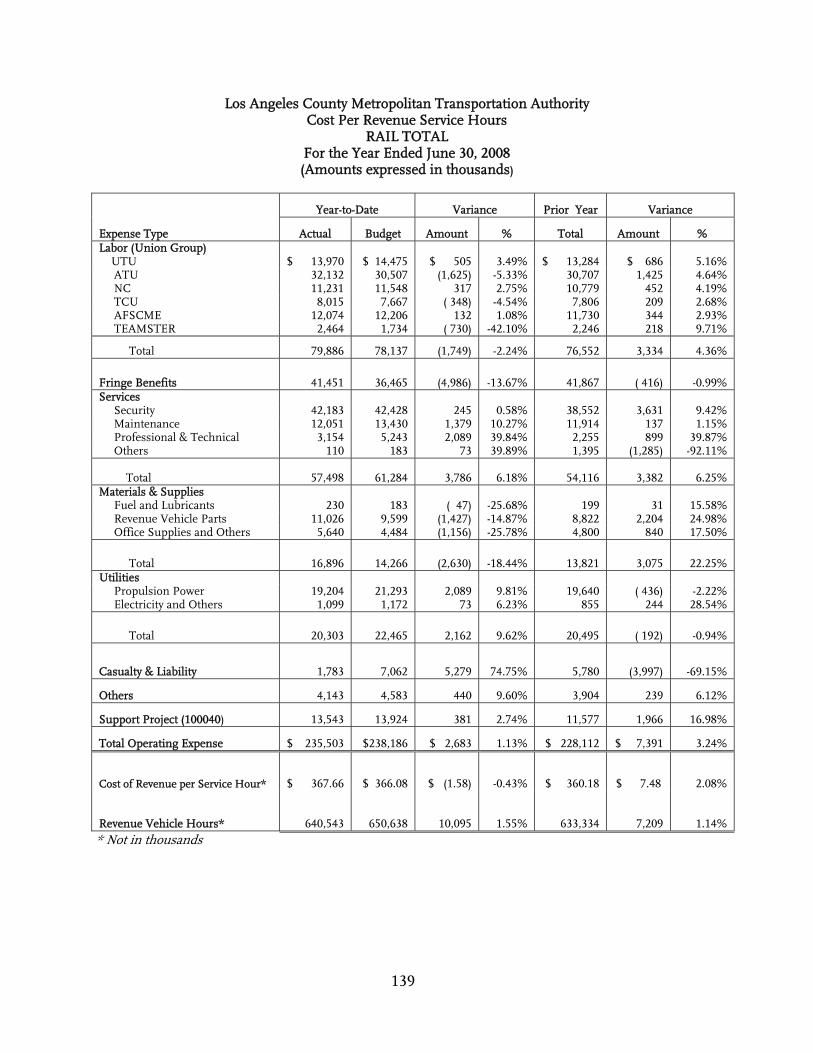
Los Angeles County Metropolitan Transportation Authority Cost Per Revenue Service Hours
RAIL TOTAL For the Year Ended June 30, 2008 (Amounts expressed in thousands)
139
Year-to-Date Variance Prior Year Variance
Expense Type Actual Budget Amount % Total Amount % Labor (Union Group) UTU $ 13,970 $ 14,475 $ 505 3.49% $ 13,284 $ 686 5.16% ATU 32,132 30,507 (1,625) -5.33% 30,707 1,425 4.64% NC 11,231 11,548 317 2.75% 10,779 452 4.19% TCU 8,015 7,667 ( 348) -4.54% 7,806 209 2.68% AFSCME 12,074 12,206 132 1.08% 11,730 344 2.93% TEAMSTER 2,464 1,734 ( 730) -42.10% 2,246 218 9.71%
Total 79,886 78,137 (1,749) -2.24% 76,552 3,334 4.36%
Fringe Benefits 41,451 36,465 (4,986) -13.67% 41,867 ( 416) -0.99% Services Security 42,183 42,428 245 0.58% 38,552 3,631 9.42% Maintenance 12,051 13,430 1,379 10.27% 11,914 137 1.15% Professional & Technical 3,154 5,243 2,089 39.84% 2,255 899 39.87% Others 110 183 73 39.89% 1,395 (1,285) -92.11%
Total 57,498 61,284 3,786 6.18% 54,116 3,382 6.25% Materials & Supplies Fuel and Lubricants 230 183 ( 47) -25.68% 199 31 15.58% Revenue Vehicle Parts 11,026 9,599 (1,427) -14.87% 8,822 2,204 24.98% Office Supplies and Others 5,640 4,484 (1,156) -25.78% 4,800 840 17.50%
Total 16,896 14,266 (2,630) -18.44% 13,821 3,075 22.25% Utilities Propulsion Power 19,204 21,293 2,089 9.81% 19,640 ( 436) -2.22% Electricity and Others 1,099 1,172 73 6.23% 855 244 28.54%
Total 20,303 22,465 2,162 9.62% 20,495 ( 192) -0.94%
Casualty & Liability 1,783 7,062 5,279 74.75% 5,780 (3,997) -69.15%
Others 4,143 4,583 440 9.60% 3,904 239 6.12%
Support Project (100040) 13,543 13,924 381 2.74% 11,577 1,966 16.98%
Total Operating Expense $ 235,503 $238,186 $ 2,683 1.13% $ 228,112 $ 7,391 3.24%
Cost of Revenue per Service Hour* $ 367.66 $ 366.08 $ (1.58) -0.43% $ 360.18 $ 7.48 2.08%
Revenue Vehicle Hours* 640,543 650,638 10,095 1.55% 633,334 7,209 1.14% * Not in thousands
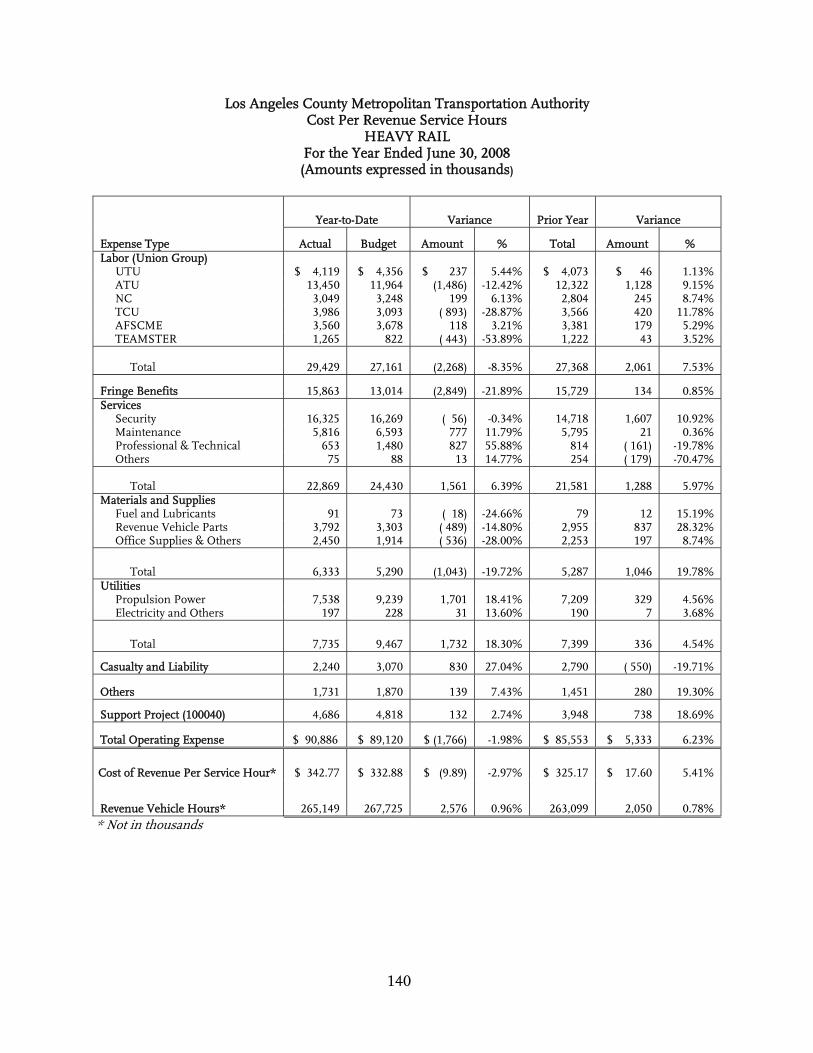
Los Angeles County Metropolitan Transportation Authority Cost Per Revenue Service Hours
HEAVY RAIL For the Year Ended June 30, 2008 (Amounts expressed in thousands)
140
Year-to-Date Variance Prior Year Variance
Expense Type Actual Budget Amount % Total Amount % Labor (Union Group) UTU $ 4,119 $ 4,356 $ 237 5.44% $ 4,073 $ 46 1.13% ATU 13,450 11,964 (1,486) -12.42% 12,322 1,128 9.15% NC 3,049 3,248 199 6.13% 2,804 245 8.74% TCU 3,986 3,093 ( 893) -28.87% 3,566 420 11.78% AFSCME 3,560 3,678 118 3.21% 3,381 179 5.29% TEAMSTER 1,265 822 ( 443) -53.89% 1,222 43 3.52%
Total 29,429 27,161 (2,268) -8.35% 27,368 2,061 7.53%
Fringe Benefits 15,863 13,014 (2,849) -21.89% 15,729 134 0.85% Services Security 16,325 16,269 ( 56) -0.34% 14,718 1,607 10.92% Maintenance 5,816 6,593 777 11.79% 5,795 21 0.36% Professional & Technical 653 1,480 827 55.88% 814 ( 161) -19.78% Others 75 88 13 14.77% 254 ( 179) -70.47%
Total 22,869 24,430 1,561 6.39% 21,581 1,288 5.97% Materials and Supplies Fuel and Lubricants 91 73 ( 18) -24.66% 79 12 15.19% Revenue Vehicle Parts 3,792 3,303 ( 489) -14.80% 2,955 837 28.32% Office Supplies & Others 2,450 1,914 ( 536) -28.00% 2,253 197 8.74%
Total 6,333 5,290 (1,043) -19.72% 5,287 1,046 19.78% Utilities Propulsion Power 7,538 9,239 1,701 18.41% 7,209 329 4.56% Electricity and Others 197 228 31 13.60% 190 7 3.68%
Total 7,735 9,467 1,732 18.30% 7,399 336 4.54%
Casualty and Liability 2,240 3,070 830 27.04% 2,790 ( 550) -19.71%
Others 1,731 1,870 139 7.43% 1,451 280 19.30%
Support Project (100040) 4,686 4,818 132 2.74% 3,948 738 18.69%
Total Operating Expense $ 90,886 $ 89,120 $ (1,766) -1.98% $ 85,553 $ 5,333 6.23%
Cost of Revenue Per Service Hour* $ 342.77 $ 332.88 $ (9.89) -2.97% $ 325.17 $ 17.60 5.41%
Revenue Vehicle Hours* 265,149 267,725 2,576 0.96% 263,099 2,050 0.78% * Not in thousands

Los Angeles County Metropolitan Transportation Authority Cost Per Revenue Service Hours
LIGHT RAIL For the Year Ended June 30, 2008 (Amounts expressed in thousands)
141
Year-to Date
Variance
Prior Year
Variance
Expense Type Actual Budget Amount % Total Amount % Labor (Union Group) UTU $ 9,851 $ 10,119 $ 268 2.65% $ 9,211 $ 640 6.95% ATU 18,682 18,543 ( 139) -0.75% 18,385 297 1.62% NC 8,182 8,299 117 1.41% 7,975 207 2.60% TCU 4,029 4,574 545 11.92% 4,240 (211) -4.98% AFSCME 8,514 8,527 13 0.15% 8,349 165 1.98% TEAMSTER 1,199 912 ( 287) -31.47% 1,024 175 17.09%
Total 50,457 50,974 517 1.01% 49,184 1,273 2.59%
Fringe Benefits 25,587 23,452 (2,135) -9.10% 26,138 (551) -2.11% Services Security 25,857 26,159 302 1.15% 23,834 2,023 8.49% Maintenance 6,235 6,838 603 8.82% 6,119 116 1.90% Professional & Technical 2,501 3,763 1,262 33.54% 1,441 1,060 73.56% Others 36 95 59 62.11% 1,141 (1,105) -96.84%
Total 34,629 36,855 2,226 6.04% 32,535 2,094 6.44% Materials and Supplies Fuel and Lubricants 139 110 ( 29) -26.36% 120 19 15.83% Revenue Vehicle Parts 7,234 6,296 ( 938) -14.90% 5,867 1,367 23.30% Office Supplies & Others 3,191 2,570 ( 621) -24.16% 2,547 644 25.28%
Total 10,564 8,976 (1,588) -17.69% 8,534 2,030 23.79% Utilities Propulsion Power 11,666 12,055 389 3.23% 12,431 (765) -6.15% Electricity and Others 902 944 42 4.45% 665 237 35.64%
Total 12,568 12,999 431 3.32% 13,096 (528) -4.03%
Casualty and Liability (456) 3,992 4,448 111.42% 2,990 (3,446) -115.25%
Others 2,412 2,712 300 11.06% 2,453 (41) -1.67%
Support Project (100040) 8,857 9,106 249 2.73% 7,629 1,228 16.10%
Total Operating Expense $144,618 $149,066 $ 4,448 2.98% $ 142,559 $ 2,059 -1.44%
Cost of Revenue Per Service Hour* $ 385.24 $ 389.29 $ 4.05 1.04% $ 385.05 $ 0.19 0.05%
Revenue Vehicle Hours* 375,394 382,913 7,519 1.96% 370,235 5,159 1.39% * Not in thousands
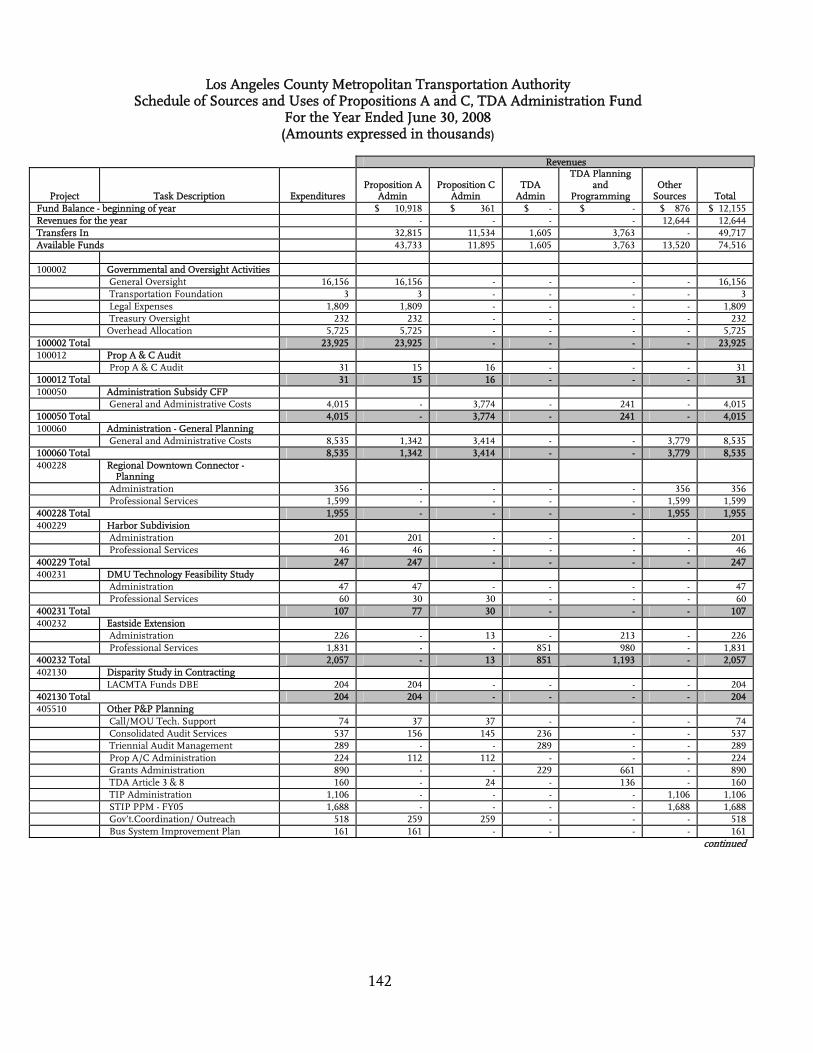
Los Angeles County Metropolitan Transportation Authority Schedule of Sources and Uses of Propositions A and C, TDA Administration Fund
For the Year Ended June 30, 2008 (Amounts expressed in thousands)
142
Revenues
Project Task Description Expenditures Proposition A
Admin Proposition C
Admin TDA
Admin
TDA Planning and
Programming Other
Sources Total Fund Balance - beginning of year $ 10,918 $ 361 $ - $ - $ 876 $ 12,155 Revenues for the year - - - - 12,644 12,644 Transfers In 32,815 11,534 1,605 3,763 - 49,717 Available Funds 43,733 11,895 1,605 3,763 13,520 74,516 100002 Governmental and Oversight Activities
General Oversight 16,156 16,156 - - - - 16,156 Transportation Foundation 3 3 - - - - 3 Legal Expenses 1,809 1,809 - - - - 1,809 Treasury Oversight 232 232 - - - - 232 Overhead Allocation 5,725 5,725 - - - - 5,725
100002 Total 23,925 23,925 - - - - 23,925 100012 Prop A & C Audit
Prop A & C Audit 31 15 16 - - - 31 100012 Total 31 15 16 - - - 31 100050 Administration Subsidy CFP
General and Administrative Costs 4,015 - 3,774 - 241 - 4,015 100050 Total 4,015 - 3,774 - 241 - 4,015 100060 Administration - General Planning
General and Administrative Costs 8,535 1,342 3,414 - - 3,779 8,535 100060 Total 8,535 1,342 3,414 - - 3,779 8,535 400228 Regional Downtown Connector -
Planning
Administration 356 - - - - 356 356 Professional Services 1,599 - - - - 1,599 1,599
400228 Total 1,955 - - - - 1,955 1,955 400229 Harbor Subdivision
Administration 201 201 - - - - 201 Professional Services 46 46 - - - - 46
400229 Total 247 247 - - - - 247 400231 DMU Technology Feasibility Study
Administration 47 47 - - - - 47 Professional Services 60 30 30 - - - 60
400231 Total 107 77 30 - - - 107 400232 Eastside Extension
Administration 226 - 13 - 213 - 226 Professional Services 1,831 - - 851 980 - 1,831
400232 Total 2,057 - 13 851 1,193 - 2,057 402130 Disparity Study in Contracting
LACMTA Funds DBE 204 204 - - - - 204 402130 Total 204 204 - - - - 204 405510 Other P&P Planning Call/MOU Tech. Support 74 37 37 - - - 74
Consolidated Audit Services 537 156 145 236 - - 537 Triennial Audit Management 289 - - 289 - - 289 Prop A/C Administration 224 112 112 - - - 224 Grants Administration 890 - - 229 661 - 890 TDA Article 3 & 8 160 - 24 - 136 - 160 TIP Administration 1,106 - - - - 1,106 1,106 STIP PPM - FY05 1,688 - - - - 1,688 1,688 Gov’t.Coordination/ Outreach 518 259 259 - - - 518 Bus System Improvement Plan 161 161 - - - - 161 continued
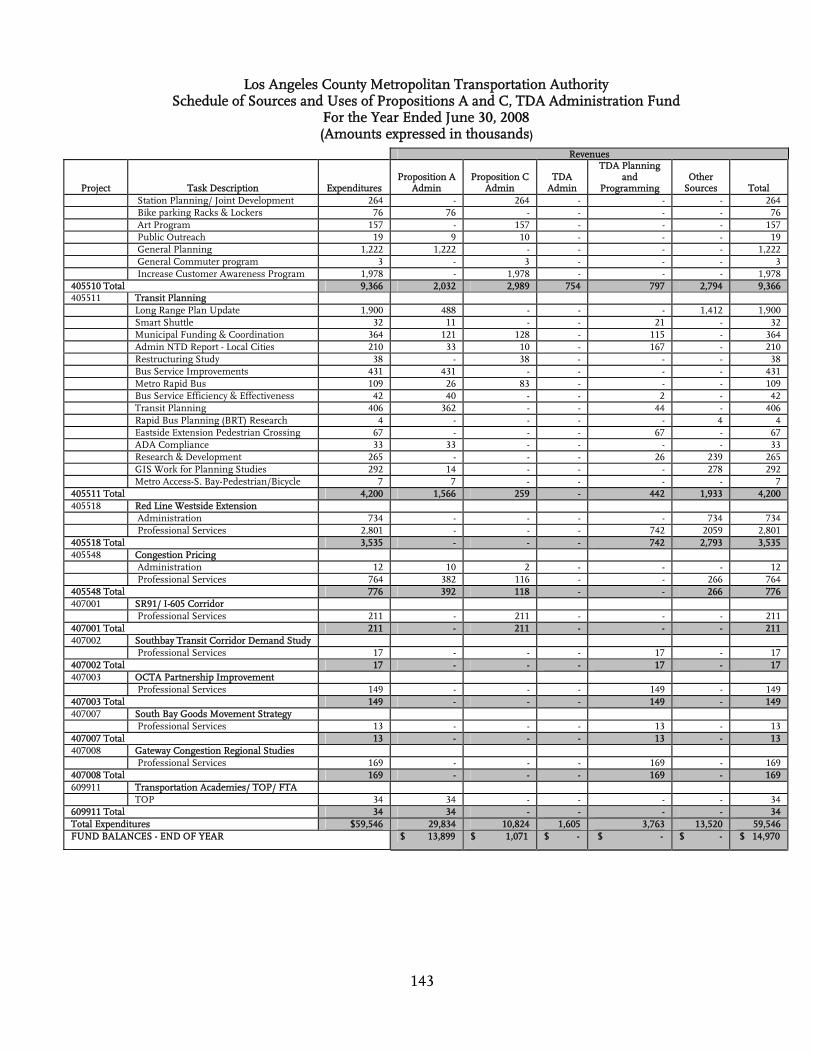
Los Angeles County Metropolitan Transportation Authority Schedule of Sources and Uses of Propositions A and C, TDA Administration Fund
For the Year Ended June 30, 2008 (Amounts expressed in thousands)
143
Revenues
Project Task Description Expenditures Proposition A
Admin Proposition C
Admin TDA
Admin
TDA Planning and
Programming Other
Sources Total Station Planning/ Joint Development 264 - 264 - - - 264 Bike parking Racks & Lockers 76 76 - - - - 76 Art Program 157 - 157 - - - 157 Public Outreach 19 9 10 - - - 19 General Planning 1,222 1,222 - - - - 1,222 General Commuter program 3 - 3 - - - 3 Increase Customer Awareness Program 1,978 - 1,978 - - - 1,978
405510 Total 9,366 2,032 2,989 754 797 2,794 9,366 405511 Transit Planning
Long Range Plan Update 1,900 488 - - - 1,412 1,900 Smart Shuttle 32 11 - - 21 - 32 Municipal Funding & Coordination 364 121 128 - 115 - 364 Admin NTD Report - Local Cities 210 33 10 - 167 - 210 Restructuring Study 38 - 38 - - - 38 Bus Service Improvements 431 431 - - - - 431 Metro Rapid Bus 109 26 83 - - - 109 Bus Service Efficiency & Effectiveness 42 40 - - 2 - 42 Transit Planning 406 362 - - 44 - 406 Rapid Bus Planning (BRT) Research 4 - - - - 4 4 Eastside Extension Pedestrian Crossing 67 - - - 67 - 67 ADA Compliance 33 33 - - - - 33 Research & Development 265 - - - 26 239 265 GIS Work for Planning Studies 292 14 - - - 278 292 Metro Access-S. Bay-Pedestrian/Bicycle 7 7 - - - - 7
405511 Total 4,200 1,566 259 - 442 1,933 4,200 405518 Red Line Westside Extension
Administration 734 - - - - 734 734 Professional Services 2,801 - - - 742 2059 2,801
405518 Total 3,535 - - - 742 2,793 3,535 405548 Congestion Pricing
Administration 12 10 2 - - - 12 Professional Services 764 382 116 - - 266 764
405548 Total 776 392 118 - - 266 776 407001 SR91/ I-605 Corridor
Professional Services 211 - 211 - - - 211 407001 Total 211 - 211 - - - 211 407002 Southbay Transit Corridor Demand Study
Professional Services 17 - - - 17 - 17 407002 Total 17 - - - 17 - 17 407003 OCTA Partnership Improvement
Professional Services 149 - - - 149 - 149 407003 Total 149 - - - 149 - 149 407007 South Bay Goods Movement Strategy
Professional Services 13 - - - 13 - 13 407007 Total 13 - - - 13 - 13 407008 Gateway Congestion Regional Studies
Professional Services 169 - - - 169 - 169 407008 Total 169 - - - 169 - 169 609911 Transportation Academies/ TOP/ FTA
TOP 34 34 - - - - 34 609911 Total 34 34 - - - - 34 Total Expenditures $59,546 29,834 10,824 1,605 3,763 13,520 59,546 FUND BALANCES - END OF YEAR $ 13,899 $ 1,071 $ - $ - $ - $ 14,970

144
THIS PAGE INTENTIONALLY LEFT BLANK

One Gateway Plaza Los Angeles, CA 90012-2952
213.922.6000 metro.net
09-
030
3jl
©20
09
lacm
ta