Long-term changes in forest floor processes in southern ... · 2002; Berg et al., 2000) examined...
16
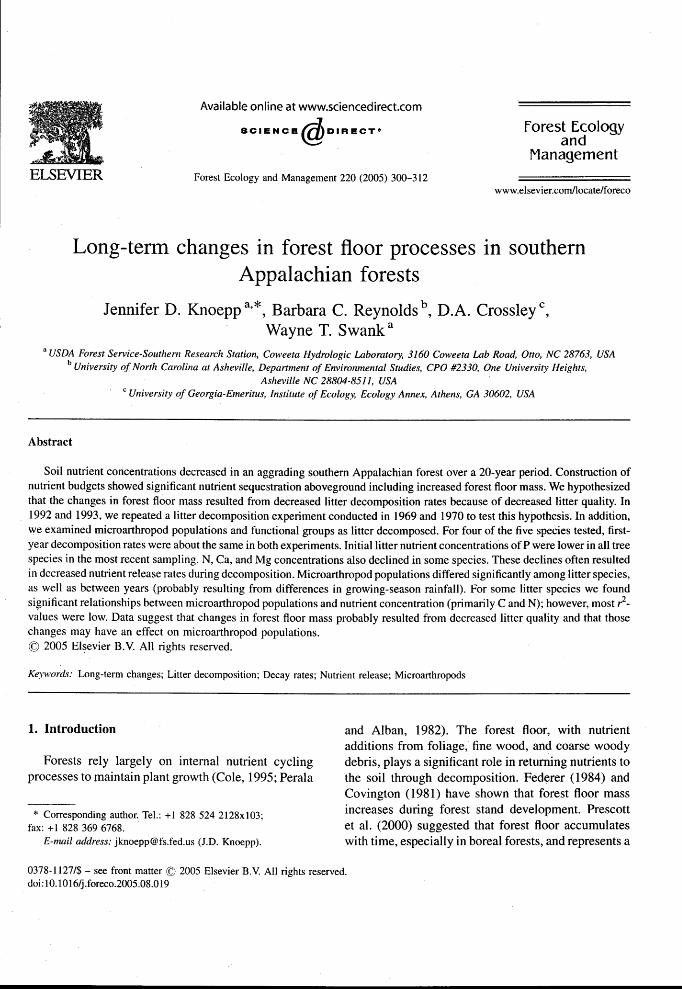
Available online at www.sciencedirect.com sciENc. @DtRCETe Forest Ecology and Management 220 (2005) 300-3 12 Forest Ecology and Management Long-term changes in forest floor processes in southern Appalachian forests Jennifer D. Knoepp Barbara C. Reynolds b, D.A. Crossley ', Wayne T. Swank a " USDA Forest Service-Southern Research Station, Coweeta Hydrologic Laboratory, 3160 Coweeta Lab Road, Otto, NC 28763, USA University of North Carolina at Asheville, Department of Environmental Studies, CPO #2330, One University Heights, Asheville NC 28804-8511, USA University of Georgia-Emeritus, Institute of Ecology, Ecology Annex, Athens, GA 30602, USA Abstract Soil nutrient concentrations decreased in an aggrading southern Appalachian forest over a 20-year period. Construction of nutrient budgets showed significant nutrient sequestration aboveground including increased forest floor mass. We hypothesized that the changes in forest floor mass resulted from decreased litter decomposition rates because of decreased litter quality. In 1992 and 1993, we repeated a litter decomposition experiment conducted in 1969 and 1970 to test this hypothesis. In addition, we examined microarthropod populations and functional groups as litter decomposed. For four of the five species tested, first- year decomposition rates were about the same in both experiments. Initial litter nutrient concentrations of P were lower in all tree species in the most recent sampling. N, Ca, and Mg concentrations also declined in some species. These declines often resulted in decreased nutrient release rates during decomposition. Microarthropod populations differed significantly among litter species, as well as between years (probably resulting from differences in growing-season rainfall). For some litter species we found significant relationships between microarthropod populations and nutrient concentration (primarily C and N); however, most r2- values were low. Data suggest that changes in forest floor mass probably resulted from decreased litter quality and that those changes may have an effect on microarthropod populations. 0 2005 Elsevier B.V. All rights reserved. Keywords: Long-term changes; Litter decomposition; Decay rates; Nutrient release; Microarthropods 1. Introduction and Alban, 1982). The forest floor, with nutrient additions from foliage, fine wood, and coarse woody Forests rely largely on internal nutrient cycling debris, plays a significant role in returning nutrients to processes to maintain plant growth (Cole, 1995; Perala the soil through decomposition. Federer (1984) and Covington (1981) have shown that forest floor mass * Corresponding author. Tel.: +1 828 524 2128x103; fax: +I 828 369 6768. increases during forest stand development. Prescott et al. (2000) suggested that forest floor accumulates E-nmil address: [email protected] (J.D. Knoepp). with time, especially in boreal forests, and represents a 0378-1 127/$ - see front matter 0 2005 Elsevier B.V. All rights reserved. doi: 10.1016/j.foreco.2005.08.019
Transcript of Long-term changes in forest floor processes in southern ... · 2002; Berg et al., 2000) examined...
Available online at www.sciencedirect.com
sciENc. @ D t R C E T e
Forest Ecology and Management 220 (2005) 300-3 12
Forest Ecology and
Management
Long-term changes in forest floor processes in southern Appalachian forests
Jennifer D. Knoepp Barbara C. Reynolds b, D.A. Crossley ', Wayne T. Swank a
" USDA Forest Service-Southern Research Station, Coweeta Hydrologic Laboratory, 3160 Coweeta Lab Road, Otto, NC 28763, USA University of North Carolina at Asheville, Department of Environmental Studies, CPO #2330, One University Heights,
Asheville NC 28804-8511, USA University of Georgia-Emeritus, Institute of Ecology, Ecology Annex, Athens, GA 30602, USA
Abstract
Soil nutrient concentrations decreased in an aggrading southern Appalachian forest over a 20-year period. Construction of nutrient budgets showed significant nutrient sequestration aboveground including increased forest floor mass. We hypothesized that the changes in forest floor mass resulted from decreased litter decomposition rates because of decreased litter quality. In 1992 and 1993, we repeated a litter decomposition experiment conducted in 1969 and 1970 to test this hypothesis. In addition, we examined microarthropod populations and functional groups as litter decomposed. For four of the five species tested, first- year decomposition rates were about the same in both experiments. Initial litter nutrient concentrations of P were lower in all tree species in the most recent sampling. N, Ca, and Mg concentrations also declined in some species. These declines often resulted in decreased nutrient release rates during decomposition. Microarthropod populations differed significantly among litter species, as well as between years (probably resulting from differences in growing-season rainfall). For some litter species we found significant relationships between microarthropod populations and nutrient concentration (primarily C and N); however, most r2- values were low. Data suggest that changes in forest floor mass probably resulted from decreased litter quality and that those changes may have an effect on microarthropod populations. 0 2005 Elsevier B.V. All rights reserved.
Keywords: Long-term changes; Litter decomposition; Decay rates; Nutrient release; Microarthropods
1. Introduction and Alban, 1982). The forest floor, with nutrient additions from foliage, fine wood, and coarse woody
Forests rely largely on internal nutrient cycling debris, plays a significant role in returning nutrients to processes to maintain plant growth (Cole, 1995; Perala the soil through decomposition. Federer (1984) and
Covington (1981) have shown that forest floor mass
* Corresponding author. Tel.: +1 828 524 2128x103; fax: + I 828 369 6768.
increases during forest stand development. Prescott et al. (2000) suggested that forest floor accumulates
E-nmil address: [email protected] (J.D. Knoepp). with time, especially in boreal forests, and represents a
0378-1 127/$ - see front matter 0 2005 Elsevier B.V. All rights reserved. doi: 10.1016/j.foreco.2005.08.019

J. D. Knoepp et al. /Forest Ecology and Management 220 (2005) 300-312 30 1
large pool of nutrients. Its decomposition is essential for nutrient availability in the short-term, but it may immobilize nutrients in the long-term.
Forest floor type has an influence on litter decomposition rates, and forest floor chemistry differs significantly among sites (Grigal and Ohmann, 1989). Litter decomposition rates involve the interaction of vegetation, soil nutrient availability, micro- and macro-fauna, microbial populations, and environmen- tal conditions. Decomposition rates can provide an accurate prediction of soil and site quality or productivity (Johansson, 1994). Increasing rates of litter decomposition suggest accelerated nutrient cycling rates within the site. On a global scale, rates of litter decomposition are regulated by climate (Johansson et al., 1995). Hornsby et al. (1995) used microcosms to alter temperature and moisture in a loblolly pine plantation. He found that increased moisture and temperature increased decomposition rates. Murphy et al. (1 998) studied decomposition of several native species along an elevation gradient in Arizona. They concluded that decomposition was largely regulated by moisture. Upon examination of the relationship between nutrient concentrations and decomposition rates, their data suggested that decom- position is limited by C availability, not nutrients. Melillo et al. (1989) found that in the initial phase of leaf litter decomposition (44 months in their study) cellulose is removed but the later phase focuses on lignin breakdown. Berg et al. (Berg and Meentemeyer, 2002; Berg et al., 2000) examined litter quality and decomposition rates across a transect in northern Europe. They found that substrate quality, specifically Mn concentration, explained 27% of the decomposi- tion pattern, because of its influence on lignin degradation. In a later study they used the final stage of litter decomposition, the limit value, as an indicator of how climatic changes would alter the forest floor (Berg and Meentemeyer, 2002). The limit value of litter decay was unaffected by climate but was negatively related to initial litter N concentration and N additions caused decomposition to stop entirely.
Other research studies have shown that litter type controls decomposition rates. Keenan and others (1996) compared decomposition rates in coniferous forests of British Columbia. They examined western redcedar, western hemlock, and lodgepole pine and found that litter species, not site microclimate
differences, regulated decomposition rates. They also concluded that litter type controlled site differences in N availability. Taylor and others (1 989) improved overall litter quality by mixing slow and rapidly decomposing litter types. They found that decay rates were most similar to the rapidly decomposing species. Their data suggested that litter quality controls rates of decomposition, regardless of the environmental condition (Taylor et al., 1991). This was also the conclusion of an experiment examining nutrient cycling rates across a climatic and vegetation gradient in mixed temperate forests of the southern Appala- chians (Knoepp et al., 2000). At the Coweeta Hydrologic Lab in western NC, litter decomposition rates were determined on five sites representing a gradient in vegetation type. Sites included a xeric mixed oak-pine community with low nutrient avail- ability, two mixed oak sites (860 and 1090m elevation), a nutrient rich cove hardwood forest, and a high N northern hardwood forest. Litter decom- position rates were determined for three species: two overstory species, Liriodendron tulipifera and Quer- cus prinus; and one evergreen understory species, Rhododendrorz maximum. On average, the two mixed oak sites, MO-H and MO-L, had the highest decay constant; followed by the northern hardwood, the mixed-oak pine, and the cove hardwood communities. Rates were not directly influenced by climate (high temperature or moisture) or nutrient availability (Knoepp et al., 2000) suggesting that additional or a combination of factors regulate litter decomposition.
Research on the relationship between nutrients and litter decomposition has generated variable results. Foliar nutrient content is often representative of soil nutrient content or availability (Stump and Binkley, 1993; Wang and Klinka, 1997). Monleon and Cromack (1996) found that nutrient release and immobilization patterns during the initial phases of decomposition suggest which nutrients are limiting on a site. However, Prescott et al. (1 993) found that while foliar N and P concentration influenced immobiliza- tion of these nutrients during decomposition, it was not related to soil nutrient availability. Aerts and De Caluwe (1997) used field grown, low N and high N litter to determine effects of nutrient concentration on decay rates and nutrient release. They found that high N species did not always have the greatest decom- position rates.

302 J. D. Knoepp et al. /Forest Ecology and Management 220 (2005) 300-312
Soil and forest floor microarthropods and microbes are important as primary decomposers and litter transformers. Their activity changes the physical and chemical characteristics of the litter layer and is thus intimately connected with decomposition processes (Wardle, 2002). Microarthropods differ in their func- tional role of decomposition both among and within groups. For example, Addison et al. (2003) found that all adult Collembola examined fed on fungal hyphae; some also feed on decomposing plant material, organic matter, and invertebrate fecal material.
In a previous study on a north-facing hardwood (WS 18) and a white pine plantation (WS 17) watershed in the Coweeta Hydrologic Laboratory basin, we found a significant decrease in surface soil extractable cations (Ca 68%; K 44%; Mg 77%) and total N (43%) between 1970 and 1990 (Knoepp and Swank, 1994, 1997). Construction of nutrient budgets showed that these aggrading forests sequestered up to 50% of the nutrients aboveground, the rest was lost from the site via leaching to stream water. Along with the decrease in soil nutrients we measured an increase in forest floor mass of 2100 kg ha-' in the hardwood watershed and 5600 kg ha-' in the white pine plantation. However, because forest floor nutrient concentration decreased, there was no change in the total nutrient content in the hardwood watershed, 99 versus 93 kg Ca ha-'. Forest floor nutrients decreased in the white pine watershed from 92 to 81 kg Ca ha-' in 1970 and 1990, respectively. We hypothesized that the forest floor mass increase resulted from decreased rates of litter decomposition because of decreased litter quality, the result of decreased soil nutrient availability.
At a similar time to the initial soil sampling of the Knoepp and Swank (1994) study (1969 and 1970) Kermit Cromack measured decomposition rates of foliage from five tree species common to the Coweeta basin (Cromack and Monk, 1975). They used four hardwood species in WS 18, Quercus prinus L., Acer rubrum L., Quercus alba L., and Cornus florida L., and one in WS 17, Pinus strobus L. Our objective was to repeat Cromack's experiment in these watersheds using the same methods to examine long-term changes in decomposition and nutrient release rates comparing 1969 and 1970 to 1992 and 1993. We hypothesized that decomposition rates decreased over this time period, resulting in the increased forest floor mass
measured in the soil resampling study (Knoepp and Swank, 1994). In addition, we examined microar- thropod populations associated with the different litter species to determine potential relationships between decay rates and forest floor microarthropods. This information will be useful in predicting the effects of changes in nutrient pools and overstory species composition on microarthropod biodiversity.
2. Methods
2.1. Site description
This study was conducted at the Coweeta Hydro- logic Laboratory, a 2180-ha USDA Forest Service facility in the southern Appalachians of western North Carolina, USA. Annual precipitation is 1900 mm with most months receiving at least 100 mm. The growing season extends from early May to early October. Mean monthly temperatures are highest in June through August (20 "C) and lowest in December through January (5 "C). Our study was within two Coweeta basin watersheds. Watershed 18 (WS 18) is a 13-ha north-facing reference watershed dominated by mixed oak hardwood vegetation; no forest management has been conducted there since the late 1920s. Watershed 17 (WS 17), a 13-ha north-facing watershed, was part of a water yield experiment and was clearcut repeatedly from 1940 to 1955; no materials were removed. In 1956, a white pine (Pinus strobus) plantation was established on WS 17 (Swank and Crossley, 1988).
2.2. Litter decomposition measurements
We repeated Cromack's 1969 and 1970 (70s) litter decomposition study (Cromack and Monk, 1975) in 1992 and 1993 (90s) using the same tree species; Quercusprinus L. (chestnut oak, CO), Acer rubrum L. (red maple, RM), Quercus alba L. (white oak, WO), CornusJlorida L. (dogwood, DW), and Pinus strobus L. (white pine, WP). We used the same plot locations and methodology. From September through Novem- ber 1992 and 1993 we collected freshly fallen leaf litter by species from several large areas of WS 18 and WS 17. Litter was air dried and mixed thoroughly to ensure minimal variability among subsamples. We put

J.D. Knoepp et ul. /Forest Ecology and Management 220 (2005) 300-312 303
approximately 2.5 g of hardwood litter and 5.0 g of white pine litter (exact weight recorded) in 10 cm2; 1- mm mesh fiberglass screen litterbags (Crossley and Hoglund, 1962) and tagged each with an identifying number. We randomly selected four subsamples, and dried them at 50 "C to determine the ratio of air-dried to oven-dried weight, and for initial chemical analysis.
Hardwood leaf litterbags were placed in a grid pattern (0.5 m apart, randomized by species and collection date) in three locations (lower, middle, and upper portion) within WS 18. Similarly, we placed WP leaf litterbags within WS 17. Litterbag installation occurred on December 17, 1992, and December 14, 1993, placing 15 and 19 litterbags of each species in each location in 1992 and 1993, respectively. One litterbag of each species was randomly collected from each grid location, lower, middle, and upper, every 27- 35 days in 1992 (1 3 total collections) and every 25-56 days in 1993 (1 8 total collections)-shorter intervals in the summer and longer intervals in the dormant season. We collected all remaining litterbags at the final collection date. Total length of the decomposition study was 394 days in 1992 (final collection January 1994) and 7 10 days in 1993 (final collection November 1995).
2.3. Collection and chemical analyses
We collected litterbags from the field, returned them to the laboratory, and refrigerated at 4 "C. Following microarthropod extraction (described below), litterbags were oven dried at 50 "C, removed from the mesh bags, and weighed. Oven-dried samples were ground using a Wiley mill with a 2-mm mesh for chemical analysis. Material was muffled (480 "C) and digested in a solution of 20% nitric acid. Both 70s and 90s sample analyses were conducted using the same nitric acid digestion procedure. In 70s nitric acid-digested samples were analyzed using direct-reading spark-emission spectroscopy for Ca, K, and Mg; P was determined colorimetrically on an autoanalyzer. Total N was determined using micro-Kjeldahl digestion technique (Cromack and Monk, 1975). In 90s, nitric acid digests were analyzed for Ca, K, and Mg using atomic absorption spectroscopy (Perkin-Elmer 300), P was determined colorimetrically, and total N and C were determined by combustion using a Perkin-Elmer 2400 CHN analyzer. In 90s ashed samples were weighed after muffling to determine ash free dry weight (AFDW).
We applied an exponential decay equation (ln(fina1 weightlinitial weight) = -kt) (Olson, 1963) to data from all plots and both years to determine a single decay constant (k) for 1 year, for each species using the regression procedure of SAS (SAS, 2000). Comparisons between 70s and 90s data were based on 1 year of litter decay 365 f 13 days; actual portion of a year was used for calculations. White pine decay rates were based on 10 months of litter decay due to missing data points in the archived 70s dataset. We also used this approach with nutrient concentrations (kg g-') to determine nutrient release rates during decomposition in the two studies. We calculated decay rates for each litter species for 90s only using AFDW.
2.4. Microarthropods
At each collection date litterbags were collected, returned to the laboratory, and refrigerated at 4 "C. The next day, we placed the litterbags on Berlese funnels for microarthropod extraction. Microarthropod samples were stored in 100% EtOH until processed. Micro- arthropod populations were determined in litterbags collected after 9-12 months of decomposition for the 1992 (n = 19) and 1993 (n = 7) decomposition study. Microarthropods were separated into the following groups: Collembola, mature oribatid, immature oriba- tid, mesostigamatid, and prostigmatid mites. Total microarthropod population in each litterbag also was determined. Microarthropod abundances were deter- mined as the number of animals per gram dry litter. We calculated populations per gram litter AFDW for analysis of microarthropods relationship with litter nutrient concentrations.
2.5. Statistical analysis
Significant differences between calculated decay rates and nutrient release rates for 70s and 90s data sets were determined using a paired t-test comparison. We computed the standard deviation of the difference (S.D.die) for 70s and 90s decay rates using the standard error (S.E.) for k-values of each species computed by SAS (S.E. = sqrt(s.~.:, + S.E.&~)); setting t = 1.671 for probability < 0.05 with 62 d.f. (S.D.diff= S.E. * 1.671). Differences between the 70s and 90s decay rates and nutrient release rates greater than

304 J.D. Knoepp et al. /Forest Ecology and Management 220 (2005) 300-312
S.Dmdiff are significant. We used the same method to determine significant differences among decay rates on an AFDW basis of litter species in 90s.
The archived 70s data set did not allow us to compute standard errors for initial nutrient concentrations. We estimated the S.E.70s using the proportion of S.E.90s to mean initial nutrient concentrations. We computed S.D.difl, using S.E. * 2.13 1 (probability < 0.05, d.f. = 4) for a t-test as described above. Differences in nutrient concentrations between 70s and 90s greater than t-value are significant.
Microarthropod abundance values were not nor- mally distributed, we used Generalized Linear Models (GLIM) in the Genmod Procedure of SAS (SAS Systems for Windows, 8e (SAS, 2000)), using Poisson distributions and log link functions (Littell et al., 2002). We examined the relationship between litter nutrient concentration and microarthropod popula- tions per gram AFDW data with the Stepwise Procedure of SAS (SAS, 1985). Default settings of Stepwise were used; the final model is presented for relationships identified with a probability of a value greater than F 5 0.05.
3. Results and discussion
3. I. Litter decomposition rates
One-year decay rates for chestnut oak (CO), dogwood (DW), red maple (RM), and white pine (WP) did not differ significantly for measurements conducted in 70s and in 90s (Table 1). White oak litter decay rates decreased significantly from k = 0.68 in 70s to k = 0.54 in 90s. At both measurement periods DW exhibited the greatest decay rate, k = 1.26 in both 70s and 90s. Lowest decay rates occurred in WP, k = 0.55 in 70s and k = 0.49 in 90s. For all species, we examined variation in decay rates between years within a study period. We found decay rates in the 70s study were very similar; rates varied between 8 and 19% for all species and differences were greatest for the species with the lowest decay rate. Variation between years was greater for the 90s study period, ranging from 8 to 32%. Again, differences between years were least for rapidly decomposing species (8% for D) and greatest for the slow decomposers (25,25, and 32% for WO, WP, and CO).
Table 1 One-year decay rates for four deciduous (chestnut oak, CO; dog- wood, D; red maple, RM; white oak, WO) and one conifer (white pine, WP) species
Leaf species CROMACK (69 and 70) KNOEPP (92 and 93) CO 0.58 (0.03) 0.53 (0.03) D 1.26 (0.03) 1.26 (0.03) RM 0.84 (0.03) 0.87 (0.03) WO 0.68 (0.03) 0.54 (0.03)* WP 0.55 (0.04) 0.49 (0.02)
k values where ln(initia1 weightfinal weight) = kt, t = time in por- tion of year. Decay rates based on 1 year (365 f 13 days). WP decay rate based on 300 days of decomposition. Values in parentheses are standard error of the regression equation.
* Significant difference between 69 and 70 and 92 and 93 based on a paired t-test comparison (p < 0.05, d.f. = 62).
We examined climatic differences between 70s and 90s and also between years at each period for insights into regulation of decay rates during these two studies. There were no differences in mean annual temperature between the two study periods. In both 70s and 90s studies, average annual air temperature was within 0.3 "C of the 69-year average temperature at the main climate station of Coweeta Hydrologic Lab (Fig. I). Average growing season temperatures for 70s and 90s were within 0.8 "C of the long-term average. In contrast, precipitation patterns varied both between and within the studies (Fig. 2). Total rainfall varied in summer and fall, the two periods with highest tempera- tures and maximum decomposition rates. Summer
25, 1
Average
Q $
0
1 v
Month
Fig. 1. Mean monthly temperature ("C) at Coweeta Hydrologic Laboratory main climatic station during litter decomposition studies initiated in 1969, 1970, 1992, and 1993; also shown is the 69-year average monthly temperature.

J.D. Knoepp et al. /Forest Ecology and Management 220 (2005) 300-312 305
@
69-yr Average
Winter Spring Summer Fall
Fig. 2. Total seasonal precipitation (cm) at Coweeta Hydrologic Laboratory main climatic station during litter decomposition studies initiated in 1969, 1970, 1992, and 1993; also shown is the 69-year average seasonal precipitation.
rainfall at Coweeta averages 41 cm. During the two summers in the 70s litterbag study, total rainfall was 6 and 3 cm greater than average. The 90s summers were more extreme; total summer rainfall was 2 1 cm below average 1 year and 26 cm above average the next. The differences in rainfall, and resulting differences in soil moisture availability, between the 2 years may help explain differences in decay rates. Fall rainfall showed less variation; 70s study years had a 26% increase and 14% decrease in rainfall; in 90s there was a 15%
increase and a 2% decrease. This variation did not appear to affect decomposition patterns.
Some research has suggested that litterbag studies are useful as indices but are not absolute decay rates. Blair and others (1990) examined the litterbag method, comparing single species and mixed species litterbags to determine if measured decomposition rates accu- rately estimate nutrient release or accumulation from forest litter. They found that single species litterbags may underestimate decay rates and nutrient release or accumulation from decomposing litter. Pillers and Stuart (1993) compared litterbag decay and a mass balance approach to calculate decomposition rates in interior and coastal redwood stands in California. They found that each method identified a different site as having the maximum rates of forest floor turnover. The mass balance method was significantly correlated with environmental conditions (summer relative humidity, I temperature, vapor-pressure deficit, and litter moist- ure); the litter bag method was not. i 3.2. Nutrient concentration and release
We measured significant changes in nutrient release patterns from litter during the first year of decomposition between 70s and 90s (Table 2). Phosphorus release decreased significantly in all five species measured (Table 2 and Fig. 3). White oak and
Table 2 Rate of nutrient release (positive value) or accumulation (negative value) during litterbag decomposition for four deciduous (chestnut oak, CO; dogwood, D; red maple, RM; white oak, WO) and one conifer (white pine, WP) species
Leaf species P N Ca Mg K
69 and 70 92 and 93 69 and 70 92 and 93 69 and 70 92 and 93 69 and 70 92 and 93 69 and 70 92 and 93
CO 0.47 -0.14* 0.06 -0.00 0.20 0.15 0.9 1 0.74 1.65 1.36* (0.05) (0.05) (0.07) (0.03) (0.07) (0.05) (0.12) (0.07) (0.13) (0.09)
Rates shown are k values where In(initia1 nutrient contentlfinal nutrient content) = kr, r = time in portion of year. Decay rates based on 1 year (365 f 13 days). WP decay rate is based on 300 days of decomposition. Values in parentheses are standard error of the regression equation.
* Significant difference (d.f. = 62; p < 0.05) between 69 and 70 and 92 and 93 based on a paired t-test comparison.

306 J. D. Knoepp et al. /Forest Ecology and Management 220 (2005) 300-312
0.00 0.25 0.50 0.75 1.00
Year in the Field
Fig. 3. Proportion original P remaining (final P g original P g-l) in decomposing litter over time in the field for Quercus prinus (A), CornusJlorida (B) , Acer rubrum (C), Quercus alba (D), and Pinus strobus (E) at Coweeta Hydrologic Laboratory. Values represent mean for each collection. Error bars represent standard errors of the mean.
whereas K release is a physical process. Blair (1988a) measured the release of cations from decomposing litter on a south-facing hardwood watershed in the Coweeta basin using three of the species we used; D, RM, and CO. His results were similar to ours, with the greatest Ca, Mg, and K release from DW followed by RM then CO (Table 2). In another Coweeta study, Heneghan et al. (1999) compared decomposition rates of CO in the tropics and in the temperate Coweeta basin. He found that although decomposition rates were greater for CO placed in the tropical location, litter at both sites had the same N concentration when 50% of the initial litter remained.
Comparison of litter nutrient concentrations before placement in the field showed that in many instances, initial nutrient concentrations were significantly lower in 90s compared to the 70s sample period (Table 3). In most cases these lower initial concentrations coincide with the reduction in nutrient release rates presented above. Initial P concentrations were significantly lower for all five-leaf species in 90s compared to 70s. Dogwood and WP litter also had lower concentrations of N and Ca. White oak litter also decreased in Ca concentrations. The decrease in litter nutrient con- centrations coincided with a decrease in soil nutrient content on WS 18 and WS 17 during a similar 20-year period, 1970 to 1990 (Knoepp and Swank, 1994; Knoepp and Swank, 1997). The cations Ca, K, and Mg, as well as total N decreased significantly in both the A and AB horizons in WS 18. Concentrations also decreased in the A horizon of WS 17, but not in the AB horizon. Initial soil concentrations in WS 17 were
WP released P at very low rates in 90s compared to much greater in 1970, because of the watershed level 70s. However, RO and CO shifted from releasing P in treatment during a water use experiment in which all 70s to either retaining or accumulating P in 90s. vegetation was cut, and left in place in most years Release of Ca changed significantly between 70s and between 1942 and 1955 (Swank and Crossley, 1988). 90s, decreasing for D, and WO but increasing for RM. Aerts and De Caluwe (1997) examined the effects Patterns of N release changed significantly for DW and of variation in leaf litter chemistry on decomposition WP; DW released significantly less N in 70s compared and nutrient release using field-grown litter from low to 90s, release rates increased for WP. N and high N sites. Decomposition rates were not
Nutrient release from decomposing litter may always greater for the high N species of litter. indicate nutrient limitations in either the decomposing However, increased nutrient content of a single litter material or the site. Laskowski et al. (1995) examined species decreased the immobilization of N and P, changes in nutrient content during decomposition and increasing nutrient release rates. Combining the 70s found nutrient release and retention were driven by and 90s data also shows this pattern. The decrease in biological, physical, and chemical processes. Of the initial litter nutrient concentration resulted in a lower nutrients we measured, they identified changes in N, rate of nutrient release from each species. This pattern Ca, and Mg, as being regulated by biological processes was observed among species within the 90s studies;

J.D. Knoepp et al. /Forest Ecology and Management 220 (2005) 300-312
Table 3 Initial nutrient concentration (bg g-') of leaf litter; before placement in the field
Leaf species P (kg g-') N (kg g-'1 Ca (kg g-') Mg (PE g-') K (kg g-')
69 and 70 92 and 93 69 and 70 92 and 93 69 and 70 92 and 93 69 and 70 92 and 93 69 and 70 92 and 93
Values shown are 69 and 70 means of calculated values for all litterbags collected and 92 and 93 means of four initial litterbag samples selected at random. Values in parentheses are standard errors of the mean.
* Significant difference between 69 and 70 and 92 and 93 means based on a t-test (d.f. = 4; r = 2.132; p < 0.05).
DW had the greatest N and P concentration and the greatest rate of N and P release during decomposition. However, in 70s data the pattern did not hold. WP had the greatest and WO the least initial P concentration, yet WO had one of the greatest and WP the least P release rates during decomposition. Bockheim et al. (1 99 1) examined release of 12 elements during decomposition of litter from one conifer and three deciduous species in northern Wisconsin. They found that all species tested showed increases in N, Ca, S, Zn, Mn, Fe, Cu, and A1 during the first year of decomposition; P, K, Mg, and B decreased. This differs from our 70s data, in which RM and WP retained N and only WP retained P. All other litter species released Ca, P, N, Mg, and K (Table 2). However, the 90s results were similar to Bockheim's
species, but numbers differed significantly among collection months. In contrast, the 1993 data showed that total populations differed among both litter species and collection month. Mesostigmatid, mature oribatid, and immature oribatid mites differed significantly among litter species in 1992 (Table 4). There were also significant differences in mesostig- matid and immature oribatid mite abundances among
Table 4 Likelihood of significant differences in microarthropod populations among litter species
Organism Year Log-likelihood X 2 P
Prostigmata 1992" 123.62 22.16 0.0358 Prostigmata 1993 77.94 4.94 0.2933 Mesostigmata 1992 121.45 10.34 0.0376
study, only DW released both N and P and WP had a N release rate of 0.1 1. Calcium, Mg, and K were released during the first year of decomposition for all species with few significant differences from 70s. Blair (1988b) studied changes in nutrient concentrations of D, RM, and CO during 2 years of decomposition on a south- facing reference watershed at Coweeta. Similarly, he found that only dogwood released P by the end of the study.
u
Mesostigmata 1993 172.19 21.04 0.0003 Mature oribatids 1992 222.23 21.93 0.0002 Mature oribatids 1993 137.02 2.57 0.6317 Immature oribatids 1992 239.9 17.27 0.0017 Immature oribatids 1993 246.66 12.25 0.0156 Collembola 1 9 9 2 ~ 54.79 15.02 0.0018 Collembola 1993 200.52 4.19 0.3815
Data analyzed (using Proc GENMOD) were total numbers of microarthropods per three replicates for each litter species per collection date. Dates collected were September, October, Novem- ber, and December in 1993 and September, October, and December in 1994. Litter species were red maple, dogwood, chestnut oak, white oak, and white pine (d.f. = 4).
" Not significant, because date x species was significant. Convergence not attained for at least one side of profile like-
lihood; many samples in October had no collembola in them.
3.3. Microarthropods
Comparison of total microarthropod populations in 1992 showed no significant differences among litter

308 J.D. Knoepp et ul./Forest Ecology and Management 220 (2005) 300-312
Fig. 4. Mean number of mature Collembola (A), mesostigmatid mites (B), immature oribatid mites (C), and oribatid mites (D), for 1992 and 1993 litterbag studies at Coweeta Hydrologic Laboratory. Data presented are mean number of microarthropods per gram oven dry litter; error bars represent standard error of the mean. Error bars are included for visual reference; because data were not normally distributed, they were analyzed using non-parametric procedures.
litter species in the 1993 collections (Table 4). Populations of prostigmatid mites and Collembola showed no significant differences among litter species in either 1992 or 1993 (Table 4). On the other hand, Collembola was the only population of microarthro- pod that differed significantly between the 1992 and 1993 sample years (Fig. 4A). In 1992, greater numbers of mesostigmatid mites were found in RM and DW litter than in other species (Fig. 4B). Mature oribatid mite numbers were greatest in WP (Fig. 4D) and immature oribatids were most abundant in RM (Fig. 4C). In 1993, mesostigmatids were found in low numbers in WO and WP (Fig. 4B). Mature oribatids were most abundant in DW and WP litter, and immature oribatids were again most abundant in RM. Although these associations are interesting, their significance in relation to forest floor decomposition
rates is tenuous. Forest floor litter in these mixed hardwood ecosystems is typically representative of species. Research has shown that microarthropods more effectively utilize mixed litter (Kaneko and Salamanca, 1999; Seastedt, 1984), probably because of increased habitat heterogeneity. This question deserves further study, as most quantitative litterbag decomposition studies continue to use a single species of litter with a few exceptions (Blair et al., 1990; Kaneko and Salamanca, 1999; Reynolds et al., 2003). We found no differences in Collembola populations among different litter species (Fig. 4A). This contra- dicts results reported by Reynolds (1976), who found Collembola abundances varied with litter species at Coweeta. However, those data were not collected over a full year and thus did not include fall and winter. Average numbers of Collembola per litter species in

J.D. Knoepp et al. /Forest Ecology and Management 220 (2005) 3610-312 309
1992 were less than half those of the 1993 collections (Fig. 4a), and many October 1992 samples had no Collembola. This may reflect the lack of moisture; summer 1992 had a 20-cm rainfall deficit (Fig. 2), and historically October has the lowest average rainfall of any month at Coweeta. Reynolds (1976) found a high correlation between precipitation in the 36-h period preceding litterbag collections and numbers of Collembola. Pflug and Wolters (2001) also reported decreased Collembola abundance in drought-stressed litter. Although Collembola numbers increased for our 1993 collections, we still had no significant differ- ences in Collembola numbers among litter species. However, inspection of the data certainly indicate a trend similar to that reported by Reynolds (1976), with greater Collembola numbers occurring in more rapidly decomposing litter - RM and D - and fewest numbers in WO.
We explored the relationships between litter nutrient concentrations (total N, C:N ratios, P, K, Mg, and Ca) and microarthropod populations, using a stepwise regression analysis (Table 5). Generally, there were more significant relationships between microarthropod populations and litter nutrients in
1992, when moisture was more limiting than in 1993. Most correlations were negative, suggesting either that populations increased as decay proceeded, or that fungal populations, that support most microarthro- pods, decreased as nutrient concentrations increase. Collembola populations were correlated with nutrient concentrations of WO and WP only in 1992, while nutrient concentrations and oribatid mite populations were related in all litter species in 1992 (Table 5). For litter types most resistant to decomposition, CO, WO, and WP, populations were often related to C:N ratio and N. In the more readily decomposing DW and RM litters we found oribatid mites were related to P and Mg, respectively. The immature oribatids showed few significant relationships in either 1992 or 1993. The response difference between the two age classes may be related to avoidance of competition within the same taxon. The prostigmatids show nutrient relationships only in the litter species most resistant to decay-CO, WO, and WP. Relationships for other mite suborders and litter nutrients are difficult to interpret.
Seastedt (1 984), surveyed microarthropod impacts on litter nutrient concentrations and found highly variable effects. Relationships depended on such
Table 5 Relationship for 1992 and 1993 litter decay studies between microarthropod populations (#/g afdw) in collected litterbags and nutrient concentrations (ugtg afdw) for the final regression model selected by the Stepwise Procedure of SAS
Organism Year Leaf species - --
CO D RM WO WP
Collembola 1992 Mg, C:N, C:N, N, K (+), P, 1993 0.53 (<0.01) 0.76 (<0.01)
Oribatid mites 1992 C:N, P+, 0.36 (0.01) Mg, 0.30 (0.02) N, 0.26 (0.03) C:N, N, 0.38 (0.01) 1993 0.30 (0.01) N (+I, C:N (+I, P (+), C:N, 0.94 (<0.01)
0.90 (<0.01)
Immature oribatids 1992 1993
Ca, 0.21 (0.05) Mg, 0.22 (0.04) K, 0.78 (<0.01)
Prostigmatids 1992 CN (+), K (+), N, C:N, 0.21 (0.04) 0.57 (~0 .01)
1993 K (+), 0.55 (0.04) Mg (+), Ca, K (+), 0.95 (0.02)
Mesostigmatids 1992 K (+), C:N, 0.31 (0.04) 1993 P (+I, C:N, Mg,
N, 0.99 (~0 .01) Total 1992 Mg, 0.26 (0.03) C:N, N, 0.37 (0.02)
microarthropods 1993 K, 0.68 (0.02)
All data available were included in the models with n = 19 or 21 in 1992 and n = 7 for 1993. Shown are the nutrients included in the final stepwise model (variables with a positive relationship are designated (+) all others are negative), the final model 3 and the probability of a value greater than F. Data shown are those in which a relationship was identified and the probability of a value greater than F 5 0.05; other data are omitted.

310 J.D. Knorpp er ul. /Forest Ecology and Munagernen? 220 (2005) 300-312
factors as microbial affinities for particular nutrients and the form and amount of nutrients entering the litter from outside sources, such as throughfall. Given the wide variation in precipitation between the 2 years of our study, it is not surprising that the relationships between microarthropods and litter nutrients differed between the 2-years. Microbial biomass, including fungi, has been shown to significantly decrease with drought (Pflug and Wolters, 2001). Hasegawa and Takeda (1996) also reported drought in the first year of their study, with corresponding decreases in micro- arthropod populations during dry months. Most microarthropods feed on fungi; however, different collembolan species, may prefer different fungal species (Addison et al., 2003; Klironomos et al., 1992; Lussenhop, 1992). At our level of taxonomic resolution, we cannot tease apart some of the specific relations between particular microarthropod species and litter nutrients. This suggests that our population data may reflect a drought response with low numbers of Collembola in 1992 compared to 1993.
We found negative relationships between C:N ratios and Collembola, prostigmatids, mesostigmatids, and mature oribatids in both years. This is similar to results reported by Hasegawa and Takeda (1996) for pine needles with high C:N ratio and low litter quality. The C:N ratios decline during decomposition due to microbial respiration and N becomes increasingly available to the microbial biomass necessary to support microarthropods. The negative relationship between N concentrations and microarthropods in some instances is surprising. It may reflect the shift from N immobilization in earlier stages of decom- position to N release which could be conflated because of our lumping of the fall and early winter population data. Also, as Filser (2002) noted, correlations between Collembola and total C and N are usually weak under field conditions. They suggest that Collembola (and other microarthropods) responses to litter nutrients are indirect, because they are mediated by microbial population responses to litter nutrient concentrations and other parameters, such as temperature, moisture, litter species, and interactions with other soil biota.
Relationships between microarthropods and other nutrients (P, K, Mg, and Ca) were variable making any general conclusions impossible. The role of nutrients in litter colonization by microarthropods was
reviewed by Seastedt (1984). He reported significant positive relationships between P and microarthropod populations in some studies and no relationship in others. He concluded that population control by K are rare because significant amounts of K can enter the litter system from precipitation and throughfall (Seastedt, 1984).
4. Conclusions
Data show no significant changes in first-year decomposition rates between the 70s and 90s studies. However, significant changes in initial litter nutrient concentrations and nutrient release patterns in the 90s suggest that long-term decomposition rates may be limited by nutrient availability. The long-term forest floor accumulation measured in a previous study could be the result of nutrient limitations. Microarthropod populations measured in the 90s varied with leaf species, resource availability, and rainfall. There were significant negative relationships between microar- thropods and C:N in some litter species. Relationships differed between years, probably because of differ- ences in precipitation. Microarthropod responses to nutrients are difficult to interpret because they are mostly indirect based on relationships with microbes, other soil biota, and numerous abiotic factors. However, data suggest that changes in forest floor nutrient content and nutrient release patterns may impact populations.
Acknowledgements
The USDA Forest Service funded this research project. We extend our thanks to Lee R. Reynolds for expert field and lab assistance and Anne E. Chesky for microarthropod enumeration.
References
Addison, J.A., Trofymow, J.A., Marshall, V.G., 2003. Functional role of Collembola in successional coastal temperate forests on Vancouver Island, Canada. Appl. Soil Ecol. 24, 247-261.
Aerts, R., De Caluwe, H., 1997. Nutritional and plant-mediated controls on leaf litter decomposition of Carex species. Ecology 78, 244-260.

J. D. Knoepp et al. /Forest Ecology and Management 220 (2005) 300-31 2 31 1
Berg, B., Meentemeyer, V., 2002. Litter quality in a north Eur- opean transect versus carbon storage potential. Plant Soil 242, 83-92.
Berg, B., Johansson, M., Meentemeyer, V., 2000. Litter decomposi- tion in a transect of Norway spruce forests: substrate quality and climate control. Can. J. For. Res. 30, 1136-1 147.
Blair, J., Parmelee, R., Beare, M., 1990. Decay rates, nitrogen fluxes, and decomposer communities of single- and mixed-species foliar litter. Ecology 7 1, 1976-1985.
Blair, J.M., 1988a. Nutrient release from decomposing foliar litter of three tree species with special reference to calcium, magnesium, and potassium dynamics. Plant Soil 1 10, 49-55.
Blair, J.M., 1988b. Nitrogen, sulfur, and phosphorus dynamics in decomposing deciduous leaf litter in the southern Appalachians. Soil Biol. Biochem. 20 .
Bockheim, J.G., Jepsen, E.A., Heisey, D.M., 1991. Nutrient dynamics in decomposing leaf litter of four tree species on a sandy soil in northwestern Wisconsin. Can. J. For. Res. 21,803- 812.
Cole, D., 1995. Soil nutrient supply in natural and managed forests. Plant Soil 168-169, 43-53.
Covington, W.W., 1981. Changes in forest floor organic matter and nutrient following clear cutting in northern hardwoods. Ecology 62, 41-48.
Cromack, J.K., Monk, C.D., 1975. Litter production, decomposi- tion, and nutrient cycling in a mixed hardwood watershed and a white pine watershed. In: Howell, F.G., Gentry, J.B., Smith, M.H. (Eds.), Proceedings of the Mineral Cycling in Southeastern Ecosystems. US Energy Research and Development Adminis- tration, Augusta, GA, pp. 609-624.
Crossley, D.A., Hoglund, M.P., 1962. Litter-bag method for study of microarthropods inhabiting leaf litter. Ecology 43, 571-573.
Federer, C.A., 1984. Organic matter and nitrogen content of the forest floor in even-aged northern hardwoods. Can. J. For. Res. 14,763-767.
Filser, J., 2002. The role of Collembola in carbon and nitrogen cycling in soil. Pedobiologia 46, 234-245.
Grigal, D.F., Ohmann, L.H., 1989. Spatial patterns in elemental concentrations of the forest floor across the North Central USA. J. Environ. Qual. 18, 368-373.
Hasegawa, M., Takeda, H., 1996. Carbon and nutrient dynamics in decomposing pine needle in relation to fungal and faunal abundances. Pedobiologia 40, 17 1-184.
Heneghan, L., Coleman, D.C., Crossley, D.A., Zou, X.M., 1999. Nitrogen dynamics in decomposing chestnut oak (Quercus prinus L.) in mesic temperate and tropical forest. Appl. Soil Ecol. 13, 169-175.
Homsby, D., Lockaby, B., Chappelka, A., 1995. Influence of microclimate on decomposition in loblolly pine stands: a field microcosm approach. Can. J. For. Res. 25, 1570-1577.
Johansson, M., 1994. Decomposition rates of Scots pine needle litter related to site properties, litter quality, and climate. Can. J. For. Res. 24, 1771-1781.
Johansson, M.-B., Berg, B., Meentemeyer, V., 1995. Litter mass-loss rates in late stages of decomposition in a climatic transect of pine forests: long-term decomposition in Scots pine forest. Can. J. Bot. 24, 1771-1781.
Kaneko, N., Salamanca, E.R., 1999. Mixed leaf litter effects on decomposition rates and soil microarthropod communities in an oak-pine stand in Japan. Ecol. Res. 14, 131-138.
Keenan, R.J., Prescott, C.E., Kimmins, J.P., Pastor, J., Dewey, B., 1996. Litter decomposition in western red cedar and western hemlock forests on northern Vancouver Island, British Colum- bia. Can. J. Bot. 74, 1626-1634.
Klironomos, J.N., Widden, P., Deslandes, I., 1992. Folsomia cani- didu in relation to microbial successions on decaying litter. Soil Biol. Biochem. 24, 685-692.
Knoepp, J.D., Swank, W.T., 1994. Long-term soil chemistry changes in aggrading forest ecosystems. Soil Sci. Soc. Am. J. 58, 325- 331.
Knoepp, J.D., Swank, W.T., 1997. Forest management effects on surface soil carbon and nitrogen. Soil Sci. Soc. Am. J. 61,928- 935.
Knoepp, J.D., Coleman, D.C., Crossley Jr., D.A., Clark, J.S., 2000. Biological indices of soil quality: an ecosystem case study of their use. For. Ecol. Manage. 138, 357-368.
Laskowski, R., Niklinska, M., Maryanski, M., 1995. The dynamics of chemical elements in forest litter. Ecology 76, 1393- 1406.
Littell, R.C., Stroup, W.W., Freund, R.J., 2002. SAS for Linear Models. SAS Institute, Inc., Cary, NC.
Lussenhop, J., 1992. Mechanisms of microarthropod-microbial interactions in soil. In: Begon, M., Fitter A.H. (Eds.), Advances in Ecological Research, pp. 1-33.
Melillo, J.M., Aber, J., Linkins, A.E., Ricca, A., Fry, B., Nadelhof- fer, K.J., 1989. Carbon and nitrogen dynamics along the decay continuum: plant litter to soil organic matter. In: Clarholm, M., Bergstrom, L. (Eds.), Ecology of Arable Land. Kluwer Aca- demic Publishers, pp. 53-62.
Monleon, V.J., Cromack Jr., K., 1996. Long-term effects of pre- scribed underburning on litter decomposition and nutrient release in ponderosa pine stands in central Oregon. For. Ecol. Manage. 81, 143-152.
Murphy, K.L., Klopatek, J.M., Klopatek, C.C., 1998. The effects of litter quality and climate on decomposition along an elevational gradient. Ecol. Appl. 8, 1061-107 1.
Olson, J.S., 1963. Energy-storage and balance of producers and decomposers in ecological-systems. Ecology 44, 322-33 1.
Perala, D.A., Alban D.H., 1982. Rates of forest floor decomposition and nutrient turnover in aspen, pine, and spruce stands on two soils. North Central Forest Experiment Station, Forest Service, U.S. Department of Agriculture, St. Paul, Minnesota, p. 5.
Pflug, A., Wolters, V., 2001. Influence of drought and litter age on Collembola communities. Eur. J. Soil Biol. 37, 305-308.
Pillers, M.D., Stuart, J.D., 1993. Leaf-litter accretion and decom- position in interior and coastal old-growth redwood stands. Can. J. For. Res. 23, 552-557.
Prescott, C.E., Mcdonald, M.A., Weetman, G.F., 1993. Availabil- ity of N and P in the forest floors of adjacent stands of western red cedar-western hemlock and western hemlock-amabilis fir on northern Vancouver island. Can. J. For. Res. 23, 605- 610.
Prescott, C.E., Maynard, D.G., Laiho, R., 2000. Humus in northern forests: friend or foe? For. Ecol. Manage. 133, 23-36.

312 J.D. Knorpp rt al. /Forest Ecology and Management 220 (2005) 300-312
Reynolds, B.C., Crossley, D.A., Hunter, M.D., 2003. Response of soil invertebrates to forest canopy inputs along a productivity gradient. Pedobiologia 47, 127-1 39.
Reynolds, L.J., 1976. Relative Abundance of Forest Floor Collem- bola as Influenced by Leaf Litter Decomposition Rates. Uni- versity of Georgia, Athens, GA.
SAS, I.I., 1985. SAS User's Guide: Statistics Version 5. SAS Institute Inc., Cary, NC, pp. 433-506.
SAS, I.I., 2000. SAS Version 8e, SAS Systems for Windows. SAS Institute Inc., Cary, NC.
Seastedt, T.R., 1984. The role of microarthropods in decomposition and mineralization processes. Ann. Rev. Entomol. 29. 25-46.
Stump, L.M., Binkley, D., 1993. Relationships between litter quality and nitrogen availability in rocky mountain forests. Can. J. For. Res. 23, 492-502.
Swank, W.T., Crossley Jr., D.A., 1988. Introduction and site descrip- tion. In: Swank, W.T., Crossley, Jr., D.A. (Eds.), Forest Hydrology and Ecology at Coweeta. Springer-Verlag, New York, p. 469.
Taylor, B.R., Parsons, W.F.J., Parkinson, D., 1989. Decomposition of Pup~~lus trein~loi~ies leaf litter accelerated by addition of Alnus crispcl litter. Can. J . For. Res. 19, 674-679.
Taylor, B.R., Prescott, C.E., Parsons, W.J.F., Parkinson, D., 1991. Substrate control of litter decomposition in four Rocky Moun- tain coniferous forests. Can. J. Bot. 69, 2242-2250.
Wang, G.G., Klinka, K., 1997. White spruce foliar nutrient con- centrations in relation to tree growth and soil nutrient amounts. For. Ecol. Manage. 98, 89-99.
Wardle, D.A., 2002. Communities and Ecosystems: Linking the Aboveground and Belowground Components. Princeton Uni- versity, Princeton, NJ, p. 400.