Delhi Technological UniversityDelhi Technological University
Upload
aldous-henryCategory
view
217download
5
LOGO
Experience of development and application of the optimization models for strategic planning in the power sector under the recent technological, economic and environmental challenges
Fedor VeselovAlla MakarovaAndery Khorshev
Seminar «Project for Kazakhstan energy system modeling: results and plans»
Kiev, May 16, 2012
Energy Research InstituteRussian Academy of Sciences

LOGOERI RAS – experience in system energy studies
Energy Research Institute RAS
Energy Research Institute of the Russian Academy of Sciences (ERI RAS) was established in 1985 for the fundamental studies in the area of national energy policy development and implementation:
state level - methodological, modeling and analytical support for the energy policy priorities and implementation mechanisms (incl. macroeconomic, technological, pricing, environmental and other aspects), quantitative elaboration of the economy and energy sector scenarios in the context of Energy Strategy
Ministry of Energy, Ministry of economic development, Ministry of natural resources, Federal Antimonopoly Service
corporate level – capacity building, modeling and information support of the strategic planning system of leading energy companies, justification of investment and market policy under the energy markets transformation processes
Gazprom, Gazexport, NovaTEK, Mezhregiongas, Wintershall, Roneft, TNK-ВР, SUEK, RAO EES Rossii, Rosenergoatom, Fortum

LOGOSCANER – multi-functional system of models for the investigation of the global and Russian energy sector development
Energy Research Institute RAS
«SCANER» is a tool for the system analysis of the Russian energy sector development for the mid- and long-term prospects (to 2030-50) as an important part of national economy and global energy markets. Integrating the powerful modeling and informational resources, SCANER provides:
Unique informational support to the analysis and forecasts (regularly updated databases on the national and regional economy, energy sector, energy balances and markets)
Multi-level co-ordination system of energy forecasts focused on the formulation of rational variants of the economy, energy sector and energy companies’ development
Huge flexibility and fast adaptation of the models and their calculation modes under the separate forecasting requirements

LOGO
Forecast of the financial feasibility by energy industries and companies
Forecast of the financial feasibility by energy industries and companies
Parameters of the global economy and energy sector development scenarios
Parameters of the global economy and energy sector development scenarios
Parameters of the Russian economy and energy sector development scenarios
Parameters of the Russian economy and energy sector development scenarios
Forecast of global energy markets development and
regulation environment
Forecast of global energy markets development and
regulation environment
Formulation of integrated target parameters for the
economy and energy sector development
Formulation of integrated target parameters for the
economy and energy sector development
National and regional forecast of the economic and technological development
National and regional forecast of the economic and technological development
National and regional fuel and energy demand forecast
with estimation of energy saving and efficiency
improvements
National and regional fuel and energy demand forecast
with estimation of energy saving and efficiency
improvements
Estimation of resources and
reserves for fuel supply industries
Estimation of resources and
reserves for fuel supply industries
Forecast of energy demand and prices by
countries
Forecast of energy demand and prices by
countries
Power sectorPower sector Oil and gas sector
Oil and gas sector Coal sectorCoal sector
Forecast of production and financial programs by energy industries
Forecast of production and financial programs by energy industries
Forecasted investment programs by energy
industries and companies
Forecasted investment programs by energy
industries and companies
Domestic fuel and energy prices’ forecast
Domestic fuel and energy prices’ forecast
National and regional energy balances
National and regional energy balances
Estimation of priorities for
new technologies
Estimation of priorities for
new technologies
Estimation of the impact of pricing and investment policy in energy
sector on the economy
Estimation of the impact of pricing and investment policy in energy
sector on the economy
Recommendations for the national energy policy improvements
Recommendations for the national energy policy improvements
Energy Research Institute RAS
SCANER – multi-functional system of models for the investigation of the global and Russian energy sector development

LOGO
Energy Research Institute RAS
Joint optimization of power sector structure with the gas and coal production and transportation system development provides opportunities:
• To form the core of the national and regional energy balances, incl. electricity, heat, gas and coal supply and demand.• To obtain the system of equilibrium wholesale prices by the regions of Russia on the basis of long-term fuel and electricity supply costs• To assess the long-term elasticity of fuel demand in electricity and heat production affected by the prices, cost and environmental factors
Power sector structure optimization as a part of national energy sector development
Fuel consumption at power plants and
boilers
Cond. Therm
alCHP
Boilers
Hydro, Nuclear,
RES
Other domestic
fuel consump-tion and export
Electricity demand
Heat demand
Gas balances
Fuel oil balances
Electricity and electric capacity balances
Centralized heat supply balances
Final energy demand
simulation models
Fuel demand models
Electricity demand model
Heat demand model
Steam coal balances
Gas production and
transportation
Fuel oil production and transportation
Coal production and
transportation
Oil sector development optimization
system
Coal sector development
simulation system
Gas sector development optimization
system
Fuel demand models
Electricity demand model
Heat demand model
Fuel demand models
Electricity demand model

LOGO
Capacity, electricity and heat production structure is formed under the optimization of capital and operational costs (or revenue requirement) of different types of investment alternatives (excl. distributed generation): life extension and rehabilitation of the existing capacities new CHP and/or boilers intersystem grid reinforcement new gas, coal and nuclear technologies renewable technologies
System assessment of the investment decisions is preformed under the uncertainities of: electricity and centralized heat demand fuel supply infrastructure development fuel pricing mechanisms (coat plus, netback of inter-fuel competition) GHG emission limitations and carbon prices Capital expenditure limitations
In the optimization model investment and production decisions are defined by the system of balances: electricity centralized heat (by types of towns and cities) installed capacity requirements (for peak and off-peak hour) fuel supply and demand
Production unit(regional electricity and
capacity balances
Investment unit(investment alternatives for the
existing and new plants)
Fuel supply unit(fuel demand, supply and
prices/ fuel balances)
Balance requirements and capacity additions
Variable fuel demand in the sector (incl. fuel substitution)
Power plant capacities
Distributed capital expenses for future additions
Fuel production and transportation capacities
Year T Year T+1Year T-1
Energy Research Institute RAS
Dynamic aspect and area of optimization (EPOS)
Dynamic links ensure to assess the efficiency of these decisions on the whole planning horizon (taking into account the 10-15 years end-effect in costs)

LOGO
Optimization and simulation models can operate with different regional detailing level of the Russian Unified Electricity System: 7 Integrated Power System 42 balancing zones based on the main grid congestions 29 Free Capacity Flow zones assigned by the System Operator for the competitive capacity market results are additionally detailed by the simulation model (ELIS) to the level of administrative units and converted in the form of regional electricity and centralized heat balances
Generating capacities are modeled with the different detailing: aggregated technologies: 10-15 types of existing and 15-30 types of new technologies power plants: over 400 existing plants and over 150 investment projects of repowering, brown- and green-field unit construction
600
2500
0
Belarus
Kola
Karelia
LeningradPskov
Novgorod
Finland
Kaliningrad
ОЭС Балтии
Tver
Vologda
Arkhangelsk Komi
Yaroslavl
Smolensk
KalugaTulaRyazan
Moscow
BryanskOryolKursk
BelgorodVoronezhTambovLipetsk
Ukraine
UlyanovskPenza
Mordvinia
Nizhny novgorod
KostromaIvanovoVladimir
VolgogradAstrakhanKalmykia
RostovStavropol
Karachayevo-cherkessiya
Kuban
Georgia
Kabardino-balkariaOsetia
ChechnyaIngushetiaDagestan
Azerbaijan
SaratovSamara
Mari ElChuvashia
KirovUdmurtiya
Tatarstan
Bashkortostan
Orenburg
Perm
Kazakhstan
ChelyabinskKurgan
Sverdlovsk
Tyumen
KhakassiaTyva
Omsk
Tomsk
NovosibirskAltayKuzbas
Krasnoyarsk Irkutsk
BuryatiaChita
Chita Amur Khabarovsk Primorskykray
Yuzhno-yakutskiy
energoregionSouth IPS
North-West IPS
Center IPS
Volga IPS
Ural IPS
Siberia IPS
Far East IPS
600
2500
0
Belarus
Kola
Karelia
LeningradPskov
Novgorod
Finland
Kaliningrad
ОЭС Балтии
Tver
Vologda
Arkhangelsk Komi
Yaroslavl
Smolensk
KalugaTulaRyazan
Moscow
BryanskOryolKursk
BelgorodVoronezhTambovLipetsk
Ukraine
UlyanovskPenza
Mordvinia
Nizhny novgorod
KostromaIvanovoVladimir
VolgogradAstrakhanKalmykia
RostovStavropol
Karachayevo-cherkessiya
Kuban
Georgia
Kabardino-balkariaOsetia
ChechnyaIngushetiaDagestan
Azerbaijan
SaratovSamara
Mari ElChuvashia
KirovUdmurtiya
Tatarstan
Bashkortostan
Orenburg
Perm
Kazakhstan
ChelyabinskKurgan
Sverdlovsk
Tyumen
KhakassiaTyva
Omsk
Tomsk
NovosibirskAltayKuzbas
Krasnoyarsk Irkutsk
BuryatiaChita
Chita Amur Khabarovsk Primorskykray
Yuzhno-yakutskiy
energoregion
600
2500
0
Belarus
Kola
Karelia
LeningradPskov
Novgorod
Finland
Kaliningrad
ОЭС Балтии
Tver
Vologda
Arkhangelsk Komi
Yaroslavl
Smolensk
KalugaTulaRyazan
Moscow
BryanskOryolKursk
BelgorodVoronezhTambovLipetsk
Ukraine
UlyanovskPenza
Mordvinia
Nizhny novgorod
KostromaIvanovoVladimir
VolgogradAstrakhanKalmykia
RostovStavropol
Karachayevo-cherkessiya
Kuban
Georgia
Kabardino-balkariaOsetia
ChechnyaIngushetiaDagestan
Azerbaijan
SaratovSamara
Mari ElChuvashia
KirovUdmurtiya
Tatarstan
Bashkortostan
Orenburg
Perm
Kazakhstan
ChelyabinskKurgan
Sverdlovsk
Tyumen
KhakassiaTyva
Omsk
Tomsk
NovosibirskAltayKuzbas
Krasnoyarsk Irkutsk
BuryatiaChita
Chita Amur Khabarovsk Primorskykray
Yuzhno-yakutskiy
energoregionSouth IPS
North-West IPS
Center IPS
Volga IPS
Ural IPS
Siberia IPS
Far East IPS
Energy Research Institute RAS
Technological and regional representation of the power sector (EPOS)
Free capacity flow zones (ZSPM)
Representation of the Unified Power System (UPS) by integrated power systems (IPS) and balancing zones

LOGO
Energy Research Institute RAS
Representation of power plant (i) operation modes (j)
Xit
Xi1t Xi2t … XiJtOperation modes
Installed capacity
Electricity production
Total fuel consumption
Fuel 1 consumption
Fuel N consumption
. . .
h1
b1*h1
11*b1*h1
…
N1*b1*h1
h2
b2*h2
12*b2*h2
…
N2*b2*h2
hJ
bJ*hJ
1J*bJ*hJ
…
NJ*bJ*hJ
…
Installed capacity requirements
Electricity supply/demand balance
Fuel 1 supply/demand balance
…Fuel N supply/demand balance
n nj = 1 for each fuel mix
LOGO
Energy Research Institute RAS
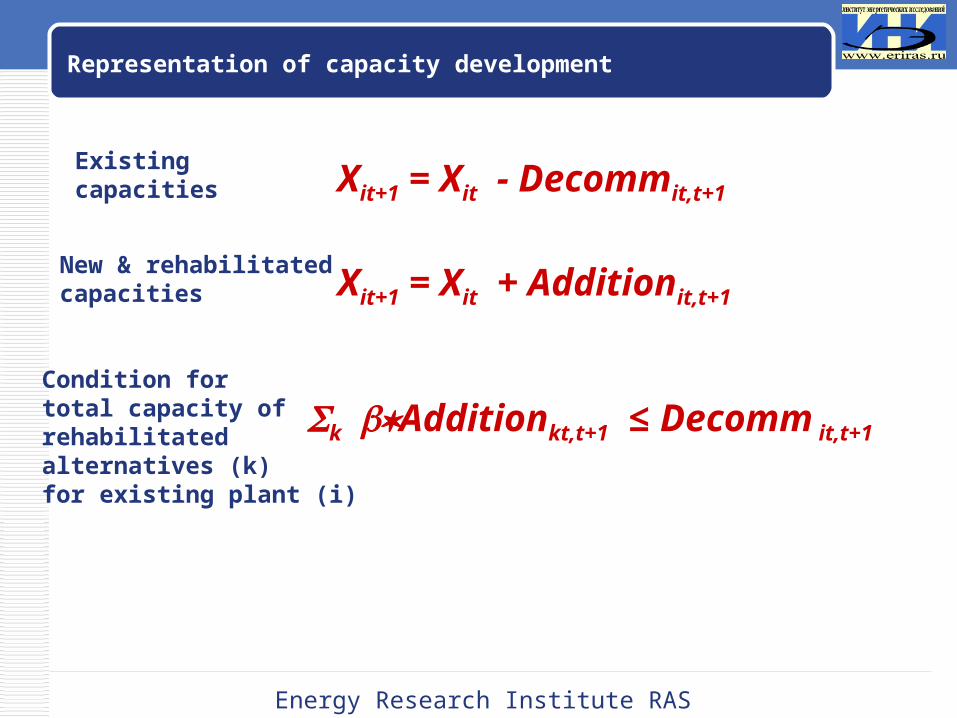
Representation of capacity development
Xit+1 = Xit - Decommit,t+1
Existing capacities
Xit+1 = Xit + Additionit,t+1
New & rehabilitated capacities
Condition for total capacity of rehabilitated alternatives (k) for existing plant (i)
kAdditionkt,t+1 ≤ Decomm it,t+1

LOGO
Energy Research Institute RAS
Capacity constraints
Matrix representation of plants in the system of capacity constraints
Coal CCGT Nuclear CHP Hydro pump strorage
GT (peak)
Wind
Electricity supply/demand balance 4,0-6,5 3,0-6,5 7,3-7,6 4,0-6,0 -0,25 0,5-1,5 0,2
Installed capacity requirement 1.0 1.0 1.0 1.0 1,0 1,0 -
Rated peak capacity requirement 0.912 0.898 0.907 0.91 1,0 1,0 -
Rated off-peak capacity requirement 0.456 0.449 0.907 0.783 -1,2 0 -
New peaking capacity requirement - - - - 1,0 1,0 -
Pmax
Pmin
NreqReserve margin
Installed capacity requirement
Nreq = Pmax + ReserveMargin
Rated capacity requirement for a peaking hour (max load requirement)
Rated capacity requirement for an off-peak hour (min load requirement)
Existing hydro and other peaking capacities
New peaking capacity requirement

LOGO
Energy Research Institute RAS
Representation of heat supply
Matrix representation of CHP capacity in the system of heat balances
Existing CHP
Rehab. of exist.
CHP
New CHP-1 New CHP-2
For class 1
For class 2
For class 3
For class 2
For class 3
Steam turbine
Comb cycle
Comb cycle
Comb cycle
Comb cycle
Gas turbine
Gas turbine
Heat balance for load class 1 0,2*8 0,2*5 5
Heat balance for load class 2 0,5*8 0,5*5 5 9
Heat balance for load class 3 0,3*8 0,3*5 5 9
Heat production in the area of existing CHP
8 6
• different heal load classes (separate balances)
• different set of heat supply alternatives (CHP and boiler technologies) for each heat load class
• heat supply alternatives can be used for different heat load classes, but with different heat distribution costs
• heat-driven rehabilitation for existing CHP – electricity is considered as by-product of the required heat production

LOGO
Energy Research Institute RAS
Analysis of dual solution
Primal LP task solutioncapacity and generation structure, supply/demand balances of all considered energy resources
Dual LP task solutionsystem of “shadow” prices of energy resources (electricity, capacity, heat, fuels)
Static LP task - short-term (spot) marginal pricingDynamic LP task - long-term (spot) marginal pricing
Post-optimization analysis of dual solution and “shadow” prices’ structure required the investigation of basic variables, their impact on matrix of LP task and cost function:
= cb B-1

LOGO
Energy Research Institute RAS
Modeling pricing rules at the energy markets
EPOS allows to investigate different pricing models for fuel industries and power sector based on the long-term marginal costs
Gas pricing model Source of marginal costs
Cost plus Gas fields and new pipelines
Netback Export routes and prices
Inter-fuel competition Gas substitution/saving in the power sector
Power plants operates at several markets with different pricing models
Product Pricing model EPOS representation of the market
Electricity Competitive + (Supply/demand balance)
Capacity Competitive + (Supply/demand balance)
Heat Regulated + (Supply/demand balance)Long-term efficiency of plant operation (revenues-costs) can be evaluated on the basis of variable reduced costs

LOGO
Knowledge baseLibrary of the formation methods
(modules) of the LP model matrix elements
LP taskMatrix and RHS coefficients of the
liner programming task
(# of equatuins – up to 150 000# of variables- up to 300 000
# of non-zero elements – up to 1 500 000)
Subject areaHierarchical stratified database
Operation and fuel supply modes
(~6500 variants of the capacity factor and fuel supply mix modes)
Equipment groups(~2500 groups of units with the
same equipment type and existing/new state)
Power plants (~600 existing and new
plants)
~ 80 regional systems
(RF administrative units)
Energy companies(22 GenCos, indep.
producers and utilities)
Generating technologies (~20 per region)
7 IPS (42 nodes, 29
free flow zones)
CountryIndustry
Linear Programming (LP) ModelDatabase of the mathematical
LP model coefficients(by LP matrix fragments and variants)
System of automatic formulation and information support of the optimization models and multi-case runs (EPOS family)
Energy Research Institute RAS
Automatization of interaction between post-relatinal and relational databases and an interface openess ensure the high flexibility and efficiency of new models and solution reports creation

LOGOTechnology of prompt matrix generation / transformation for EPOS family
Energy Research Institute RAS
Types of LP matrix transformation
• recalculation of coefficients (RHS) for existing variables (constraints) without changes of dimension
• simple changes of dimension without changes of the matrix structure - addition of variables (constraints) of existing types
• complex changes of dimension with the changes of the matrix structure - addition of variables (constraints) of new types
EPOS modeling system
Alternative algorithms for separate matrix coeffs, bounds and RHS calculation from initial input data
Free fragmentation of LP matrix elements in the database
Automatic assembling of the whole LP matrix from its fragments in the database
Opened for used and time saving technology will not require regular general
recalculations of input data
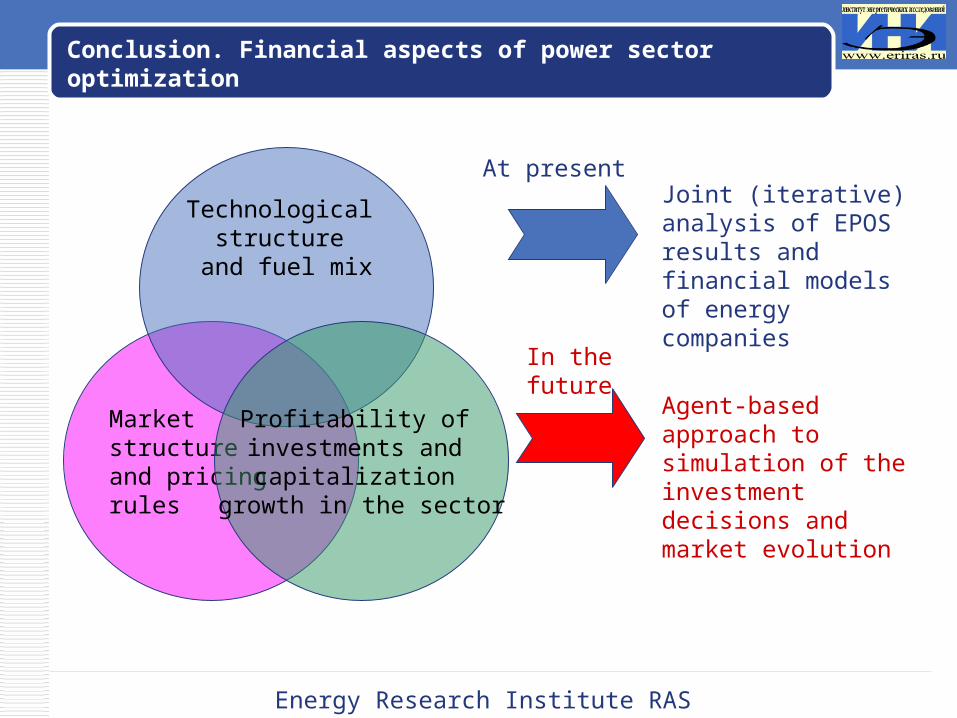
LOGOConclusion. Financial aspects of power sector optimization
Energy Research Institute RAS
Market structure and pricing rules
Technological structure
and fuel mix
Profitability of investments and
capitalization growth in the sector
Joint (iterative) analysis of EPOS results and financial models of energy companies
Agent-based approach to simulation of the investment decisions and market evolution
At present
In the future

LOGO
Energy Research Institute of [email protected]
Veselov Fedor, PhD economics, Head of Department
[email protected], [email protected]
Makariva Alla, PhD economics, Head of Laboratory [email protected]
Khorshev Andrey, PhD economics, Head of Laboratory [email protected]