
LOCATION PATTERNS OF CREATIVE CAPITAL AND · PDF fileLOCATION PATTERNS OF CREATIVE CAPITAL AND...
27
Regional and Sectoral Economic Studies Vol. 14-1 (2014) LOCATION PATTERNS OF CREATIVE CAPITAL AND REGIONAL DISPARITIES IN SPAIN KERIMOGLU, Ebru * KARAHASAN, B.Can** Abstract The ‘creative class’ as a source for regional growth has been afforded increasing attention in recent years. Likewise the location decisions of creative people have been forwarded as an important factor for understanding regional disparities. Yet, creative people are not distributed evenly across space, tending rather to concentrate in particular locations. Inspired by these ongoing discussions surrounding the creative capital theory, this study investigates the location patterns of creative capital and its impact on regional differences in Spain. Our preliminary set of results indicates that between 1996 and 2004 there is a general tendency regarding the increase in the spatial dependency of the creative capital in Spain. Moreover a more careful observation of these spatial interactions confirms that locations share common patterns concerning the creative capital and income differences at local level. Finally our final set of evidence suggest that creative capital and more importantly its local spillover is affecting the regional income gaps in Spain even once other factors such as human capital and physical capital accumulation are controlled for. Keywords: Creative Capital, Spain, Regional Disparities, Regional Spillover JEL codes: R 11, R 12, O 10, E 24 1. Introduction The role played by the creative class as a factor of economic growth has recently come under examination (Lang and Danielsen, 2005; Boschma and Fritsch, 2007). Florida (2005) claims that creative class is a key driver of urban and regional development (see also Boschma and Fritsch, 2007) and he presents evidence that, cities and regions whose populations show high levels of creativity grow faster. Background of this debate makes sense even once we have a quick look at the neo-classical arguments regarding the convergence and regional inequality discourse. Other than the physical capital accumulation, the most recent discussions about openness and R&D spillovers between north and south postulates the importance of knowledge and technology transfer between nations and even regions (Coe et al., 1997). Given the creative industry classification, the inter-connection between the arguments of the central neo-classical discussion and the contemporary remarks of the creative capital theory has vital issues in common. * Ebru Kerimoglu, Assoc. Prof. Dr. Istanbul Technical University, Department of Urban and Regional Planning, [email protected], [email protected], ** B. Can Karahasan, Assist. Prof. Dr. Okan University, Faculty of Economics and Administrative Sciences, Department of International Trade, [email protected], [email protected] Acknowledgments: Authors acknowledge the scientific research support from the Scientific and Technological Research Council of Turkey (TUBITAK). The authors thank IREA/AQR, in particular Dr. Jordi Surinach Caralt and Dr. Enrique Lopez Bazo for hosting and supporting them during their PhD and post-doc periods. Special thanks are owed to Federico Pablo-Marti for his valuable contribution to our work and the sharing of his database.
Transcript of LOCATION PATTERNS OF CREATIVE CAPITAL AND · PDF fileLOCATION PATTERNS OF CREATIVE CAPITAL AND...
Regional and Sectoral Economic Studies Vol. 14-1 (2014)
LOCATION PATTERNS OF CREATIVE CAPITAL AND REGIONAL DISPARITIES IN SPAIN
KERIMOGLU, Ebru* KARAHASAN, B.Can**
Abstract The ‘creative class’ as a source for regional growth has been afforded increasing attention in recent years. Likewise the location decisions of creative people have been forwarded as an important factor for understanding regional disparities. Yet, creative people are not distributed evenly across space, tending rather to concentrate in particular locations. Inspired by these ongoing discussions surrounding the creative capital theory, this study investigates the location patterns of creative capital and its impact on regional differences in Spain. Our preliminary set of results indicates that between 1996 and 2004 there is a general tendency regarding the increase in the spatial dependency of the creative capital in Spain. Moreover a more careful observation of these spatial interactions confirms that locations share common patterns concerning the creative capital and income differences at local level. Finally our final set of evidence suggest that creative capital and more importantly its local spillover is affecting the regional income gaps in Spain even once other factors such as human capital and physical capital accumulation are controlled for. Keywords: Creative Capital, Spain, Regional Disparities, Regional Spillover JEL codes: R 11, R 12, O 10, E 24 1. Introduction
The role played by the creative class as a factor of economic growth has recently come under examination (Lang and Danielsen, 2005; Boschma and Fritsch, 2007). Florida (2005) claims that creative class is a key driver of urban and regional development (see also Boschma and Fritsch, 2007) and he presents evidence that, cities and regions whose populations show high levels of creativity grow faster. Background of this debate makes sense even once we have a quick look at the neo-classical arguments regarding the convergence and regional inequality discourse. Other than the physical capital accumulation, the most recent discussions about openness and R&D spillovers between north and south postulates the importance of knowledge and technology transfer between nations and even regions (Coe et al., 1997). Given the creative industry classification, the inter-connection between the arguments of the central neo-classical discussion and the contemporary remarks of the creative capital theory has vital issues in common.
* Ebru Kerimoglu, Assoc. Prof. Dr. Istanbul Technical University, Department of Urban and Regional Planning, [email protected], [email protected], ** B. Can Karahasan, Assist. Prof. Dr. Okan University, Faculty of Economics and Administrative Sciences, Department of International Trade, [email protected], [email protected] Acknowledgments: Authors acknowledge the scientific research support from the Scientific and Technological Research Council of Turkey (TUBITAK). The authors thank IREA/AQR, in particular Dr. Jordi Surinach Caralt and Dr. Enrique Lopez Bazo for hosting and supporting them during their PhD and post-doc periods. Special thanks are owed to Federico Pablo-Marti for his valuable contribution to our work and the sharing of his database.
Regional and Sectoral Economic Studies Vol. 14-1 (2014)
114
In this respect Florida’s creative capital theory differs markedly from that of human capital, which holds that education is the key to promoting regional economic growth (Florida, 2002; 2002a). And, indeed, more recently Florida has argued that the creative capital theory outperforms the human capital theory in predicting urban economic development (Florida, 2005). By contrast, Glaeser (2005) reports that human capital variables, when pitted against the creative capital theory in a test of economic growth, outperform the creative capital variables (see also Hoyman and Faricy, 2008). Similarly, a number of empirical studies conclude that cities and regions with more highly educated residents tend to grow faster than cities with smaller stocks of highly educated labor (Glaeser and Saiz, 2003; Marlet and Woerkens, 2007). Here we have to underline that human capital and creative capital interconnection and/or difference is an important motivation for the ongoing research. As will be highlighted we are going to test this human capital and creative capital connection during the estimation procedure.
Despite these findings, examining the impact of creative capital on regional differences remains a relevant objective. Here, the underlying idea is that the creative capital is strongly linked to territorial considerations, because regions and cities have to attract highly skilled or creative human capital in order to attain higher levels of economic growth (Florida, 2005; Lucas, 1988; Chantelot et al., 2010). The idea is that, creative capital has been identified as a critical resource for boosting innovation and economic competitiveness (Chantelot et al., 2010); hence, we need to be able to identify the geographical distribution of creative people in order to understand any regional differences. In an attempt at shedding further light on some of these questions, this study presents empirical findings from a case study conducted in southern Europe, more specifically in the state of Spain. It investigates the spatial patterns of creative capital and its impact on regional differences. The first set of analysis aims to examine how the creative capital is dispersed across the geography of Spain and next second set of observations is expected to yield the relevant information about the impact of this pattern on regional differences.
The following section provides a summary of the literature examining the creative capital theory and its relation to regional disparities. In Section 3, the geography of employment and creative capital in Spain is described at provincial level. The evolution in creative capital for the post-1996 period, and its performance, is visualized. Section 4 outlines the methodology employed and describes the data set. Section 5 reports our empirical findings concerning the spatial patterns of creative capital and regional differences. Here, the spatial patterns and their interdependencies are discussed in testing the impact of the creative capital on regional differences. Finally the last section concludes. 2. A review of the creative capital theory
Literature demonstrates that the quality of a region’s labor force is a major determinant of that region’s economic success (Glaeser, 2000; Florida, 2002; Simon and Nardinelli, 2002). The role of highly skilled workers is at the center of an emerging paradigm in economic development and is the subject of growing interest not only among economists, economic geographers and regional scientists (Mallender and Florida, 2007),
Kerimoglu,E., Karahasan,B.C. Location of Creative Capital And Regional Disparities In Spain
115
but also among sociologists, and urban planners (Power and Scott, 2004; Hartley, 2005; Cooke and Lazzeretti, 2008, Lazzeretti et al., 2008). Florida (2002a) claims that the ideas and creativity provided by highly skilled workers are the most important elements in the economic success of a region and that knowledge-based economic growth and local development are typically found in close association with the ‘clustering of creative people and human capital’ (Lucas, 1988). Likewise, a number of studies highlight the close relation between local development and highly skilled human capital (Simon, 1998; Glaeser et al., 1992; Glaeser and Saiz, 2003; Henderson et al., 1995; Capone, 2006).
The creative capital theory emphasizes the importance of place in attracting talented workers. Locations boasting the three Ts - technology, talent, and tolerance – will, it is argued, experience demographic and economic growth (Hoyman and Faricy, 2008). The theory, presented by Richard Florida in ‘The Rise of the Creative Class’ (2002a), is a multifaceted concept that describes a new class, an emerging sector of the economy, and an urban plan for economic growth and development. The creative class is typically described as a group of individuals that are either highly educated or engaged in creative (scientific, artistic, or technological) activities (Florida, 2002a; 2005). At the core of this creative class we find ‘people in science and engineering, architecture and design, education, arts, music and entertainment, whose economic function is to create new ideas, new technology and/or new creative content’ (Florida, 2005). Around this creative core is ‘a broader group of creative professionals in business and finance, law, health care and related fields’ (Florida, 2002a). An important sub-group within this creative core comprises bohemians - the artistically creative, including ‘authors, designers, musicians, composers, actors, directors, painters, sculptors, artists, printmakers, photographers, dancers, artists, and performers’ (Florida, 2002a; Fritsch and Stuetzer, 2009). Florida stresses that the creative class is above all innovative and consequently highly productive (Florida, 2002a; Marlet and Woerkens, 2007).
The main factor participating in creativity is human capital and, as such, it can be considered a form of capital, what Florida (2005) refers to as ‘creative capital’. The basic principles of the human capital and the creative capital approaches differ from those in the standard economic geography literature in that they assume that it is people, not firms that lead the way (Marlet and Woerkens, 2007). Contemporary theories of modern growth hold that technology drives economic growth, and that it is the accumulation of human capital that accounts for differences in the levels of this technology and consequently for differences in economic growth. Although the most conventional measure of human capital is an individual’s level of education, this new approach requires the appraisal of an individual’s intrinsic creative potential to generate new ideas, technologies, business models, cultural forms and whole new industries, which is how the ‘creative class’ emerged as a concept in the work of Richard Florida (Dinescu and Grigorovici, 2008). It is argued that in addition to the skill level, the creative ability of the labor force (or of the creative class) is an essential component of the endogenous development of urban areas (Anderson, 1985; Florida, 2002; 2002a). The creative capital theory, although disputed by many (Glaeser, 2005; Markusen, 2006), has found support in a number of critical empirical studies that seek to measure creativity and its impact on regional economic
Regional and Sectoral Economic Studies Vol. 14-1 (2014)
116
competitiveness (Florida and Gates, 2001; Florida, 2002; 2002a; McGranahan and Wojan, 2007).
The main criticism of Florida’s approach is that creativity and human capital are interconnected (Glaeser, 2005; Fritsch and Stuetzer, 2009), which weakens any definition of creative people in empirical analyses made on the basis of occupation. Indeed, many of the occupations regarded by Florida as being creative require a relatively high level of educational qualification and Glaeser (2005) shows that there tends to be a highly positive correlation between the share of people with creative occupations and the share of people with a higher level of education. Thus, Florida’s critics argue that creativity simply measures the impact of qualification and human capital on economic development (Fritsch and Stuetzer, 2009). Marlet and Woerkens (2007) similarly claim that creativity is basically the same as human capital, but show that designing categories for people that are not necessarily highly educated, yet who play a key role in economic production, is useful in achieving a better understanding of regional economic growth (Marlet and Woerkens, 2007). They argue that Florida does not support his creative capital theory with much empirical analysis, pointing out that while some of the individuals in Florida’s creative class are indeed not highly educated, the majority are (Marlet and Woerkens, 2007). Additionally, there would appear to be a lack of evidence regarding the direction of causality between the creative class and economic growth in thriving urban areas – i.e., does the creative class foster growth or does growth attract a creative labor force (Glaeser, 2005; Shearmur, 2007; Petrov, 2008). Other critics call into question the impact of people in artistic occupations (bohemians) on economic development (Lang and Danielsen, 2005; Markusen, 2006), doubting the existence of a causal relationship (Fritsch and Stuetzer, 2009). Hoyman and Faricy (2008) find the widespread adoption of creative capital–based policies somewhat surprising given that the academic literature provides little evidence in support of the relationship between creative clusters and actual economic indicators. Finally, Goonewardena (2004) argues that cities have always been creative and diverse, and so creative capital cannot be responsible for the new economic growth of the 1990s (cited in Hoyman and Faricy, 2008).
Despite these criticisms, the majority of evidence supports the positive impact of creative people on economic development. In addition, the creative class is reported to be spread unevenly, which makes it important to understand the factors that account for its varied geography (Mallender and Florida, 2007). The concentration of creative people in just a few locations can be considered a factor in the clustering of economic activity. This is particularly true of those activities with a high demand for highly qualified labor, such as research and development, design and marketing and the high-tech industries (Arora et al., 2000; Florida, 2005; Fritsch and Stuetzer, 2009). Florida’s theory is thus very much in line with Jacobs’ ideas (1970, 1985) concerning the role of cities and with the basic hypotheses underpinning new economic growth theory (Romer, 1986, 1993; Lucas, 1988). For instance, Lucas (1988) recognizes the role of great cities, which localize human capital and information, create knowledge spillovers, and become engines of economic growth (see also Mallender and Florida, 2009). Based on the importance of highly skilled workers in explaining the relation between inequality and economic
Kerimoglu,E., Karahasan,B.C. Location of Creative Capital And Regional Disparities In Spain
117
growth, several studies have examined whether this growth is heterogeneous (Paci and Usai, 2001; Castella and Domanech, 2002).
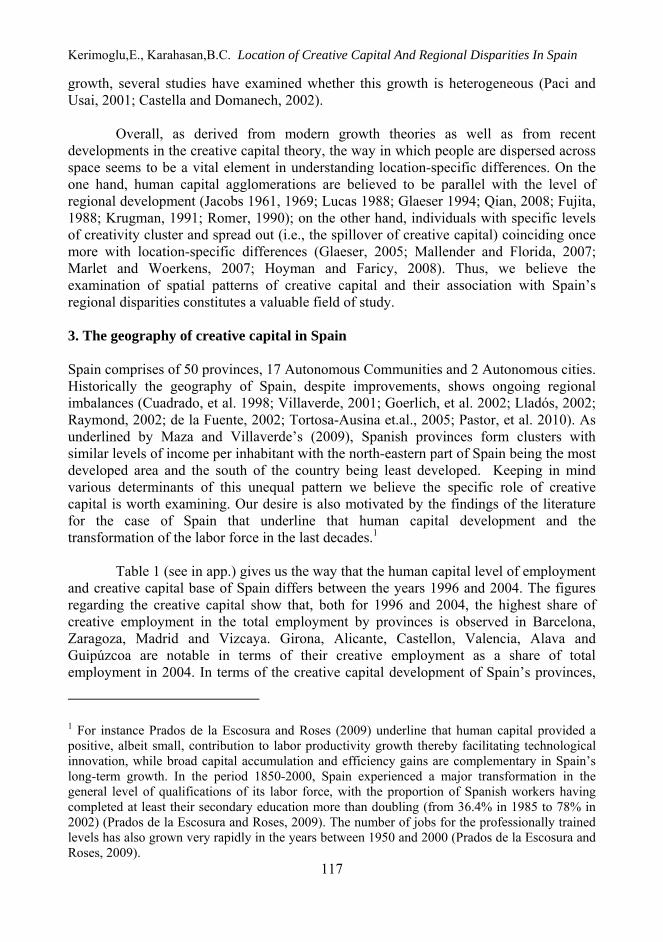
Overall, as derived from modern growth theories as well as from recent developments in the creative capital theory, the way in which people are dispersed across space seems to be a vital element in understanding location-specific differences. On the one hand, human capital agglomerations are believed to be parallel with the level of regional development (Jacobs 1961, 1969; Lucas 1988; Glaeser 1994; Qian, 2008; Fujita, 1988; Krugman, 1991; Romer, 1990); on the other hand, individuals with specific levels of creativity cluster and spread out (i.e., the spillover of creative capital) coinciding once more with location-specific differences (Glaeser, 2005; Mallender and Florida, 2007; Marlet and Woerkens, 2007; Hoyman and Faricy, 2008). Thus, we believe the examination of spatial patterns of creative capital and their association with Spain’s regional disparities constitutes a valuable field of study. 3. The geography of creative capital in Spain Spain comprises of 50 provinces, 17 Autonomous Communities and 2 Autonomous cities. Historically the geography of Spain, despite improvements, shows ongoing regional imbalances (Cuadrado, et al. 1998; Villaverde, 2001; Goerlich, et al. 2002; Lladós, 2002; Raymond, 2002; de la Fuente, 2002; Tortosa-Ausina et.al., 2005; Pastor, et al. 2010). As underlined by Maza and Villaverde’s (2009), Spanish provinces form clusters with similar levels of income per inhabitant with the north-eastern part of Spain being the most developed area and the south of the country being least developed. Keeping in mind various determinants of this unequal pattern we believe the specific role of creative capital is worth examining. Our desire is also motivated by the findings of the literature for the case of Spain that underline that human capital development and the transformation of the labor force in the last decades.1
Table 1 (see in app.) gives us the way that the human capital level of employment and creative capital base of Spain differs between the years 1996 and 2004. The figures regarding the creative capital show that, both for 1996 and 2004, the highest share of creative employment in the total employment by provinces is observed in Barcelona, Zaragoza, Madrid and Vizcaya. Girona, Alicante, Castellon, Valencia, Alava and Guipúzcoa are notable in terms of their creative employment as a share of total employment in 2004. In terms of the creative capital development of Spain’s provinces,
1 For instance Prados de la Escosura and Roses (2009) underline that human capital provided a positive, albeit small, contribution to labor productivity growth thereby facilitating technological innovation, while broad capital accumulation and efficiency gains are complementary in Spain’s long-term growth. In the period 1850-2000, Spain experienced a major transformation in the general level of qualifications of its labor force, with the proportion of Spanish workers having completed at least their secondary education more than doubling (from 36.4% in 1985 to 78% in 2002) (Prados de la Escosura and Roses, 2009). The number of jobs for the professionally trained levels has also grown very rapidly in the years between 1950 and 2000 (Prados de la Escosura and Roses, 2009).
Regional and Sectoral Economic Studies Vol. 14-1 (2014)
118
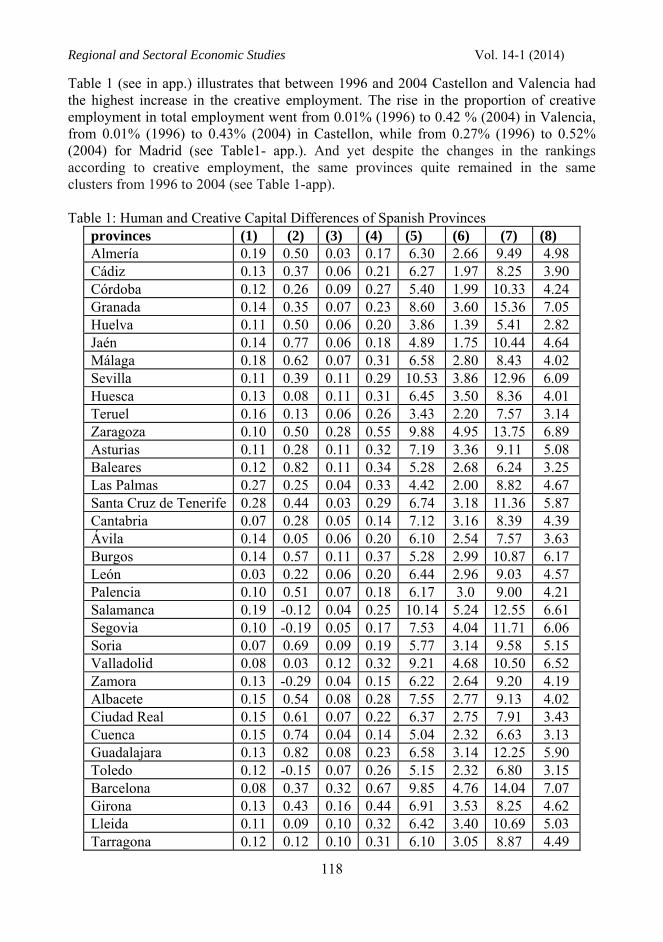
Table 1 (see in app.) illustrates that between 1996 and 2004 Castellon and Valencia had the highest increase in the creative employment. The rise in the proportion of creative employment in total employment went from 0.01% (1996) to 0.42 % (2004) in Valencia, from 0.01% (1996) to 0.43% (2004) in Castellon, while from 0.27% (1996) to 0.52% (2004) for Madrid (see Table1- app.). And yet despite the changes in the rankings according to creative employment, the same provinces quite remained in the same clusters from 1996 to 2004 (see Table 1-app). Table 1: Human and Creative Capital Differences of Spanish Provinces
provinces (1) (2) (3) (4) (5) (6) (7) (8) Almería 0.19 0.50 0.03 0.17 6.30 2.66 9.49 4.98 Cádiz 0.13 0.37 0.06 0.21 6.27 1.97 8.25 3.90 Córdoba 0.12 0.26 0.09 0.27 5.40 1.99 10.33 4.24 Granada 0.14 0.35 0.07 0.23 8.60 3.60 15.36 7.05 Huelva 0.11 0.50 0.06 0.20 3.86 1.39 5.41 2.82 Jaén 0.14 0.77 0.06 0.18 4.89 1.75 10.44 4.64 Málaga 0.18 0.62 0.07 0.31 6.58 2.80 8.43 4.02 Sevilla 0.11 0.39 0.11 0.29 10.53 3.86 12.96 6.09 Huesca 0.13 0.08 0.11 0.31 6.45 3.50 8.36 4.01 Teruel 0.16 0.13 0.06 0.26 3.43 2.20 7.57 3.14 Zaragoza 0.10 0.50 0.28 0.55 9.88 4.95 13.75 6.89 Asturias 0.11 0.28 0.11 0.32 7.19 3.36 9.11 5.08 Baleares 0.12 0.82 0.11 0.34 5.28 2.68 6.24 3.25 Las Palmas 0.27 0.25 0.04 0.33 4.42 2.00 8.82 4.67 Santa Cruz de Tenerife 0.28 0.44 0.03 0.29 6.74 3.18 11.36 5.87 Cantabria 0.07 0.28 0.05 0.14 7.12 3.16 8.39 4.39 Ávila 0.14 0.05 0.06 0.20 6.10 2.54 7.57 3.63 Burgos 0.14 0.57 0.11 0.37 5.28 2.99 10.87 6.17 León 0.03 0.22 0.06 0.20 6.44 2.96 9.03 4.57 Palencia 0.10 0.51 0.07 0.18 6.17 3.0 9.00 4.21 Salamanca 0.19 -0.12 0.04 0.25 10.14 5.24 12.55 6.61 Segovia 0.10 -0.19 0.05 0.17 7.53 4.04 11.71 6.06 Soria 0.07 0.69 0.09 0.19 5.77 3.14 9.58 5.15 Valladolid 0.08 0.03 0.12 0.32 9.21 4.68 10.50 6.52 Zamora 0.13 -0.29 0.04 0.15 6.22 2.64 9.20 4.19 Albacete 0.15 0.54 0.08 0.28 7.55 2.77 9.13 4.02 Ciudad Real 0.15 0.61 0.07 0.22 6.37 2.75 7.91 3.43 Cuenca 0.15 0.74 0.04 0.14 5.04 2.32 6.63 3.13 Guadalajara 0.13 0.82 0.08 0.23 6.58 3.14 12.25 5.90 Toledo 0.12 -0.15 0.07 0.26 5.15 2.32 6.80 3.15 Barcelona 0.08 0.37 0.32 0.67 9.85 4.76 14.04 7.07 Girona 0.13 0.43 0.16 0.44 6.91 3.53 8.25 4.62 Lleida 0.11 0.09 0.10 0.32 6.42 3.40 10.69 5.03 Tarragona 0.12 0.12 0.10 0.31 6.10 3.05 8.87 4.49
Kerimoglu,E., Karahasan,B.C. Location of Creative Capital And Regional Disparities In Spain
119
Alicante 0.10 0.35 0.17 0.43 5.66 2.65 9.97 4.79 Castellón 0.52 0.26 0.01 0.43 6.60 3.29 8.34 3.93 Valencia 0.53 0.41 0.01 0.42 8.33 3.95 13.76 6.82 Badajoz 0.10 0.15 0.04 0.18 6.11 2.07 7.80 3.37 Cáceres 0.19 -0.38 0.03 0.19 6.09 2.46 7.98 3.61 A Coruña 0.14 -0.23 0.07 0.28 6.92 3.40 11.19 6.19 Lugo 0.16 -0.49 0.04 0.24 3.42 2.00 9.35 4.94 Ourense 0.12 -0.42 0.07 0.26 6.62 3.54 12.68 5.84 Pontevedra 0.16 -0.02 0.07 0.32 5.83 2.89 7.71 4.29 Madrid 0.08 0.51 0.27 0.52 15.97 7.89 21.07 10.95 Murcia 0.13 0.64 0.08 0.24 7.88 3.41 9.68 4.68 Navarra 0.09 0.56 0.17 0.34 8.29 4.39 14.16 7.02 Álava 0.11 0.31 0.16 0.43 8.10 4.62 13.21 7.50 Guipúzcoa 0.09 0.32 0.15 0.40 8.67 4.19 13.63 7.76 Vizcaya 0.08 0.47 0.21 0.45 15.68 7.22 16.98 8.88 La Rioja 0.08 0.39 0.11 0.27 7.55 3.53 9.97 5.19
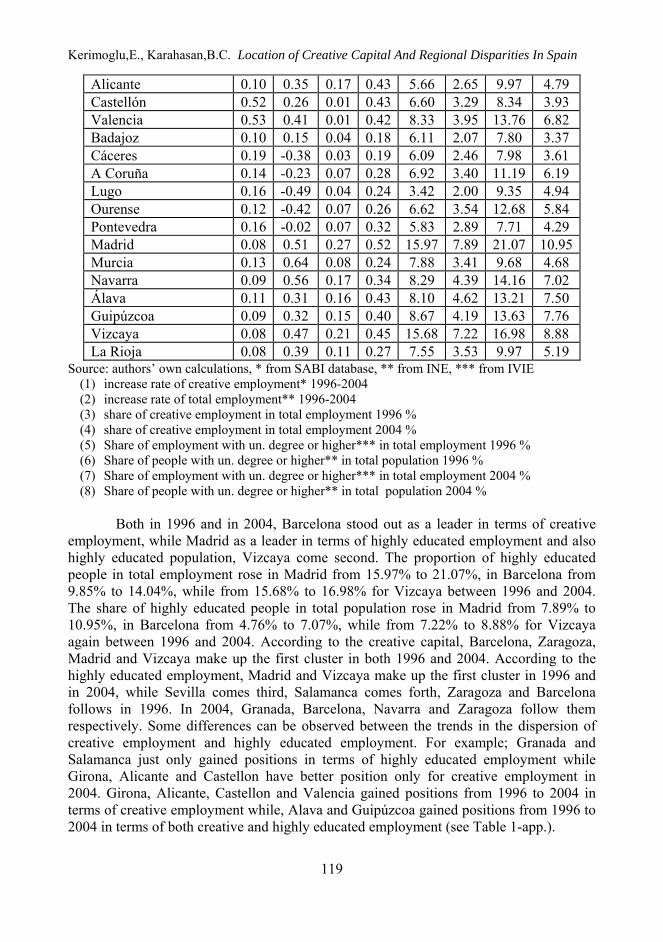
Source: authors’ own calculations, * from SABI database, ** from INE, *** from IVIE (1) increase rate of creative employment* 1996-2004 (2) increase rate of total employment** 1996-2004 (3) share of creative employment in total employment 1996 % (4) share of creative employment in total employment 2004 % (5) Share of employment with un. degree or higher*** in total employment 1996 % (6) Share of people with un. degree or higher** in total population 1996 % (7) Share of employment with un. degree or higher*** in total employment 2004 % (8) Share of people with un. degree or higher** in total population 2004 %
Both in 1996 and in 2004, Barcelona stood out as a leader in terms of creative
employment, while Madrid as a leader in terms of highly educated employment and also highly educated population, Vizcaya come second. The proportion of highly educated people in total employment rose in Madrid from 15.97% to 21.07%, in Barcelona from 9.85% to 14.04%, while from 15.68% to 16.98% for Vizcaya between 1996 and 2004. The share of highly educated people in total population rose in Madrid from 7.89% to 10.95%, in Barcelona from 4.76% to 7.07%, while from 7.22% to 8.88% for Vizcaya again between 1996 and 2004. According to the creative capital, Barcelona, Zaragoza, Madrid and Vizcaya make up the first cluster in both 1996 and 2004. According to the highly educated employment, Madrid and Vizcaya make up the first cluster in 1996 and in 2004, while Sevilla comes third, Salamanca comes forth, Zaragoza and Barcelona follows in 1996. In 2004, Granada, Barcelona, Navarra and Zaragoza follow them respectively. Some differences can be observed between the trends in the dispersion of creative employment and highly educated employment. For example; Granada and Salamanca just only gained positions in terms of highly educated employment while Girona, Alicante and Castellon have better position only for creative employment in 2004. Girona, Alicante, Castellon and Valencia gained positions from 1996 to 2004 in terms of creative employment while, Alava and Guipúzcoa gained positions from 1996 to 2004 in terms of both creative and highly educated employment (see Table 1-app.).
Regional and Sectoral Economic Studies Vol. 14-1 (2014)
120
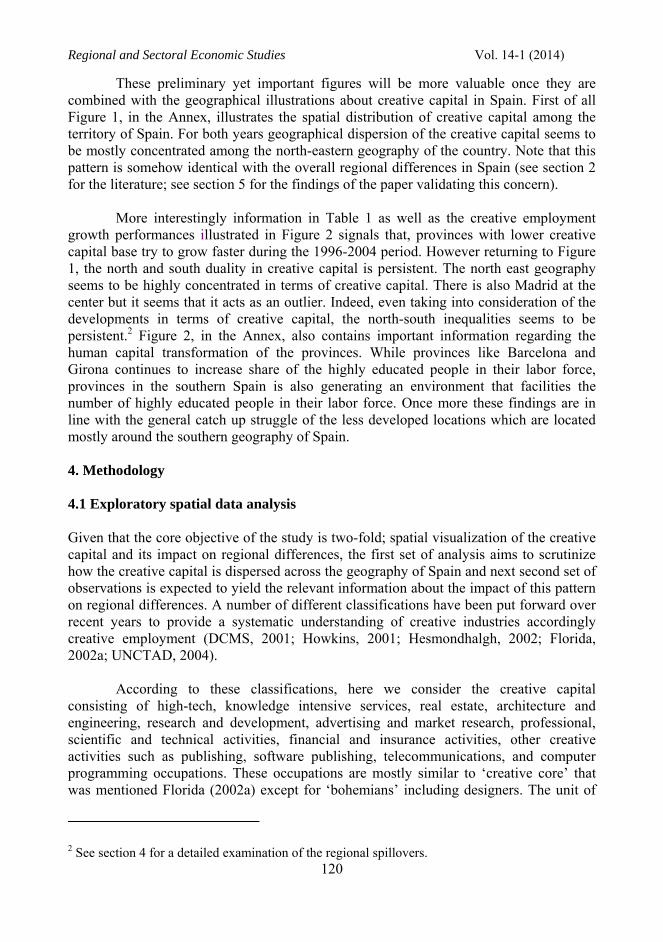
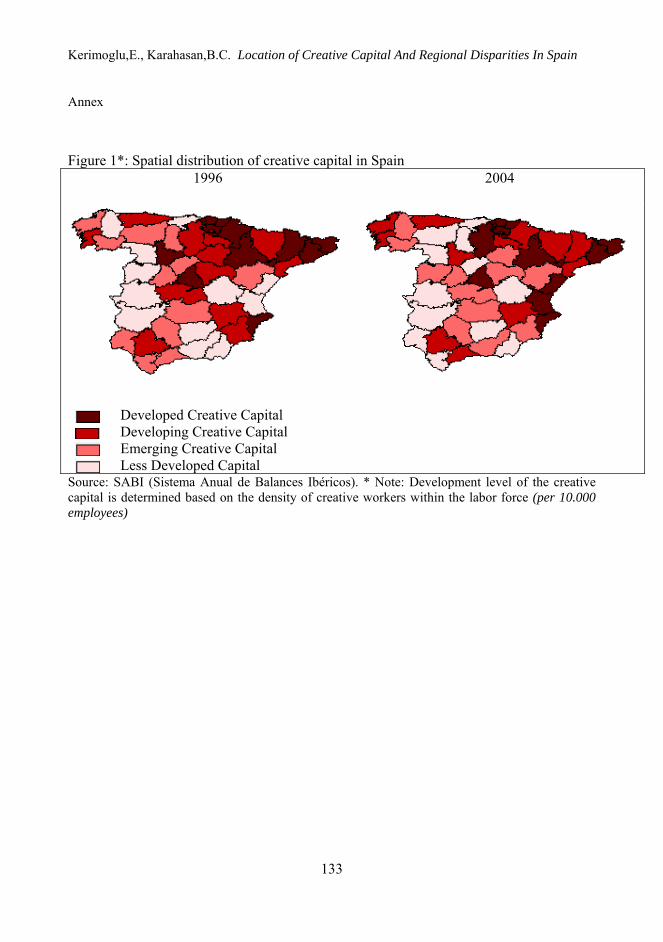
These preliminary yet important figures will be more valuable once they are combined with the geographical illustrations about creative capital in Spain. First of all Figure 1, in the Annex, illustrates the spatial distribution of creative capital among the territory of Spain. For both years geographical dispersion of the creative capital seems to be mostly concentrated among the north-eastern geography of the country. Note that this pattern is somehow identical with the overall regional differences in Spain (see section 2 for the literature; see section 5 for the findings of the paper validating this concern).
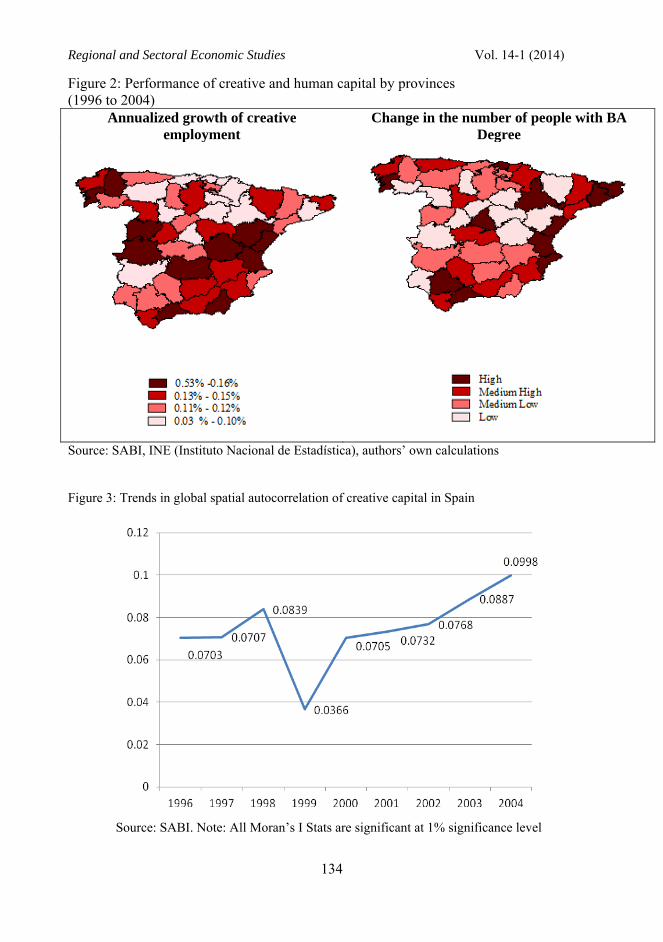
More interestingly information in Table 1 as well as the creative employment growth performances illustrated in Figure 2 signals that, provinces with lower creative capital base try to grow faster during the 1996-2004 period. However returning to Figure 1, the north and south duality in creative capital is persistent. The north east geography seems to be highly concentrated in terms of creative capital. There is also Madrid at the center but it seems that it acts as an outlier. Indeed, even taking into consideration of the developments in terms of creative capital, the north-south inequalities seems to be persistent.2 Figure 2, in the Annex, also contains important information regarding the human capital transformation of the provinces. While provinces like Barcelona and Girona continues to increase share of the highly educated people in their labor force, provinces in the southern Spain is also generating an environment that facilities the number of highly educated people in their labor force. Once more these findings are in line with the general catch up struggle of the less developed locations which are located mostly around the southern geography of Spain. 4. Methodology
4.1 Exploratory spatial data analysis Given that the core objective of the study is two-fold; spatial visualization of the creative capital and its impact on regional differences, the first set of analysis aims to scrutinize how the creative capital is dispersed across the geography of Spain and next second set of observations is expected to yield the relevant information about the impact of this pattern on regional differences. A number of different classifications have been put forward over recent years to provide a systematic understanding of creative industries accordingly creative employment (DCMS, 2001; Howkins, 2001; Hesmondhalgh, 2002; Florida, 2002a; UNCTAD, 2004).
According to these classifications, here we consider the creative capital consisting of high-tech, knowledge intensive services, real estate, architecture and engineering, research and development, advertising and market research, professional, scientific and technical activities, financial and insurance activities, other creative activities such as publishing, software publishing, telecommunications, and computer programming occupations. These occupations are mostly similar to ‘creative core’ that was mentioned Florida (2002a) except for ‘bohemians’ including designers. The unit of
2 See section 4 for a detailed examination of the regional spillovers.
Kerimoglu,E., Karahasan,B.C. Location of Creative Capital And Regional Disparities In Spain
121
analysis is NUTS 3. There are 52 provincial locations however we prefer to keep the analysis within the territorial borders of Spain; Ceuta, Meila in the North Africa and Balaric and Canary Islands are not used during the estimation procedure.
Revisiting the previous section about the spatial patterns of creative capital, we find it valuable to focus on the possible spatial interactions. That is to say investigation of the spatial autocorrelation. Such an approach will not only shed light on the local dynamics of the creative capital and regional differences link, but also will help us to visualize the clusters and outliers. First to examine the spatial concentration of the creative capital as well as regional income differences, the spatial autocorrelation measure is computed (see equation1, Moran’s I). n represents the number of provinces, s is the summation of all the elements in the weight matrix, and wi,j is the generic element of W, a row-standardized weight matrix.3
(eq.1) ∑
∑∑−
−−
−
−−=
ii
i jjiij
xx
xxxxw
sn
IsMoran2)(
))(( '
While this measure explains the general tendency about the regional spatial interconnections, it will fail to show the local patterns (Anselin, 1995). Despite the fact that it is possible to visualize the local realizations of the global spatial autocorrelation by decomposing it, testing for the local instability thorough testing the significance of the local spatial interactions is more valuable. As proposed by Anselin (1995) Local Indicator of Spatial Autocorrelation (LISA) is the appropriate method to discuss the local realizations of the spatial autocorrelation (see equation 2).
(eq.2) ∑−−
−−=j
jifi xxwxxLISA )()(
4.2 Econometric specifications
The way that the creative workers and their density within the employment base of the Spanish provinces affect the regional differences attracts the attention of the ongoing research. Yet the way that the regional inequality in Spain is explained is another discussion, which we believe is another valuable piece of research. Still once the regional differences in Spain is visualized by the regional per capita income level and growth numbers, we have to control for some regional specific determinants. This second set of
3 There are various methods to construct a weight matrix. During the estimation procedure for spatial statistics as well as spatial econometric models, both contiguity (w=1 if locations are adjacent to each other and w=0 otherwise) and inverse distance (w=1/d^2) weight matrices are constructed and used. Results are robust to the weight matrix construction. However for simplicity results obtained from the inverse distance weight matrix are reported in all kind of spatial analysis (in section 5). Results obtained from the contiguity weight matrix are also available from the authors upon request.
Regional and Sectoral Economic Studies Vol. 14-1 (2014)
122
analysis originates from a basic production function that intends to explain why some regions of Spain are lagging behind the others (see equation 3).
(eq. 3) ),,,(: SpilloversKHKCreafy As summarized in equation 3, we believe the that creative capital (Crea) is
affecting the regional per capita income differences (y), even once we control for human capital bases of regions (HK), capital accumulation (K) and regional spillovers working over spatial interactions (Spillovers). This general hypothesis is tested by a system of models from a reduced form one to an augmented one. Both the reduced form models as well as the augmented models are estimated by using three separate assumptions about the way that spatial interactions work. First a spatial lag model (SAR) is estimated with the assumption that spatial links work over the income differences. Next a spatial error model (SEM) is estimated by proposing that there are common shocks, which are kept outside the model (omitted variables of the model) that are spatially auto correlated. Finally a spatial cross regressive model is estimated; this time the assumption is that it is the creative capital that is correlated across space.4 In the reduced form models from equations 4 to 6, impact of creative capital on regional differences is tested without controlling for any regional properties of provinces. Per capita income of provinces (pgdp) is used to understand the regional differences. Creative capital bases of provinces are calculated by the share of creative people in total employment of regions (crea). Data for creative employment is collected from SABI data base, per capita GDP from INE.
(eq. 4) ερβα +++= pgdpWcreapgdp lnlnln
(eq. 5) uWcreapgdp +++= ελβα lnln
(eq. 6) εβα ++= creaWpgdp lnln
Next the same set of analyses is handled by controlling for different regional properties. Average year of schooling is used to control for the regional differences in human capital development of locations. Alternatively per capita value of human capital is also used to understand both the human capital differences as well as productivity differences of the labor force of provinces.5 Data for human capital development for the
4 Note that for spatial cross regressive models we are not also controlling for the location base creative capital dispersions. Once we introduce the spatial interactions to work over the surroundings we believe using that individual locations’ creative capital bases will prevent us to control for the spillover mechanisms to work. Yet models using the spatial lag of the creative capital together with the individual creative capital bases of the locations are also estimated, with similar findings to the estimations results summarized in the following sub-sections. All these results are not reported but available from the authors’ up on request. 5 See Mulligan and Sala-i-Martin (1997), Mulligan and Sala-i-Martin (2000), Serrano and Pastor (2002) and Serrano and Soler (2008) for the methodological concerns of the data set. The data is provided in the IVIE-Bancaja Human Capital Dataset. Basically it measures the productivity level of a skilled worker compared to an unskilled worker. See Karahasan and Lopez-Bazo (2013) for an implementation.
Kerimoglu,E., Karahasan,B.C. Location of Creative Capital And Regional Disparities In Spain
123
year 2004 is obtained from IVIE (Instituto Valenciano de Investigaciones Económicas). Finally the physical capital accumulation of provinces is also controlled for by using the average growth rate of the provincial physical capital formation from 1964 to 2000 (cap). This data is also provided by IVIE. Equations 7 to 8 visualize the models where HK represents the relevant human capital development and K represents the physical capital accumulation with the previous assumptions about the spatial interactions.
(eq. 7) ερψφβα +++++= pgdpWKHKcreapgdp lnlnln
(eq. 8) uWKHKcreapgdp +++++= ελψφβα lnln
(eq. 9) εψφβα ++++= KHKcreaWpgdp lnln
5. Empirical findings
5.1 Results for spatial data analysis
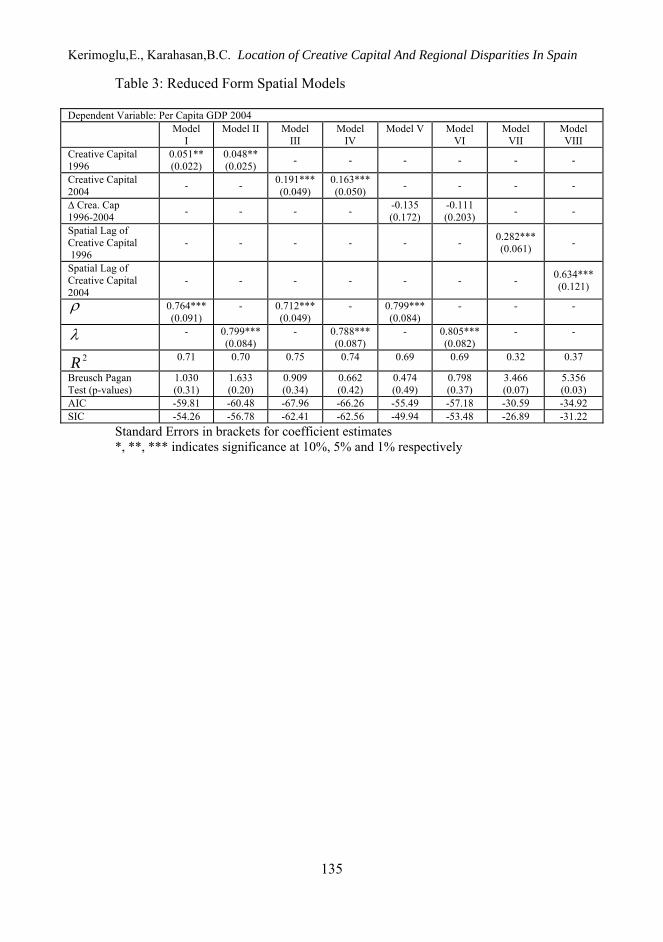
We have already addressed in Figure 1 that there is an unequal structure for creative capital dispersion in Spain. Furthermore this pattern is far away from being random; hence investigating its spatial autocorrelation is a necessity. Figure 3 give the historical evolution of the global spatial autocorrelation for a ten year period, reminding us that the way that creative people are dispersed across the geography of Spain is spatially correlated. The estimated Moran’s I statistic based on an inverse distance weight matrix indicate that for the nine year period the statistics varies between 0.073 and 0.098 with an upward trend in the last four-five years.
As emphasized in the previous section, we share the concerns raised by Anselin (1995) that the above pattern is informative yet insufficient to show the local realizations. Therefore assuming that there is strong positive and significant location base interactions among the whole territory of Spain will be away from the realism of the Spanish Economy. Henceforth the decomposition of the global spatial autocorrelation is done and illustrated as in Figure 4.
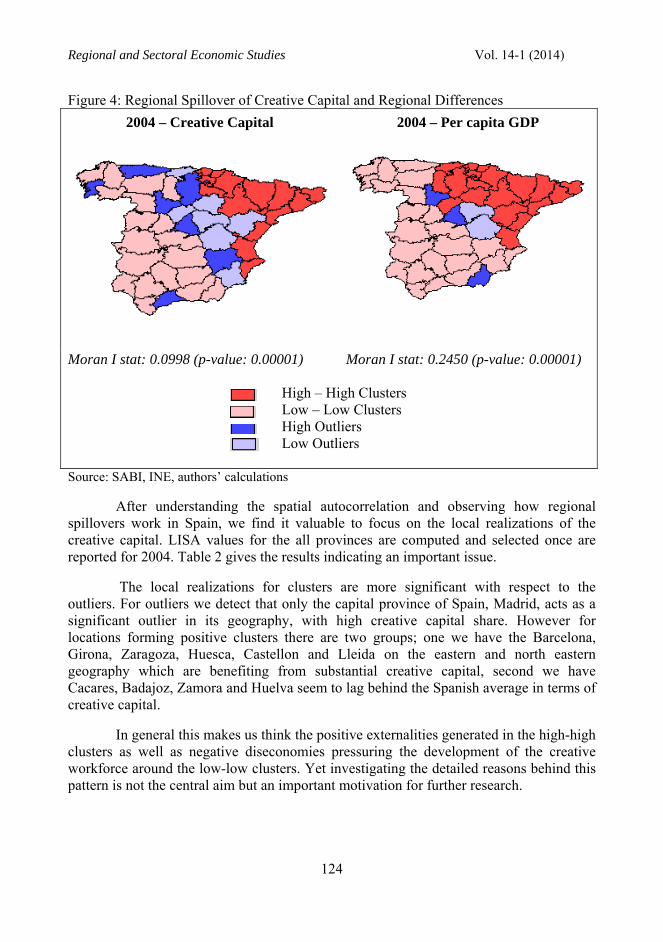
Note that per capita GDP as of year 2004 is also investigated as to give some preliminary yet informative information about the way that these two measures are dispersed across the geography of Spain. Figure 4 give us the comparison in that sense by offering two clusters and two outliers sets. Results confirm that locations in the north-east of Spain is realizing high creative employment in their labor force and these locations are observed to diverge from the Spanish average income level by forming a cluster of relatively richer provinces. On contrary there is also an L-shaped cluster running from the north-west Spain towards the south east that is composed of provinces with loose creative capital base and also low income levels. In both cases the spillover of the creative capital and the regional per capita income has much or less a similar pattern. These results are very preliminary however confirm our curiosity regarding the link between the way that creative people are dispersed and local income differences is realized.
Regional and Sectoral Economic Studies Vol. 14-1 (2014)
124
Figure 4: Regional Spillover of Creative Capital and Regional Differences
2004 – Creative Capital 2004 – Per capita GDP
Moran I stat: 0.0998 (p-value: 0.00001) Moran I stat: 0.2450 (p-value: 0.00001)
High – High Clusters Low – Low Clusters High Outliers
Low Outliers
Source: SABI, INE, authors’ calculations
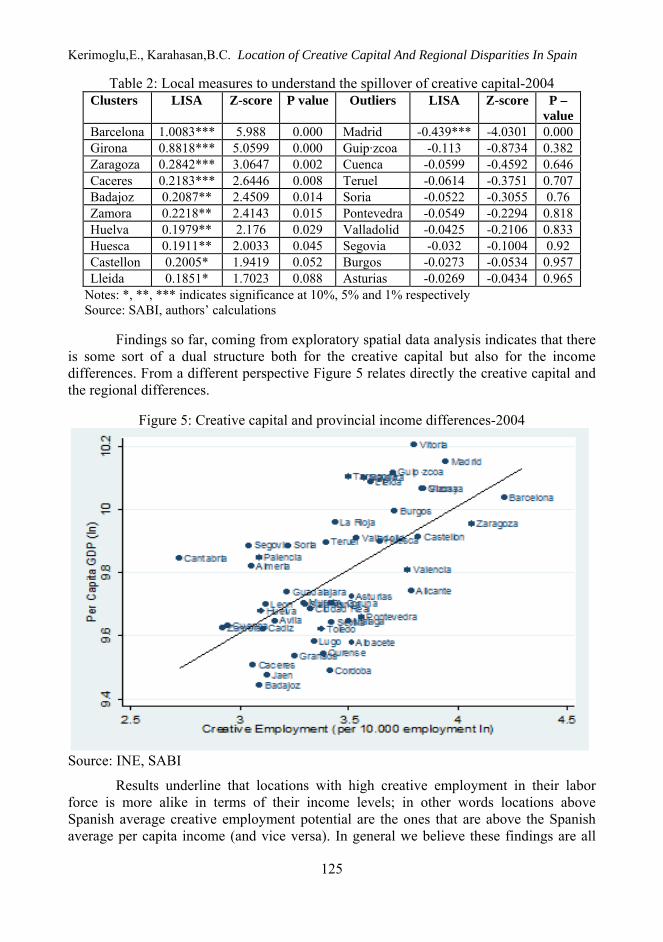
After understanding the spatial autocorrelation and observing how regional spillovers work in Spain, we find it valuable to focus on the local realizations of the creative capital. LISA values for the all provinces are computed and selected once are reported for 2004. Table 2 gives the results indicating an important issue.
The local realizations for clusters are more significant with respect to the outliers. For outliers we detect that only the capital province of Spain, Madrid, acts as a significant outlier in its geography, with high creative capital share. However for locations forming positive clusters there are two groups; one we have the Barcelona, Girona, Zaragoza, Huesca, Castellon and Lleida on the eastern and north eastern geography which are benefiting from substantial creative capital, second we have Cacares, Badajoz, Zamora and Huelva seem to lag behind the Spanish average in terms of creative capital.
In general this makes us think the positive externalities generated in the high-high clusters as well as negative diseconomies pressuring the development of the creative workforce around the low-low clusters. Yet investigating the detailed reasons behind this pattern is not the central aim but an important motivation for further research.
Kerimoglu,E., Karahasan,B.C. Location of Creative Capital And Regional Disparities In Spain
125
Table 2: Local measures to understand the spillover of creative capital-2004 Clusters LISA Z-score P value Outliers LISA Z-score P –
value Barcelona 1.0083*** 5.988 0.000 Madrid -0.439*** -4.0301 0.000 Girona 0.8818*** 5.0599 0.000 Guip·zcoa -0.113 -0.8734 0.382 Zaragoza 0.2842*** 3.0647 0.002 Cuenca -0.0599 -0.4592 0.646 Caceres 0.2183*** 2.6446 0.008 Teruel -0.0614 -0.3751 0.707 Badajoz 0.2087** 2.4509 0.014 Soria -0.0522 -0.3055 0.76 Zamora 0.2218** 2.4143 0.015 Pontevedra -0.0549 -0.2294 0.818 Huelva 0.1979** 2.176 0.029 Valladolid -0.0425 -0.2106 0.833 Huesca 0.1911** 2.0033 0.045 Segovia -0.032 -0.1004 0.92 Castellon 0.2005* 1.9419 0.052 Burgos -0.0273 -0.0534 0.957 Lleida 0.1851* 1.7023 0.088 Asturias -0.0269 -0.0434 0.965
Notes: *, **, *** indicates significance at 10%, 5% and 1% respectively Source: SABI, authors’ calculations
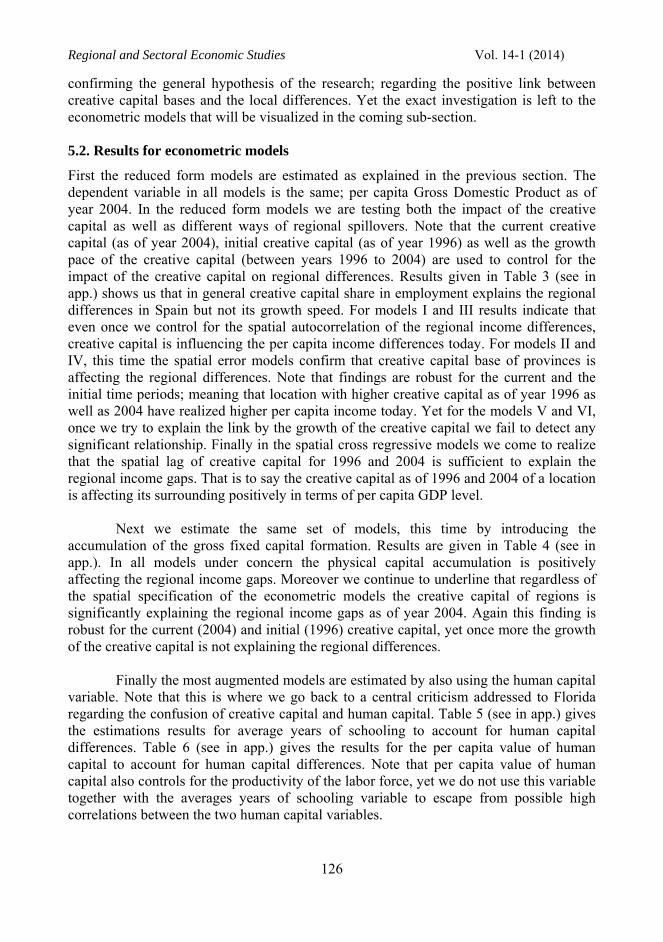
Findings so far, coming from exploratory spatial data analysis indicates that there is some sort of a dual structure both for the creative capital but also for the income differences. From a different perspective Figure 5 relates directly the creative capital and the regional differences.
Figure 5: Creative capital and provincial income differences-2004
Source: INE, SABI
Results underline that locations with high creative employment in their labor force is more alike in terms of their income levels; in other words locations above Spanish average creative employment potential are the ones that are above the Spanish average per capita income (and vice versa). In general we believe these findings are all
Regional and Sectoral Economic Studies Vol. 14-1 (2014)
126
confirming the general hypothesis of the research; regarding the positive link between creative capital bases and the local differences. Yet the exact investigation is left to the econometric models that will be visualized in the coming sub-section. 5.2. Results for econometric models
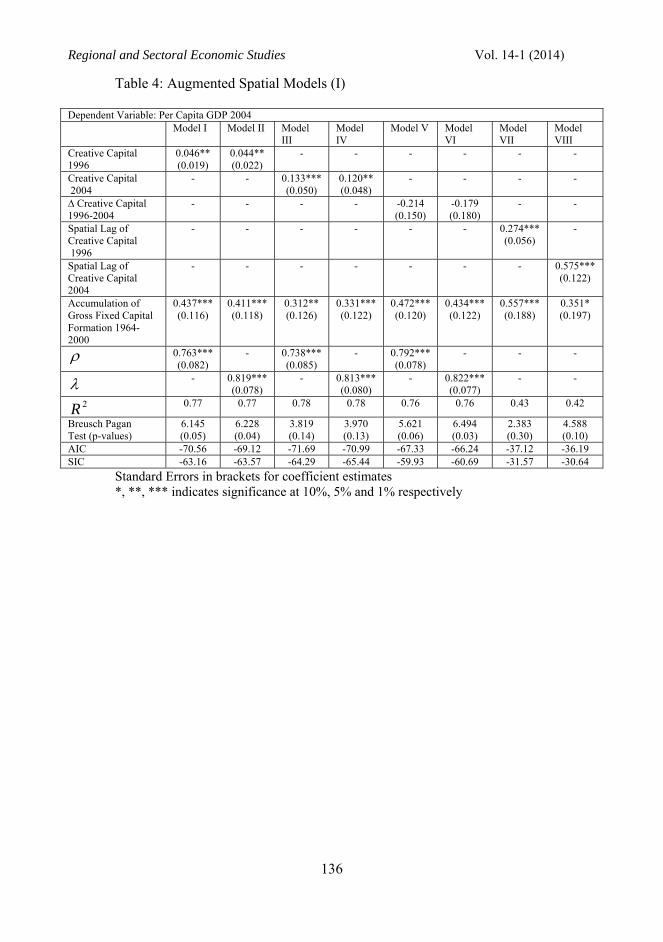
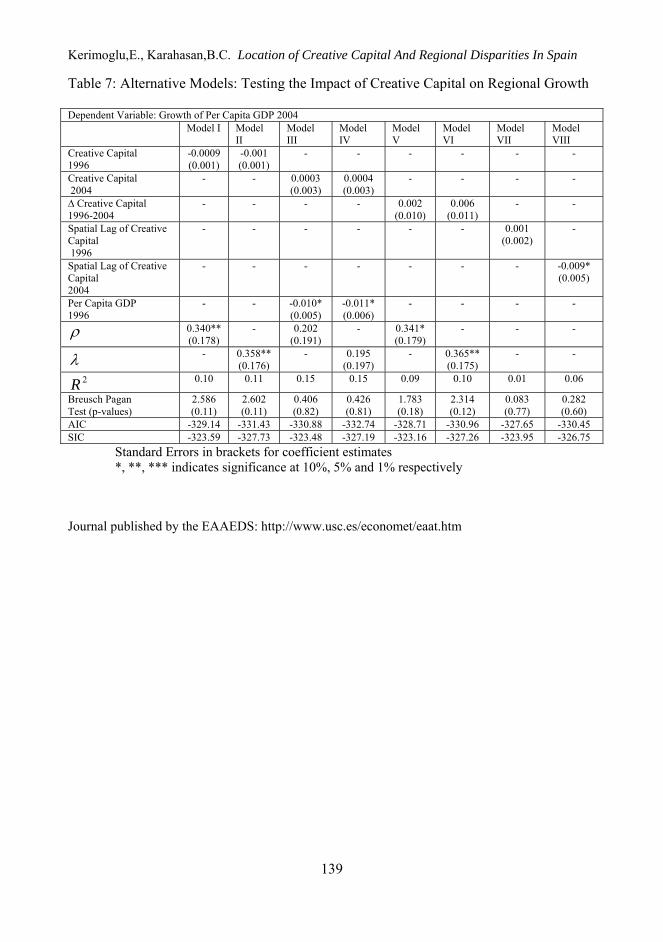
First the reduced form models are estimated as explained in the previous section. The dependent variable in all models is the same; per capita Gross Domestic Product as of year 2004. In the reduced form models we are testing both the impact of the creative capital as well as different ways of regional spillovers. Note that the current creative capital (as of year 2004), initial creative capital (as of year 1996) as well as the growth pace of the creative capital (between years 1996 to 2004) are used to control for the impact of the creative capital on regional differences. Results given in Table 3 (see in app.) shows us that in general creative capital share in employment explains the regional differences in Spain but not its growth speed. For models I and III results indicate that even once we control for the spatial autocorrelation of the regional income differences, creative capital is influencing the per capita income differences today. For models II and IV, this time the spatial error models confirm that creative capital base of provinces is affecting the regional differences. Note that findings are robust for the current and the initial time periods; meaning that location with higher creative capital as of year 1996 as well as 2004 have realized higher per capita income today. Yet for the models V and VI, once we try to explain the link by the growth of the creative capital we fail to detect any significant relationship. Finally in the spatial cross regressive models we come to realize that the spatial lag of creative capital for 1996 and 2004 is sufficient to explain the regional income gaps. That is to say the creative capital as of 1996 and 2004 of a location is affecting its surrounding positively in terms of per capita GDP level.
Next we estimate the same set of models, this time by introducing the accumulation of the gross fixed capital formation. Results are given in Table 4 (see in app.). In all models under concern the physical capital accumulation is positively affecting the regional income gaps. Moreover we continue to underline that regardless of the spatial specification of the econometric models the creative capital of regions is significantly explaining the regional income gaps as of year 2004. Again this finding is robust for the current (2004) and initial (1996) creative capital, yet once more the growth of the creative capital is not explaining the regional differences.
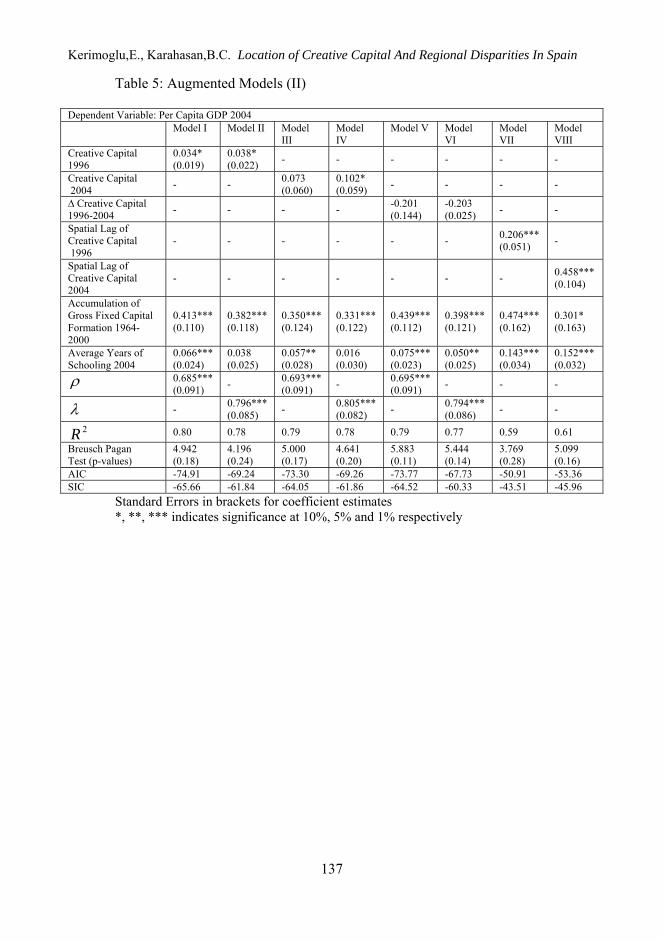
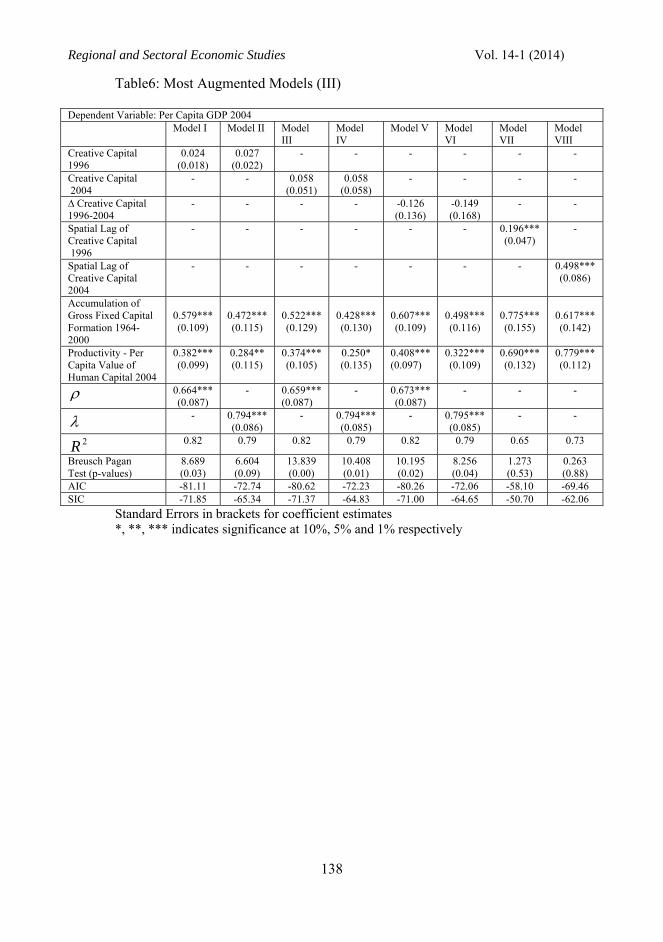
Finally the most augmented models are estimated by also using the human capital variable. Note that this is where we go back to a central criticism addressed to Florida regarding the confusion of creative capital and human capital. Table 5 (see in app.) gives the estimations results for average years of schooling to account for human capital differences. Table 6 (see in app.) gives the results for the per capita value of human capital to account for human capital differences. Note that per capita value of human capital also controls for the productivity of the labor force, yet we do not use this variable together with the averages years of schooling variable to escape from possible high correlations between the two human capital variables.
Kerimoglu,E., Karahasan,B.C. Location of Creative Capital And Regional Disparities In Spain
127
Results reported in Table 5 (see in app.) underlines that both the accumulation of gross fixed capital as well as the average years of schooling in general is positively and significantly affecting the regional differences in Spain. The exception is model II and IV, in which the average year of schooling variable is correctly signed yet insignificant. Above all in general there is a clear fall in the significance and the power of the creative capital for the spatial lag and error models. For the models I and II, results underline that creative capital base in 1996, which is initial creative capital is explaining the regional differences in SAR and SEM models only at 10% significance level. On the other hand current creative capital in 2004 in model IV is explaining the regional differences only for the SEM model again at 10% significance level but not for the SAR specification in model III. In addition to these findings models V and VI indicates that once more the growth of the creative capital from 1996 to 2004 is not explaining the regional differences. However for the models VII and VIII, the spatial spillover of the creative capital seems to continue to explain the regional differences.
This finding is robust both for the initial and current creative capital. That is to say both the initial as well as the existing creative capital spillover is explaining the current regional differences in Spain. All these findings become more consistent once the final set of models is estimated, this time by using the per capita value of human capital. Results reported in Table 6 (see in app.) shows that both the accumulation of physical capital as well as the productivity differences is positively and significantly explaining the current regional imbalances in Spain. More importantly model running from I to VI pin points that in the SAR and SEM models, the impact of the creative capital is non-existent. This finding together with the fall in the significance of the creative capital variable in the previous set of models (see table 5) indicate the importance of the criticism raised to Florida. What we have detected in the models including the human capital variables is that, impact of the human capital development seems to outperform the importance of the creative capital. Yet above all once more once we control for the spatial interactions to work over the creative capital, this time we find clear significant evidence that both the initial creative capital as well as the existing creative capital is affecting the recent regional differences in Spain by using the spillover mechanisms. Note that this finding is robust once we go back to table 5 that also pin points that spillover of creative capital in the initial as well as final year successfully explains the current inequalities even once we control for the average year of schooling of the provinces. In general the persistence of the significance of this spillover mechanism reminds us that, the way we treat the spatial autocorrelation in the econometric setting is crucial.
We believe empirical findings as well as the exploratory findings of the previous sub-section validate our initial concerns about the positive connection between how creative people are dispersed and the regional income gaps. Moreover even though the criticism to Florida regarding the confusion between creative capital and human capital seems to hold at the local level, a more careful investigation by allowing for creative capital spillover reminds us that it is still the creative capital that successfully explains the regional differences among the geography of Spain.
Regional and Sectoral Economic Studies Vol. 14-1 (2014)
128
6. Conclusion
The general tendency for locations to converge to or diverge from each other has numerous economical, social and cultural reasons. Among various determinants this study focuses on the creativity potential of locations by observing the spatial dispersion of creative capital and its inter-connection with the regional inequalities in Spain. Overall we believe our findings contribute to the literature by not only sharing the common concerns regarding the ongoing differences in Spain but also proposing that the way that creative capital is spilling over the geography of Spain is one of the determinants.
In line with the central objective, once we figure out how creative capital is dispersed among the geography of Spain, our first set of exploratory spatial data analysis indicate that for almost a decade from 1996 to 2004 there is a trend regarding the increase in the spatial autocorrelation of the creative capital in Spain. Likewise once we decompose this spatial association we realize that clusters composed of high share as well as low share of the creative capital locate in much or less the same geographies with high and low income provinces. In addition to that the local significance of these clusters also validate that among these locations there are significant regional spillovers that generates positive and negative economies depending on the level of creative employment. In general the north-eastern geography benefits from the positive economies, whereas the L-shape clusters running from north-southern to south-eastern Spain seem to suffer from the negative economies. The ingredient of the positive and negative economies is vital yet another research question. Still observing the common pattern between the income and creative capital spillovers is an important sign about the interdependencies. Still this exploratory investigation is just the visual verification of our concerns.
Yet once the econometric models are estimated we end up with a number of important findings. First of all the way we treat the spillover seem to affect our results seriously. Although the positive correlation between creative capital and regional differences are confirmed in the reduced form models, once we augment the model to control for human capital differences, things turn out to be different. In the most augmented models we realize that the spillover of the regional income differences as well as the omitted determinants seem to explain the regional inequalities together with some regional specific human capital and physical capital properties. In these cases both the current creative capital as well as the initial creative capital fail to explain the regional imbalances in Spain. However once we allow for the regional spillovers to work over the way that creative people are locating across the geography of Spain, we find clear and strong evidence that development of creative capital on a location has positive externality base effects on the regional development of its geography in terms of the general income levels. Thus even after controlling for human capital differences, it is possible to explain the regional differences by looking at the creative capital spillovers. These results are all confirming the general hypothesis of the research; regarding the positive link between creative capital and the local differences. The issue raised at the end of this research is remarking the importance of the way that one treats the link between creative people and local development.
Kerimoglu,E., Karahasan,B.C. Location of Creative Capital And Regional Disparities In Spain
129
We believe our findings contribute to the literature from two separate perspectives. For the discussion regarding the imbalances in Spain, we have to underline that inclusion of the labor force qualification and the way that creative industries plus related labor force affects local developments should gain importance. What Richard Florida and others mention about the significance of the creative industries is robust for an EU member country. On the other hand for the criticisms regarding the creative capital and human capital, we continue to follow the remarks of Florida; although it seems that human capital may dominate the creative capital once we allow for locations to differ for their physical and human capital accumulations, both the spatial patterns observed in the visualizations as well as the spillover mechanisms used in the final econometric settings underline that the geographical dispersion of the creative people is going to affect the surrounding. Finally, the reasons that influence the location choice of creative people are worth mentioning; yet currently stood as an important future research question in our agenda. References Anderson, A (1985) Creativity and Regional Development. Papers in Regional Science 56:5–20, doi10.1007/BF01887900 Anselin, L (1995) Local Indicators of Spatial Association—LISA. Geographical Analysis 27 (2): 93–115 Arora, A, Florida, F, Gates, GJ and Kamlet, M (2000) Human Capital, Quality of Place, and Location. Working Paper, H.J. Heinz III School of Public Policy. Pittsburg, PA: Carnegie Mellon University Boschma, R, Fritsch, M (2007) Creative Class and Regional Growth: Empirical Evidence from eight European Countries. Jena Economic Research Paper, Germany Capone, F (2006) Identification and analysis of cultural creative systems in Italy (1991-2001). 14th International Conference of the ACEI presentation Vienna 6-9 July 2006 Castello, A, Domenech, R (2002) Human Capital Inequality and Economic Growth: Some new evidence. the Economic Journal 112(478): 187-200 Chantelot, S, Peres, S, Virol, S (2010) The geography of French creative class: An exploratory spatial data analysis. Cahiers du GREThA, n°2010-16, http://ideas.repec.org/p/grt/wpegrt/2010-16.html Coe, D,T, Helpman, E, Hoffmaister, A,W (1997) North-South R&D Spillovers. Economic Journal, Royal Economic Society 107(440): 134-49 Cooke, P, Lazzeretti, L (2008) Creative cities, cultural clusters and local economic development. Edward Elgar, Cheltenham, UK Cuadrado JR, Mancha T, Garrido R (1998) Regional Convergence in Spain. Fundación Argentaria-Visor, Madrid DCMS (Department of Culture, Media and Sport-London, UK) (2001), Creative Industries Mapping Document de la Fuente, A (2002) On the sources of convergence: a close look at the Spanish Regions. European Economic Review 46:3,569–599
Regional and Sectoral Economic Studies Vol. 14-1 (2014)
130
Dinescu, M, C, Grigorovici, C (2008) The Creative Class – Research and Development Potential of the Cities–Driver of Economic Growth, Working Paper, http://steconomice.uoradea.ro/anale/volume/2008/v1-international-business-and-europeanintegration/050.pdf Florida, R (2002) The economic geography of talent. Annals of the Association of American Geographers 92(4): 743-755 Florida, R (2002a) The Rise of the Creative Class: and how it's transforming work, leisure, community and everyday life. New York, Basic Books Florida, R (2005) Cities and the Creative Class. New York: Routledge Florida, R, and Gates, G (2001) Technology and tolerance: The importance of diversity to hightechnology growth. Washington, D.C., Center on Urban and Metropolitan Policy, the Brookings Institution, http://www.urban.org/UploadedPDF/1000492_tech_and_tolerance.pdf Fritsch, M, Stuetzer, M (2009) The Geography of Creative People in Germany. International Journal of Foresight and Innovation Policy 5: 7-23 Fujita, M (1988) A monopolistic competition model of spatial agglomeration: a differentiated product approach. Regional Science and Urban Economics 18: 87–124 Glaeser, EL (1994) Cities, information and economic growth. Cityscape 1(1): 9-47 Gleaser, EL (2000) The new economics of urban and regional growth. In: Clark, Gertler, Feldman (eds.), the Oxford handbook of Economic Geography: 83-98. Oxford University Press Glaeser, E L (2005) Review of Richard Florida’s the rise of the creative class. Regional Science and Urban Economics 35(5): 593-96 Glaeser, E L, Kallal, H, Scheinkman, J and Shleifer, A (1992) Growth in Cities. Journal of Political Economy 100:1126-1152 Glaeser, E L, Saiz, A (2003) The rise of the skilled city. Working Paper No. 10191, National Bureau of Economic Research, Cambridge, MA Goerlich, FJ, Mas, M, Pérez, F (2002) Concentración, convergencia y desigualdad regional en Espana. Papeles Econ Esp 93: 17–36 Goonewardena, K (2004) Creative class struggle. Presentation at the INURA Conference on the Creative City, Amsterdam, June 13-20 Hartley, J (2005) Creative industries. Blackwell Publishing, Oxford Henderson, V, Kunkoro, M, Turner, M (1995) Industrial development of cities. The Journal of Political Economy 103 (5): 1067-1090 Hesmondhalgh, D, (2002) The Cultural Industries. London, Thousand Oaks, New Delhi: Sage Publications Howkins, J, (2001) The Creative Economy: How People Make Money from Ideas. New York: The Penguin Press Hoyman, M, Faricy, C, (2008) It Takes a Village, A Test of the Creative Class, Social Capital, and Human Capital Theories. Urban Affairs Review Online, July 2008, doi:10.1177/1078087408321496 Jacobs, J, (1961) The death and life of great American cities. New York: Random House
Kerimoglu,E., Karahasan,B.C. Location of Creative Capital And Regional Disparities In Spain
131
Jacobs, J, (1969) The economy of cities. New York: Random House Jacobs, J, (1970) The Economy of Cities. New York, NY: Vintage Book Jacobs, J, (1985) Cities and the Wealth of Nations. New York, NY: Vintage Book Karahasan, C, Lopez Bazo, E. (2013) The Spatial Distribution of Human Capital: Can it Really Be Explained by Regional Differences in Market Access. International Regional Science Review 36 (4): 451-480 Krugman, P, (1991) Increasing Returns and Economic Geography. The Journal of Political Economy 99 (3): 483-499 Lang, R, Danielsen, K (2005) Review Roundtable: Cities and Creative Class. Journal of American Planning Association 71: 203-220 Lazzeretti, L, Boix, R, Capone, F (2008) Do creative industries cluster? Mapping Creative Local Production Systems in Italy and Spain’, Working Paper, 01/03/2008, Departament d’Economia Aplicada, UAB Lladós, J (2002) Estructura productiva y desigualdad regional: la transición hacia el Euro y la economía del conocimiento. Papeles Econ Esp 93: 79–97 Lucas, R (1988) On the mechanics of economic development. Journal of Monetary Economics 22: 3-42 Maza, A, Villaverde, J (2009) Spatial Effects on Provincial Convergence and Income Distribution in Spain: 1985–2003. Tijdschrift voor Economische en Sociale Geografie 100(3): 316–331 McGranahan, D, Wojan, T (2007) Recasting the creative class to examine growth processes in rural and urban counties. Regional Studies 41(2): 197–216 Mallender C, Florida, R (2007) The creative class or human capital? explaining regional development in Sweden. CESIS Electronic Working Paper Series, paper no.79, January 2007 Mallender, C, Florida, R (2009) Creativity, talent and regional wages in Sweden. Annals of Regional Science 46(3): 637-660 Markusen, A, (2006) Urban development and the politics of a creative class: Evidence from a study of artists. Environment and Planning A 38(10): 1921–1940 Marlet, G, van Woerkens, C (2007) The Dutch Creative Class and How it Fosters Urban Employment Growth. Urban Studies 44 (13): 2605-2626 Mulligan, C, Sala-i-Martin, X (1997) A Labor Income Based Measure of Human Capital. Japan and the World Economy 9: 159–191 Mulligan, C, Sala-i-Martin, X (2000) Measuring aggregate human capital. Journal of Economic Growth 5: 215-52 Paci, R, Usai, S (2001) Externalities and Local Economic Growth in Manufacturing Industries. Working Paper http://www.crenos.it/working/pdf/01-13.pdf Pastor, JM, Pons, E, Serrano, L (2010) Regional inequality in Spain: permanent income versus current income. Annals of Regional Science 44: 121–145 DOI 10.1007/s00168-008-0236-9 Petrov, A, N (2008) Talent in the Cold? Creative Capital and the Economic Future of the Canadian North. ARCTIC 61(2): 162–176
Regional and Sectoral Economic Studies Vol. 14-1 (2014)
132
Power, D, Scott, A (2004) Cultural industries and the production of culture. Routledge, London Prados de la Escosura, L, P, Roses, J, R (2009) Human Capital and Economic Growth in Spain, 1850- 2000’, Working Papers in Economic History, August 2009, WP 09-06 Qian, H (2008) Talent, creativity and regional economic performance: the case of China. Annals of Regional Science, 45(1): 133-156 Raymond, JL (2002) Convergencia real de las regiones españolas y capital humano. Papeles Econ Esp 93: 109–121 Romer, P (1986) Increasing returns and long-run growth. Journal of Political Economy 84: 1002–1037 Romer, P (1990) Endogenous technological change. Journal of Political Economy 98 (5): 71-102 Romer, P (1993) Economic growth. In D.R. Henderson (Ed.) the Fortune Encyclopedia of Economics. New York, NY: Time Warner Books Shearmur, R (2007) The new knowledge aristocracy: A few thoughts on the creative class, mobility and urban growth. Work Organization, Labor and Globalization 1(1): 31–47 Serrano L, Pastor, J, M (2002): Capital Humano y Actividad Económica. El Valor Económico del Capital Humano en España, Fundación Bancaja Serrano L, Soler, A (2008) Metodología para la estimación de las series de capital humano, 1964-2007. Instituto Valenciano de Investigaciones Económicas – Fundación Bancaja. Valencia, Spain Simon, C (1998) Human capital and metropolitan employment growth. Journal of Urban Economics 43: 223-43 Simon, CJ, Nardinelli, C (2002) Human capital and the rise of American cities, 1900 – 1990. Regional Science and Urban Economics 32(1): 59–96 Tortosa- Ausina, E, Perez, F, Mas, M, Goerlich, FJ (2005) Growth and Convergence Profiles in the Spanish Provinces (1965–1997). Journal of Regional Science 45(1): 147-182 UNCTAD (2004) CreativeIndustries and Development, Eleventh session. Sao Paolo, 13-18 June 2004. http://www.unctad.org/en/docs//tdxibpd13_en.pdf Villaverde J (2001) La distribución espacial de la renta en España: 1980–1995. Papeles Econ Esp 88:166–181 Fuentes de datos SABI: http://www.buc.unican.es/content/sabi-sistema-de-analisis-de-balances-ibericos http://www.einforma.com/sabi?portal=GOO/tipo/S/?utm_source=google&utm_term=sistema%20de%20analisis%20de%20balances%20ibericos&utm_content=14632615256&Network=Search&SiteTarget=&gclid=COSL6JOSqrYCFUnMtAodQU8ARw Annex on line at the journal Website: http://www.usc.es/economet/rses.htm
Kerimoglu,E., Karahasan,B.C. Location of Creative Capital And Regional Disparities In Spain
133
Annex Figure 1*: Spatial distribution of creative capital in Spain
1996 2004
Developed Creative Capital Developing Creative Capital Emerging Creative Capital Less Developed Capital
Source: SABI (Sistema Anual de Balances Ibéricos). * Note: Development level of the creative capital is determined based on the density of creative workers within the labor force (per 10.000 employees)
Regional and Sectoral Economic Studies Vol. 14-1 (2014)
134
Figure 2: Performance of creative and human capital by provinces (1996 to 2004)
Annualized growth of creative employment
Change in the number of people with BA Degree
Source: SABI, INE (Instituto Nacional de Estadística), authors’ own calculations
Figure 3: Trends in global spatial autocorrelation of creative capital in Spain
Source: SABI. Note: All Moran’s I Stats are significant at 1% significance level
Kerimoglu,E., Karahasan,B.C. Location of Creative Capital And Regional Disparities In Spain
135
Table 3: Reduced Form Spatial Models Dependent Variable: Per Capita GDP 2004 Model
I Model II Model
III Model
IV Model V Model
VI Model
VII Model VIII
Creative Capital 1996
0.051** (0.022)
0.048** (0.025) - - - - - -
Creative Capital 2004 - - 0.191***
(0.049) 0.163*** (0.050) - - - -
∆ Crea. Cap 1996-2004 - - - - -0.135
(0.172) -0.111 (0.203) - -
Spatial Lag of Creative Capital 1996
- - - - - - 0.282*** (0.061) -
Spatial Lag of Creative Capital 2004
- - - - - - - 0.634*** (0.121)
ρ 0.764*** (0.091)
- 0.712*** (0.049)
- 0.799*** (0.084)
- - -
λ - 0.799*** (0.084)
- 0.788*** (0.087)
- 0.805*** (0.082)
- -
2R 0.71 0.70 0.75 0.74 0.69 0.69 0.32 0.37
Breusch Pagan Test (p-values)
1.030 (0.31)
1.633 (0.20)
0.909 (0.34)
0.662 (0.42)
0.474 (0.49)
0.798 (0.37)
3.466 (0.07)
5.356 (0.03)
AIC -59.81 -60.48 -67.96 -66.26 -55.49 -57.18 -30.59 -34.92 SIC -54.26 -56.78 -62.41 -62.56 -49.94 -53.48 -26.89 -31.22
Standard Errors in brackets for coefficient estimates *, **, *** indicates significance at 10%, 5% and 1% respectively
Regional and Sectoral Economic Studies Vol. 14-1 (2014)
136
Table 4: Augmented Spatial Models (I) Dependent Variable: Per Capita GDP 2004 Model I Model II Model
III Model IV
Model V Model VI
Model VII
Model VIII
Creative Capital 1996
0.046** (0.019)
0.044** (0.022)
- - - - - -
Creative Capital 2004
- - 0.133*** (0.050)
0.120** (0.048)
- - - -
∆ Creative Capital 1996-2004
- - - - -0.214 (0.150)
-0.179 (0.180)
- -
Spatial Lag of Creative Capital 1996
- - - - - - 0.274*** (0.056)
-
Spatial Lag of Creative Capital 2004
- - - - - - - 0.575*** (0.122)
Accumulation of Gross Fixed Capital Formation 1964-2000
0.437*** (0.116)
0.411*** (0.118)
0.312** (0.126)
0.331*** (0.122)
0.472*** (0.120)
0.434*** (0.122)
0.557*** (0.188)
0.351* (0.197)
ρ 0.763*** (0.082)
- 0.738*** (0.085)
- 0.792*** (0.078)
- - -
λ - 0.819***
(0.078) - 0.813***
(0.080) - 0.822***
(0.077) - -
2R 0.77 0.77 0.78 0.78 0.76 0.76 0.43 0.42
Breusch Pagan Test (p-values)
6.145 (0.05)
6.228 (0.04)
3.819 (0.14)
3.970 (0.13)
5.621 (0.06)
6.494 (0.03)
2.383 (0.30)
4.588 (0.10)
AIC -70.56 -69.12 -71.69 -70.99 -67.33 -66.24 -37.12 -36.19 SIC -63.16 -63.57 -64.29 -65.44 -59.93 -60.69 -31.57 -30.64
Standard Errors in brackets for coefficient estimates *, **, *** indicates significance at 10%, 5% and 1% respectively
Kerimoglu,E., Karahasan,B.C. Location of Creative Capital And Regional Disparities In Spain
137
Table 5: Augmented Models (II) Dependent Variable: Per Capita GDP 2004 Model I Model II Model
III Model IV
Model V Model VI
Model VII
Model VIII
Creative Capital 1996
0.034* (0.019)
0.038* (0.022) - - - - - -
Creative Capital 2004 - - 0.073
(0.060) 0.102* (0.059) - - - -
∆ Creative Capital 1996-2004 - - - - -0.201
(0.144) -0.203 (0.025) - -
Spatial Lag of Creative Capital 1996
- - - - - - 0.206*** (0.051) -
Spatial Lag of Creative Capital 2004
- - - - - - - 0.458*** (0.104)
Accumulation of Gross Fixed Capital Formation 1964-2000
0.413*** (0.110)
0.382*** (0.118)
0.350*** (0.124)
0.331*** (0.122)
0.439*** (0.112)
0.398*** (0.121)
0.474*** (0.162)
0.301* (0.163)
Average Years of Schooling 2004
0.066*** (0.024)
0.038 (0.025)
0.057** (0.028)
0.016 (0.030)
0.075*** (0.023)
0.050** (0.025)
0.143*** (0.034)
0.152*** (0.032)
ρ 0.685*** (0.091) - 0.693***
(0.091) - 0.695*** (0.091) - - -
λ - 0.796*** (0.085) - 0.805***
(0.082) - 0.794*** (0.086) - -
2R 0.80 0.78 0.79 0.78 0.79 0.77 0.59 0.61 Breusch Pagan Test (p-values)
4.942 (0.18)
4.196 (0.24)
5.000 (0.17)
4.641 (0.20)
5.883 (0.11)
5.444 (0.14)
3.769 (0.28)
5.099 (0.16)
AIC -74.91 -69.24 -73.30 -69.26 -73.77 -67.73 -50.91 -53.36 SIC -65.66 -61.84 -64.05 -61.86 -64.52 -60.33 -43.51 -45.96
Standard Errors in brackets for coefficient estimates *, **, *** indicates significance at 10%, 5% and 1% respectively
Regional and Sectoral Economic Studies Vol. 14-1 (2014)
138
Table6: Most Augmented Models (III)
Dependent Variable: Per Capita GDP 2004 Model I Model II Model
III Model IV
Model V Model VI
Model VII
Model VIII
Creative Capital 1996
0.024 (0.018)
0.027 (0.022)
- - - - - -
Creative Capital 2004
- - 0.058 (0.051)
0.058 (0.058)
- - - -
∆ Creative Capital 1996-2004
- - - - -0.126 (0.136)
-0.149 (0.168)
- -
Spatial Lag of Creative Capital 1996
- - - - - - 0.196*** (0.047)
-
Spatial Lag of Creative Capital 2004
- - - - - - - 0.498*** (0.086)
Accumulation of Gross Fixed Capital Formation 1964-2000
0.579*** (0.109)
0.472*** (0.115)
0.522*** (0.129)
0.428*** (0.130)
0.607*** (0.109)
0.498*** (0.116)
0.775*** (0.155)
0.617*** (0.142)
Productivity - Per Capita Value of Human Capital 2004
0.382*** (0.099)
0.284** (0.115)
0.374*** (0.105)
0.250* (0.135)
0.408*** (0.097)
0.322*** (0.109)
0.690*** (0.132)
0.779*** (0.112)
ρ 0.664*** (0.087)
- 0.659*** (0.087)
- 0.673*** (0.087)
- - -
λ - 0.794***
(0.086) - 0.794***
(0.085) - 0.795***
(0.085) - -
2R 0.82 0.79 0.82 0.79 0.82 0.79 0.65 0.73
Breusch Pagan Test (p-values)
8.689 (0.03)
6.604 (0.09)
13.839 (0.00)
10.408 (0.01)
10.195 (0.02)
8.256 (0.04)
1.273 (0.53)
0.263 (0.88)
AIC -81.11 -72.74 -80.62 -72.23 -80.26 -72.06 -58.10 -69.46 SIC -71.85 -65.34 -71.37 -64.83 -71.00 -64.65 -50.70 -62.06
Standard Errors in brackets for coefficient estimates *, **, *** indicates significance at 10%, 5% and 1% respectively
Kerimoglu,E., Karahasan,B.C. Location of Creative Capital And Regional Disparities In Spain
139
Table 7: Alternative Models: Testing the Impact of Creative Capital on Regional Growth Dependent Variable: Growth of Per Capita GDP 2004 Model I Model
II Model III
Model IV
Model V
Model VI
Model VII
Model VIII
Creative Capital 1996
-0.0009 (0.001)
-0.001 (0.001)
- - - - - -
Creative Capital 2004
- - 0.0003 (0.003)
0.0004 (0.003)
- - - -
∆ Creative Capital 1996-2004
- - - - 0.002 (0.010)
0.006 (0.011)
- -
Spatial Lag of Creative Capital 1996
- - - - - - 0.001 (0.002)
-
Spatial Lag of Creative Capital 2004
- - - - - - - -0.009* (0.005)
Per Capita GDP 1996
- - -0.010* (0.005)
-0.011* (0.006)
- - - -
ρ 0.340** (0.178)
- 0.202 (0.191)
- 0.341* (0.179)
- - -
λ - 0.358**
(0.176) - 0.195
(0.197) - 0.365**
(0.175) - -
2R 0.10 0.11 0.15 0.15 0.09 0.10 0.01 0.06
Breusch Pagan Test (p-values)
2.586 (0.11)
2.602 (0.11)
0.406 (0.82)
0.426 (0.81)
1.783 (0.18)
2.314 (0.12)
0.083 (0.77)
0.282 (0.60)
AIC -329.14 -331.43 -330.88 -332.74 -328.71 -330.96 -327.65 -330.45 SIC -323.59 -327.73 -323.48 -327.19 -323.16 -327.26 -323.95 -326.75
Standard Errors in brackets for coefficient estimates *, **, *** indicates significance at 10%, 5% and 1% respectively
Journal published by the EAAEDS: http://www.usc.es/economet/eaat.htm