Locally coordinated synaptic plasticity shapes cell …...24 in synaptic strength of identified...
37
1 1 Title: Locally coordinated synaptic plasticity shapes cell-wide 2 plasticity of visual cortex neurons in vivo 3 4 Authors: Sami El-Boustani 1 *†, Jacque P K Ip 1 †, Vincent Breton-Provencher 1 , Hiroyuki 5 Okuno 2 , Haruhiko Bito 3 & Mriganka Sur 1 * 6 7 Affiliations: 8 1 Department of Brain and Cognitive Sciences, Picower Institute for Learning and Memory, 9 Massachusetts Institute of Technology, 77 Massachusetts Avenue, Cambridge, Massachusetts 10 02139, USA. 11 2 Medical Innovation Center, Kyoto University Graduate School of Medicine, Sakyo-ku, 12 Kyoto 606-8507, Japan. 13 3 Department of Neurochemistry, Graduate School of Medicine, The University of Tokyo, 14 Hongo 7-3-1, Bunkyo-ku, Tokyo 113-0033, Japan. 15 16 * Correspondence to: Mriganka Sur ([email protected]) and Sami El-Boustani 17 ([email protected]) 18 † These authors contributed equally to this work. 19 author/funder. All rights reserved. No reuse allowed without permission. The copyright holder for this preprint (which was not peer-reviewed) is the . https://doi.org/10.1101/249706 doi: bioRxiv preprint
Transcript of Locally coordinated synaptic plasticity shapes cell …...24 in synaptic strength of identified...

1
1
Title: Locally coordinated synaptic plasticity shapes cell-wide 2
plasticity of visual cortex neurons in vivo 3
4
Authors: Sami El-Boustani1*†, Jacque P K Ip1†, Vincent Breton-Provencher1, Hiroyuki 5
Okuno2, Haruhiko Bito3 & Mriganka Sur1* 6
7
Affiliations: 8
1Department of Brain and Cognitive Sciences, Picower Institute for Learning and Memory, 9
Massachusetts Institute of Technology, 77 Massachusetts Avenue, Cambridge, Massachusetts 10
02139, USA. 11
2Medical Innovation Center, Kyoto University Graduate School of Medicine, Sakyo-ku, 12
Kyoto 606-8507, Japan. 13
3 Department of Neurochemistry, Graduate School of Medicine, The University of Tokyo, 14
Hongo 7-3-1, Bunkyo-ku, Tokyo 113-0033, Japan. 15
16
* Correspondenceto:Mriganka Sur ([email protected]) and Sami El-Boustani 17
†These authors contributed equally to this work. 19
author/funder. All rights reserved. No reuse allowed without permission. The copyright holder for this preprint (which was not peer-reviewed) is the. https://doi.org/10.1101/249706doi: bioRxiv preprint
2
Abstract: Plasticity of cortical responses involves activity-dependent changes at synapses, 20
but the manner in which different forms of synaptic plasticity act together to create functional 21
changes in neuronal responses remains unknown. Here we show that spike-timing induced 22
receptive field plasticity of individual visual cortex neurons in vivo is anchored by increases 23
in synaptic strength of identified spines, and is accompanied by a novel decrease in the 24
strength of adjacent spines on a slower time scale. The locally coordinated potentiation and 25
depression of spines involves prominent AMPA receptor redistribution via targeted 26
expression of the immediate early gene Arc. Similar changes accompany recovery of eye-27
specific responses following monocular deprivation. These findings demonstrate that 28
Hebbian strengthening of activated synapses and heterosynaptic weakening of adjacent 29
synapses, in dendrites with heterogeneous synaptic inputs, co-operatively orchestrate cell-30
wide plasticity of functional neuronal responses. 31
32
One Sentence Summary: Arc-mediated local synaptic plasticity regulates reorganization of 33
synaptic responses on dendritic stretches to mediate functional plasticity of neuronal 34
responses in vivo. 35
36
author/funder. All rights reserved. No reuse allowed without permission. The copyright holder for this preprint (which was not peer-reviewed) is the. https://doi.org/10.1101/249706doi: bioRxiv preprint

3
Main Text: 37
Neuronal circuits in the developing and mature brain are subject to dramatic changes driven 38
by sensory inputs (1, 2) or motor learning (3–5), causing cells to modify their responses to 39
individual inputs while maintaining a relatively stable level of activity (6). Global 40
mechanisms such as cell-wide homeostatic plasticity were initially reported for stabilizing the 41
output firing rate of a cell by uniformly scaling up or down the effective strength of all its 42
synapses (6, 7). More recent experimental evidence in vitro has suggested that other forms of 43
compensatory plasticity can also act locally at the level of dendritic stretches (8–13) or even 44
at single synapses (14–16) and that potentially confer rich functional compartmentalization 45
within the dendritic tree (17–19). However, the precise mechanisms that regulate potentiation 46
of specific synapses, depression of other synapses, and the co-operative reorganization of 47
synaptic strength on individual neurons to mediate functional plasticity in vivo, remain 48
unexplored. 49
50
In particular, it has been pointed out that the joint action of Hebbian and homeostatic 51
plasticity in synaptic ensembles could impede the formation of new functions by cancelling 52
each other (19). Alternatively synaptic potentiation at specific dendritic locations could be 53
coordinated with heterosynaptic depression of nearby synapses within short stretches of the 54
same dendrite in order to co-operatively implement functional plasticity of single cell 55
responses. Such local plasticity could be particularly effective at reinforcing selective 56
responses in dendritic compartments displaying functionally intermixed synaptic inputs. 57
However, it is unknown whether locally coordinated synaptic plasticity occurs during 58
physiological conditions in vivo, and whether it has a role in shaping neuronal responses. 59
Here we have addressed these questions by using visual-optogenetic pairing to induce 60
receptive field plasticity in single visual cortex neurons of awake mice, and asking how such 61
author/funder. All rights reserved. No reuse allowed without permission. The copyright holder for this preprint (which was not peer-reviewed) is the. https://doi.org/10.1101/249706doi: bioRxiv preprint
4
plasticity is implemented by local Hebbian potentiation and heterosynaptic depression of 62
identified synapses on neuronal dendrites. 63
64
Induction of receptive field plasticity in single-neurons of awake mice 65
Classical in vivo plasticity induced by sensory deprivation or enrichment (2) inevitably 66
results in large-scale polysynaptic functional and structural changes. To isolate synaptic 67
changes in single neurons in vivo, we first developed a controlled paradigm for inducing 68
plasticity at identified synapses on single neurons in the primary visual cortex (V1) of awake 69
juvenile mice (P28-P35), using a pairing protocol where individual neurons were forced to 70
fire action potentials soon after presentation of a target visual stimulus (20–22). A sparse 71
noise stimulus ensemble (white squares on a 4 by 5 grid, see Fig. 1A and Materials and 72
Methods) was used to measure single-cell receptive fields and to induce plasticity. Pairing 73
visual stimuli presented at a target location with channelrhodopsin-2 (ChR2) driven spiking 74
of a single neuron allowed us to increase the strength of a subset of excitatory synapses at 75
spines on the neuron - as evident by a shift in the neuron’s receptive field towards the target 76
location - and examine the effects on the function and structure of these and a wide range of 77
other spines (Fig. 1B). First, we characterized the population excitatory synaptic inputs to V1 78
layer 2/3 neurons in response to sparse noise stimuli using whole-cell recordings in voltage-79
clamp mode (Fig. 1C). Excitatory subthreshold receptive fields were large, but with centroids 80
that could be clearly identified (Fig. 1D-E). The EPSC evoked by the sparse noise stimuli 81
typically displayed two components corresponding to stimulus onset and offset respectively 82
(Fig. 1F). The response at stimulus onset was sharp, unimodal and lasted for about 200 ms 83
with a peak response at 65-130 ms (mean 96.3±7.4 ms, n=8 neurons) after stimulus onset. 84
Based on previous studies (21, 22), we reasoned that pairing a visual stimulus at a target 85
location with ChR2 activation of a postsynaptic neuron at a sufficient latency within the onset 86
author/funder. All rights reserved. No reuse allowed without permission. The copyright holder for this preprint (which was not peer-reviewed) is the. https://doi.org/10.1101/249706doi: bioRxiv preprint

5
EPSC response (150 ms after stimulus onset) would be an effective pre-leading-post 87
(synaptic input-action potential) protocol for inducing Hebbian potentiation of excitatory 88
synapses responding to the target stimulus, and hence for inducing receptive field shifts at the 89
soma. 90
91
To reliably induce and measure receptive field plasticity of single neurons over an extended 92
period of time, we recorded visually-evoked Ca2+ transients of these neurons and 93
optogenetically manipulated their firing. Using single-cell electroporation, we delivered two 94
plasmids into single neurons encoding respectively the calcium indicator GCaMP6s (23) with 95
mRuby fluorescent protein, and ChR2 (24) fused with a mCherry fluorescent protein (Fig. 96
1G,H, see Materials and Methods). Expression of ChR2 allowed precise and reliable control 97
of neuron activity in awake mice with on average a single spike evoked for each blue light 98
pulse (Fig. 1I, n=7 neurons, number of spikes/pulse = 1.2±0.32). Prior to inducing receptive 99
field plasticity in single cells, we used the GCaMP6s signal to map the receptive field 100
measured at the soma (Fig. 1J-K, Fig. S1A-B). Based on the spatial distribution of the 101
receptive field we determined a target stimulus location in the vicinity of the peak response 102
location. Repeated presentations of the target stimulus were then paired with single blue light 103
pulses delivered to the cortex to elicit spikes in the imaged neurons (60 pairings, see 104
Materials and Methods). A distractor stimulus was presented in-between each pairing to 105
prevent fixation at the target location (Fig. 1A). The effect of this pairing was assessed by 106
measuring the receptive field of the same neuron 1 to 2 hours after the end of the protocol. 107
For most neurons, the receptive field center-of-mass shifted toward the target stimulus as a 108
result of the pairing (Fig. 1K-L), indicating that the protocol successfully altered the neuron’s 109
synaptic weights (Fig. 1B). These receptive field changes lasted for several hours and were 110
not observed when ChR2 stimulation was not paired with the target stimulus (Fig. 1L). 111
author/funder. All rights reserved. No reuse allowed without permission. The copyright holder for this preprint (which was not peer-reviewed) is the. https://doi.org/10.1101/249706doi: bioRxiv preprint

6
Moreover receptive field shifts could not be explained by changes in eye position statistics 112
(Fig. S2) and did not induce noticeable functional changes in the surrounding network (Fig. 113
S3). Successful receptive field shifts could also be achieved with long pairing times at low 114
pairing rate (Fig. S4). 115
116
Synaptic inputs are functionally heterogeneous along dendritic stretches 117
In order to understand how synapses on imaged neurons were affected by the plasticity 118
protocol, we first defined responses of identified spines and their distribution on dendrites. 119
GCaMP6s and mRuby signals were imaged in stretches of dendrites and spine-specific 120
calcium responses were isolated (Fig. 2A-C). The shape and volume of spines were estimated 121
based on the mRuby structural fluorescence signal. The fluorescent GCaMP6s activity in 122
individual spines in response to sparse noise stimuli was used to measure input-specific 123
receptive fields (see Materials and Methods and Fig. S1C-F). We found a heterogeneous 124
distribution of spine receptive fields along the dendritic tree (Fig. 2D). This was assessed by 125
comparing for each cell the distribution of receptive field center-of-mass distance between 126
pairs of spines belonging to the same dendrite or to different dendrites (Fig. 2E). Although 127
spines along the same dendritic stretches had significantly closer receptive fields than spines 128
in different stretches, the two distributions overlapped considerably. Moreover, no clear 129
spatial organization of receptive fields was found for spines lying along the same dendrite, 130
indicating a functionally heterogeneous mixture of synapses, and of their presynaptic neurons, 131
on dendrites (Fig. 2F-G). 132
133
Hebbian potentiation and heterosynaptic depression in functionally heterogeneous 134
dendritic spines 135
author/funder. All rights reserved. No reuse allowed without permission. The copyright holder for this preprint (which was not peer-reviewed) is the. https://doi.org/10.1101/249706doi: bioRxiv preprint

7
We next investigated the structural and functional basis at the synaptic level of receptive field 136
plasticity at the soma (Fig. 1B). Spines receiving synaptic inputs during the narrow time 137
window following target stimulus onset (Fig. 1F, inset) could be identified by averaging their 138
calcium responses during the first second following stimulus onset (Fig. 2D). By repetitively 139
pairing the activation of a subset of synapses to a somatic spike through ChR2 activation 140
delivered 150 ms after stimulus onset, we specifically targeted these synapses for potentiation 141
through spike-timing-dependent plasticity (21, 22). To compare functional changes at the 142
soma with plasticity in functionally identified spines, we used increased or decreased spine 143
volume as a structural proxy for long-term potentiation (25–27) or depression (27) 144
respectively. Because we used a short pairing protocol, we hypothesized that spines within 145
the same dendritic branches that experience depression will do so through heterosynaptic 146
plasticity acting on a slower time scale in response to local targeted potentiation. By 147
comparing dendritic spines before and at several time points following the pairing protocol, 148
we indeed observed bi-directional volume changes within the same dendritic stretch with 149
seemingly different temporal dynamics (Fig. 3A). These changes were not the result of drift 150
in the imaging planes (Fig. S5). Such structural long-term potentiation (sLTP) or depression 151
(sLTD) in ChR2-expressing (ChR2+) neurons were compared to changes observed in control 152
experiments where neurons did not express ChR2 (ChR2- neurons; Fig. 3B-C). We 153
quantified changes in spine volume using the normalized difference between the integrated 154
spine fluorescence signal relative to shaft before and after the pairing (see Materials and 155
Methods). The normalized difference (δV) is contained in the range [-1,1] with positive 156
values for spines that became larger after pairing and negative values for spines that became 157
smaller (Fig. 3B). The proportion of spines for different volume change values revealed a 158
balanced increase of sLTP and sLTD spines in ChR2+ neurons as measured at least 2 hours 159
following the pairing (Fig. 3C). To assess the effect of the pairing protocol on spine structure 160
above chance level, we defined a threshold for pairing-induced sLTP and sLTD in ChR2+ 161
author/funder. All rights reserved. No reuse allowed without permission. The copyright holder for this preprint (which was not peer-reviewed) is the. https://doi.org/10.1101/249706doi: bioRxiv preprint

8
neurons based on the spine volume change distribution in ChR2- neurons (a δV value of 162
±0.25, corresponding to spines that exceeded the 97th percentile of the ChR2- distribution; 163
Fig. S6). By considering spines that became significantly potentiated or depressed more than 164
two hours following pairing, we could backtrack their temporal evolution to the pairing 165
protocol (Fig. 3D). We found that sLTP spines rapidly increased in volume right after pairing 166
followed by a moderate increase over the following two hours. In contrast, sLTD spines 167
showed a small decrease in volume soon after pairing that strongly declined over the course 168
of the following two hours until the average volume change for both sLTD and sLTP spines 169
became approximately balanced. These different temporal dynamics indicate that fast 170
Hebbian potentiation is first induced in targeted spines closely followed by heterosynaptic 171
depression of other spines acting on the timescale of minutes to hours. We then investigated 172
coordination between sLTP and sLTD spines within individual dendrites by comparing their 173
density and distribution (Fig. 3E). The density of sLTD spines was significantly correlated 174
with, and was greater than, the density of sLTP spines (Fig. 3F). Because spine density is 175
quite variable along dendrites, we examined the distribution of depressed spines around 176
potentiated spines by computing the deviation of sLTD spine density from the mean as a 177
function of distance from sLTP spines for each dendrite (see Materials and Methods). We 178
reasoned that if sLTD spines were more likely to be found around sLTP spines, we would see 179
a significantly larger density at short sLTP-sLTD distances. The pairing protocol indeed 180
resulted in significantly larger sLTD spine density in the vicinity of sLTP spines (Fig. 3G). 181
182
We investigated the functional signature associated with these structural changes to evaluate 183
if they were consistent with receptive field plasticity measured at the soma. In particular, we 184
hypothesized that sLTP spines should have their receptive field centers close to or 185
overlapping the visual target as a consequence of Hebbian plasticity, whereas sLTD spines 186
author/funder. All rights reserved. No reuse allowed without permission. The copyright holder for this preprint (which was not peer-reviewed) is the. https://doi.org/10.1101/249706doi: bioRxiv preprint

9
would have receptive field centers located away from the target as a consequence of 187
heterosynaptic, potentially co-operative, plasticity. Spines with receptive fields overlapping 188
the target stimulus indeed increased in volume (Fig. 3H,I), whereas spines with receptive 189
fields centered away from the target were reduced in volume (Fig. 3H,J). These structural 190
changes were accompanied by consistent changes in GCaMP6s signal amplitude (Fig. S7). 191
To examine at the population level whether functional plasticity of neuronal receptive fields 192
was accompanied by structural and functional changes in spines, we examined the receptive 193
fields of all spines that underwent sLTP or sLTD, relative to the target stimulus location used 194
for each neuron (Fig. 3K). The average receptive field for sLTP spines was sharp and 195
centered on the target whereas the average receptive field for sLTD spines was distributed 196
broadly away from and around the target. The difference between these average receptive 197
fields (Fig. 3L) highlighted the observation that sLTP spines were specifically targeted by the 198
pairing protocol whereas sLTD spines had receptive fields away from the target and resulted 199
in response reduction around the target stimulus. Quantifying the spine volume difference for 200
sLTP and sLTD spines as a function of their receptive field center distance from the target 201
stimulus showed that as the distance from target increased, the effect on spine size shifted 202
from sLTP to sLTD (Fig. 3M). The organized distribution of sLTP and sLTD spines, and the 203
location of their receptive fields, demonstrates that targeted Hebbian potentiation 204
accompanied by local heterosynaptic depression remodels synaptic inputs within functionally 205
heterogeneous dendrites, to enable cell-wide functional receptive field plasticity. 206
207
Arc and AMPAR dynamics in dendrites following receptive field plasticity 208
To assess mechanisms of functional and structural changes resulting from the pairing 209
protocol, we electroporated AMPA receptor (AMPAR) subunit 1 tagged with a pH-sensitive 210
form of GFP (Super Ecliptic pHluorin) SEP-GluA1 (18, 28) into single neurons to restrict the 211
author/funder. All rights reserved. No reuse allowed without permission. The copyright holder for this preprint (which was not peer-reviewed) is the. https://doi.org/10.1101/249706doi: bioRxiv preprint

10
signal to membrane-inserted receptors, together with ChR2 and a volume-filling marker 212
DsRed2, and imaged neurons 5-10 days after electroporation. Because SEP-GluA1 utilizes 213
GFP as indicator, and to determine a target stimulus for plasticity induction, we 214
electroporated GCaMP6s into neighboring neurons (Fig. 4A) that shared a substantial 215
proportion of their subthreshold receptive field (Fig. S8) – the target was placed near their 216
receptive field. Several days after electroporation, a strong and distinct SEP fluorescence 217
signal could be observed at the surface of individual spines (Fig. 4B, left) indicating the 218
density of AMPARs inserted in the membrane. Comparing the normalized change in SEP-219
GluA1 density and volume in individual spines two or more hours following the short or long 220
pairing protocol (Fig. S4), we found a significant positive correlation (Fig. 4C-E), indicating 221
that positive or negative changes in volume reflected corresponding modifications of spine 222
synaptic weight through AMPAR expression changes. 223
224
The immediate early gene Arc has been previously shown to be involved in AMPAR 225
endocytosis (29) and in mediating homeostatic plasticity in cell cultures (30). Recent work 226
has suggested that Arc preferentially interacts with the β isoform of CaMKII and acts as an 227
inverse tag of plasticity (31) that could potentially act in local dendritic segments to mediate 228
heterosynaptic depression (32). However, the single-spine dynamics of Arc in vivo in 229
response to plasticity induction remain unexplored. We employed a monomeric EGFP-tagged 230
Arc (mEGFP-Arc) probe under the control of the Arc promoter to study the molecular 231
dynamics of Arc following the pairing protocol (31) (Fig. 4B, right). The accumulation of 232
Arc in dendritic spines becomes strongly significant about 2 hours following plasticity 233
induction in vitro (31). Interestingly, we found that Arc-EGFP changes during volume 234
changes were complementary to and mirrored changes in AMPAR density (Fig. 4C-E). Thus, 235
Arc expression density was increased in sLTD spines and decreased in sLTP spines, 236
author/funder. All rights reserved. No reuse allowed without permission. The copyright holder for this preprint (which was not peer-reviewed) is the. https://doi.org/10.1101/249706doi: bioRxiv preprint

11
supporting the idea that Arc acts as an inverse tag on spines that did not previously 237
experience potentiation and therefore could be subject to heterosynaptic depression. We 238
further tested if the level of Arc-EGFP and SEP-GluA1 modulation was dendrite-specific. 239
We found that the average spine volume change for individual dendrites was correlated with 240
the average change of spine SEP-GluA1 and anti-correlated with the average change of spine 241
Arc-EGFP (Fig. 4E). These correlations were not found for Arc-EGFP and SEP-GluA1 242
signals in the dendritic shaft. 243
244
Role of Arc in regulating AMPAR distribution and receptive field plasticity 245
To further examine the role of Arc in mediating spine-specific heterosynaptic depression in 246
vivo, we delivered small hairpin RNA (shRNA, see Materials and Methods and Fig. S9 and 247
S10) to deplete Arc in single neurons. This plasmid was electroporated together with SEP-248
GluA1 to track surface AMPAR distribution (Fig. 5A). We imaged neurons 5-10 days after 249
electroporation to study the long-term effects of Arc depletion. Neurons in which Arc was 250
knocked down displayed dendrites populated with mature spines filled with SEP-GluA1 251
compared to control neurons with unaltered Arc expression (Fig. 5B). The distribution was 252
skewed with a large variance in the control condition, indicating a more heterogeneous 253
distribution of surface AMPAR density as compared to the knock down condition, while the 254
latter had a lower ‘hot spot index’ (see Materials and Methods) indicating more closely 255
located spines with high surface SEP-GluA1 density (Fig. 5B, inset). The functional 256
consequence of abnormal AMPAR distribution was assessed by using the pairing protocol in 257
Arc knock down neurons expressing GCaMP6s and ChR2 (Fig. 5C). We quantified the 258
change in calcium activity following pairing by measuring average amplitude and frequency 259
of GCaMP6s transients for neurons with unaltered Arc or Arc knock down (Fig. 5D-E). 260
Neurons with normal Arc expression showed no changes in the average amplitude of 261
author/funder. All rights reserved. No reuse allowed without permission. The copyright holder for this preprint (which was not peer-reviewed) is the. https://doi.org/10.1101/249706doi: bioRxiv preprint

12
GCaMP6s transients but displayed a significant reduction of transient frequency. We posit 262
that this is caused by a strong synaptic depression in response to the pairing protocol to 263
balance the newly potentiated spines. In contrast, neurons with reduced Arc expression 264
displayed increased transient frequency after the pairing protocol (Fig. 5E). These data 265
suggest that co-operation between synaptic potentiation and depression is altered in neurons 266
lacking Arc expression, likely causing reduced AMPAR endocytosis. We then compared the 267
distance between neuronal receptive field centers and target before and after the pairing, and 268
found that knock down of Arc prevented displacement of receptive fields toward the target 269
(Fig. 5F), consistent with impaired functional plasticity (33). Functional and structural 270
imaging of spines indicated that the lack of neuronal receptive field plasticity could 271
potentially be explained by reduced functional segregation between potentiated and 272
depressed spines (Figs. S10 and S11). [Note that we did not find any changes in spine density 273
following the pairing protocol in any of these conditions (Fig. S12)]. Thus, Arc is critical for 274
altering AMPAR expression at synapses and driving a mechanism that underlies receptive 275
field plasticity of neurons. 276
277
We then investigated whether coordinated spine potentiation and depression within 278
individual dendrites was altered in the absence of Arc. In contrast to neurons with normal Arc 279
expression, the density of sLTP spines was not significantly different from the density of 280
sLTD spines for neurons with Arc knock down (Fig. 5G). Furthermore, in dendrites with 281
normal Arc expression, the pairing protocol resulted in significantly larger sLTD spine 282
density in the vicinity of sLTP spines (Fig. 5H, left) whereas this effect was absent when Arc 283
was knocked down, (Fig. 5H, right) indicating impaired spatial organization of 284
heterosynaptic plasticity around potentiated spines. In all these conditions we did not observe 285
author/funder. All rights reserved. No reuse allowed without permission. The copyright holder for this preprint (which was not peer-reviewed) is the. https://doi.org/10.1101/249706doi: bioRxiv preprint

13
any specific organization of potentiated spines along the dendrite (Fig. S13). Thus, Arc helps 286
organize the distribution of potentiated and depressed spines that underlies neuronal plasticity. 287
288
Spine-specific Hebbian potentiation and heterosynaptic depression at eye opening 289
following monocular deprivation 290
Finally, we examined whether Arc-mediated spine-specific heterosynaptic interactions, 291
specifically the paired expression of sLTP and sLTD in nearby spines, occurs under 292
physiological conditions where neurons are not manipulated with optogenetics. V1 neurons 293
show reduced responses from a deprived eye following monocular deprivation, followed by 294
recovery of responses when the deprived eye is re-opened (Fig. 6A); loss of Arc abolishes the 295
effects of monocular deprivation or visual experience (33). We imaged V1 neurons in the 296
binocular zone following 4-5 days of monocular deprivation before and after eye opening 297
during the critical period for ocular dominance plasticity (2) (Fig. 6A-C), to assess how an 298
increase in synaptic drive from the reopened eye remodeled spines. The ocular dominance 299
index (ODI) was measured in neurons expressing GCaMP6s-P2A-mRuby (Fig. 6D), at the 300
soma and at spines, by presenting drifting gratings to each eye separately (see Materials and 301
Methods). Layer 2/3 neurons responded to visual stimuli in both eyes (Fig. 6E) and had 302
dendrites where spines with preference for one eye or the other were intermingled (Fig. 6F-303
G). Following monocular deprivation, the population distribution of ocular dominance index 304
for all imaged spines with visual responses was biased toward the contralateral eye, though a 305
substantial proportion of spines had significant ipsilateral responses. We then assessed the 306
level of structural plasticity several hours following eye opening, hypothesizing that specific 307
potentiation of ipsilateral eye dominated spines would be accompanied by local 308
heterosynaptic depression of contralateral eye dominated spines (Fig. 6I). We found a 309
significant increase of potentiated and depressed spines as compared to age-matched control 310
author/funder. All rights reserved. No reuse allowed without permission. The copyright holder for this preprint (which was not peer-reviewed) is the. https://doi.org/10.1101/249706doi: bioRxiv preprint

14
neurons where no monocular deprivation was performed (Fig. 6J). For neurons expressing 311
DsRed2 and Arc-EGFP we found a negative correlation of Arc-EGFP density changes with 312
spine volume changes, comparable to that obtained with the pairing protocol (Fig. 6K; cf. Fig 313
4D). Reopening the deprived eye led not only to potentiated spines but also to a significantly 314
larger density of depressed spines in individual dendrites (Fig. 6J,L). Similar to the pairing 315
protocol, sLTD spines were found in significantly higher density around sLTP spines (Fig. 316
6M). Finally, we related spine volume changes to their functional properties. Spines with 317
ODI biased toward the ipsilateral eye (ODI<0) experienced strong potentiation whereas 318
spines with responses biased towards the contralateral eye were more subject to depression 319
(Fig. 6N-O). Thus, spine-specific plasticity accompanies recovery of V1 neurons from 320
monocular deprivation, and likely involves coordinated spatial interactions between spines 321
expressing Hebbian potentiation and heterosynaptic depression. 322
323
Discussion 324
We demonstrate here that coordinated Hebbian potentiation and heterosynaptic depression 325
within local stretches of dendrites is a key mechanism underlying functional plasticity of 326
single V1 neurons in awake animals in vivo. Potentiation of synapses with receptive fields 327
overlying a target visual location, or driven by a newly opened eye after deprivation, is 328
locally coordinated with depression of adjacent synapses with receptive fields that are off-329
target or driven by the other eye. Together, these synaptic changes co-operatively drive 330
functional plasticity of single neuron responses and shift their receptive field towards the 331
target visual location, or their ocular dominance towards the opened eye. These results 332
provide a new understanding of the mechanisms underlying the functional and structural 333
reorganization of dendritic spines following learning (3–5) and sensory loss or deprivation 334
(34–36). Furthermore, we show that Arc-mediated heterosynaptic plasticity acting at the 335
author/funder. All rights reserved. No reuse allowed without permission. The copyright holder for this preprint (which was not peer-reviewed) is the. https://doi.org/10.1101/249706doi: bioRxiv preprint

15
dendritic level can organize functional plasticity in neurons that have heterogeneous 336
functional synaptic inputs. This mechanism can potentially confer on individual neurons the 337
capacity to co-operatively alter functional properties that are locally distributed in different 338
domains of their dendritic tree (37) (Fig. S14). 339
340
Locally coordinated potentiation of individual synapses together with depression of adjacent 341
synapses contrasts sharply with cell-wide global homeostatic plasticity (6), which was 342
proposed primarily as a mechanism acting over long timescales (hours to days) by which 343
neuronal firing rates are maintained within a narrow physiological range. The role of local 344
heterosynaptic depression overlaid on heterogeneous synaptic inputs, acting together with 345
sparsely distributed potentiated spines (38), has been proposed through computational models 346
(19) to produce rich synaptic integration at the single-cell level. Our results are in line with 347
these predictions and show the functional relevance of this inverse synaptic tagging 348
mechanism in regulating functional neuronal plasticity within hours in the intact brain. The 349
spatio-temporal profile of the structural changes associated with heterosynaptic depression 350
observed in our data (~10µm, ~2hours) is comparable to a previous study performed in 351
hippocampal slices (13), possibly indicating a common mechanism (32). 352
353
Our findings potentially provide a functional explanation for the enigmatic targeting 354
dynamics of Arc (39). Early studies of Arc found that domain-specific NMDA-dependent 355
potentiation of synaptic inputs leads to augmented localization of Arc mRNA and proteins 356
near the site of potentiation (40). Our findings, in conjunction with the role of Arc in 357
mediating AMPAR endocytosis (29) in inactive spines (31), clarify its role in the spatial 358
orchestration of LTD and LTP in functionally heterogeneous dendrites in vivo, whereby Arc 359
author/funder. All rights reserved. No reuse allowed without permission. The copyright holder for this preprint (which was not peer-reviewed) is the. https://doi.org/10.1101/249706doi: bioRxiv preprint

16
is targeted near potentiated spines to weaken neighboring synaptic inputs through local 360
heterosynaptic interactions. 361
author/funder. All rights reserved. No reuse allowed without permission. The copyright holder for this preprint (which was not peer-reviewed) is the. https://doi.org/10.1101/249706doi: bioRxiv preprint

17
References and Notes: 362
1. H. Ko et al., The emergence of functional microcircuits in visual cortex. Nature. 496, 36396–100 (2013). 364
2. J. S. Espinosa, M. P. Stryker, Development and plasticity of the primary visual cortex. 365Neuron. 75, 230–49 (2012). 366
3. S. X. Chen, A. N. Kim, A. J. Peters, T. Komiyama, Subtype-specific plasticity of 367inhibitory circuits in motor cortex during motor learning. Nat. Neurosci. 18, 1109–3681115 (2015). 369
4. J. Cichon, W.-B. Gan, Branch-specific dendritic Ca2+ spikes cause persistent synaptic 370plasticity. Nature. 520, 180–185 (2015). 371
5. A. Hayashi-Takagi et al., Labelling and optical erasure of synaptic memory traces in 372the motor cortex. Nature. 525, 333–8 (2015). 373
6. G. G. Turrigiano, S. B. Nelson, Homeostatic plasticity in the developing nervous 374system. Nat. Rev. Neurosci. 5, 97–107 (2004). 375
7. K. Ibata, Q. Sun, G. G. Turrigiano, Rapid Synaptic Scaling Induced by Changes in 376Postsynaptic Firing. Neuron. 57, 819–826 (2008). 377
8. W. Ju et al., Activity-dependent regulation of dendritic synthesis and trafficking of 378AMPA receptors. Nat. Neurosci. 7, 244–253 (2004). 379
9. W. C. Oh, L. K. Parajuli, K. Zito, Heterosynaptic Structural Plasticity on Local 380Dendritic Segments of Hippocampal CA1 Neurons. Cell Rep. 10, 162–169 (2015). 381
10. M. A. Sutton et al., Miniature Neurotransmission Stabilizes Synaptic Function via 382Tonic Suppression of Local Dendritic Protein Synthesis. Cell. 125, 785–799 (2006). 383
11. W.-J. Bian, W.-Y. Miao, S.-J. He, Z. Qiu, X. Yu, Coordinated Spine Pruning and 384Maturation Mediated by Inter-Spine Competition for Cadherin/Catenin Complexes. 385Cell. 162, 808–822 (2015). 386
12. J. Winnubst, J. E. Cheyne, D. Niculescu, C. Lohmann, Spontaneous Activity Drives 387Local Synaptic Plasticity In Vivo. Neuron. 87, 399–410 (2015). 388
13. J. N. Bourne, K. M. Harris, Coordination of Size and Number of Excitatory and 389Inhibitory Synapses Results in a Balanced Structural Plasticity Along Mature 390Hippocampal CA1 Dendrites During LTP. 373, 354–373 (2011). 391
14. J. Béïque, Y. Na, D. Kuhl, P. F. Worley, R. L. Huganir, Arc-dependent synapse-392specific homeostatic plasticity. Proc. Natl. Acad. Sci. U. S. A. 108, 816–21 (2011). 393
15. Q. Hou, D. Zhang, L. Jarzylo, R. L. Huganir, H.-Y. Man, Homeostatic regulation of 394AMPA receptor expression at single hippocampal synapses. Proc. Natl. Acad. Sci. U. 395S. A. 105, 775–780 (2008). 396
author/funder. All rights reserved. No reuse allowed without permission. The copyright holder for this preprint (which was not peer-reviewed) is the. https://doi.org/10.1101/249706doi: bioRxiv preprint

18
16. M. C. Lee, R. Yasuda, M. D. Ehlers, Metaplasticity at Single Glutamatergic Synapses. 397Neuron. 66, 859–870 (2010). 398
17. A. Govindarajan, R. J. Kelleher, S. Tonegawa, A clustered plasticity model of long-399term memory engrams. Nat. Rev. Neurosci. 7, 575–583 (2006). 400
18. H. Makino, R. Malinow, Compartmentalized versus global synaptic plasticity on 401dendrites controlled by experience. Neuron. 72, 1001–1011 (2011). 402
19. I. Rabinowitch, I. Segev, Two opposing plasticity mechanisms pulling a single synapse. 403Trends Neurosci. 31, 377–383 (2008). 404
20. Y. Frégnac, D. Shulz, S. Thorpe, E. Bienenstock, A cellular analogue of visual cortical 405plasticity. Nature. 333, 367–370 (1988). 406
21. C. D. Meliza, Y. Dan, Receptive-field modification in rat visual cortex induced by 407paired visual stimulation and single-cell spiking. Neuron. 49, 183–189 (2006). 408
22. V. Pawlak, D. S. Greenberg, H. Sprekeler, W. Gerstner, J. N. D. Kerr, Changing the 409responses of cortical neurons from sub- To suprathreshold using single spikes in vivo. 410Elife. 2013, 1–18 (2013). 411
23. T.-W. Chen et al., Ultrasensitive fluorescent proteins for imaging neuronal activity. 412Nature. 499, 295–300 (2013). 413
24. F. Zhang et al., Multimodal fast optical interrogation of neural circuitry. Nature. 446, 414633–639 (2007). 415
25. M. Matsuzaki, N. Honkura, G. C. R. Ellis-Davies, H. Kasai, Structural basis of long-416term potentiation in single dendritic spines. Nature. 429, 761–766 (2004). 417
26. C. D. Harvey, K. Svoboda, Locally dynamic synaptic learning rules in pyramidal 418neuron dendrites. Nature. 450, 1195–1200 (2007). 419
27. Y. Zhang, R. H. Cudmore, D.-T. Lin, D. J. Linden, R. L. Huganir, Visualization of 420NMDA receptor–dependent AMPA receptor synaptic plasticity in vivo. Nat. Neurosci., 4211–8 (2015). 422
28. C. D. Kopec, B. Li, W. Wei, J. Boehm, R. Malinow, Glutamate receptor exocytosis 423and spine enlargement during chemically induced long-term potentiation. J. Neurosci. 42426, 2000–2009 (2006). 425
29. S. Chowdhury et al., Arc/Arg3.1 Interacts with the Endocytic Machinery to Regulate 426AMPA Receptor Trafficking. Neuron. 52, 445–459 (2006). 427
30. J. D. Shepherd et al., Arc/Arg3.1 Mediates Homeostatic Synaptic Scaling of AMPA 428Receptors. Neuron. 52, 475–484 (2006). 429
31. H. Okuno et al., Inverse synaptic tagging of inactive synapses via dynamic interaction 430of Arc/Arg3.1 with CaMKIIβ. Cell. 149, 886–898 (2012). 431
32. C. Mullins, G. Fishell, R. W. Tsien, Unifying Views of Autism Spectrum Disorders: A 432
author/funder. All rights reserved. No reuse allowed without permission. The copyright holder for this preprint (which was not peer-reviewed) is the. https://doi.org/10.1101/249706doi: bioRxiv preprint

19
Consideration of Autoregulatory Feedback Loops. Neuron. 89, 1131–1156 (2016). 433
33. C. L. McCurry et al., Loss of Arc renders the visual cortex impervious to the effects of 434sensory experience or deprivation. Nat. Neurosci. 13, 450–457 (2010). 435
34. S. B. Hofer, T. D. Mrsic-Flogel, T. Bonhoeffer, M. Hübener, Experience leaves a 436lasting structural trace in cortical circuits. Nature. 457, 313–317 (2009). 437
35. T. Keck et al., Synaptic scaling and homeostatic plasticity in the mouse visual cortex 438in vivo. Neuron. 80, 327–334 (2013). 439
36. T. Rose, J. Jaepel, M. Hubener, T. Bonhoeffer, Cell-specific restoration of stimulus 440preference after monocular deprivation in the visual cortex. Science (80-. ). 352, 1319–4411322 (2016). 442
37. N. Xu et al., Nonlinear dendritic integration of sensory and motor input during an 443active sensing task. Nature. 492, 247–51 (2012). 444
38. M. Nonaka et al., Untangling the two-way signalling route from synapses to the 445nucleus, and from the nucleus back to the synapses. Philos. Trans. R. Soc. Lond. B. 446Biol. Sci. 369, 20130150 (2014). 447
39. O. Steward, S. Farris, P. S. Pirbhoy, J. Darnell, S. J. Van Driesche, Localization and 448local translation of Arc/Arg3.1 mRNA at synapses: some observations and paradoxes. 449Front. Mol. Neurosci. 7, 1–15 (2015). 450
40. O. Steward, P. F. Worley, Selective targeting of newly synthesized Arc mRNA to 451active synapses requires NMDA receptor activation. Neuron. 30, 227–240 (2001). 452
41. K. Kitamura, B. Judkewitz, M. Kano, W. Denk, M. Häusser, Targeted patch-clamp 453recordings and single-cell electroporation of unlabeled neurons in vivo. Nat. Methods. 4545, 61–67 (2008). 455
42. T. Matsuda, C. L. Cepko, Electroporation and RNA interference in the rodent retina in 456vivo and in vitro. Proc. Natl. Acad. Sci. U. S. A. 101, 16–22 (2004). 457
43. C. A. Schneider, W. S. Rasband, K. W. Eliceiri, HISTORICAL commentary NIH 458Image to ImageJ : 25 years of image analysis. Nat. Methods. 9, 671–675 (2012). 459
44. M. H. Longair, D. a. Baker, J. D. Armstrong, Simple neurite tracer: Open source 460software for reconstruction, visualization and analysis of neuronal processes. 461Bioinformatics. 27, 2453–2454 (2011). 462
45. J. R. Arron et al., NFAT dysregulation by increased dosage of DSCR1 and DYRK1A 463on chromosome 21. Nature. 441, 595–600 (2006). 464
46. L. Madisen et al., Transgenic mice for intersectional targeting of neural sensors and 465effectors with high specificity and performance. Neuron. 85, 942–958 (2015). 466
47. V. Bonin, M. H. Histed, S. Yurgenson, R. C. Reid, Local diversity and fine-scale 467organization of receptive fields in mouse visual cortex. J. Neurosci. 31, 18506–21 468
author/funder. All rights reserved. No reuse allowed without permission. The copyright holder for this preprint (which was not peer-reviewed) is the. https://doi.org/10.1101/249706doi: bioRxiv preprint

20
(2011). 469
48. S. L. Smith, M. Häusser, Parallel processing of visual space by neighboring neurons in 470mouse visual cortex. Nat. Neurosci. 13, 1144–1149 (2010). 471
472
473
474
author/funder. All rights reserved. No reuse allowed without permission. The copyright holder for this preprint (which was not peer-reviewed) is the. https://doi.org/10.1101/249706doi: bioRxiv preprint

21
Acknowledgements: 475
We thank Rachael Neve, Benjamin Bartelle and Alan Jasanoff for their assistance with 476
plasmid preparation and testing. We thank Jeremy Petravicz for performing the eyelid sutures 477
for MD experiments, Murat Yildirim for providing two-photon point spread function 478
measurements and Keji Li for his assistance with optical intrinsic imaging. We thank Olivier 479
Marre, Johannes Mayrhofer and Celia Gasselin for their comments on the manuscript. We 480
thank Vivek Jayaraman, Rex A. Kerr, Douglas S. Kim, Loren L. Looger and Karel Svoboda 481
from the GENIE Project, Janelia Farm Research Campus, Howard Hughes Medical Institute 482
(HHMI) for the distribution of GCaMP6. This work was supported by Marie Curie 483
postdoctoral fellowship FP7-PEOPLE-2010-IOF (S.E.B.), Human Frontier Science Program 484
Long-Term Fellowship (J.P.K.I), AMED-CREST (H.B.) and KAKENHI grants (H.O., H.B.), 485
and NIH grants NS090473 and EY007023; NSF grant EF1451125; the Simons Center for the 486
Social Brain; and the Picower Institute Innovation Fund (M.S.). 487
488
Author Contribution: 489
S.E.B., J.P.K.I. and M.S conceived experiments. S.E.B. performed single-cell electroporation. 490
S.E.B. and J.P.K.I. performed surgeries and carried out in vivo experiments. S.E.B performed 491
data analysis. M.S. and J.P.K.I. contributed to analysis of experiments. V.B-P. performed 492
intracellular recordings in vivo and eye tracking controls. H.O. and H.B. designed and 493
provided the Arc-EGFP plasmid. S.E.B., J.P.K.I., V.B-P. and M.S. wrote the paper. 494
495
author/funder. All rights reserved. No reuse allowed without permission. The copyright holder for this preprint (which was not peer-reviewed) is the. https://doi.org/10.1101/249706doi: bioRxiv preprint
22
496
author/funder. All rights reserved. No reuse allowed without permission. The copyright holder for this preprint (which was not peer-reviewed) is the. https://doi.org/10.1101/249706doi: bioRxiv preprint

23
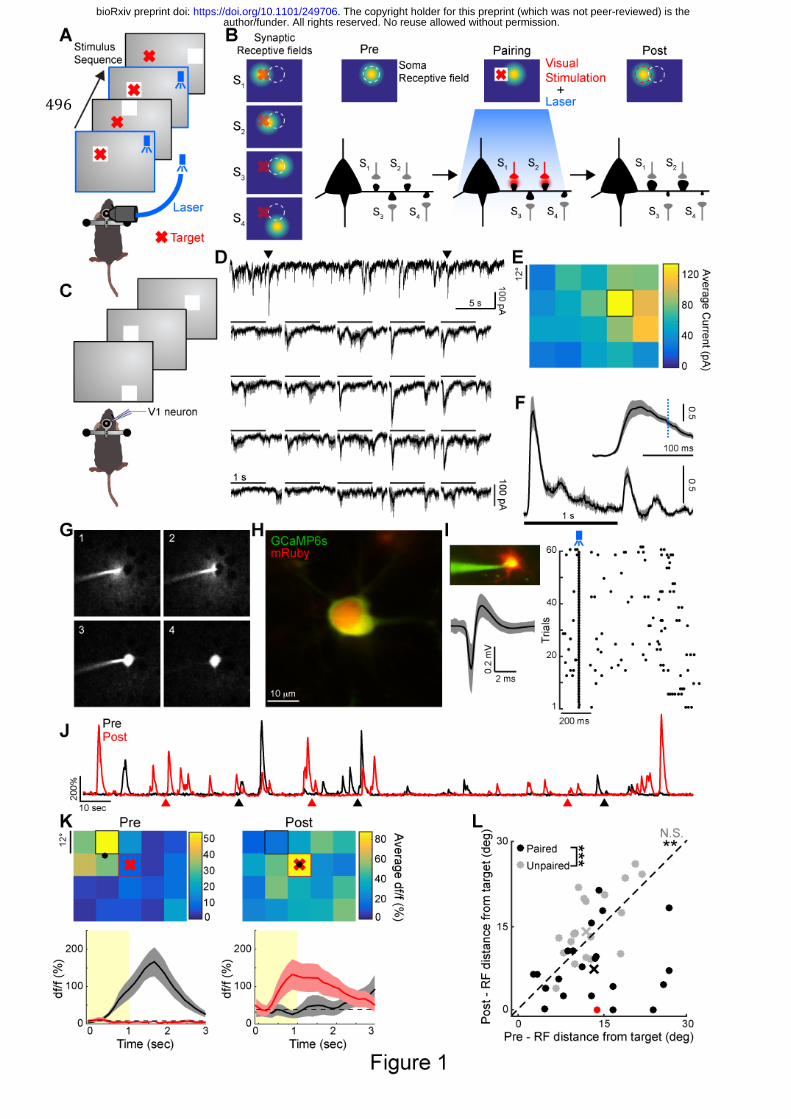
Fig. 1. Functional plasticity induced in single V1 neurons of awake mice. (A) Schematic 497
of the protocol used to induce plasticity. Whenever a stimulus (white square) appeared at a 498
target location (red cross), ChR2 expressing neurons were stimulated with a blue laser pulse. 499
(B) Illustration of the effect of the pairing protocol on a neuron’s receptive field and its 500
dendritic spines. Left: Layer 2/3 excitatory neurons in V1 receive synaptic inputs (S1-S4) at 501
spines from diverse local neurons (synaptic receptive fields). The soma receptive field, 502
depicted above the neuron, represents the integration of these synaptic inputs. Here we 503
illustrate the scenario where S1 and S2 receive inputs from cells with receptive fields close to 504
the stimulated target location. Middle: Schematic of the plasticity protocol where visual 505
target stimulation (red cross on white square) is repeatedly paired with ChR2 neuronal 506
stimulation (blue). Right: After plasticity induction, the receptive field of the neuron shifts 507
towards the target location. This is achieved through specific potentiation of spines with 508
receptive fields close to the target and depression of other spines. The initial and final soma 509
receptive field locations are shown as dashed white and red circles respectively. (C) Whole-510
cell recording of single neuron receptive field using sparse noise stimuli. (D) Top: example 511
current trace of a neuron recorded in voltage-clamp mode at -70mV. Arrows indicate onset of 512
preferred stimulus. Bottom: Average EPSC recorded for the same neuron for each stimulus 513
location on a 4x5 grid. Scale bars indicate stimulus duration. Shaded gray areas: s.e.m. (E) 514
Spatial ON receptive field obtained by averaging currents elicited by stimulus onset for each 515
stimulus position (window: 50-150 ms). Black square indicates preferred stimulus position. 516
(F) EPSC (converted to z-score) averaged over all neurons and all stimulus positions (n=8 517
neurons). Shaded area: s.e.m. Inset: expanded view of the first 200 ms. The dashed blue line 518
indicates timing of ChR2 stimulation for pairing. (G) Snapshots showing single-cell approach 519
(1-2) and subsequent electroporation in vivo (3). Cell body is left intact after withdrawal of 520
the pipette (4). (H) Example of a neuron expressing GCaMP6s-P2A-mRuby and ChR2 48h 521
after electroporation. (I) Loose-patch recording of an electroporated neuron expressing ChR2, 522
author/funder. All rights reserved. No reuse allowed without permission. The copyright holder for this preprint (which was not peer-reviewed) is the. https://doi.org/10.1101/249706doi: bioRxiv preprint

24
showing responses to single blue light pulses. Left: Image of a patched neuron and averaged 523
spike waveform (grey: standard deviation). Right: raster plot for several trials of blue light 524
stimulation. (J) Example calcium df/f traces obtained from soma imaging before (black) and 525
after (red) visual-ChR2 stimulation pairing. Arrows indicate visual stimuli, presented pre-526
pairing at the preferred location (black) and post-pairing at the target location (red). (K) Top: 527
Receptive fields corresponding to the traces in J. Black and red squares indicate preferred 528
stimulus location before and after pairing respectively. Black dots indicate center-of-mass 529
and red crosses indicate target stimulus location for pairing. Bottom: Response time course 530
for the preferred stimulus location before (black) and after pairing (red). Shaded area: s.e.m. 531
Yellow areas indicate stimulus duration. (L) Comparison of the distance between target and 532
receptive field center-of-mass before and after pairing (black, n=22 neurons with significant 533
visual responses before and after pairing out of 94 electroporated cells, N=23 mice, paired 534
Wilcoxon test, ** p<0.01). The red dot indicates the example shown in panel K and the black 535
cross indicates the average shift. Control experiments where ChR2 activation was not paired 536
with the target stimulus are shown in gray (n=21 neurons out of 91, N=11 mice, paired 537
Wilcoxon test, p=0.06, N.S. Not significant). Distribution of receptive field shifts were 538
significantly different between these two populations (unpaired Kruskal-Wallis test, 539
***p<0.001) 540
541
542
author/funder. All rights reserved. No reuse allowed without permission. The copyright holder for this preprint (which was not peer-reviewed) is the. https://doi.org/10.1101/249706doi: bioRxiv preprint

25
543
author/funder. All rights reserved. No reuse allowed without permission. The copyright holder for this preprint (which was not peer-reviewed) is the. https://doi.org/10.1101/249706doi: bioRxiv preprint

26
Fig. 2. Synaptic inputs are functionally heterogeneous along dendritic stretches. (A) Z-544
stack projection of a neuron expressing GCaMP6s-P2A-mRuby. (B) Image of a dendritic 545
stretch indicated by the orange rectangle in A. (C) Calcium fluorescent traces for 546
representative spines indicated by numbers in B. Orange trace: signal imaged in the entire 547
branch shaft. Arrows: onset of preferred stimuli for the first two spines (blue and purple). (D) 548
Receptive field examples showing df/f responses for spines 1 and 2 in B-C. Average response 549
traces are shown as black lines with s.e.m. in gray. Colormap indicates time-averaged 550
magnitude for each location obtained over the whole response window. (E) Distribution of 551
receptive field distances for pairs of spines within the same branch (n=1238 pairs) or between 552
different branches (n=2498 pairs, unpaired Kruskal-Wallis test, ***p<0.001). (F) 553
Relationship between spine distance on the dendrite and receptive field distance for pairs of 554
spines in the same branch averaged over dendrites (n=34 dendrites, one-way ANOVA test, 555
p=0.34). (G) Distribution of Pearson correlation coefficients between spine and receptive 556
field distances measured in individual dendrites (n=34 dendrites, black indicates significant 557
correlation with p<0.05). 558
559
560
author/funder. All rights reserved. No reuse allowed without permission. The copyright holder for this preprint (which was not peer-reviewed) is the. https://doi.org/10.1101/249706doi: bioRxiv preprint

27
561
author/funder. All rights reserved. No reuse allowed without permission. The copyright holder for this preprint (which was not peer-reviewed) is the. https://doi.org/10.1101/249706doi: bioRxiv preprint

28
Fig. 3. Hebbian potentiation and heterosynaptic depression in functionally 562
heterogeneous dendritic spines. (A) Time-lapse imaging of a dendritic stretch before and 563
after pairing. Red and green arrows indicate example spines that undergo structural long-term 564
potentiation (sLTP) and depression (sLTD) respectively. (B) Comparison of spine volumes 565
before and more than 2 hours after pairing for ChR2+ (black, n=1987 spines) and ChR2- 566
(gray, n=845 spines) neurons including newly formed or eliminated spines. The colored lines 567
indicate domains of constant normalized volume change in the [-1,1] interval. (C) Proportion 568
of sLTP (red) and sLTD (green) spines for different values of normalized volume change. 569
Curves for ChR2- neurons are shown with dashed lines (variance F-test between volume 570
change distributions for ChR2+ and ChR2- spine populations, p<0.001). Black dashed line 571
indicates sLTP and sLTD plasticity threshold of δV>0.25 based on the ChR2- control data 572
(Fig. S6). (D) Left: For all spines that were significantly potentiated (red, n=110) or 573
depressed (green, n=98) at least 2 hours following the pairing, the average normalized 574
volume change is shown for the preceding time points. Error bars: s.e.m. Dashed lines 575
indicate threshold for sLTP and sLTD. Right: sLTP to sLTD volume change ratio for all time 576
points following pairing. Dashed line indicates identical average volume change. (E) 577
Examples of dendritic stretches where sLTP (red arrows) and sLTD (green arrows) spines are 578
intermixed. Dendrite contours are depicted before and after pairing. (F) Comparison of sLTP 579
and sLTD spine density per dendrite (n=20 dendrites; Pearson coefficient: 0.55, p<0.05; 580
paired Wilcoxon test, * p<0.05). (G) For dendrites in F, sLTD spine density variation relative 581
to the mean as a function of distance from sLTP spines in individual dendrites (average over 582
n=103 sLTP spines with neighbor sLTD spines, one-way ANOVA test, p<0.01, unpaired 583
Kruskal-Wallis test, **p<0.01 and *p<0.05 with Bonferroni correction). The distribution of 584
sLTD spines in the immediate vicinity of sLTP spines showed a significantly larger density 585
increase compared to longer distances. (H) Example of a dendritic segment where an 586
enlarged spine is in close proximity to a depressed spine following the pairing. The bottom 587
author/funder. All rights reserved. No reuse allowed without permission. The copyright holder for this preprint (which was not peer-reviewed) is the. https://doi.org/10.1101/249706doi: bioRxiv preprint

29
panel compares the dendrite before (green) and after (red) plasticity induction. (I) Left: 588
Profiles indicated by the dashed red line in H (bottom) comparing spine size before (black) 589
and after (red) pairing. Middle: receptive field of the corresponding spine (yellow square 590
indicates location with significant responses and red cross indicates target position). Right: 591
Response time course for the preferred stimulus. Yellow area indicates stimulus duration and 592
shaded red areas s.e.m. (J) Same as I for the depressed spine in H indicated with a green 593
dashed arrow. Right: Response time course for the preferred stimulus (gray) and for the target 594
stimulus location (red). (K) Average normalized receptive field centered on target for spines 595
that experienced sLTP (left, n=94 spines) and sLTD (right, n=87 spines). (L) Difference 596
between the distributions in K. (M) Top: Distribution of receptive field distances from target 597
for sLTP spines (red) and sLTD spines (green). The black distribution is obtained by 598
randomly shuffling spine identity. Shaded areas indicate standard deviation. Bottom: Average 599
normalized volume change as a function of receptive field distance from target for all spines 600
that experienced plasticity (n=181 spines, one-way ANOVA test, p<0.01, * p<0.05 and ** 601
p<0.01 with Bonferroni correction). 602
603
604
author/funder. All rights reserved. No reuse allowed without permission. The copyright holder for this preprint (which was not peer-reviewed) is the. https://doi.org/10.1101/249706doi: bioRxiv preprint

30
605
author/funder. All rights reserved. No reuse allowed without permission. The copyright holder for this preprint (which was not peer-reviewed) is the. https://doi.org/10.1101/249706doi: bioRxiv preprint

31
Fig. 4. Arc and AMPAR trafficking in dendrites following receptive field plasticity. (A) 606
Example V1 neuron expressing DsRed2 and SEP-GluA1 in close proximity to a neuron 607
expressing GCaMP6s. (B) Example of dendrites expressing DsRed2 and SEP-GluA1 (left) or 608
Arc-EGFP (right). Dendrite contours are shown in white. (C) Example of spine changes 609
before and after pairing for SEP-GluA1 (top) or Arc-EGFP (bottom) corresponding to the 610
white rectangles in B. (D) Comparison of the normalized change in volume and SEP-GluA1 611
(left) or Arc-EGFP (right) density for individual spines (SEP-GluA1: n=4354 spines from 17 612
neurons, N=12 mice, Pearson coefficient=0.22, *** p<0.001; Arc-EGFP: n=1719 spines from 613
16 neurons, N=8 mice, Pearson coefficient=-0.37, *** p<0.001). These panels combine data 614
obtained with the short pairing protocol (SEP-GluA1: n=2046 spines, Pearson 615
coefficient=0.28, p<0.001; Arc-EGFP: n=262 spines, Pearson coefficient=-0.32, p<0.001) 616
and the long pairing protocol (Fig. S4, SEP-GluA1: n=2308 spines, Pearson coefficient=0.16, 617
p<0.001; Arc-EGFP: n=1457 spines, Pearson coefficient=-0.4, p<0.001). The purple and 618
orange lines indicate linear fits for SEP-GluA1 and Arc-EGFP respectively. (E) Average 619
changes in SEP-GluA1 (top, n=122 dendrites) and Arc-EGFP (bottom, n=81 dendrites) 620
density relative to initial density as a function of average spine volume change relative to 621
initial volume for individual dendrites. The left and right plots show the comparison for SEP-622
GluA1 or Arc-EGFP signal average over all spines and in the dendritic shaft respectively. 623
Only signals in spines correlate with structural plasticity (Pearson coefficient: 0.27, ** 624
p<0.01 for SEP-GluA1 and -0.29, ** p<0.01 for Arc-EGFP, N.S. Not Significant). The 625
purple and orange lines indicate best linear fits and empty circles indicate average values. 626
627
628
author/funder. All rights reserved. No reuse allowed without permission. The copyright holder for this preprint (which was not peer-reviewed) is the. https://doi.org/10.1101/249706doi: bioRxiv preprint
32
629
author/funder. All rights reserved. No reuse allowed without permission. The copyright holder for this preprint (which was not peer-reviewed) is the. https://doi.org/10.1101/249706doi: bioRxiv preprint

33
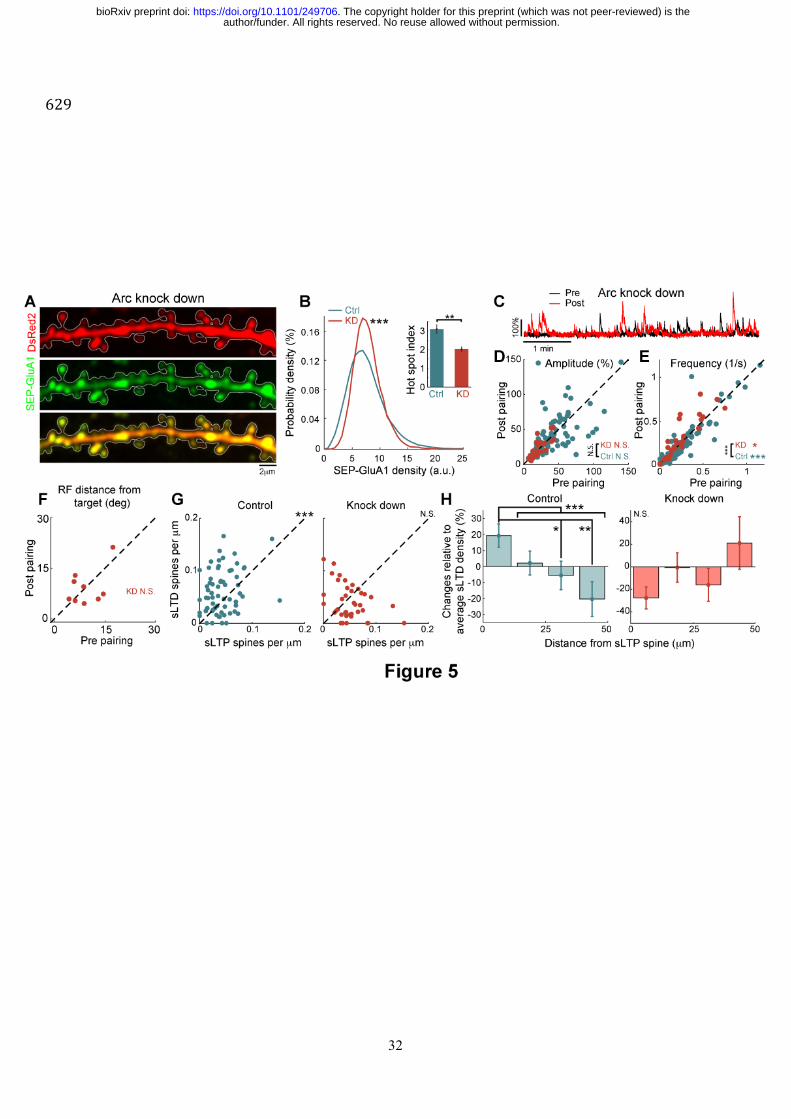
Fig. 5. Role of Arc in regulating AMPAR distribution at spines and receptive field 630
plasticity of single V1 neurons. (A) Example of a dendrite expressing SEP-GluA1 and Arc 631
shRNA (Arc knock down) fused with DsRed2. (B) Distributions of SEP-GluA1 density for 632
individual spines where Arc is endogenously expressed or knocked down (n=992 spines from 633
3 neurons for KD, n=5302 spines from 17 neurons for Ctrl, Kruskal-Wallis test, *** p 634
<0.001). Inset: hot spot index measured for individual dendrites in these conditions (n=18 635
dendrites for KD and n=123 dendrites for control, unpaired Kruskal-Wallis test, **p<0.01). 636
(C) Example of calcium traces before and after pairing for a neuron with Arc KD. (D) 637
Comparison for individual cells of the average GCaMP6s transient amplitude in response to 638
sparse noise before and after pairing for control (turquoise, n=94 neurons, N=23 mice) or Arc 639
KD (brown, n=27 neurons, N=7 mice) conditions (paired Wilcoxon test, N.S. Not significant, 640
comparison between KD and Ctrl conditions was performed with an unpaired Kruskal-Wallis 641
test between distributions for post-pre differences). (E) Same as in D but comparing transient 642
frequency (paired Wilcoxon test, p<0.001 for control and p<0.05 for KD; unpaired Kruskal-643
Wallis test for comparing both populations, p<0.001). (F) Comparison of the distance 644
between target and receptive field center-of-mass before and after pairing for the KD 645
condition (n=9 neurons with significant visual responses before and after pairing out of 27 646
electroporated cells, N=7 mice, paired Wilcoxon test, N.S. not significant). (G) Comparison 647
of sLTP and sLTD spine density per dendrite for control (left, n=66 dendrites; Pearson 648
coefficient: 0.31, p<0.05; paired Wilcoxon test, *** p<0.001) and Arc KD neurons (right, 649
n=39 dendrites; Pearson coefficient: -0.37, p<0.05; paired Wilcoxon test, N.S. Not 650
Significant) conditions. (H) For dendrites in G, sLTD spine density variation relative to the 651
mean as a function of distance from sLTP spines in individual dendrites for the control (left, 652
average over n=253 sLTP spines with neighbor sLTD spines, one-way ANOVA test, p<0.001, 653
unpaired Kruskal-Wallis test, **p<0.01 and *p<0.05 with Bonferroni correction) and Arc KD 654
conditions (right, average over n=142 sLTP spines with neighbor sLTD spines, one-way 655
author/funder. All rights reserved. No reuse allowed without permission. The copyright holder for this preprint (which was not peer-reviewed) is the. https://doi.org/10.1101/249706doi: bioRxiv preprint

34
ANOVA test, p=0.3). Dendrites in the control condition either express a scrambled Arc 656
shRNA plasmid fused with DsRed (n=46 dendrites) or GCaMP6s-P2A-mRuby (n=20 657
dendrites). 658
659
660
author/funder. All rights reserved. No reuse allowed without permission. The copyright holder for this preprint (which was not peer-reviewed) is the. https://doi.org/10.1101/249706doi: bioRxiv preprint

35
661
author/funder. All rights reserved. No reuse allowed without permission. The copyright holder for this preprint (which was not peer-reviewed) is the. https://doi.org/10.1101/249706doi: bioRxiv preprint

36
Fig. 6. Spine-specific Hebbian potentiation and heterosynaptic depression at eye 662
opening following monocular deprivation. (A) Schematic of the experiment. The ipsilateral 663
eye (blue) was suture for a period of 4-5 days, starting at P25, during which the contralateral 664
eye (red) was left open. On the last day, structural and functional imaging was performed 665
before and after eye opening. (B) Ocular dominance domains obtained with intrinsic signal 666
optical imaging. The color code indicates ODI and the border between the monocular zone 667
(MZ) and the binocular zone (BZ) is indicated. (C) Low magnification two-photon image 668
superimposed on the cranial window image. (D) Z-stack maximum projection of the neuron 669
indicated by an orange rectangle in C. (E) Average df/f somatic traces of the cell in D in 670
response to drifting gratings for the contralateral (top, red) and ipsilateral (bottom, blue) eyes. 671
Shaded blue and red areas: s.e.m. Yellow areas indicate stimulus duration and gray areas 672
blank screen presentation. (F) Magnification of the dendritic segment indicated by an orange 673
rectangle in D. (G), Response df/f traces for individual spines indicated with numbers in F. 674
Vertical scale bars: 20%. (H) Distribution of ODI values for all visually-responsive spines 675
(n=408 spines from 14 neurons, N=3 mice). (I) Schematic of the spine size measurements 676
and hypothesis. At eye opening spines receiving ipsilateral eye dominated synaptic inputs are 677
expected to enlarge through Hebbian plasticity. As a consequence, nearby spines that receive 678
contralateral eye dominated inputs are hypothesized to shrink through local heterosynaptic 679
interaction. (J) Proportion of spines for different volume change thresholds (sLTP in red and 680
sLTD in green, n=3028 spines from 13 neurons, N=5 mice). Dashed curves: baseline 681
structural changes as in Fig. 3C (unpaired variance F-test with control condition, p<0.001). 682
Inset: Comparison of spine volumes measured before and after eye opening. (K) Comparison 683
of the normalized change in volume and Arc-EGFP density for individual spines (n=288 684
from 7 neurons, N=3 mice, Pearson coefficient=-0.38, *** p<0.001). The orange line 685
indicates linear fit. (L) Comparison of sLTP and sLTD spines density for individual dendrites 686
(n=39 dendrites, paired Wilcoxon test, ** p<0.01). (M) For dendrites in L, sLTD spine 687
author/funder. All rights reserved. No reuse allowed without permission. The copyright holder for this preprint (which was not peer-reviewed) is the. https://doi.org/10.1101/249706doi: bioRxiv preprint

37
density variation relative to the mean as a function of distance from sLTP spines in individual 688
dendrites (average over n=145 sLTP spines with neighbor sLTD spines, one-way ANOVA 689
test, p<0.001, unpaired Kruskal-Wallis test, **p<0.01 and *p<0.05 with Bonferroni 690
correction). (N) ODI distributions for sLTP spines (red) and sLTD spines (green). Black 691
distributions are obtained by randomly shuffling spine identity. Shaded areas indicate 692
standard deviation. (O) Normalized volume difference as a function of ODI for all spines 693
(n=408 spines from 14 neurons, N=3 mice, one-way ANOVA test, p<0.01, * p<0.05 and ** 694
p<0.01 with Bonferroni correction). Error bars: s.e.m. 695
696
Supplementary Materials: 697
Materials and Methods 698
Figure S1-S14 699
700
author/funder. All rights reserved. No reuse allowed without permission. The copyright holder for this preprint (which was not peer-reviewed) is the. https://doi.org/10.1101/249706doi: bioRxiv preprint