LNG in the New Oil Price Era v2 - LNG market analysisLNG in the New Oil Price Era Paper presented by...
18
LNG in the New Oil Price Era Paper presented by Morten Frisch MSc Senior Partner Morten Frisch Consulting United Kingdom Global Forum on Energy Security (2016) Energy Choice: Energy Revolution under Low Oil Price Convention Centre, Beijing International Hotel Beijing, P. R. China 30 June – 1 July 2016 Morten Frisch Consulting [email protected] www.mfcgas.com
Transcript of LNG in the New Oil Price Era v2 - LNG market analysisLNG in the New Oil Price Era Paper presented by...

LNG in the New Oil Price Era
Paper presented by
Morten Frisch MSc Senior Partner
Morten Frisch Consulting United Kingdom
Global Forum on Energy Security (2016)
Energy Choice: Energy Revolution under Low Oil Price
Convention Centre, Beijing International Hotel
Beijing, P. R. China 30 June – 1 July 2016
Morten Frisch Consulting [email protected] www.mfcgas.com

© 2016 Morten Frisch Consulting 2
About the Author
The oil and gas industry in Norway, Morten Frisch’s home country was at in its infancy when he started his career. His career developed together with the industry. As a result, Morten Frisch has more than 40 years of senior level, international, hands-on “operator” experience in dealing with strategic, commercial and operational issues along the entire pipeline gas as well as LNG chains. He has planned and led the negotiation of major international Gas Sales Agreements and he has done so on behalf of sellers as well as buyers.
Morten Frisch is one of the main architects of the price review and price re-opener clauses today commonly used in Continental European pipeline gas and Atlantic Basin LNG sales agreements. He is frequently called upon as an expert witness in arbitrations and court cases dealing with pricing and contractual issues arising under gas supply agreements.
Morten Frisch has followed shale gas and shale/tight oil developments in North America since 2002 analysing the revival of the oil and gas industries in this region and its impact on international energy markets.
Morten Frisch founded Morten Frisch Consulting or MFC in October 1990. Prior to starting MFC, he worked for Mobil Oil Corporation (now ExxonMobil), Phillips Petroleum Company (now ConocoPhillips), Den norske stats olje selskap (now Statoil ASA) and Norwegian government organisations.
Morten Frisch is an engineer and economist with degrees from The University of Newcastle upon Tyne in the UK (1971) and Massachusetts Institute of Technology, Cambridge, Massachusetts, USA (1975). He has been a member of the Society of Petroleum Engineers (SPE) since 1975. He is a founding member of the Norwegian Petroleum Society and he holds memberships with the British Institute of Energy Economics (BIEE) and the International Association for Energy Economics (IAEE).

© 2016 Morten Frisch Consulting 3
Contents
Executive Summary ................................................................................................................................. 4
Forces in the Oil Market .......................................................................................................................... 4
North American Shale/Tight Oil Developments ..................................................................................... 6
Oil Price Outlook ..................................................................................................................................... 8
North American Shale Gas Developments ............................................................................................ 10
North American LNG Exports ................................................................................................................ 12
Global LNG Developments .................................................................................................................... 14
Global LNG Price Dynamics ................................................................................................................... 15
References ............................................................................................................................................ 17
List of Tables and Figures
Table 1: OPEC 2016 World Oil Demand Projections ............................................................................... 9
Table 2: Approved Lower 48 LNG Export Projects ................................................................................ 13
Figure 1: Global Oil Market Disruptions ................................................................................................. 5
Figure 2: Main Shale Plays of US Lower 48 ............................................................................................. 6
Figure 3: Weekly Oil Rigs vs. Production ................................................................................................. 7
Figure 4: US Liquids Production Projections ........................................................................................... 8
Figure 5: Tight Oil and Shale Gas in US Lower 48 ................................................................................. 10
Figure 6: US Shale Gas Price Setters ..................................................................................................... 11
Figure 7: Enhanced Stimulation Performance ...................................................................................... 11
Figure 8: US LNG Export Likely Front- Runners ..................................................................................... 12
Figure 9: Expected Cost of US LNG (2016 US$) ..................................................................................... 14

© 2016 Morten Frisch Consulting 4
Executive Summary
The factors influencing the oil price are varied and many have demonstrated themselves in the past 24 months both in terms of demand and in terms of supply putting downward pressure on the price of crude oil and oil products.
In the main shale/ tight oil plays of the U.S. Lower 48 the falling number of wells drilled and completed for production has halted overall US production growth. However, advancements made since 2014 in enhanced oil recovery techniques, reductions in drilling and cash operating costs together with the current WTI price of some US$ 50 per bbl, now enable the international and the larger domestic E & P companies operating in this oil play to achieve full cycle economics equivalent to an IRR of 10%, the level required to secure financing for their operations.
A high number of drilled but uncompleted wells are likely to allow U.S. shale/ tight oil production to resume at the current WTI price levels, but a fast revival of the E&P industry is under question when the dispersion of high pressure pumping crews used for hydraulic fracturing and completion of wells is taken into account.
The oil price outlook is likely to be impacted by supply side and demand side wild cards. Although this is the case and when assuming no further major deterioration of geopolitical situations, the oil price could fluctuate between US$45 and US$60 in the short to medium term. Gas production and, therefore, the price of gas will be influenced by oil market economics, as increases in oil – related E&P activities likely will pull E&P resources away from gas in North America. A price increase to US$ 3-3.5 MMBtu is likely to be required for the gas market in the U.S. Lower 48 states to balance in the medium term. This price level could ease after 2018 as most drilled, but uncompleted gas wells or gas DUCs are concentrated in areas of pipeline capacity shortages, and these shortages are due to be removed in 2018 and beyond.
US delivered ex ship or DES LNG cargos bound for Asia can currently not be delivered above the short run marginal cost of production, when compared to ICIS Heren East Asia Index for LNG pricing. LNG produced in the U.S. is already uncompetitive, despite the current low level of Henry Hub gas prices. Should Henry Hub prices rise in the future as predicted, U.S. LNG will become even less competitive in Asian markets and Europe is likely to be an alternative destination of “last –resort” for flexible LNG cargoes.
US LNG projects under construction will be adding substantially to the current total global LNG oversupply, particularly in the 2018 - 2020 period. Floating Storage Re-gasification Units or FSRU technology appears to be an innovative solution for both buyers and LNG developers, as it creates additional LNG demand in smaller, newer markets. But oversupply will remain a problem for years to come, also beyond 2020, putting further pressure on LNG supply chain costs and helping buyers command new, unprecedented allowances in long term LNG agreements.
Forces in the Oil Market
The factors influencing oil price formation can broadly be categorised into the following nine: Global economic growth; speculation; hedging and investment strategies; exchange rate movements and inflation; geopolitical risks; spare production capacity; inventory requirements and their levels; OPEC’s production decisions or the absence thereof; non-OPEC supply growth and weather. With the exception of OPEC – related factors, the aforementioned factors also apply to pipeline gas and LNG price formation and developments.
At the OPEC ministerial meeting in Vienna in November 2014 Saudi Arabia declared that it was no longer going to act as the swing supplier in the Cartel. The Kingdom increased its oil production to near its maximum level and it started implementing a policy of protecting its crude oil and petroleum product market shares in key markets, particularly in Asia, but also in North America and

© 2016 Morten Frisch Consulting 5
Europe. This was originally done to counter-balance Russia’s increasing influence in world oil markets in a period after crude oil prices had started to fall in June 2014 and to curtail the growth in North American oil production. After nuclear sanctions against Iran were lifted in early 2016 and Iran was again in a position to increase its international oil sales, this Saudi Arabian policy was also directed towards Iran.
As a result of falling economic activities and increased oil production from OPEC countries, Russia, U.S. and Canada, crude oil and oil product storage have reached record levels. However lately this has not been properly reflected in the oil price due to a series of major production disruptions which has taken place in Canada, Nigeria, Libya, Colombia, Venezuela and the northern part of Iraq, including Kurdistan. These production disruptions have been augmented by an oil worker strike in Kuwait and also North Sea planned maintenance shut downs. Figure 1 demonstrates:
Figure 1: Global Oil Market Disruptions
Source: Financial Times
When these disruptions peaked during the Canadian wildfires, they resulted in the reduction of more than 2.5 million barrels of oil production per day and elevated the price for Brent crude to above US$ 50 per bbl.
In the future, impacts from underinvestment and instability across OPEC countries, and in particular in Nigeria, Libya and Venezuela are likely to be of increasing importance. The combined 450,000 bbl per day annual decline in oil production from these three countries has played a significant role in offsetting the increase in Iranian oil output taking place after atomic sanctions were lifted in early 2016. This drop in OPEC oil production has reduced OPEC’s collective oil market influence substantially.
Other important factors which currently influence the oil price are the economic slowdowns taking place in China, Japan, South Korea and Europe with corresponding reductions in overall energy demand growth. This is in contract to gasoline or petrol consumption which is increasing in many countries and particularly in the US, UK, China, India and Mexico.
In addition to increased Russian oil production, Canada and the US have also experienced an oil and gas “renaissance”. In the case of Canada this has been driven by oil sands projects together with shale gas and shale/tight oil production. In the US oil and gas E&P activities targeting unconventional oil and gas deposits in the Lower 48 states and the development of deep-water offshore oil fields in

© 2016 Morten Frisch Consulting 6
the Gulf of Mexico have resulted in a rapid increase in the production of oil, natural gas liquids (NGLs) and natural gas.
North American Shale/Tight Oil Developments
In the United States there are four main shale/tight oil formations and four main shale gas formations. For oil these are Bakken in North Dakota and Montana, Eagle Ford in Texas, Niobrara in Colorado, Wyoming and Utah, and The Permian in Texas and New Mexico. The main shale gas plays are Marcellus and Utica in the Northeast of the US, namely Pennsylvania, West Virginia and Ohio. Marcellus also stretches into New York State, where there is a ban on shale gas drilling and production. Other major shale gas plays are Haynesville in Texas and Louisiana and the gas-bearing part of Eagle Ford in Texas. The location of these is shown on the map below.
Figure 2: Main Shale Plays of US Lower 48
Source: Energy Information Administration
The production characteristics and hydrocarbon recovery factor of shale/tight oil reserves differ substantially from those of conventional deposits. Typically a conventional oil field has an annual decline rate of 5% of recoverable reserves. In the case of shale/tight oil wells, the production normally declines by between 45 and 60% during the first year of production, although this is now improving. The recovery factor achieved in the production of conventional oil fields is today normally 50% of the oil reserves in place, if not higher. A limited number of wells will be needed to produce the reserves in the field and these wells can be planned in advance as part of the field’s development programme.
In contrast, the normal recovery factor range achieved for the production of shale or tight oil is only 3.5 to 6% of oil in place, although some producers claim that they have achieved recovery factors in tight oil sweet spots of up to 15% of oil in place. Shale or tight oil’s rapid initial decline rate and low recovery factor makes it is necessary to drill a large number of horizontal, long lateral wells to produce from these formations. Continuous drilling and well completions are required over the producing life of the field; akin to a manufacturing process which requires continued investments to maintain production over the producing life of the formation.
Research and development programmes are being conducted to improve low recovery factors in the production of tight oil formations. The application of Enhanced Oil Recovery (EOR) through gas injection into Eagle Ford oil wells, for example, has resulted in ultimate oil recovery in the range of 1.3 to 1.7 times the recovery achieved with legacy-type of wells, the so called primary recovery. An

© 2016 Morten Frisch Consulting 7
Eagle Ford oil well which initially recovered 3.5% of oil in place could increase the ultimate recovery to between 4.6% and 6.0% after the application of this EOR technique. In addition to recovery improvements, shale oil and gas E&P companies are also striving to reduce their investment and operating costs. Since 2014 well cost improvements in major shale basins of up to 15% in Eagle Ford, up to 30% in Bakken and up to 42% in the Permian Basin have been documented by producers. Over the same period cash operating cost reductions of up to 30% have also been achieved. As a result, major operators in the US Lower 48 shale/tight oil industry as an approximate guide now require a WTI price of US$ 50 ± 10% per barrel for full cycle economics yielding an internal rate of return (IRR) of 10%.
The rapid fall in oil prices observed after the OPEC meeting in November 2014, caused the number of active oil and gas drilling rigs in the US to fall dramatically as shown in Figure 3. This view graph was first used by Mr. Harold Hamm, president of the US Domestic Energy Producers Alliance at the US Energy Information Administration’s conference in July 2015. In this presentation Mr. Hamm predicted that US oil production would fall from 9,610 million bbl per day in May 2015 (full red line) by 700,000 bbl per day in May 2016. As shown in Figure 3, the number of active oil rigs has continued to fall since the end of May 2015 (full black line) to only 316 rigs end May 2016. In spite of this large reduction in active oil rigs which was not fully predicted by Mr. Hamm a year ago, his estimate of US crude oil reduction has proved correct. At the end of May 2016 the oil production was 8,735 million bpd.
Figure 3: Weekly Oil Rigs vs. Production
Source: Baker Hughes, EIA, DEPA (US Domestic Energy Producers Alliance), MFC
Longer term, US and Canadian conventional and shale/tight oil production is very hard if not impossible to forecast. In North America, and this applies in particular to onshore oil and gas E & P activities, production dynamics remain complex and are driven by numerous factors. These include well productivity, decline rates, ultimate oil and gas recovery, wells drilled but uncompleted (DUCs), operator cash constraints, availability of service contractors and therefore pace of service contractor cost deflation or possibly already in the medium term cost inflation.
For example, as the price of Brent and WTI blend crudes increased to between US$ 55 and US$ 60 per bbl. during the second half of April 2015, the number of oil wells completed for production in Texas increased by some 900 wells compared to April 2014. This rise in oil well completions which applied the whone of North America and continued in May 2015 resulted in a large and sudden boost in oil production.

© 2016 Morten Frisch Consulting 8
Around 4,000 uncompleted horizontal shales/tight oil wells (DUCs) were thought to exist in the US Lower 48 states this past April. At the current Brent and WTI oil prices of around US$50 per barrel many of these wells could be economic to complete for production. The number of active drilling rigs targeting oil in the US has started to increase, although erratically, and Figure 4 shows how US oil production is estimated to reach its bottom in 3Q 2016. The pace of oil production is forecasted to increase until the end of 2017, for oil production growth to decrease when compared to earlier industry forecasts in 2018.
On 1 July 2016 there were 341 oil rigs and 89 gas rigs active in the whole of the US. Members of the US Domestic Producers Alliance indicate drilling activity can be increased by some 170 rigs from the current level to a total of some 600 rigs without experiencing serious bottlenecks. However, high pressure pumping crews used for hydraulic fracturing and completion of drilled wells for production is likely to be the critical factor for the expansion of US oil production over the next two to three years. This is the time it will take to hire and train new high pressure pumping crews. In North Dakota (Bakken) there were only 8 hydraulic fracturing crews in May 2016 against a total of 45 such crews in 2014.
Figure 4: US Liquids Production Projections
Source: Raymond James Research, EIA, HPDI
A year ago Mr. Harold Hamm managed to correctly predict the level of US oil production in May 2016. It should be noted that this correct prediction was made by a “hands on” oil man, and not by an analyst operating a sophisticated oil production model. However, such a prediction is likely to be much more difficult in the future, both in the US and internationally.
Oil Price Outlook
As shown in Table 1 below the world’s total oil production was 92.98 million bbl per day in 2015. OPEC predicts this to increase to 94.18 in 2016. This prediction depends on a number of factors. For example the U.S. liquids production is now forecasted to bottom out earlier than previously anticipated, resulting in increased oil production in 2016/17 when compared to the earlier projection as shown in Figure 4 above.

© 2016 Morten Frisch Consulting 9
Beyond any supply considerations of the U.S. Lower 48 states, the forest fires in Northern Canada which resulted in oil production interruptions of 1.3 million bbl per day at its peak appear to have been contained and the Canadian production is slowly coming back on stream.
Table 1: OPEC 2016 World Oil Demand Projections
Source: OPEC Secretariat
On a global scale, attempts have been made by the Nigerian government to negotiate a ceasefire and eventual peace conditions with Delta militants, despite contradicting statements from both sides. This will hopefully resurrect Nigerian oil production currently disturbed by sabotage. Progress is also being made with regards to containing IS in Libya which could also lead to revival of the oil production in this country, although there are legitimate concerns regarding the state of oil fields and associated infrastructure. The UK “Brexit” will, at least in the short term reduce the price of crude oil and, hence, could also negatively impact on production economics.
On the demand side, China has been buying large quantities of oil in order to add to its newly constructed strategical reserves as well as demand from independent refineries (“teapots”) and this has masked a reduction in the oil demand resulting from a slow-down in the country’s economic growth. It is predicted that China has nearly filled its currently available strategic reserves and this could lead to a decline in the country’s crude oil imports by some 0.8 million barrels per day.
The state of Asian economies in general is also adding to the oil demand gloom. Based on official reports the Indian economy was a bright exception, reported to be growing at a healthy pace. However it is now widely believed that Indian growth figures might have been overstated by as much as 4.8 percentage points.
Assuming no further deterioration of geopolitical situations and related activities which could negatively affect oil supply, the following conclusions can be drawn about the current state of oil demand: Petrol/ gasoline demand is increasing in the rapidly developing economies of China, India and Mexico, while the same is the case in the OECD countries of the U.S. and the U.K. However, in parallel with increased demand for petrol/gasoline, diesel demand is falling due to a reduction in industrial activity and this is now causing refinery product imbalances throughout most of the world. In the medium to longer term electric car sales, improved car fuel

© 2016 Morten Frisch Consulting 10
efficiencies and the increasing use of CNG/LNG as a transportation fuel will reduce oil consumption growth.
Demand side wild cards are Chinese and Indian oil consumptions, while on the supply side the wild cards remain Nigerian, Libyan and Venezuelan oil production. With regards to the oil price outlook again assuming no further deterioration of geopolitical situations, one can expect the U.S. Lower 48 shale/tight oil production to remain the marginal oil supply at a WTI price in the range of US$ 50±10% per barrel. The price of Brent crude oil will likely fluctuate between US$45 -60 per barrel over the next couple of years. However, Brent and WTI could again spike down to below US$30 per barrel, but this, if it occurs, it is likely to be over relatively short periods only as observed in early 2016.
In conclusion: Oil prices likely will be staying low for longer…
North American Shale Gas Developments
The four main shale gas formations were identified as Marcellus, Utica, Haynesville and the gas-bearing part of Eagle Ford. The first separate shale gas play developed was Barnett in Texas. Another important play is Fayetteville.
Figure 5: Tight Oil and Shale Gas in US Lower 48
Source: Energy Information Administration
The production history of these shale gas accumulations is shown in Figure 6 which clearly demonstrates the dominance of Marcellus after 2012 in the overall U.S. Lower 48 states shale gas production. The category “Rest of US incl. Utica, Bakken” reflects the inclusion into this category the rapidly increasing production of Utica, now the next largest source of shale gas in the U.S. Currently Marcellus and Utica cannot produce and deliver gas at production capacity due to pipeline capacity constraints. However, based on the number of pipeline projects currently under construction, these shortages should be removed in 2018 and beyond.
As was the case for shale/tight oil, large improvements in shale gas recovery rates and decline rates are being achieved through the application of enhanced stimulation performance also in

© 2016 Morten Frisch Consulting 11
Figure 6: US Shale Gas Price Setters
Source: EIA dry shale production data to May 2016
some of the major shale gas plays. An example of such improvements achieved by Chesapeake Energy in the Haynesville shale formation is shown in figure 7.The Haynesville shale formation has a strategic location in relation to LNG export projects in Louisiana, hence such performance improvements are significant for the feed gas supplies for these plants.
Figure 7: Enhanced Stimulation Performance
Source: Chesapeake Energy
The US gas market has until recently been very depressing due to a low gas demand caused by a mild 2015/16 winter. This market situation could continue in the short term since the high oil prices currently experienced are likely to bring to market more associated gas than what is needed. Such a development could result in downward pressure on gas prices in the short term.
0
2
4
6
8
10
12
14
16
18
Woodford (OK)Rest of US incl. Uttica, BakkenBarnett (TX)Fayetteville (AR)Eagle Ford (TX)Haynesville (LA & TX)Marcellus (PA & WV)
© 2016 Morten Frisch Consulting 12
In the longer term however, increased oil drilling is likely to draw capital investment away from natural gas drilling. If this happens, natural gas prices will need to rise to somewhere within the range of US$ 3 – 3.5 per MMBtu in order to incentivise gas E&P activities and yield a life cycle IRR of 10%. This level of IRR is likely to be the minimum required for gas producers to expand their shale gas production activities and it presupposes a hedging horizon of at least 18 months in order to lock in the necessary production income to justify the additional investment.
Neither shale/tight oil- nor shale gas producers amongst the independent and smaller E&P companies can rely on external financing for their drilling and production completion activities as they did in the past. These drillers can no longer outspend cash flow, which means that oil and gas prices will have to support new and expanded E&P activities.
North American LNG Exports
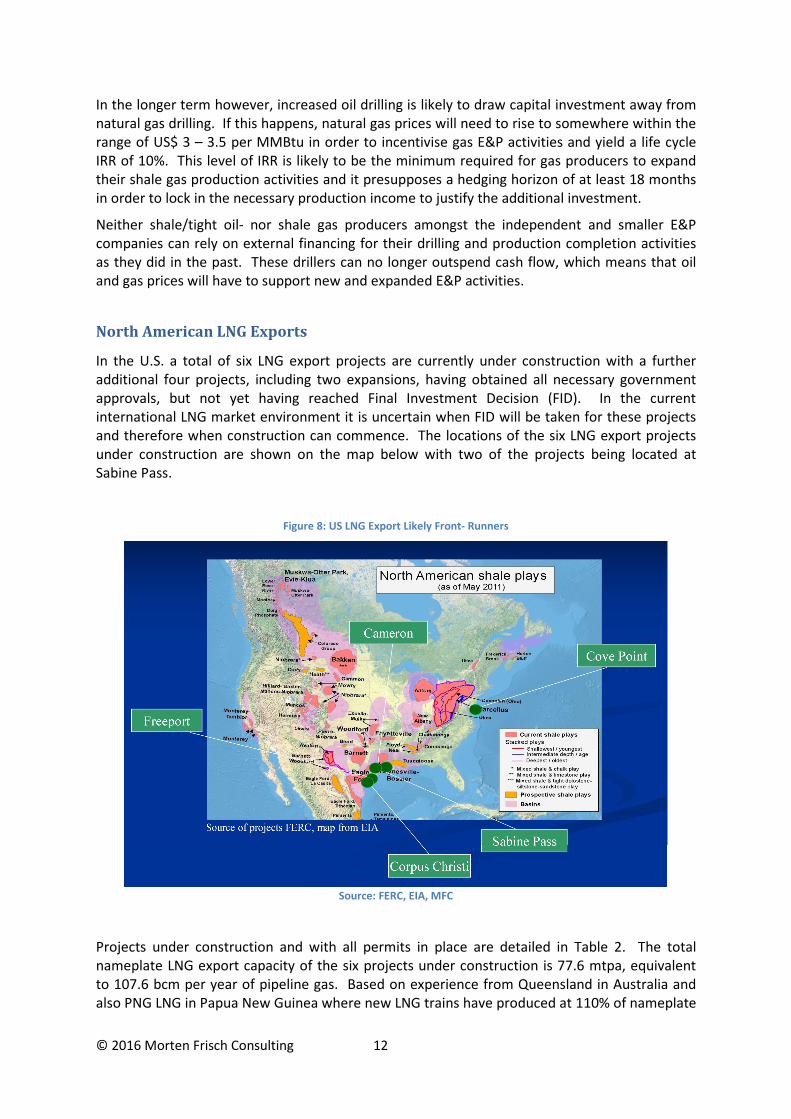
In the U.S. a total of six LNG export projects are currently under construction with a further additional four projects, including two expansions, having obtained all necessary government approvals, but not yet having reached Final Investment Decision (FID). In the current international LNG market environment it is uncertain when FID will be taken for these projects and therefore when construction can commence. The locations of the six LNG export projects under construction are shown on the map below with two of the projects being located at Sabine Pass.
Figure 8: US LNG Export Likely Front- Runners
Source: FERC, EIA, MFC
Projects under construction and with all permits in place are detailed in Table 2. The total nameplate LNG export capacity of the six projects under construction is 77.6 mtpa, equivalent to 107.6 bcm per year of pipeline gas. Based on experience from Queensland in Australia and also PNG LNG in Papua New Guinea where new LNG trains have produced at 110% of nameplate

© 2016 Morten Frisch Consulting 13
capacity on a continuous basis, it is possible that also the total export capacity of the six US projects could exceed nameplate.
Table 2: Approved Lower 48 LNG Export Projects
It should also be noted that the U.S. LNG production has been sold on flexible and tradable terms, and due to the current oversupply of LNG in the international market this is likely to influence LNG trade models globally. Furthermore, a large part of this LNG production, equivalent to some 2 cargoes a week, is still owned by the project developers themselves and they are, therefore, likely to be sold in the spot market increasing liquidity and price flexibility for buyers. It is highly likely that LNG FOB price quotations for a Gulf of Mexico location will be developed by 2020 when the LNG plants under construction should all be producing at full capacity.
Figure 9 demonstrates the current position of US LNG exports to the Far East Asian market. For August 2016 deliveries not even Cheniere’s first Sabine Pass train which has a liquefaction cost of US$ 2.25 per MMBtu can compete in this market without treating the liquefaction costs as sunk costs and, therefore, selling product below the short term marginal cost of production. This is the case even when comparing the cost of delivering LNG from Sabine Pass to Tokyo Bay against an in the LNG industry commonly adopted oil-indexed LNG price arrangements based on a Japanese Customs Cleared Crude Oil Cocktail, commonly referred to as JCC, value of US$50 per barrel.
When measured against the current August 2016 ICIS Heren East Asian Index (EAX) an LNG DES cargo delivered from Sabine Pass would incur a loss of US$3 per MMBtu which exceeds liquefaction costs. Such a trade will likely therefore result in a loss, even based on the short term marginal cost of production if liquefaction costs are considered as “sunk” since most of these costs are subject to a process or pay arrangement, i.e. most of the liquefaction costs will have to be paid whether LNG is produced or not.

© 2016 Morten Frisch Consulting 14
Figure 9: Expected Cost of US LNG (2016 US$)
The situation for a delivery to a northwest European terminal is better. Here the differential between the LNG DES cost and ICIS Heren August 2016 Zeebrugge market value has been reduced to US$ 1.5 per MMBtu. A similar situation would occur if a cargo was sold on a DES basis against the gas trading hubs TTF in Holland or NBP in the United Kingdom. Such a trade would result in a positive cash income against short term marginal cost, before accounting for any LNG regasification terminal charges and pipeline system entry charges.
Global LNG Developments
The equivalent of 77.6 mtpa (107.6 bcm/y) of US supply is has just been started up or is currently under construction, in the form of very flexible, tradable LNG and a similar new volume is expected by 2020 out of Australia. U.S. and Australian volumes are both competing for Asian markets, but the Australian suppliers seem to have gained the upper hand due to lower shipping costs and the existence of long term LNG purchase agreements covering most of their production. It can therefore be expected that US supplies will be competing for market share in Atlantic Basin markets and in the Middle East. That this is likely to be the case is supported by the LNG value comparison for DES cargoes analysed in the previous section.
Some 800mtpa (1,100 bcm/y) of LNG liquefaction projects are estimated to be in various stages of development globally, although approximately 100 mtpa of such projects have been cancelled in the last 12 months and additional planned LNG liquefaction projects are likely to be cancelled in the next to three years.
Global LNG demand is estimated to grow by some 90 mtpa (124 bcm per year) by 2025. The ratio of new projects to likely committed demand is currently 9 to 1, close to the highest ever and this reflects the strength of buyers’ positions in the current LNG market.
Uncommitted and traded LNG will compete for “any” market. The owners of uncommitted cargoes may have to accept European NPB or TTF discounted prices in order to find an outlet for their product. The bright spot in the LNG market is new demand developed on the basis of Floating Storage and Regasification Units (FSRUs) technology. The use of this cost competitive technology is now increasingly used worldwide and especially in countries with high seasonal demand or supply shortages, where LNG is the only solution to make a downstream project

© 2016 Morten Frisch Consulting 15
work or high price differentials between LNG supplier costs and the domestic energy market still make the investment attractive.
For LNG suppliers, LNG export project developers and/or LNG shippers such FSRUs are a way to turn some of the uncompetitive LNG supply projects to viable economic investments. Companies such as Golar LNG via its recent Joint Venture with private equity Stonebridge aim to provide with the help of FSRU solutions the infrastructure needed for new LNG imports when the buyer cannot do so. This could be the case for smaller, downstream markets where the buyer, usually involved in power generation, would consider LNG imports for their power plant. Even Cheniere are moving away from their mostly FOB-based long term agreements and offer ex. ship/DES contractual terms to allow smaller LNG demand which might be lacking sophistication in shipping arrangements to be enhanced and therefore to be developed into real LNG import projects.
Currently there are twenty four FSRU vessels operating around the world with at least eight new FSRUs on order, the latest of which has been placed with a Shanghai shipyard. In 2015 FSRUs represented some 8% of global LNG demand, or approximately 20 mtpa out of a total of 245 mtpa. Pakistan, Jordan and Egypt are the most recent LNG importers using FRSUs with Ghana and Columbia to start next year.
Arabian Gulf countries represented by Kuwait and the UAE are already substantial LNG importers, currently using FSRU technology. Saudi Arabia has declared that it will consider the import of gas. If this happens, it will boost gas in the Saudi Arabia energy mix. During summer periods Saudi Arabia burn up to 1 million bbl per day of crude oil and oil products in its power generation and water desalination plants. These crude oil and oil product volumes could be replaced by imported LNG. At current prices, this would generate positive economic benefits to Saudi Arabia. At the present time, LNG can also be delivered at cost below the cost of developing new, deep and highly sulphurous gas deposit in the country.
For Saudi Arabia to import LNG via FSRU technology would create cost savings, environmental benefits, while crude oil and oil products would be released for exports and hence strengthen the country’s position as an oil exporter. Such a development would likely be a win-win for both Saudi Arabia and LNG exporters.
Global LNG Price Dynamics
Periodic supply demand imbalances in the global LNG market may also lead to power imbalance in long term contractual negotiations. At periods of high market prices suppliers typically dictate the terms, while in periods of low prices, buyers appear to regain negotiation power. In the current market of global oversupply and with prices having already seen six-year lows, buyers are in the privileged position to demand unprecedented changes in longer term LNG supply arrangements.
The LNG players have also changed themselves. Traditional LNG buyers in Asia and elsewhere have matured in how they approach and navigate through both long term contracts and gas markets. They have also gained exposure to different price indices and their associated risk as well as to downstream markets such as power generation. Less mature and/or experienced players have also gained access to major liquefaction projects and have managed to secure supply contracts, invest in equity and/or tolling capacity with some of these LNG export projects.

© 2016 Morten Frisch Consulting 16
Supported by the current price environment, buyers now seek and receive flexible terms ranging from simple freedom of cargo destination to shorter contract lengths and seasonality in their offtake. They are also demanding “real term” assessment of the seller’s capacity to meet their contractual obligations by introducing “cargo-by-cargo” supply arrangements and abandoning Take-or-Pay conditions that prevailed in previous agreements. Asian gas buyers have in the past demanded Henry Hub – based LNG pricing. With the LNG liquefaction projects being developed in the U.S. flexible LNG pricing terms have as a result been used for LNG exports from the U.S. and also in some other non-U.S. LNG supply arrangements. For LNG buyers outside the Americas this could prove to be a very costly mistake. Based on the current low Henry Hub prices LNG from the U.S. is already uncompetitive in Asian markets when compared to alternative supplies. U.S. gas prices are likely to increase to a level of US$3 – 3.5 per MMBtu in the future making the position of Henry Hub pricing in Asian markets even less attractive in the short to medium term.
Currently 70% of all contracts for LNG supply still have prices based on some form of oil indexation. With oil prices rising in relation to gas market clearing prices and there being an increasing LNG oversupply in the world, these arrangements are likely to come under increasing strain. This LNG supply and pricing environment is likely to lead in the longer term to local hub - type pricing in Asia and hence allow market players to avoid problems arising from the international application of gas pricing regimes and/ or gas price data from a region other than the market served.
Given the current great value differential between gas buyers and sellers, price review and price re-opener clauses of existing agreements are being triggered more often, a situation that may lead to more high profile arbitration and even court cases, especially in Europe, but later also in Asia. It is possible that in the future we will see long term LNG contracts allowing for either party to exit the agreement altogether, if no consensus is reached following the end of a price review period. Should this materialise, it would be in breach of one of the main principles on which price review and price re-opener clauses in long term agreements for gas sales have been based: The sanctity of contract.
LNG sellers are now forced to adapt to the current LNG market environment. This is very different from the commercial environment during the LNG investment wave of 2009, just seven years earlier. LNG liquefaction projects are capital intensive, often at a total cost exceeding US$10 billion and require stable offtake agreements to secure 3rd party financing. But the onset of contractual “flexibility” is likely to hurt LNG project investments. More than 13 projects representing in excess of 100 mtpa of LNG production have already been cancelled or postponed a number likely to grow substantially over the next two to three years.
On a more positive note, LNG chain capital cost improvements, technical efficiencies such as reduced boil-off during vessel journeys and downward pressure on shipping costs are still likely to improve the overall relative attractiveness of LNG as a source of fuel and therefore of LNG projects. Global LNG oversupply is putting pressure on shipping costs and in particular allowing for greater flexibility on what might have otherwise been inflexible vessel charters. This development is creating the conditions for a larger number of cargo swaps.
As concluding remarks about the energy markets in general and the LNG market, in particular, one has to admit that on balance the oil and gas market negatives currently and in the short term outweigh the positives. Provided there are no new geopolitical upheavals and based on available market information, it should currently be safe to assume that oil prices will stay low for longer, and gas prices will stay low for even longer than oil.

© 2016 Morten Frisch Consulting 17
References
"Shale Gas, Competitiveness, and New U.S. Chemical Industry Investment—An Analysis of Announced Projects.", American Chemistry Council report, May 2013. Unraveling the Oil Conundrum: Productivity Improvements and Cost Declines in the U.S. Shale Oil Industry, Ryan Decker, Aaron Flaaen, and Maria Tito, U.S. FEDS Notes, 22 March 2016. The DUCs Are Fracking: The Uncertainty Surrounding Drilled but Uncompleted Wells, Matt Piotrowski, Energyfuse.org, 06 May 2016. World oil market prospects for the second half of 2016, OPEC Monthly Oil Market Report, 13 June 2016. International Energy Outlook 2016 with Projections to 2040, US Energy Information Administration, May 2016. China Shale Gas Development, Faouzi Aloulou, senior economist, Exploration and Production Analysis Team US Energy Information Administration, Kenan-Falgler Energy Center, University of North Carolina at Chapel Hill, April 2016. Energy Stat: Lowering Our U.S. Rig Count Estimates- Why is This Good for Oilfield Service Margins? J. Marshall Adkins, Raymond James, 31 May 2016. Oil market getting used to looking up, not down, Anjli Raval, Oil and Gas Correspondent, Financial Times, 9 June 2016. Oil Prices Recovering; Energy Outlook, Syed Rashid Husain, Saudi Gazette, 19 June 2016. The Transition from Peak Oil to Peak Oil Demand, Morten Frisch, Morten Frisch Consulting, Saudi Gazette, 1 February 2016. Oil Price Rally and US Tight Oil Production, Morten Frisch, Morten Frisch Consulting, Saudi Gazette, 27 June 2015. US Tight Oil production and the Future Oil Price, Morten Frisch, Morten Frisch Consulting, Saudi Gazette, 12 January 2015. Current European gas pricing problems: Solutions based on price review and price re-opener provisions , Morten Frisch, Morten Frisch Consulting, University of Dundee, Centre for Energy, Petroleum & Mineral Law & Policy (CEPMLP), International Energy Law and Policy Research Paper Series, Working Research Paper Series No: 2010/03, 18 February 2010. Future trends in spot LNG cargoes and the development of trade and pricing, Morten Frisch, Morten Frisch Consulting LNG Journal, February 2011 issue. Future pricing of LNG spot cargoes to be guided by dynamics of growing gas market, Morten Frisch, Morten Frisch Consulting, LNG Journal, January 2011 issue. THE LNG Industry GIIGNL Annual Report, 2016 Edition, April 2016.

© 2016 Morten Frisch Consulting 18