Livestock Slaughter 01/23/2009 - Cornell...
25
Mt An 1-2 (1-09) Washington, D.C. Livestock Slaughter Released January 23, 2009, by the National Agricultural Statistics Service (NASS), Agricultural Statistics Board, U.S. Department of Agriculture. For information on Livestock Slaughter call Sherry Bertramsen at (515) 284-4340, office hours 7:00 a.m. to 4:00 p.m. CT. Total Red Meat and Pork Production at Record Highs for December Commercial red meat production for the United States totaled 4.16 billion pounds in December, up 3 percent from the 4.06 billion pounds produced in December 2007. Beef production, at 2.08 billion pounds, was 1 percent above the previous year. Cattle slaughter totaled 2.67 million head, up 1 percent from December 2007. The average live weight was up 1 pound from the previous year, at 1,303 pounds. Veal production totaled 13.3 million pounds, 28 percent above December a year ago. Calf slaughter totaled 94,100 head, up 54 percent from December 2007. The average live weight was down 43 pounds from last year, at 245 pounds. Pork production totaled 2.05 billion pounds, up 4 percent from the previous year. Hog kill totaled 10.14 million head, up 5 percent from December 2007. The average live weight was down 2 pounds from the previous year, at 270 pounds. Lamb and mutton production, at 15.4 million pounds, was up slightly from December 2007. Sheep slaughter totaled 230,800 head, 1 percent above last year. The average live weight was 134 pounds, down 1 pound from December a year ago. January to December 2008 commercial red meat production was 50.2 billion pounds, up 3 percent from 2007. Accumulated beef production was up 1 percent from last year, veal was up 4 percent, pork was up 6 percent from last year, and lamb and mutton production was down 5 percent. December 2007 contained 21 weekdays (including one holiday) and 5 Saturdays. December 2008 contained 23 weekdays (including one holiday) and 4 Saturdays.
Transcript of Livestock Slaughter 01/23/2009 - Cornell...

Mt An 1-2 (1-09)
Washington, D.C.
Livestock Slaughter
Released January 23, 2009, by the National Agricultural Statistics Service (NASS), Agricultural Statistics Board, U.S. Department of Agriculture. For information on Livestock Slaughter call Sherry Bertramsen at (515) 284-4340, office hours 7:00 a.m. to 4:00 p.m. CT.
Total Red Meat and Pork Production at Record Highs for December Commercial red meat production for the United States totaled 4.16 billion pounds in December, up 3 percent from the 4.06 billion pounds produced in December 2007. Beef production, at 2.08 billion pounds, was 1 percent above the previous year. Cattle slaughter totaled 2.67 million head, up 1 percent from December 2007. The average live weight was up 1 pound from the previous year, at 1,303 pounds. Veal production totaled 13.3 million pounds, 28 percent above December a year ago. Calf slaughter totaled 94,100 head, up 54 percent from December 2007. The average live weight was down 43 pounds from last year, at 245 pounds. Pork production totaled 2.05 billion pounds, up 4 percent from the previous year. Hog kill totaled 10.14 million head, up 5 percent from December 2007. The average live weight was down 2 pounds from the previous year, at 270 pounds. Lamb and mutton production, at 15.4 million pounds, was up slightly from December 2007. Sheep slaughter totaled 230,800 head, 1 percent above last year. The average live weight was 134 pounds, down 1 pound from December a year ago. January to December 2008 commercial red meat production was 50.2 billion pounds, up 3 percent from 2007. Accumulated beef production was up 1 percent from last year, veal was up 4 percent, pork was up 6 percent from last year, and lamb and mutton production was down 5 percent. December 2007 contained 21 weekdays (including one holiday) and 5 Saturdays. December 2008 contained 23 weekdays (including one holiday) and 4 Saturdays.


Livestock Slaughter Agricultural Statistics Board January 2009 i NASS, USDA
Contents Page Red Meat Production, Commercial and FI, by Type, U.S. .......................................................1 Livestock Slaughter, Number and Average Weights, by Species and Type of Slaughter, U.S. ........................................................................2 Commercial Red Meat Production, by State and U.S. .............................................................3 Commercial Cattle Slaughter, Number, Total and Average Live Weight, by State and U.S. .....................................................................................4 Commercial Calf Slaughter, Number, Total and Average Live Weight, by State and U.S. .....................................................................................5 Commercial Hog Slaughter, Number, Total and Average Live Weight, by State and U.S. .....................................................................................6 Commercial Sheep and Lamb Slaughter, Number, Total and Average Live Weight, by State and U.S. ................................................................7 Federally Inspected Classification of Number and Average Dressed Weight, by Species and Class and U.S. ............................................8 Federally Inspected Slaughter by Species and Class, by Region and U.S. ............................................................................................................9 Federally Inspected Percent of Total Commercial, by Species, U.S. ................................................................................................................11 Reliability Statement................................................................................................................18 Types of Plants.........................................................................................................................19 Terms and Definitions .............................................................................................................20 Information Contacts ...............................................................................................................20


Livestock Slaughter Agricultural Statistics Board January 2009 1 NASS, USDA
Commercial Red Meat Production: United States 1 Dec 08 % of Jan - Dec 2
Type Dec 2007
Nov 2008
Dec 2008 Dec
2007 Nov 2008 2007 2008 08 as %
of 07
Million Pounds
Million Pounds
Million Pounds Percent Percent Million
Pounds Million Pounds Percent
Beef Veal Pork Lamb & Mutton Total Red Meat 3
2,061.4 10.4
1,972.7 15.4
4,059.9
1,960.9 11.3
1,886.5 12.9
*3,871.7
2,082.0 13.3
2,052.0 15.4
4,162.7
101 128 104 100
103
106 117 109 120
108
26,420.8 137.2
21,942.6 183.1
48,683.8
26,564.5 143.3
23,348.0 174.0
50,229.7
101 104 106 95
103
* Revised. 1 Based on packers' dressed weights and excludes farm slaughter. 2 Accumulated totals and percentages based on unrounded data. 3 Totals may not equal sum of the parts due to rounding.
Federally Inspected Red Meat Production: United States 1 Dec 08 % of Jan - Dec 2
Type Dec 2007
Nov 2008
Dec 2008 Dec
2007 Nov 2008 2007 2008 08 as %
of 07
Million Pounds
Million Pounds
Million Pounds Percent Percent Million
Pounds Million Pounds Percent
Beef Veal Pork Lamb & Mutton Total Red Meat 3
2,032.7 10.2
1,957.4 14.5
4,014.8
1,933.1 10.9
1,873.7 12.2
3,830.0
2,051.3 13.0
2,036.8 14.5
4,115.6
101 128 104 100
103
106 119 109 119
107
26,070.0 134.3
21,768.0 174.7
48,146.9
26,200.2 139.8
23,170.1 165.7
49,675.8
100 104 106 95
103
1 Based on packers' dressed weights and excludes farm slaughter. 2 Accumulated totals and percentages based on unrounded data. 3 Totals may not equal sum of the parts due to rounding.

Livestock Slaughter Agricultural Statistics Board January 2009 2 NASS, USDA
Livestock Slaughter: Number and Average Weights, United States 1 Dec 08 % of Jan - Dec 2
Species Unit Dec 2007
Nov 2008
Dec 2008 Dec
2007 Nov 2008 2007 2008 08 %
of 07 Percent Percent Prcnt
Cattle No. Fed. Insp. Other Comm'l. 3 Live Wt/Hd Fed. Insp. Other Comm'l. Calves No. Fed. Insp. Other Comm'l. 3 Live Wt/Hd Fed. Insp. Other Comm'l. Hogs No. Fed. Insp. Other Comm'l. 3 Live Wt/Hd Fed. Insp. Other Comm'l. Sheep&Lambs No. Fed. Insp. Other Comm'l. 3 Live Wt/Hd Fed. Insp. Other Comm'l. Goats No. Fed. Insp. Other Comm'l. 3 Live Wt/Hd Fed. Insp. Other Comm'l. Bison No. Fed. Insp. Other Comm'l. 3
Thou Thou Thou Lbs Lbs Lbs Thou Thou Thou Lbs Lbs Lbs Thou Thou Thou Lbs Lbs Lbs Thou Thou Thou Lbs Lbs Lbs Thou Thou Thou Lbs Lbs Lbs Thou Thou Thou
2,602.5
45.4 2,647.9
1,305 1,132 1,302
59.9 1.1
61.0
287 386 288
9,600.6 89.3
9,689.9
272 236 272
212.2 16.8
229.0
137 104 135
61.9 17.2 79.1
62 61 62
3.6 1.5 5.2
2,475.0
44.0 2,519.0
1,305 1,122 1,302
79.7 1.7
81.4
*237 424 240
9,249.5 75.5
9,325.0
271 237 271
179.9 13.8
193.7
136 103 133
53.5 19.4 73.0
62 74 65
4.0 1.2 5.2
2,623.0
48.2 2,671.3
1,306 1,139 1,303
92.8 1.3
94.1
243 416 245
10,053.4 91.2
10,144.6
271 232 270
212.5 18.3
230.8
137 100 134
70.9 23.5 94.5
62 72 64
4.5 1.4 5.8
101 106 101
100 101 100
155 116 154
85
108 85
105 102 105
99 98 99
100 109 101
100 96 99
115 136 119
100 119 104
124 89
113
106 110 106
100 101 100
116 80
116
103 98
102
109 121 109
100 98
100
118 133 119
101 97
100
133 121 129
99 97 99
112 119 113
33,720.7
543.3 34,264.0
1,275 1,139 1,273
744.8 13.3
758.1
304 399 305
108,138.2 1,033.4
109,171.6
269 234 269
2,528.6 165.1
2,693.7
138 104 136
639.4 187.9 827.3
61 56 60
50.1 16.9 67.0
33,805.3
564.2 34,369.5
1,284 1,143 1,282
942.0 15.3
957.3
255 411 257
115,420.2 1,037.4
116,457.5
268 238 268
2,393.4 162.0
2,555.4
138 104 136
670.7 202.4 873.1
62 66 63
54.8 15.5 70.3
100 104 100
101 100 101
126 115 126
84
103 84
107 100 107
100 102 100
95 98 95
100 100 100
105 108 106
100 118 104
109 92
105 * Revised. 1 Excludes slaughter on farms. 2 Accumulated totals and percentages based on unrounded data. 3 Totals may not equal sum of the parts due to rounding.

Livestock Slaughter Agricultural Statistics Board January 2009 3 NASS, USDA
Commercial Red Meat Production: By State and United States 1 Dec 08 as % of 2 State Dec
2007 Nov 2008
Dec 2008 Dec 2007 Nov 2008
Million Pounds Million Pounds Million Pounds Percent Percent
AL AK AZ AR CA CO DE-MD FL GA HI ID IL IN IA KS KY LA MI MN MS MO MT NE NV N ENG 3 NJ NM NY NC ND OH OK OR PA SC SD TN TX UT VA WA WV WI WY US
2.0
31.5 5.7
142.9 147.8
2.9 7.2
12.5 0.8
17.8 254.1 142.4 591.8 456.3
50.8 0.5
40.0 208.0
1.2 139.1
1.6 581.5
0.1 1.0 4.1 0.3 2.7
204.1 2.3
25.2 91.4
4.6 108.3
21.1 95.6 20.0
372.0 38.0 45.7 67.6
0.7 116.1
0.5
4,059.9
1.6 0.1
29.6 3.9
129.4 149.8
3.0 7.6
12.2 0.8
18.4 241.1 138.7 555.5 377.0 49.1 0.6
42.1 210.5
1.1 135.6
1.4 575.1
0.1 1.3 3.7
*0.6 2.9
207.5 2.1
23.4 92.5 4.6
110.1 19.0 81.5 19.3
361.3 38.4 40.6 63.2 0.8
114.3 0.4
*3,871.7
1.7
33.7 5.7
149.6 164.3
3.4 7.7
11.2 0.9
19.4 256.5 146.1 599.3 421.0 54.5 0.6
45.1 222.1
1.5 147.2
1.4 592.1
0.1 1.4 4.6 0.5 3.5
221.8 2.2
26.4 98.2 4.8
116.7 20.5 87.6 21.1
399.3 42.3 46.4 65.3 0.9
113.3 0.6
4,162.7
86
107 101 105 111 117 107 89
113 109 101 103 101 92
107 104 113 107 126 106 89
102 135 137 111 157 129 109 95
105 107 105 108 97 92
105 107 112 102 97
127 98
125
103
106
114 149 116 110 112 101 92
114 105 106 105 108 112 111 91
107 106 134 109 106 103 106 105 124 89
119 107 105 113 106 105 106 108 108 110 111 110 114 103 117 99
147
108 * Revised. 1 Includes total beef, veal, pork, lamb, and mutton. 2 Percentages based on unrounded data. 3 N ENG includes CT, ME, MA, NH, RI, and VT.

Livestock Slaughter Agricultural Statistics Board January 2009 4 NASS, USDA
Commercial Cattle Slaughter: By State and United States, December 2007 and 2008 1
Number Slaughtered Total Live Weight Average Live Weight State 2007 2008 2007 2008 2007 2008
1,000 Head 1,000 Head 1,000 Pounds 1,000 Pounds Pounds Pounds
AL AK AZ AR CA CO DE-MD FL GA HI ID IL IN IA KS KY LA MI MN MS MO MT NE NV N ENG 2 NJ NM NY NC ND OH OK OR PA SC SD TN TX UT VA WA WV WI WY US 3
0.3 0.1
39.4 0.9
128.4 171.8
3.1
22.1 0.8
23.7
3.2
553.1 1.7 0.5
45.7 64.7
7.9 2.0
547.8 0.1 1.1 2.4 0.4 2.0
16.6 1.1 9.2 1.9 2.8
73.4 12.2
2.1
476.8 46.7
1.2 84.8
1.1 142.5
0.6
2,647.9
0.5
46.9 1.0
137.1 187.4
3.7
0.9 25.8
4.1
501.0
2.0 0.6
52.8 66.3
0.1 7.9 1.8
544.8 0.1 1.5 3.1 0.5 2.8
16.1 1.1 8.8 2.3 3.1
77.1 12.1
2.8
512.3 52.0 0.8
82.8 1.4
140.3 0.8
2,671.3
247 60
55,377 884
165,404 227,506
4,078
20,890 823
29,214
3,396
719,679 1,606
396 62,729 88,492
9,450 2,343
737,099 100
1,135 2,899
377 2,366
19,046 1,286
10,876 2,099 3,173
92,421 12,892
1,799
595,414 60,676 1,246
110,447 1,177
190,207 699
3,434,170
412
61,712 1,039
176,505 252,316
4,783
1,040 32,292
4,366
653,600
1,868 415
72,444 91,012
39 9,295 2,074
736,356 143
1,532 3,533
536 3,302
18,460 1,342
10,458 2,499 3,648
97,003 13,227
2,408
642,589 67,498
821 107,163
1,479 184,441
911
3,467,891
945 1,147 1,410 1,016 1,312 1,325 1,312
946
1,006 1,249
1,053
1,301
929 770
1,383 1,378
1,202 1,163 1,348 1,078 1,029 1,202 1,046 1,179 1,152 1,174 1,193 1,080 1,183 1,270 1,065
864
1,252 1,303 1,002 1,307 1,036 1,348 1,161
1,302
863
1,321 994
1,306 1,348 1,278
1,100 1,270
1,056
1,305
939 741
1,383 1,380
774 1,186 1,137 1,353 1,179 1,031 1,136 1,039 1,184 1,150 1,178 1,195 1,068 1,228 1,273 1,097
871
1,258 1,303
987 1,299 1,048 1,330 1,147
1,303
1 Includes slaughter under Federal inspection and other Commercial slaughter, excludes farm slaughter. 2 N ENG includes CT, ME, MA, NH, RI, and VT. 3 States with no data printed are still included in the US total, data not printed to avoid disclosing individual operations.
Accumulated totals and percentages based on unrounded data.
Livestock Slaughter Agricultural Statistics Board January 2009 5 NASS, USDA
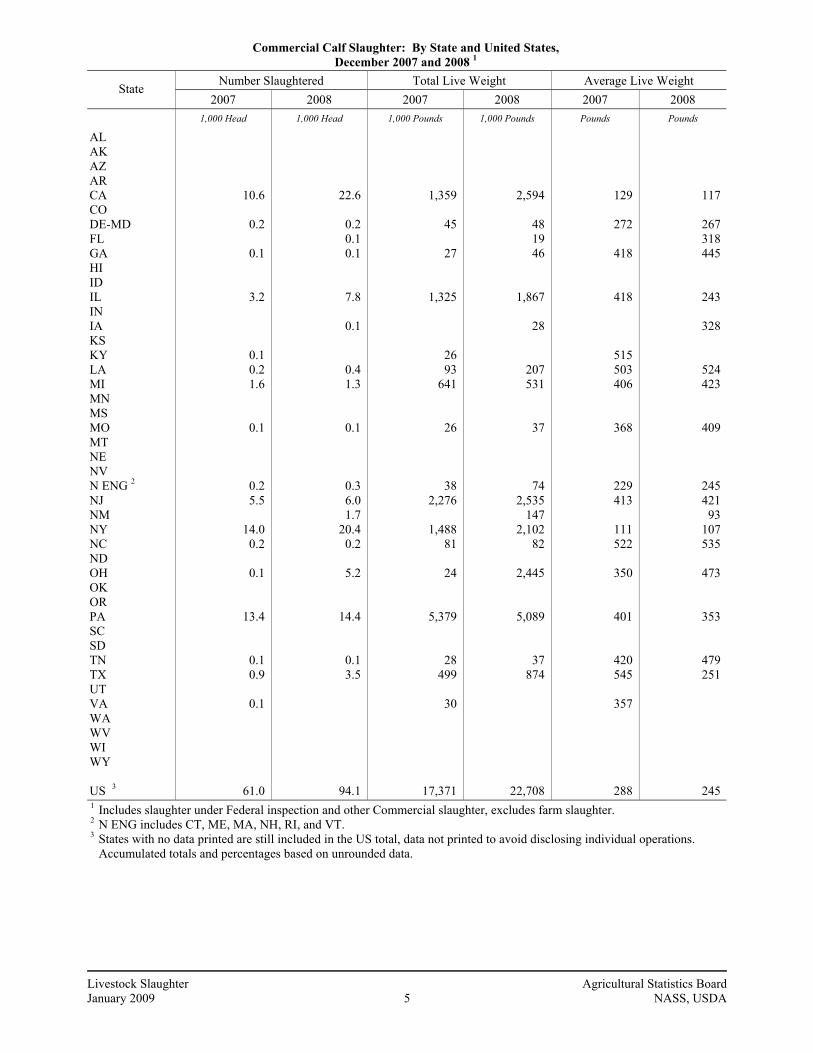
Commercial Calf Slaughter: By State and United States, December 2007 and 2008 1
Number Slaughtered Total Live Weight Average Live Weight State 2007 2008 2007 2008 2007 2008
1,000 Head 1,000 Head 1,000 Pounds 1,000 Pounds Pounds Pounds
AL AK AZ AR CA CO DE-MD FL GA HI ID IL IN IA KS KY LA MI MN MS MO MT NE NV N ENG 2 NJ NM NY NC ND OH OK OR PA SC SD TN TX UT VA WA WV WI WY US 3
10.6
0.2
0.1
3.2
0.1 0.2 1.6
0.1
0.2 5.5
14.0
0.2
0.1
13.4
0.1 0.9
0.1
61.0
22.6
0.2 0.1 0.1
7.8
0.1
0.4 1.3
0.1
0.3 6.0 1.7
20.4 0.2
5.2
14.4
0.1 3.5
94.1
1,359
45
27
1,325
26 93
641
26
38 2,276
1,488
81
24
5,379
28 499
30
17,371
2,594
48 19 46
1,867
28
207 531
37
74 2,535
147 2,102
82
2,445
5,089
37 874
22,708
129
272
418
418
515 503 406
368
229 413
111 522
350
401
420 545
357
288
117
267 318 445
243
328
524 423
409
245 421 93
107 535
473
353
479 251
245 1 Includes slaughter under Federal inspection and other Commercial slaughter, excludes farm slaughter. 2 N ENG includes CT, ME, MA, NH, RI, and VT. 3 States with no data printed are still included in the US total, data not printed to avoid disclosing individual operations.
Accumulated totals and percentages based on unrounded data.

Livestock Slaughter Agricultural Statistics Board January 2009 6 NASS, USDA
Commercial Hog Slaughter: By State and United States, December 2007 and 2008 1
Number Slaughtered Total Live Weight Average Live Weight State 2007 2008 2007 2008 2007 2008
1,000 Head 1,000 Head 1,000 Pounds 1,000 Pounds Pounds Pounds
AL AK AZ AR CA CO DE-MD FL GA HI ID IL IN IA KS KY LA MI MN MS MO MT NE NV N ENG 2 NJ NM NY NC ND OH OK OR PA SC SD TN TX UT VA WA WV WI WY US 3
7.6 0.1 0.2
17.6 251.8
0.5 1.6 6.8
12.6 2.0
12.4 926.0 693.2
2,684.4 10.3
243.3 2.0
10.9 813.4
632.1
1.3 650.7
1.6
11.5 0.1 2.6
972.9 9.2
95.0 427.6
15.1 273.7
441.8
59.9 41.6
5.6 226.3
2.4 0.7
39.3 0.3
9,689.9
6.0 0.1 0.1
17.3 262.1
0.7 1.8 6.0 6.8 1.8
13.6 936.4 707.9
2,791.3
1.8 10.6
878.8 7.2
687.6 1.3
693.0
2.1 11.0
0.1 2.5
1,076.1 8.3
96.2 465.1
14.7 295.8
403.3
62.9 44.3
5.9 227.0
2.1 0.7
45.5 0.3
10,144.6
3,335 12 29
7,968 61,517
123 420
1,014 2,828
443 3,188
258,524 184,842 731,234
4,514 65,817
318 4,172
214,632
177,286 330
176,184
319 986 19
425 257,756
2,379 26,492
119,311 3,806
69,429
114,252 28,093 11,271
968 59,629
460 175
17,131 77
2,632,754
2,644 26 30
7,859 62,824
171 477 967
1,821 404
3,429 258,603 189,822 751,628
258 3,809
231,484 2,142
188,093 322
187,209
420 944 25
391 283,056
2,121 26,255
127,511 3,686
75,923
105,200 29,298 11,414 1,079
60,664 467 192
19,741 70
2,739,463
436 245 129 454 245 249 262 150 224 220 258 279 267 273 441 271 158 386 264
281 251 271
198 86
248 163 265 257 280 279 254 254
259 470 271 173 264 192 263 445 260
272
438 207 271 454 240 258 262 161 266 222 254 276 268 269
141 361 264 300 274 251 270
199 86
248 156 263 256 274 274 252 257
261 467 258 185 267 219 266 442 255
270
1 Includes slaughter under Federal inspection and other Commercial slaughter, excludes farm slaughter. 2 N ENG includes CT, ME, MA, NH, RI, and VT. 3 States with no data printed are still included in the US total, data not printed to avoid disclosing individual operations.
Accumulated totals and percentages based on unrounded data.

Livestock Slaughter Agricultural Statistics Board January 2009 7 NASS, USDA
Commercial Sheep and Lamb Slaughter: By State and United States, December 2007 and 2008 1
Number Slaughtered Total Live Weight Average Live Weight State 2007 2008 2007 2008 2007 2008
1,000 Head 1,000 Head 1,000 Pounds 1,000 Pounds Pounds Pounds
AL AK AZ AR CA CO DE-MD FL GA HI ID IL IN IA KS KY LA MI MN MS MO MT NE NV N ENG 2 NJ NM NY NC ND OH OK OR PA SC SD TN TX UT VA WA WV WI WY US 3
82.5 3.0 0.1 0.5
0.3
2.9
32.9 0.2 1.0 0.3
17.2 0.3
0.4 0.4
0.1 2.1
12.3 1.0 5.0 1.0
1.2 0.1 2.1 4.5
0.9 1.4 2.9 2.7 1.6 0.9
1.0 0.1
229.0
0.1
82.2 4.0 0.3 0.3
0.3
3.1
32.8 0.3 1.3 0.4
15.8 1.0
0.6 0.4 0.1
3.5
13.4 1.1 5.5 1.1 0.1 0.9 0.1 2.1 5.0
0.2 1.6 4.4 3.2 2.0 1.0 0.5 1.3 0.1
230.8
12,574 307
6 55
34
311
4,981 20
125 17
2,227 37
55 43
8
189 1,053
147 417 74
122
7 283 435
118 107 269 364 151 148
133 18
30,860
7
13,003 385 19 22
33
343
4,836 38
155 22
2,011 114
72 44 9
306 1,130
151 434 87 6
96 7
291 489
28
116 332 440 182 128 78
176 19
30,861
153 101 78
100
127
106 151 105 124 68
130 121
123 107
121 92 85
147 83 75
105 102 134 97
130 74 93
135 96
170
136 137
135
83
158 97 57 79
129
112 148 115 123 62
128 119
117 115 99
87 84
137 79 78
118 104 82
136 97
130 71 75
136 93
134 146 134 146
134
1 Includes slaughter under Federal inspection and other Commercial slaughter, excludes farm slaughter. 2 N ENG includes CT, ME, MA, NH, RI, and VT. 3 States with no data printed are still included in the US total, data not printed to avoid disclosing individual operations.
Accumulated totals and percentages based on unrounded data.

Livestock Slaughter Agricultural Statistics Board January 2009 8 NASS, USDA
Classification of Livestock Slaughtered Under Federal Inspection: United States
Jan - Dec 1 Jan - Dec 1 Item Dec 2007
Nov 2008
Dec 2008 2007 2008
Dec 2007
Nov 2008
Dec 2008 2007 2008
1,000 Head 1,000 Head
1,000 Head 1,000 Head 1,000 Head Percent of
Total Percent of
Total Percent of
Total Percent of
Total Percent of
Total
Class 2 Cattle Steers Heifers All Cows Dairy Cows Other Cows Bulls Total 1 Calves & Vealers Hogs Barrow & Gilts Sows Boars Total 1 Sheep Mature Sheep Lambs & Yrlngs Total 1 Average Dressed Weight
1,279 799 483 205 278
41
2,602
60
9,301 264
36
9,601
11 201
212
1,137 778 514 208 306
46
2,475
80
8,970 247
32
*9,250
9 171
180
1,272 796 517 229 288 38
2,623
93
9,749 271 33
10,053
11 201
213
17,285 10,207 5,675 2,497 3,178
554
33,721
745
104,352 3,309
477
108,138
116 2,413
2,529
16,949 10,091 6,161 2,591 3,569
605
33,805
942
111,460 3,502
458
115,420
122 2,271
2,393
49.2 30.7 18.6 7.9
10.7 1.6
100.0
100.0
96.9 2.8 0.4
100.0
5.2 94.8
100.0
45.9 31.4 20.8 8.4
12.4 1.9
100.0
100.0
97.0 2.7 0.3
100.0
4.8 95.2
100.0
48.5 30.4 19.7 8.7
11.0 1.5
100.0
100.0
97.0 2.7 0.3
100.0
5.2 94.8
100.0
51.3 30.3 16.8 7.4 9.4 1.6
100.0
100.0
96.5 3.1 0.4
100.0
4.6 95.4
100.0
50.1 29.8 18.2 7.7
10.6 1.8
100.0
100.0
96.6 3.0 0.4
100.0
5.1 94.9
100.0
Pounds Pounds Pounds Pounds Pounds
Cattle Steers 3 Heifers 3 All Cows 3 Bulls 3 Calves & Vealers Hogs Barrow Gilts4 Sows 4 Boars 4 Sheep Mature Sheep5 Lamb & Yrlngs5
784 844 784 613 871
172
204 201 304 214
69 67 69
784 856 794 598 872
139
203 200 308 205
68 65 68
785 852 789 606 869
142
203 200 305 201
68 66 69
776 830 764 617 893
182
202 198 308 213
69 67 69
778 838 772 609 888
150
201 198 308 209
69 67 69
* Revised. 1 Total and percentages based on unrounded data. 2 Species totals and classification reported by food inspectors, Inspection Operations, FSIS. 3 Included in cattle average dressed weight. 4 Included in hog average dressed weight. 5 Included in sheep average dressed weight.

Livestock Slaughter Agricultural Statistics Board January 2009 9 NASS, USDA
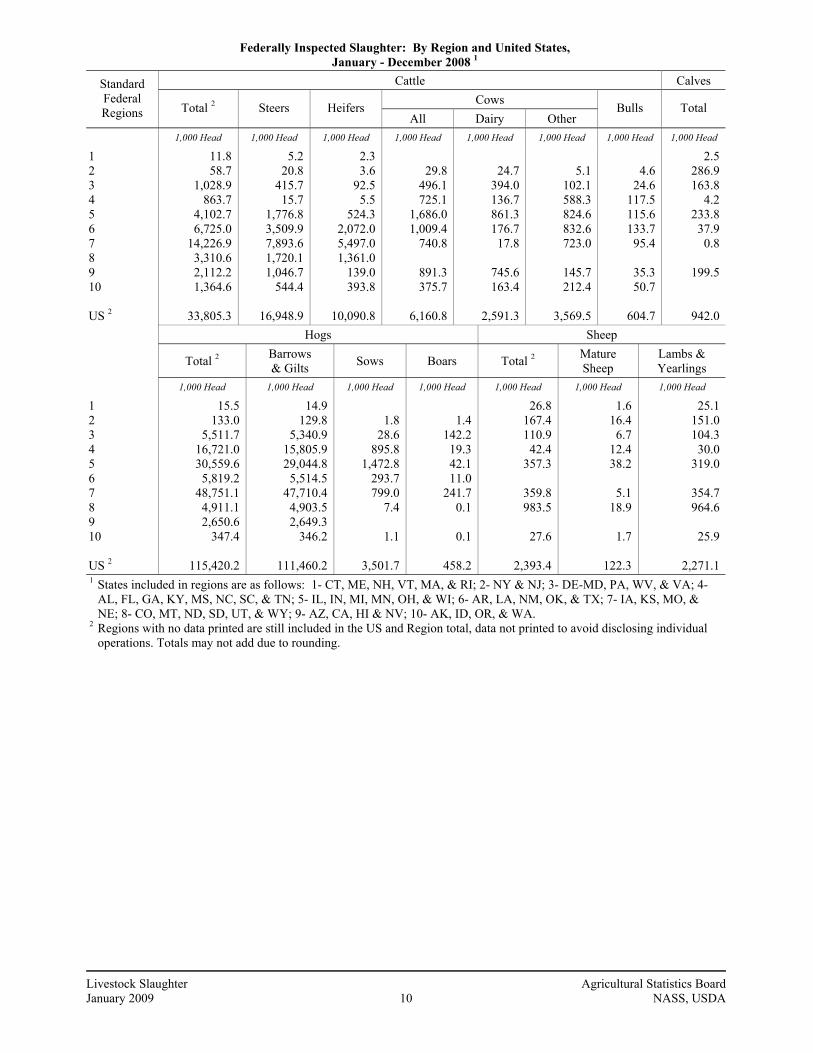
Federally Inspected Slaughter: By Region and United States, December 2008 1
Cattle Calves Cows
Standard Federal Regions Total 2 Steers Heifers
All Dairy Other Bulls Total
1,000 Head 1,000 Head 1,000 Head 1,000 Head 1,000 Head 1,000 Head 1,000 Head 1,000 Head
1 2 3 4 5 6 7 8 9 10 US 2
1.1 5.7
80.2 63.9
329.5 511.8
1,085.4 250.7 184.3 110.3
2,623.0
0.5 2.2
31.9 1.6
135.5 261.6 571.9 134.8
86.1 45.6
1,271.5
0.3 0.4 8.4 0.5
45.5 153.1 450.2 97.8 11.4 28.8
796.4
2.7
38.8 54.0
141.5 87.7 57.8
84.2 33.0
517.0
2.3
30.9 12.7 72.9 18.5 1.3
70.3 14.1
228.9
0.3 7.9
41.3 68.7 69.2 56.5
14.0 18.9
288.1
0.5 1.1 7.8 6.9 9.4 5.5
2.5 2.9
38.2
0.3 26.4 14.7 0.4
22.6 5.1 0.1
22.3
92.8 Hogs Sheep
Total 2 Barrows
& Gilts Sows Boars Total 2 Mature Sheep
Lambs & Yearlings
1,000 Head 1,000 Head 1,000 Head 1,000 Head 1,000 Head 1,000 Head 1,000 Head
1 2 3 4 5 6 7 8 9 10 US 2
1.7 13.2
523.7 1,473.8 2,642.5
517.7 4,183.0
414.8 253.4
29.6
10,053.4
1.6 13.0
513.5 1,389.4 2,534.9
490.8 4,108.9
414.4 253.3
29.5
9,749.3
0.1 2.1
83.1 104.3 25.7 55.8 0.3
271.5
0.1 8.2 1.2 3.4 1.1
18.4
32.5
3.2 16.8 11.3 4.7
32.0
33.6 84.8
2.2
212.5
0.2 1.7 0.7 1.1 3.6
0.3 1.8
0.2
11.1
3.0 15.1 10.7 3.6
28.4
33.3 83.0
2.0
201.4
1 States included in regions are as follows: 1- CT, ME, NH, VT, MA, & RI; 2- NY & NJ; 3- DE-MD, PA, WV, & VA; 4- AL, FL, GA, KY, MS, NC, SC, & TN; 5- IL, IN, MI, MN, OH, & WI; 6- AR, LA, NM, OK, & TX; 7- IA, KS, MO, & NE; 8- CO, MT, ND, SD, UT, & WY; 9- AZ, CA, HI & NV; 10- AK, ID, OR, & WA.
2 Regions with no data printed are still included in the US and Region total, data not printed to avoid disclosing individual operations. Totals may not add due to rounding.
Livestock Slaughter Agricultural Statistics Board January 2009 10 NASS, USDA
Federally Inspected Slaughter: By Region and United States, January - December 2008 1
Cattle Calves Cows
Standard Federal Regions Total 2 Steers Heifers
All Dairy Other Bulls Total
1,000 Head 1,000 Head 1,000 Head 1,000 Head 1,000 Head 1,000 Head 1,000 Head 1,000 Head
1 2 3 4 5 6 7 8 9 10 US 2
11.8 58.7
1,028.9 863.7
4,102.7 6,725.0
14,226.9 3,310.6 2,112.2 1,364.6
33,805.3
5.2 20.8
415.7 15.7
1,776.8 3,509.9 7,893.6 1,720.1 1,046.7
544.4
16,948.9
2.3 3.6
92.5 5.5
524.3 2,072.0 5,497.0 1,361.0
139.0 393.8
10,090.8
29.8
496.1 725.1
1,686.0 1,009.4
740.8
891.3 375.7
6,160.8
24.7
394.0 136.7 861.3 176.7 17.8
745.6 163.4
2,591.3
5.1
102.1 588.3 824.6 832.6 723.0
145.7 212.4
3,569.5
4.6
24.6 117.5 115.6 133.7 95.4
35.3 50.7
604.7
2.5 286.9 163.8
4.2 233.8 37.9 0.8
199.5
942.0 Hogs Sheep
Total 2 Barrows
& Gilts Sows Boars Total 2 Mature Sheep
Lambs & Yearlings
1,000 Head 1,000 Head 1,000 Head 1,000 Head 1,000 Head 1,000 Head 1,000 Head
1 2 3 4 5 6 7 8 9 10 US 2
15.5 133.0
5,511.7 16,721.0 30,559.6
5,819.2 48,751.1
4,911.1 2,650.6
347.4
115,420.2
14.9 129.8
5,340.9 15,805.9 29,044.8
5,514.5 47,710.4
4,903.5 2,649.3
346.2
111,460.2
1.8
28.6 895.8
1,472.8 293.7 799.0
7.4
1.1
3,501.7
1.4
142.2 19.3 42.1 11.0
241.7 0.1
0.1
458.2
26.8 167.4 110.9 42.4
357.3
359.8 983.5
27.6
2,393.4
1.6 16.4 6.7
12.4 38.2
5.1
18.9
1.7
122.3
25.1 151.0 104.3 30.0
319.0
354.7 964.6
25.9
2,271.1
1 States included in regions are as follows: 1- CT, ME, NH, VT, MA, & RI; 2- NY & NJ; 3- DE-MD, PA, WV, & VA; 4- AL, FL, GA, KY, MS, NC, SC, & TN; 5- IL, IN, MI, MN, OH, & WI; 6- AR, LA, NM, OK, & TX; 7- IA, KS, MO, & NE; 8- CO, MT, ND, SD, UT, & WY; 9- AZ, CA, HI & NV; 10- AK, ID, OR, & WA.
2 Regions with no data printed are still included in the US and Region total, data not printed to avoid disclosing individual operations. Totals may not add due to rounding.
Livestock Slaughter Agricultural Statistics Board January 2009 11 NASS, USDA
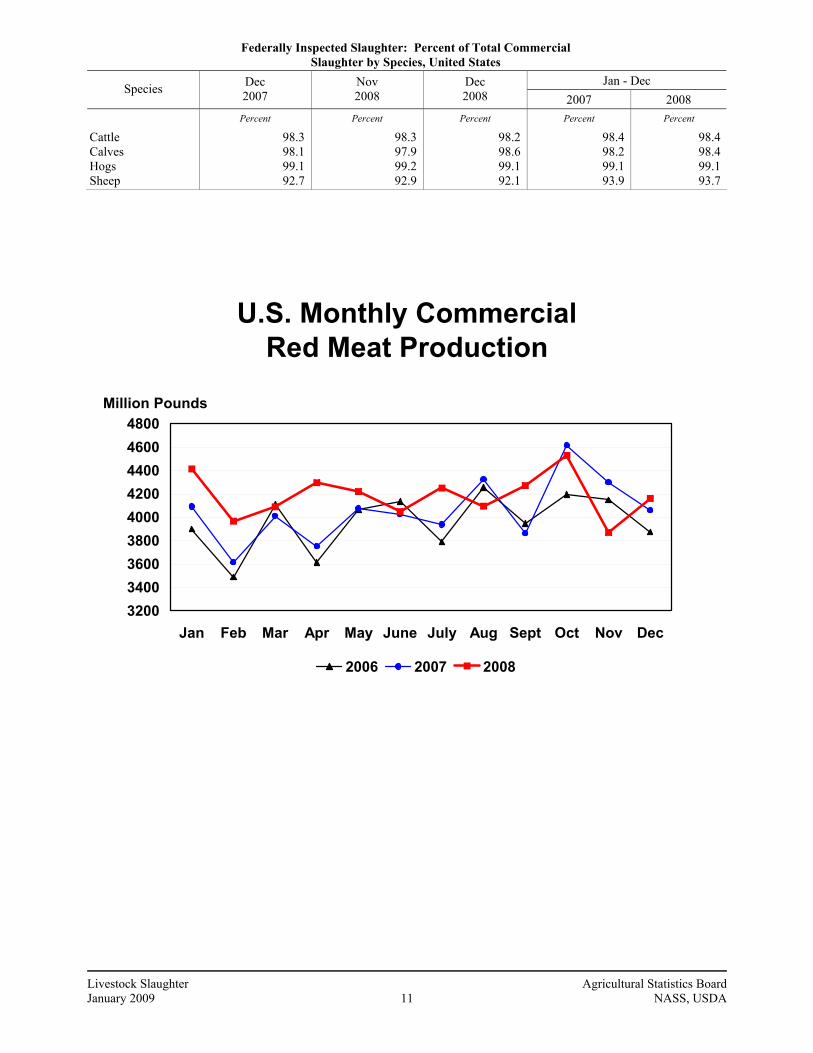
Federally Inspected Slaughter: Percent of Total Commercial Slaughter by Species, United States
Jan - Dec Species Dec 2007
Nov 2008
Dec 2008 2007 2008
Percent Percent Percent Percent Percent
Cattle Calves Hogs Sheep
98.3 98.1 99.1 92.7
98.3 97.9 99.2 92.9
98.2 98.6 99.1 92.1
98.4 98.2 99.1 93.9
98.4 98.4 99.1 93.7
U.S. Monthly CommercialRed Meat Production
320034003600380040004200440046004800
Jan Feb Mar Apr May June July Aug Sept Oct Nov Dec
Million Pounds
2006 2007 2008

Livestock Slaughter Agricultural Statistics Board January 2009 12 NASS, USDA
U.S. Monthly Commercial SlaughterCattle
2200
2400
2600
2800
3000
3200
3400
Jan Feb Mar Apr May Jun Jul Aug Sep Oct Nov Dec
1,000 head
2006 2007 2008
U.S. Monthly Commercial SlaughterCalves
30405060708090
100110
Jan Feb Mar Apr May Jun Jul Aug Sep Oct Nov Dec
1,000 head
2006 2007 2008
Livestock Slaughter Agricultural Statistics Board January 2009 13 NASS, USDA
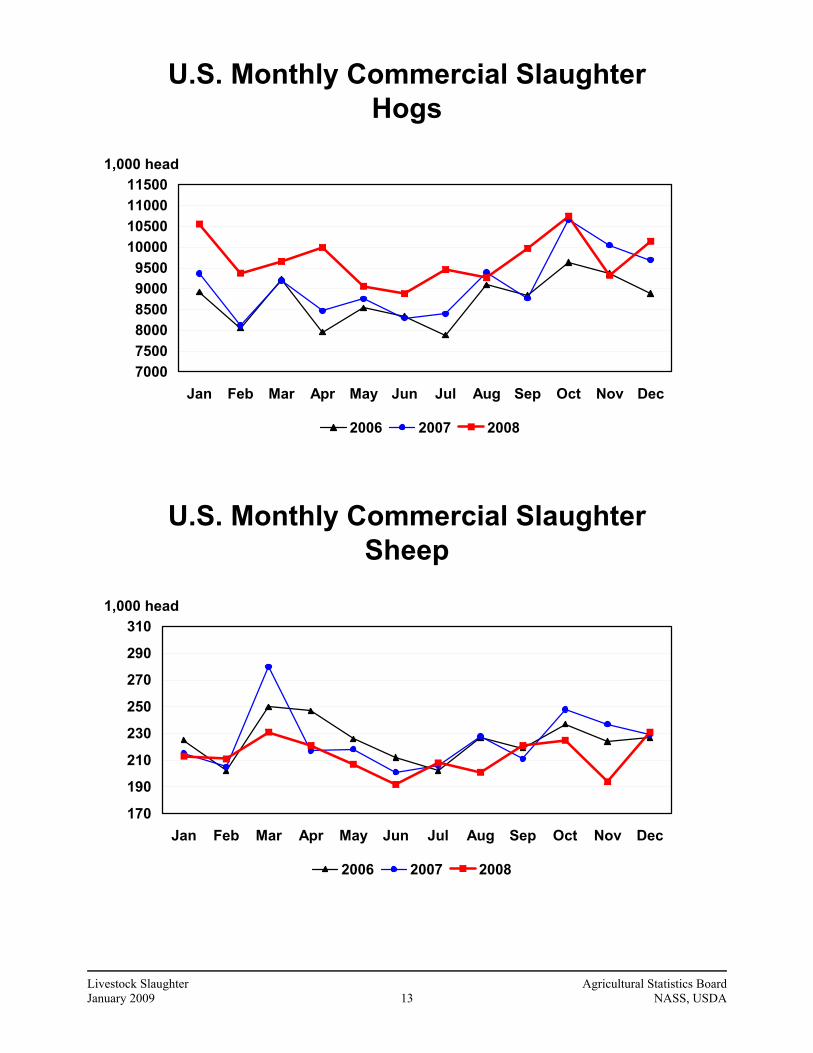
U.S. Monthly Commercial SlaughterHogs
700075008000850090009500
10000105001100011500
Jan Feb Mar Apr May Jun Jul Aug Sep Oct Nov Dec
1,000 head
2006 2007 2008
U.S. Monthly Commercial SlaughterSheep
170
190
210
230
250
270
290
310
Jan Feb Mar Apr May Jun Jul Aug Sep Oct Nov Dec
1,000 head
2006 2007 2008

Livestock Slaughter Agricultural Statistics Board January 2009 14 NASS, USDA
U.S. Monthly Commercial SlaughterAverage Live Weight
Cattle
1200
1220
1240
1260
1280
1300
1320
1340
Jan Feb Mar Apr May Jun Jul Aug Sep Oct Nov Dec
Pounds
2006 2007 2008
U.S. Monthly Commercial SlaughterAverage Live Weight
Hogs
260
262
264
266
268
270
272
274
Jan Feb Mar Apr May Jun Jul Aug Sep Oct Nov Dec
Pounds
2006 2007 2008

Livestock Slaughter Agricultural Statistics Board January 2009 15 NASS, USDA
U.S. Monthly Federally InspectedAverage Dressed Weight
Cattle
740
750
760
770
780
790
800
810
Jan Feb Mar Apr May Jun Jul Aug Sep Oct Nov Dec
Pounds
2006 2007 2008
U.S. Monthly Federally InspectedAverage Dressed Weight
Hogs
192194196198200202204206208
Jan Feb Mar Apr May Jun Jul Aug Sep Oct Nov Dec
Pounds
2006 2007 2008

Livestock Slaughter Agricultural Statistics Board January 2009 16 NASS, USDA
U.S. Monthly Federally InspectedAverage Dressed Weight
Steers
770
790
810
830
850
870
890
Jan Feb Mar Apr May Jun Jul Aug Sep Oct Nov Dec
Pounds
2006 2007 2008
U.S. Monthly Federally InspectedAverage Dressed Weight
Heifers
700
720
740
760
780
800
820
Jan Feb Mar Apr May Jun Jul Aug Sep Oct Nov Dec
Pounds
2006 2007 2008

Livestock Slaughter Agricultural Statistics Board January 2009 17 NASS, USDA
U.S. Monthly Federally InspectedAverage Dressed Weight
Barrows and Gilts
190
192
194
196
198
200
202
204
Jan Feb Mar Apr May Jun Jul Aug Sep Oct Nov Dec
Pounds
2006 2007 2008
U.S. Monthly Federally InspectedAverage Dressed Weight
Sows
302
304
306
308
310
312
314
316
Jan Feb Mar Apr May Jun Jul Aug Sep Oct Nov Dec
Pounds
2006 2007 2008

Livestock Slaughter Agricultural Statistics Board January 2009 18 NASS, USDA
Reliability of Livestock Slaughter Estimates Data Sources: Primary data for the commercial livestock slaughter estimates are obtained from electronic reports completed by inspectors from the Food Safety and Inspection Service (FSIS), USDA, which provide daily counts of animals slaughtered in Federally Inspected (FI) plants, in addition to total live and dressed weights. These counts are combined with data from State-administered Non-Federally Inspected (NFI) slaughter plants to derive total commercial slaughter estimates. More than 95 percent of the total U.S. slaughter for any species is under Federal Inspection. There are nearly 800 livestock slaughter plants in the U.S. operating under Federal Inspection and over 2,000 Non-Federally Inspected (State-inspected or custom-exempt) slaughter plants. Slaughter from State-inspected Talmedge-Aiken plants is included in FI totals (see Types of Plants, page 20). To prevent duplication in reporting between FI and NFI plants and assure all FI plants are included, certificates prepared by FSIS identifying operating status are constantly monitored Revision Policy: Number of head slaughtered, live weights, and dressed weights are subject to revision the following month after the monthly release. Annual totals are published in the slaughter summary each March which includes any revisions made to current and previous year’s published data. Revisions are generally the result of late reports received from slaughter plants and are usually less than one-half of one percent. No revisions will be made to the previous year’s data after the publication of the annual summary in March. Procedures and Reliability: The livestock slaughter data is obtained electronically on a daily basis and summarized approximately two weeks after the week of slaughter. An edit compares each plant's data with the historical data for that plant. Data are checked for unusual values for head kill, patterns of kill, average weights, and dressing percent, based on each plant's past operating profile. In addition, the edit provides a listing of missing reports for follow-up contact with FSIS. Average live and dressed weights and dressing percentages by State are compared with the previous weeks as an additional check. Fluctuations are frequently the result of plants permanently or temporarily closing and a shift in the species reported. The FSIS District Veterinary Medical Specialists (DVMS) are contacted by e-mail or telephone for missing or potentially erroneous slaughter data. This assures that plants slaughtering a large number of head or several species are accounted for each week. Any corrections FSIS makes to the slaughter data are included in the summary. Imputation may be necessary for incomplete reports. The imputation of live and dressed weights is based on the current week reported data of plants of similar size and location. Imputation for live and dressed weight data for cattle and hogs is less than 10 percent and 7 percent, respectively. The imputation for calves and sheep is more frequent and variable. If no data is received electronically or by other means, for plants slaughtering fewer than 50 total head weekly of only one species, data are imputed. The imputation of head for any plant is based on the historical data for that particular plant. The imputation of head slaughtered is rare but when necessary, the imputed head kill for missing plants usually is less than 1 percent of the U.S. head kill totals. FI data are summarized weekly and accumulated to a monthly total for this release. These weekly totals are published by USDA's Agricultural Marketing Service (AMS) in Livestock, Meat, Wool Market News, Weekly Summary, and Statistics and are also available on the NASS website. NFI data are summarized monthly only.

Livestock Slaughter Agricultural Statistics Board January 2009 19 NASS, USDA
Livestock slaughter estimates are based on a census of operating plants and therefore, have no sampling error. However, they may be subject to errors such as omissions, duplications and mistakes in reporting, recording and processing the data. These errors are minimized through rigid quality controls in the edit and summarization process, and a careful review of all reported data for consistency and reasonableness. No data are published when an individual plant’s data could be divulged. If not published, these data are still included in US and region totals. A review of the data is made annually to determine the publishable data.
Types of Livestock Slaughter Plants There are generally four types of slaughtering plants. (1) Federally Inspected (FI) Plants: Plants that transport meat interstate must employ federal
inspectors to assure compliance with USDA standards. Any State whose commercial plants operate entirely under federal inspection may still have custom-exempt establishments for which NFI estimates are made.
(2) Talmedge-Aiken (TA) Plants: Slaughter plants in which USDA is responsible for inspection.
However, federal inspection is carried out by State employees. These plants are considered to be federally inspected.
(3) Non-Federally Inspected (NFI) Plants: Plants which sell and transport only intrastate. State
inspectors assure compliance with individual State standards for these NFI plants. Mobile slaughtering units are excluded and are considered farm slaughter.
(4) Custom-Exempt Plants: Plants that do not sell meat but operate on a custom basis only are
custom-exempt. The animals and meat are not inspected, but the facilities must meet health standards. These are considered NFI plants and head kill is included in NFI totals.

Livestock Slaughter Agricultural Statistics Board January 2009 20 NASS, USDA
Terms and Definitions Used for Livestock Slaughter Estimates Average Live Wight: Excludes post-mortem condemnations Commercial Production: Includes slaughter and meat production in federally inspected and other plants, but excludes animals slaughtered on farms. Dressed Weight: The weight of a chilled animal carcass. Beef with kidney knob in; veal with hide off; lamb and mutton with pluck out; pork with leaf fat and kidneys out, jowls on and head off. Dressing Percent: Usually expressed as a percentage yield of chilled carcass in relation to the weight of the live animal on hoof. For example, a live hog that weighed 200 pounds on hoof and yielded a carcass weighing 140 pounds would have a dressing percentage of 70. Food and Meat Inspection: Includes examination, checking, or testing of a carcass and/or meat against established government standards and involves checking the facility for cleanliness, health of animals, or parts of animals and quality of the meat produced. Number of Head: Includes post-mortem condemnations. Plant, Slaughter: An establishment where animals are killed and butchered. Red Meat: Red meat production is the carcass weight after slaughter excluding condemnation and is comprised of beef, veal, pork, and lamb and mutton. The FI red meat production is equal to the total carcass weight after slaughter. The NFI meat production formula is (NFI head kill) X (live weight) X (FI dressing percentage) = NFI red meat production. Slaughter: Killing and butchering of animals primarily for food. Slaughter, Farm: Animals slaughtered on farms primarily for home consumption. Excludes custom slaughter for farmers at commercial establishments, but includes mobile slaughtering on farms. These estimates appear only in the annual slaughter release. Total Live Weight: Excludes post-mortem condemnations. Wholesome Meat Act: Legislation that specifies that all meat produced for sale in the U.S. must be inspected. Meat that is transported interstate must be inspected in compliance with Federal (USDA) Standards.
Information Contacts Listed below are the commodity specialists in the Livestock Branch of the National Agricultural Statistics Service to contact for additional information. Dan Kerestes, Chief, Livestock Branch............................................................................................................(202) 720-3570 Scott Hollis, Head, Livestock Section ..............................................................................................................(202) 690-2424 Jim Collom – Dairy Products ............................................................................................................(202) 690-3236 Joe Gaynor – Dairy Products Prices ..................................................................................................(202) 690-2168 Jason Hardegree – Cattle, Cattle on Feed..........................................................................................(202) 720-3040 Sherry Bertramsen – Livestock Slaughter .........................................................................................(515) 284-4340 Mike Miller – Milk Production and Milk Cows................................................................................(202) 720-3278 Everett Olbert – Sheep and Goats .....................................................................................................(202) 720-4751 Nicholas Streff – Hogs and Pigs........................................................................................................(202) 720-3106

ACCESS TO REPORTS!!
For your convenience, there are several ways to obtain NASS reports, data products, and services:
INTERNET ACCESS All NASS reports are available free of charge on the worldwide Internet. For access, connect to the Internet and go to the NASS Home Page at: www.nass.usda.gov.
E-MAIL SUBSCRIPTION All NASS reports are available by subscription free of charge direct to your e-mail address. Starting with the NASS Home Page at www.nass.usda.gov, under the right navigation, Receive reports by Email, click on National or State. Follow the instructions on the screen.
- - - - - - - - - - - - - - - - - - - - - - - - - - - - - - - - -
PRINTED REPORTS OR DATA PRODUCTS
CALL OUR TOLL-FREE ORDER DESK: 800-999-6779 (U.S. and Canada) Other areas, please call 703-605-6220 FAX: 703-605-6900
(Visa, MasterCard, check, or money order acceptable for payment.)
- - - - - - - - - - - - - - - - - - - - - - - - - - - - - - - - - -
ASSISTANCE For assistance with general agricultural statistics or further information about NASS or its products or services, contact the Agricultural Statistics Hotline at 800-727-9540, 7:30 a.m. to 4:00 p.m. ET, or e-mail: [email protected].
The U.S. Department of Agriculture (USDA) prohibits discrimination in all its programs and activities on the basis of race, color, national origin, age, disability, and where applicable, sex, marital status, familial status, parental status, religion, sexual orientation, genetic information, political beliefs, reprisal, or because all or part of an individual’s income is derived from any public assistance program. (Not all prohibited bases apply to all programs.) Persons with disabilities who require alternative means for communication of program information (Braille, large print, audiotape, etc.) should contact USDA’s TARGET Center at (202) 720-2600 (voice and TDD). To file a complaint of discrimination, write to USDA, Director, Office of Civil Rights, 1400 Independence Avenue, S.W., Washington, D.C. 20250-9410, or call (800) 795-3272 (voice) or (202) 720-6382 (TDD). USDA is an equal opportunity provider and employer.