LITERACY, TRUST AND 401(K) SAVINGS...
33
1 LITERACY, TRUST AND 401(K) SAVINGS BEHAVIOR Julie R. Agnew, Lisa Szykman, Stephen P. Utkus, and Jean A. Young* CRR WP 2007-10 New version posted: April 2009 Released: May 2007 Draft Submitted: March 2007 Center for Retirement Research at Boston College Hovey House 140 Commonwealth Avenue Chestnut Hill, MA 02467 Tel: 617-552-1762 Fax: 617-552-0191 www.bc.edu/crr * Julie R. Agnew is an assistant professor of finance and economics at the College of William and Mary. Lisa Szykman is an associate professor of marketing at the College of William and Mary. Stephen P. Utkus is the Principal of the Vanguard Center for Retirement Research. Jean A. Young is a research analyst at the Vanguard Center for Retirement Research. The research reported herein was performed pursuant to a grant from the U.S. Social Security Administration (SSA) funded as part of the Retirement Research Consortium. The opinions and conclusions expressed are solely those of the authors and do not represent the opinions or policy of SSA, any agency of the Federal Government, Boston College, the College of William and Mary, or Vanguard. We would like to thank Olivia Mitchell for her comments. We would also like to thank Matthew Woodall for his excellent research assistance. © 2009, by Julie R. Agnew, Lisa Szykman, Stephen P. Utkus, and Jean A. Young. All rights reserved. Short sections of text, not to exceed two paragraphs, may be quoted without explicit permission provided that full credit, including © notice, is given to the source.
Transcript of LITERACY, TRUST AND 401(K) SAVINGS...

1
LITERACY, TRUST AND 401(K) SAVINGS BEHAVIOR
Julie R. Agnew, Lisa Szykman, Stephen P. Utkus, and Jean A. Young*
CRR WP 2007-10
New version posted: April 2009
Released: May 2007
Draft Submitted: March 2007
Center for Retirement Research at Boston College
Hovey House
140 Commonwealth Avenue
Chestnut Hill, MA 02467
Tel: 617-552-1762 Fax: 617-552-0191
www.bc.edu/crr
* Julie R. Agnew is an assistant professor of finance and economics at the College of
William and Mary. Lisa Szykman is an associate professor of marketing at the College
of William and Mary. Stephen P. Utkus is the Principal of the Vanguard Center for
Retirement Research. Jean A. Young is a research analyst at the Vanguard Center for
Retirement Research. The research reported herein was performed pursuant to a grant
from the U.S. Social Security Administration (SSA) funded as part of the Retirement
Research Consortium. The opinions and conclusions expressed are solely those of the
authors and do not represent the opinions or policy of SSA, any agency of the Federal
Government, Boston College, the College of William and Mary, or Vanguard. We would
like to thank Olivia Mitchell for her comments. We would also like to thank Matthew
Woodall for his excellent research assistance.
© 2009, by Julie R. Agnew, Lisa Szykman, Stephen P. Utkus, and Jean A. Young. All
rights reserved. Short sections of text, not to exceed two paragraphs, may be quoted
without explicit permission provided that full credit, including © notice, is given to the
source.

2
Abstract
Financial literacy and trust in financial institutions – two qualitative variables missing
from standard neoclassical or behavioral models of decision-making – are strongly
related to 401(k) saving behavior. In voluntary enrollment settings, financial literacy has
a larger marginal effect on saving than does a sizeable increase in income. In automatic
enrollment settings, low levels of literacy and trust are linked to the decision of
employees to quit their savings plan. While it cannot be disputed that automatic
enrollment is a very successful intervention, our results suggest that there still may be
opportunities to improve savings rates among employees with low literacy and trust
characteristics. These findings underscore the need for remedial education and plan
design strategies, as well as the importance of a broader specification for models of
savings behavior.

2
Literacy, Trust and 401(k) Savings Behavior
Julie R. Agnew, Lisa Szykman, Stephen P. Utkus, and Jean A. Young
I. Introduction
Over the past fifteen years, a substantial body of 401(k) savings research has
posited a number of reasons why employees participate (or fail to participate) in
voluntary 401(k) arrangements. These include neoclassical explanations, such as
employee budget constraints, the incentive effect of employer matching contributions,
and the desire by employees for tax-deferred savings, as well as behavioral explanations,
including procrastination, peer effects, and choice overload. Meanwhile, recent efforts to
understand household financial decision-making more broadly have focused on the
critical role played by financial literacy. In addition, in the context of banking and other
financial decisions, the role of trust has become a focus, particularly among low-income
households. Overall it would appear that financial decision-making is influenced by a
complex set of factors, yielding to both neoclassical and behavioral explanations.
Our current effort uses a very unique dataset that combines both survey and
administrative data and is the first attempt to extend the issues of financial literacy and
trust to the domain of 401(k) savings behavior. Moreover, our research takes place in the
context of a significant change occurring in the nature of 401(k) plan design, motivated
by behavioral findings regarding employee inertia and the importance of default and
framing effects on employee savings. Increasingly, employers offering 401(k) plans are
availing themselves of a plan design strategy known as automatic enrollment, under
which eligible workers have 401(k) contributions automatically deducted from their
paychecks, with the legal right to opt-out if they choose.1 This reframing of the savings
3
decision, from a positive to a negative election, improves plan participation rates
dramatically. At the same time, it is still the case that among certain demographic groups
within the population of eligible workers, as many as 20% choose to exercise their opt-
out rights and quit an automatic enrollment plan (Madrian and Shea, 2001; Nessmith,
Utkus and Young, 2007).
As a result, two types of non-savers have emerged today in the U.S. 401(k)
system: “non-joiners,” those who fail to join voluntary 401(k) arrangements; and
“quitters,” those who exercise their opt-out rights under an automatic enrollment regime.
This development raises an intriguing set of questions about the dynamics of 401(k)
savings behavior. Are quitters (of automatic enrollment plans) fundamentally different
from non-joiners (of voluntary plans)? Do neoclassical models help explain the
variations between the two types of non-savers—or are broader questions of financial
literacy or trust important as well? The goal of this paper is to paint a more complete
picture of the 401(k) savings decision in the context of both voluntary and automatic
enrollment plans. We rely on administrative and survey data drawn from three large
firms sponsoring 401(k) plans, two offering automatic enrollment plans and one offering
a voluntary enrollment plan. The survey data permit us to delve into the psychological
motivations behind employee savings decisions, which would not be possible with
administrative data alone. This unique combination is an important distinguishing feature
of this study.
We find that two measures not included in prior research – financial literacy and
trust in financial institutions –play a critical role in shaping employee savings behavior.
In voluntary enrollment 401(k) plans, the marginal effects of literacy are substantial, and

4
are arguably more powerful than a sizeable increase in income. Under automatic
enrollment, low levels of both literacy and trust are strongly linked to the decision by an
employee to quit their employer’s savings plan. While automatic enrollment, designed as
a remedial strategy to address behavioral biases such as procrastination, is an extremely
successful intervention that increases participation across demographic groups, our
results suggest that despite its overwhelming success, there still may be an opportunity to
improve savings among a vulnerable subgroup of employees with low literacy and low
trust characteristics.
These findings underscore the fact that even the highly successful reframing
strategies, such as automatic enrollment, can have limitations in the face of substantial
problems of illiteracy and mistrust. They highlight the importance of financial literacy
and trust-building efforts, principally through communications and education programs,
as a potential remedy. In addition, in light of research suggesting the importance of
learning in financial decision-making2, our results suggest the need for a more persistent
approach to automatic enrollment, such as the periodic re-enrollment of quitters, as they
gain over time general lifetime financial experience and specific knowledge of 401(k)
saving. Finally, given the recent economic events, low levels of trust in financial
institutions may lead more employees to decide to not participate in a 401(k) savings
plan. This paper is organized as follows. After a literature review in the next section, the
third section of the paper turns to our administrative data, and the fourth to our survey
instrument and measures of literacy and trust. The fifth section presents our econometric
analysis, and a final section concludes.

5
II. Literature Review
Most prior research on the 401(k) savings decision has been centered on
straightforward neoclassical lifecycle models, using either administrative or survey data,
and considering employee choices in a voluntary enrollment setting.3 Overall, the
research using administrative data suggests that three key demographic variables are
positively related to 401(k) participation – income, age and job tenure. Several theories
have been suggested to explain the positive income and plan participation relationship.
In particular, low-income households may participate less than higher income households
because they are more likely to be financially constrained (i.e., a simple positive elasticity
of saving with respect to income); they face lower (or negative) tax rates and derive little
(or no) tax benefit from 401(k) saving; or they need to save less because of the
progressive benefits structure of Social Security. In terms of age, a general lifecycle
model suggests age-related variation in savings. As well, as employees age, the
importance of savings may become more salient, making participation in a retirement
plan more likely. Job tenure is also strongly linked to 401(k) plan participation. One
reason may be that longer-tenured employees may find plan participation more attractive
due to the vesting of benefits over time; another may be growing familiarity over time
with the employer’s retirement plan.
Workplace financial education programs have been linked to improved 401(k)
savings outcomes (Bernheim and Garrett, 1996; Nyce, 2005), although financial literacy
levels per se have not been incorporated in 401(k) savings models. Outside the domain
of 401(k) plans, Moore (2003) finds that individuals with lower levels of financial
literacy are less likely to engage in positive financial behaviors (e.g., paying bills on time,

6
budgeting and tracking expenses, and saving/investing money out of every paycheck).
Moore (2003) also suggests that individuals with low financial literacy are naïve when it
comes to evaluating financial options. Lusardi and Mitchell (2006) demonstrate that
those with higher financial literacy are more likely to save and invest in more complex
assets, using data from older households in the Health and Retirement Study. Using
special modules from the Dutch National Bank Household Survey, van Rooij, Lusardi
and Alessi (2007) find that individuals with low literacy are significantly less likely to
invest in stocks. In the 401(k) domain, using an experimental approach, Agnew and
Szykman (2005) suggest that individuals with lower levels of financial literacy are more
likely to take a default plan investment option when making asset allocations than
individuals with higher levels of financial literacy.
Knowledge of a retirement plan’s specific features, as opposed to measures of
general financial literacy, may also be related to increased saving behavior. Choi,
Laibson and Madrian (2005) found that only 21% of 401(k) participants contributing
below their plan’s match threshold knew their plan’s match rate, compared to 41% of
those above the match threshold. Furthermore, Chan and Stevens (2006) find that
knowledgeable participants are five times more responsive to plan features than the
average individual.
Finally, a well-known stream of research supports the influence of behavioral
biases on 401(k) decisions and suggests that employees may not be behaving as standard
neoclassical decision agents.4 The automatic enrollment findings noted above indicate
that a simple reframing of the 401(k) savings decision from a positive to a negative
election can elicit substantially higher plan participation rates. Other researchers have
7
noted other behavioral biases, including procrastination in a variety of other retirement
plan decisions (Choi, Laibson, Madrian and Metrick, 2006), the fact that “choice
overload” (as measured by the number of plan investment options) may discourage plan
participation (Sethi-Iyengar, Huberman, and Jiang, 2004), and the effect of peer groups
on an individual’s own saving behavior (Duflo and Saez, 2003).
In this paper, we examine the role of trust, a behavioral factor that has not been
previously addressed in the context of retirement savings choices and may be either
rational or irrational. 5 A distrust of financial institutions has been shown to influence
general financial behavior, particularly among households in lower socio-economic
strata. Poorer individuals have a culture of distrust of financial institutions and
consciously avoid doing business with them (Bertrand, Mullainathan, and Shafir, 2006;
Szykman, Rahtz, Plater, and Goodwin 2005). In a related focus group conducted by
Szykman et al. (2005), respondents expressed feelings of alienation as well as an
underlying belief that banks cannot be trusted to do the right thing. The respondents also
stated that they avoided doing business with banks because of these perceptions. Finally,
Guiso, Sapienza and Zingales (2007) found that lack of trust can explain why some
people do not invest in the stock market.6 They find that countries with low stock
participation rates have low trust levels.
Broadly speaking the prior literature on 401(k) savings behavior advances three
distinct theories of individual decision-making:
Hypothesis 1: Neoclassical Agents. Under this theory, non-savers, regardless of
the type of retirement plan offered, are viewed as forward-looking, rational agents. Their
decision not to save in a 401(k) plan is rationally explained by income-related budget
8
constraints, their own preferences for tax-deferred saving, and by a recognition that
saving is unnecessary given the presence of Social Security benefits.
Hypothesis 2: Information Costs. In this model, non-savers may be impeded
by a lack of information on basic financial concepts and plan features, as well as by the
transaction costs needed to accumulate that information. They are rational agents
impeded by information or financial literacy constraints.
Hypothesis 3: Behavioral Biases. Under behavioral theories of 401(k) decision-
making, non-savers are impeded by psychological biases such as procrastination that may
interfere with a purely rational assessment of retirement savings choices. Trust, whether
rationally or irrationally based, is another factor that may influence behavior.
These theories are not necessarily mutually exclusive. For example, List (2004)
finds that prospect theory adequately explains the behavior of inexperienced consumers,
whereas those with intense market experience react more in line with neoclassical
predictions. It is thus possible that elements of 401(k) saving behavior are explained by
all three theories. Indeed, both the prior empirical evidence, as well as our new findings,
suggest that a complex set of factors—rational, information-constrained and behavioral—
are all linked to 401(k) savings.
III. Administrative and Survey Data
Our current study is based on administrative and survey data from three 401(k)
savings plans. Administrative data, including employee demographics and plan behavior,
were extracted from Vanguard recordkeeping systems under restricted access conditions
in mid-2006.7 The three plans drawn from Vanguard systems were chosen based on

9
similar plan features, including the availability of employer matching contributions and
the presence of similar-sized investment menus, in order to minimize the impact of plan-
specific design variation.8 What distinguishes the plans from one another is their use of
automatic versus voluntary enrollment. Plans A and B have an automatic enrollment
feature: eligible employees receive communication materials notifying them that they are
automatically enrolled after a given period following employment—90 days in the case
of Plan A, two months in the case of Plan B. Plan C is a voluntary enrollment plan;
eligible employees receive communication materials inviting them to join the plan upon
employment.
Table I summarizes important plan characteristics. Plan A and Plan B instituted
automatic enrollment in 2003 and 2001, respectively, for new-hires only. As a result, our
analysis is restricted to new hires in the three plans based on the “cut-off date” when
automatic enrollment was introduced in each plan. (For the voluntary plan, we set the
new hire cut-off date to equal Plan B.) Our sample size for the administrative data set,
from which our survey respondents are drawn, is 9,523.
Table I here
As expected based on prior studies, the automatic enrollment plans have higher
participation rates than the voluntary enrollment plan – 84% (Plan A) and 78% (Plan B)
versus 64% (Plan C).9 This difference is even more striking given the substantially lower
incomes of the participants in the automatic enrollment plans (mean salary of $37,994 for
Plan A and $34,383 for Plan B versus $69,803 for Plan C). We believe that these
descriptive statistics underscore the strong effect of automatic enrollment on savings
choices.
10
To obtain our literacy and trust measures, we administered a telephone survey to a
random subset of the new hires drawn from the administrative data set.10 Panel A of
Table II presents summary statistics for the 817 survey respondents. As in the overall
administrative data set, survey respondents from Plans A and B, the automatic enrollment
plans, have a lower mean salary than the voluntary enrollment plan, Plan C. Plan C
participants, besides having higher wages, also have higher levels of educational
attainment: the proportion of post-graduate education is more than double in Plan C than
in Plan A and B, and only 9% of Plan C respondents have just completed high school (or
less), versus 20% and 37% in the two automatic enrollment plans.
Table II here
In implementing the survey, our aim was to reach at least 250 respondents in four
categories: in a voluntary or automatic enrollment plan, and participating or not
participating. Given the small total number of automatic enrollment non-participants,
however, we were able to reach only 62 of such employees. Panel B of Table II presents
the number of respondents in each category.
IV. Literacy and Trust Measures
Our literacy measure is derived from an eight question quiz. Three questions
relate to very basic financial concepts: the idea of compounding, the risks of investing in
an equity mutual fund, and familiarity with common financial instruments. Five
questions are related to 401(k) plan features: whether the employer offers a plan; whether
the employee is participating (i.e., whether the participant accurately can recall whether
or not he or she is contributing to the plan); whether the employer offers a match; the
11
value of the match; and the presence or absence of a loan feature. The full questionnaire
and descriptive statistics are included in the Appendix. From the responses, we created a
binary measure of literacy based on a mean split (mean=5.6). Participants scoring a six,
seven or eight on the quiz are considered part of a “high literacy” group, those scoring
from zero to five are considered to be part of a “low literacy” group.
Our trust measure was based on the extent of respondents’ agreement or
disagreement with the following statement: “For the most part, financial institutions are
trustworthy.” Often trust measures in other studies are based on broad statements, such
as whether the respondents are trusting of other people. But such instruments have been
criticized as being too vague and perhaps unrelated to specific behaviors (Glaeser,
Laibson, Scheinkman, and Soutter 2000). Our approach (following Alesina and La
Ferrara, 2002) is to focus on trust in financial institutions.11 As with our financial
literacy indicator, we created a binary measure of trust. “Low trust” respondents are
those who disagree or strongly disagree with the idea of trusting financial institutions;
“high trust” are all others.12
Table III provides summary statistics for our literacy and trust measures. As
shown in Panel A, 58% of the survey respondents are in the high literacy group, and 86%
in the high trust group. High literacy is much more common among voluntary
enrollment participants than automatic enrollment participants (78% v. 57%).
Meanwhile, low levels of literacy are more common among quitters of automatic
enrollment plans than non-joiners of voluntary enrollment plans (73% versus 57%).
Interestingly, when comparing participants to non-participants, regardless of the plan
type, a majority of participants are in the high literacy category while a majority of the
12
non-participants are in the low literacy category. The trust measure is more closely
related to non-saving behavior under automatic enrollment. Twenty-six percent of those
who quit automatic enrollment were low trust individuals, versus 15% of employees who
failed to join a voluntary plan.13
Table III
Panel B of Table III analyzes financial literacy and trust measures by level of
educational attainment and salary. As might be expected, a high school education (or
less) appears somewhat related to low levels of literacy and trust. Low levels of literacy
and trust are also more common in the bottom half of the income distribution in our
sample. That said, our literacy and trust measures are not strictly a function of education
and income. Nearly one-third of respondents who have completed some graduate work
(beyond 4-year college) have low levels of literacy; and over one in 10 of respondents in
the top quartile of salary has low levels of trust in financial institutions.14
Table IV further decomposes our literacy and trust measures by education, salary
and saving behavior. Panel A reports the percent of survey respondents with low levels
of financial literacy; Panel B, the percent of respondents with low trust. Panel A
demonstrates a powerful relationship of low levels of financial literacy to saving
behavior. Among those with a high school (or less) education, 79% of quitters (non-
participants) in automatic enrollment plans have low levels of literacy, versus 40% of
those who voluntarily joined a savings plan. There are similar effects by salary.
Seventy-six percent of the bottom-quartile salary earners who quit their automatic 401(k)
plan had low literacy, versus only 20% of the bottom-quartile salary earners who joined
their voluntary 401(k) plan. These statistics also suggest that education, salary and

13
financial literacy are imperfectly related.15 The effects in Panel B for low trust are
somewhat different. Overwhelmingly the largest low-trust groups are, first, quitters (non-
participants) of automatic enrollment plans, generally across all education levels and
most salary levels; and second, non-joiners (non-participants) of voluntary enrollment
plans with a high school education or less.
Table IV here
V. Econometric Analysis
The descriptive statistics in the previous section suggest that both literacy and
trust may play a role in 401(k) savings decisions. In this section, we assess the
relationship between the employee plan participation decision using several probit
regressions relating an employee’s plan participation decision to a variety of
demographic measures and our trust and literacy indicators. Specifically our models are
of the following form:
iiiii LOWTRUSTLOWLITEETPARTICIPAN εββββ ++++= 3210 (1)
In Equation (1), the dependent variable PARTICIPANT equals 1 if the ith eligible
employee is participating in the plan, otherwise 0; EEi is a vector of demographic
variables for the ith eligible employee in our survey, which includes age, salary, marital
status, number of dependents, job tenure and race/ethnicity; and LOWLIT and
LOWTRUST are dummy variables indicating whether the participant fell into the low
literacy and low trust categories, respectively. We pool respondents from Plans A and B
into a single regression for automatic enrollment; the respondents from Plan C are in a
separate regression for voluntary enrollment. We do not pool all the plans together

14
because the binary choice to participate is fundamentally different (either opt in or opt
out) depending on the enrollment method.
In Table V, the first set of results is for a standard specification of 401(k) plan
participation based on prior studies. The coefficients and their standard errors are shown.
Not surprisingly, in the standard specification for voluntary enrollment, we find based on
the marginal effects (not reported in the table) we calculated that a salary increase, job
tenure increase and marriage raise the probability of participation in a voluntary plan,
while lower levels of education and additional dependent children reduce the probability
of participation.16 Meanwhile, in the standard specification model under automatic
enrollment, none of these demographic variables has a positive relationship to plan
participation. This result is consistent with the finding from prior research that automatic
enrollment tends to equalize savings behavior across various demographic groups.
Table V here
Two additional specifications add literacy and trust as separate explanatory
variables. In the standard specification with our literacy measure under voluntary
enrollment, several demographic variables – high school education, job tenure, marriage
and number of dependents – remain significant. The new literacy variable is
economically meaningful and significant, and the calculated marginal effect indicates that
an employee with low literacy is 29% less likely to participate—a very sizeable effect.
Meanwhile, under the same specification with automatic enrollment, the demographic
effects remain insignificant and only our literacy indicator remains meaningful, with a
low literacy employee 15% less likely to remain in the plan. Under both voluntary and

15
automatic enrollment models, the addition of the new literacy variable improves the
regressions pseudo-R2s over the standard specification without those variables.
The addition of the trust variable to the standard specification produces somewhat
different results. In our analysis, trust is not important to savings decisions under
voluntary enrollment but is very important under automatic enrollment. Someone with
low trust is 20% less likely to remain in an automatic enrollment plan. These results are
consistent with a theory that procrastination as an explanatory factor may be
overshadowing the influence of trust in voluntary enrollment settings. However, once the
procrastination effect is largely offset with the introduction of automatic enrollment, trust
surfaces as an important explanatory variable of the remaining variation in savings
behavior. This explanation needs to be tested with more data from additional plans.
However, it is a noteworthy result because it does show that trust can be an important
factor in savings and investment decisions related to retirement.
Our final empirical specification includes both trust and literacy measures.
Interestingly, the marginal effects of the two measures are relatively stable across
specifications. Please refer to Figure I for a graphical depiction of selected marginal
effects calculated from the final specification. Literacy is important in both types of
enrollment. Low literacy individuals are 30% less likely to participate under voluntary
enrollment and 13% less likely to participate under automatic enrollment. The effect of
literacy in a voluntary plan is quite substantial compared to income. For example, an
increase of $10,000 in income would only raise the probability of participation by 2% in
a voluntary enrollment setting and this effect is only significant at the 10% level. In
automatic enrollment, trust again comes to the forefront in explaining quitting behavior,
16
as trust levels decrease, the probability of participation decreases by 15%. Interestingly,
these marginal effects are relative to an individual with high literacy and high trust. If we
recalculate the marginal effect for the same person but give them low literacy
characteristics, the influence of low trust levels increases. For this individual, as trust
levels decrease, the probability of participation decreases by 23%. Finally, education,
which is distinct from financial literacy, is a separate and significant explanatory variable
under voluntary enrollment. But consistent with the notion that automatic enrollment
reduces significant demographic variation in savings behavior, education does not appear
to be significant in the automatic enrollment specification.
Our findings suggest a multi-faceted model of employee saving in 401(k) plans,
consistent with models of neo-classical decision agents, information costs, and behavioral
biases. Our final specification confirms both a neoclassical model for voluntary
enrollment, linking saving behavior of various demographic variables such as salary, as
well as a behavioral model, in which automatic enrollment eliminates much of these
demographic variations. Beyond these explanations, however, our results underscore the
importance of qualitative measures such as literacy and trust in explaining retirement
savings behavior. The importance of literacy as an explanatory variable is consistent
with a model of decision agents constrained by access to appropriate financial
information. The significance of trust confirms a new dimension of decision-making in
401(k) savings choices that may or may not be rational, namely, a lack of trust in
financial institutions, particularly but not exclusively among employees with lower wages
and lower levels of educational attainment.

17
VI. Conclusions
Prior research on 401(k) savings behavior has focused on the importance of
neoclassical models in explaining variation in saving behavior, or on behavioral biases
such as procrastination as impediments to rational decision-making. Automatic
enrollment in particular has emerged as a response by employers and policymakers to
findings of employee procrastination in retirement savings. The strategy is being adopted
by employers, with active encouragement in the Pension Protection Act of 2006, in an
effort to improve savings behavior through default, or reframing effects. This paper
highlights the importance of two other factors—financial literacy and trust—in 401(k)
savings decisions, and assesses their impact depending on whether the decision is framed
as a positive (voluntary) or negative (automatic enrollment) one.
In particular, in voluntary savings arrangements, both demographic characteristics
and financial literacy play a role in explaining variations in the decision whether to
participate in a 401(k) plan. The literacy effects are quite substantial. Low literacy
individuals are 30% less likely to participate in their 401(k) plan; by comparison, an
increase in income of $10,000 would lead to only a 2% increase in the probability of
participation and this effect is not even statistically significant. In automatic enrollment
arrangements, which tend to minimize demographic variations in savings behavior, what
stands out is the role of trust in financial institutions along with financial literacy in
influencing whether employees will choose to quit such plans. In such plans, the
marginal effect of low trust is a 15% reduction in plan participation; for low literacy, it is
13%. Our results support both a rational information costs model of decision-making—
some employees are impeded in their decision-making simply by a lack of adequate

18
financial information-- and a behavioral bias theory—some employees are influenced
substantially by framing. Furthermore, our trust finding demonstrates that some
employees may be influenced by the psychological level of trust they have in financial
institutions. This finding is new to 401(k) research, and may also more broadly influence
retirement and other savings behavior.
More broadly, our findings extend the richness of our understanding of the
complex factors underlying savings choices. The earliest empirical models of 401(k)
saving, focusing exclusively on voluntary savings choices, relied on a neoclassical
lifecycle framework, and incorporated such demographic factors such as age and income
as important explanatory variables. In subsequent studies of automatic enrollment, this
approach was extended to include behavioral biases such as procrastination. Our findings
suggest an even more nuanced model. First, models of voluntary savings choice ought to
incorporate financial literacy as a separate, and powerful, explanatory variable. And
second, even with the introduction of automatic enrollment, which eliminates much
demographic variation in savings choices, both low literacy and low trust in financial
institutions stand out as critical explanations of non-saving behavior.
On a practical and policy level, our findings underscore the importance of
remedial education programs and plan design strategies that focus on raising literacy and
trust levels among targeted groups of employees. These efforts seem particularly
important in the case of plans adopting automatic enrollment. As automatic enrollment
becomes more widespread, plan sponsors and policymakers may come to view
enrollment communications and 401(k) literacy programs generally as superfluous, and
quitters as purely rational agents making calculated choices about their future. An

19
alternative view arising from our study is that plan enrollment communications by
employers – and retirement education generally by community groups and the
government – becomes even more essential in raising financial literacy levels, and
reducing quit rates under automatic enrollment.
Our findings also highlight the need for strategies to bolster trust in financial
institutions. These include employers and community groups adopting social marketing
approaches, such as electing a plan or retirement savings advocate, introducing a trusted
peer program or offering seminars designed to increase understanding and trust of
financial institutions. Finally, another possible remedial strategy is to consider changing
plan design—in particular, periodically re-enrolling those who quit automatic enrollment
arrangements—under the assumptions that financial literacy and trust levels may change
over time with learning, and that such employees, if re-enrolled, may choose not to quit
the second or third time around.
In summary, what emerges from our findings, and the now extensive body ofprior
research, is a complex and nuanced model of 401(k) retirement saving. It is no longer
sufficient to explain savings behavior in terms of purely neoclassical lifecycle models.
Literacy effects appear to be pervasive. Also, even a behaviorally-motivated reframing
of savings choices under automatic enrollment while extremely effective still leaves some
room for improvement among a vulnerable subset of employees, those exhibiting low
literacy and mistrust of financial institutions. Our findings suggest several possible
avenues for future research, including the ways in which employers, community groups
and governments can effectively improve understanding of basic retirement savings
concepts. Additionally, if trust levels in financial institutions drop due to the recent

20
economic events, the long-term repercussions may be far-reaching and long lasting.
Therefore, research focusing on how overall trust impacts all financial decisions,
including retirement decision-making, is now even more important and necessary.
Endnotes
1 Automatic enrollment was first authorized by the US Internal Revenue Service in 1997. The Pension Protection Act of 2006 also included several provisions to encourage its wider adoption. 2 See Agarwal, Discroll, Gabaix and Laibson (2008) for an illustration of learning and financial decision-making. 3 See Munnell, Sunden and Taylor (2001/2002) and Mitchell, Utkus and Yang (2007) for a review of past literature. 4See Benartzi and Thaler (2007) for a comprehensive overview. 5 Not all distrust of financial institutions among the poor is irrational. Business Week (Grow, Epstein, Elgin, Der Hovanesian 2007) devoted a cover story to how U.S. companies are actively seeking profits from the poor and not always using fair business practices. The recent subprime lending crisis in the U.S. demonstrates that in many instances poorer individuals may have been misled by financial institutions. Furthermore, Guiso, Sapienza and Zingales’ (2008) present a theoretical model of trust that relies on prior beliefs which they argue cannot be irrational. They assert that only beliefs after exposure to information can be irrational, and if the information presented is not trusted, then it cannot be used be used to form beliefs. For some additional background on trust and a survey of the psychology literature as it related to finance please refer to Olsen (2008). 6 Researchers have also shown that trust can have a positive effect on a company’s financial performance and on the macroeconomy. La Porta, Lopez-de-Silanes, Shliefer and Vishny (1997) in particular found that large organizations perform better and have a larger share of the economy when trust levels are higher. Similarly, Knack and Keefer (1997) found that the economy of countries where trust levels are higher grows faster than countries that have lower overall levels of trust. 7 Administrative data for Plans A and B were collected in June 2006; for Plan C, in May 2006. Data included: age, income, sex and race/ethnicity; contributions for the year; investment holdings and balances; and related plan features. Vanguard (2006) provides descriptive statistics of the overall Vanguard data base from which the three plans were drawn. 8 All three plans offer the same employer matching contributions; the ability of employees to make “catch-up” contributions (after age 50); and the standard immediate vesting of employee contributions. The matching formula and vesting schedule for employer contributions vary somewhat by plan. In terms of investment options, all three plans offer individual fund options ranging from 11 funds to 14 funds. In addition to individual fund choices, Plans B and C also offer pre-mixed life cycle portfolios. 9 An employee is considered an active participant if they were making positive employee contributions to the plan at the time the administrative data was extracted. 10 Our sample includes the overwhelming majority of the employees eligible to participate in each plan who were hired after their respective cut-off dates. It excludes employees who had participated in the past year in market research for Vanguard or who previously asked not to be contacted. Although not reported here, the demographic statistics for the entire population of employees are very similar to our sample data. These results are available upon request. The marketing research firm Greenwald Associates conducted the survey. 11 Alesina and La Ferrara (2002) show that while an average of 40% of survey respondents report that they trust other people, the percentage drops dramatically when they are asked about their confidence in certain institutions. Specifically, an average of only 27% of people report having confidence in financial institutions. See also Guiso, Sapienza and Zingales (2008).

21
12 All non-respondents to this question were conservatively classified as high trust individuals. As a robustness check, we also excluded this group from the later regression analysis and did not find a qualitatively different result. 13 Care must be taken when interpreting these statistics because the sample size of the non-participant, automatically enrolled employees is small compared to other groups. 14 Guiso, Sapienza and Zingales (2008) note that one of the advantages of using trust to predict general stock market participation in their study is that it can explain lack of participation by wealthy individuals. They show a strong positive correlation between the level trust in a country and the level of participation among the top 5% of the wealth distribution in the same 12 countries. 15Using survey data representative of the Dutch population , van Rooij, Lusardi and Alessie (2007) also find that schooling may not be the best proxy for financial literacy. 16 The marginal effects are relative to a white, married male with a high school education. The salary ($56,656), age (40), job tenure (2.25) and dependents (1) are based on the means for the entire sample.

22
Appendix A. Financial Literacy Questionnaire Table
Table A.1.
Percentages may not sum to 100 percent due to rounding.

23
References Agarwal, Sumit, John C. Driscoll, Xavier Gabaix, and David I. Laibson , "The Age of
Reason: Financial Decisions Over the Lifecycle," SSRN Working Paper, (2/11/2008). Available at SSRN: http://ssrn.com/abstract=973790.
Agnew, Julie R. and Lisa R. Szykman., “Asset Allocation and Information Overload:
The Influence of Information Displays,” Journal of Behavioral Finance, 6(2), (2005),pp. 57-70.
Alesina, Alberto and Eliana La Ferrara “Who Trusts Others?” Journal of Public
Economics, 85, (2002),pp. 207-234. Benartzi, Shlomo and Richard H. Thaler. “Heuristics and Biases in Retirement Savings
Behavior,” Journal of Economic Perspectives, 21, 3, (2007), pp. 81-104. Bernheim, B. Douglas and Daniel M. Garrett. “The Determinants and Consequences of
Financial Education in the Workplace: Evidence from a Survey of Households,” NBER Working Paper 5667.
Bertrand, Marianne, Sendhil Mullainathan, and Eldar Shafir. “Behavioral Economics and
Marketing in Aid of Decision Making Among the Poor,” Journal of Public Policy and Marketing, 25, 1, (2006), pp. 8-23.
Chan, Sewin and Ann Huff Stevens. “What You Don’t Know Can’t Help You: Pension
Knowledge and Retirement Decision Making,” Working Paper, New York University, 2006.
Choi, James J, David Laibson and Brigitte C. Madrian. “$100 Bills on the Sidewalk:
Suboptimal Saving in 401(k) Plans,” Harvard Working Paper, 2005. Choi, James J., David Laibson, Brigitte C. Madrian and Andrew Metrick. "Saving for
Retirement on the Path of Least Resistance." In Behavioral Public Finance: Toward a New Agenda, Ed McCaffrey and Joel Slemrod, eds. New York: Russell Sage Foundation, (2006), pp. 304-351.
Duflo, Esther and Emmanuel Saez, “The Role of Information and Social Interactions in
Retirement Plan Decisions: Evidence from a Randomized Experiment” Quarterly Journal of Economics 118, 3, (2003), 815-842.
Glaeser, Edward L., David I. Laibson, Jose A. Scheinkman and Christine L. Soutter.
“Measuring Trust,” The Quarterly Journal of Economics, 115, 3, (2000), pp. 811-846.
Grow, Brian, Keith Epstein, Ben Elgin and Mara Der Hovanesian. “The Poverty
Business; Inside U.S. Companies’ Audacious Drive to Extract More Profits from the Nation’s Working Poor,” BusinessWeek, (21 May 2007).

24
Guiso, Luigi, Paola Sapienza, and Luigi Zingales. “Trusting the Stock Market,” The
Journal of Finance, LXIII, 6, (2008), 2557-2600.
Hilgert, Marianne A., Jeanne M. Hogarth and Sondra G. Beverly. "Household Financial Management: The Connection between Knowledge and Behavior," Federal Reserve Bulletin, (July 2003), Available at: http://www.federalreserve.gov/pubs/bulletin/2003/0703lead.pdf
John Hancock Financial Services. "Insight Into Participant investment, Knowledge and Behavior," Eighth Defined Contribution Survey, (2002).
2004 Jump$tart Survey of Personal Financial Literacy Among High School Students. Coalition website: http://www.jumpstart.org/index.cfm.
Knack, Stephen and Philip Keefer. “Does Social Capital Have an Economic Payoff? A Cross-Country Investigation,” The Quarterly Journal of Economics, 112, 4, (1997), pp. 1251-1288.
LaPorta, Rafael, Florencio Lopez-de-Silanes, Andrei Shliefer, and Robert W. Vishny.
“Trust in Large Organizations,” The American Economic Review. 87, 2, (1997), pp. 333-338.
List, John A. “Neoclassical Theory Versus Prospect Theory: Evidence from the
Marketplace,” Econometrica, 72, 2, (2004), pp. 615-625. Lusardi, Annamaria and Olivia S. Mitchell. “Financial Literacy and Planning:
Implications for Retirement Wellbeing,” Working Paper, Dartmouth College, 2006. Madrian, Brigitte C. and Dennis F. Shea. “The Power of Suggestion: Inertia in 401(k)
Participation and Savings Behavior,” Quarterly Journal of Economics 116, , (2001), pp. 1149-1525.
Mitchell, Olivia S., Stephen P. Utkus and Tongxuan (Stella) Yang. “Turning Workers
into Savers? Incentives, Liquidity and Choice in 401(k) Plan Design,” National Tax Journal, LX, 3, (2007), pp. 469-489.
Moore, Danna. Survey of Financial Literacy in Washington State: Knowledge, Behavior,
Attitudes, and Experiences. Social and Economic Sciences Research Center Technical Report 03-39, 2003.
Munnell, Alicia H., Annika Sunden, and Catherine Taylor. “What Determines 401(k)
Participation and Contributions?” Social Security Bulletin, 64 (3): 64-76.

25
Nessmith, William E., Stephen P. Utkus and Jean A. Young, (2007), “Measuring the Effectiveness of Automatic Enrollment,” Vanguard Center for Retirement Research, (2001/2002), www.vanguard.com/retirementresearch.
Nyce, Steven A. “The Importance of Financial Communications for Participation Rates
and Contribution Levels in 401(k) Plans,” Wharton Pension Research Council Working Paper 2005-03. Wharton School, University of Pennsylvania, 2005. www.pensionresearchcouncil.org.
Olsen, Robert A. “Trust as Risk and the Foundation of Investment Value,” Journal of
Socio-Economics, 37, (2008), 2189-2200. Sethi-Iyengar, Sheena, Gur Huberman and Wei Jiang. “How Much Choice is Too Much?
Contributions to 401(k) Retirement Plans,” In Pension Design and Structure: New Lessons From Behavioral Finance, Edited by Olivia S. Mitchell and Stephen P. Utkus, Oxford University Press, Oxford, United Kingdom, (2004), pp.83-95.
Szykman, L., Rahtz, D. R., Plater, M and Goodwin, G., “Living on the Edge: Financial
Services for the Lower Socio-Economic Strata.” Working Paper, The College of William and Mary, (2005).
van Rooij, Maarten, Annamaria Lusardi and Rob Alessie. “ Financial Literacy and Stock
Market Participation.” Working Paper 2007-162, Michigan Retirement Research Center, 2007.
Vanguard . How America Saves 2006: A Report on Vanguard 2005 Defined Contribution
Plan Data, (2007), www.vanguard.com/retirementresearch.

26
Table I: Plan and Employee Characteristics This table reports general statistics for the all the plan participants, including survey respondents and non-respondents. In addition, it includes the type of enrollment each plan uses and the cutoff date for the data collection.

27
Table II: Survey Respondents Characteristics Panel A reports important demographic statistics for each plan and all the plans combined (“Total” column on the far right) for respondents only. Panel B breaksdown the number of respondents for each participant status/plan type category.
Panel A: Demographic Characteristics
Plan Plan A Plan B Plan C Total
Type of Enrollment Automatic Automatic Voluntary AllSurvey Sample Size (N) 116 199 502 817% of Eligible New Hires 9% 9% 8% 9%Mean Age 41 40 40 40Mean Salary $35,784 $44,019 $66,463 $56,656Mean Tenure (years as of 6/30/2006) 1.52 3.00 2.12 2.25
Sex Female 22% 26% 31% 29% Male 78% 74% 69% 71% Missing 0% 0% 0% 0%
Ethnic Group White 85% 80% 78% 79% Black/African-American 6% 9% 4% 6% Hispanic 6% 5% 4% 4% Other / missing 3% 7% 14% 10%
Married No 25% 34% 38% 35% Yes 75% 66% 62% 65%
Dependents Zero 35% 41% 45% 42% One 22% 19% 19% 19% Two 19% 23% 25% 23% Three 16% 12% 9% 10% More than Three 6% 6% 3% 5% Missing 1% 0% 0% 0%
Education High School 20% 37% 9% 18% Some College 38% 28% 23% 26% College 31% 25% 40% 35% Post Graduate Work or Degree 11% 10% 27% 21% Refused 0% 1% 0% 0%
Panel B. Number of Employees by Participation Status and Plan Type

28
Table III: Financial Literacy and Trust Measures by Participation Status, Plan Type, Education and Salary
These tables breakdown the percentage of the sample in literacy and trust categories by plan type, participation status, education and salary. Individuals with low literacy answered 5 or less questions correct on the literacy test. Individuals with low trust either strongly disagreed or disagreed to the statement “For the most part, financial institutions are trustworthy.” Sample sizes of each category are reported in the far right column.
Panel A: Financial Literacy and Trust by Participation Status and Plan Type
Panel B: Financial Literacy and Trust by Education and Salary
Percentages may not sum to 100 percent due to rounding.

29
Table IV: Low Literacy and Low Trust by Various Measures
These tables further refine Table III panel A and Table III B by breaking down each participation/plan type category by either education and or salary. The cells report the percentage of each subcategory that are either low literacy (Panel A) or low trust (Panel B). Individuals with low literacy answered 5 or less questions correct on the literacy test. Individuals with low trust either strongly disagreed or disagreed to the statement “For the most part, financial institutions are trustworthy.” Sample sizes of each cell are reported below.
Panel A: Respondents with Low Level of Financial Literacy
Panel B: Respondents with Low Level of Trust
Sample Sizes: Number of employees represented in each Participation/Plan Type category by Education: Automatic, Non-Participants [High School: N=24, Some College: N=25, College: N=11, Graduate Work: N=2], Voluntary, Non-Participants [High School: N=36, Some College: N=65, College: N=79, Graduate Work: N=46] Automatic, Participants [High School: N=73, Some College: N=75, College: N=74, Graduate Work: N=30] Voluntary, Participants [High School: N=10, Some College: N=49, College: N=124, Graduate Work: N=91] Number of employees represented in each Participation/Plan Type category by Salary Quartile: Automatic, Non-Participants [1st Quartile: N=37, 2nd Quartile: N=18, 3rd Quartile: N=5, 4th Quartile: N=1 ] Voluntary, Non-Participants [1st Quartile: N=49, 2nd Quartile: N=49, 3rd Quartile: N=68, 4th Quartile: N=61]Automatic, Participants [1st Quartile: N=108, 2nd Quartile: N=94, 3rd Quartile: N=28, 4th Quartile: N=23] Voluntary, Participants [1st Quartile: N=10, 2nd Quartile: N=43, 3rd Quartile: N=103, 4th Quartile: N=119] Percentages may not sum to 100 percent due to rounding.

30
Table V: Probit Regressions for Survey Sample This table reports the coefficients from a probit regression. The dependent variable is a binary variable that equals one if the employee participated in his 401(k) plan or equals zero if he did not. Ln(Salary) is the natural log of salary measured in dollars. High School, Some College, College are dummy variables for education (omitted category is graduate work). Age is measured in years. Male is a dummy variable that equals one if the employee is male. Married is a dummy variable the equals one if the respondent is married. Number of Dependents is equal to the number of children or elderly living in the household not including the spouse and Job Tenure is the years employed. Low literacy is a dummy variable that equals one if the employee answered 5 or less questions correct on the literacy test. Low trust is equal to 1 if the employee strongly disagrees or disagrees to the statement “For the most part, financial institutions are trustworthy.” Race is controlled for with dummy variables. The results are not significant and not reported for space reasons. Robust standard errors are reported in parentheses. ** ,* indicate a significance of 1% and 5%, respectively.
Dependent Variables Coefficient Coefficient Coefficient Coefficient Coefficient Coefficient Coefficient CoefficientConstant -5.555 ** -1.516 -3.491 -0.246 -5.554 ** -1.075 -3.489 0.122
(2.000) (1.960) (2.046) (1.985) (2.002) (2.012) (2.047) (2.015)Ln(Salary) 0.471 ** 0.240 0.334 0.142 0.472 ** 0.187 0.335 0.094
(0.183) (0.182) (0.185) (0.184) (0.183) (0.187) (0.185) (0.187)High School1 -0.723 * -0.671 -0.653 * -0.449 -0.709 * -0.736 -0.644 * -0.528
(0.293) (0.432) (0.305) (0.439) (0.295) (0.416) (0.308) (0.423)Some College1 -0.238 -0.733 -0.272 -0.587 -0.236 -0.815 * -0.269 -0.679
(0.188) (0.417) (0.197) (0.420) (0.189) (0.401) (0.197) (0.403)College1 0.098 -0.244 0.057 -0.121 0.099 -0.256 0.058 -0.137
(0.156) (0.425) (0.164) (0.434) (0.156) (0.416) (0.164) (0.426)Age 0.003 0.011 -0.001 0.010 0.003 0.016 -0.002 0.015
(0.007) (0.008) (0.007) (0.008) (0.007) (0.008) (0.007) (0.009)Married1 0.404 ** -0.075 0.344 * -0.122 0.404 ** 0.014 0.344 * -0.037
(0.142) (0.209) (0.150) (0.219) (0.143) (0.214) (0.151) (0.224)Male -0.114 0.339 -0.156 0.303 -0.113 0.380 * -0.157 0.352
(0.136) (0.193) (0.142) (0.199) (0.136) (0.193) (0.143) (0.199)Dependents -0.149 ** -0.067 -0.140 * -0.049 -0.148 ** -0.067 -0.138 * -0.049
(0.054) (0.071) (0.056) (0.073) (0.054) (0.070) (0.056) (0.072)Job Tenure 0.220 ** -0.044 0.207 ** -0.040 0.219 ** -0.053 0.206 ** -0.049
(0.041) (0.065) (0.041) (0.066) (0.041) (0.067) (0.041) (0.069)Low Literacy1 -0.834 ** -0.619 ** -0.834 ** -0.591 **
(0.136) (0.193) (0.136) (0.198)Low Trust1,3 -0.091 -0.678 ** -0.082 -0.642 **
(0.188) (0.227) (0.197) (0.227)Race Controls Yes
Pseudo R-Squared 0.128N 296
Standard Specification Standard Specification Plus
LiteracyStandard Specification Plus
Mistrust
0.139 0.068
Standard Specification Plus Literacy and Mistrust
Automatic Enrollment2
Voluntary Enrollment
Automatic Enrollment2
Voluntary Enrollment
Automatic Enrollment2
Yes
Voluntary Enrollment
Automatic Enrollment2
Yes YesYes Yes Yes
Voluntary Enrollment
0.197 0.105 0.139 0.095
Yes
0.197495 296 495495 296 495 296
1 These variables are dummy variables. 2 In the automatic enrollment plan, eight individuals in the "other" race category perfectly predicted participation and were dropped. Regressions including them as part of the omitted race variable did not qualitatively change the results. 3 20 individuals who did not answer the trust question were coded as low trust equals zero. Excluding these 20 from the analysis did not qualitatively change the results.

31
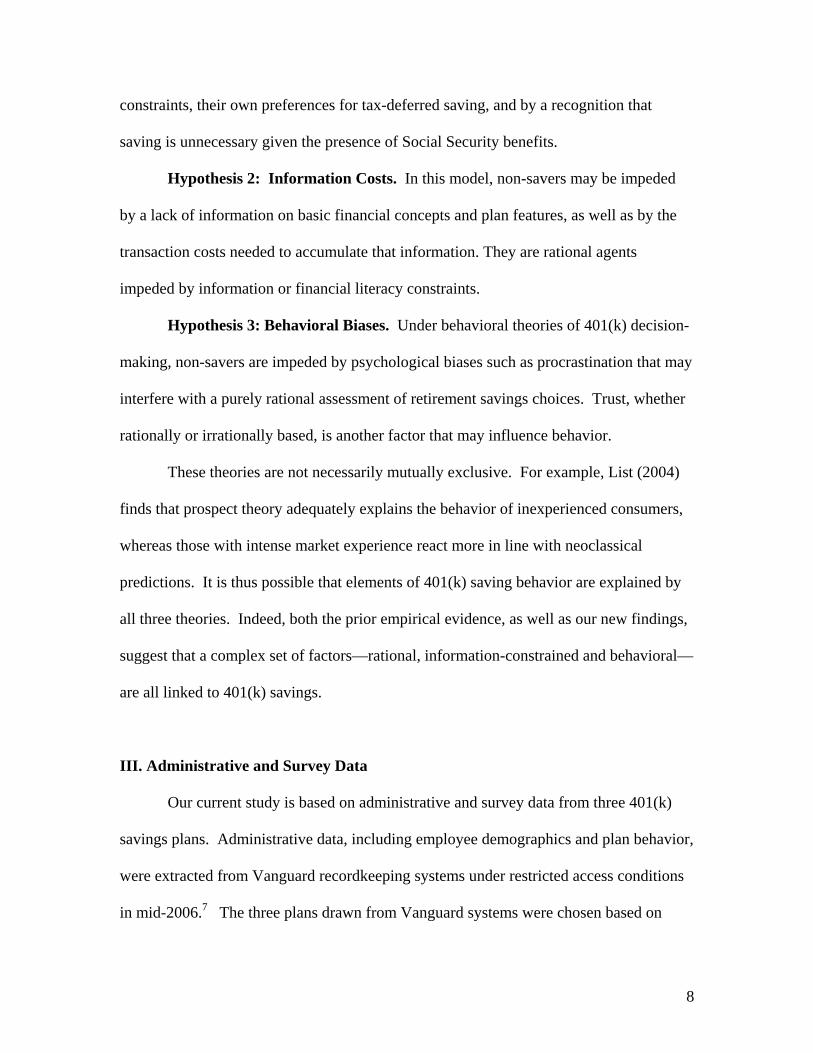
Figure I: Selected Marginal Effects from Standard Specification Plus Literacy and Trust Probit Regression by Plan Type
These figures report selected marginal effects from the full probit regression, “Standard Specification Plus Literacy and Trust.” The results are calculated at the mean for the continuous variables for the entire sample for all plans combined. The means of the continuous variables are 40 years of age, salary of $56,656, job tenure of 2.25 years and 1 dependent. The individual is male and married with a high school education (or less). The individual is in the high literacy and high trust categories. The marginal effects reported for the salary variable show the change in probability for a $10,000 increase in salary from the mean. The marginal effect of college represents the change in probability for an individual given a change in education from high school to college level.The marginal effects for dummy variables low literacy and low trust are the change in probability given a change from zero to one of the dummy variable.Bold bars indicate that the underlying coefficients of the marginal effects are significant at least at the 5% level.** and * indicate significance of 1% and 5%, respectively. The open bars indicate insignificant coefficients.
Panel A. Under Automatic Enrollment
‐15%
‐13%
5%
0%
‐30% ‐25% ‐20% ‐15% ‐10% ‐5% 0% 5% 10% 15% 20% 25% 30%
Low Trust
Low Literacy
College
Salary
*
*
Panel B. Under Voluntary Enrollment
‐3%
‐30%
26%
2%
‐30% ‐25% ‐20% ‐15% ‐10% ‐5% 0% 5% 10% 15% 20% 25% 30%
Low Trust
Low Literacy
College
Salary
*
**

RECENT WORKING PAPERS FROM THE CENTER FOR RETIREMENT RESEARCH AT BOSTON COLLEGE
The Recent Evolution of Pension Funds in the Netherlands: the Trend to Hybrid DB-DC Plans and Beyond Eduard H.M. Ponds and Bart van Riel, May 2007 Demographic Influences on Saving-Investment Balances in Developing and Developed Economies Ralph C. Bryant, May 2007 Social Security Spouse and Survivor Benefits for the Modern Family Melissa M. Favreault and C. Eugene Steuerle, February 2007 How Economic Security Changes During Retirement Barbara Butrica, February 2007 International Investment for Retirement Savers: Historical Evidence on Risk and Returns Gary Burtless, February 2007 Job Changes at Older Ages: Effects on Wages, Benefits, and other Job Attributes Richard W. Johnson and Janette Kawachi, February 2007 Cross-National Comparison of Income and Wealth Status in Retirement: First Results from the Luxembourg Wealth Study (LWS) Eva Sierminska, Andrea Brandolini and Timothy M. Smeeding, February 2007 Saving and Demographic Change: The Global Dimension Barry Bosworth and Gabriel Chodorow-Reich, February 2007 The Repeal of the Retirement Earnings Test and the Labor Supply of Older Men Gary V. Engelhardt and Anil Kumar, February 2007 Persistence in Labor Supply and the Response to the Social Security Earnings Test Leora Friedberg and Anthony Webb, December 2006 Annuitized Wealth and Consumption at Older Ages Barbara A. Butrica and Gordon B.T. Mermin, December 2006
All working papers are available on the Center for Retirement Research website (http://www.bc.edu/crr) and can be requested by e-mail ([email protected]) or phone (617-552-1762).