Listening to Dam - Final
12
LISTENING TO THE DAM- INSTRUMENTATION AND MONITORING PROGRAM SALUDA DAM REMEDIATION Elena Sossenkina, Monitoring Coordinator Matt Glunt, E.I.T. Field Engineer Joseph A. Mann, E.I.T. Field Engineer Scott G. Newhouse, P.E. Senior Engineer, Paul C. Rizzo Associates, Monroeville, PA Nature of the Dam Saluda Dam is owned and operated by South Carolina Electric and Gas Company (SCE&G). The Dam is located 8 miles upstream of the City of Columbia, South Carolina. Lake Murray, impounded by the Dam, has a storage capacity of more than 2,100,000 ac-ft of water. Lake Murray supplies water to a hydroelectric power plant (Saluda Hydro) and a coal- fired plant (McMeekin Station), provides drinking water for Columbia and adjacent towns, and offers many recreational opportunities for the community. The Saluda Dam is a 200 ft high and 7,800 ft long earth Dam built in 1930. An on-site borrow source of silty and clayey sand was used for construction. The Dam was built by hauling fill to the embankment in rail cars then side dumped into piles on the upstream and downstream portions of the embankment (the two outer shells). The piles were watered by monitors, sluicing the fine material into a central sedimentation pool, where it settled to form a core for the Dam. This method of placement has little control over the quality and consistency of the final product. The trestles and railroad tracks were left in place and buried in the Dam, further increasing its heterogeneity. The geotechnical investigations indicate that density of the fill varies from very loose to medium dense. The Dam is founded on residual soil with no provisions for seepage cut-off. Originally the Dam included no internal drainage and the phreatic surface exited high on the downstream slope. A few years after the first filling, drains and tunnels were dug into the Dam. The tunnels were filled with rockfill and gravel to improve drainage and riprap benches were added on the downstream slope to provide additional stability. The network of crisscrossing tunnels makes behavior of the Dam even more complex. The Dam has undergone several renovations since its construction. The most current one is a seismic upgrade to comply with current federal regulations. Paul C. Rizzo Associates (RIZZO) with input from a Board of Consultants (BOC) and FERC evaluated alternatives for the remediation and decided on a large backup Berm as the most feasible solution. The new structure, a combination of Rockfill and RCC Berms, is to be built immediately downstream of the existing Dam, as shown on Figure 1. Construction of both the Rockfill and RCC sections entails excavation. Excavation for the Rockfill section reaches a competent soil subgrade while excavation for the RCC extends to bedrock. Excavation as deep as 70 ft at the toe of so large a Dam that impounds so large a lake is a dangerous undertaking. The complex character of the semi-hydraulic fill Dam makes this task an even bigger challenge. Excavation at the toe may weaken the existing Dam and cause a failure. To minimize the risk, engineers decided to excavate in short segments, or cells. Only when a cell is backfilled to the original ground surface can excavation progress to another area. An
Transcript of Listening to Dam - Final
LISTENING TO THE DAM- INSTRUMENTATION AND MONITORING PROGRAM
SALUDA DAM REMEDIATION
Elena Sossenkina, Monitoring Coordinator Matt Glunt, E.I.T. Field Engineer
Joseph A. Mann, E.I.T. Field Engineer Scott G. Newhouse, P.E. Senior Engineer, Paul C. Rizzo Associates, Monroeville, PA
Nature of the Dam
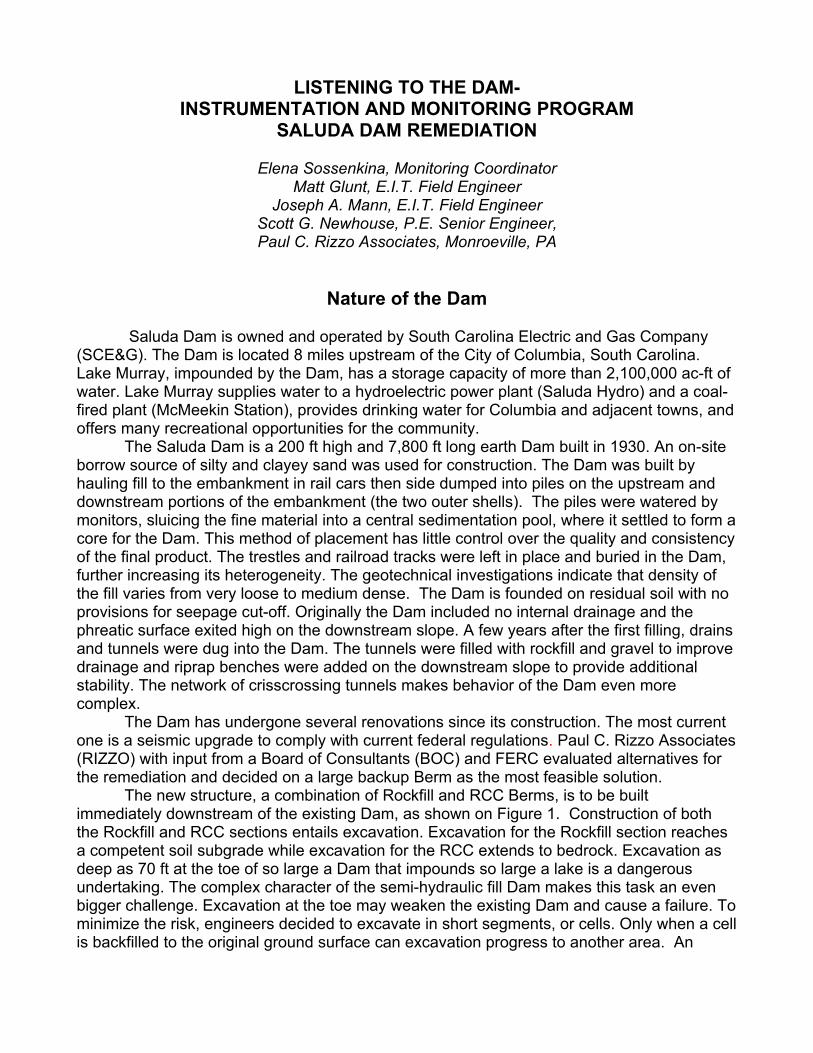
Saluda Dam is owned and operated by South Carolina Electric and Gas Company (SCE&G). The Dam is located 8 miles upstream of the City of Columbia, South Carolina. Lake Murray, impounded by the Dam, has a storage capacity of more than 2,100,000 ac-ft of water. Lake Murray supplies water to a hydroelectric power plant (Saluda Hydro) and a coal-fired plant (McMeekin Station), provides drinking water for Columbia and adjacent towns, and offers many recreational opportunities for the community.
The Saluda Dam is a 200 ft high and 7,800 ft long earth Dam built in 1930. An on-site borrow source of silty and clayey sand was used for construction. The Dam was built by hauling fill to the embankment in rail cars then side dumped into piles on the upstream and downstream portions of the embankment (the two outer shells). The piles were watered by monitors, sluicing the fine material into a central sedimentation pool, where it settled to form a core for the Dam. This method of placement has little control over the quality and consistency of the final product. The trestles and railroad tracks were left in place and buried in the Dam, further increasing its heterogeneity. The geotechnical investigations indicate that density of the fill varies from very loose to medium dense. The Dam is founded on residual soil with no provisions for seepage cut-off. Originally the Dam included no internal drainage and the phreatic surface exited high on the downstream slope. A few years after the first filling, drains and tunnels were dug into the Dam. The tunnels were filled with rockfill and gravel to improve drainage and riprap benches were added on the downstream slope to provide additional stability. The network of crisscrossing tunnels makes behavior of the Dam even more complex.
The Dam has undergone several renovations since its construction. The most current one is a seismic upgrade to comply with current federal regulations. Paul C. Rizzo Associates (RIZZO) with input from a Board of Consultants (BOC) and FERC evaluated alternatives for the remediation and decided on a large backup Berm as the most feasible solution.
The new structure, a combination of Rockfill and RCC Berms, is to be built immediately downstream of the existing Dam, as shown on Figure 1. Construction of both the Rockfill and RCC sections entails excavation. Excavation for the Rockfill section reaches a competent soil subgrade while excavation for the RCC extends to bedrock. Excavation as deep as 70 ft at the toe of so large a Dam that impounds so large a lake is a dangerous undertaking. The complex character of the semi-hydraulic fill Dam makes this task an even bigger challenge. Excavation at the toe may weaken the existing Dam and cause a failure. To minimize the risk, engineers decided to excavate in short segments, or cells. Only when a cell is backfilled to the original ground surface can excavation progress to another area. An

extensive dewatering system was installed to lower the phreatic surface in the Dam to a safe level, established on the basis of slope stability analyses. To provide early warning of a potential problem developing and to ensure safety of the excavation and stability of the Dam, a $6 Million Excavation Monitoring Program was implemented.
Excavation Monitoring Plan
RIZZO developed an excavation monitoring program, adopting the observational method (Peck, 1969). First, engineers had to identify mechanisms which may cause the existing Dam to fail. In this case, a slide in the cut slope, piping, internal erosion and bottom heave were considered the main modes of failure. Then, parameters to be monitored had to be selected. Pore pressure fluctuations and vertical and lateral deformations within the embankment fill and the foundation soil were chosen as quantifiable indicators of the Dam’s condition. The next step was identifying construction activities and other factors affecting the Dam behavior. Careful observation of such activities is essential for correlation with instrument measurements and making sense of the data. Engineers kept a detailed record of dewatering effort, lake drawdown, rainfall, excavation progress, and construction of haul roads and conveyors on the slope. As the project progressed, other factors were added to the list.
One of the most difficult tasks was predicting the Dam’s response to the construction activities and establishing “baseline conditions”. Because the consequences of Dam failure are so high, engineers opted for a conservative approach, reflected in a very low tolerance to deviation from baseline conditions. The limitation of such an approach was a single set of threshold values that didn’t differentiate between causes of the observed measurement. For example, 0.5 in. of deformation due to settlement would be treated the same way as 0.5 in. of deformation caused by a developing shear surface. As engineers learned more about the Dam and compared measurements with actual conditions, the threshold values were revised to recognize different causes. The plan as a whole evolved as the project progressed.
The plan must have action built in. It is insufficient to simply deploy instruments and watch them. One must know what it is the instrument should tell us, and what we will do as a result of its measurements. Based on the assessment of probable conditions, threshold values of instrumentation measurements were established to indicate appropriate action in response to the measurements. Response action is organized into four levels: Alert, Warning, Stop Work, and Emergency Backfill. The Plan contains the criteria and threshold values defining each of these action levels. The threshold values, presented in Table 1, only provide a basis for judgment and must not be applied blindly. The single fact that an instrument exceeds the established threshold level does not compel action. If the response is judged as normal, predicted behavior rather than a sign of an unanticipated failure, no Action Level should be triggered. Specific steps for the Engineer, Owner, and Contractor are diagrammed for each of the action levels. Related to the fourth action level, the project has a Construction Emergency Action Plan.
Excavation Instrumentation
The primary instruments to detect and predict slope failure or bottom heave are piezometers and inclinometers. They are supplemented by laser lines and survey
monuments set up on the surface. The team relies on these instruments, and, just as importantly, on visual observation, to assess the safety of the excavation and Dam performance. From the time excavation begins in a cell, the team must be able to account for the condition and safety of that excavation at all times until the cell is backfilled.
Water Pressure Measurement- Piezometers Excavation below the level of Lake Murray at the toe of the existing Dam presents a
risk of distress or even failure of the Dam. Seepage can drive a failure in several different mechanisms:
• Slide in cut slope driven by seepage- increasing pore pressure may be a sign of shear in the excavated soil;
• Internal erosion/piping mechanism driven by high hydraulic gradient; and • Bottom heave caused by high hydraulic gradient.
A major part of the Monitoring Plan is measurement of pore pressure to evaluate such a condition. Engineers chose electric vibrating wire (vw) diaphragm piezometers over other types (such as open standpipe) because of their quicker response time, ability to measure negative pore water pressure, automating capability, and rapid installation. Significant time and cost were saved by installing spring-activated vw piezometers (Model 4500-MLP, Geokon, Inc.) without a sand pack using the “fully-grouted” installation method (Mikkelson, 2002). Typically, two transducers are deployed per borehole as shown on Figure 2. More than 100 vw piezometers were placed in this fashion within the Dam and its foundation. Readings from vw piezometers are verified by comparing them to data from nearby open standpipe piezometers. Thus far, we find that the data from both types of piezometers are usually in good agreement and, as anticipated, the vw piezometers detect changes to pore pressure faster.
The instrumentation monitoring team has to evaluate constantly changing conditions associated with the excavation. To accomplish this difficult goal, RIZZO set up a highly automated monitoring system. Piezometers in the slope above the cut are wired to a datalogger (Figure 6a) transmitting data directly to the construction trailer via radio link. It was not feasible to extend piezometer cable through the excavation footprint. Therefore, the piezometers located there were affixed with single-channel data collectors (LC-1) that are downloaded in the field with a laptop computer. The other key feature of the automated system is a wireless computer network that covers the entire Dam. Using the wireless technology, technicians in the field download the LC-1 data files directly to the shared network. Critical time is saved by the ability to see all data in a real-time fashion using the wireless network and automated dataloggers. Interpreting Piezometer Data
Each excavation cell has a target piezometric level (head). Deviation from that stable condition could be a sign of trouble that the instrumentation team must evaluate immediately. In deciding on whether to implement an action level, the team has to weigh the dewatering system operation and performance, construction activity, and other factors such as rainfall and lake elevation.
An extensive dewatering program of deep wells, shallow wells, and eductors was deployed to lower head within the Dam and foundation during excavation. The piezometers allow constant evaluation of the piezometric head in the cell, and thus the dewatering system effectiveness. If piezometric elevation rises, it may be due to failure of a dewatering system

component, or it may be due to shear developing in the excavated slope. As shown on Figure 3, the vibrating wire piezometers show a characteristic response to shutdown of nearby dewatering components. This recognizable response pattern allows engineers to determine the cause of the rise and to gauge the severity of the situation. Piezometer data is also used to evaluate effect of abandoning the dewatering system in excavation cells that have been backfilled.
Before the start of excavation, Lake Murray was lowered 15 ft to provide an additional safeguard during the excavation phase. The instrumentation team monitored the effect of this drawdown. They found typically a pressure decrease of less than 2 ft on the piezometers located closest to Dam centerline (100 ft away) and no effect on instruments near the toe. The team will also monitor water pressure during the refilling of Lake Murray to its normal operating level.
Deformation measurement - Inclinometers The most likely failure mechanism for the Dam with excavation at the toe is a slide in
the excavation slope. To detect an impending slide, the team tracks ground movement and deformation within the Dam with inclinometers.
Typically, three rows of inclinometers are installed above each excavation cell, as shown on Figure 2, with more than 80 for the entire Dam. Typical depth of inclinometers on the project varies from 50 ft to 140 ft. Most of them extend down to weathered rock. However, where the foundation soil layer is thick the casing is terminated in competent residual (foundation) soil.
The instruments are read manually by a team of field technicians who return to the trailer at regular intervals during the day to download data. When required, such as during an Alert Level, technicians can download data directly from the inclinometer location, via the wireless network in place on the Dam. The most critical inclinometers are read as often as four times per day. Any indication of movement can be verified by laser lines, concrete shear strips, or by GPS surveying.
Accuracy of Inclinometers
A typical accuracy of +/- 0.3 in. per 100 ft of inclinometer casing under ordinary conditions is suggested by the manufacturer (Slope Indicator). To ensure that any signs of distress were detected as early as possible, engineers on the Saluda project required a higher level of accuracy. Established threshold values are of the same order of magnitude as the typical accuracy of the instrument, therefore even the smallest displacement is a matter of concern. One of the challenges of inclinometer evaluation is distinguishing between a developing shear surface and anticipated soil relaxation. To make that evaluation, the team needed to measure deformations to the highest possible accuracy.
Human error and several types of systematic and random errors in inclinometer surveys can influence the readings and produce false indication of displacement. A bias-shift error caused by a shift in the probe calibration during the reading is the most common systematic error seen in inclinometer data (Mikkelson, 2003). To reduce this error the team used four separate probes and performed regular maintenance and re-calibration. Careful installation of the casing minimized random error, while thorough training of field technicians and use of consistent field procedures helped reduce human error.

Interpreting Inclinometer Data As excavation progresses and toe support is removed, engineers expect some
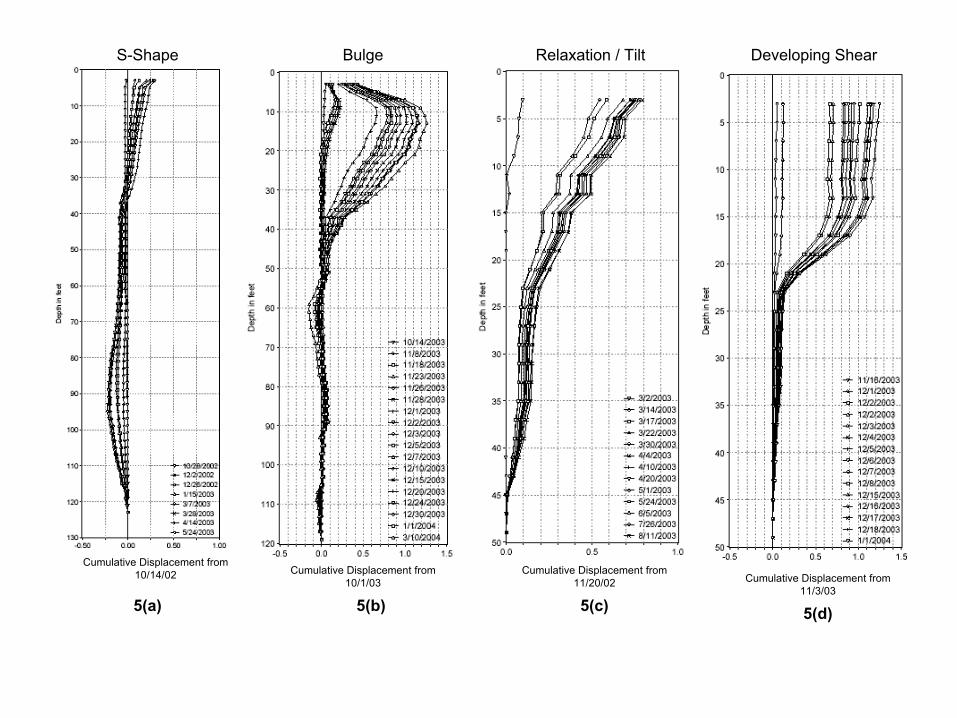
resulting deformation within the Dam. The instrumentation team’s challenge in interpretation of the inclinometer data is deciding if a movement is a normal, expected response of the Dam, or the onset of a slope failure. The team must evaluate the depth, magnitude, rate, and location of the deformation and attempt to correlate it to specific construction activities, as shown on Figure 4. Engineers noticed that reaction to certain construction activities produced inclinometer data plots of a distinct characteristic shape. The team categorized inclinometer data plots into 4 categories, shown on Figure 5, based on shape of the data plot and nearby construction activity:
• Settlement induced by dewatering- produces an S-shape plot; • Response to Surcharge– produces a bulge-shaped plot; • Soil relaxation caused by excavation unloading- produces a plot with a fairly
constant, gradual slope; and • Shear- sliding plane- produces a plot with an abrupt kink/sudden change in
slope. Early in the project, prior to excavation, inclinometers in a portion of the Dam near
maximum section began showing gradual movements of similar shape (S-shape) and magnitude. Many of the plots showed movement in the upstream and left/right directions, a puzzling effect. In evaluating the puzzle, the team found that this section of the Dam experienced the greatest drawdown during dewatering; head in the residual (foundation) soil had been lowered by as much as 45 ft. Accordingly, the team theorized settlement due to dewatering. Surveying of crest monuments confirmed that settlement had occurred. The inclinometer casings leaned (moved) towards the zone of maximum settlement, explaining the left and right measured deflections. This example highlights the importance of monitoring all activities on site when interpreting data.
To facilitate construction of the Rockfill Berm, a haul road was built along the downstream face of the Dam, as shown on Figure 2. The 45 ft-wide road was perched on a bench along the downstream slope, nearly 100 ft above the excavation cut slope at the Dam’s toe. During road construction, inclinometers installed on a bench downstream of the road indicated movement of a characteristic bulge shape, shown on Figure 5b. The response was brought on by adding the bench to the Dam (surcharge loading), and load by heavy haul trucks. This was an anticipated reaction of the loose embankment fill to applied stress. In this case, the deformation was considered tolerable, requiring no restriction on construction activities.
Inclinometers located in close proximity to large excavation slopes recorded movements of 0.2-0.4 in. at the top of the casing that were attributed to soil relaxation. This type of inclinometer plot, shown on Figure 5c, exhibits a constant angle of tilt over the entire length of casing. Engineers interpreted the observed creep (slow, uniform flexing of inclinometer casing with no concentrated shear zone) as the anticipated normal reaction of soil mass to unloading associated with excavation.
The fourth category of recorded movement is a developing shear zone. This type of deformation is the most serious, as it’s a sign of potential slope failure. Accordingly, detection of this type of movement that exceeds threshold level compels immediate action in accordance with the Action Levels found in the Monitoring Plan. The team interprets shear by a kink in the data plot over a relatively short depth interval, as shown on Figure 5d. The concept of soil strain was introduced into the analysis to gauge the severity of the movement.

The largest movement of this type observed on the project to date is a 1.2 in. deformation over a 15 ft interval. On the occasions where this type of movement was observed, engineers noticed that the depth of the movement correlated well with the residual (foundation) soil/embankment fill interface. Additional Instrumentation
Vibrating wire tiltmeters, shown on Figure 6b, were deployed to monitor movement of important structures during excavation activities. Tiltmeters were installed on overhead circulating water pipes and on an old gravity wall uncovered by the excavation. The 72 in. diameter circulating water pipes are connected to Dam penstocks and supply cooling water to the nearby coal-fired plant. Highly erratic movement (+/- 0.5 degrees) was recorded by the tiltmeters installed on the pipes. Inspection of the pipe indicated no signs of distress. After the unsuccessful attempt to correlate the data with nearby excavation activities, engineers were left with a puzzle. What caused these massive pipes to vibrate so much? After further investigation, it was noticed that certain fluctuations coincided well with opening and closing gates at the hydropower station. Engineers suggested that the observed vibrations are caused by water hammer forces. A field test was performed under extensive monitoring to confirm this conclusion. Other factors that contributed to the abnormalities included jolting of the instrument during nearby activity and daily fluctuations due to ambient temperature change.
Additional surface instrumentation, shown on Figure 6 was used to aid in visual observation. Strips of unreinforced concrete (shear strips) were placed on the surface of the slopes (Figure 6c). Pipe lasers (Figure 6d) were utilized to monitor a line of targets installed along the cut slope to gauge movement of the slope. Theoretically, surface movements would cause readily visible relative movement in a laser line or a crack in a shear strip and could help define the lateral extent of the movement. Survey monuments were monitored with GPS for any horizontal or vertical displacement. Thus far, GPS surveying has correlated well with inclinometer indications and calculations of expected values for settlement and lateral displacement of the ground surface. The other tools, i.e. laser lines and shear strips, have been found to be inconclusive and easily disturbed.
Visual Observation
One can not overestimate the power of visual observations. Through routine inspections and careful observations of the Dam engineers develop a sense for a “normal” behavior of the Dam. Instrument measurements are not very valuable unless they are correlated with the construction activities. Keeping a detailed record of significant events, such as excavation sequence, dewatering system performance, and any other factors that may influence the behavior of the embankment is essential for interpreting the data and making decisions. As Dr. Ralph Peck said, “an instrument too often overlooked in our technical world is a human eye connected to the brain of an intelligent human being”. No matter how sophisticated and numerous deployed instruments are, vital clues as to the Dam’s behavior and potential failure modes developing can be missed if engineers focus on reading instruments only.
When a small local slide developed in an over steepened excavation slope, instruments upslope didn’t register any unusual readings. The slide was detected by routine visual observations. Inspection of the slide area revealed series of tension cracks developing above the initial scarp. The tension cracks indicated a larger failure developing. The movement was arrested by constructing a buttress at the toe of the slope. If engineers relied

on instruments alone, and waited for them to pick up some movement, a more serious problem could have developed.
In another case, a strong seep emerged on a previously dry slope. Just like in the example above, nearby piezometers didn’t register any fluctuations in pore pressure. The 12 gpm seep had murky color and transported fines. Quick check of a nearby dewatering system confirmed that it is functioning properly, and is unlikely the cause of the seepage. Review of old drawings and sketches indicated existence of a large drain tunnel not far from the seep. The 4 ft by 6 ft square tunnel filled with gravel and rockfill extended approximately 100 ft into the Dam. People, who worked on the Dam for decades recalled that after extended periods of rain similar seeps often emerge in vicinity of old drainage features. They usually disappear in a short period of time. After a few hours the seep cleared up and reduced to less than 0.1 gpm. A filter blanket was placed on the slope to prevent loss of fines, if the seep reactivates in the future. If engineers didn’t have a good record of the previous experience, costly and unnecessary remedial actions would have been implemented.
Conclusion
Excavation at the toe of a large high-hazard Dam is a unique and challenging task that must not be taken lightly. Despite the extensive subsurface explorations and numerous sophisticated analyses, engineers knew little about the Dam when the project began. How would the Dam react to the excavation? How much movement and pore pressure fluctuations can it tolerate? Each Dam is unique, no calculations and computer-aided analyses can predict what exactly it will do when subjected to stress. Some circumstances were as designed and anticipated, some were better than anybody could have hoped for, and some were a total surprise. Engineers learned to expect the unexpected. Constantly listening to the Dam through instruments and visual observations, correlating the observed behavior with construction activities and revising the design or correcting your expectations accordingly is the key to a successful Monitoring Program. The authors wish to acknowledge the Board of Consultants (Dr. Ralph B. Peck, Joseph Ehasz, Eric Kollgaard, and Randall Bass), FERC staff (Dr. Steve Collins, and Gus Tjoumas) and FERC consultants (Dr. Alfred J. Hendron, Kenneth Hansen and Dr. I. M. Idriss) for their consultation and advice during the course of the project. We appreciate working on this fascinating project and would like to take an opportunity to thank the following SCE&G personnel: Jim Landreth, Kristina Massey, and Sam Stockman, and acknowledge the Contractor, Barnard Construction Company, for their dedication and hard work.
References
1. Dunnicliff, J. (1988), “Geotechnical Instrumentation for Monitoring Field Performance”, John
Wiley, New York. 2. Geokon, Inc. Lebanon, NH. www.geokon.com 3. Mikkelson, P.E., Green, Gordon E., “Piezometers in Fully Grouted Boreholes”, FMGM - Field
Measurements in Geomechanics, Oslo, Norway (2003). 4. Mikkelson, P.E., “Advances in Inclinometer Data Analysis”, FMGM - Field Measurements
in Geomechanics, Oslo, Norway (2003). 5. Peck, R.B., “Advantages and limitations of the observational method in applied soil mechanics”,
Publication # 116. Ninth Rankine Lecture. Geotechnique, June 1969, 19, pp 171-187 6. Slope Indicator, Mukilteo, WA. www.slopeindicator.com

Initial Revised1/2 in. movement from baseline 0.6 in. cumulative movement from pre-
excavation baseline;3 ft rise above target Seepage entering cell requiring pumping;
kink in plot of 1/4 in. over a 4 ft casing length
Kink on incremental plot of ¼ in. over a 4 ft casing length measured from pre-excavation baseline;
Surficial ravelling, sliding in cut slope
Cracks in Shear StripsContinued movement beyond 1/2 in. from baseline
Continued rise above 3 ft Increase in seepage
Continued movement along kink in plot Total cumulative movement greater than 1.2 in. from pre-excavation baseline in inclinometers closest to cut
Softening of subgrade
Total rise exceeding 4 ftTotal movement greater than 1/2 in. Tension crack developing
Total cumulative movement greater than 0.6 in. from pre-excavation baseline in inclinometers greater than 200 ft away from cut
Rate of rise of 0.5 ft per day
Continued cut slope ravelling -Shallow failures between benches
Rate of movement of 1/4 in. per day Rate of movement interpreted from cumulative displacement plot of 0.25 in./day
Total movement of 1 in. Total cumulative movement greater than 2.2 in. from pre-excavation baseline;
Piezometric level 5 ft above target Evidence of bottom heave
Rate of movement of 1/2 in. per day Rate of rise of 1 ft per day Quick conditions or softened subgradePresence of fines in seepage stream
Rate of movement interpreted from cumulative displacement plot of 0.5 in./day
Tension crack is open and continuous for 10 ft or more
Total movement of 3 in. Total cumulative movement greater than 3.2 in. from pre-excavation baseline;
Piezometric level 8 ft above target Seepage boil- cone of deposition
Rate of movement of 1 in. per day Rate of movement interpreted from cumulative displacement plot of 1 in./day
Rate of rise of 2 ft per day Tension crack is propagating
Emergency Backfill
InstrumentInclinometer
Action Level
Alert
Piezometer Visual Observation
Warning
Stop
monitoring4
Table 1 - Threshold Levels

monitoring4
Figure 1 - Typical Cross Section Existing Dam and Back-up Berm
monitoring4
Figure 2 - Typical Excavation and Dewatering System
monitoring4
monitoring4
Figure 2 - Typical Excavation and Dewatering System
monitoring4
monitoring4

Figure 3 – Piezometer Data Typical Response to Dewatering Shutdown
315.0
314.0
313.0
312.0
311.0
310.0
309.0
308.0
4/18/03 4/21/03 4/24/03 4/27/03 5/1/03 5/4/03 5/7/03 5/10/03 5/13/03 5/17/03 5/20/03 5/24/03Date
Localized Dewatering System Maintenance
and Down-Time
Figure 4 – Typical Inclinometer Time Displacement Plot Correlated with Construction Activities
1.8
1.6
1.4
1.2
1.00.8
0.6
0.4
0.2
0.0 50 100 150 200 250 300 350 400 450 5000.0
2.0
Cum
ulat
ive
Dis
plac
emen
t, in
.
Excavation Begins
Soil Mass Stabilizes
First Signs of Relaxation
Soil Relaxation Pattern
Construction of Haul Road Begins
Shear Pattern
Buttress Placed at the Toe of the Slope
Soil Mass Stabilizes
Days from Installation
Pie
zom
etric
Hea
d, E
leva
tion,
ft.
monitoring4
monitoring4
monitoring4
monitoring4
monitoring4
Figure 3 - Piezometer Data Typical Response to Dewatering Shutdown
monitoring4
monitoring4
monitoring4
Figure 4 - Typical Inclinometer Time Displacement Plot Correlated with Construction Activities
S-Shape
Cumulative Displacement from 10/14/02
5(a)
Bulge
Cumulative Displacement from 10/1/03
5(b)
Relaxation / Tilt
Cumulative Displacement from 11/20/02
5(c)
Developing Shear
Cumulative Displacement from 11/3/03
5(d)
monitoring4
Figure 5 - Typical Incliometer Plots

Tiltmeters
6(a) - Datalogger 6(b) – Tiltmeters
Shear Strips
6(c) – Shear Strips 6(d) – Laser Line
monitoring4
Figure 6 - Additional Instrumentation