Linux Performance Analysis: Parallel, Serial and I/O
60
Linux Performance Analysis: Parallel, Serial and I/O Per Ekman ( [email protected]) System Engineer, PDC/KTH Philip Mucci ([email protected]) Visiting Scientist, PDC/KTH Research Consultant, UTK LCSC 2004 Linköping, Sweden http://www.cs.utk.edu/~mucci/latest/mucci_talks.html http://www.pdc.kth.se/~pek
Transcript of Linux Performance Analysis: Parallel, Serial and I/O

Linux Performance Analysis: Parallel, Serial and I/O
Per Ekman ([email protected])System Engineer, PDC/KTH
Philip Mucci ([email protected])Visiting Scientist, PDC/KTHResearch Consultant, UTK
LCSC 2004 Linköping, Sweden
http://www.cs.utk.edu/~mucci/latest/mucci_talks.htmlhttp://www.pdc.kth.se/~pek
Overview
● PAPI and Hardware Performance Analysis
● A Production Ready Tool Suite
● Site Wide Performance Monitoring at PDC
● IOTrack: Passively Tracking I/O
Overall Performance
“The single most important impediment to good parallel performance is still poor single
node performance.” William Gropp
Argonne National Lab
Linux Performance Infrastructure
● Contrary to popular belief, the Linux Performance Infrastructure is well established.
● PAPI/Kernel Support is +7 years old.
● Wide complement of tools from which to choose, but few are production quality.
● Sun, IBM, Dell, HP and other major vendors are focusing on Linux Clustering and HPC.
– More focus on performance than ever before.
The Adaptability Gap(Thanks Bjørn)
● Until we have....
– Hardware counter based profile directed feedback in compilers.
– Adaptable, reconfigurable, real-time computing resources that eat C/Fortran not VHDL. (MMU's, FPGA's)
– Matched memory, interconnect bandwidth, logic-level latencies for offboard communication.
– Generalized zero-copy infrastructure in kernel/user space.
● We need tools and expertise to narrow it.
Hardware Performance Counters
● Performance Counters are hardware registers dedicated to counting certain types of events within the processor or system.– Usually a small number of these registers (2,4,8)– Sometimes they can count a lot of events or just a few– Symmetric or asymmetric
● Each register has a various modes of operation.– Interrupt on overflow– Edge detection (cycles vs. events)– User vs. kernel mode
• Cycle count• Instruction count
– All instructions– Floating point– Integer– Load/store
• Branches– Taken / not taken – Mispredictions
• Pipeline stalls due to– Memory subsystem
– Resource conflicts
• Cache– I/D cache misses for
different levels – Invalidations
• TLB – Misses– Invalidations
Hardware Performance Data
Linux Kernel Support for PMC
● Performance counters are part of the thread context, just like FPU registers.
– Dedicated, per-thread measurements● Cost of switching is minimal when lazy-
evaluation is used.
● Linux Kernel Integration
– IA64: HP designed and pushed 'perfmon' into mainline by inheritance. (syscall based)
– x86/x86_64: PerfCtr, designed by Mikael Pettersson in Uppsala. (mmap based)
● Accepted in 2.6-mm series.
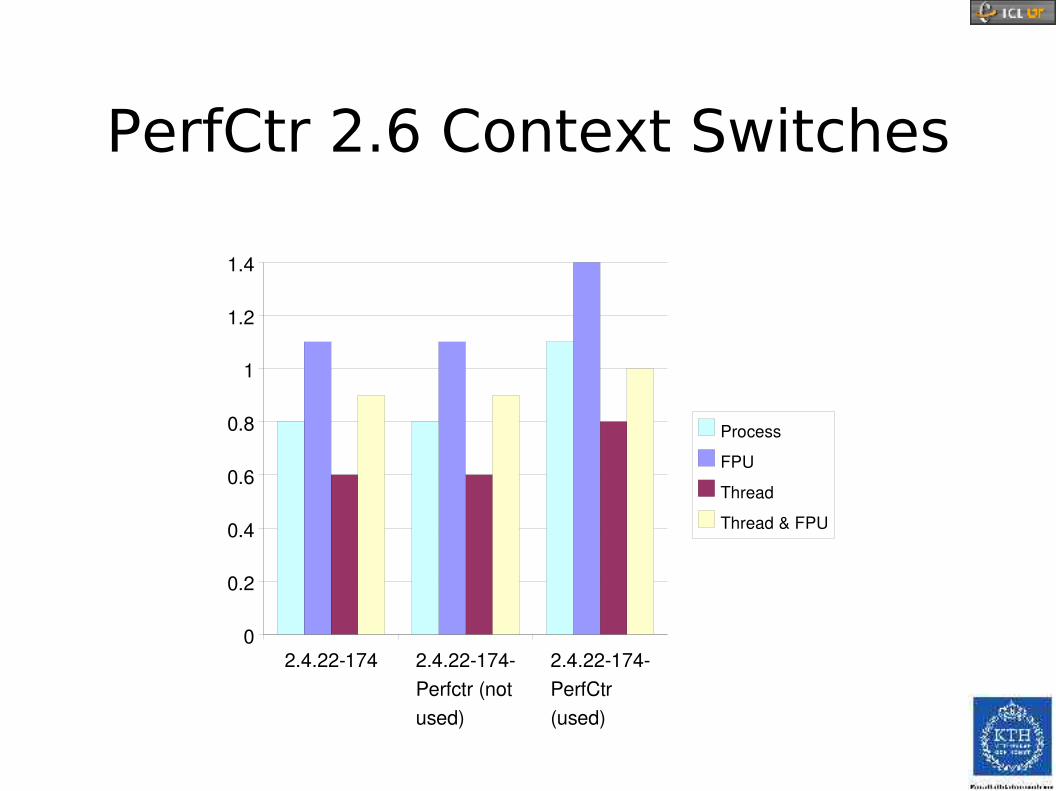
PerfCtr 2.6 Context Switches
2.4.22174 2.4.22174Perfctr (not used)
2.4.22174PerfCtr (used)
0
0.2
0.4
0.6
0.8
1
1.2
1.4
ProcessFPUThreadThread & FPU
PAPIPerformance Application Programming
Interface
• The purpose of PAPI is to implement a standardized portable and efficient API to access the hardware performance monitor counters found on most modern microprocessors.
• The goal of PAPI is to facilitate the optimization of parallel and serial code performance by encouraging the development of cross-platform optimization tools.
PAPI 3.0
● Full enumeration of platform-specific metrics● Overflow and profiling on multiple events simultaneously
● Complete memory hierarchy information● Complete shared library map● Thread safe, high level API● Efficient thread local storage and locking routines
● 32 and 64-bit profiling buckets (vs. 16-bit in SVR4/POSIX)
PAPI 3.0 Release
● Final release scheduled this week after 1 year Beta.
● Vastly lower measurement overheads.
● New support for Intel EM64T and Cray X1 (SSP/MSP)
● Updated Web Site and Documentation:
– Links to New tools, Example codes
– Improved Web page
– Bugzilla Database
Open Source Tool Suite
● Mostly Orthogonal Functionality
● Well Documented
● Extensively Tested
● Actively Supported
– Not just a research effort or a funding vehicle.● 100% Open Source
● Expose Gaps in Research
Essential Tool Functionality
● Must work with Pthreads, OpenMP, MPI, fork() and exec().
● Passive Tools
– Require no modification/instrumentation of source or object code.
● Library preloading and/or name shifting.● Active Tools
– Instrumentation performed.● Binary● Source
Tool Methodology
● Direct Measurements read raw values of Metrics.
– Overall/Global Measurements. (aka Quick & Dirty)
– Site based.● Module/Function/Loop/Basic Block● Address Range
Tool Methodology
● Indirect Measurements infer values from probabilistic distributions.
● Statistical Profiling, developing a Histogram with X axis = Location, Y axis = Event Count.
● Event could equal:
– Timer interrupts (like Gprof)
– Hardware Counter Overflows on arbitrary Thresholds
The PDC Tool Collection
● PerfSuite from NCSA
● HPCToolkit from Rice U.
● TAU from U. Oregon.
● MpiP from LLNL
● Jumpshot/MPICH from MS State.
● IOTrack from PDC/KTH
PerfSuite from NCSA
● psrun/psprocess
● Command line tool similar to IRIX's perfex command.
● Does aggregate counting of the entire run. Also provides statistical profiling.
● Uses library preloading.
● Output is XML or Plain Text.
– Machine information
– Raw counter values
– Derived metrics
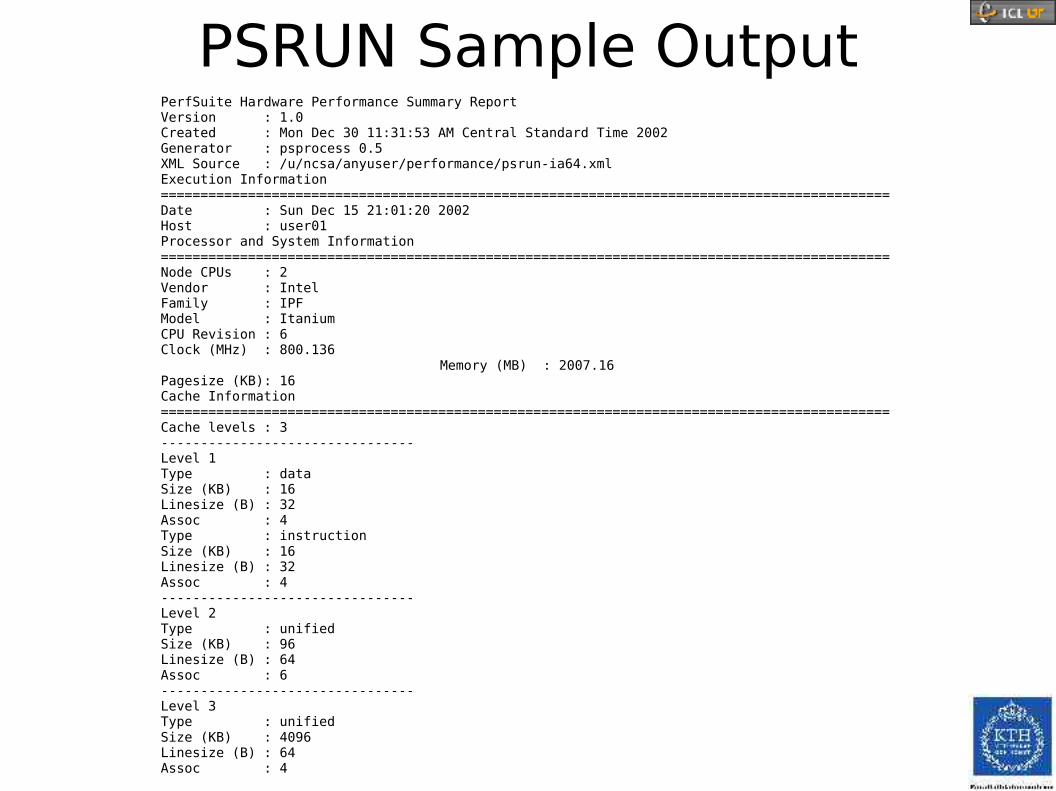
PSRUN Sample OutputPerfSuite Hardware Performance Summary ReportVersion : 1.0Created : Mon Dec 30 11:31:53 AM Central Standard Time 2002Generator : psprocess 0.5XML Source : /u/ncsa/anyuser/performance/psrun-ia64.xmlExecution Information============================================================================================Date : Sun Dec 15 21:01:20 2002Host : user01Processor and System Information============================================================================================Node CPUs : 2Vendor : IntelFamily : IPFModel : ItaniumCPU Revision : 6Clock (MHz) : 800.136
Memory (MB) : 2007.16Pagesize (KB): 16Cache Information============================================================================================Cache levels : 3--------------------------------Level 1Type : dataSize (KB) : 16Linesize (B) : 32Assoc : 4Type : instructionSize (KB) : 16Linesize (B) : 32Assoc : 4--------------------------------Level 2Type : unifiedSize (KB) : 96Linesize (B) : 64Assoc : 6--------------------------------Level 3Type : unifiedSize (KB) : 4096Linesize (B) : 64Assoc : 4

PSRUN Sample OutputIndex Description Counter Value============================================================================================ 1 Conditional branch instructions mispredicted..................... 4831072449 2 Conditional branch instructions correctly predicted.............. 52023705122 3 Conditional branch instructions taken............................ 47366258159 4 Floating point instructions...................................... 86124489172 5 Total cycles..................................................... 594547754568 6 Instructions completed........................................... 1049339828741 7 Level 1 data cache accesses...................................... 30238866204 8 Level 1 data cache hits.......................................... 972479062 9 Level 1 data cache misses........................................ 29224377672 10 Level 1 instruction cache reads.................................. 221828591306 11 Level 1 cache misses............................................. 29312740738 12 Level 2 data cache accesses...................................... 129470315862 13 Level 2 data cache misses........................................ 15569536443 14 Level 2 data cache reads......................................... 110524791561 15 Level 2 data cache writes........................................ 18622708948 16 Level 2 instruction cache reads.................................. 566330907 17 Level 2 store misses............................................. 1208372120 18 Level 2 cache misses............................................. 15401180750 19 Level 3 data cache accesses...................................... 4650999018 20 Level 3 data cache hits.......................................... 186108211 21 Level 3 data cache misses........................................ 4451199079 22 Level 3 data cache reads......................................... 4613582451 23 Level 3 data cache writes........................................ 38456570 24 Level 3 instruction cache misses................................. 3631385 25 Level 3 instruction cache reads.................................. 17631093 26 Level 3 cache misses............................................. 4470968725 27 Load instructions................................................ 111438431677 28 Load/store instructions completed................................ 130391246662 29 Cycles Stalled Waiting for memory accesses....................... 256484777623 30 Store instructions............................................... 18840914540 31 Cycles with no instruction issue................................. 61889609525 32 Data translation lookaside buffer misses......................... 2832692
Event Index============================================================================================ 1: PAPI_BR_MSP 2: PAPI_BR_PRC 3: PAPI_BR_TKN 4: PAPI_FP_INS 5: PAPI_TOT_CYC 6: PAPI_TOT_INS 7: PAPI_L1_DCA 8: PAPI_L1_DCH 9: PAPI_L1_DCM 10: PAPI_L1_ICR 11: PAPI_L1_TCM 12: PAPI_L2_DCA 13: PAPI_L2_DCM 14: PAPI_L2_DCR 15: PAPI_L2_DCW 16: PAPI_L2_ICR 17: PAPI_L2_STM 18: PAPI_L2_TCM 19: PAPI_L3_DCA 20: PAPI_L3_DCH 21: PAPI_L3_DCM 22: PAPI_L3_DCR 23: PAPI_L3_DCW 24: PAPI_L3_ICM 25: PAPI_L3_ICR 26: PAPI_L3_TCM 27: PAPI_LD_INS 28: PAPI_LST_INS 29: PAPI_MEM_SCY 30: PAPI_SR_INS 31: PAPI_STL_ICY 32: PAPI_TLB_DM
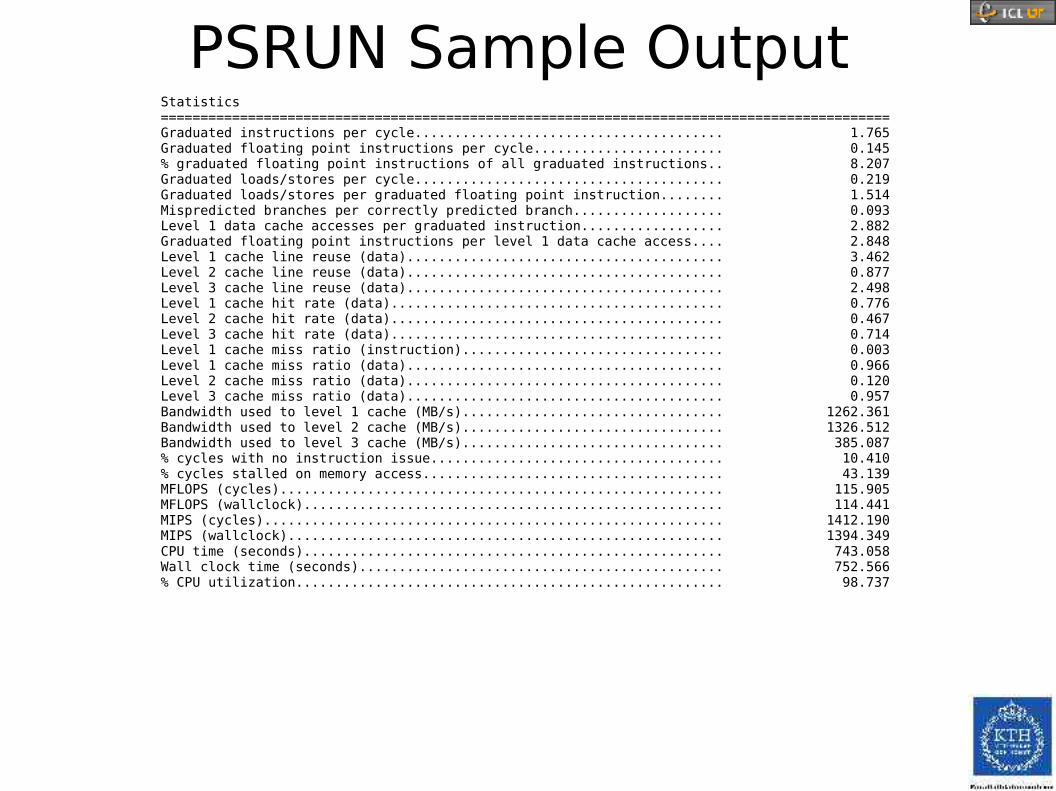
PSRUN Sample Output Statistics============================================================================================Graduated instructions per cycle....................................... 1.765Graduated floating point instructions per cycle........................ 0.145% graduated floating point instructions of all graduated instructions.. 8.207Graduated loads/stores per cycle....................................... 0.219Graduated loads/stores per graduated floating point instruction........ 1.514Mispredicted branches per correctly predicted branch................... 0.093Level 1 data cache accesses per graduated instruction.................. 2.882Graduated floating point instructions per level 1 data cache access.... 2.848Level 1 cache line reuse (data)........................................ 3.462Level 2 cache line reuse (data)........................................ 0.877Level 3 cache line reuse (data)........................................ 2.498Level 1 cache hit rate (data).......................................... 0.776Level 2 cache hit rate (data).......................................... 0.467Level 3 cache hit rate (data).......................................... 0.714Level 1 cache miss ratio (instruction)................................. 0.003Level 1 cache miss ratio (data)........................................ 0.966Level 2 cache miss ratio (data)........................................ 0.120Level 3 cache miss ratio (data)........................................ 0.957Bandwidth used to level 1 cache (MB/s)................................. 1262.361Bandwidth used to level 2 cache (MB/s)................................. 1326.512Bandwidth used to level 3 cache (MB/s)................................. 385.087% cycles with no instruction issue..................................... 10.410% cycles stalled on memory access...................................... 43.139MFLOPS (cycles)........................................................ 115.905MFLOPS (wallclock)..................................................... 114.441MIPS (cycles).......................................................... 1412.190MIPS (wallclock)....................................................... 1394.349CPU time (seconds)..................................................... 743.058Wall clock time (seconds).............................................. 752.566% CPU utilization...................................................... 98.737
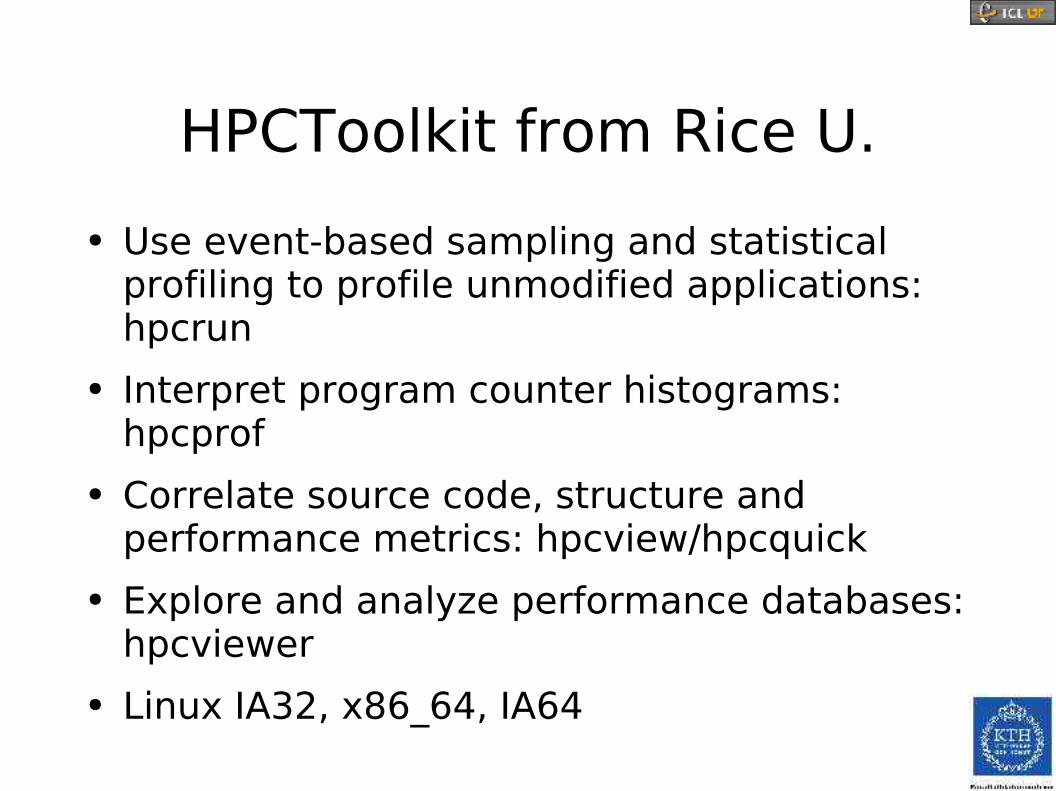
HPCToolkit from Rice U.
● Use event-based sampling and statistical profiling to profile unmodified applications: hpcrun
● Interpret program counter histograms: hpcprof
● Correlate source code, structure and performance metrics: hpcview/hpcquick
● Explore and analyze performance databases: hpcviewer
● Linux IA32, x86_64, IA64
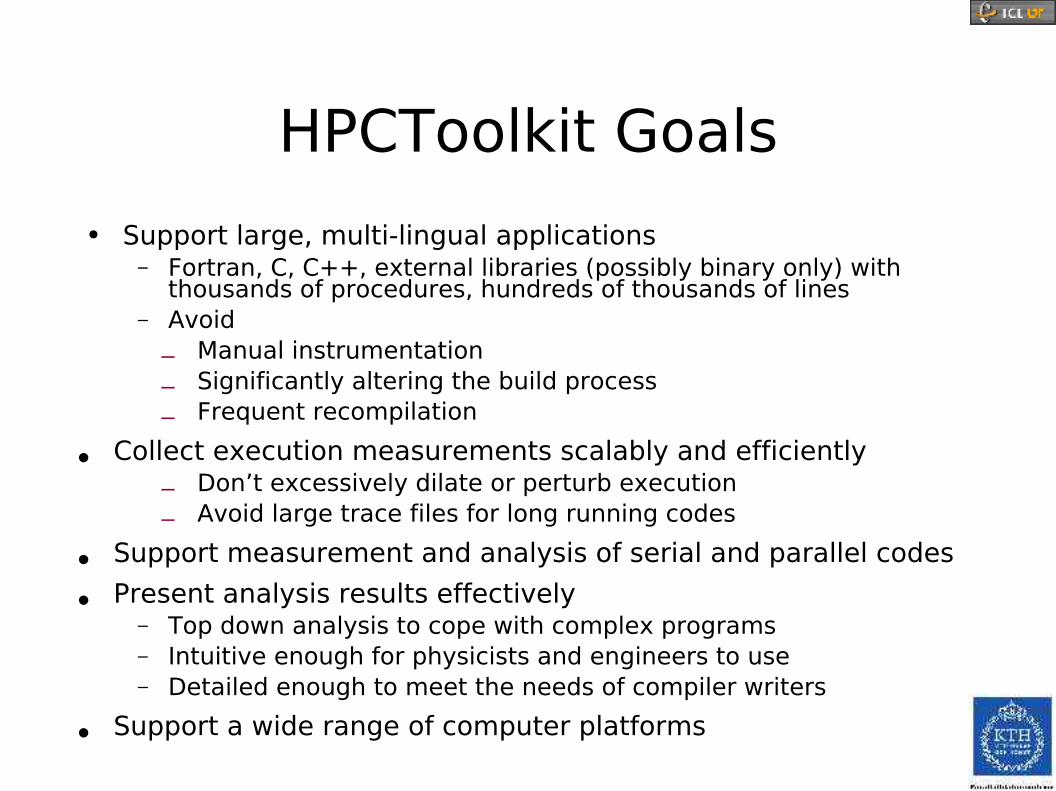
HPCToolkit Goals
● Support large, multi-lingual applications– Fortran, C, C++, external libraries (possibly binary only) with
thousands of procedures, hundreds of thousands of lines– Avoid
– Manual instrumentation
– Significantly altering the build process
– Frequent recompilation
• Collect execution measurements scalably and efficiently– Don’t excessively dilate or perturb execution
– Avoid large trace files for long running codes
• Support measurement and analysis of serial and parallel codes
• Present analysis results effectively– Top down analysis to cope with complex programs – Intuitive enough for physicists and engineers to use– Detailed enough to meet the needs of compiler writers
• Support a wide range of computer platforms
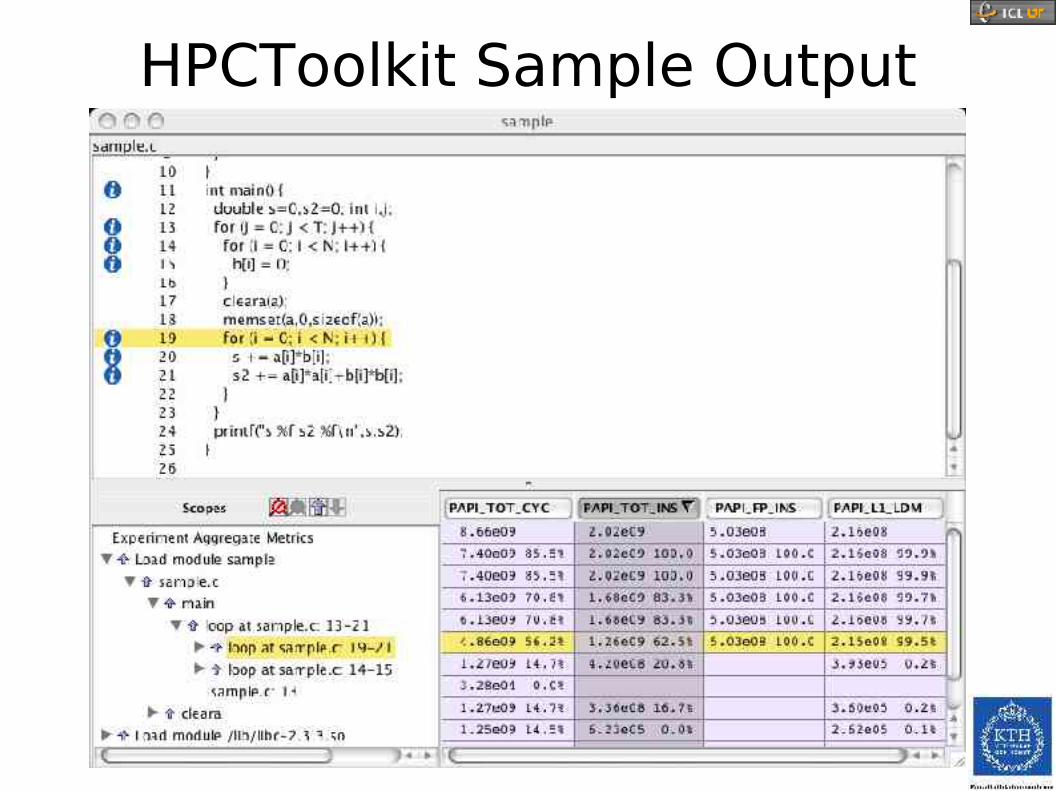
HPCToolkit Sample Output
OProfile
● Oprofile is a statistical profiler put into RedHat kernels and adopted by other Linux vendors.
● Implementation is good for overall system tuning, but useless for production environments.
– No aggregate counter support
– Must be configured by root
– Non-existent API
TAU from U. Oregon
● Tuning and Analysis Utilities (11+ year project effort)
● Integrated toolkit for parallel and serial performance instrumentation, measurement, analysis, and visualization
● Open software approach with technology integration
● Robust timing and hardware performance support using PAPI
● TAU supports both profiling and tracing models.
Some TAU Features
● Function-level, block-level, statement-level
● Support for callgraph and callpath profiling
● Parallel profiling and Inter-process communication events
● Supports user-defined events
● Trace merging and format conversion
TAU Instrumentation
● Flexible mechanisms:
– Source code both manual and automatic.● C, C++, F77/90/95 (Program Database Toolkit
(PDT))● OpenMP (directive rewriting (Opari), POMP
spec)
– Object code● pre-instrumented libraries (e.g., MPI using
PMPI)
– Executable code● dynamic instrumentation (pre-execution)
(DynInstAPI)
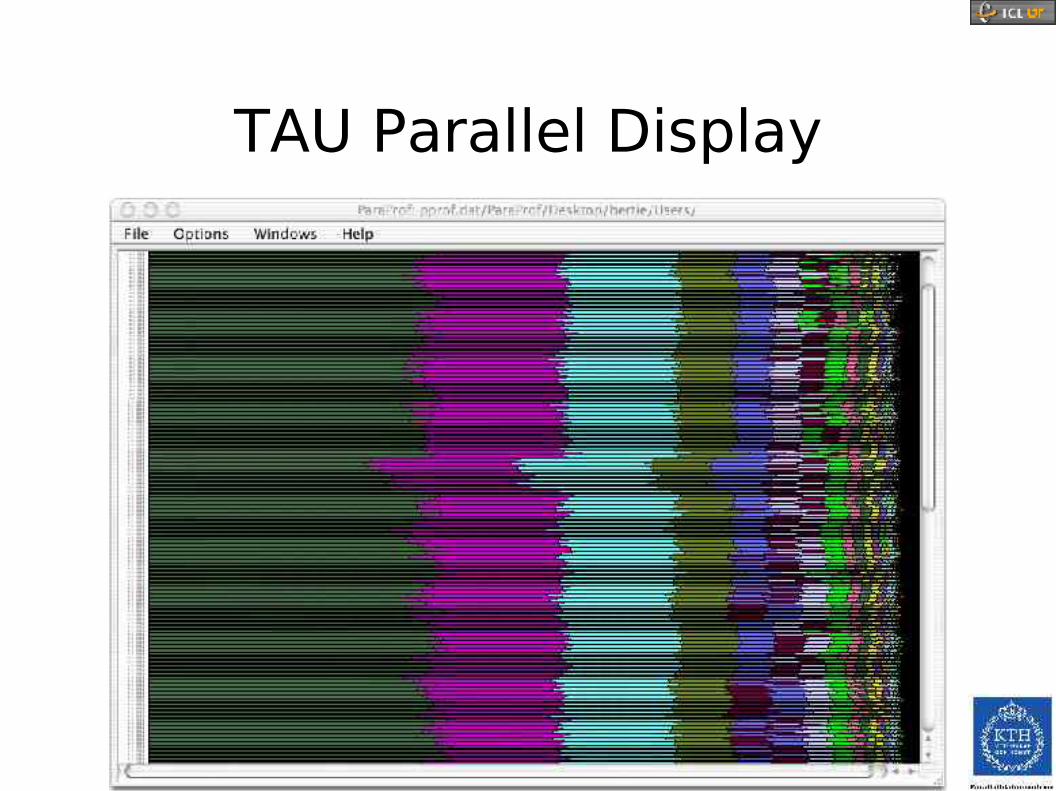
TAU Parallel Display
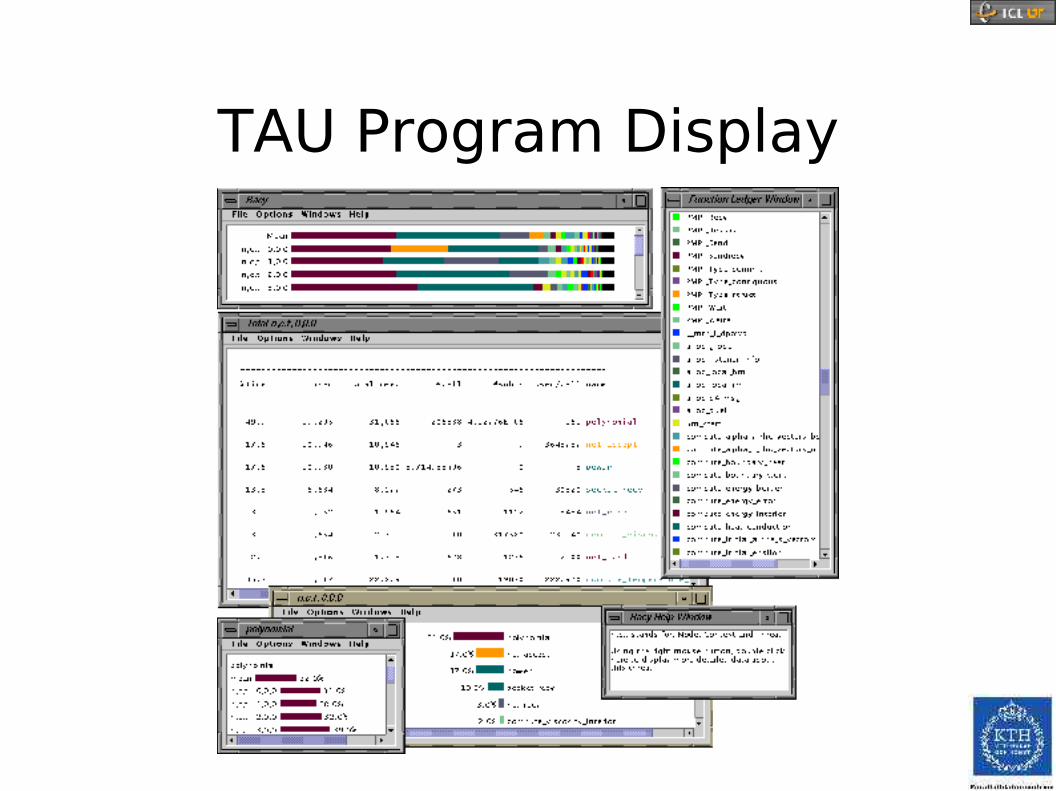
TAU Program Display
MPI Profiling
● How much time we are spending in communication.
– Load balance
– Algorithm design
– Synchronization and scaling● MPI tools to do this via the MPI profiling
interface.
– MpiP for aggregate statistics and call site information.
– Jumpshot-4 for trace generation and visualization.
MpiP: Lightweight MPI Profiling
● Trace generation of MPI calls is Heavyweight!
● Trace is generated but reduced at runtime
● Short text summary is generated at the end of execution.
● Traces:
– MPI I/O
– Callsite and callstack (optional)
– Controlled scope with MPI_Pcontrol().
MpiP: Lightweight MPI Profiling
● MPIP is a lightweight, scalable profiling tool for gathering timing information about MPI applications
– Records cumulative time for each MPI callsite
– Tested up to 4,096 processors
– Output data size is time-invariant
– Timing information provides first order approximation of performance problems
● Short text summary is generated at the end of execution.
MpiP Tracing
● No large tracefiles or large perturbation on application
● Traces:
– MPI 1 and MPI 2 Calls
– MPI I/O
– Callsite and callstack (optional)
– Controlled scope with MPI_Pcontrol().
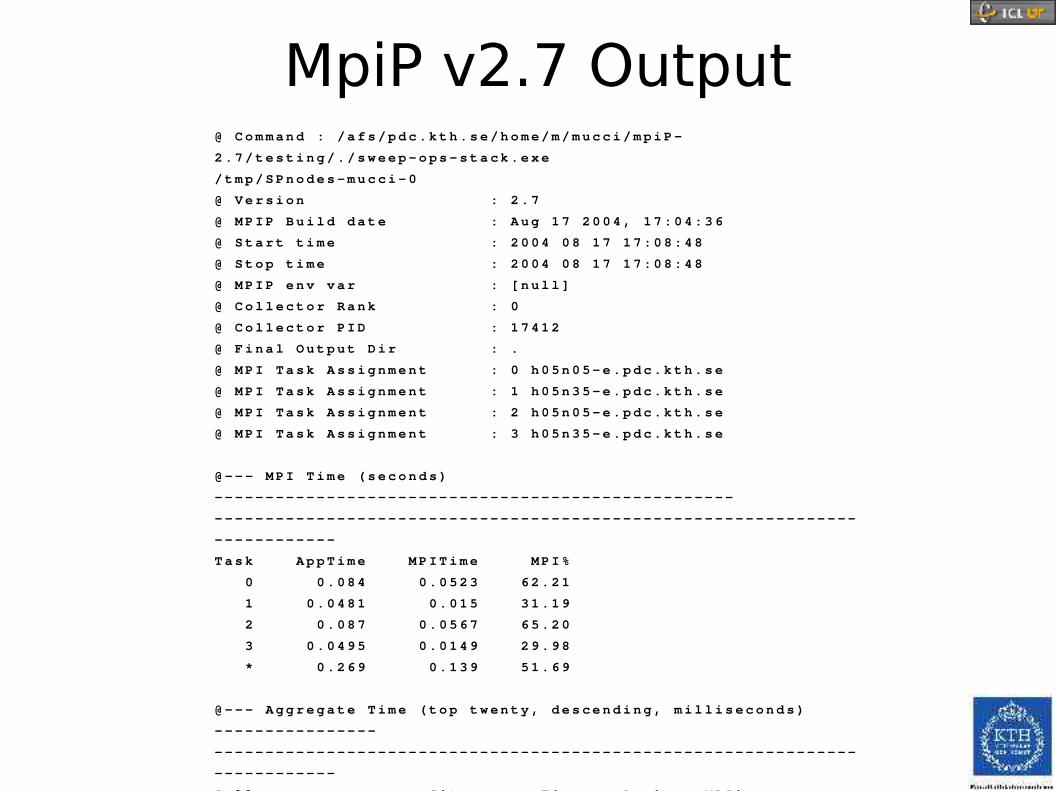
MpiP v2.7 Output@ Command : /afs/pdc.kth.se/home/m/mucci/mpiP-
2.7/testing/./sweep-ops-stack.exe
/tmp/SPnodes-mucci-0
@ Version : 2.7
@ MPIP Build date : Aug 17 2004, 17:04:36
@ Start time : 2004 08 17 17:08:48
@ Stop time : 2004 08 17 17:08:48
@ MPIP env var : [null]
@ Collector Rank : 0
@ Collector PID : 17412
@ Final Output Dir : .
@ MPI Task Assignment : 0 h05n05-e.pdc.kth.se
@ MPI Task Assignment : 1 h05n35-e.pdc.kth.se
@ MPI Task Assignment : 2 h05n05-e.pdc.kth.se
@ MPI Task Assignment : 3 h05n35-e.pdc.kth.se
@--- MPI Time (seconds)
---------------------------------------------------
---------------------------------------------------------------
------------
Task AppTime MPITime MPI%
0 0.084 0.0523 62.21
1 0.0481 0.015 31.19
2 0.087 0.0567 65.20
3 0.0495 0.0149 29.98
* 0.269 0.139 51.69
@--- Aggregate Time (top twenty, descending, milliseconds)
----------------
---------------------------------------------------------------
------------
Call Site Time App% MPI%
Barrier 1 112 41.57 80.42
Recv 1 26.2 9.76 18.89
Allreduce 1 0.634 0.24 0.46
Bcast 1 0.3 0.11 0.22
Send 1 0.033 0.01 0.02
@--- Aggregate Sent Message Size (top twenty, descending,
bytes) ----------
---------------------------------------------------------------
------------
Call Site Count Total Avrg
Sent%
Allreduce 1 8 4.8e+03 600
46.15
Bcast 1 8 4.8e+03 600
46.15
Send 1 2 800 400
7.69
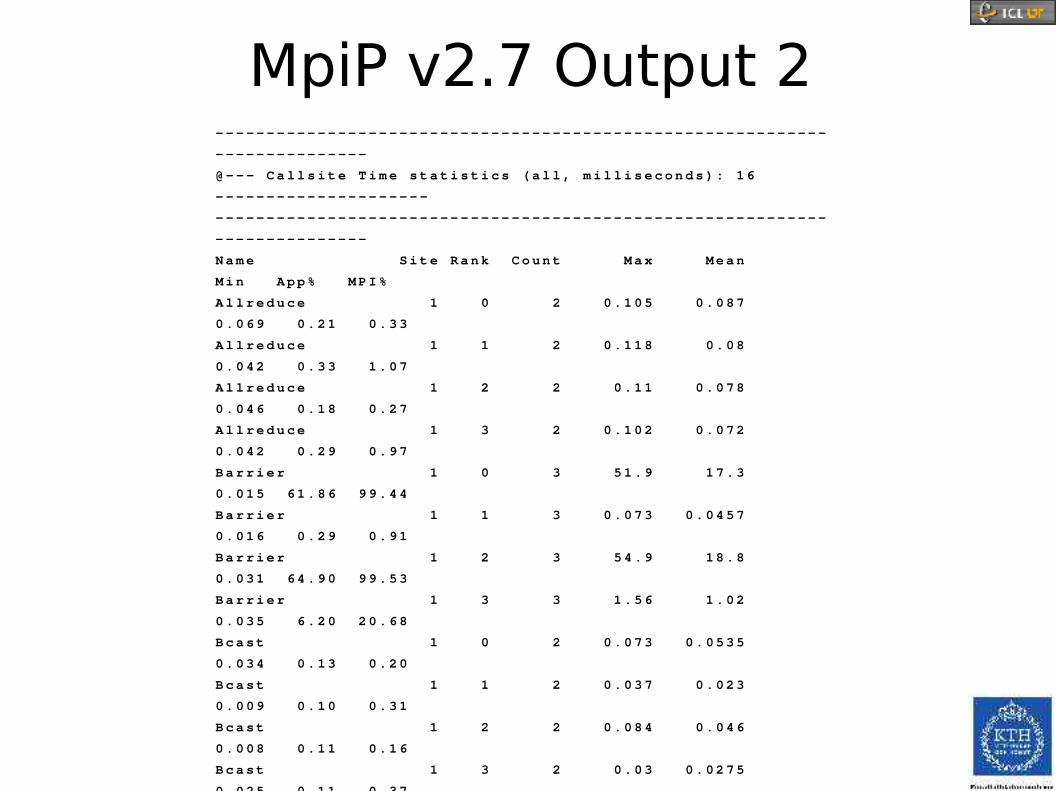
MpiP v2.7 Output 2------------------------------------------------------------
---------------
@--- Callsite Time statistics (all, milliseconds): 16
---------------------
------------------------------------------------------------
---------------
Name Site Rank Count Max Mean
Min App% MPI%
Allreduce 1 0 2 0.105 0.087
0.069 0.21 0.33
Allreduce 1 1 2 0.118 0.08
0.042 0.33 1.07
Allreduce 1 2 2 0.11 0.078
0.046 0.18 0.27
Allreduce 1 3 2 0.102 0.072
0.042 0.29 0.97
Barrier 1 0 3 51.9 17.3
0.015 61.86 99.44
Barrier 1 1 3 0.073 0.0457
0.016 0.29 0.91
Barrier 1 2 3 54.9 18.8
0.031 64.90 99.53
Barrier 1 3 3 1.56 1.02
0.035 6.20 20.68
Bcast 1 0 2 0.073 0.0535
0.034 0.13 0.20
Bcast 1 1 2 0.037 0.023
0.009 0.10 0.31
Bcast 1 2 2 0.084 0.046
0.008 0.11 0.16
Bcast 1 3 2 0.03 0.0275
0.025 0.11 0.37
Recv 1 1 1 14.6 14.6
14.6 30.48 97.71
Recv 1 3 1 11.6 11.6
11.6 23.37 77.98
Send 1 0 1 0.013 0.013
0.013 0.02 0.02
Send 1 2 1 0.02 0.02
0.02 0.02 0.04
Send 1 * 32 54.9 4.34
0.008 51.69 100.00
------------------------------------------------------------
---------------
@--- Callsite Message Sent statistics (all, sent bytes)
-------------------
------------------------------------------------------------
---------------
Name Site Rank Count Max Mean
Min Sum
Allreduce 1 0 2 800 600
400 1200
Allreduce 1 1 2 800 600
400 1200
Allreduce 1 2 2 800 600
400 1200
Allreduce 1 3 2 800 600
400 1200
Bcast 1 0 2 800 600
400 1200
Bcast 1 1 2 800 600
400 1200
Bcast 1 2 2 800 600
400 1200
Bcast 1 3 2 800 600
400 1200
Send 1 0 1 400 400
400 400
Send 1 2 1 400 400
400 400
Send 1 * 18 800 577.8
400 1.04e+04
------------------------------------------------------------
---------------
@--- End of Report

Jumpshot: MPI Visualization● If we need to see the exact sequence of
messages exchanged between processes.
● MPI tracing by relinking our application using the Jumpshot MPE libraries that can be used with any MPI.
● Jumpshot-3 included with MPICH 1.2.6.
● Jumpshot-4 is a separate release.
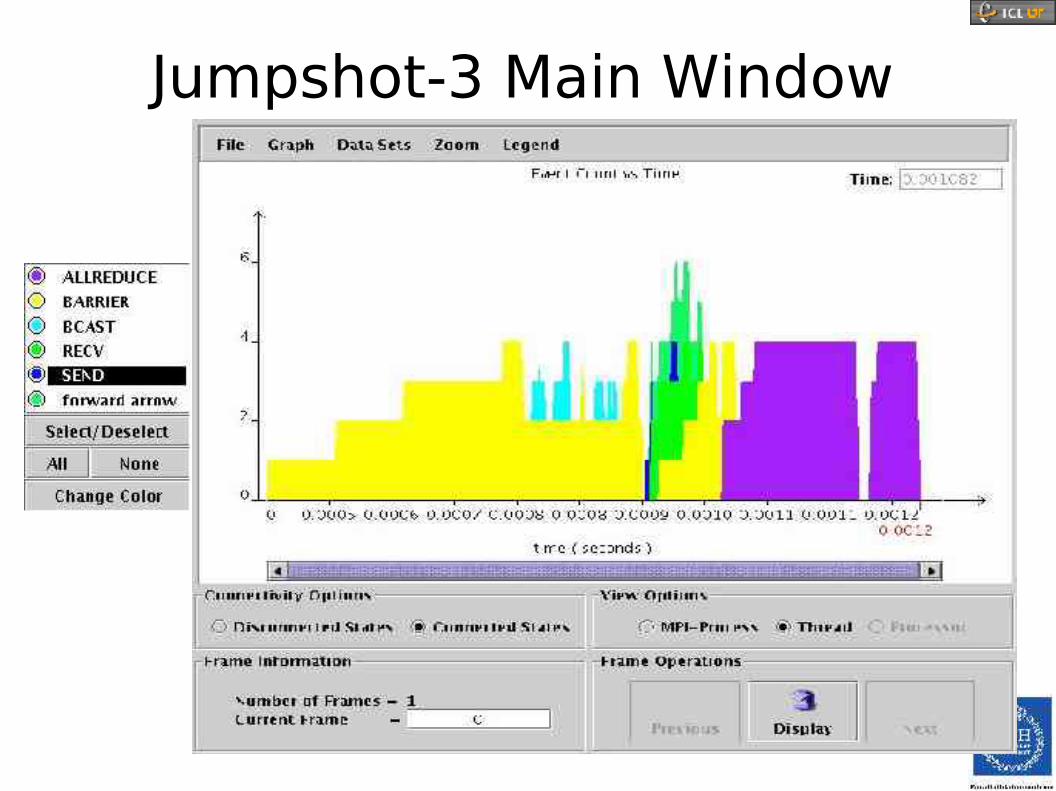
Jumpshot-3 Main Window
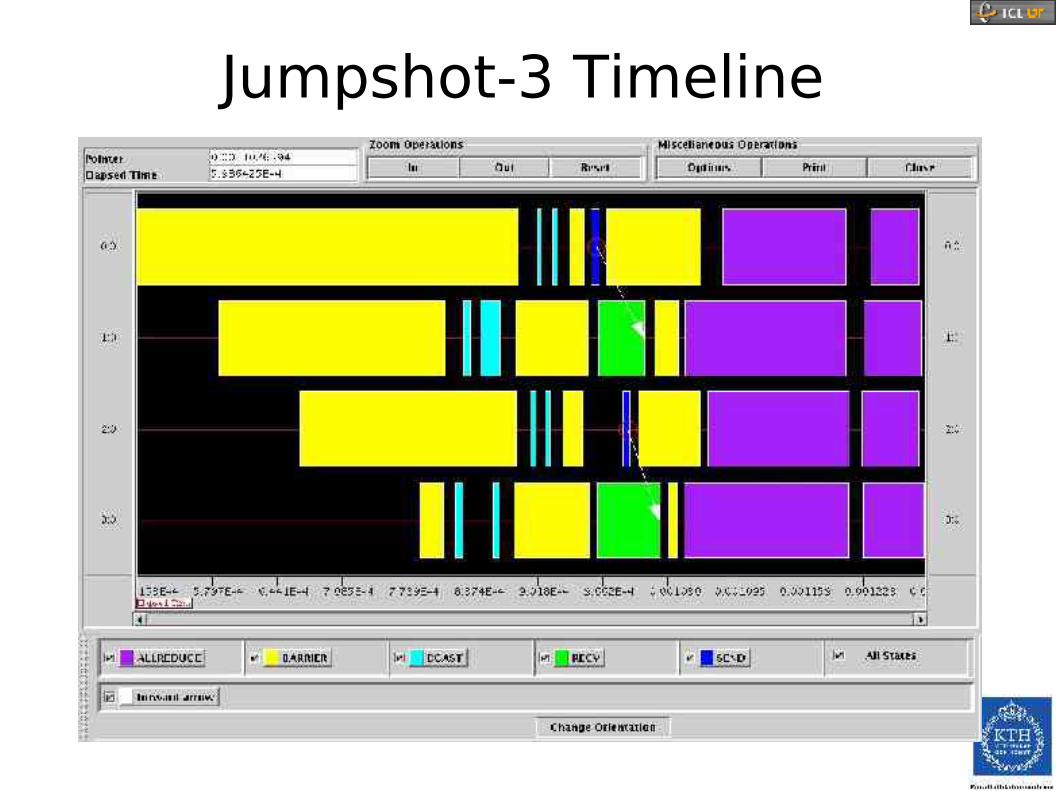
Jumpshot-3 Timeline
Performance Work at PDC● Long History of Focus on Performance
– Early use of Hardware Counters on the SP2 in Batch System for per CPU collection
● Collaboration with PAPI group from ICL/University of Tennessee
– Work on Itanium 2, Opteron port and involved in the design of PAPI 3
● Development of custom monitoring scripts for the Itanium 2 cluster: “Lucidor”.
● Performance Analysis and Optimization Workshop of 2003: Brought researchers in the field from all around Scandinavia
Site Wide Performance Monitoring at PDC
● Integrate complete job monitoring in the batch system itself.
● Track every cluster, group, user, job, node all the way down to individual threads.
● Zero overhead monitoring, no source code modifications.
● Near 100% accuracy.
Site Wide Performance Monitoring at PDC
● Allow performance characterization of all aspects of a technical compute center:
– Application Workloads
– System Performance
– Resource Utilization● Provide users, managers and administrators
with a quick and easy way to track and visualize performance of their jobs/system.
● Complete integration from batch system to database to PHP web interface.
● Motivated by work at PDC & NCSA.
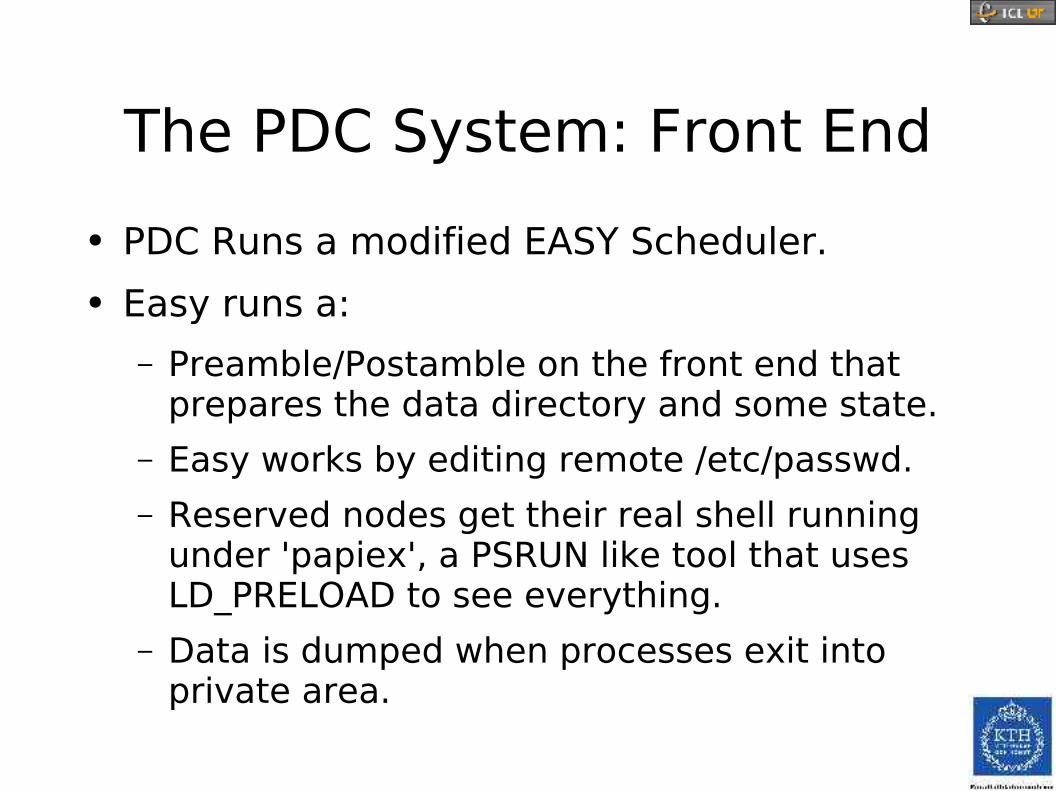
The PDC System: Front End
● PDC Runs a modified EASY Scheduler.
● Easy runs a:
– Preamble/Postamble on the front end that prepares the data directory and some state.
– Easy works by editing remote /etc/passwd.
– Reserved nodes get their real shell running under 'papiex', a PSRUN like tool that uses LD_PRELOAD to see everything.
– Data is dumped when processes exit into private area.
The PDC System: Back End
● Perl scripts walk the data directory and insert the data into a Postgres database using the DBI interface.
● Interface is run on webserver with PHP scripts and JPGraph.

PDC Performance MinerMain Window
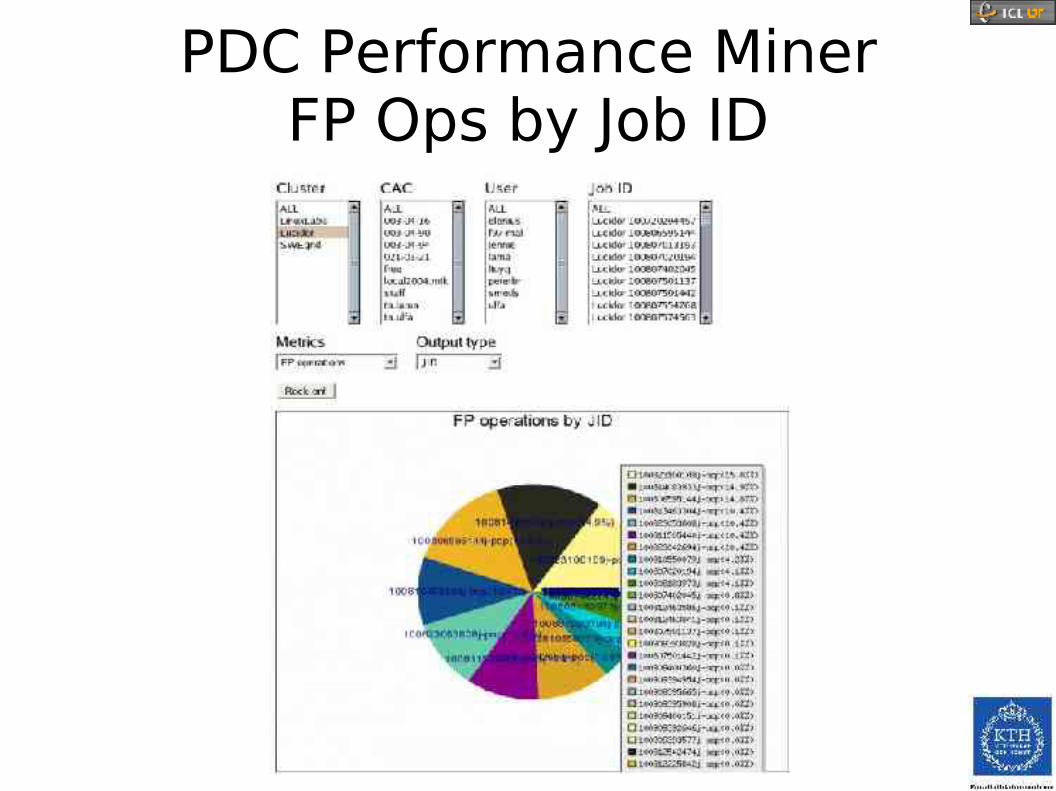
PDC Performance MinerFP Ops by Job ID
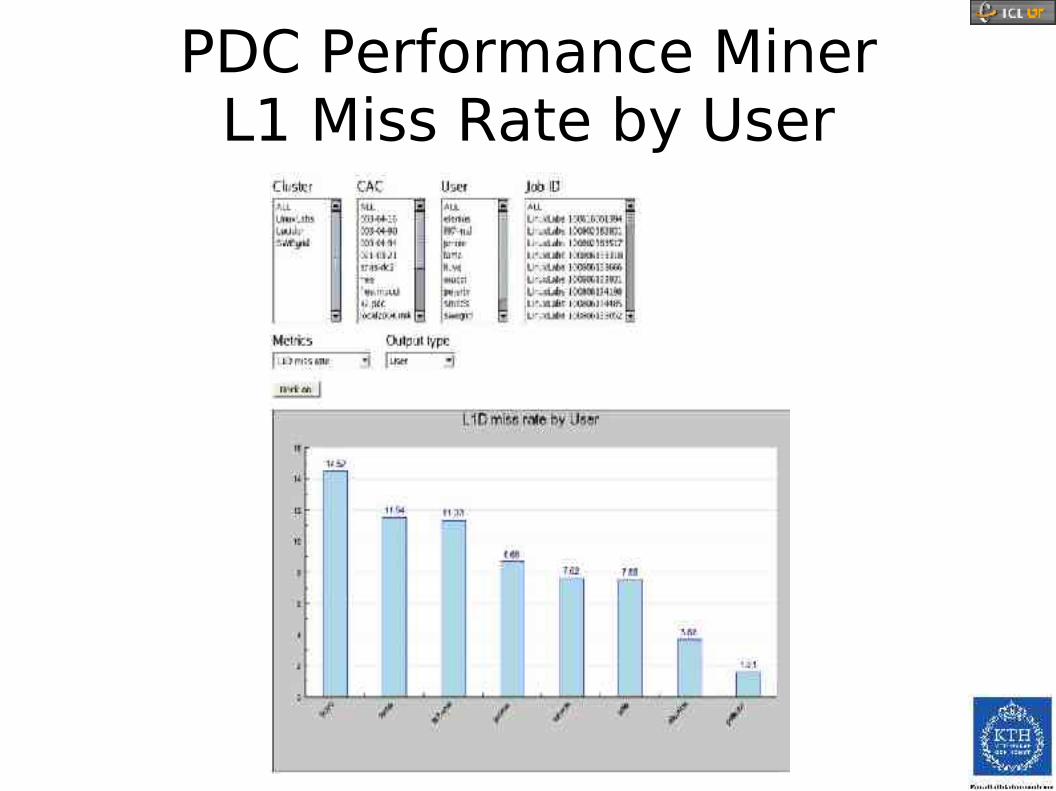
PDC Performance MinerL1 Miss Rate by User

PDC Performance MinerIPC by Process for SweGrid
IO Track Goals
● Understand application I/O patterns in order to:
– Direct optimization efforts for applications
– Direct system design and tuning
– Give a better understanding of I/O needs in general
● Provide an infrastructure for automatic I/O tuning
IO Track Overview
● IOtrack consists of three components:
– iowrap - A preloaded library that traps calls to libc and creates log-files for each process.
– logread - A tool to analyze iowrap log-files. (not yet finished)
– iotrack - A driver program.
Iowrap Internals
● iowrap traps I/O calls to libc using function replacement.
– File descriptor creation/close:● open/close/creat/dup/socket/accept/fcntl
– I/O on File descriptors:● read/write/readv/writev/send/recv/sendto
recvfrom/lseek/sendmsg/recvmsg
– Stream I/O● fopen/fclose/fdopen/fread/fwrite/fprintf/fscanf
● mmap-based I/O is not handled: If the user knows enough to use mmap, we probably don't need to help.

Logfile Format
● Currently ASCII, may change in the future.
0.607013:LIBRARY LOADED:pid 3082:ppid
3738:process /usr/bin/head:args /etc/passwd
0.607375:OPEN:new fd 4:/etc/passwd
0.607444:READ:fd 4:request size 4096:I/O size 4096
0.607480:LSEEK:fd 4:offset -3356:whence -1:new pos 1
0.607663:CLOSE:fd 4
0.607714:CLOSE:fd 3
Data from Log File
● Size of I/Os
● Which files are accessed?
● Location of I/Os within files
● I/O tracing withing files
● Redundant operations
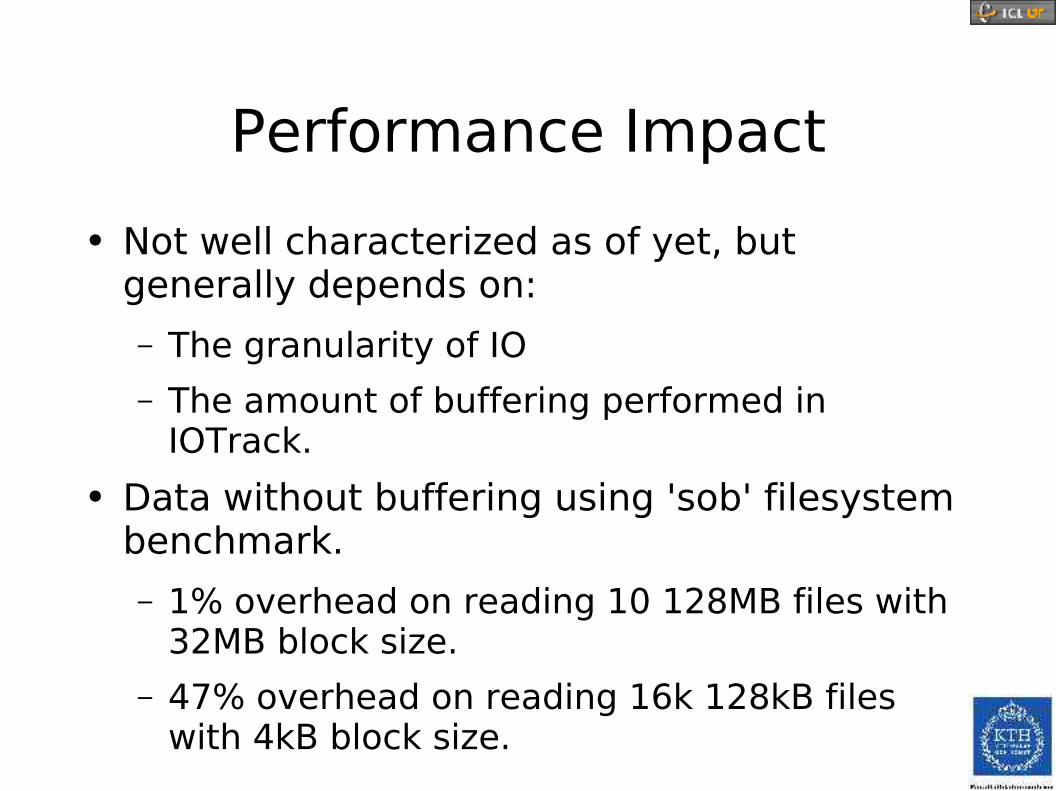
Performance Impact
● Not well characterized as of yet, but generally depends on:
– The granularity of IO
– The amount of buffering performed in IOTrack.
● Data without buffering using 'sob' filesystem benchmark.
– 1% overhead on reading 10 128MB files with 32MB block size.
– 47% overhead on reading 16k 128kB files with 4kB block size.

Gaussian03 C02 Datatest653
● Runtime is 31 minutes on 900Mhz Itanium2
● Profiling overhead was 3.5%
● 3 processes
– 29 executions of 15 binaries● 180 opens on 13 files
● Essentially all I/O goes to $GAUSS_SCRDIR, a temporary storage area on local disk
● Aggregate I/O is 14GB writes and 68GB reads
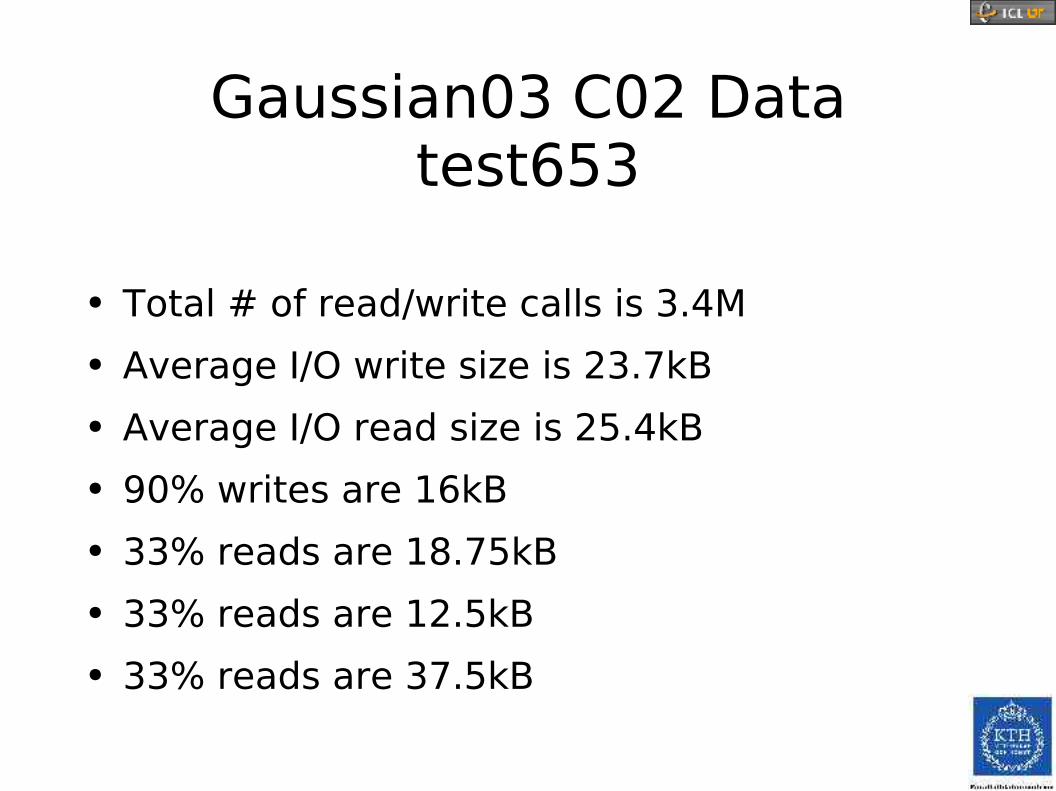
Gaussian03 C02 Datatest653
● Total # of read/write calls is 3.4M
● Average I/O write size is 23.7kB
● Average I/O read size is 25.4kB
● 90% writes are 16kB
● 33% reads are 18.75kB
● 33% reads are 12.5kB
● 33% reads are 37.5kB
IOTrack Information
● This is a work in progress!
● Developed as part of a SNIC project on storage led by NSC.
● Code at http://www.pdc.kth.se/~pek/iotrack
● Contact:
– Per Ekman, [email protected]
– Philip J. Mucci, [email protected]
Links
● PAPI
– http://icl.cs.utk.edu/projects/papi
– PerfCtr● http://user.it.uu.se/~mikpe/linux/perfctr/2.6
– Perfmon● http://www.hpl.hp.com/research/linux/perfmon
● IOTrack
– http://www.pdc.kth.se/~pek/iotrack● HPCToolkit
– http://www.hipersoft.rice.edu/hpctoolkit
Links
● PerfSuite
– http://perfsuite.ncsa.uiuc.edu● TAU
– http://www.cs.uoregon.edu/research/paracomp/tau/tautools
● MPIP
– http://www.llnl.gov/CASC/mpip● Jumpshot-4
– http://www-unix.mcs.anl.gov/perfvis/software/viewers
Credits
● PDC
– http://www.pdc.kth.se● ICL/UTK
– http://icl.cs.utk.edu● Additional work on PDC Performance Miner:
– Daniel Ahlin, Johan Danielsson, Lars Malinowski, Ulf Andersson, Nils Smeds
● Work funded in part by:
– US: DoE MICS, DoE SciDAC, NSF PACI Alliance
– Sweden: SNIC