Links between livestock production, the environment …_Documentation/docs... · Links between...
47
Rev. sci. tech. Off. int. Epiz., 2014, 33 (3), ... - ... No. 09102014-00044-FR 1/47 Links between livestock production, the environment and sustainable development This paper (No. 09102014-00044-FR) has been peer-reviewed, accepted, edited, and corrected by authors. It has not yet been formatted for printing. It will be published in December 2014 in issue 33-3 of the Scientific and Technical Review J.-P. Pradère World Organisation for Animal Health, 12 rue de Prony, 75017 Paris, France E-mail: [email protected] Summary This study examines the prospects for strong growth in the supply and demand of animal products worldwide, especially in developing countries, where 80% of the world’s population lives. Based on scientific publications, statistics and field observations, it reviews greenhouse gas emission levels from livestock, the ability of ruminant livestock systems to sequester carbon and the capacity of the livestock industry to meet the challenge of sustainable development and to share its benefits while minimising impacts to climate change. Special attention is paid to the situation of the 800 million livestock farmers in the world living at the extreme end of poverty. The study underlines the importance of improving livestock productivity and the interdependence of the economic, environmental and social components of sustainable development. It highlights how, in the least developed countries and most lower-middle-income countries, the pressure exerted by animal diseases hampers efforts to improve livestock productivity. Poor livestock farmers have not sufficiently benefited from development policies and need support to adopt technological advances to meet the challenges of sustainable development and poverty reduction. Keywords
Transcript of Links between livestock production, the environment …_Documentation/docs... · Links between...

Rev. sci. tech. Off. int. Epiz., 2014, 33 (3), ... - ...
No. 09102014-00044-FR 1/47
Links between livestock production, the environment and sustainable development
This paper (No. 09102014-00044-FR) has been peer-reviewed, accepted, edited, and corrected by authors. It has not yet been formatted for printing. It will be published in December 2014 in issue 33-3 of the Scientific and Technical Review
J.-P. Pradère
World Organisation for Animal Health, 12 rue de Prony, 75017 Paris,
France
E-mail: [email protected]
Summary
This study examines the prospects for strong growth in the supply and
demand of animal products worldwide, especially in developing
countries, where 80% of the world’s population lives. Based on
scientific publications, statistics and field observations, it reviews
greenhouse gas emission levels from livestock, the ability of ruminant
livestock systems to sequester carbon and the capacity of the livestock
industry to meet the challenge of sustainable development and to share
its benefits while minimising impacts to climate change. Special
attention is paid to the situation of the 800 million livestock farmers in
the world living at the extreme end of poverty. The study underlines
the importance of improving livestock productivity and the
interdependence of the economic, environmental and social
components of sustainable development. It highlights how, in the least
developed countries and most lower-middle-income countries, the
pressure exerted by animal diseases hampers efforts to improve
livestock productivity. Poor livestock farmers have not sufficiently
benefited from development policies and need support to adopt
technological advances to meet the challenges of sustainable
development and poverty reduction.
Keywords

Rev. sci. tech. Off. int. Epiz., 33 (3) 2
No. 09102014-00044-FR 2/47
Development policy – Environment – Greenhouse gas – Livestock
production – Livestock productivity – Poverty reduction – Sustainable
development.
Introduction
Importance of livestock for human well-being and the
future of our planet
World economic growth and the massive development of non-
agricultural industries and services have reduced the monetary share
of livestock production in the global economy. Nevertheless, this has
not diminished the importance of livestock for human well-being and
the future of our planet. Grasslands occupy more than one-quarter of
the world’s land surface, and one-third of cultivated land worldwide is
used to produce cereals, oilseeds or feed-crops for animals (1). Almost
one-fifth of the world’s population – 1.3 billion people – derive
income from livestock production (2) and 2 billion people use animals
to work the land or to transport goods (3). For 800 million poor
farmers living on less than US$1.25 a day, animals are of particular
attraction because they generate income, provide numerous benefits
and represent capital that can be mobilised to cope with agricultural
crises or life events.
Changing lifestyles have significantly reduced direct contact between
humans and farm animals; nevertheless, in biological terms, human
and animal health remain inextricably linked. Two-thirds of human
pathogens are pathogens that also affect animals, and the incidence of
emerging zoonotic diseases is on the rise, thus increasing the threat of
human pandemics.
Prospects for strong growth in animal production
worldwide
Humans have a strong natural behaviour to consume animal products.
For most people, an improvement in the quality of life goes hand in
hand with increased consumption of animal products. In the most
developed countries, where per capita consumption of animal products

Rev. sci. tech. Off. int. Epiz., 33 (3) 3
No. 09102014-00044-FR 3/47
is very high, recommendations aimed at stabilising or reducing
demand for such products mean that growth in the consumption of
milk and meat is on the wane. Conversely, in developing countries,
where 80% of the world’s population lives, demand for animal
products is soaring and, over the coming years, is likely to increase
further because of rising household purchasing power (especially
among those exiting poverty and entering the middle class) and
demographic growth.
Focus and objectives of the study
Thanks to advances in science and technology, animal husbandry has
the capacity for continued growth and increased production
worldwide. Today, the main challenge is to achieve sustainable
growth that is able to satisfy needs and contribute to the well-being of
present generations of people and animals, as well as to share the
benefits of growth and preserve the natural resources and ecosystems
on which future generations will depend.
This study accepts that increased production and consumption of
animal products is inevitable in developing countries. Using data from
scientific publications, statistics and field observations, it examines
the conditions for sustainable growth in livestock production in least
developed countries and in lower-middle-income countries1, where
87% of poor people live and where livestock farmers live in extreme
poverty.
Exaggerated accusations and environmental impacts revised downwards
In 2006, the report Livestock’s long shadow (4) made a number of
serious accusations about livestock, often alleging that they are the
main culprit for: water pollution; lowering water tables (because
animals compact the soil as they move around); soil degradation; acid
1 The country classification is based on that used by the OECD Development Aid Committee for granting
aid. In 2013, there were 49 least developed countries, 34 of them in sub‐Saharan Africa, and 40 lower‐middle‐income countries, all of which had a gross national income per inhabitant between US$1,006 and US$3,975. They included India, Nigeria and Pakistan.

Rev. sci. tech. Off. int. Epiz., 33 (3) 4
No. 09102014-00044-FR 4/47
rain; diminished wildlife and biodiversity; deforestation; and hazards
to human health. It also blames livestock for helping to degrade
coastal areas and destroy coral reefs, as well as being responsible for
37% of anthropogenic emissions of methane (CH4), 65% of
anthropogenic emissions of nitrous oxide (N2O) and 18% of total
anthropogenic greenhouse gas emissions. These accusations were
levelled particularly at extensive livestock systems.
Very few people have read all 390 pages of the report. Short excerpts
containing the most serious allegations were widely quoted in the
press, but the benefits of livestock and the improvement measures
cited in the report were not reported, thus helping to demonise
livestock production in the eyes of the public and of decision-makers
in least developed countries, lower-middle-income countries and
development agencies. This led to a collapse in aid and national
financing for the poorest farmers (see below, in particular Fig. 10),
which weakened animal production and aggravated the impact of
livestock on the environment and climate change (5) (Box 1).
Box 1 The greenhouse effect and greenhouse gas emissions from agriculture
Two-thirds of the sun’s rays reaching the Earth’s surface are absorbed. Under the effect of reverberation, the remaining one-third is returned to space in the form of infrared rays. However, the gases referred to as greenhouse gases, which accumulate in the lower atmosphere, act as a filter and block the passage of some of the infrared rays, which are then returned to the Earth and contribute to its warming.
Two-thirds of the greenhouse effect results from the absorption of heat by water vapour and clouds, while one-third results from the interaction of 40 or so greenhouse gases, including: carbon dioxide (CO2), methane (CH4), ozone (O3), nitrous oxide (N2O), hydrofluorocarbons (HFCs), perfluorocarbons (PFCs) and sulphur hexafluoride (SF6). The main greenhouse gases are naturally present in the atmosphere but, since the beginning of the industrial era, human activity has significantly increased their concentration.
According to the Intergovernmental Panel on Climate Change (IPCC), in 2010–2011, agricultural production was responsible for 5 to 5.8 Gt CO2-eq, or around 12%, of total anthropogenic greenhouse gas emissions, and the entire agriculture, forestry and other land uses (AFOLU) sector is responsible for 10 to 12 Gt of CO2-eq, or almost one-quarter of total anthropogenic greenhouse gas emissions (6).
CO2-eq: carbon dioxide equivalent; Gt: gigatonne (1 GT = 109 tonnes)

Rev. sci. tech. Off. int. Epiz., 33 (3) 5
No. 09102014-00044-FR 5/47
Since 2006, estimates of greenhouse gas emmissions from livestock
have been revised sharply downwards several times. In 2014, an
analysis conducted according to recommendations from the
Intergovernmental Panel on Climate Change (IPCC) concluded that
greenhouse gas emissions from livestock worldwide represented
around 28% of CH4 emissions, 29% of N2O emissions and 9% of total
anthropogenic greenhouse gas emissions (7). These new estimates, far
lower than in the Livestock’s long shadow report, were compared with
the estimates sent periodically by developed countries to the United
Nations Framework Convention on Climate Change (UNFCCC),
which confirmed their validity.
In addition, many studies have demonstrated that the allegations
against livestock production were exaggerated or unfounded,
highlighting in particular the low impact of livestock production on
deforestation (Box 2) and the benefits of pasture land for air quality,
the regeneration of water resources and the maintainence of wildlife
and biodiversity (see below).
Box 2 The impact of livestock production on worldwide deforestation is declining
The rate of deforestation has diminished on every continent, from 16 million hectares in the 1990s to less than 10 million hectares in 2012. The most spectacular results have been achieved in Brazil, where government measures have curbed deforestation and the spread of sugar cane plantations (for bioethanol production) and soy (for animal feed). According to Nepstad et al. (8), deforestation in Brazil has been reduced by 70% since 2008 and stood at around 0.45 million hectares in 2012.
In 2012, the two main regions affected by deforestation were equatorial and southern Africa, with 3 million hectares of forest destroyed, and Indonesia, with 2.1 million hectares of forest destroyed. In Africa, deforestation is widespread and often caused by poor peasants gathering fuelwood and who need agricultural land to plant crops. In Indonesia, deforestation stems from industrial planting of crops such as oil palm and from the timber trade. In Brazil, residual deforestation is caused by small farmers clearing trees to extend their crops onto more fertile land. The departments responsible for forest protection now rely on mixed crop/livestock farming to maintain soil fertility and ensure the sustainable development of agriculture on land already cleared, thereby avoiding further slashing and burning.
Source: Malhi et al. (9), Nepstad et al. (8) and Margono et al. (10).

Rev. sci. tech. Off. int. Epiz., 33 (3) 6
No. 09102014-00044-FR 6/47
However, the studies that might have restored the reputation of livestock farming did not enjoy the same media attention as the Livestock’s long shadow report, and alarmist messages prejudicial to the implementation of sustainable livestock development continue to be broadcast.
Evaluating emissions and the capacity of livestock systems to sequester carbon
The instructions of the IPCC state that estimates of greenhouse gas
emissions must include all sources, as well as all sinks of greenhouse
gases associated directly or indirectly with a product or service. An
evaluation of the contribution of livestock production to greenhouse
gas emissions therefore entails a balance-sheet approach that takes
into account the offsetting allowed for carbon sequestration.
Assessment of the environmental impact of greenhouse gases is
generally based on a life cycle analysis. For the low-input/low-output
livestock systems adopted by many poor farmers (see Box 3), life-
cycle analysis may be confined to assessing the greenhouse gases
emitted directly by animals and their dung, because such systems
consume no fossil fuels and use virtually no inputs.
Box 3
The main greenhouse gases generated by agriculture
Carbon dioxide (CO2) represents around 70% of anthropogenic greenhouse gas emissions. It is produced mainly by burning fossil fuels (oil, coal) and biomass. Photosynthesis helps to offset CO2 flows. On balance, the net flow of CO2 emissions is very low (11).
The volume of nitrous oxide (N2O) emissions is much lower than for CO2, but its ability to trap heat is 298 times greater than that of CO2. Agricultural N2O (from animal effluents, crop residues and agricultural fertilsers) is produced in the soil or in liquids when an aerobic biological process turns ammonia into nitrates and the nitrates are then turned into nitrogen gas (N2) by anaerobic denitrification.
Methane (CH4) is produced mainly by enteric fermentation, a stage in the ruminant digestion process, and by irrigated rice crops. Its ability to trap heat is 25 times greater than that of CO2.
In most regions of the world, N2O is the main source of agricultural greenhouse gases. CH4 is the main source of agricultural greenhouse gases in only a few regions: Latin America, Eastern Europe, Central Asia (owing to large-scale rice growing) and in the OECD countries of Oceania.

Rev. sci. tech. Off. int. Epiz., 33 (3) 7
No. 09102014-00044-FR 7/47
The calculation of greenhouse gas emissions takes into account the global warming potential of the main gases. Estimates must include all sources and all sinks of greenhouse gases associated directly or indirectly with a product or service. The total volume of emissions of these gases is expressed as a CO2 equivalent (CO2-eq), using the formula:
kg CO2-eq = kg CH4 × 25 + kg N2O × 298 + kg CO2.
Types of livestock greenhouse gas emissions
Enteric fermentation
According to Gerber et al. (12), because enteric fermentation produces
heat-trapping methane, cattle account for a total of 71% of the
greenhouse gases generated by the livestock sector, and small
ruminants for around 7%. Pigs and poultry, which provide more than
three-quarters of the world’s meat, together produce less than 20% of
greenhouse gases. The estimates of Caro et al. (7) are comparable,
although they apportion a slighter higher share of livestock emissions
to cattle (74%) (Fig. 1; Box 4).
Box 4
Enteric fermentation
Ruminants have a very special digestion process called enteric fermentation, which takes places in the rumen under aerobic conditions, enabling them to transform cellulose-rich food into milk or meat with a high nutritional value.
During the digestion phase, bacteria break down the plant matter into fatty acids, CO2 and CH4. The fatty acids are absorbed into the bloodstream, while non-fermented food and microbial cells pass through the intestine and the gases (including methane) are removed by eructation.
The quality of feed is very important. When rations contain less
cellulose, more energy and proteins and are more digestible, the part
played by enteric fermentation in digestion is reduced, as are methane
emissions.
In extensive livestock systems, animal dung produces little
methane
In extensive livestock systems, animal excrement is dropped on the
ground. The CH4 generated by dung is negligible when there is no

Rev. sci. tech. Off. int. Epiz., 33 (3) 8
No. 09102014-00044-FR 8/47
storage in a confined space and no anaerobic fermentation (13, 11).
According to IPCC standards (13), at an average temperature of 25°C,
the average level of CH4 produced by dairy cattle manure is 98 kg a
year in North America, where animal dung is often processed in liquid
form, but only 1 kg a year in Latin America and Africa where
ruminant livestock systems are usually extensive (Table I).
In extensive livestock systems, N2O emissions are less than the
global average
The volume of N2O emissions depends on manure storage conditions,
temperature, type of soil, rainfall and other factors. In faeces the
nitrogen is largely organic. It must first be mineralised in an aerobic
environment and then denitrified in an anaerobic environment (in a
confined space or in the soil) before becoming a source of N2O. When
dung is deposited on the ground in areas with heavy rainfall,
mineralisation can be rapid but, in dry regions, it breaks down much
more slowly and the faeces can remain intact on the ground for
months.
There are very few studies concerning N2O emissions from pastoral
farming systems in arid zones. The few results available vary widely.
Gerber et al. have estimated that N2O emissions from animal dung
account for around 33% of total emissions from cattle in sub-Saharan
Africa (12). According to an estimate of greenhouse gas emissions in
Australia, under climatic conditions similar to those in sub-Saharan
Africa, in 2012, the amount of N2O emitted by animal dung on the
ground was three times smaller than the amount produced by
grassland fires, ten times smaller than that producd by crop fertilisers,
and represented only 3% of the total N2O emmissions from livestock
(14).

Rev. sci. tech. Off. int. Epiz., 33 (3) 9
No. 09102014-00044-FR 9/47
Capacity of ruminant livestock systems to sequester
carbon and prevent greenhouse gas emissions
Carbon sequestration on pasture land
Grazing land acts as a carbon sink that can sequester a large
proportion of greenhouse gas emissions from livestock. According to
Ronald and Debbie (15), cattle grazing land captures 20% of the CO2
released into the atmosphere by deforestation and agriculture
worldwide. In Europe, grasslands are net sinks of CO2, storing 500 kg
to 1,200 kg of carbon per hectare. In addition, good pasture
management and hedgerow maintenance offset 24% to 53% of
emission levels, depending on the production system (16, 17). Leip et
al. (18) demonstrated that plant consumption by animals reduces the
amount of reactive nitrogen available in the soil by 30% to 40%,
thereby limiting the production of N2O.
Consumption of coarse agricultural by-products prevents
biomass burning
In many African countries there are formal contracts between
livestock owners and arable-land farmers under which animals are led
onto croplands immediately after the harvest to eat the coarse residues
of crops (corn, millet and sorghum stubble, leguminous haulm, etc.)
and, in exchange, to fertilise the soil. Animal consumption of
agricultural residues that would otherwise have been burned can
prevent the emission of 15 kg to 25 kg of CH4 per hectare from field
residues2.
Contribution to reducing bush fires and protecting shrub
savannah
By reducing the savannah ground cover, ruminants prevent or reduce
the severity of periodic bush fires, thereby preventing the destruction
2 One kilogram of burned corn stover emits 2.7 g of CH4 and 1 ha of corn stover represents 10 t of dry
matter; 1 kg of burned grass savannah emits 2.3 g of CH4 and 1 ha of savannah represents around 6 t of dry matter. When assessing greenhouse gas balances, the emissions from dung on the ground should be offset against the crops they fertilise (13).

Rev. sci. tech. Off. int. Epiz., 33 (3) 10
No. 09102014-00044-FR 10/47
of trees and shrubs by fire and the emission of at least 13 kg of CH4
per hectare of burned savannah (Box 5).
Box 5
Production of greenhouse gases by bush fires
Fire contributes to climate change in many ways. It releases very large quantities of
CO2, CH4 and, to a lesser extent, N2O. Fires generate emissions of hydrocarbons
and reactive nitrogen, which reacts to form ground-level ozone, a powerful
greenhouse gas. In addition, large fires produce a variety of aerosols and smoke that
play a role in preventing certain kinds of radiation from leaving the atmosphere.
Lastly, they reduce the Earth’s surface albedo for several weeks, which contributes
to global warming.
In the savannah covering around one-eighth of the Earth’s surface, the impact of
bush fires on global warming differs widely, depending on whether the fires affect
woody layers or grass cover. Reducing the intensity of bush fires by grazing usually
leads to an increase in tree and shrub cover, creating CO2 sinks in soil and biomass.
In tropical regions where annual rainfall exceeds 500 mm per year and
where grasses compete with shrubby vegetation for soil use, the
presence of animals weakens grass cover and the intensity of bush
fires. First, this promotes shrubs and, second, the replacement of
shrubs with non-fire-resistant woody plants, thereby boosting the
establishment of shrub savannah and carbon storage capacity.
Draught power
In all least developed countries and middle-income countries, animals
provide a cheap source of renewable energy. They help with farm
work and transportation and play a key role in the rural economy. Two
billion people use animals to work the land or to transport goods. In
some countries, a huge proportion of animals are used for their labour.
In Bangladesh, 90% of adult cattle are used for both farm work and
transportation (3).
In 2009, 60% of India’s land was ploughed by animals, 20% by hand
and 20% using tractors. The power provided by India’s 83 million
draught animals, fed mainly on agricultural by-products, has been

Rev. sci. tech. Off. int. Epiz., 33 (3) 11
No. 09102014-00044-FR 11/47
estimated at 30,000 megawatts – the equivalent of 50% of India’s
power generation capacity. Without draught animals, ploughing would
require five times as many tractors and the use of 20 million tonnes of
diesel fuel, which would release 60 million tonnes of CO2 (19, 20).
Methods for calculating greenhouse gas emissions should
be adapted for extensive livestock production
All researchers point to the particularities of calculating carbon
emission and sequestration and the huge differences arising from
farming methods, soil types and climate. This wide variability makes
it risky to use local observations as the basis for constructing models
for calculations on a wider scale. Furthermore, in tropical countries
there is little understanding of carbon sequestration capacity and the
types of greenhouse gas emissions prevented by livestock. It is vital to
take them into account and this warrants more detailed assessments in
the regions concerned.
In least developed countries and middle-income countries, the
technical difficulties of estimating greenhouse gas emissions are
compounded by the diversity of livestock’s economic and social
functions. Udo and Steenstra (21) note that estimates invariably
attribute all greenhouse gas emissions to consumable animal products
and overlook the non-consumable outputs that benefit poor farmers
(livestock are a source of labour and manure, and they represent
capital that can ensure the survival of a household during a farming
crisis) (see below). While this method of calculation is fine for
developed countries, it is unsuitable for countries where animals
provide numerous services and social functions for hundreds of
millions of poor farmers, and where crops often account for less than
half the total value of animal production.

Rev. sci. tech. Off. int. Epiz., 33 (3) 12
No. 09102014-00044-FR 12/47
Combined effect of improved livestock productivity on human well-being and the environment
Strong correlations between productivity, poverty and the
impact of livestock on climate change
Improving productivity3 makes it possible to produce equal amounts
of outputs using fewer inputs (fewer animals, less cattle feed or less
grazing, and, generally, less labour). The effects of improved
productivity are wide-ranging. They may be economic, through better
use of investments and inputs. They may also be environmental
because, at the same level of production, greenhouse gas emissions
and the pressure of livestock on natural resources diminish. Finally,
improved productivity requires better animal husbandry, welfare and
health, which in turn reduces the impact of zoonoses.
A statistical analysis of a series of variables representing poverty
reduction and enhanced livestock performance (intensive growth) in
the world’s major regions shows strong positive correlations (the
variables vary in the same direction). Poultry are an exception,
because increasingly they are produced intensively by ‘rich’ farmers
and the correlation with poverty reduction (0.2) is weak. The analysis
also shows strong negative correlations (the variables vary in the
opposite direction) between the series of variables representing
livestock performance and greenhouse gas emissions. In other words,
any improvement in livestock performance corresponds to a reduction
in greenhouse gas emissions (Table II).
Improved agricultural productivity is the main driver of
poverty reduction
In the 19th Century, improved agricultural productivity underpinned
growth in the major economies (including the United States [USA],
Japan and Europe) and, more recently, in the major emerging
3 The term ‘productivity’ is used here in the physical sense [volume] and refers to the technical performance of livestock production.

Rev. sci. tech. Off. int. Epiz., 33 (3) 13
No. 09102014-00044-FR 13/47
countries (24, 25). No country has succeeded in alleviating rural
poverty without improving the productivity of its agricultural sector
(26, 27).
In countries where agriculture is the main source of employment and
income for poor people, agricultural growth contributes significantly
more to reducing poverty than growth in other sectors, partly because
it is difficult to transfer the income generated in one economic sector
to another. As a result, poor people derive greater benefits from
growth if it occurs in their own sector (28, 29). In addition, agriculture
is highly labour intensive. Growth in agriculture helps to provide jobs
for low-skilled workers, create wealth, and deliver commodities to
promote growth in local manufacturing and non-agricultural jobs (30,
31) (Fig. 2).
Montalvo and Ravallion (32) showed that, in China, improved
agricultural productivity has been the main driver of poverty
reduction. They conclude that the idea that the secondary sector
(manufacturing) and tertiary sector (services) have played a role in
fighting poverty is debatable because of the lack of data demonstrating
the influence of these two sectors on growth (Box 6).
Box 6
Intensive and extensive growth in livestock production
Poverty has been driven back in countries that have succeeded in improving
livestock productivity. Conversely, it has stagnated in countries where growth in
livestock production has been largely extensive (see Figs 2 and 5). This is because
of the different characteristics of these two forms of growth. Improving productivity
makes it possible to produce more by making better use of inputs and, in particular,
by giving farmers a better return on their work. On the other hand, growth in
extensive production requires greater use of inputs (more animals, requiring more
pasture and more labour) but it fails to make better use of inputs and, in particular,
does not give farmers a better return on their work. As a result, farmers’ incomes
stagnate. In other words, extensive growth may create jobs if new farmers enter the
sector but it does not lead to a significant reduction in poverty.

Rev. sci. tech. Off. int. Epiz., 33 (3) 14
No. 09102014-00044-FR 14/47
According to Pica et al. (33), livestock sector development has a
unique ability to reduce poverty and contribute to economic growth.
Basing their observations on data from 66 developing countries, these
authors found a statistically significant causal relationship between
livestock development and economic growth in 36 of the 66 countries
studied. In 33 countries, development in livestock production seems to
be (or to have been) an engine of growth in per capita gross domestic
product (GDP). Livestock productivity seems to be (or to have been)
driven by growth in per capita GDP in only three countries. According
to the authors, the unique ability of livestock productivity to reduce
poverty and contribute to economic growth stems from its indirect
benefits for the productivity and marketing of agricultural products (in
the form of organic manure and transport) and for human health (by
reducing zoonoses and improving nutrition), as well as from the use of
animals to accumulate capital, making it easier to escape from
poverty.
Livestock’s ability to help build wealth is crucial to reducing poverty.
Experience in East Asia shows that rural household assets promote the
creation of non-farm rural employment and facilitate the urban
integration of households leaving farming (31).
Greenhouse gas emissions from livestock fall when
productivity improves
According to Caro et al. (7), between 1961 and 2010, greenhouse gas
emissions from livestock fell by 23% in developed countries where
there were massive productivity gains. On the contrary, they rose by
117% in developing countries where, at least in some regions,
productivity gains were low.
Higher productivity and lower greenhouse gas emissions from
livestock in developed countries
The estimates that developed countries submit periodically to the
UNFCCC confirm a continuing reduction in greenhouse gas emissions
from livestock. In developed countries, emissions from livestock
peaked in the 1970s. Since then they have fallen and the pace of

Rev. sci. tech. Off. int. Epiz., 33 (3) 15
No. 09102014-00044-FR 15/47
decline accelerated in the mid-1990s (7). With the exception of
poultry, production of which has soared worldwide, livestock numbers
in developed countries are falling. Nevertheless, continuing
productivity gains have led to steadily rising livestock production
volumes. Between 1981 and 2012, the number of pigs in Western
Europe fell by 4%, while output increased by 20%. During the same
period, in North America, the number of cattle decreased by 22%,
while beef production increased by 13% (23).
In 2011, greenhouse gas emissions in Canada, Australia, the USA and
Europe (including land use change) were estimated at 20, 25, 26 and
32 kg CO2-eq (carbon dioxide equivalent) per kg of carcass weight,
respectively. In developed countries, CO2-eq emissions for milk were
0.8 to 1.2 kg CO2-eq per kg of milk (17, 34, 35). In Europe and the
USA, improved performance was the leading factor in reducing
greenhouse gas emissions from livestock.
Low productivity and higher greenhouse gas emissions from
livestock in low-income countries
The situation in developing countries is very mixed. Emerging
countries such as China and Brazil have improved productivity and
achieved performances close to those of developed countries. Least
developed countries and large middle-income countries, such as
Nigeria and Pakistan, have low productivity levels, resulting in higher
emissions (Figs 3, 4 and 5).
What is the outlook for livestock numbers and production levels by 2050?
Strong growth forecast for livestock production worldwide
Between 1961 and 2012, global meat production grew by a factor of
four, from 71 million tonnes (Mt) to around 300 Mt, while milk
production more than doubled from 344 Mt to 740 Mt (23). According
to estimates by the Food and Agriculture Organization of the United
Nations (FAO), in 2050, global meat production is expected to rise to
455 Mt (50% more than in 2012), milk production to 1,077 Mt (45%

Rev. sci. tech. Off. int. Epiz., 33 (3) 16
No. 09102014-00044-FR 16/47
more than in 2012) and egg production to 102 Mt (45% more than in
2012) (36) (Figs 6 and 7).
The FAO forecasts that, by 2050, growth in the main animal products
is likely to still be greater than global population growth. By 2050, it
is estmated that there will be 9.5 billion people on the planet (37). For
meat, per capita annual consumption is expected to rise from 36 kg to
48 kg (+33% compared with 2012) and, for milk, from 101 kg to
114 kg (+13%).
Thanks to productivity gains, by 2050, greenhouse gas
emissions from livestock are expected to decrease
worldwide, except in least developed countries and some
lower-middle-income countries
Average annual growth in meat production of 1.2% between 2010 and
2050 would be sufficient to achieve the forecasted volumes by 2050.
Between 1981 and 2012, worldwide growth in the off-take ratio for
pork (the main meat consumed) and chicken meat, far exceeded this
value (Table III). If productivity were to continue to rise at this rate, it
would be enough to meet the needs of the global population without
increasing the number of animals.
The problem is that global averages mask major regional differences.
Latin American and East Asian countries have already made
substantial progress. Nevertheless, there is still plenty of scope for
improving productivity (Fig. 4), especially in pork and beef
production. In these countries, the decline in greenhouse gas
emissions is expected to be boosted by household consumption of a
growing proportion of monogastric meat.
In developed countries, productivity gains have slowed but needs have
barely increased. Under the terms of the Kyoto protocol4, developed
countries are required to continue reducing greenhouse gas emissions
from livestock.
4 The Kyoto Protocol target for 2008–2012 requires a reduction in the emissions of six greenhouse gases (carbon dioxide, methane, nitrous oxide and three substitutes for chlorofluorocarbons) by at least 5% compared with 1990 levels.

Rev. sci. tech. Off. int. Epiz., 33 (3) 17
No. 09102014-00044-FR 17/47
Least developed countries, especially those in sub-Saharan Africa, and
large lower-middle-income countries such as Nigeria and Pakistan, are
a special case. Although their consumption of animal products is
relatively low (17 kg of meat and 44 litres of milk per capita in sub-
Saharan Africa in 2011), demand is rising because of strong
population growth and greater purchasing power. Productivity gains
are very low owing to weak sectoral policies and pressure from animal
diseases (Table III). As a result, in order to meet growing demand,
imports are rising and growth in local production is largely extensive,
achieved by increasing the number of animals, with few productivity
gains (see Box 6 and Fig. 4). In least developed countries, cattle
numbers have been rising twice as quickly as in the rest of the world
and the number of sheep and goats, three times as fast (Fig. 8). Unless
sectoral policies are adopted to achieve productivity gains, greenhouse
gas emissions will continue to increase.
Conditions for improving livestock productivity
Government support is vital to trigger an improvement in
agricultural productivity
Using meta-analyses, Latruffe (38) and the Organisation for Economic
Co-operation and Development (OECD) (39) have shown that the
most powerful determinants of productivity are the quality of
government interventions (sectoral policies, including those on animal
health, research and development, and infrastructure), the quality of
the natural environment (climate and soil fertility), market conditions
(strength of demand) and the level of commercialisation of farms
(commercial farming as opposed to subsistence farming). In the
specific case of livestock, improving productivity also means
improving the systems for preventing and treating animal diseases,
especially transmissible diseases, to secure investments and product
sales. With the exception of the level of commercialisation, the most
powerful determinants of productivity are outside the control of
livestock producers. This would explain, at least in part, the low
productivity levels in countries where sectoral policies are weak and
there is very little support for livestock production, and the high

Rev. sci. tech. Off. int. Epiz., 33 (3) 18
No. 09102014-00044-FR 18/47
productivity levels in countries where livestock farming receives
strong government support.
Animal diseases are a barrier to improving livestock
productivity
‘Animal health is a prerequisite for higher productivity. Investment in
animal husbandry, whether in nutrition, animal genetics or housing,
may become profitable provided the risk of high-impact livestock
disease has first been contained’ (40).
Direct effects of improved animal health on greenhouse gas
emissions
Very few studies specify the direct effects of animal diseases on
greenhouse gas emissions. One of the rare studies on the subject was
carried out by researchers and field veterinarians in the United
Kingdom (41). The study assessed the impact of 15 endemic diseases
and physiological disorders of dairy cattle (mastitis, lameness,
infertility, etc.) on greenhouse gas emissions. The results showed that,
when animals are healthy, they produce an average of 3.8% more milk
(7,831 litres compared with 7,539 litres a year) and, in parallel, emit
1.6% less CO2. The adoption in the United Kingdom of a programme
to reduce by 50% the impact of the 15 diseases studied would reduce
emissions of CO2 by 669 kilotonnes (kt) a year, equivalent to 5% of
dairy cattle emissions. For the most important diseases, the
programme would also have a positive effect on the profitability of
livestock farming. In addition, performance gains would reduce the
number of dairy cows by 83,000 (out of a total of 1.8 million).
Conversion of the released pasture land to woodland would allow 207
to 1,077 kt CO2-eq to be sequestered per year, depending on the type
of woodland. Overall, livestock performance gains from improved
control of the 15 diseases studied could reduce the carbon footprint
from British dairy farming by 7% to 13%.
The above example concerns a developed country with a favourable
animal health context. In countries where animal health conditions are

Rev. sci. tech. Off. int. Epiz., 33 (3) 19
No. 09102014-00044-FR 19/47
dire, a programme to control animal diseases by reducing animal and
production losses would have a much greater impact.
In least developed countries and most lower-middle-income
countries, animal diseases lead to wasted resources and are a
constraint on technological progress
In least developed countries, annual mortality rates in traditional
village livestock systems average 20% to 22% of calves, 6% to 7% of
adult cattle, 22% to 24% of lambs and kids, 15% of adult sheep and
goats, 40% to 50% of piglets and 50% of chickens aged 0 to 6 months
(World Organisation for Animal Health, unpublished data). Moreover,
even when they do not kill, diseases weaken animals and affect their
performance, resulting in animal production losses of up to 50% (42).
Apart from wasting resources, the incidence and severity of animal
diseases in least developed countries and most lower-middle-income
countries make them a serious risk, which dissuades farmers from
specialising in livestock and making the necessary investments to
improve their productivity. It also cripples foreign investment.
Animal disease risk is preventing poor farmers from developing
monogastric livestock farming
In 2012, three-quarters of global meat output was from pigs and
poultry, which emit only small quantities of greenhouse gases (Fig. 1),
while in least developed countries ruminants remain the main source
of meat, accounting for 60% of total meat production in 2012.
Because of pressure from animal diseases, poor farmers are unable to
participate in the development of monogastric livestock farming
(Box 7). Wealthier farmers have the ability to reduce disease risk by
isolating their animals from external pathogen threats and engaging
the services of veterinarians. They manage to set up intensive
livestock units for poultry and sometimes for pigs (in southern Asia),
often near cities. As demand is strong, they can incorporate the costs
of risk prevention and treatment into their production costs. On local
markets, products from factory farms compete with those of poor
farmers. In a context of poor animal health with inefficient Veterinary

Rev. sci. tech. Off. int. Epiz., 33 (3) 20
No. 09102014-00044-FR 20/47
Services, animal disease risk is also a factor of social inequality and
contributes to marginalisation of the poorest farmers.
Box 7
Low-input/low-output livestock systems
Poor livestock farmers usually employ low-input/low-output livestock systems, with
ruminants capable of making use of vast expanses of arid land and coarse
agricultural by-products, or with monogastric animals (poultry, pigs) that are able to
find food for themselves: kitchen waste, crop residues, insects and wild grains.
For highly risk-averse poor farmers, low-input/low-output systems are of great
economic interest because they require no investment and use very few inputs.
Although the animals do not produce much, they do offer many benefits and
represent capital that can ensure the survival of a household during a farming crisis
and help it to cope with life events.
Low-input/low-output livestock systems are suitable for ruminants or hardy
monogastric breeds. However, they do not allow the development of genetically
improved and profitable monogastric livestock, which require feed rich in energy and
protein. Good quality rations are expensive, and the genetic characteristics of the
indigenous monogastric breeds, which are hardy breeds, make them unable to use
such rations profitably5.
Genetically enhanced monogastric breeds, which perform much better, are also
much less resistant to endemic diseases and require hygiene conditions that poor
farmers are unable to provide.
5 In traditional village livestock farming systems in Africa, chickens achieve their sale weight at around six months. Half die before that age. Under intensive systems, genetically improved chickens achieve their sale weight at seven or eight weeks and less than 4% die before this age.

Rev. sci. tech. Off. int. Epiz., 33 (3) 21
No. 09102014-00044-FR 21/47
Poor farmers do not derive enough benefit from
development policies
Livestock enjoys significant support in developed countries
In developed countries, the agricultural sector receives support6 and
strong productivity gains have been achieved thanks to substantial
government assistance. The livestock share in agricultural GDP is
very high, often close to 50%, and agricultural support is distributed
equitably between crop and livestock production. In the late 1980s,
support for farmers in OECD countries represented around 37% of the
total value of agricultural products at the farm gate. Although support
has dwindled since then, it was still worth US$258 billion in 2012, or
19% of the total value of farm products (43).
In East Asia, institutional reforms and substantial government
support have improved agricultural productivity and reduced
poverty significantly
The countries of East Asia, which have provided strong support to
agriculture, are those that have achieved the best results in reducing
poverty. In China, poverty fell from 77% to 10% between 1981 and
2012.
In parallel with major sectoral reforms, China’s support for agriculture
had risen to 17% of the value of agricultural production in 2011. This
exceptionally high level for a middle-income country accounted for
3.7% of national GDP, far more than in the OECD countries (0.9% of
GDP in 2011). The livestock sector was a major beneficiary of this
support. Livestock production grew faster than crop production and
contributed to the diversification of rural incomes. Growth in
agricultural productivity has been compatible with maintaining a big
rural population (50%) and a large number of farms. In 2012, there
6 Agricultural support includes support for producers, support for consumers and support for general services such as research, infrastructure and agricultural training.
Rev. sci. tech. Off. int. Epiz., 33 (3) 22
No. 09102014-00044-FR 22/47
were 200 million farming households in China. The average farm size
was 0.65 hectares (44, 31).
Weak sectoral policies and the collapse of government support
for poor farmers in least developed countries and lower-middle-
income countries
Despite its economic and social importance, livestock farming has
been the biggest loser in both the changing international aid strategies
and the economic policies of the poorest countries.
Up until the 1980s, the governments of most least developed countries
provided significant support for livestock production. However, the
introduction of structural adjustment policies in the 1990s led to the
rapid withdrawal of public Veterinary Services from the field, even
though there were not enough private operators capable of taking
over. This led to the sudden cessation of many services provided to
farmers (mass vaccination, veterinary clinics, etc.), with serious
consequences for livestock sector performance (40).
In the early 2000s, the Poverty Reduction Strategy Papers (PRSP)
initiative and the priority given to achieving the Millennium
Development Goals, resulted in a substantial rise in aid to institutions
and the social sector (especially health and education), coupled with a
sharp reduction in government support and international aid for
infrastructure and the productive sectors, including agriculture. The
share of official development assistance (ODA) allocated to the
agricultural sector, which accounted for around 12% of total aid in the
1980s, fell to less than 4% of total aid in 2004 (Fig. 9).
Beginning in the 1990s, livestock production became the target of
exaggerated or totally unfounded allegations by non-governmental
organisations (NGOs) and some international organisations (see
above). Livestock production in general, and pastoralism by the most
vulnerable communities in particular, was held responsible for serious
damage to the environment and human health. While these often
highly publicised allegations did not reduce support for livestock
farming in developed countries and emerging countries, they

Rev. sci. tech. Off. int. Epiz., 33 (3) 23
No. 09102014-00044-FR 23/47
coincided with a collapse in international aid and national funding for
the poorest farmers (Fig. 10). This led to growth in extensive farming
to meet consumer demand, with no productivity gains, exacerbating
the impact on the environment and climate change (5, 46).
In 2012, total ODA stood at US$172 billion. Agriculture as a whole
received US$11.5 billion. The share of aid allocated directly to the
livestock sector was US$173 million (0.1% of total ODA), including
US$114 million for animal production (OECD Development
Assistance Committee [DAC] code 31163) and US$59 million for
Veterinary Services (OECD-DAC code 31195). In 2012, the livestock
sector received directly only 1.5% of the aid allocated to agriculture,
which is completely disproportionate to the economic and social
importance of livestock. The multilateral agencies that provide on
average 22% of total ODA contributed 57% of the aid allocated to the
livestock sector (45). Animal production also receives a small portion
of aid for agricultural research, extension, policy and training. In least
developed countries, where ODA often accounts for over 10% of GDP
(22) and over 30% of the agricultural investment budget, the sharp
reduction in government support has acted as a constraint on livestock
productivity gains.
In most least developed countries and lower-middle-income countries,
especially in Africa, aid guidelines often follow PRSP guidelines, as
do national strategies, because these countries are required to have
their PRSP approved before they are eligible for debt relief or
financial assistance from the World Bank or the International
Monetary Fund (IMF). A study of references to livestock in the PRSPs
of 49 countries revealed that no PRSP explained coherently the
importance of livestock for the economy and for poverty reduction
(47). The PRSPs of countries where most of the population depends
mainly on livestock for their livelihoods (such as Niger or Tajikistan)
touched on the subject only briefly. The few recommendations
concerning livestock production were all general in nature, with no
details of the activities to be carried out and no quantification of
budgetary needs. According to the study’s authors, this reflected not
only the influence of World Bank and IMF consultants – because

Rev. sci. tech. Off. int. Epiz., 33 (3) 24
No. 09102014-00044-FR 24/47
several PRSPs were drawn up in a language (English) other than the
language of the countries concerned – but also the lack of any political
will on the part of national decision-makers and experts to develop the
livestock sector.
The same reluctance to finance livestock is found in Global
Environment Facility (GEF) funding (48) (least developed countries
have easy access to this facility under the Least Developed Countries
Fund for climate change). Climate experts recommend giving priority
to improving livestock productivity to reduce greenhouse gas
emissions. Smith et al. (11) estimate that improved performance
would reduce greenhouse gas emissions from livestock by 70% in
low-income countries. Although agriculture plays a key role in the
seven priorities cited in the UNFCC guidelines for preparing National
Adaptation Programmes of Action for climate change, the actions
concerning agriculture relate to land preparation systems, irrigation,
traditional crops, etc. None concern the livestock sector (49).
Conclusions
Counter-productive effects of allegations against livestock
production
Livestock farming is subjected to an astonishing level of surveillance
and many studies have endeavoured to assess its impact on the
environment. No other agricultural activity has attracted so much
attention. After exhausting the list of allegations against livestock
farming in terms soil degradation and deforestation, the most recent
critical studies are now focusing on its impact on climate change.
In an increasingly populated world where the pressure of agriculture
on natural resources is rising inexorably, it is only right to seek to
safeguard ecosystem integrity, animal welfare and the needs of future
generations. However, instead of leading to reforms capable of
offering sustainable production growth, with shared benefits, repeated
allegations have penalised the poorest farmers by depriving them of
the support they need to secure their production and lay the
foundations for sustainable development.

Rev. sci. tech. Off. int. Epiz., 33 (3) 25
No. 09102014-00044-FR 25/47
Harmful consequences of growth driven solely by demand
All too often, the finding that demand is driving growth has resulted in
reduced support for livestock. Demand is a powerful determinant of
production and, in principle, strong demand leads to higher prices,
which stimulate greater production. However, demand alone is not
enough to improve livestock productivity, which also requires greater
support for research, a better institutional framework, etc. In the
absence of productivity gains, demand drives extensive growth, which
pushes up animal numbers, exacerbates pressure on natural resources
and is unable to reduce poverty.
The danger of one-criterion assessments and the
advantages of ruminants
One-criterion assessments of the environmental impact of livestock
frequently recommend replacing ruminants with monogastric animals,
which emit fewer greenhouse gases and occupy less space. These
recommendations do not stand up to a broader analysis that takes into
account all the requirements of sustainable development.
Enteric fermentation enables ruminants to convert very coarse by-
products, which cannot be used by humans and monogastric animals
and might otherwise be burned, into proteins with a high nutritional
value. They are the only animals capable of providing a livelihood for
the often marginalised pastoral communities inhabiting the immense,
arid expanses covering 16% of the Earth’s land mass, where cold,
drought or steep gradients preclude the cultivation of crops (1).
Ruminants provide the draught power for farm work and
transportation in remote areas. Consumable animal products are often
the sole basis used for assessing the environmental impact of poor
farmers, but in fact they are just one of the benefits offered by
ruminants.
Although it is often recommended that monogastric livestock
production be developed in order to preserve ecosystems, more often
than not these animals are produced under landless systems that use
rations produced intensively, far from livestock farms or even on

Rev. sci. tech. Off. int. Epiz., 33 (3) 26
No. 09102014-00044-FR 26/47
another continent. However, in the case of ruminants, poor farmers
use virtually no imported inputs and, in developed countries, 90% of
ruminant fodder and grain is produced on-farm and does not require
transport with a high carbon footprint. In all cases, ruminant dung
returns to the soil where it re-enters natural cycles that are difficult to
quantify and nearly impossible to model because they are linked
directly to specific local factors, such as soil type, climate and farming
practices (17).
Ruminants have a relatively long life cycle and systems for farming
them are better than those used for monogastric animals in that they
respect the animals’ natural way of life and welfare and avoid the use
of antibiotics to counter the microbial build-up inherent in intensive
farming systems. Although ruminants use pastures occupying 26% of
the Earth’s land mass (1), many studies have shown that ruminant
farming systems have the capacity to offset much of their greenhouse
gas emissions. In addition, natural pastureland is able to create an
environment that helps improve air quality, regenerate water
resources, maintain wildlife and biodiversity and improve the living
environment by providing pleasant landscapes (15, 50). In addition,
Leip et al. (18) have demonstrated that plant consumption by animals
reduces reactive nitrogen availability in the soil by a full 30% to 40%,
greatly limiting the production of N2O.
Making scientific advances accessible to the poorest
farmers, especially in Africa
Africa is the continent with the highest proportion of the population
engaged in farming (60% of the working population). It is also the
continent that provides the least support for agricultural productivity.
For a number of years, sub-Saharan Africa has posted sustained
economic growth of around 5%. This growth has been on the back of
the extraction of raw materials and investment in infrastructure, as
well as an increase in agricultural output (51). However, unlike the
growth in Europe and North America in the 19th Century and in Asia
in the late 20th Century, Africa’s growth has not been built on
improved agricultural productivity. It therefore provides very little

Rev. sci. tech. Off. int. Epiz., 33 (3) 27
No. 09102014-00044-FR 27/47
benefit for the poor. Africa is the continent that has done the least to
alleviate poverty (Fig. 2).
Africa is the future demographic giant. Population growth is expected
to slow worldwide, except in Africa, where it is expected to remain
close to 2% a year until at least 2050. Africa’s population is set to
more than double (+119%) between 2010 and 2050. With 4 billion
inhabitants by 2100, it is likely to be the world’s second most
populous continent, after Asia (37).
Apart from the dramatic consequences of poverty for nearly half of all
Africans, persistent large-scale rural poverty in this future
demographic giant could have repercussions on the entire planet.
Inadequate veterinary surveillance would pose a major threat to
animal and human health in the rest of the world because of the
persistence of transmissible animal diseases and the risk of emerging
zoonoses. In addition, continuing dire economic vulnerability in
livestock production areas, which cover a large part of the continent
from Senegal to Somalia and Mauritania to Kenya, could produce
hotbeds of insecurity (which already exist), with serious consequences
for the stability of the continent and for the rest of the world.
In all major countries, agricultural productivity gains have played a
key role in poverty reduction and the unique ability of livestock
farming to reduce poverty has been widely recognised. Erik Solheim,
Chair of the OECD Development Assistance Committee, pointed out
that there is no single solution for ending poverty but that the
remarkable success stories of some countries show the way for others
(52).
As well as the need for international solidarity, in view of the
interdependence of the various economic, social and environmental
processes required to ensure our planet’s sustainable development,
there is a need to rethink the marginalisation of livestock production
in development policies.

Rev. sci. tech. Off. int. Epiz., 33 (3) 28
No. 09102014-00044-FR 28/47
References
1. World Bank (2009). – Minding the stock: bringing public
policy to bear on livestock sector development. World Bank,
Agriculture and Rural Development Department, Washington, DC.
2. World Bank (2014). – Reducing climate-sensitive disease
risks. Agriculture and Environmental Services Discussion Paper
No. 07, April 2014. World Bank, Washington, DC.
3. Joshi D.D. (2011). – Draught animals in Asia. In Livestock
rearing (M.L. Myers, ed.). Encyclopedia of occupational health and
safety, Jeanne Mager Stellman, Editor-in-Chief. International Labour
Organization, Geneva.
4. Food and Agriculture Organization of the United Nations
(FAO) (2006). – Livestock’s long shadow: environmental issues and
options (H. Steinfeld, P. Gerber, T. Wassenaar, V. Castel, M. Rosales
& C. Haan, eds). FAO, Rome, 390 pp.
5. Joint Parliamentary Assembly of African, Caribbean and
Pacific (ACP) Countries and the European Union (EU) (2009). –
Brussels Rural Development Briefings. Briefing No. 12. The role of
livestock for ACP countries: challenges and opportunities ahead.
ACP-EU, Brussels.
6. Intergovernmental Panel on Climate Change (IPCC), Working
Group III – Mitigation of Climate Change (2013). – Chapter 11:
Agriculture, forestry and other land use (AFOLU). In IPCC 5th
Assessment Report ‘Climate Change 2014: Mitigation of Climate
Change’. Available at: http://report.mitigation2014.org/drafts/final-
draft-postplenary/ipcc_wg3_ar5_final-
draft_postplenary_chapter11.pdf (accessed on 30 September 2014).
7. Caro D., Davis S.J., Bastianoni S. & Caldeira K. (2014). –
Global and regional trends in greenhouse gas emissions from
livestock. Climatic change, 126, 203–216. doi:10.1007/s10584-014-
1197-x.

Rev. sci. tech. Off. int. Epiz., 33 (3) 29
No. 09102014-00044-FR 29/47
8. Nepstad D., McGrath D., Stickler C., Alencar A., Azevedo A.,
Swette B., Bezerra T., DiGiano M., Shimada J., Seroa da Motta R.,
Armijo E., Castello L., Brando P., Hansen M.C., McGrath-Horn M.,
Carvalho O. & Hess L. (2014). – Slowing Amazon deforestation
through public policy and interventions in beef and soy supply chains.
Science, 344 (6188), 1118–1123. doi:10.1126/science.1248525.
9. Malhi Y., Adu-Bredu S., Asare R.A., Lewis S.L. & Mayaux P.
(2013). – African rainforests: past, present and future. Phil. Trans.
roy. Soc., B, biol. Sci., 368 (1625), 20120312.
doi:10.1098/rstb.2012.0312.
10. Margono B.A., Potapov P.V., Turubanova S., Stolle F. &
Hansen M.C. (2014). – Primary forest cover loss in Indonesia over
2000–2012. Nature Climate Change, 4, 730–735.
doi:10.1038/NClimate2277.
11. Smith P., Martino D., Cai Z., Gwary D., Janzen H., Kumar P.,
McCarl B., Ogle S., O’Mara F., Rice C., Scholes B. & Sirotenko O.
(2007). – Chapter 8: Agriculture. In Climate change 2007: mitigation
of climate change. Contribution of Working Group III to the 4th
Assessment Report of the Intergovernmental Panel on Climate Change
(B. Metz, O.R. Davidson, P.R. Bosch, R. Dave & L.A. Meyer, eds).
Cambridge University Press, Cambridge, 15.
12. Gerber P.J., Steinfeld H., Henderson B., Mottet A., Opio C.,
Dijkman J., Falcucci A. & Tempio G. (2013). – Tackling climate
change through livestock: a global assessment of emissions and
mitigation opportunities. Food and Agriculture Organization of the
United Nations, Rome.
13. Intergovernmental Panel on Climate Change (IPCC) (2006). –
Guidelines for national greenhouse gas inventories. Chapter 10:
Emissions from livestock and manure management. Available at:
www.ipcc-
nggip.iges.or.jp/public/2006gl/pdf/4_Volume4/V4_10_Ch10_Livestoc
k.pdf (accessed on 30 September 2014).

Rev. sci. tech. Off. int. Epiz., 33 (3) 30
No. 09102014-00044-FR 30/47
14. Commonwealth of Australia (2014). – National Inventory
Report 2012, Volume 1.
15. Ronald F.F. & Debbie A.R. (2010). – Soil carbon sequestration
in grazing lands: societal benefits and policy implications. Rangeland
Ecol. & Manag., 63 (1), 4-15. doi:10.2111/08-225.1.
16. Soussana J.F., Tallec T. & Blanfort V. (2010). – Mitigating the
greenhouse gas balance of ruminant production systems through
carbon sequestration in grasslands. Animal, 4, 334–350.
17. Dollé J.-B., Agabriel J.-L., Peyraud P., Faverdin V.,
Manneville C., Raison A., Gac A. & Le Gall A. (2011). – Les gaz à
effet de serre en élevage bovin: évaluation et leviers d’action. In Gaz à
effet de serre en élevage bovin: le méthane (M. Doreau, R. Baumont
& J.M. Perez, eds). Dossier, INRA Prod. anim., 24, 415–432.
18. Leip A., Weiss F., Wassenaar T., Pérez I., Fellmann T.,
Loudjani P., Tubiello F., Grandgirard D., Monni S. & Biala K. (2010).
– Evaluation of the livestock sector’s contribution to the EU
greenhouse gas emissions (GGELS) – Final Report. European
Commission’s Joint Research Centre, Brussels.
19. Phaniraja K.L. & Panchasara H.H. (2009). – Indian draught
animals power. Vet. World, 2 (10), 404–407.
20. Dikshita A.K. & Birthalb P.S. (2010). – Environmental value
of draught animals: saving of fossil-fuel and prevention of greenhouse
gas emission. Agric. Econ. Res. Rev., 23, 227–232.
21. Udo H.M.J. & Steenstra F. (2010). – Intensification of
smallholder livestock production: is it sustainable? 5th International
Seminar on Tropical Animal Production: Community Empowerment
and Tropical Animal Industry, 19–22 October, Yogyakarta, Indonesia.
22. World Bank (2014). – World development indicators.
Available at: http://data.worldbank.org/topic/poverty (accessed on
30 September 2014).
Rev. sci. tech. Off. int. Epiz., 33 (3) 31
No. 09102014-00044-FR 31/47
23. FAOSTAT (2014). – FAO statistical databases. Available at:
http://faostat.fao.org/DesktopDefault.aspx?PageID=569# (consulted
on 30 September 2014).
24. Krueger A., Schiff M. & Valdés A. (1988). – Agricultural
incentives in developing countries: measuring the effect of sectoral
and economy-wide policies, World Bank. Econ. Rev., 2 (3), 255–272.
25. Ravaillon M. & Chen S. (2007) – China’s (uneven) progress
against poverty. J. Dev. Econ., 82, (1), 1–42.
26. Gallup J., Radelet S. & Warner (1997). – Economic growth
and the income of the poor. Consulting Assistance on Economic
Reform (CAER) Discussion Paper No. 36. Harvard Institute for
International Development, Cambridge, Massachusetts.
27. Irz X., Lin L., Thirtle C. & Wiggins S. (2001). – Agricultural
productivity growth and poverty alleviation. Dev. Policy Rev., 19 (4),
449–466.
28. Alary V. (2003). – L’élevage dans la gestion des risques par
les producteurs du Nord de l’Inde. In Élevage et pauvreté. Proceedings
of workshop of the Centre for Agricultural Research and Development
(CIRAD), Montpellier, 11–12 September 2003.
29. Thirtle C., Lin L. & Piesse J. (2003). – The impact of research-
led agricultural productivity growth on poverty reduction in Africa,
Asia and Latin America (conference paper). 25th Conference of the
International Association of Agricultural Economists, 16–22 August,
Durban, South Africa. World Dev., 31, 1959–1975.
30. Christiaensen L., Demery L. & Kuhl J. (2010). – The
(evolving) role of agriculture in poverty reduction: an empirical
perspective. Working paper No. 36. United Nations University World
Institute for Development Economics Research, Helsinki.
31. Xiaoyun Li (2013). – What can Africa learn from China’s
agricultural miracle? In Development co-operation report 2013:
ending poverty. OECD Publishing, Paris. doi:10.1787/dcr-2013-en.

Rev. sci. tech. Off. int. Epiz., 33 (3) 32
No. 09102014-00044-FR 32/47
32. Montalvo J. & Ravallion M. (2009). – The pattern of growth
and poverty reduction in China. J. comp. Econ., 38 (2010), 2–16.
33. Pica G., Pica-Ciamarra U. & Otte J. (2008). – The livestock
sector in the world development report 2008: re-assessing the policy
priorities. Pro-Poor Livestock Policy Initiative. A living from
livestock. Research Report No. 08-07.
34. Desjardins R.L., Worth D.E., Xavier P.C., Vergé X.P.,
Maxime D., Dyer J. & Cerkowniak D. (2012). – Carbon footprint of
beef cattle. Sustainability, 4 (12), 3279–3301. doi:10.3390/su4123279.
35. Jayasundara S. & Wagner-Riddle C. (2014). – Comparaison de
l’intensité des emissions de gaz à effet de serre dans la production de
lait en Ontario en 2011 par rapport à 1991. Can. J. Anim. Sci., 94,
155–173.
36. Alexandratos N. & Bruinsma J. (2012). – World agriculture
towards 2030/2050: the 2012 revision. ESA Working paper No. 12-
03. Food and Agriculture Organization of the United Nations, Rome.
37. United Nations Department of Economic and Social Affairs,
Population Division (2013). – World population prospects: the 2012
revision, Volume I: comprehensive tables ST/ESA/SER.A/336.
38. Latruffe L. (2010). – Competitiveness, productivity and
efficiency in the agricultural and agri-food sectors. OECD Food,
Agriculture and Fisheries Papers No. 30. OECD Publishing, Paris.
doi:10.1787/5km91nkdt6d6-en.
39. Organisation for Economic Cooperation and Development
(OECD) (2011). – Determinants of productivity growth and
competitiveness. In Fostering productivity and competitiveness in
agriculture. OECD Publishing, Paris.
40. Food and Agriculture Organization of the United Nations
(FAO) (2013). – World livestock 2013: changing disease landscapes.
FAO, Rome, 130 pp. Available at:

Rev. sci. tech. Off. int. Epiz., 33 (3) 33
No. 09102014-00044-FR 33/47
www.fao.org/docrep/019/i3440e/i3440e.pdf (accessed on
30 September 2014).
41. Elliott J., Drake B., Jones G., Chatterton J., Williams A., Wu
Z., Hateley G. & Curwen A. (2014). – Modelling the impact of
controlling UK endemic cattle diseases on greenhouse gas emissions.
Presentation at the 88th Annual Conference of the Agricultural
Economics Society, 9–11 April, AgroParisTech, Paris.
42. Food and Agriculture Organization of the United Nations
(FAO) (2013). – Programme against African Trypanosomosis
(PAAT). Available at:
www.fao.org/ag/againfo/programmes/en/paat/home.html (accessed on
30 September 2014).
43. Organisation for Economic Cooperation and Development
(OECD) (2013). – Trends in the OECD area. In Agricultural policy
monitoring and evaluation 2013: OECD countries and emerging
economies, OECD Publishing, Paris. doi:10.1787/agr_pol-2013-6-en.
44. Organisation for Economic Co-operation and Development
(OECD) (2011). – Agricultural policy monitoring and evaluation
2011: OECD countries and emerging economies. OECD Publishing,
Paris. doi:10.1787/agr_pol-2011-en.
45. Organisation for Economic Cooperation and Development
(OECD) Development Assistance Committee (2013). – Aid statistics.
OECD, Paris. Available at: www.oecd.org/dac/stats/ (accessed on
30 September 2014).
46. Perry B. & Grace D. (2009). – The impacts of livestock
diseases and their control on growth and development processes that
are pro-poor. Philos. Trans. Roy. Soc. Lond. B, Biol. Sci., 364 (1530),
2643–2655.
47. Blench R., Chapman R. & Slaymaker T. (2003). – A study of
the role of livestock in poverty reduction strategy papers. Pro- Poor
Livestock Policy Initiative, Working Paper No. 1. Food and
Agriculture Organization of the United Nations, Rome.

Rev. sci. tech. Off. int. Epiz., 33 (3) 34
No. 09102014-00044-FR 34/47
48. Global Environment Facility (GEF) (2011). – Accessing
resources under the least developed countries fund. Available at:
www.thegef.org/gef/sites/thegef.org/files/publication/23469_LDCF.pd
f (accesed on 30 September 2014).
49. United Nations Framework Convention on Climate Change
(UNFCCC) (2014). – National Adaptation Programmes of Action
(NAPA) priorities database. Available at:
http://unfccc.int/adaptation/workstreams/national_adaptation_program
mes_of_action/items/4583.php (accessed on 30 September 2014).
50. Borer E.T., Seabloom E.W., Gruner D.S., Harpole W.S.,
Hillebrand H., Lind E.M., Adler P.B., Alberti J., Anderson T.M.,
Bakker J.D., Biederman L., Blumenthal D., Brown C.S., Brudvig
L.A., Buckley Y.M., Cadotte M., Chu C., Cleland E.E., Crawley M.J.,
Daleo P., Damschen E.I., Davies K.F., Decrappeo N.M., Du G., Firn
J., Hautier Y., Heckman R.W., Hector A., Hillerislambers J., Iribarne
O., Klein J.A., Knops J.M.H., La Pierre K.J., Leakey A.D.B., Li W.,
MacDougall A.S., McCulley R.L., Melbourne B.A., Mitchell C.E.,
Moore J.L., Mortensen B., O'Halloran L.R., Orrock J.L., Pascual J.,
Prober S.M., Pyke D.A., Risch A.C., Schuetz M., Smith M.D.,
Stevens C.J., Sullivan L.L., Williams R.J., Wragg P.D., Wright J.P. &
Yang L.H. (2014). – Herbivores and nutrients control grassland plant
diversity via light limitation. Nature, 508 (7497), 517–520.
doi:10.1038/nature13144.
51. International Monetary Fund (2014). – World Economic and
Financial Surveys, 0256–6877. World economic outlook: recovery
strengthens, remains uneven. IMF, Washington, DC..
52. Organisation for Economic Co-operation and Development
(OECD) (2013). – Development co-operation report 2013: ending
poverty. OECD Publishing. http://www.oecd-
ilibrary.org/development/development-co-operation-report-2013_dcr-
2013-en. ____________

Rev. sci. tech. Off. int. Epiz., 33 (3) 35
No. 09102014-00044-FR 35/47
Table I
Emissions of enteric CH4 and CH4 from cattle and pig manure in
the major world regions (13)
Region
Kilograms of enteric CH4 per
animal/year
Kilograms of CH4 from animal manure
per year (25°C)
Dairy cows Other cattle Pigs Dairy cows Other cattle Pigs
Sub-Saharan
Africa
46 31 1 1 1 1
Latin America
and the
Caribbean
72 56 1 1 1 1
East Asia and
the Pacific
68 47 1 26 1 6
South Asia 58 27 1 5 2 5
Middle East
and North
Africa
46 31 1 2 1 5
North America 128 53 1.5 98 2 39
Western
Europe
117 57 1.5 75 21 27

Rev. sci. tech. Off. int. Epiz., 33 (3) 36
No. 09102014-00044-FR 36/47
Table II
Correlation between datasets concerning livestock performance,
poverty reduction and greenhouse gas emissions in the major
world regions
Series of variables studied Correlation
coefficient
Poverty reduction rate
between 1981 and 2012
(Fig. 2)
and Percentage of the intensive
component of livestock growth
between 1981 and 2012
(Fig. 5)
Cattle: 0.87
Pigs: 0.64
Poultry: 0.20
SR: 0.77
Annual milk production
per cow
(Fig. 4)
and GHG emissions per kg of milk
(Figu. 3)
– 0.68
Off-take ratio
(Fig. 4)
and GHG emissions per kg of meat
(Fig. 3)
– 0.78
GHG : greenhouse gas
SR : small ruminants
Correlations calculated from World Bank data (World Development Indicators, 2014) (22) for the poverty
rate; from Gerber et al. (12) for emissions per kilogram of meat and per kilogram of milk; from the
Intergovernmental Panel on Climate Change (IPCC, 2006) (13) for milk production per cow, and from
the Statistics Division of the Food and Agriculture Organization of the United Nations [FAOSTAT] in
2014 (23) for off-take ratios. The percentage of the intensive component of growth was calculated based
on data from FAOSTAT in 2014 (23)

Rev. sci. tech. Off. int. Epiz., 33 (3) 37
No. 09102014-00044-FR 37/47
Table III
Average annual growth in the off-take ratio for meat from cattle,
pigs, chickens and sheep/goats, in major world regions, between
1981 and 2012
Region Cattle Pigs Chickens Sheep/goats
Sub-Saharan Africa 0.2% 0.3% 1.3% 0.5%
Latin America and the
Caribbean
0.9% 2.9% 2.7% 1.1%
East Asia and the Pacific 4.5% 2.8% 1.6% 4.0%
South Asia 1.1% 2.4% 0.7% –0.1%
Middle East and North Africa 2.0% - 2.1% –1.0%
Least developed countries 0.6% 1.0% 1.5% 0.3%
Developed countries 0.8% 1.1% 0.9% 0.7%
World 0.8% 1.7% 1.3% 0.7%
Calculated on the basis of data from the Statistics Division of the Food and Agriculture Organization of the United Nations (FAOSTAT) in 2014 (23)

Rev. sci. tech. Off. int. Epiz., 33 (3) 38
No. 09102014-00044-FR 38/47
Fig. 1
Estimated global greenhouse gas emissions by species, in metric
tonnes of carbon dioxide equivalent (Mt CO2-eq) (2011)
Source: Global livestock environmental assessment model (GLEAM),
cited by Gerber et al. (12)

Rev. sci. tech. Off. int. Epiz., 33 (3) 39
No. 09102014-00044-FR 39/47
LCDs: least developed countries
Fig. 2
Percentage of people in extreme poverty in developing countries
of the world’s main regions and in least developed countries, in
1981 and 2012
Source: World Bank, World Development Indicators (22)
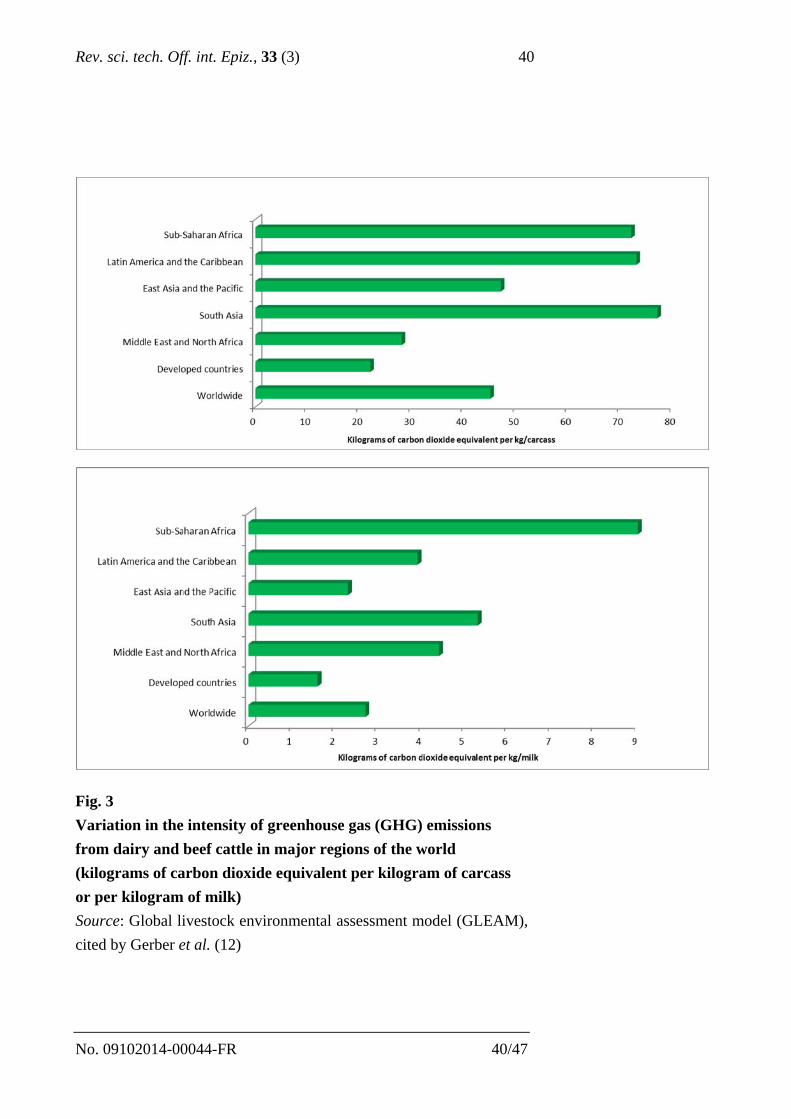
Rev. sci. tech. Off. int. Epiz., 33 (3) 40
No. 09102014-00044-FR 40/47
Fig. 3
Variation in the intensity of greenhouse gas (GHG) emissions
from dairy and beef cattle in major regions of the world
(kilograms of carbon dioxide equivalent per kilogram of carcass
or per kilogram of milk)
Source: Global livestock environmental assessment model (GLEAM),
cited by Gerber et al. (12)

Rev. sci. tech. Off. int. Epiz., 2014, 33 (3), ... - ...
No. 09102014-00044-FR 41/47
Fig. 4
Off-take ratio of meat and milk in major regions of the world
Off-take ratio calculated on the basis of data from the Statistics Division of the Food and Agriculture Organization of the United
Nations (FAOSTAT) in 2014 (23).
Milk production volume based on figures from the Intergovernmental Panel on Climate Change (13). The off-take ratio is calculated
by dividing the amount of meat obtained from a species in a year (usually expressed in kilograms) by the average number of animals
of that species for the same year. For cattle and pigs, it is expressed as kilograms of carcass weight and, for broilers, as
0.1 kilograms of ready-to-cook chicken weight

Rev. sci. tech. Off. int. Epiz., 2014, 33 (3), ... - ...
No. 09102014-00044-FR 42/47
LDCs: least developed countries
Fig. 5
Percentage of the intensive component in total production growth
in major regions of the world and in least developed countries
between 1981 and 2012
The percentage of production gains from the intensive component of
growth (with productivity gains), between year A (start of the period)
and year B (end of the period) is determined by the formula:
Intenstive growth (%) =
(Production year B − [(Production year A/Numbers year A) ×
Numbers year B]
Production year B − Production year A

Rev. sci. tech. Off. int. Epiz., 33 (3) 43
No. 09102014-00044-FR 43/47
Fig. 6
Growth trend and outlook for meat and milk production from
1970 to 2050, in millions of tonnes
Source: Statistics Division of the Food and Agriculture Organization
of the United Nations (FAOSTAT) (23) for the period 1970 to 2010
and Alexandratos and Bruinsma (36) for 2010 to 2050

Rev. sci. tech. Off. int. Epiz., 33 (3) 44
No. 09102014-00044-FR 44/47
Fig. 7
Comparison of global trends in the annual growth rate of the
population and meat and milk production, from 1970 to 2050
Source: Growth rate calculated on the basis of data from the Statistics
Division of the Food and Agriculture Organization of the United
Nations (FAOSTAT) (23) for the period 1970 to 2010 and from
Alexandratos and Bruinsma (36) for 2010 to 2050

Rev. sci. tech. Off. int. Epiz., 33 (3) 45
No. 09102014-00044-FR 45/47
Fig. 8
Numbers of production livestock from 1981 to 2011
a) Worldwide, excluding least developed countries
b) Least developed countries
Source: Statistics Division of the Food and Agriculture Organization
of the United Nations (FAOSTAT) (23)

Rev. sci. tech. Off. int. Epiz., 33 (3) 46
No. 09102014-00044-FR 46/47
Fig. 9
Agricultural support as a percentage of total official development
assistance from 2002 to 2012
Source: Development Assistance Committee of the Organisation for
Economic Co-operation and Development (45)

Rev. sci. tech. Off. int. Epiz., 33 (3) 47
No. 09102014-00044-FR 47/47
Fig. 10
Livestock support as a percentage of agricultural support
Source: Development Assistance Committee of the Organisation for
Economic Co-operation and Development (45)