Linking small and large strain behavior of soils using shear ...docs.trb.org/prp/13-4893.pdfSand...
18
Title: Linking small and large strain behavior of soils using shear wave velocity measurements 1 in the laboratory 2 3 Submission date: November 19, 2012 4 Word count: 4271 (4380 including this page) 5 Number of Tables: 1 6 Number of Figures: 11 7 Authors: 8 Yaurel Guadalupe, MSCE, Graduate Student, Department of Civil and Environmental 9 Engineering, University of Rhode Island, Narragansett, RI 02882. Phone: 787-467-3226, 10 E-mail: [email protected] (Main Author) 11 12 Christopher D.P Baxter, PhD, PE, Associate Professor, Department of Ocean/Civil and 13 Environmental Engineering, University of Rhode Island, Narragansett, RI 02882. Phone: 14 401-874-6575, E-mail: [email protected] 15 16 M.S. Ravi Sharma, PhD, PE, Ocean and Coastal Consultants Inc. a COWI Company, 35 17 Corporate Drive, Trumbull, CT 06611. Phone: 203-400-6527, E-mail: 18 [email protected] 19 20
Transcript of Linking small and large strain behavior of soils using shear ...docs.trb.org/prp/13-4893.pdfSand...

i
Title: Linking small and large strain behavior of soils using shear wave velocity measurements 1 in the laboratory 2
3 Submission date: November 19, 2012 4 Word count: 4271 (4380 including this page) 5 Number of Tables: 1 6 Number of Figures: 11 7 Authors: 8
Yaurel Guadalupe, MSCE, Graduate Student, Department of Civil and Environmental 9 Engineering, University of Rhode Island, Narragansett, RI 02882. Phone: 787-467-3226, 10 E-mail: [email protected] (Main Author) 11 12 Christopher D.P Baxter, PhD, PE, Associate Professor, Department of Ocean/Civil and 13 Environmental Engineering, University of Rhode Island, Narragansett, RI 02882. Phone: 14 401-874-6575, E-mail: [email protected] 15 16 M.S. Ravi Sharma, PhD, PE, Ocean and Coastal Consultants Inc. a COWI Company, 35 17 Corporate Drive, Trumbull, CT 06611. Phone: 203-400-6527, E-mail: 18 [email protected] 19
20
TRB 2013 Annual Meeting Paper revised from original submittal.
ii
Abstract: 1 2 Current geotechnical practice relies on empirical relationships with in situ tests to determine the 3 effective stress strength parameters for dense cohesionless soils. Although these methods work 4 reasonably well in practice, they cannot account for in situ effects related to time, fabric, and 5 cementation. These factors are especially important for brittle or sensitive soils, such as loess and 6 cemented sands. To develop methods that can predict strength in these types of soils, a better 7 understanding of the link between small and large strain behavior is needed. 8 The objective of this paper is to evaluate the hypothesis that there is a unique relationship 9 between the small strain shear modulus (G0) and the effective stresses at failure (σ'1f) for dilatant 10 soils. To accomplish this objective, isotropically consolidated-drained triaxial compressional 11 tests were performed with shear wave velocity measured throughout the tests. The soils tested in 12 this study include a quartz sand and non-plastic silt, and the results are compared to previous 13 studies by the authors on weakly cemented sands. 14
It was found that the ratio G0/σ'1f was approximately 200 ± 20 for the three different soils 15 tested, and was independent of density, degree of cementation, and confining stress. If true for 16 other soils, this finding could have important implications for evaluating staged construction on 17 sensitive soils and estimating the strength of dilative soils in situ. 18
TRB 2013 Annual Meeting Paper revised from original submittal.
1
INTRODUCTION 1
This paper focuses on linking small and large strain behavior of soils during triaxial compression 2 tests. It is hypothesized from previous work by the authors (1, 2) that there is a unique 3 relationship between the elastic shear modulus (i.e. stiffness) and effective stresses at failure for 4 dilatant soils. This work involved 22 isotropically consolidated, drained triaxial compression 5 tests on samples of weakly cemented sand at various densities, levels of cementations, and 6 confining stresses. The work presented in this paper seeks to extend the results of the previous 7 studies by evaluating this hypothesis for samples of quartz sand and non-plastic silt. 8 The practical importance of this study is that it may lead to an in situ method of assessing 9 the strength of dilative or sensitive soils. Current geotechnical practice relies on empirical 10 relationships developed from the Standard Penetration Test (SPT) and the Cone Penetration Test 11 (CPT). The SPT consists of counting the blows required to penetrate a split-spoon sampler 0.3 m 12 (1 ft) with a 63.5 kg (140 lb) hammer. The SPT blow count (N) is first corrected for the effects 13 of hammer energy and effective stress and then correlated to soil properties such as internal 14 friction angle (φ'), undrained shear strength (Su), and unit weight (γ). The CPT consists of 15 pushing an instrumented cone continuously through the soil while measuring the resistance at the 16 tip and along the sleeve and the pore water pressure at some point on the cone. These data are 17 used to classify the soil and estimate soil properties. 18 For both the SPT and CPT, correlations to soil properties have been developed from field 19 studies, large calibration chamber tests, and laboratory tests on reconstituted soils. Although 20 these correlations work reasonably well for dense, cohesionless soils, they cannot capture the in 21 situ effects related to time, fabric, and cementation. This is particularly true for brittle soils, such 22 as loess and cemented sands. An improved method of estimating strength parameters in these 23 types of soils that takes into account the in situ fabric would be of value to geotechnical 24 engineering practice. 25
Shear wave velocity is a property that is strongly influenced by the fabric and state of the 26 soil. The measurement of shear wave velocity in situ is increasingly being used in geotechnical 27 engineering practice, especially in seismic response analyses and liquefaction potential 28 assessment (3, 4, 5). Shear wave velocity can be measured both in the field and in the 29 laboratory. Field methods include the cross-hole test, down-hole test (often in conjunction with 30 CPT), Spectral Analysis of Surface Waves (SASW), Multi-channel Analysis of Surface Waves 31 (MASW), and others (6). In the laboratory, small strain properties are most often measured 32 using a resonant column to measure the small strain shear modulus or bender elements to 33 measure shear wave velocity (7). 34
The benefit of measuring shear wave velocity is that the small strain shear modulus (G0) 35 can be obtained directly. The small strain shear modulus is a dynamic soil property that depends 36 on several parameters including effective stresses, void ratio, stress history, grain characteristics, 37 and degree of saturation, among others (8). However, the two most significant are effective 38 stresses (σ') and void ratio (e). The relationship between the small strain shear modulus and 39 shear wave velocity can be obtained from the theory of elasticity by the following equation: 40
41 G0 = ρvs
2 (1) 42 43
where G0 is the small strain shear modulus, vs is the shear wave velocity, and ρ is the 44 corresponding bulk density of the soil at the time of vs measurement. 45
TRB 2013 Annual Meeting Paper revised from original submittal.

2
The objective of this paper is to evaluate the hypothesis that there is a unique relationship 1 between the small strain shear modulus (G0) and the effective stresses at failure for different 2 dilatant soils. To accomplish this objective, isotropically consolidated triaxial compression tests 3 were performed with shear wave velocity measured throughout the tests. The soils tested in this 4 study include a medium quartz sand, and non-plastic silt. Samples were tested at different 5 combinations of density and effective stress. The results of these tests are compared to previous 6 work on weakly cemented sands by the authors. 7 8
LABORATORY TESTING PROGRAM 9
Properties of Soil Tested 10
Grain size distributions of the three soils presented in this paper are shown in Figure 1. The soils 11 used in this study are a silty sand artificially cemented with Ordinary Portland Cement (OPC), a 12 quartz sand, and non-plastic silt. Hoffman (9) summarizes the properties of the cemented sand. 13 The specific gravity (Gs) of the silty sand used for the mixture and the Ordinary Portland Cement 14 are 2.66 and 3.15, respectively. As a result, the final Gs of the cemented sand samples varied 15 depending on the specified cement content. The sand samples have a Gs = 2.66, emax = 0.835 and 16 emin = 0.460 (10, 11). The silt used for this research is a blended material from three different 17 sites in Providence, Rhode Island, and has a Gs = 2.75, emax = 1.17, and emin = 0.488. 18 19 20
21 FIGURE 1 Grain size distribution for the soils used in this study. 22
0
10
20
30
40
50
60
70
80
90
100
0.00010.0010.010.1110
Perc
ent p
assi
ng [%
]
Particle size [mm]
Cemented Sand Sand Silt
Sand Silt Clay
TRB 2013 Annual Meeting Paper revised from original submittal.

3
Sample preparation techniques varied depending on the soil type. The weakly cemented 1 sand samples were prepared and cured following the procedure suggested by Hoffman (9) with 2 different OPC contents of 0, 1, 2.5, and 5% by weight. These samples were compacted using a 3 modified moist tamping method developed by Bradshaw and Baxter (12) and Taylor (13). In 4 this approach, samples are compacted in layers that are tamped to a specific energy. The layers 5 are prepared at a specific molding water, which greatly influences the resulting fabric of the 6 specimen. A 3 kg compaction hammer was used, and the drop height and number of blows 7 varied depending on the desired density. Uncemented samples were tested immediately after 8 their preparation. Cemented samples were stored at the laboratory and weighted periodically 9 until a constant weight was achieved due to drying (about 14 days) then tested (14). 10
The silt samples were also prepared using the modified moist tamping method. Sand 11 samples were prepared by air pluviation and subsequent tapping (on the sides of the mold) on the 12 triaxial cell to achieve the desired void ratio. 13
14
Test Method and Equipment 15
The isotropically consolidated-drained (CID) triaxial tests were performed using an automated 16 stress path apparatus. This equipment consists of a computer controlled load frame and two flow 17 pumps to control the cell and sample pressures. The flow pumps allowed for automatic back 18 pressure saturation of the samples and measurement of volume changes during consolidation and 19 shear. 20
The weakly cemented sands were saturated to a Skempton’s B-value of at least 0.90, and 21 sheared at a rate of 0.005%/minute to ensure drained conditions. The sand and silt samples were 22 saturated to B-values of at least 0.95, and consolidated for a period no less than 60 minutes. 23 They were sheared at a rate of 0.01%/minute. Table 1 shows the testing matrix for this study 24 including the weakly cemented sands tested by Sharma et al. (1). Shear wave velocity 25 measurements were taken both during consolidation and shear phases. 26
TABLE 1 Soil Testing Matrix 27 Soil Type Test
Type DR [%] or Density [g/cc]
OPC Cement [%]
Confining Stress [kPa]
Weakly cemented sand
CID 1.8, 2.1, 2.25 0, 1, 2.5, 5.0 50, 100, 300
Quartz sand CID 80, 60, 40 N/A 50, 100, 200
Non-plastic silt CID 80, 60 N/A 50, 100, 200
28
Shear Wave Velocity Measurement 29
Shear wave velocity measurements have become more common in research laboratories over the 30 past decade. Such measurements have been used to observe changes in compressibility during 31
TRB 2013 Annual Meeting Paper revised from original submittal.

4
consolidation (15), liquefaction potential (5), development of aging effects (16), and effects of 1 cementation (17, 18, 19). Details of using bender elements, including prevention of 2 electromagnetic coupling, directivity, resonant frequency, detection of first arrival, and near field 3 effects are studied by Lee and Santamarina (20). A summary of best practices, including 4 generation of input signals, interpretation of received signals and signal processing is presented 5 by Yamashita, S. et al., (21). 6
The equipment used to measure shear wave velocity in this study consisted of a pair of 7 transducers installed in each sample end cap (one transmitter and one receiver), a function 8 generator, a noise-reduction and pre-amplifier device, and a data acquisition card interfaced with 9 a desktop computer. Figure 2 shows a schematic of the equipment setup. A commercial 10 programming language software was used to trigger the input signal and store both the input and 11 received signal. A single sinusoidal wave was used as the input signal with a voltage of 20 V 12 peak to peak. The frequency of the input signal varied from 5 to 12 kHz depending on sample 13 size and soil type. The burst period was set to 0.1 s, and the sampling frequency to 1 MHz (22). 14 15
16 FIGURE 2 Shear wave velocity measurement system. 17
18 Two types of shear wave transducers were used in this study: bender elements and 19
torsional transducers. Bender elements have been widely accepted in the geotechnical 20 community to measure shear waves and were first used in soil laboratory testing by Shirley (23). 21 These piezoceramic elements are installed in each end cap leaving a small protrusion (about 0.6 22 cm) that is embedded into the sample. Each bender element consists of two-layered piezoelectric 23 plates bonded together. One transducer is used as the transmitter and the other as the receiver. 24
TRB 2013 Annual Meeting Paper revised from original submittal.
5
When the transmitter element is excited with a voltage it deforms in a bending motion due to the 1 polarization of the plates. This produces a vibration that travels through the medium. On the 2 other end, the receiver transducer detects the vibration, and produces a voltage. The torsional 3 transducers consist of discs painted in sections with silver electrodes in a specific pattern (14). 4 The sections are polarized by applying some voltage. Similarly, when the transmitter receives a 5 voltage it produces a vibration which is detected by the receiver. Torsional transducers have the 6 benefit that they do not penetrate into the sample, which is particularly useful for rock and 7 cemented samples. Wang et al. (24) and Hanchar (25) showed that torsional transducers produce 8 comparable results to bender elements. 9
10
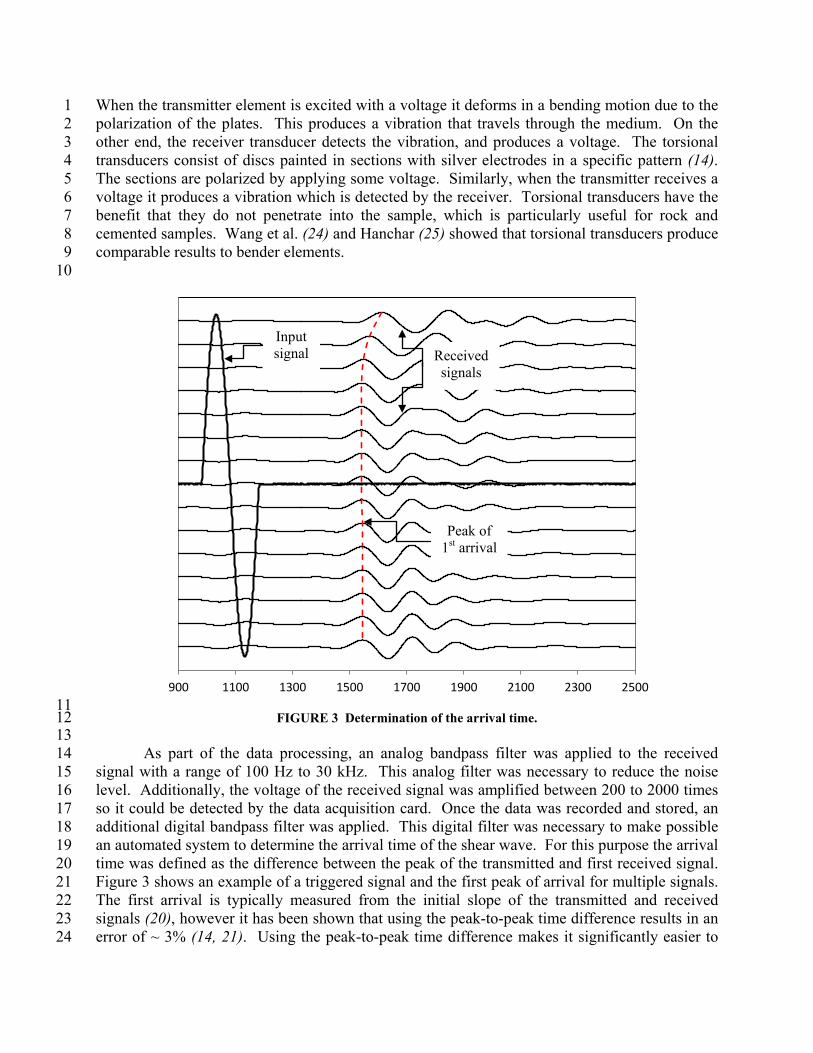
11 FIGURE 3 Determination of the arrival time. 12
13 As part of the data processing, an analog bandpass filter was applied to the received 14
signal with a range of 100 Hz to 30 kHz. This analog filter was necessary to reduce the noise 15 level. Additionally, the voltage of the received signal was amplified between 200 to 2000 times 16 so it could be detected by the data acquisition card. Once the data was recorded and stored, an 17 additional digital bandpass filter was applied. This digital filter was necessary to make possible 18 an automated system to determine the arrival time of the shear wave. For this purpose the arrival 19 time was defined as the difference between the peak of the transmitted and first received signal. 20 Figure 3 shows an example of a triggered signal and the first peak of arrival for multiple signals. 21 The first arrival is typically measured from the initial slope of the transmitted and received 22 signals (20), however it has been shown that using the peak-to-peak time difference results in an 23 error of ~ 3% (14, 21). Using the peak-to-peak time difference makes it significantly easier to 24
-1.1
-0.6
-0.1
0.4
0.9
78
83
88
93
98
103
108
900 1100 1300 1500 1700 1900 2100 2300 2500
Input signal Received
signals
Peak of 1st arrival
TRB 2013 Annual Meeting Paper revised from original submittal.
6
automate this process. Time delay caused by the whole system is measured and taken into 1 account. Specific details of the measurement used in this study can be found in previous work 2 performed by Sharma (22). 3 4
As the sample is sheared, the distance between the peaks shortens. The shear wave 5 velocity, vs, is calculated as: 6
7 vs = Ltt
∆t (2) 8
9 where Ltt is the length of the sample (if torsional transducers are used) or the tip-to-tip distance 10 between the bender elements, and Δt is the time difference between the peak of the input signal 11 and the first peak of arrival of the output signal. 12 13
RESULTS 14
Stress-Strain Behavior of Weakly Cemented Sand 15
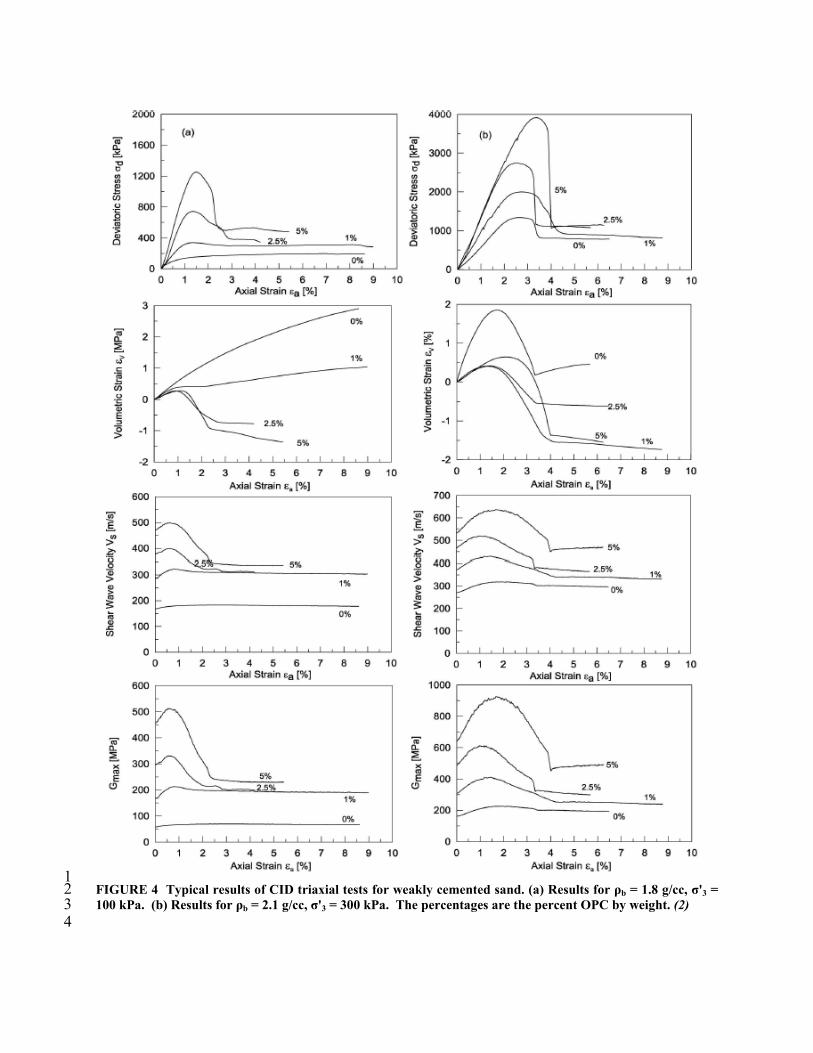
Figure 4 shows typical stress strain relationships for a weakly cemented sand. The variation of 16 volumetric strain, shear wave velocity, and small strain shear modulus with axial strain is also 17 shown. A discussion on the effect of cementation on the stress-strain behavior of weakly 18 cemented sand is beyond the scope of this paper, and is presented in detail by Sharma et al. (2) 19 and Baxter and Sharma (26). The focus of these figures is to compare the small strain shear 20 modulus with the other parameters shown. Six of the eight samples (all dilative) exhibited a 21 clear peak in the small strain shear modulus during shear. In contrast, two of the samples 22 (contractive) do not show any peak in the shear modulus. It is evident that the presence of 23 cementation increases shear strength resistance. However, it also increases the tendency to 24 dilate, the initial shear modulus, and its maximum peak. The authors believe that the occurrence 25 of this characteristic peak is fundamental for the development of a relationship between G0 and 26 σ'1f. 27 28
Constant G0/σ'1f for Weakly Cemented Sand 29
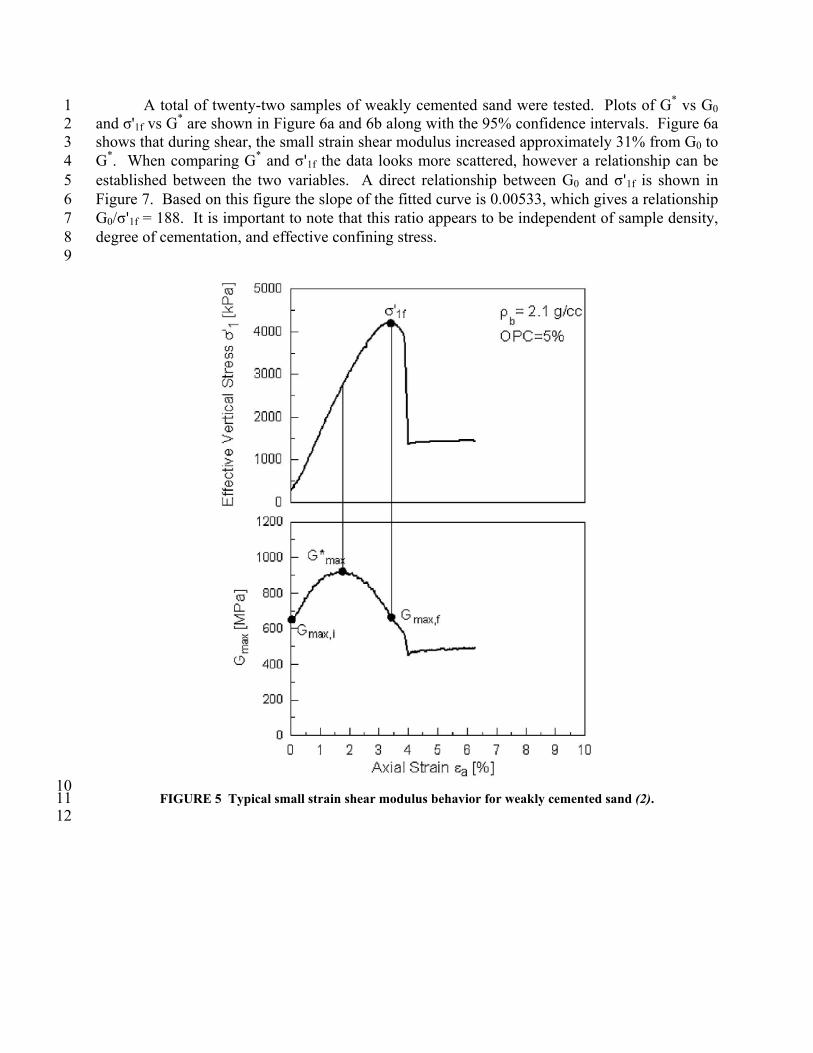
For each of the dilative samples tested, the variation of small strain shear modulus with strain 30 followed a distinctive trend. At the beginning of shear, the small strain shear modulus starts at 31 G0 (Gmax,i), which is the initial shear modulus measured at the end of consolidation. During 32 shearing, the small strain shear modulus increases up to a maximum point (G*) and then 33 decreases. The maximum peak G* occurs at some point before the strength is fully mobilized 34 (σ'1f). Figure 5 shows this behavior, which was observed in all dilative tests. This increase in the 35 small strain shear modulus follows a similar trend with the volumetric change; e.i. the maximum 36 peak G* occurs near the maximum point of contraction during the shear phase. 37 38 39
TRB 2013 Annual Meeting Paper revised from original submittal.
7
1 FIGURE 4 Typical results of CID triaxial tests for weakly cemented sand. (a) Results for ρb = 1.8 g/cc, σ'3 = 2 100 kPa. (b) Results for ρb = 2.1 g/cc, σ'3 = 300 kPa. The percentages are the percent OPC by weight. (2) 3 4
TRB 2013 Annual Meeting Paper revised from original submittal.
8
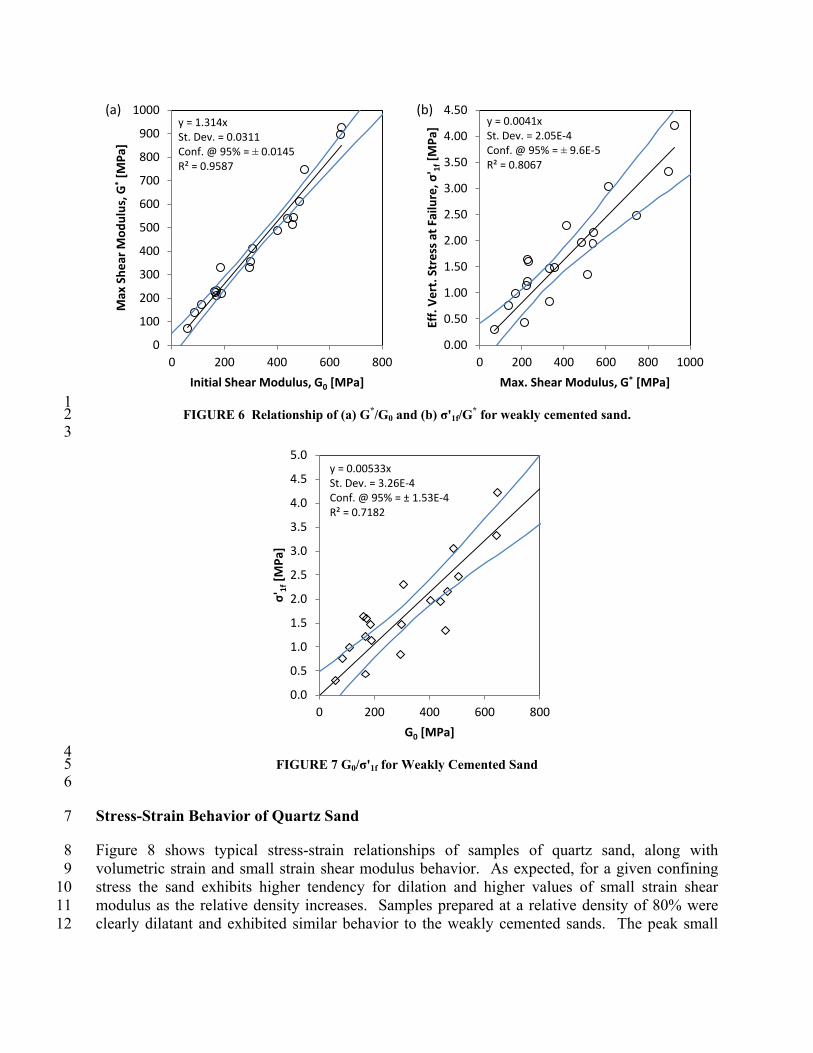
A total of twenty-two samples of weakly cemented sand were tested. Plots of G* vs G0 1 and σ'1f vs G* are shown in Figure 6a and 6b along with the 95% confidence intervals. Figure 6a 2 shows that during shear, the small strain shear modulus increased approximately 31% from G0 to 3 G*. When comparing G* and σ'1f the data looks more scattered, however a relationship can be 4 established between the two variables. A direct relationship between G0 and σ'1f is shown in 5 Figure 7. Based on this figure the slope of the fitted curve is 0.00533, which gives a relationship 6 G0/σ'1f = 188. It is important to note that this ratio appears to be independent of sample density, 7 degree of cementation, and effective confining stress. 8 9
10 FIGURE 5 Typical small strain shear modulus behavior for weakly cemented sand (2). 11
12
TRB 2013 Annual Meeting Paper revised from original submittal.
9
1 FIGURE 6 Relationship of (a) G*/G0 and (b) σ'1f/G* for weakly cemented sand. 2
3
4 FIGURE 7 G0/σ'1f for Weakly Cemented Sand 5
6
Stress-Strain Behavior of Quartz Sand 7
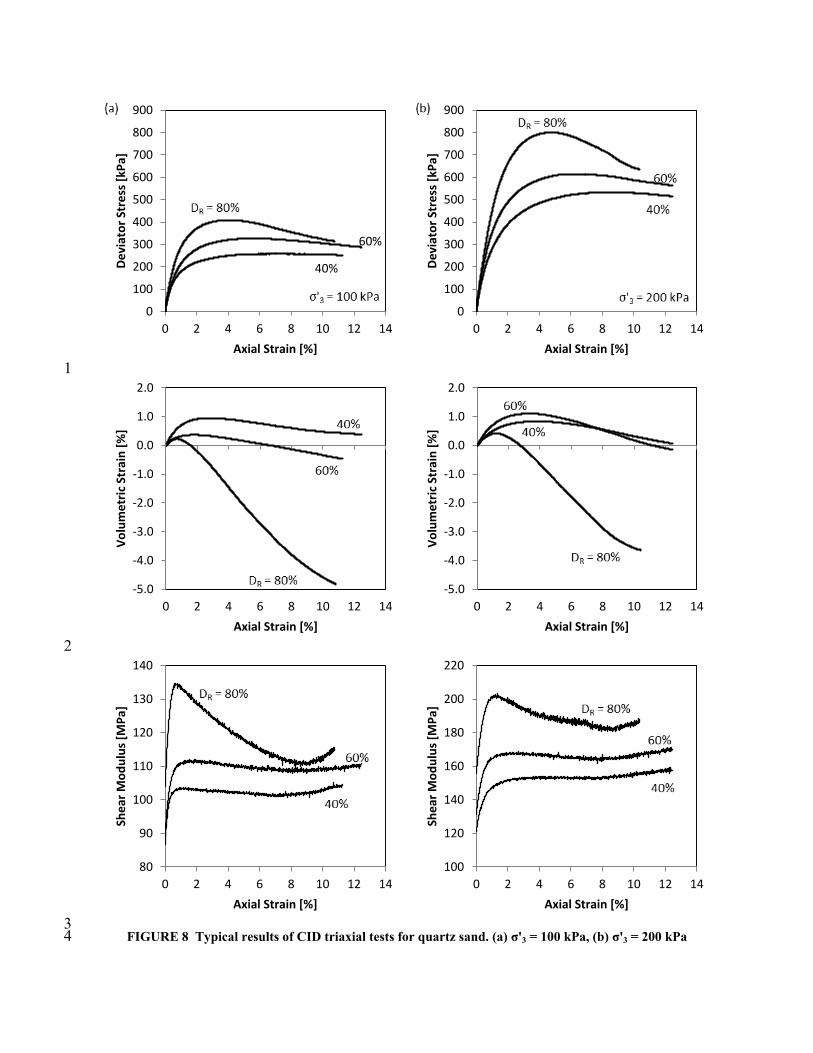
Figure 8 shows typical stress-strain relationships of samples of quartz sand, along with 8 volumetric strain and small strain shear modulus behavior. As expected, for a given confining 9 stress the sand exhibits higher tendency for dilation and higher values of small strain shear 10 modulus as the relative density increases. Samples prepared at a relative density of 80% were 11 clearly dilatant and exhibited similar behavior to the weakly cemented sands. The peak small 12
y = 1.314x St. Dev. = 0.0311 Conf. @ 95% = ± 0.0145 R² = 0.9587
0
100
200
300
400
500
600
700
800
900
1000
0 200 400 600 800
Max
She
ar M
odul
us, G
* [M
Pa]
Initial Shear Modulus, G0 [MPa]
(a) y = 0.0041x St. Dev. = 2.05E-4 Conf. @ 95% = ± 9.6E-5 R² = 0.8067
0.00
0.50
1.00
1.50
2.00
2.50
3.00
3.50
4.00
4.50
0 200 400 600 800 1000
Eff.
Vert
. Str
ess a
t Fai
lure
, σ' 1f
[MPa
]
Max. Shear Modulus, G* [MPa]
(b)
y = 0.00533x St. Dev. = 3.26E-4 Conf. @ 95% = ± 1.53E-4 R² = 0.7182
0.0
0.5
1.0
1.5
2.0
2.5
3.0
3.5
4.0
4.5
5.0
0 200 400 600 800
σ'1f
[MPa
]
G0 [MPa]
TRB 2013 Annual Meeting Paper revised from original submittal.
10
1
2
3 FIGURE 8 Typical results of CID triaxial tests for quartz sand. (a) σ'3 = 100 kPa, (b) σ'3 = 200 kPa 4
0
100
200
300
400
500
600
700
800
900
0 2 4 6 8 10 12 14
Devi
ator
Str
ess [
kPa]
Axial Strain [%]
60%
40%
0
100
200
300
400
500
600
700
800
900
0 2 4 6 8 10 12 14
Devi
ator
Str
ess [
kPa]
Axial Strain [%]
-5.0
-4.0
-3.0
-2.0
-1.0
0.0
1.0
2.0
0 2 4 6 8 10 12 14
Volu
met
ric S
trai
n [%
]
Axial Strain [%]
-5.0
-4.0
-3.0
-2.0
-1.0
0.0
1.0
2.0
0 2 4 6 8 10 12 14
Volu
met
ric S
trai
n [%
]
Axial Strain [%]
80
90
100
110
120
130
140
0 2 4 6 8 10 12 14
Shea
r Mod
ulus
[MPa
]
Axial Strain [%]
100
120
140
160
180
200
220
0 2 4 6 8 10 12 14
Shea
r Mod
ulus
[MPa
]
Axial Strain [%]
TRB 2013 Annual Meeting Paper revised from original submittal.
11
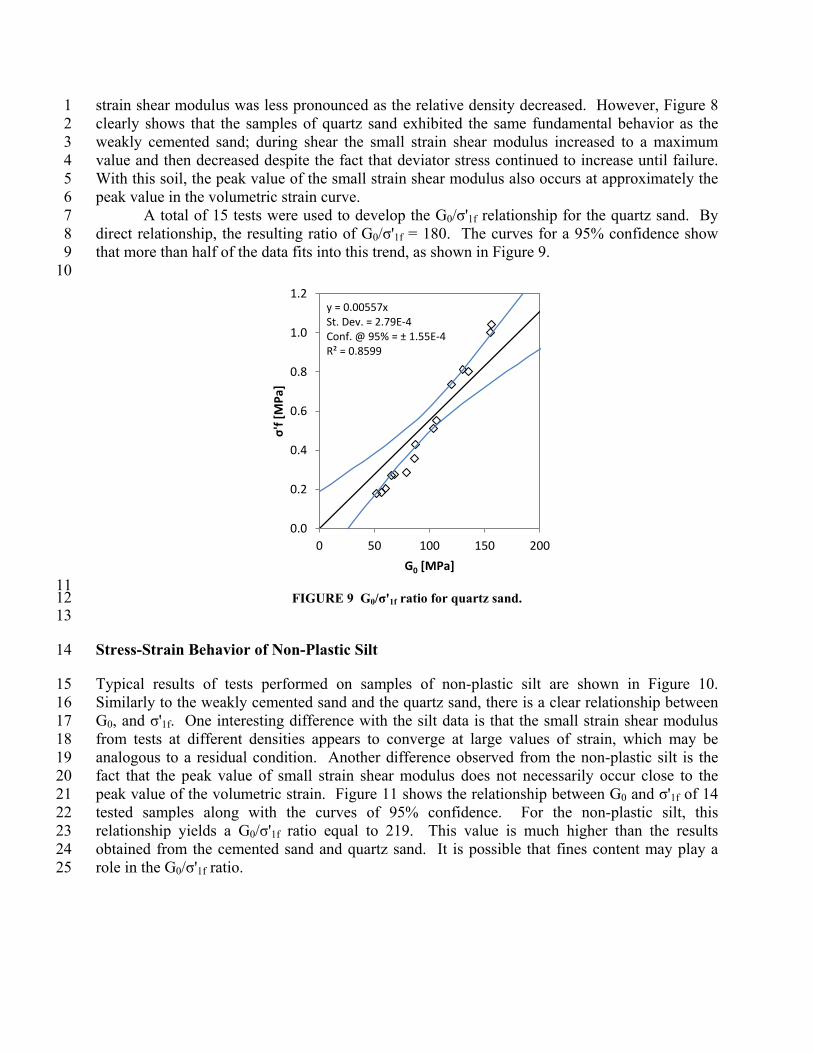
strain shear modulus was less pronounced as the relative density decreased. However, Figure 8 1 clearly shows that the samples of quartz sand exhibited the same fundamental behavior as the 2 weakly cemented sand; during shear the small strain shear modulus increased to a maximum 3 value and then decreased despite the fact that deviator stress continued to increase until failure. 4 With this soil, the peak value of the small strain shear modulus also occurs at approximately the 5 peak value in the volumetric strain curve. 6 A total of 15 tests were used to develop the G0/σ'1f relationship for the quartz sand. By 7 direct relationship, the resulting ratio of G0/σ'1f = 180. The curves for a 95% confidence show 8 that more than half of the data fits into this trend, as shown in Figure 9. 9 10
11 FIGURE 9 G0/σ'1f ratio for quartz sand. 12
13
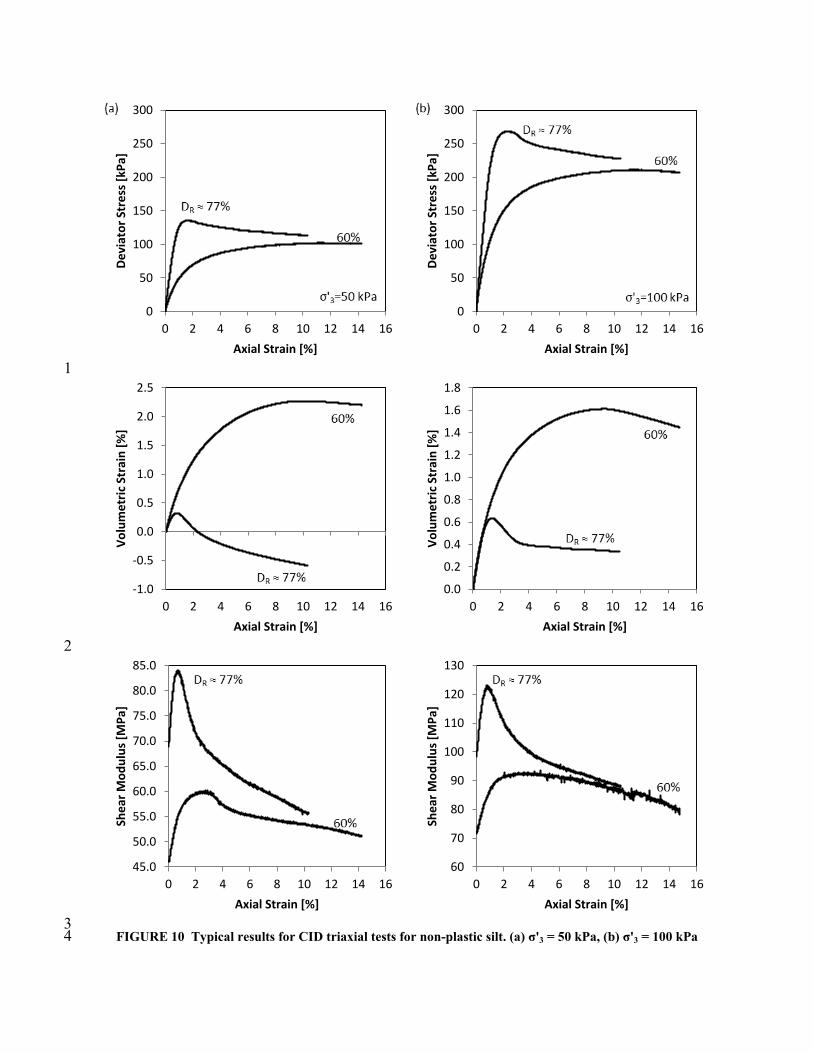
Stress-Strain Behavior of Non-Plastic Silt 14
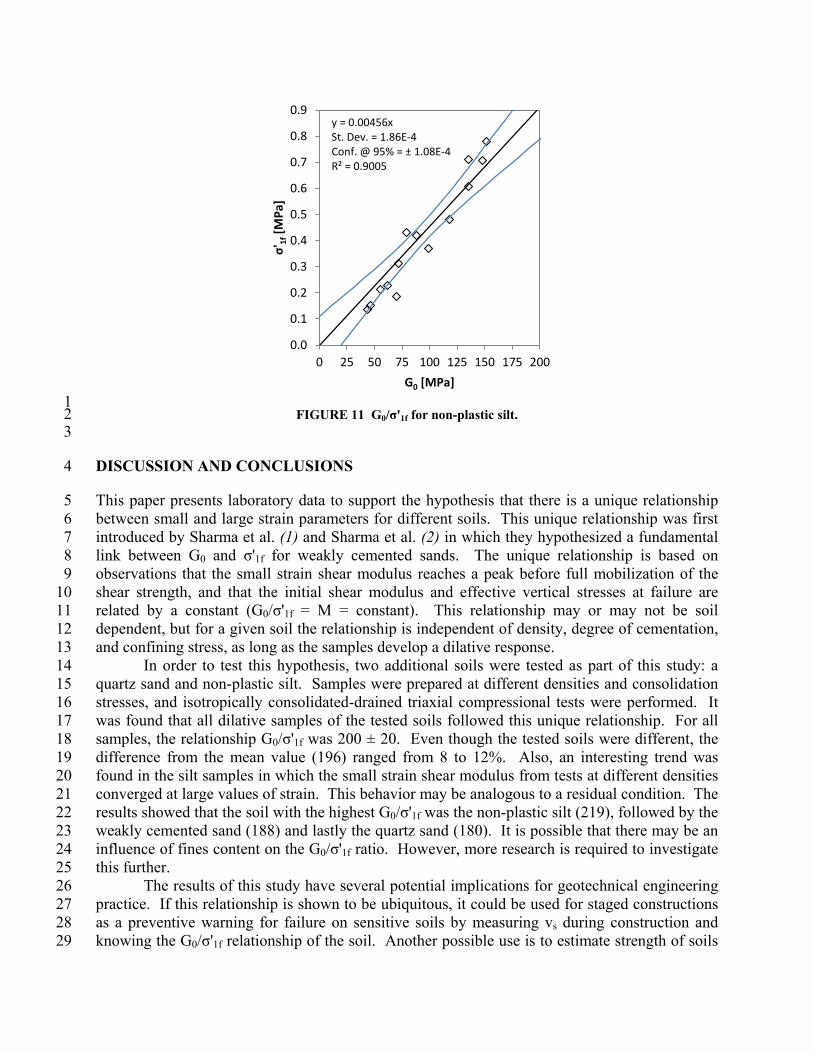
Typical results of tests performed on samples of non-plastic silt are shown in Figure 10. 15 Similarly to the weakly cemented sand and the quartz sand, there is a clear relationship between 16 G0, and σ'1f. One interesting difference with the silt data is that the small strain shear modulus 17 from tests at different densities appears to converge at large values of strain, which may be 18 analogous to a residual condition. Another difference observed from the non-plastic silt is the 19 fact that the peak value of small strain shear modulus does not necessarily occur close to the 20 peak value of the volumetric strain. Figure 11 shows the relationship between G0 and σ'1f of 14 21 tested samples along with the curves of 95% confidence. For the non-plastic silt, this 22 relationship yields a G0/σ'1f ratio equal to 219. This value is much higher than the results 23 obtained from the cemented sand and quartz sand. It is possible that fines content may play a 24 role in the G0/σ'1f ratio. 25
y = 0.00557x St. Dev. = 2.79E-4 Conf. @ 95% = ± 1.55E-4 R² = 0.8599
0.0
0.2
0.4
0.6
0.8
1.0
1.2
0 50 100 150 200
σ'f [
MPa
]
G0 [MPa]
TRB 2013 Annual Meeting Paper revised from original submittal.
12
1
2
3 FIGURE 10 Typical results for CID triaxial tests for non-plastic silt. (a) σ'3 = 50 kPa, (b) σ'3 = 100 kPa 4
0
50
100
150
200
250
300
0 2 4 6 8 10 12 14 16
Devi
ator
Str
ess [
kPa]
Axial Strain [%]
0
50
100
150
200
250
300
0 2 4 6 8 10 12 14 16
Devi
ator
Str
ess [
kPa]
Axial Strain [%]
-1.0
-0.5
0.0
0.5
1.0
1.5
2.0
2.5
0 2 4 6 8 10 12 14 16
Volu
met
ric S
trai
n [%
]
Axial Strain [%]
0.0
0.2
0.4
0.6
0.8
1.0
1.2
1.4
1.6
1.8
0 2 4 6 8 10 12 14 16
Volu
met
ric S
trai
n [%
]
Axial Strain [%]
45.0
50.0
55.0
60.0
65.0
70.0
75.0
80.0
85.0
0 2 4 6 8 10 12 14 16
Shea
r Mod
ulus
[MPa
]
Axial Strain [%]
60
70
80
90
100
110
120
130
0 2 4 6 8 10 12 14 16
Shea
r Mod
ulus
[MPa
]
Axial Strain [%]
TRB 2013 Annual Meeting Paper revised from original submittal.
13
1 FIGURE 11 G0/σ'1f for non-plastic silt. 2
3
DISCUSSION AND CONCLUSIONS 4
This paper presents laboratory data to support the hypothesis that there is a unique relationship 5 between small and large strain parameters for different soils. This unique relationship was first 6 introduced by Sharma et al. (1) and Sharma et al. (2) in which they hypothesized a fundamental 7 link between G0 and σ'1f for weakly cemented sands. The unique relationship is based on 8 observations that the small strain shear modulus reaches a peak before full mobilization of the 9 shear strength, and that the initial shear modulus and effective vertical stresses at failure are 10 related by a constant (G0/σ'1f = M = constant). This relationship may or may not be soil 11 dependent, but for a given soil the relationship is independent of density, degree of cementation, 12 and confining stress, as long as the samples develop a dilative response. 13
In order to test this hypothesis, two additional soils were tested as part of this study: a 14 quartz sand and non-plastic silt. Samples were prepared at different densities and consolidation 15 stresses, and isotropically consolidated-drained triaxial compressional tests were performed. It 16 was found that all dilative samples of the tested soils followed this unique relationship. For all 17 samples, the relationship G0/σ'1f was 200 ± 20. Even though the tested soils were different, the 18 difference from the mean value (196) ranged from 8 to 12%. Also, an interesting trend was 19 found in the silt samples in which the small strain shear modulus from tests at different densities 20 converged at large values of strain. This behavior may be analogous to a residual condition. The 21 results showed that the soil with the highest G0/σ'1f was the non-plastic silt (219), followed by the 22 weakly cemented sand (188) and lastly the quartz sand (180). It is possible that there may be an 23 influence of fines content on the G0/σ'1f ratio. However, more research is required to investigate 24 this further. 25
The results of this study have several potential implications for geotechnical engineering 26 practice. If this relationship is shown to be ubiquitous, it could be used for staged constructions 27 as a preventive warning for failure on sensitive soils by measuring vs during construction and 28 knowing the G0/σ'1f relationship of the soil. Another possible use is to estimate strength of soils 29
y = 0.00456x St. Dev. = 1.86E-4 Conf. @ 95% = ± 1.08E-4 R² = 0.9005
0.0
0.1
0.2
0.3
0.4
0.5
0.6
0.7
0.8
0.9
0 25 50 75 100 125 150 175 200
σ'1f
[MPa
]
G0 [MPa]
TRB 2013 Annual Meeting Paper revised from original submittal.

14
in which sampling is difficult (e.g. loess, cemented sands). Additional studies suggest that this 1 unique relationship may lead to the determination of soil strength parameters such as internal 2 friction angle φ', and cohesion c' for dilative, brittle or sensitive soils. 3
4
ACKNOWLEDGEMENTS 5
This research was funded by grants from the National Science Foundation (No. CMMI 1031135) 6 and BP America, Inc. This support is gratefully acknowledged. 7
REFERENCES 8
1. Sharma R., C. D. P. Baxter, and Y. Guadalupe. Unique Relationship between Small Strain 9 Shear Modulus and Effective Stresses at Failure for Dilatant Soils, NSF CMMI Research and 10 Innovation Conference 2011, 2011, Atlanta, Georgia, 8 pgs. 11
12 2. Sharma R., C. D. P. Baxter, and M. Jander. Relationship between shear wave velocity and 13
stresses at failure for weakly cemented sand during triaxial compression. Soils and 14 Foundations Japanese Geotechnical Society, Vol. 51, No. 4, 2011, pp. 761-771. 15
16 3. Andrus R. D. and K. H. Stokoe. Liquefaction Resistance of Soils from Shear-Wave 17
Velocity. Journal of the Geotechnical and Geoenvironmental Engineering, Vol. 126, No. 11, 18 2000, pp. 1015-1025. 19
20 4. Yunmin, C., K. Han, and C. Ren-peng. Correlation of Shear Wave Velocity with 21
Liquefaction Resistance based on Laboratory Tests. Soil Dynamics and Earthquake 22 Engineering, Vol. 25, 2005, pp. 461-469. 23
24 5. Baxter, C. D. P., A. S. Bradshaw, R. A. Green, and Jian-Hua Wang. Correlation between 25
Cyclic Resistance and Shear-Wave Velocity for Providence Silts. Journal of the 26 Geotechnical and Geoenvironmental Engineering, Vol. 134, No. 1, 2008, pp. 37-46. 27
28 6. Kramer, S. L. Geotechnical Earthquake Engineering, Prentice Hall, Inc., New Jersey, 1996. 29
30 7. Dyvik, R and C. Madshus. Lab Measurements of Gmax using Bender Elements. 31
Proceeding, ASCE Conference on Advances in the Art of Testing Soils Under Cyclic 32 Conditions, New York, 1985, pp. 186-196. 33
34 8. Richart, F. E., J. R. Hall, and R. D. Woods. Vibrations of Soils and Foundations. Prentice-35
Hall, Inc., New Jersey, 1970. 36 37
TRB 2013 Annual Meeting Paper revised from original submittal.
15
9. Hoffmann, W. Evaluation of real cohesion for a weakly cemented sand. MS Thesis. The 1 University of Rhode Island, 2008. 2
3 10. ASTM D4253-00. Standard Test Methods for Maximum Index Density and Unit Weight of 4
Soils Using a Vibratory Table. West Conshohocken, PA 19428-2959, US. 2000. 5 6
11. ASTM D4254-00. Standard Test Methods for Minimum Index Density and Unit Weight of 7 Soils and Calculation of Relative Density. West Conshohocken, PA 19428-2959, US. 2000. 8
9 12. Bradshaw, A. S. and C. D. P. Baxter. Sample Preparation of Silts for Liquefaction Testing. 10
Geotechnical Testing Journal, Vol. 30, No. 4, 2007, 9 pgs. 11 12
13. Taylor, O. D. S. Use of Energy-Based Liquefaction Approach to Predict Deformation in 13 Silts due to Pile Driving. PhD Dissertation. The University of Rhode Island, 2011. 14
15 14. Jander, M. Small Strain Shear Modulus Degradation of Cemented Sand during Drained 16
Shear. MS Thesis. The University of Rhode Island, 2009. 17 18
15. Yun, T.S. and, J.C. Santamarina. Decementation, Softening, and Collapse: Changes in 19 Small-Strain Shear Stiffness in k0 Loading. Journal of the Geotechnical and 20 Geoenvironmental Engineering, Vol. 131, No. 3, 2005, pp.350-358. 21 22
16. Baxter, C.D.P. and J.K. Mitchell. Experimental Study on the Aging of Sands. Journal of the 23 Geotechnical and Geoenvironmental Engineering, Vol. 130, No. 10, 2004, pp. 1051-1062. 24 25
17. Fam, M. and J.C. Santamarina, Study of Geoprocesses with Complementary Mechanical and 26 Electromagnetic Wave Measurements in an Oedometer. Geotechnical Testing Journal, Vol. 27 18, No. 3, 1995, pp. 307-314. 28
29 18. Fam, M.A. and J.C. Santamarina. Study of Clay-Cement Slurries with Mechanical and 30
Electromagnetic Waves. Journal of Geotechnical Engineering, Vol. 122, No. 5, 1996, pp. 31 365-373. 32
33 19. Fernandez, A.L. and J.C. Santamarina. Effect of cementation on the small-strain parameters 34
of sands. Canadian Geotechnical Journal, Vol. 38, 2001, pp. 191-199. 35 36
20. Lee, J-S., and J. C. Santamarina. Bender Elements: Performance and Signal Interpretation. 37 Journal of the Geotechnical and Geoenvironmental Engineering, Vol. 131, No. 9, 2005, pp. 38 1063-1070. 39 40
TRB 2013 Annual Meeting Paper revised from original submittal.
16
21. Yashamita, S., T. Kawagushi, Y. Nakata, T. Mikami, T. Fujiwara, and S. Shibuya. 1 Interpretation of International Parallel Tests on the Measurement of Gmax using Bender 2 Elements. Organized by TC-29 of International Society of Soil Mechanics Geotechnical 3 Engineering, 2007, 76 pgs. 4
5 22. Sharma, R. Strength Prediction of Weakly Cemented Sands from Geophysical Logs. PhD 6
Dissertation. The University of Rhode Island, 2010. 7 8
23. Shirley, D. J. An Improved Shear Wave Transducer. Journal of Acoustical Society of 9 America, Vol. 63, No. 5, 1978, pp.1643-1645. 10
11 24. Wang, Jian-Hua, K. Moran, and C. D. P. Baxter. Correlation between Cyclic Resistance 12
Ratios on Intact and Reconstituted Offshore Saturated Sands and Silts with the Same Shear 13 Wave Velocity. Journal of the Geotechnical and Geoenvironmental Engineering, Vol. 132, 14 No. 12, 2006, pp. 1574-1580. 15
16 25. Hanchar, S. T. A Comparison of Bender Elements and Torsional Shear Wave Transducers. 17
MS Thesis. The University of Rhode Island, 2006. 18 19
26. Baxter, C.D.P. and R. Sharma. Shear Wave Velocity of Weakly Cemented Silty Sand 20 During Drained and Undrained Triaxial Compression. GeoCongress 2012, 2012, ASCE, 12 21 pgs. 22
TRB 2013 Annual Meeting Paper revised from original submittal.