Link performance measurement and improvement using ...
71
Link performance measurement and improvement using Bluetooth mesh network DURGAPRASAD SRINIVASA HARSHAVARDHAN MANJUNATH MASTER´S THESIS DEPARTMENT OF ELECTRICAL AND INFORMATION TECHNOLOGY FACULTY OF ENGINEERING | LTH | LUND UNIVERSITY
Transcript of Link performance measurement and improvement using ...

Link performance measurement and improvement
using Bluetooth mesh network
DURGAPRASAD SRINIVASAHARSHAVARDHAN MANJUNATHMASTER´S THESISDEPARTMENT OF ELECTRICAL AND INFORMATION TECHNOLOGYFACULTY OF ENGINEERING | LTH | LUND UNIVERSITY
Printed by Tryckeriet i E-huset, Lund 2020
DU
RG
APR
ASA
D SR
INIV
ASA
& H
AR
SHA
VA
RD
HA
N M
AN
JUN
ATH
Link performance m
easurement and im
provement using B
luetooth mesh netw
orkLU
ND
2020
Series of Master’s thesesDepartment of Electrical and Information Technology
LU/LTH-EIT 2020-797http://www.eit.lth.se

Link performance measurement and improvementusing Bluetooth mesh network
Durgaprasad Srinivasa , Harshavardhan [email protected] , [email protected]
Department of Electrical and Information TechnologyLund University
Supervisor: Michael Lentmaier(LTH),Peter Karlsson(u-blox),Magnus Persson(u-blox)
Examiner: Fredrik Rusek
November 26, 2020

c© 2020Printed in SwedenTryckeriet i E-huset, Lund

Abstract
Bluetooth is a short-range technology, it helps with wireless communication be-tween many electronic devices. Bluetooth low energy (BLE) is the advanced ver-sion of Bluetooth which uses low energy compared to the standard Bluetooth.Bluetooth mesh technology play a crucial role in the Internet of things (IoT).The IoT mesh technology enables many-to-many and one-to-many communica-tion. This project deals with creating a Bluetooth mesh network model usingMATLAB as a tool to replicate the readings obtained from real-world measure-ments. The purpose of this model is to give an overview of how the nodes inthe Bluetooth mesh network will work by giving performance such as Round triptime, Time to live and throughput of each individual node, this in turn will helpa consumer who will purchase the Bluetooth nodes for the mesh network abouttheir performance and number of nodes that would be required for a given areawith optimal performance.
i

ii

Popular Science Summary
“Bluetooth”, it has become very common and has been used widely. Bluetoothtechnology has developed very much and recently there is a new part of Bluetoothtechnology, which is the Bluetooth Mesh Network. The Bluetooth Mesh Networkis similar to wireless mesh networks used in offices or industries to connect all thecomputers to the internet, but, here in Bluetooth mesh network, it is used to sendsmall information from time to time like the temperature in the building or forsome applications like switching lights on and off. Bluetooth Mesh forms a crucialpart of IoT.
The structure of the project was to measure the latency of nodes in the Blue-tooth Mesh network. The measurements are carried out with the help of Bluetoothmodules. This Bluetooth Mesh Network is for an office of area 50mx60m. Themeasurements are undertaken with the help of 4 test points (Bluetooth modulesexplained later in the report) which are placed at 4 corners of the office, thereare 30 nodes spread out randomly in the office. These test points send a randommessage to each node and the node responds with an acknowledgment, this, inturn, finds the RTT (Round Trip Time) between the test point and the node,this measurement is carried out for all 30 nodes from each of the different testpoints to get different RTT. Before this measurement, we can configure the Timeto Live (TTL) for the mesh network and the node properties. To limit these hopsto a certain value we set the TTL to 5 (this is considered in the measurements aswell). And, the throughput is also measured, but in this case, it is measured onlybetween the test points. There are two different types of nodes used in here threedifferent background traffic types, therefore this gives us 6 different measurementvalues. This measurement is carried out using the C-Sharp platform. Our taskwas to create a theoretical Bluetooth Mesh model using MATLAB based on thereadings obtained from the measurement.
The main aim of the project to give an idea of how the mesh network works andcan be used as a base to figure out the number of nodes that would be required forany given area and for the given latency requirement for a particular applicationwhich is achieved by the simulation model.
iii

iv

Acknowledgement
We would first like to thank our thesis supervisor Michael Lentmaier and examinerFredrik Rusek of the faculty of engineering at Lund University. The door to Prof.Lentmaier office was always open whenever we ran into a trouble spot or hada question about our research or writing. He steered us in the right directionwhenever he thought we needed it.
We would also like to thank the experts who were involved and helped us inthis project at u-blox: Peter Karlsson, Magnus Persson and Pär-Olof Håkansson.Without their passionate participation and input, this project would not have beensuccessfully conducted.
Finally, we must express our very profound gratitude to all our companionsfor providing us with unfailing support and continuous encouragement throughoutour years of study and through the process of researching and writing this thesis.This accomplishment would not have been possible without them. Thank you.
v

vi

Acronyms and abbreviations
ATT Attribute ProfileEVK Evaluation KitGATT Generic Attribute ProfileHCI Host Control InterfaceIoT Internet of ThingsISM Industrial, Scientific and MedicalL2CAP Logical Link Control and Adoption ProtocolLPN Low Power NodePDU Protocol Data UnitRTT Round Trip TimeSEQ Sequence NumberSIG Special Interest GroupSMP Security Manager ProtocolTTL Time To Live
vii

viii

Table of Contents
1 Introduction 11.1 Background and motivation . . . . . . . . . . . . . . . . . . . . . . 11.2 Project aims and main challenges . . . . . . . . . . . . . . . . . . . 21.3 Approach and methodology . . . . . . . . . . . . . . . . . . . . . . 21.4 Literature survey . . . . . . . . . . . . . . . . . . . . . . . . . . . . 3
2 Bluetooth low energy and Bluetooth mesh network overview 52.1 Bluetooth low energy . . . . . . . . . . . . . . . . . . . . . . . . . . 52.2 Bluetooth mesh concepts . . . . . . . . . . . . . . . . . . . . . . . . 72.3 Bluetooth mesh nodes . . . . . . . . . . . . . . . . . . . . . . . . . 11
3 Bluetooth mesh architecture and security 153.1 Overview of Bluetooth mesh architecture . . . . . . . . . . . . . . . 153.2 Bluetooth mesh protocol . . . . . . . . . . . . . . . . . . . . . . . . 173.3 Security of Bluetooth mesh network . . . . . . . . . . . . . . . . . . 19
4 Methodology and measurement of Bluetooth mesh network 214.1 Proposed mesh network layout . . . . . . . . . . . . . . . . . . . . . 214.2 Considered parameters for the Bluetooth mesh network . . . . . . . 224.3 Scenarios considered . . . . . . . . . . . . . . . . . . . . . . . . . . 234.4 Measurements . . . . . . . . . . . . . . . . . . . . . . . . . . . . . 25
5 Simulation model and results 295.1 Layout of the nodes in mesh network . . . . . . . . . . . . . . . . . 295.2 Implementation . . . . . . . . . . . . . . . . . . . . . . . . . . . . . 295.3 Results . . . . . . . . . . . . . . . . . . . . . . . . . . . . . . . . . 32
6 Conclusion 45
References 49
A Extra Materials 51A.1 AT commands . . . . . . . . . . . . . . . . . . . . . . . . . . . . . 51A.2 OP-CODE used for measurements, specified by Bluetooth SIG . . . . 53
ix

x

List of Figures
1.1 Bluetooth mesh network. [19] . . . . . . . . . . . . . . . . . . . . . 1
2.1 Channel distribution in Bluetooth Low Energy.[5] . . . . . . . . . . . 52.2 Advertising mode in Bluetooth Low Energy.[6] . . . . . . . . . . . . 62.3 Connection mode in Bluetooth Low Energy.[7] . . . . . . . . . . . . 62.4 Bluetooth mesh standard through a publish/subscribe model. [8] . . 72.5 Node Composition. [8] . . . . . . . . . . . . . . . . . . . . . . . . . 82.6 Provisioning of a new device for Bluetooth mesh. [10] . . . . . . . . 102.7 Different features of nodes. [20] . . . . . . . . . . . . . . . . . . . . 11
3.1 Bluetooth mesh network architecture. [11] . . . . . . . . . . . . . . 153.2 Bluetooth mesh protocol stacks.[15] . . . . . . . . . . . . . . . . . . 18
4.1 Bluetooth mesh network layout . . . . . . . . . . . . . . . . . . . . 214.2 Round trip time of Bluetooth mesh network . . . . . . . . . . . . . . 224.3 Throughput of Bluetooth mesh network . . . . . . . . . . . . . . . . 234.4 EVK NINA-B3 evaluation board . . . . . . . . . . . . . . . . . . . . 264.5 NINA-B3 microcontroller . . . . . . . . . . . . . . . . . . . . . . . . 264.6 Virtual-Here [14] . . . . . . . . . . . . . . . . . . . . . . . . . . . . 274.7 S-Center . . . . . . . . . . . . . . . . . . . . . . . . . . . . . . . . 27
5.1 Simulated layout of Bluetooth mesh network . . . . . . . . . . . . . 305.2 ALLTreon-off RTT vs distance(Measurement) . . . . . . . . . . . . . 335.3 ALLTreon-off RTT vs distance(Simulation model) . . . . . . . . . . 335.4 BestGuess-off RTT vs distance(Measurement) . . . . . . . . . . . . 345.5 BestGuess-off RTT vs distance(Simulation model) . . . . . . . . . . 345.6 ALLTreon-1second RTT vs distance(Measurement) . . . . . . . . . . 355.7 ALLTreon-1second RTT vs distance(Simulation model) . . . . . . . . 355.8 BestGuess-1second RTT vs distance(Measurement) . . . . . . . . . . 365.9 BestGuess-1second RTT vs distance(Simulation model) . . . . . . . 365.10 ALLTreon-10seconds RTT vs distance(Measurement) . . . . . . . . . 375.11 ALLTreon-10seconds RTT vs distance(Simulation model) . . . . . . 375.12 BestGuess-10seconds RTT vs distance(Measurement) . . . . . . . . 385.13 BestGuess-10seconds RTT vs distance(Simulation model) . . . . . . 38
xi

5.14 ALLTreon TTL vs distance(Measurement) . . . . . . . . . . . . . . . 405.15 ALLTreon TTL vs distance(Simulation model) . . . . . . . . . . . . 405.16 BestGuess TTL vs distance(Measurement) . . . . . . . . . . . . . . 415.17 BestGuess TTL vs distance(Simulation model) . . . . . . . . . . . . 415.18 Throughput comparison of measurement vs model . . . . . . . . . . 425.19 Scenario of map with reduced nodes . . . . . . . . . . . . . . . . . . 435.20 Alltreon scenario with reduced nodes(Simulation model) . . . . . . . 445.21 Bestguess scenario with reduced nodes(Simulation model) . . . . . . 44
A.1 AT-Command (UBTMMOD) . . . . . . . . . . . . . . . . . . . . . 51A.2 AT-Command (UBTMPAD) . . . . . . . . . . . . . . . . . . . . . . 51A.3 AT-Command (UBTMCCB) . . . . . . . . . . . . . . . . . . . . . . 52A.4 AT-Command (UBTMRPUB) . . . . . . . . . . . . . . . . . . . . . 52A.5 Server reply (UUBTMRCV) . . . . . . . . . . . . . . . . . . . . . . 52
xii

List of Tables
4.1 Measurement traffic models . . . . . . . . . . . . . . . . . . . . . . 23
5.1 Average RTT for measured values . . . . . . . . . . . . . . . . . . . 395.2 Average RTT for simulation model values . . . . . . . . . . . . . . . 395.3 Average RTT retransmission for measured values . . . . . . . . . . . 395.4 Average RTT retransmission for simulation model values . . . . . . . 395.5 Average RTT values . . . . . . . . . . . . . . . . . . . . . . . . . . 43
A.1 Messages name and its opcode . . . . . . . . . . . . . . . . . . . . . 53
xiii

xiv

Chapter 1Introduction
Technology advancement in Bluetooth has made tremendous improvements. TheBluetooth mesh was first introduced in 4.0, in which it makes difference betweennormal Bluetooth and low energy Bluetooth. The Bluetooth LE will save energyand serves a good purpose for the Internet of things (IoT) and this has beenimplemented in many applications. Bluetooth 4.0 is the source for the Bluetoothmesh, Bluetooth 5.0 is the advanced version of the Bluetooth Low Energy andwith the more specification and also supports Bluetooth mesh.
Figure 1.1: Bluetooth mesh network. [19]
Bluetooth mesh enables many-to-many communication between different nodes.These different nodes in the network will communicate with each other directly orvia multi-hop communication. This mesh technology is used in different applica-tions like IoT, building automation, sensor networks, and so on.
1.1 Background and motivation
IoT has increased drastically and is driving the growth of connected devices toan estimated value of 30 billion devices by 2020 [4]. Short-range technologies aretypically operating on the license-free industrial, scientific, and medical (ISM) fre-quency bands. IoT devices can be used to monitor and control the mechanical,electrical, and electronic systems used in various types of buildings in home au-tomation and building automation system. With devices such as IEEE 802.15.4
1

2 Introduction
based ZigBee and thread technology, Bluetooth LE, etc., are easily disturbed bythe other networks on the 2.4GHz bands.
Bluetooth LE is the low-power variant of classic Bluetooth which operates inthe same 2.4 GHz ISM band and uses frequencies between 2402 and 2480 MHz.Bluetooth LE offers two modes of communication between devices: advertisingmode or connection-oriented mode. Both communication techniques have theiruse and both of them can be used to realize Bluetooth mesh networking. However,the Bluetooth special interest group (SIG) has chosen to use the advertising modeas the core underlying technique for the Bluetooth mesh standard.
The communication in a Bluetooth mesh network uses a flooding mechanism,which makes sure that all the nodes in the network repeat themselves so that theyare relayed further until the destination is reached. The standard uses a new typeof BLE advertisement packet to communicate in a mesh network, which is onlysupported by devices that support both Bluetooth LE and Bluetooth mesh. For-tunately, the standard also defines a backward compatibility feature to ensure thatBLE devices that do not support Bluetooth mesh can also be part of a Bluetoothmesh network.
1.2 Project aims and main challenges
The main aim of this master’s thesis is to study the working of indoor Bluetoothmesh and its layers by building a theoretical model and to obtain the resultslike RTT (round trip time), TTL (time to live), throughput, and an approximatedistance. This theoretical model is then compared with the previously measuredresults. We differentiate this model by transmitting packets of different lengths(maximum and minimum). Nodes are placed according to the floor plan andby using the Bluetooth module (NINA-B3), which supports Bluetooth 5.0 andmesh technology we measure above mentioned parameters. Based on the resultswe obtain, we may try to modify and improve the theoretical model for betterperformance.
The main challenges are to replicate the real-life scenario in the theoreticalmodel and obtain values that match the measured values.
1.3 Approach and methodology
We initially build a theoretical model based on the floor plan using MATLAB andevaluate the key performance parameters such as RTT, TTL, and throughput.We compare the values which are obtained from the theoretical model with theparameter values provided to us.
In this method, we are going to consider the flooding technique for the com-munication between Bluetooth nodes. With this model, we differentiate the per-formance by sending messages of different lengths and we examine the parametervalues to check for variations.

Introduction 3
1.4 Literature survey
After a various literature search, we were able to find a few papers which wererelated to our work and which gave us more insight into what we were doing andthe challenges and problems that we were going to face during this project.
Utilizing Bluetooth LE as an underlying technology to implement mesh net-works has gained such importance in recent years. The paper [1] presents a com-plete background on Bluetooth mesh network, such as its network layer, how thecommunication takes place between nodes in a closed environment, the effects ofRTT, TTL, and so on. And also showing the evaluation of Bluetooth Mesh perfor-mance utilizing three approaches, namely an experimental evaluation, a statisticalapproach, and a graph-based simulation model, which can be used as the basisfor our thesis work. Paper [2] depicts how problems can be caused in a meshnetwork in commercial or industrial buildings such as offices, factories with a highdensity of Wi-Fi networks and other wireless equipment, microwave ovens, etc. Inparticular, [2] shows the mechanism (flooding) of how messages are transmittedin a Bluetooth mesh network and also showing the effects of RTT by transmit-ting packets of different sizes (Bytes). Paper [3] shows the auto-configuring andtopology mapping in which any low energy Bluetooth protocol can be utilized.
We are given the values of parameters that were obtained from previous sum-mer work and we hold these values as a reference and to obtain measurementssimilar to these values.

4 Introduction

Chapter 2Bluetooth low energy and Bluetooth mesh
network overview
In this chapter we discuss the Bluetooth low energy and the concepts of Bluetoothmesh network. Several concepts are introduced and explained in depth about theBluetooth mesh network concept.
2.1 Bluetooth low energy
Bluetooth LE is first introduced in Bluetooth version 4.0 by Bluetooth SIG, whichis also known as Bluetooth smart. Bluetooth LE uses the simple modulationtechniques and also works on the same ISM band of normal Bluetooth which is2.4 GHz. The frequency lies between 2402 Mhz - 2480 Mhz. It is used in healthcare, fitness, IoT, and home automation. Bluetooth LE has over the air data rateof 125 kbps - 1 Mbps - 2 Mbps, enables the single hop, star topology network, andprovides low energy consumption.
Bluetooth LE spectrum has several channels which are divided into 2 Mhz eachwith the spacing of 2 Mhz, this gives 40 channels. The channels of Bluetooth LEis shown in the figure below. It has an advertisement channel of 37, 38, and 39, atotal of 37 main channels that are used for the connection. Bluetooth Low Energyworks in two modes: connection-oriented mode and advertising mode. Figure 2.1show the channel distribution in Bluetooth Low Energy.
Figure 2.1: Channel distribution in Bluetooth Low Energy.[5]
In the advertising mode, the Bluetooth LE send full packets to the nearbydevices to receive and process from the three advertising channels. In this process,
5

6 Bluetooth low energy and Bluetooth mesh network overview
the advertiser will transmit data and the other receiver device will scan for theadvertiser which is to receive the transmitted information. The advertising modeis explained in the Figure 2.2 below.
Figure 2.2: Advertising mode in Bluetooth Low Energy.[6]
In the connection mode, the remaining 37 channels are used to send datapackets. This mode follows the master-slave operation with the time-division mul-tiplexing (TDMA) scheme. The data is sent on a different channel with a certaininterval. The connection mode is explained in the Figure 2.3 given below.
Figure 2.3: Connection mode in Bluetooth Low Energy.[7]
Both the techniques explained above can be used for the Bluetooth LE opera-tions. In advertising mode, we can configure each node to scanning and broadcastthe incoming message for further network. The connection mode depends on thecentral and peripheral at the same time. Depending on the application each hasits own best results. As suggested by the Bluetooth special interest group (SIG)advertising mode is the most suitable mode for Bluetooth mesh standard.
Bluetooth low energy and Bluetooth mesh network overview 7
2.2 Bluetooth mesh concepts
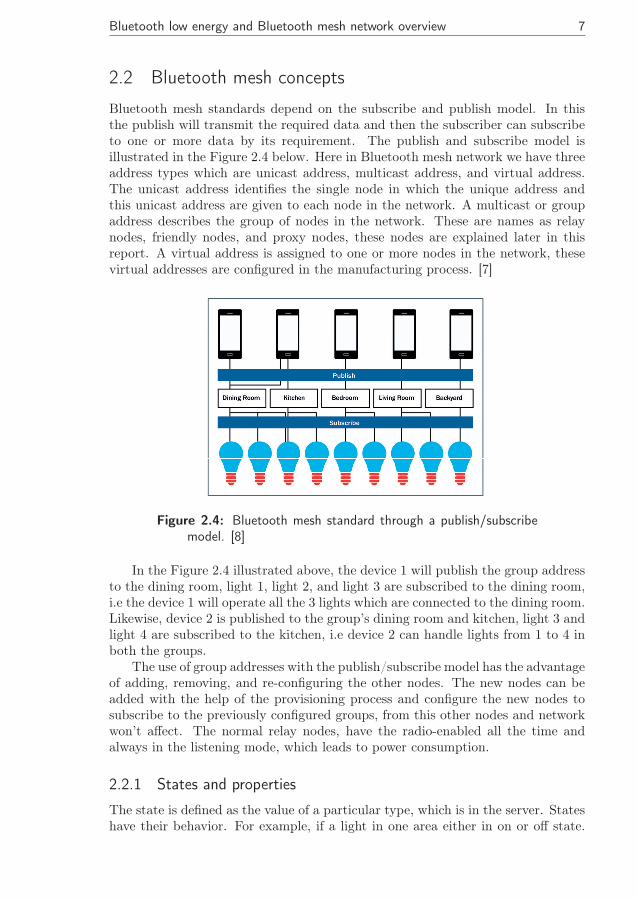
Bluetooth mesh standards depend on the subscribe and publish model. In thisthe publish will transmit the required data and then the subscriber can subscribeto one or more data by its requirement. The publish and subscribe model isillustrated in the Figure 2.4 below. Here in Bluetooth mesh network we have threeaddress types which are unicast address, multicast address, and virtual address.The unicast address identifies the single node in which the unique address andthis unicast address are given to each node in the network. A multicast or groupaddress describes the group of nodes in the network. These are names as relaynodes, friendly nodes, and proxy nodes, these nodes are explained later in thisreport. A virtual address is assigned to one or more nodes in the network, thesevirtual addresses are configured in the manufacturing process. [7]
Figure 2.4: Bluetooth mesh standard through a publish/subscribemodel. [8]
In the Figure 2.4 illustrated above, the device 1 will publish the group addressto the dining room, light 1, light 2, and light 3 are subscribed to the dining room,i.e the device 1 will operate all the 3 lights which are connected to the dining room.Likewise, device 2 is published to the group’s dining room and kitchen, light 3 andlight 4 are subscribed to the kitchen, i.e device 2 can handle lights from 1 to 4 inboth the groups.
The use of group addresses with the publish/subscribe model has the advantageof adding, removing, and re-configuring the other nodes. The new nodes can beadded with the help of the provisioning process and configure the new nodes tosubscribe to the previously configured groups, from this other nodes and networkwon’t affect. The normal relay nodes, have the radio-enabled all the time andalways in the listening mode, which leads to power consumption.
2.2.1 States and properties
The state is defined as the value of a particular type, which is in the server. Stateshave their behavior. For example, if a light in one area either in on or off state.

8 Bluetooth low energy and Bluetooth mesh network overview
The state of generic on/off will be reflected on light to be switched on/off. [7]
Figure 2.5: Node Composition. [8]
The property provides the context for interpreting characteristics. Use ofcontext which is related to properties is explained in the example, an 8-bit tem-perature state type with some associated properties, which also includes presentindoor ambient temperature and present outdoor ambient temperature. Thesetwo properties make a sensor to publish sensor readings in a way that allows areceiving client to determine the context of the temperature value. Properties areof two categories, which are read-only and read-write.
2.2.2 Messages, States and properties
Operation in a mesh network is done through messages which are circulated in theBluetooth mesh network. A message represents an operation on a state value orcollection of multiple states’ values. All messages are of three types on which theBluetooth mesh network supports. The three types of messages are GET, SET,and STATUS.
GET messages request from one or more nodes for the value of a given statein the network. To get the required response to a GET and also have relevantstate value a STATUS message is sent. To change the value of the given state inthe network we use SET message. Acknowledged SET messages in the networkwill be returned as a STATUS message in response to the SET message, butunacknowledged SET messages need not to get a response. In response to GETmessage STATUS messages are sent in the network which contains the relevantstate value.

Bluetooth low energy and Bluetooth mesh network overview 9
2.2.3 State transition and bound state
Changing from one state to another state is called the transition of states. Tran-sitions are off two types, it may be instantaneous or it takes time to execute,this time is called transition time. State transition affects the application layerdepending on the nodes.
When there is a change in one state and this change is affected to anotherstate, this is the relationship lies between the states, this relationship is calledstate binding. one state can be bind to many other states. For example, considera light controlled by a dimmer switch. The light would possess the two states,generic On/Off and generic level with each bound to the other. Reducing thebrightness of the light until generic level has a value of zero fully dimmed resultsin generic of transitioning from On to Off.
2.2.4 Models
Models will define the functionality and characteristics of an element which isrelated to the mesh network by taking all the preceding concepts. There are threecategories of the model, which are server model, client model, and control models.
The collection of states is defined in the server model, also the server modelwill take care of state transition, state binding, and messages of an element thatcontains the model may transmit or receive. This server takes care of the behaviorof messages, states, and state transitions.
The client model does not elaborate on any states. It will define the servermodel messages, in which it will transmit or receive to GET, SET, or know theSTATUS of states.
The control model has both client and server model, it allows a server modelto communicate with other client models, and also it allows a client model tocommunicate with the other server model. By extending the models we can createthe new models, a model that is not extended is called the root model. Adding orremoving the behavior of the model is not possible. The only way to create a newmodel is by extending the existing model.
2.2.5 Generics
In the Bluetooth mesh network, there are several types of devices that use genericstates and generic messages. Bluetooth mesh model defines many generic statessuch as generic on/off and generic level. Generic states and generic levels areutilized by the generalized model and generic server models.
Generics are used to create new models in the Bluetooth mesh network, ithas a wide range of devices that support the network. As mentioned before, themodels can be created by extending other models, generic models have the basisfor creating the new devices quickly.
2.2.6 Scenes
A scene is stored in different types of states which can be called at a specific timeand also for a particular type of message. It is a 16- bit numbers, they are all

10 Bluetooth low energy and Bluetooth mesh network overview
unique in the Bluetooth mesh network. For example, you want to have a certaintemperature and certain kind of lighting at home for a party, you can store thesesettings as scenes by using a configuration application and can recall this scenewhenever it is needed. It can be recalled by sending scene-related mesh messagesor automatically at a scheduled time.
2.2.7 Provisioning
In the paper [9], provisioning is the process of the device becoming a node byjoining a Bluetooth mesh network. This process involves many processes and it isa secured process. Provisioning is accomplished by devices like tablets and thesetypes of devices are called the provisioner. The provisioning steps are mentionedbelow [10].
Figure 2.6: Provisioning of a new device for Bluetooth mesh. [10]
Beaconing
Beaconing is a type of advertisement process, in this process, the unprovisioneddevice will advertise its availability by using "Mesh Beacon" AD type in the ad-vertising packets. Mesh beacons use a version of Bluetooth that came out lastDecember that turn the current generation of location-broadcasting beacons intoa two-way, net-connected network. For example, users can make a Bluetooth de-vice to search for pairing for another Bluetooth device by using the pairing option.
Invitation
In this step, the provisioner will send an invite to the device which is to be provi-sioned in the form of Protocol Data Unit (PDU). The beaconing device will senda reply with the information about itself and its availability.

Bluetooth low energy and Bluetooth mesh network overview 11
Exchanging public keys
In this step, both the beaconing device and the provisioner will exchange the publickeys, which is ephemeral or static. This process of exchanging key is done by theout-of-band (OOB) method.
Authentication
In the authentication process, the device which is to be paired(to be provisioned)gives out the random numbers, it may be single or multiple digit numbers witha suitable action. For example, while authentication the device to be paired willblink LED to show that the device is ready for authentication and the cryptographycommunication takes place in between the user device and provisioned device, thiswill complete the authentication.
Distribution of provisioning data
After completing the authentication process a session key is obtained by eachof the two devices from their private keys and the exchanged, peer public keys.This session key is used to complete the provisioning process, this will protect thesubsequent distribution of data which includes the security key, also known as anetwork (NetKey). The provisioned device possesses the NetKey, IV Index (meshsecurity parameter), and unicast address, all these are given to the provisioner.This whole thing forms a node. The provisioning process is explained in the Figure2.5.
2.3 Bluetooth mesh nodes
Nodes in the Bluetooth mesh network will receive and transmit the messages asdiscussed before. There are several types of nodes that have their capability,application, and working procedure. There are four different features in nodes forBluetooth mesh networks, which are a relay, proxy, friend, Low-power and Endnodes. These features can be enabled and disable any time in the network.
Figure 2.7: Different features of nodes. [20]

12 Bluetooth low energy and Bluetooth mesh network overview
2.3.1 Relay Nodes
Relay nodes are the nodes that support relay features. These nodes will re-transmitthe packets which are received. By this relaying process, the message can travelthrough the whole Bluetooth mesh network by taking the multiple hops betweenrelay nodes. The Bluetooth mesh network has the PDU called the TTL (Time ToLive). This TTL is used to limit the number of hops for a packet to travel fromsource to destination in the network. For example, if TTL is set to 3 then thepackets take 3 hops to reach from source to destination, if TTL is set to 0 thenthere will be no hops and also no relay of the packets, packets take a direct linkfrom source to destination. The TTL Relay nodes can be effectively used in theBluetooth mesh network. TTL will be explained in Chapter 4.
2.3.2 Proxy Nodes
As we can see in the present world many devices support Bluetooth Low Energy.These devices connect with the help of the GATT, the generic attribute profile.The GATT helps two Bluetooth Low Energy devices to communicate with eachother with the help of service and characteristics.
Proxy nodes use the GATT interface for its process in the BLE network.A Proxy Protocol, this protocol is used with a connection-oriented bearer, suchas GATT is defined in the device. The devices which use GATT will read andwrite Proxy Protocol PDUs from within GATT characteristics implemented bythe Proxy node. The Proxy node transforms these PDUs to/from mesh PDUs.These proxy nodes will allow BLE devices to interact with the mesh network eventhough they do not have the Bluetooth mesh stack.
2.3.3 Low Power Nodes and Friend Nodes
Messages when the temperature is above or below the given threshold. If the tem-perature is in the threshold, nodes remain silent. The nodes used in temperaturesensing are referred to as low power nodes (LPN). These LPN are used in manyapplications like motion sensors, temperature monitoring, etc.
Low power nodes will work connected to another node that has a permanentpower supply. Another node in which LPN is connected is called the friend node.This friend node will store the data or messages which is required by the LPN,when the LPN will poll the friend nodes, the data which is stored in the friendnodes are sent to the LPN in order by using a flag known as MD (More Data),this MD indicates if there is more messages or data to be sent from friend nodes toLPN. As mentioned in section 2.2, the relay nodes consume more power, the lowpower nodes play a crucial in Bluetooth mesh network as it consumes less power.
This relationship of the friend nodes and low power nodes is called friendship.The friendship will allow LPN to receive the messages when it is required to beactive in the Bluetooth mesh network with very little power consumption.

Bluetooth low energy and Bluetooth mesh network overview 13
2.3.4 End Nodes
End nodes are the nodes that are present in the Bluetooth mesh network, thesenodes will receive the message and do not re-transmit that message, the messagewill be ended in that node.
2.3.5 Nodes Configuration
The nodes which are used in the Bluetooth mesh network are implemented withinthe configuration server model and they are accessed using the configuration clientmodel. The configuration server state will indicate features such as a relay, proxy,low power, and friend, subscription list has all the addresses in which the nodes aresubscribed. The application keys are in the nodes. But, if the nodes are countedin a network or not is indicated by network keys and subnet keys. Configurationmessages permit the configuration client model and configuration server model.These models will support GET, SET, and STATUS operations.

14 Bluetooth low energy and Bluetooth mesh network overview

Chapter 3Bluetooth mesh architecture and security
In this chapter, the Bluetooth mesh architecture is elaborated with a detailedexplanation and the importance of the different layers will be explained. As theapplication increases in the Bluetooth mesh network, it is obvious for the networkto have a secured connection to preserve the data, security becomes an importantpart of the network. In this chapter, we take a close look at Bluetooth meshnetwork Security.
3.1 Overview of Bluetooth mesh architecture
The Bluetooth mesh network will follow the layers as shown in the Figure 3.1 below.Bluetooth Mesh has a special layer called Bluetooth Low Energy Core Specificationalong with Bearer Layer, Network Layer, Lower transport layer, Upper transportlayer, Access Layer, Foundation Model Layer, and Model Layer. Bluetooth meshbasic is Bluetooth Low Energy, devices in the Bluetooth mesh does not connectas it happens in Bluetooth Low Energy. But, it uses advertising and scanning totransmit the message with the relay feature. [16]
Figure 3.1: Bluetooth mesh network architecture. [11]
15

16 Bluetooth mesh architecture and security
3.1.1 Bluetooth Low Energy Core Specifications
As mentioned before the whole architecture has a base of Bluetooth Low Energylayer, this is not just a single layer to be specified it is more than a layer ofBluetooth mesh architecture. This BLE Core Specifications will provide all thesupport to have the basic wireless communication for the mesh network, it takesthe higher position in the architecture. The mesh system is directly dependent onthe availability of the Bluetooth Low Energy mesh stack.
3.1.2 Bearer layer
The bearer layer explains how the different mesh message packets(Protocol DataUnits or PDU) are transmitted in the network. Two types of bearers are present,they are Advertising bearer and GATT bearer.
In the advertising bearer, the scanning and advertising states of BluetoothLow Energy devices are used to transmit and receive the mesh message packets
GATT bearer uses a protocol from the proxy node called the Proxy Protocolwhich performs GATT operations, it allows the devices to communicate indirectlywith the nodes in the mesh which does not support the advertising bearer. TheGATT operation has the GATT characteristics, as mentioned before the Proxynodes have these GATT characteristics, it helps both the GATT bearer and theadvertising bearer so that the message packets are suitable for both the bearer.
3.1.3 Network layer
In the Network Layer, network message format, and various message address aredefined in here, the message format will transport layer PDUs to be transported bythe bearer layer. The network layer also implements the relay and proxy features,it supports multiple bearers which has multiple network interfaces. To communi-cate between the devices which are part of the same node network layer uses thelocal interface. It will decide the network interface to output messages over. Todetermine whether the messages from the bearer layer should be delivered to thenetwork layer for the processing. A filter controls the output messages whether todrop or deliver to the bearer layer.
3.1.4 Lower Transport Layer
Sending PDUs from the upper transport layer to the lower transport layer on a peerdevice is carried out by the Lower transport layer. The longer packets which donot fit into a single transport PDU, the lower transport layer will divide PDUs intomultiple Transport PDUs by performing the segmentation process. The receiverlower transport layer will rejoin the segmented PDUs as a single upper transportlayer PDU and this is sent to the stack.
3.1.5 Upper Transport layer
The application data passing to and from the access layer is encrypting, decrypting,and authenticated takes place in the upper transport layer. It will take care of

Bluetooth mesh architecture and security 17
the transport control messages which are related to friendship and heartbeat,these messages are generated inside and sent to different peer nodes of the uppertransport layer.
3.1.6 Access layer
This access layer defines how the application layer is responsible for defining howthe application can use the upper transport layer. It Defines the application dataformat. It will control the encryption and decryption process which happens inthe upper transport layer. Verify the data which is from the upper transport layerbefore forwarding the data to the stack.
3.1.7 Foundation Models Layer and Models Layer
The Foundation models layer will handle by implementing the network config-uration and network management models. The models’ layer will address theimplementation of models, which include behaviors, messages, states, and statebinding.
3.2 Bluetooth mesh protocol
In the previous section, we discussed the Bluetooth mesh architecture with differ-ent layers. Since Mesh network messages are inside the payload of Bluetooth LowEnergy advertisement packets. Therefore, it is possible to compare the BluetoothLow Energy and mesh protocol stacks. The Figure 3.2 shows the Bluetooth meshprotocol stacks.
As depicted in the Figure 3.2 the Bluetooth low energy consists of GenericAttribute Profile (GATT), Attribute Protocol (ATT), Security Manager Protocol,Logical Link Control and Adaption Protocol (L2CAP), Link Layer, and PhysicalLayer.
GATT is elaborated when two BLE devices exchange data using service andcharacteristics. It makes use of ATT to store services. Server/client relationshipwhich gives a clear image of GATT. GATT server has the ATT lookup data andservice and characteristics definitions and GATT client will send requests to theserver. The transactions take place in the GATT client a response is received inthe GATT server.
Transferring of data is handled by a low-level layer Attribute protocol. Fora device, it identifies its discovery, reading, and writing properties. Generic At-tribute Profile gives high-level services to the manufacturer for implementing Blue-tooth Low Energy. The main aim of the service is to transfer data with a systematicprocedure. For example, GATT defines if a device’s role is going to be Server orClient [15].
L2CAP is used in the Bluetooth protocol stack as shown in the figure 3.2.The packets are passed to Host Controller Interface (HCI) or the Link manager.L2CAP also includes the functions like Multiplex the data between different higherlayer protocols, Segmentation of packets in a server, and reassembling of packetsin clients, for a group of Bluetooth devices it provides the one-way transmission

18 Bluetooth mesh architecture and security
Figure 3.2: Bluetooth mesh protocol stacks.[15]
management of multiple data and L2CAP provides Quality of Service (QOS) forhigher-layer protocols.
GAP gives many imports to the Central devices and Peripheral devices anddefines various tasks for other devices too. Central devices are high power andmemory units like mobile phones and tablets. Peripheral devices are small, lowpower, and fewer resource devices, these peripheral devices are can be connectedto powerful central devices. Peripheral devices are proximity tags.
The Security Manager Protocol (SMP) contains two independent subsystemswhich are: initiator (SMPI) and responder (SMPR). SMPI will help multiple con-nections simultaneously by implementing the initiator features of the security man-ager protocol. SMPR helps for only one connection by implementing the respon-der feature of the security manager protocol. It also implements the cryptographictoolbox.
The link layers will help to discover the new Bluetooth devices, by assigningone device as a master and one device as a slave, the link-layer will establishthe connection between various Bluetooth devices. The link layer will handle theinterference, noise, and deep fades. It will broadcast the data by managing theconnections between the devices.
As specified by the IEEE 802.15.1 Bluetooth physical layer consists of basebandand radio features. In a small region called the piconet Bluetooth network consistsof one master and several slave devices. The master device selects the channel andtime to transmit the data packet, this process can be used by other devices inthe same piconet. A Bluetooth device in the piconet can act as both master orslave to the other devices in another piconet. The overlapping region is called thescatternet. These processes are all handled in the physical layer of the Bluetooth

Bluetooth mesh architecture and security 19
mesh network.
3.3 Security of Bluetooth mesh network
As mentioned before the security of the Bluetooth mesh network is so important, inthe coming section we have explained the mesh security fundamentals, key securityfeatures, and few attacks. The manufacturer of the Bluetooth mesh device willtake care of the security required by researching on the threats of the Bluetoothmesh network. The security and protection of the Bluetooth mesh network aremandatory. The network, individual applications, and devices should be securedand these cannot be switched off or decremented for any reason [6].
3.3.1 Fundamentals of Mesh Security
The following fundamental security statements apply to all Bluetooth mesh net-works:
1. All mesh messages are encrypted and authenticated.
2. Network security, application security, and device security are addressedindependently.
3. Security keys can be changed during the life of the mesh network via a KeyRefresh procedure.
4. Message obfuscation makes it difficult to track messages sent within thenetwork providing a privacy mechanism to make it difficult to track nodes.
5. Mesh security protects the network against replay attacks.
6. The process by which devices are added to the mesh network to becomenodes is itself secure.
7. Nodes can be removed from the network securely, in a way which preventstrashcan attacks.
3.3.2 Separation of Concerns and Mesh Security Keys
Bluetooth mesh security mainly consists of 3 keys, necessary for mesh security andother crucial functions. To understand in detail let us consider a mesh light actas a relay. As a relay, it can find itself handling messages related to the Bluetoothmesh door and security system. Light has no idea regarding these messages butneeds to rely on other nodes. At the network layer mesh uses different securitykeys to overcome the above conflict. The nodes in the mesh should contain anetwork key(NetKey) so that it is part of the network. Encryption and the pri-vate key are obtained from Netkey, with the help of the Netkey node can decryptand authenticate to the network layer hence relaying is obtained. The Network isdivided into subnets each sub-net has its Netkey. Nodes having a specific Applica-tion key (Appkey) can possess decryption of respective application data. Nodes ina mesh posses many Appkeys, but each Appkey belongs to a small subset of nodes

20 Bluetooth mesh architecture and security
of a particular function. App-keys are used for decryption and authentication ofmessages before passing them to the access layer. Appkey can work only on onespecific network i.e. key binding, but the network can organize various applica-tions. The last type of key is the Device key, only the provisioner device knowsthis key, is used in the process of secured communication between the node andprovisioner.
3.3.3 Nodes Removal, attacks Attacks and privacy
An owner can take a call to sell the node to another owner but he has to make surethe security of the network from which it is taken. Hence, it’s necessary to follow upon some methods for detaching node. Initially, a node that has to remove is addedto the blacklist from the provisioner application later Key Refresh takes place inwhich the complete set of security key is replaced but the node which is detacheddoes not contain the new NetKey and AppKey because the Key Refresh processdepends on the network. Therefore, the old node does not pose any threat.[13]
NetKey gives rise to other important keys i.e. privacy key main function is toconfound some of the crucial information such as source address (PDU header val-ues) and to make sure that the max security is provided so that tracking via passiveeavesdropping becomes difficult. Attacks based on traffic analysis is complex.
Replay Attacks
As discussed in the previous section we node contains security keys. A replayattack is one of the kinds of attacks, where valid data is transmitted repeatedlyor delayed maliciously due to interrupt by an eavesdropper to track the recipientwhere the attacking device is unauthorized. For example, various applications usevoice recognition to verify the identity. In text-dependent systems, an attacker canrecord the target individual’s speech that was correctly verified by the system, thenplay the recording again to be verified by the system and access the application sohe can track the data in the application. As a counter to protect from this kindof attack Bluetooth uses 2 network PDU fields i.e. SEQ and IV Index. SequenceNumber (SEQ) is incremented on publication of the message every time. If thenode receives a message from an element with an SEQ value less than or equal toSEQ of the last valid message then its discarded because it’s likely to be a Replayattack. IV Index is different, it is valued within messages from a given elementwhich has to be always greater than or equal to the last valid message. [13]

Chapter 4Methodology and measurement of
Bluetooth mesh network
To improve the link performance of the Bluetooth mesh network we require a wayto achieve it. The methodology being the basic key to the process, it is explainedin detail along with the measurements of the Bluetooth mesh network.
4.1 Proposed mesh network layout
Figure 4.1 shows the physical layout of the u-blox office space and the positionof each node which are spread out in the area. The configuration of each node isdepicted in this figure. (Red and blue dots have no significance)
Figure 4.1: Bluetooth mesh network layout
21
22 Methodology and measurement of Bluetooth mesh network
There are 4 test points, each test point is an evaluation kit (EVK) with aNINA-B3 module (explained later in this chapter) connected to a raspberry-pie,which makes each test point available on the network and can be connected byanother device. One more EVK, which is connected with the PC/laptop as shownin Figure 4.3, collects all the basic parameters and logs them on the PC/Laptop.In this Bluetooth mesh network, we have a total of 30 nodes in that we have twotypes of nodes, they are relay and end nodes, based on the requirements we canconfigure them as the end or relay nodes. Figure 4.1 just depicts the layout of thenodes and not the actual configuration as the configurations are varied based onthe measurements.
4.2 Considered parameters for the Bluetooth mesh network
The basic parameters which are considered in the Bluetooth mesh network arehops, TTL, RTT, and throughput.
1. Hops: Number of hops between relay nodes from source to destination.
2. TTL: It is a field in mesh network protocol data units (PDUs). Its purposeis to control whether or not a received message should be relayed and tolimit the total number of hops over which a message is ultimately relayedwithin the network.
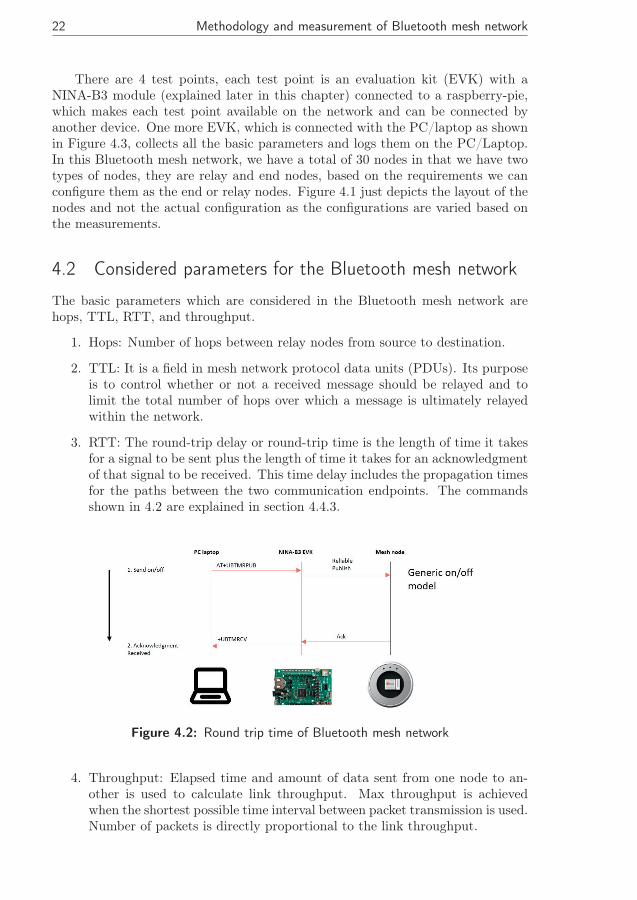
3. RTT: The round-trip delay or round-trip time is the length of time it takesfor a signal to be sent plus the length of time it takes for an acknowledgmentof that signal to be received. This time delay includes the propagation timesfor the paths between the two communication endpoints. The commandsshown in 4.2 are explained in section 4.4.3.
Figure 4.2: Round trip time of Bluetooth mesh network
4. Throughput: Elapsed time and amount of data sent from one node to an-other is used to calculate link throughput. Max throughput is achievedwhen the shortest possible time interval between packet transmission is used.Number of packets is directly proportional to the link throughput.

Methodology and measurement of Bluetooth mesh network 23
The throughput measurement is carried out between the test points only,i.e. from test point 1 to test point 4 and test point 2 to test point 3.Packet size = N bytes = N x 8 = n (bits).
Packets p sent during measurement time.
round trip time = RTT(s)
Link throughput = n x p / RTT (b/s)
Figure 4.3: Throughput of Bluetooth mesh network
4.3 Scenarios considered
In our Bluetooth mesh network test we are considering 2 types of sensor nodes,they are ALL Treon and best guess. We are considering 3 background trafficmodels for each sensor nodes, this makes a total of six different types of scenarioswhich are shown in the table 4.1 below.
Background traffic model Sensor cadence TTL Sensor nodes type1 OFF 5 Best guess2 OFF 5 ALL Treon3 10 seconds 5 Best guess4 1 second 5 Best guess5 10 seconds 5 ALL Treon6 1 second 5 ALL Treon
Table 4.1: Measurement traffic models

24 Methodology and measurement of Bluetooth mesh network
4.3.1 Sensor Nodes Types
A Treon node is a wireless sensor device for mesh networks. It is equipped with avariety of sensors to monitor environmental quality. It calculates an air quality in-dex (via measuring a broad range of gases including Volatile Organic Compounds)and keeps track of temperature, humidity, ambient light, and barometric pressure.A Treon node can also measure acceleration and detect the proximity of a magnet.Once the node is turned on, it starts automatically to measure and transmit dataat pre-configured intervals. A Treon node operates in a mesh network transmittingsensor values directly or via other nodes to a gateway, such as a Treon gateway.Typically, the data is sent from the gateway to a cloud back end for storage andanalysis. [17]
Best guess: In best guess configuration the center few nodes are configured asrelay nodes and rest of the nodes are configured as the end nodes
ALL Treon: In ALL Treon configuration all the nodes are set as relays and thereare no end nodes, so that all the nodes receive and transmit packets.
4.3.2 Sensor Cadence
The Sensor Cadence state controls the cadence of sensor reports. It allows asensor to be configured to send measured values using Sensor Status messages ata different cadence for a range of measured values. It also allows a sensor to beconfigured to send measured values when the value changes up or down by morethan a configured delta value. If the Fast Cadence High value is equal or higherthan the Fast Cadence Low value, and the measured value is within the closedinterval of [Fast Cadence Low, Fast Cadence High], the Sensor Status messagesare published more frequently. The messages shall be published every PublishPeriod divided by the Fast Cadence Period Divisor state. [12]
If the Fast Cadence High value is lower than the Fast Cadence Low value,and the measured value is lower than the Fast Cadence High value or is higherthan the Fast Cadence Low value, the Sensor Status messages are published morefrequently. The messages shall be published every Publish Period (configured forthe model) divided by the Fast Cadence Period Divisor state [12].
The Fast Cadence Period Divisor field is a 7-bit value that shall control theincreased cadence of publishing Sensor Status messages. The value is representedas a 2n divisor of the Publish Period. For example, the value 0x04 would have adivisor of 16, and the value 0x00 would have a divisor of 1.
4.3.3 Flow of the project
The main aim of the project is to measure the latency of nodes in the BluetoothMesh network. The measurements are carried out with the help of Bluetoothmodules. This Bluetooth Mesh Network is for an office of area 50m x 60m. Themeasurements are undertaken with the help of 4 test points (Bluetooth modulesexplained later in the report) which are placed at 4 corners of the office, thereare 30 nodes spread out randomly in the office. These test points send a randommessage to each node and the node responds with an acknowledgment, this in

Methodology and measurement of Bluetooth mesh network 25
turn finds the RTT (Round Trip Time) between the test point and the node, thismeasurement is carried out for all 30 nodes from each of the different test pointsto get different RTT. Before this measurement, we can configure the Time to Live(TTL) for the mesh network and the node properties. And, the throughput is alsomeasured, but in this case, it is measured only between the testpoints. There are 2different types of nodes used in here 3 different background traffic types, thereforethis gives us 6 different measurement values. This measurement is carried outusing the C-Sharp platform. Our task was to create a theoretical Bluetooth Meshmodel using MATLAB based on the readings obtained from the measurement. Forthis model, we had to take into consideration the distance between each node andtest points to make a map of the mesh network layout. To make this model assimilar to the readings obtained from the measurements, several parameters wereconsidered, the key ones were the number of hops each message took to reach fromsource to destination (that is from test point to node). To limit these hops to acertain value we set the TTL to 5 (this is considered in the measurements as well).The main focus was on the link layer of the Bluetooth LE stack. Most importantlya model will not be like real value, since, during measurements, there are severalfactors like noise and interference which affects the readings, hence, in our model,we also considered noise parameters to make the values similar to the measuredvalues. There were several other configurations based on Bluetooth SIG (SpecialInterest Group) that were used to make the model work and be as close as possibleto the measured value.
4.4 Measurements
The measurements are made concerning 4 test points (or 4 EVKs). Each testpoint sends a message to all the nodes and finds the basic parameters such asTTL, RTT, and throughput. Since 4 test points are hooked up to raspberry-piethey are available on the network, these test points are added as COM-ports onthe PC/Laptop using software called ’virtual-here’ before the measurements. Oncethe COM-ports are added, the specific COM-port numbers are to be mentionedin the configuration JSON file (JavaScript Object Notation). These are the initialsetup before the measurements. The test cases have been written on C-Sharpcode, we used Visual Studio as the IDE (Integrated Development Environment)to run this. We can configure parameters such as TTL and message type. Thismeasurement is carried out for 300 iterations as suggested in u-blox.
In case, if a problem occurs in any of the COM-ports they can be verified byrunning AT-commands on company-specific software called S-Center. We can alsouse this to check if the nodes are working properly.
4.4.1 Evaluation Kit and NINA-B3
The NINA-B3 evaluation kit is a platform that allows simulating and developinglow power IoT applications using full Bluetooth 5, Near Field Communication(NFC), and IEEE 802.15.4.
The NINA-B3 module used in the EVK is stand-alone Bluetooth low energyMicrocontroller Unit (MCU). It includes Arm R© Cortex R© -M4F microcontroller

26 Methodology and measurement of Bluetooth mesh network
with 1 MB internal flash and 256 KB RAM and having a system clock speedof 64 MHz and state of the art performance which improves power consumptionby enabling optimum power saver modes. With a 1MB flash and 256 KB RAM,they provide the best capacity for applications on top of Bluetooth LE stackssuch as beacons, GATT, and mesh. These are widely used in smart buildings,smart cities which include smart lighting systems, sensor networks, asset trackingsolutions, and automation systems. Figure 4.4 shows the evaluation kit and Figure4.5 shows the NINA-B3 microcontroller.
Figure 4.4: EVK NINA-B3 evaluation board
Figure 4.5: NINA-B3 microcontroller
4.4.2 Virtual-here
Normally the Universal Serial Bus (USB) devices are connected to the PC/Laptopsby cables. With the use of virtual-here we don’t need any cables to connect thedevices, the network in which the virtual here is connected acts as the cable toconnect the devices from PC/Laptop. This USB server solution helps the USBdevice to work remotely over a Local Area Network (LAN) network, Internet, andcloud network without the USB is physically connected to PC/Laptop.

Methodology and measurement of Bluetooth mesh network 27
Figure 4.6: Virtual-Here [14]
4.4.3 S-center u-connectXpress Software
The u-connectXpress software is a powerful and easy-to-use tool for evaluating,configuring, and testing u-blox short range modules. It includes an intuitive, easy-to-understand and easy-to-use graphical interface. S-center provides a convenientmeans to configure the u-blox short range modules, to save the configuration in theflash memory of the module, and to restore factory settings if needed. Toolbar but-
Figure 4.7: S-Center
tons are available to control settings. Each command that is executed by s-center isan AT command that is described in the Short Range Modules AT Command Man-ual. S-center also includes AT command terminal with user defined commands,support for Universal asynchronous receiver-transmitter (UART), TransmissionControl Protocol (TCP) client and TCP server interface, firmware update featurefor u-blox short range modules, chat tool, TCP reflector, and data pump.

28 Methodology and measurement of Bluetooth mesh network

Chapter 5Simulation model and results
The main purpose of creating this simulation model for the application team atu-blox is to have theoretical descriptive values on the link performance of the Blue-tooth mesh network. So that, the consumers who implement the Bluetooth meshnetwork for their specific needs would have an appropriate idea of the performanceand reliability of the Bluetooth mesh nodes and also have a brief picture of thenumber of nodes that they would require for a good performance in a given area.
5.1 Layout of the nodes in mesh network
Our first task was to replicate the node positions similar to the map provided asshown in Figure 4.1. To achieve this task we found out the distance between allthe nodes and the test points to plot the x and y coordinates, so that we couldhave a visual map in our model and to trace the path that the message packetwould take when transmitted from a source to reach the destination. The mapobtained from simulation model is as shown below. As seen from the figure, thepeach colour dots represent the relay nodes and blue dots represent the end nodes.
5.2 Implementation
This implementation is carried out in MATLAB. The main aim of this simulationwas to make it as similar to the measurement values. To make this possible weused the Communication toolbox in MATLAB. It consists of all the Bluetoothfunctions having a Bluetooth LE stack on top of which the Bluetooth mesh works.
The Bluetooth mesh works on the principle of the flooding mechanism. Asthe name suggests the transmitter floods the packet through the entire networkand chooses the path with the least hops. To control the hops, TTL is set, as thepacket takes a hop, the TTL is decremented by 1, this continues until the TTL hasbecome zero. This is a controlled flooding mechanism, as the transmitted packet isattached with the address and a sequence number, this sequence number is savedin the cache memory of each node and it prevents sending the message to the samenode twice. [18]
As shown in Figure 3.2 the functioning of each layer was modeled as a separateobject to create an entire model of the Bluetooth mesh. Following the Bluetooth
29

30 Simulation model and results
Figure 5.1: Simulated layout of Bluetooth mesh network
SIG documents several parameters were implemented, our Bluetooth mesh workson the Generic on-Off model (mentioned in Appendix).
Now coming to the parameters, TTL is set to 5 as mentioned in the measure-ment Table 4.1, based on this the hops the message needs to reach the destinationis found. For each hop, the TTL is decremented by 1, once the TTL reaches 0 themessage is discarded and no values are obtained to this reading. To identify eachnode they are addressed using hexadecimal values referred to as unicast addressand each node is given an ID, which can be used to mention the source from whichthe packet will be transmitted and the destination to which it is supposed to reach.Based on the ID’s and the unicast address of that destination node is obtainedand the packet is flooded throughout the network until it reaches the destination.The packet takes the shortest route to reach the destination.
As we know that RTT refers to the total time of sending a message from thesource until it reaches the destination and the destination sends an acknowledg-ment of receiving the message. Here we assumed that the acknowledgment willtake the same path as the original message took to reach the destination. For this,we took the time it took the reach the destination and multiplied by 2. Of course,in theory, it will be well and good, but, in real life, there are so many factors thatare affecting this.
To simulate the messages sent, we used the Generic on-off set and Genericon-off status opcodes specified by Bluetooth SIG (opcodes are mentioned in Ap-pendix). The equation 5.1 was the base foundation used to find the RTT andequation 5.2 used to find the retransmission time.
RTT = Numberofhops ∗ 10ms. (5.1)
In the above equation, the 10 ms contribute to the advertising intervals, scanninginterval, and transmission delay of the network. If the packet is lost then the re-
Simulation model and results 31
transmission takes place in the network. The retransmission formula is mentionedbelow.
Retransmission = 200ms+ 50ms ∗ TTL (5.2)
In equation 5.1 the 10ms hold for the advertising delay, scanning delay, and trans-mission times, and in the equation 5.2, 200 ms is the time the source waits if themessage fails to reach the destination in the first attempt and the 50 ms makesup for the scan interval, advertising delay and transmission time, here the scan-ning delay is longer since it is for the retransmission. For this, the re-transmitcount is set to 2, so, the source tries one more time before giving up. So, for thesecond attempt it waits another 150ms before it transmits, if this attempt also isunsuccessful, it stops transmitting and gives zero (meaning packet failed).
As mentioned earlier, all of these formulas are good, but cannot replicate thereal measurement values. The first attempt to find RTT in our model was basedon these equations, but the readings were not close to the measured value.
For the RTT simulation, we compared our RTT model which was based on theformula to the measurement values. For this, we considered RTT per-hop whichwas 10ms from the formula to the RTT per-hop of the measurement which wasranged from 12.332 ms to 14.6 ms, we found the delta between the simulationmodel and the measurement and added it to RTT calculation. Since, in reality,many elements are affecting the RTT, like interference from other wireless devices,let’s just call it noise to simplify things. We introduced noise elements like randomGaussian noise such that the values from equation 5.1 deviate approximately 30milliseconds to 100 milliseconds to get the values closer to the measured values.To set these noise values, we added random noise with the value of how muchthe simulation model was varying with the measurement and we set a thresholdvalue of 160ms, that is once the RTT of any iteration reaches 160ms or beyond,it takes the retransmission path, that is it follows equation 5.2. For the secondretransmission, the threshold was set for 500ms, for any iteration with RTT of500ms or beyond would wait for 150ms and transmit again. Usually, the secondretransmission is not considered because of very high values and only very fewiterations around 2% take the second retransmission. After few corrections tonoise levels, the RTT obtained were close enough to the measured values.
The message sent is of size 11 Bytes. As seen in the simulation model mapFigure 5.1, we are considering points 1 to 4 as test-points and the rest as normalnodes. Each node can be configured to being either a relay or an end node. In thesimulation model, the RTT is carried out for 100 iterations.
Similarly, after obtaining the round trip time from the diagonally oppositetest points (in this simulation we considered these testpoints as extra nodes).we calculate the throughput using the throughput formula. The throughput iscalculated only between the testpoints 1 to 4 and 2 to 3.
Packet size = N bytes = N x 8 = n (bits).Packets p sent during measurement time.round trip time = RTT(s)Link throughput = n x p / RTT (b/s)
We are sending a message of size 11 Bytes and the corresponding throughput isfound.

32 Simulation model and results
5.3 Results
5.3.1 Round Trip Time
Now, coming to the main part of the project is to compare the results of themeasurements and the simulation model. we compare the results of RTT concern-ing distance, TTL concerning distance, and Throughput concerning RTT. Herewe use a curve-fitting tool to see the trend of how each of them varies with theother parameter. The base is that the round trip time increases as the distanceincreases, TTL decreases as the distance increases, and throughput increases andthe RTT decreases. Here, the distance is measured in meters, RTT is in units ofmilliseconds, throughput with units of bits/second (b/s) and there are no unitsfor TTL.
The upper graphs represent the values of the measurement and the lowergraphs represent the values of the simulation model, this representation is thesame for all six readings. These graphs are plotted using the curve fitting toolin MATLAB. It shows the overall average values of the readings and shows howthey are varying. As mentioned earlier we can see from the graph that the RTTincreases as the distance increases.
For ALL Treon the number of relay nodes is more (27 of 30 nodes). This makesit more reliable and when the sensor cadence setting of ’off’ makes the backgroundtraffic less. When it is 1 second, this means that the nodes send a message afterevery one second, this leads to an increase in background traffic and when thesensor cadence is set to 10 seconds, the messages are sent every 10 seconds, thisreduces the traffic and chances for retransmission.
For best guess as seen from the graphs below the number of zeros are more,this is because there are more end nodes compared to all Treon (21 of 30 nodes arerelays). The sensor cadence settings will be the same as it follows ’off” makes thebackground traffic less and the rest of the settings of sensor cadence follows thesame principle of ALL Treon. Here, the red cross marks in the plots are the zerovalues, it means that the packets are lost or not delivered. This can happen becauseof few reasons, one is when the packets get lost due to more interference or if thedestination node is far and the packet has to take more hops (more than 5)thanthe set value of TTL, it becomes zero. Another case is when a message is sentto an end node, so, the end nodes cannot relay or transmit an acknowledgment,therefore the source node does not receive any acknowledgment, it assumes thepacket delivery has failed.
RTT = (c1 ∗ distance/3e8) + (10 ∗ hops) + c2 + r +N (5.3)
The simulation model follows equation 5.3, where c1 is the slope of the linearregion in the plot of RTT vs Distance with a slope of 2.63,this slope is varyingfor each simulation, but the mentioned slope is average of all the slope values, c2is the offset value between the measurement and the simulation model, N is theGaussian noise and r is the initial values that represents whether it is a transmissionor retransmission, r=0 with a probability of 0.698, r=200 with probability 0.081and r=500 with a probability of 0.02. The probability of packet failing is about0.201. The 5.3 for all of the simulation trials carried out in this project.

Simulation model and results 33
RTT vs distance comparison of ALLTreon-off from measurement and simulationmodel
5 10 15 20 25 30 35 40 45 50 55
Distance [m]
0
100
200
300
400
500
600
700
800R
TT
ALLTREON-OFFRELAY
RTT vs. DISTExcluded RTT vs. DISTAllTreon-offrelay
Figure 5.2: ALLTreon-off RTT vs distance(Measurement)
5 10 15 20 25 30 35 40 45 50 55
Distance [m]
0
100
200
300
400
500
600
700
800
RT
T
ALLTREON-OFFRELAY
RTT vs. DistanceExcluded RTT vs. DistanceAllTreon-offrelay
Figure 5.3: ALLTreon-off RTT vs distance(Simulation model)

34 Simulation model and results
RTT vs distance comparison of BestGuess-off from measurement and simulationmodel
5 10 15 20 25 30 35 40 45 50 55
Distance [m]
0
100
200
300
400
500
600
700
800
RT
T
BESTGUESS-OFFRELAY
RTT vs. DISTExcluded RTT vs. DISTBestguess-offrelay
Figure 5.4: BestGuess-off RTT vs distance(Measurement)
5 10 15 20 25 30 35 40 45 50 55
Distance [m]
0
100
200
300
400
500
600
700
800
RT
T
BESTGUESS-OFFRELAY
RTT vs. DistanceExcluded RTT vs. DistanceBestguess-offrelay
Figure 5.5: BestGuess-off RTT vs distance(Simulation model)

Simulation model and results 35
RTT vs distance comparison of ALLTreon-1second from measurement and sim-ulation model
5 10 15 20 25 30 35 40 45 50 55
Distance [m]
0
100
200
300
400
500
600
700
800R
TT
ALLTREON-ONE SECOND
RTT vs. DISTExcluded RTT vs. DISTAllTreon-one second
Figure 5.6: ALLTreon-1second RTT vs distance(Measurement)
5 10 15 20 25 30 35 40 45 50 55
Distance [m]
0
100
200
300
400
500
600
700
800
RT
T
ALLTREON-ONE SECOND
RTT vs. DistanceExcluded RTT vs. DistanceAllTreon-one second
Figure 5.7: ALLTreon-1second RTT vs distance(Simulation model)

36 Simulation model and results
RTT vs distance comparison of BestGuess-1second from measurement and sim-ulation model
5 10 15 20 25 30 35 40 45 50 55
Distance [m]
0
100
200
300
400
500
600
700
800
RT
T
BESTGUESS-ONE SECOND
RTT vs. DISTExcluded RTT vs. DISTBestguess-one second
Figure 5.8: BestGuess-1second RTT vs distance(Measurement)
5 10 15 20 25 30 35 40 45 50 55
Distance [m]
0
100
200
300
400
500
600
700
800
RT
T
BESTGUESS-ONE SECOND
RTT vs. DistanceExcluded RTT vs. DistanceBestguess-one second
Figure 5.9: BestGuess-1second RTT vs distance(Simulation model)

Simulation model and results 37
RTT vs distance comparison of ALLTreon-10seconds from measurement andsimulation model
5 10 15 20 25 30 35 40 45 50 55
Distance [m]
0
100
200
300
400
500
600
700
800R
TT
ALLTREON-TEN SECONDS
RTT vs. DISTExcluded RTT vs. DISTAllTreon-ten seconds
Figure 5.10: ALLTreon-10seconds RTT vs distance(Measurement)
5 10 15 20 25 30 35 40 45 50 55
Distance [m]
0
100
200
300
400
500
600
700
800
RT
T
ALLTREON-TEN SECONDS
RTT vs. DistanceExcluded RTT vs. DistanceAllTreon-ten seconds
Figure 5.11: ALLTreon-10seconds RTT vs distance(Simulationmodel)

38 Simulation model and results
RTT vs distance comparison of BestGuess-10seconds from measurement andsimulation model
5 10 15 20 25 30 35 40 45 50 55
Distance [m]
0
100
200
300
400
500
600
700
800
RT
T
BESTGUESS-TEN SECONDS
RTT vs. DISTExcluded RTT vs. DISTBestguess-ten seconds
Figure 5.12: BestGuess-10seconds RTT vs distance(Measurement)
5 10 15 20 25 30 35 40 45 50 55
Distance [m]
0
100
200
300
400
500
600
700
800
RT
T
BESTGUESS-TEN SECONDS
RTT vs. DistanceExcluded RTT vs. DistanceBestguess-ten seconds
Figure 5.13: BestGuess-10seconds RTT vs distance(Simulationmodel)

Simulation model and results 39
To make it simple, we averaged out the RTT values. We have separated thevalues which are below 200 ms. They are the transmission with the first attempt,that is no retransmission, and values above 200ms are the ones where the packetsare lost and retransmission occurs.
In these two tables 5.1 and 5.2, we have compared only the first transmissionvalues of the measurement and simulation model. For the measurement, there areabout 242 values compared to 76 values of the simulation model, hence the averagevalues of the simulation model are little higher than the measurement. But, thecloseness of the simulation model to the measurement achieved is about 90.1%,that is the All Treon model around 85.37% similar to the measurement and BestGuess model is around 95.2% close to the measurement. From this we can saythat the simulation model is reliable.
TYPE offrelay(ms) 1second(ms) 10seconds(ms)ALLTreon 63.03 64.6 61.513BestGuess 63.7215 66.015 62.514
Table 5.1: Average RTT for measured valuesTYPE offrelay(ms) 1second(ms) 10seconds(ms)ALLTreon 85.89 83.2018 81.8BestGuess 70.37 72.412 62.89
Table 5.2: Average RTT for simulation model values
These two tables 5.3 and 5.4 have the average retransmission RTT, whichis above 200ms. The simulation model values are almost close to measurementvalues.
TYPE offrelay(ms) 1second(ms) 10seconds(ms)ALLTreon 445.093 412.36 429.3902BestGuess 429.042 435.61 429.108
Table 5.3: Average RTT retransmission for measured valuesTYPE offrelay(ms) 1second(ms) 10seconds(ms)ALLTreon 410.36 415.29 409.899BestGuess 428.8731 425.5039 409.183
Table 5.4: Average RTT retransmission for simulation model values
It is quite difficult to come to any conclusion based on these since RTT variesvery because of interference present by other elements. So, to get a proper under-standing of the node performance, we find their throughput and compare them.

40 Simulation model and results
5.3.2 Time To Live
In TTL we consider only two node configuration settings, one for ALL Treon andanother for Best guess. As mentioned earlier since the number of nodes in Bestguess is less the TTL for certain iterations will be more compared to ALL Treon.The TTL remains the same for all the background traffic model. The below graphshows the TTL vs distance.
The representation holds the same, the upper graphs represent the values of themeasurement and the lower graphs represent the values of the simulation model.
TLL vs distance comparison of AllTreon from measurement and simulationmodel
5 10 15 20 25 30 35 40 45 50 55
Distance [m]
0
1
2
3
4
5
6
7
TT
L
ALLTREON
TTL vs. DistanceExcluded TTL vs. DistanceAllTreon
Figure 5.14: ALLTreon TTL vs distance(Measurement)
5 10 15 20 25 30 35 40 45 50 55
Distance [m]
0
1
2
3
4
5
6
7
TT
L
ALLTREON
TTL vs. DistanceExcluded TTL vs. DistanceAllTreon
Figure 5.15: ALLTreon TTL vs distance(Simulation model)

Simulation model and results 41
TLL vs distance comparison of BestGuess from measurement and simulationmodel
5 10 15 20 25 30 35 40 45 50 55
Distance [m]
0
1
2
3
4
5
6
7T
TL
BESTGUESS
TTL vs. DistanceExcluded TTL vs. DistanceBestguess
Figure 5.16: BestGuess TTL vs distance(Measurement)
5 10 15 20 25 30 35 40 45 50 55
Distance [m]
0
1
2
3
4
5
6
7
TT
L
BESTGUESS
TTL vs. DistanceExcluded TTL vs. DistanceBestguess
Figure 5.17: BestGuess TTL vs distance(Simulation model)
The TTL is a little different than measurement values because, in measure-ment, the node configurations have been varied consistently, but, in our simulation,we are keeping the node configurations constant, that is one configuration settingfor ALL Treon and one configuration setting for Best Guess for all the iterations.

42 Simulation model and results
5.3.3 Throughput
To get a better idea of how the nodes are working we take the throughput mea-surements since the RTT is quite unreliable due to noise. But from these results,we can properly compare the result and choose the node with better performance.
The throughput measurement is carried out between the test points 1 to 4 and2 to 3. In the measurement there are 30 iterations for each test run, this is carriedout for both the type of sensor nodes and the three background traffic models.In the simulation we have considered 30 iterations same as measurement, and thethroughput is calculated using the formula mentioned in the Section 4.2. For thethroughput measurement and in the simulation model 30 message packets are sentand each message packet is of size 11 Bytes. To show the comparison we havetaken the average value of the throughput for both measurement and simulationmodel in Figure 5.18.
Figure 5.18: Throughput comparison of measurement vs model
As we can see from the above figure ALL Treon nodes has the better perfor-mance and one second sensor cadence setting achieves peak through put. Fromthis we can say that the Treon nodes have better throughput and in turn lesserround trip time.

Simulation model and results 43
5.3.4 Reliability of simulation mesh model
To check the reliability of the model and to show that it is not just replicatingthe measurement values, we simulated another set of scenarios for RTT values.In this scenario, we reduced the number of nodes almost by half (16 nodes), wesimulated for one set of values for each sensor node types, that is for ALL Treonand Bestguess. There were few changes made for the configurations, the TTL wasset to 6 in ALL Treon case and TTL was set to 7 in Bestguess case. The mapin Figure 5.19 shows the layout of the nodes. The plots show the values of RTT
Figure 5.19: Scenario of map with reduced nodes
vs Distance. To be more accurate, we tabulated the average values of RTT forthe transmission time and one for retransmission time. As seen from the table,the average RTT values are higher in this case, this is because, the nodes arespread apart and it will the packet more hops to reach the destination, this inturn increases the RTT. There are more chances of retransmission because, thepackets delivery gets failed, due to more number of hops.
TYPE Avg transmission Time (ms) Avg re-transmission time (ms)ALLTreon 108.4629 531.6361BestGuess 109.9756 686.3855
Table 5.5: Average RTT values

44 Simulation model and results
Alltreon and Bestguess scenarios in simulation model with reduced nodes
5 10 15 20 25 30 35 40 45 50 55
Distance [m]
0
100
200
300
400
500
600
700
800
RT
T
ALLTREON
RTT vs. DistanceExcluded RTT vs. Distanceuntitled fit 1
Figure 5.20: Alltreon scenario with reduced nodes(Simulationmodel)
5 10 15 20 25 30 35 40 45 50 55
Distance [m]
0
100
200
300
400
500
600
700
800
RT
T
BEESTGUESS
RTT vs. DistanceExcluded RTT vs. DistanceBestguess
Figure 5.21: Bestguess scenario with reduced nodes(Simulationmodel)

Chapter 6Conclusion
All of the results of measurements and simulation models were done to knowthe optimal performance of the Bluetooth Mesh Network and node performance.These results will give a brief idea for the customers who purchase these Bluetoothnodes about its performance and the number of nodes that would be required foroptimal performance in a given work environment.
Now, coming to the approximation of the number of nodes that would berequired in a Bluetooth mesh network in a given area, we have made a briefcalculation based on our measurements and simulation and with few assumptions.
Considering the node requirements for an office/building of area (50m x 50m).From the measurements and simulation, we have a base RTT for a single hop fromsource to destination to be around 11.854milliseconds(including all the backgroundtraffic) and the vicinity range of each node to be 15 meters, with these as a keyfactor, we calculate the number of nodes that would be required.
Let’s consider a scenario when the requirements of RTT is below 100millisec-onds. To fulfill these criteria, we can assume to have TTL configured to 4 or 5 (canbe max up to 128). Since the distance per hop is around 12milliseconds, approxi-mately 16-17 nodes would be sufficient, with an average RTT of 35-40 millisecondsand average RTT from corner to corner nodes to be around 72 milliseconds(theseare the values between node to node). The number of nodes can be increasedto around 20 for better performance. If the RTT requirements are not too tight,then, nodes can be reduced by half, with increased TTL, this scenario of the effectof reducing the nodes has been shown using the simulation model. Depending onthe application of the nodes in the Bluetooth Mesh Network, if the information isto be sent more frequently (for example, frequent heartbeat readings), the sensorcadence value can be set to a lower threshold value.
45

46 Conclusion

Future Work
During certain applications (Temperature sensing mostly) Low Power nodes areused, this reduces the power consumption by remaining silent when it is not needed.This LPN works in connection with another node called the Friend node. Thefriend feature is currently not available in the current Treon node which was usedin the measurements, this can be implemented in the future when the nodes areupdated. Also, when the transmitting message sizes increase, which gives rise tothe segmentation of messages. The feature of segmentation can be enabled onthe Bluetooth LE stack and should check if there is any significant impact onparameters such as RTT and throughput.
47

48 Conclusion

References
[1] Baert, M.; Rossey, J.; Shahid, A.; Hoebeke, J. "The Bluetooth Mesh Standard:An Overview and Experimental Evaluation." vol. 18, pp. 2409, Sensors 2018.
[2] Michael Karlsson, "MiraMesh, Thread and Bluetooth Mesh; A study on wire-less mesh network disturbance resilience." LumenRadio AB, Sweden, 2019.
[3] Ali, Hassan.; Anna, Ahlquist. Previous thesis work on "Using BLE meshnetwork for indoor tracking."Master Thesis, Malmö universitet/Teknik ochsamhälle, Sweden, 2019.
[4] https://en.wikipedia.org/wiki/Internet_of_things
[5] https://microchipdeveloper.com/wireless:ble-link-layer-channels
[6] "Bluetooth Smart and Nordic’s Softdevices - Part 1, GAP Advertising."It is available at: https://devzone.nordicsemi.com/nordic/short-range-guides/b/bluetooth-low-energy/posts/bluetooth-smart-and-the-nordics-softdevices-part-1
[7] "Bluetooth Low Energy (BLE) overview." It is available at:https://www.global-tag.com/bluetooth-low-energy-ble-overview/
[8] "Getting Started with Bluetooth Mesh - AN227069." It is available at:https://www.cypress.com/html_doc/AppNotes/AN227069/index.html#getting-started-with-bluetooth-mesh-an227069
[9] Ngela Hernández-Solna.; David Pérez-Díaz-De-Cerio.; Mario García-Lozano.;Antonio Valdovinos Bardají.; José-Luis Valenzuela. "Bluetooth Mesh Analy-sis, Issues, and Challenges." pp. 1-1, IEEE Access, 2020.
[10] https://www.bluetooth.com/blog/provisioning-a-bluetooth-mesh-network-part-1/
[11] "The Fundamental Concepts of Bluetooth Mesh Networking." It isavailable at: https://www.bluetooth.com/blog/the-fundamental-concepts-of-bluetooth-mesh-networking-part-2/
[12] "Bluetooth Mesh Profile specification, Version 1.0 or later."
[13] A.A. Pammi. ”Threats, Countermeasures, and Research Trends for BLE basedIoT Devices.” Master Thesis, Arizona State University, US, 2017.
49

50 References
[14] http://www.isagecomm.com/virtual-usb-server-setup-guide/
[15] https://www.eetimes.com/the-highlights-of-bluetooth-mesh-networking-technology/#
[16] "Mesh Network Performance Comparison Accessed." Sil-icon Labs, AN1142, Mar.3, 2020. It is available at:https://www.silabs.com/documents/public/application-notes/an1142-mesh-network-performancecomparison.pdf
[17] https://www.treon.fi/project/treon-node/
[18] https://www.geeksforgeeks.org/fixed-and-flooding-routing-algorithms/
[19] "Bluetooth SIG announces mesh networking capability." It is available at:https://www.asmag.com/showpost/26924.aspx
[20] https://www.mdpi.com/1424-8220/19/5/1238/htm

Appendix AExtra Materials
A.1 AT commands
AT command mode allows you to interrogate the Bluetooth module and to changesome of the settings; things like the name, the baud rate, whether or not it operatesin slave mode or master mode.
When used as a master device AT commands allow you to connect to otherBluetooth slave devices
Some of the AT- Commands used and their description is given below.
Figure A.1: AT-Command (UBTMMOD)
Figure A.2: AT-Command (UBTMPAD)
51

52 Extra Materials
Figure A.3: AT-Command (UBTMCCB)
Figure A.4: AT-Command (UBTMRPUB)
Figure A.5: Server reply (UUBTMRCV)

Extra Materials 53
A.2 OP-CODE used for measurements, specified by Blue-tooth SIG
A message is defined as having an opcode, associated parameters, and behavior.An opcode may be a single octet (for special messages that require maximumpossible payload for parameters), 2 octets (for standard messages), or 3 octets (forvendor-specific messages).
A total message size, including an opcode, is determined by the underlyingtransport layer, which may use a Segmentation and Reassembly (SAR) mechanism.To maximize performance and avoid the overhead of SAR, a design goal is to fitmessages in a single segment. The transport layer provides up to 11 octets for anon-segmented message, leaving up to 10 octets that are available for parameterswhen using a 1-octet opcode, up to 9 octets available for parameters when using a2-octet opcode, and up to 8 octets available for parameters when using a vendor-specific 3-octet opcode.
Message Name OpcodeConfig Node Reset 0x80 0x49Config Node Reset Status 0x80 0x4AConfig Relay Get 0x80 0x26Config Relay Set 0x80 0x27Config Relay Status 0x80 0x28
Table A.1: Messages name and its opcode

Link performance measurement and improvement
using Bluetooth mesh network
DURGAPRASAD SRINIVASAHARSHAVARDHAN MANJUNATHMASTER´S THESISDEPARTMENT OF ELECTRICAL AND INFORMATION TECHNOLOGYFACULTY OF ENGINEERING | LTH | LUND UNIVERSITY
Printed by Tryckeriet i E-huset, Lund 2020
DU
RG
APR
ASA
D SR
INIV
ASA
& H
AR
SHA
VA
RD
HA
N M
AN
JUN
ATH
Link performance m
easurement and im
provement using B
luetooth mesh netw
orkLU
ND
2020
Series of Master’s thesesDepartment of Electrical and Information Technology
LU/LTH-EIT 2020-797http://www.eit.lth.se