Lincoln University New Zealand
223
Lincoln University Digital Thesis Copyright Statement The digital copy of this thesis is protected by the Copyright Act 1994 (New Zealand). This thesis may be consulted by you, provided you comply with the provisions of the Act and the following conditions of use: you will use the copy only for the purposes of research or private study you will recognise the author's right to be identified as the author of the thesis and due acknowledgement will be made to the author where appropriate you will obtain the author's permission before publishing any material from the thesis.
Transcript of Lincoln University New Zealand

Lincoln University Digital Thesis
Copyright Statement
The digital copy of this thesis is protected by the Copyright Act 1994 (New Zealand).
This thesis may be consulted by you, provided you comply with the provisions of the Act and the following conditions of use:
you will use the copy only for the purposes of research or private study you will recognise the author's right to be identified as the author of the thesis and
due acknowledgement will be made to the author where appropriate you will obtain the author's permission before publishing any material from the
thesis.

BARRIERS TO THE ADOPTION
OF ORGANIC FARMING
IN CANTERBURY
A thesis submitted In partial fulfillment
of the requirements for the degree of
Master of Applied Science In the
University of Canterbury
by Paul Fisher
Centre for Resource Management Lincoln College
1989

ABSTRACT
Organic farming (OF) shows promise as a commercial alternative to conventional
agriculture. Organic farming is characterised by Jow production costs, high commodity
prices and an environmental philosophy. However, few farmers have actually adopted
OF and little information is available about OF in New Zealand. A multi-disciplinary
approach was used to focus on barriers to the adoption of organic farming by
Canterbury cereal crop and -livestock farmers. The expansion of organic farming was
considered within the framework of the adoption and diffusion of innovations. The
current population of 13 Canterbury organic farmers was interviewed, and postal
questionnaires were sent to 52 South Island farmers who had expressed a strong interest
in adopting OF (response rate 90.4%, n=41 usable survey forms). Secondary
information was also extensively used.
A number of barriers were identified. Pest control was the main technical problem for
organic farmers, particularly control of crop weeds and parasitic disease in young stock.
The period of transition from conventional to organic agriculture was a major barrier
due to investment costs and low income. A lack of production and marketing
information reduced the feasibility and increased the perceived risk of the technology.
Perceived technical difficulties, the uncertainty of organic food markets, a lack of
production information, and current economic hardship were the main factors which
deterred producers from adopting OF. Current economic conditions provide an
incentive to reduce chemical use in fann production, but not to completely eliminate
chemical inputs. The main areas where public policy could remove barriers to OF are
the supply of information through subsidised research and extension, and the
establishment of a commercial industry infrastructure.
Key words: organic fanning, barriers, innovation. diffusion. multi-disciplinary. bio
dynamic, low-input. agricultural policy.

I
TABLE OF CONTENTS
List of figures ............................................................................. IV List of tables .............................................................................. V Glossary of terms ....................................................................... VI.'.
PART I INTRODUCTION AND RESEARCH METHODS
1. INTRODUCTION ..................................................................... 1 1.1 Background and objectives .................................................... 1 1.2 Scope of the investigation ..................................................... 4 1.3 Organisation of the thesis .................................................... .4
2. CONCEJ>1rU~ ·F~ME~ORl( ................................................... 6 2.1 Introduction ..................................................................... 6 2.2 Literature review ................................................................ 6 2.3 The adoption-diffusion model ................................................ 8 2.4 The induced innovation model ............................................. 10 2.5 Agroecosystems theory ............................... : ....................... 15 2.6 Towards an integrated approach ........................................... 16
3. METHODOLOGY .................................................................. 18 3.1 Introduction .................................................................... 18 3.2 Methodological approach .................................................... 18 3.3 Data sources ................................................................... 20 3.4 The research program ........................................................ 23 3.5 Survey objectives and procedure ........................................... 24
3.5.1 Initial contact with- the practicing organic farmers ............................................................. 24
3.5.2 PartiCipant observation and in-depth interviews: practicing organic farmers ....................... 24
3.5.3 Structured interviews and postal questionnaires: practicing organic fmmers ...... , ........... 25
3.5.4 Postal questionnaires: prospective organic farmers ............................................................. 26
3.6 Data analysis ... · ............ ; ................................................... 27 3.7 Potential for bias .............................................................. 27
II
PART II RESULTS AND DISCUSSION
4. INSTITUTIONS AND INFORMATION ....................................... 29 4.1 Introduction .................................................................... 29 4.2 The Biological Producers Council and the Bio Gro
Standard ...................................................................... 29 4.2.1 The Bio Gro Standard .......................................... 29 :4.2.2 The BPC review process ....................................... 32
4.3 Research and extension agencies and information ...................... 34 4.4 Agribusiness .................................................................... 38 4.5 Summary ...................................................................... 39
5. FARM PRACTICES ................................................................. 42 5.1 Introduction .................................................................... 42 5.2 Strategies for conversion .................................................... .42 5.3 Changes in farm practices .................................................. .45
5.3.1 Changes in farm enterprises .................................. .45 5.3.2 Pasture diversification .......................................... .46 5.3.3 Control of pasture pests ....................................... .47 5.3.4 livestock management ......................................... .48 5.3.5 Crop rotations .................................................... 51 5.3.6 Cultivation and weed control .................................. 53 5.3.7 Control of other crop pests .................................... 53 5.3.8 Seed source ....................................................... 55 5.3.9 Crop residues ..................................................... 56 5.3.10 Fertility maintenance ............................................ 56 5.3.11 Storage ............................................................. 57
5.4 Bio-Dynamic agriculture ..................................................... 58 5.5 Summary ...................................................................... 61
6. ECONOMIC CHARACTERISTICS OF ORGANIC FARMING .......... 64 6.1 Introduction .................................................................... 64 6.2 Comparative research ........................................................ 65 6.3 Performance of Canterbury Organic farms ............................... 6R
6.3.1 Survey results ..................................................... 6~ 6.3.2 Gross margins .................................................... 74
6.3.3 Summary .......................................................... 8 [ 6.4 Risk ...................................................................... 82 6.5 Public costs and benefits ..................................................... 83 6.6 Summary ...................................................................... 88
7. ORGANIC FARMERS AND THE ADOPTION DECISION .............. 91 7.1 Introduction .................................................................... 91 7.2 Previous investigations ....................................................... 92 7.3 Survey results .................................................................. 96

III 7.3.1 Socio-economic characteristics of organic
farmers .................................................. : .......... 96 7.3.2 Motivations and attitudes of organic farmers ............. 100 7.3.3 Perceived barriers .............................................. 105
7.4 Summary .................................................................... 109
8. THE FARMING ENVIRONMENT ............................................ 113 8 .1 Introduction .................................................................. 113 8.2 Economic conditions ........................................................ 114
8.2. L Markets for organic produce ................................. 114 8.2.2 The changing economics of production .................... 120
8.3 Technological developments ............................................... 124 8.4 Sociological factors ......................................................... 125 8.5 Summary .................................................................... 126
PART III SUMMARY AND CONCLUSION
9. SUMMARY AND CONCLUSION ............................................. 131 9. 1 Introduction .................................................................. 131 9.2 Review of research methods ............................................... 132 9.3 Review of the main findings ............................................... 134 9.4 Policy implications and research recommendations ................... 143
Acknowledgements .................................................................... 149 References .................................................................... 150
APPENDICES
A. Letter of introduction to Canterbury organic farmers ..................... 158 B. Postal questionnaire to Canterbury organic fatmers ....................... 159 C. Interview survey form for Canterbury organic farmers .................... 170 D. Ql1estionnaire to prospective organic farmers ............................... 1 R' E. Comparison of the gross margins for conventional and
organic crop rotations ........................................................... I 89 F. Case studies of Canterbury organic farmers ................................. 203 G. Prospective organic farmers' expectations regarding
adoption of organic farming .................................................... 208

IV LIST OF FIGURES
2.1 Labour use and productivity comparisons for three fanning systems ................................................................... 11
2.2 Resource intensity functions for three farming systems ................... 12 2.3 Finn's demand curve for labour ............................................... 14 8.1 Fertiliser application decision-making model .............................. 122
V
LIST OF TABLES
3.1 Characteristics of different survey methods .................................... 19 3.2 Classification of different farmer groups ........................................ 21 3.3 Physical characteristics of the 13 Canterbury organic cereal
crop and livestock farmers ...................................................... 22 3.4 The research programme .......................................................... 23 4.1 Contribution-of different sources to practicing organic
farmers' information needs ..................................................... 36 4.2 Initial and most useful information sources cited by
prospective organic farmers .................................................... 36 4.3 The preferred roles of the MAF and BPC: responses of
practicing organic farmers ...................................................... 37 4.4 Information requirements for practicing and prospective
organic farmers ................................................................... 3 8 5.1 Characteristics of full versus stepwise conversion strategies ............. .43 5.2 Farm characteristics and the choice of full versus
t · . tt' 44 s epwlse conversIon s ra egles.................................................. . 5.3 Anthelmintic drenching of sheep on Canterbury organic farms ......... 50 5.4 Chemical dipping of sheep on Canterbury organic farms ................. 50 5.5 Crop rotations on Canterbury organic farms ................................ 52 5.6 The first cultivation out of pasture on Canterbury organic
farms ................................................................................ 54 5.7 A comparison between incorporation and bumoff of crop
residues ............................................................................. 56 5.8 A comparison of bio-dynamic and organic farm systems ................. 60 6.1 Changes in the performance of Canterbury organic farms
during the transition period compared with past production: farmers' own assessments ..................... .-................................. 69
6.2 Crop yields on Canterbury organi c farms .................................... 70 6.3 Factors affecting the profitability of the organic system .................. 73 6.4 Gross margins for conventional and organic sheep enterprises .......... 76 6.5 Sensitivity of organic sheep gross margins per hectare to
different productin parameters ................................................. 77 6.6 Gross margins for conventional and organic wheat enterprises .......... 7R 6.7 Sensitivity of organic wheat gross margins to different
production parameters ........................................................... 79 6.8 Comparison of average annual gross margins (GM) for organic
and conventional crop rotations ................................................ 8 I 7.1 Tenure and ownership arrangements on organic farms .................... 96 7.2A Age and experience of organic farmers ...................................... 97 7.2B Age distribution of organic farmers ........................................... 97 7.3 Size and class of survey farms compared with national
averages ............................................................................ 98 7.4 The level of post-secondary education of organic farmers
compared with conventional farmers .......................................... 99
VI
7.5 Farming objectives: a comparison between organic and conventional farmers ........................................................... 100
7.6 Motivations for organic farming: responses from practicing and prospective organic farmers to a closed-ended question ........... 102
7.7 Practicing and prospective organic farmers' perceptions of the advantages of organic farming ........................................... 103
7.8 The type of farm system aimed for by practicing and prospective organic farmers ................................................... 104
7.9 Practicing and prospective organic farmers' perceptions of the main problems and disadvantages of organic farming ........... 106
7.10 Reasons why practicing organic farmers thought few Canterbury farmers currently use organic farming methods ............ 107
7.11 The likelihood that prospective organic farmers would convert to organic farming in the next three years ....................... 108
8. 1 Changing prices of herbicide and fertiliser relative to labour ............................................................................. 121
8.2 Capital expenditure on New Zealand farms, 1983-86 ................... 123

VI
GLOSSARY OF TERMS
anthroposophy is the philosophical basis for bio-dynamic farming. It is based on the premise that the human intellect has the ability to contact spiritual worlds. Anthroposophy was founded at the tum of the century by Rudolf Steiner, an Austrianborn scientist, artist, editor and philosopher. Steiner believed that humans had lost contact with spiritual processes through their attachment to material things. Anthroposophy seeks to regain this contact through training the human intellect to ris~ above attention to matter. A wide range of fields have grown out of Steiner's work; including education, medicine, religion, the arts and agriculture.
Bio Gro is the organic food trademark owned and administered by the BPe.
Bio Gro Standard for Organic Food Production is the set of regulations and guiding principles for the Bio Gro trademark. The Bio Oro Standard is summarised and discussed in Chapter 4.
bio-dynamics (BD) incorporates all aspects of the Bio Gro Standard, but it is based on the 1924 lectures of the philosopher Rudolf Steiner. Bio-dynamic farmers use homeopathic sprays, an astrological calendar, and other practices to stimulate cosmic and terrestrial forces in the farm system. The system also differs from OF in having a separate, and more rigorous production standard and trademark ('Demeter') and a different governing body (the BD Assn.). Bio-dynamics also features a German/Austrian/Swiss origin, a distinctive philosophical base (anthroposophy), and a strong sense of community between BD farmers and consumers. Some consumers are willing to pay an added price premium for bio-dynamic produce over the organic food price. For these purposes, BD is considered as a special case of OF.
Bio-Dynamic Farming and Gardening Association (BD Assn.) owns and administers the Demeter label and promotes BD agriculture.
Biological Producers Council (BPC) The semi-voluntary organisation which owns and administers the Bio Gro label.
Canterbury Organic Producers is a non-formal organisation which acts both as a point of social interaction for organic producers. and as a regional branch of the BPC.
chemicals refer to inputs which are prohibited by the Bio Gro Standard. inclucting artificial pesticides and hormones. and chemically processed fertilisers.
conventional farming (CF) refers to a production system which employs a full range of pre- and post-plant tillage practices (e.g. plow. disk, plant. cultivate). synthetic fertilisers, and pesticides (Cacek and Langner. L986).
conventional producers (CP) are those farmers who use conventional methods and are unaware of, or uninterested in, OF as an option for their farms. (Refer also to EOP, PRAC, PROS and TOP).
Demeter is the trademark (and production standard) for BD produce.
VII
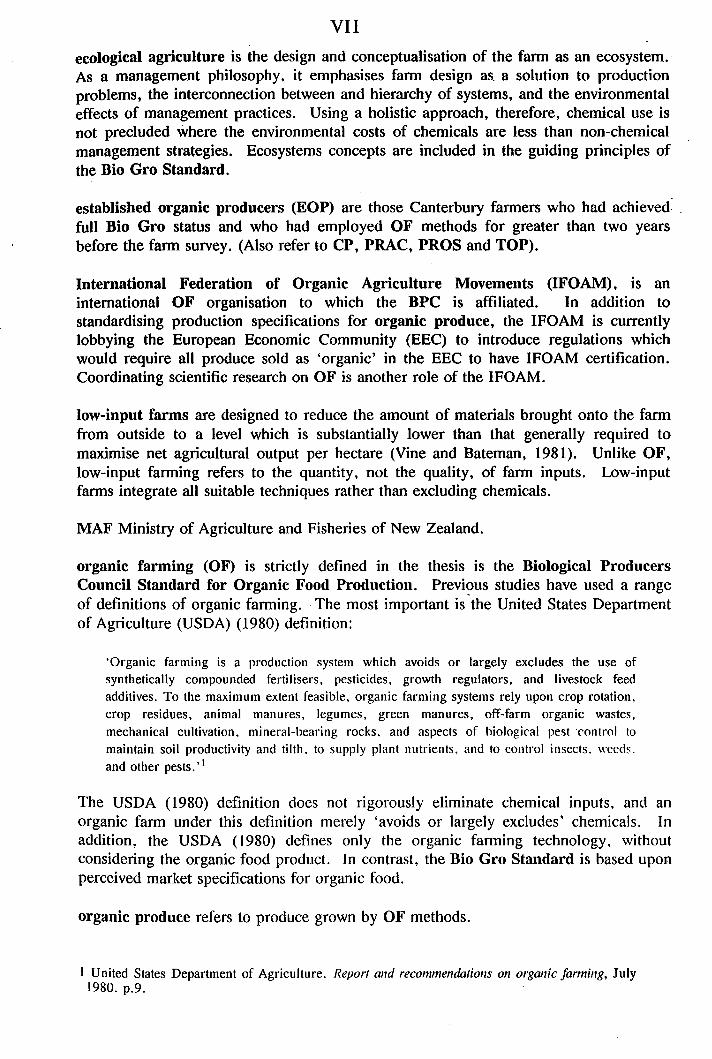
ecological agriculture is the design and conceptualisation of the farm as an ecosystem. As a management philosophy, it emphasises farm design as, a solution to production problems, the interconnection between and hierarchy of systems, and the environmental effects of management practices. Using a holistic approach, therefore, chemical use is not precluded where the environmental costs of chemicals are less than non-chemical management strategies. Ecosystems concepts are included in the guiding principles of the Bio Gro Standard.
established organic producers (EOP) are those Canterbury farmers who had achieved: . full Bio Gro status and who had employed OF methods for greater than two years before the farm survey. (Also refer to CP, PRAC, PROS and TOP).
International Federation of Organic Agriculture Movements (IFOAM), is an international OF organisation to which the BPC is affiliated. In addition to standardising production specifications for organic produce, the IFOAM is currently lobbying the European Economic Community (EEC) to introduce regulations which would require all produce sold as 'organic' in the EEC to have IFOAM certification. Coordinating scientific research on OF is another role of the IFOAM.
low-input farms are designed to reduce the amount of materials brought onto the farm from outside to a level which is substantially lower than that generally required to maximise net agricultural output per hectare (Vine and Bateman, 1981). Unlike OF, low-input farming refers to the quantity, not the quality, of farm inputs. Low-input farms integrate all suitable techniques rather than excluding chemicals.
MAF Ministry of Agriculture and Fisheries of New Zealand.
organic farming (OF) is strictly defined in the thesis is the Biological Producers Council Standard for Organic Food Production. Previ?us studies have used a range of definitions of organic farming. The most important is the United States Department of Agriculture (USDA) (1980) definition:
'Organic farming is a production system which avoids or largely excludes the use of synthetically compounded fertilisers, pesticides, growth regulators, and livestock feed additives. To the maximum extent feasible, organic farming systems rely upon crop rotation, crop residues, animal manures, legumes, green manures, off-farm organic wastes, mechanical cultivation. mineral-bearing rocks. and aspects of biological pest control to maintain soil productivity and tilth. to supply plant nutrients. and to control insects. weeds. and other pests.' 1
The USDA (1980) definition does not rigorously eliminate chemical inputs. and an organic farm under this definition merely 'avoids or largely excludes' chemicals. In addition, the USDA (1980) defines only the organic farming technology. without considering the organic food product. In contrast, the Bio Gro Standard is based upon perceived market specifications for organic food.
organic produce refers to produce grown by OF methods.
1 United States Department of Agriculture. Report and recommendations on organic farming, July 1980. p.9.

VIII
pesticide is the generic tenn referring to most of the lethal chemical techniques employed by humans to. Hmit or prevent pest damage to agricultural products (MacIntyre, 1987).
pests are organisms which are declared or perceived as detrimental to agricultural enterprises. They include weeds, fungi, nematodes, insects and other animals.
practicing organic farmers (PRAC) include both established and transitional organic producers (EOP and TOP) in Canterbury.
prospective organic producers (PROS) includes those South Island fanners who were known to have a strong interest in OF, but had yet to adopt the technology. (Also refer to CP, EOP, PRAC and TOP).
Soil and Health Association is an umbrella group for organic fanning and gardening organisations in New Zealand.
sustainable farm systems can maintain current patterns of resource use indefinitely. Renewable resources are consumed at or below their rate of replacement, nonrenewable resources are used slowly, and future generations are given the same weight as present generations in management decisions (Hunt, 1986). Sustainability is one of the guiding principles of the Bio Gro Standard. The degree of chemical use is a poor measure of sustain ability , because farm systems which integrate all available management practices may achieve sustainability goals more readily than fann systems which totally exclude chemical use.
transitional organic producers (TOP) includes the Canterbury fanners who had achieved transitional Bio Gro status, and had converted to OF less than two years before they were surveyed. (Also refer to CP, EOP, PRAC and PROS)

PART I
INTRODUCTION AND RESEARCH METHODS

CHAPTER 1. INTRODUCTION
1.1 Background and objectives 1.2 Scope of the investigation 1.3 Organisation of the thesis
1.1 BACKGROUND AND OBJECTIVES
Current economic conditions, and problems associated with conventional farming (CF)l in New Zealand indicate a need to investigate alternative production technologies and commodity markets. Low profitability and rising rural debt in New Zealand agriculture have resulted from declining markets for traditional export markets, high exchange rates and low commodity prices, and shrinking export quotas and protectionism. Market restrictions on chemical use, for example the recent ban on beef hormones by the European Economic Community, and the removal of price supports and input subsidies provide further challenges to New Zealand producers. Also associated with contemporary agriculture is the emergence of public costs on a scale unforeseen in the past. Specialised, high-input farm systems have been accused of causing a degradation in soil and water quality, human illness, production problems including pest resistance to chemical controls, and financial and ecological instability (Berardi, 1978; Klepper et al., 1977; Madden, 1988; Oelhaf, 1978). In combination, these costs have induced some farmers and policymakers to reassess alternatives to CF.
One alternative production system is organic farming (OF). Organic farming incorporates both a farm management approach and the production of an undersuppJied, and hence high-priced, health food product. The essential features of OF are the r~moval of chemical inputs from production, an environmental philosophy, and an emphasis on soil husbandry. Conventional farming in New Zealand is less chemical-intensive than northern hemisphere production systems. and New Ze,d,lIld
producers have pioneered the use of nitrogen-fixing pasture plants in place of mineral fertilisers. However, this does not in itself constitute OF, which completely eliminates chemical use and is bound by strict production constraints and management guidelines (the Bio Gro Standard for Organic Food Production). By excluding chemical inputs and augmenting them with biological processes and management techniques. OF shows promise as a low-cost, environmentally-benign farm system (Buttel et al., 1986). Thei growing market for premium priced organic produce is a further incentive to farm organically. 1 Due to the range of unfamiliar terms and and their special definitions used in the thesis, a glossary of all bolded and abbreviated terms is included at the beginning of the document.

2
The public, fanners, and research institutions have shown a high level of interest in OF. \
For example. a seminar' on OF at Lincoln College in May 19RR attracted several I hundred participants, ·many of them conventional farmers. The Ministry of Agriculture I
and Fisheries (MAF) has recently committed research and marketing resources to OF,
with a view to developing a commercial export industry (Galloway, 1988; R. Scott,
1987; Williams, 1988). Consumer demand for organic produce is increasing both
domestically and overseas (Horticultural Market Res¢arch Unit (HMRU), 1986).
At present, however, little information is available about factors which are likely to
affect the future of OF. Few producers have actually adopted OF. At present there are ~
91 commercial organic producers in New Zealand with the organic Bio Oro trademark, ~
and a small number of independent organic fanners. Previous research suggests that
technical, sociological and economic obstacles exist to adopting and implementing OF
practices (Aubert, 1982; Blobaum, 1983; Oelhaf, 1978). In situations such as farms
with chronic animal health problems, the feasibility of removing chemical inputs is
questionable. The lack of basic information about OF increases the risk that individual
producers will make inefficient management decisions, and that public resources will be
wastefully allocated. Central questions remain to be answered: What are the technical
and economic implications at a fann and industry level of removing chemical inputs?
How desirable is OF for producers and society as a whole? What demand, and
justification, is there for public support of OF? What is the likely rate of growth and
limits to the size of an organic food production industry?
To address these questions, OF can be considered within the framework of the adoption
and diffusion of innovations. Organic farming is an interesting case of technological
change, for several reasons. Unlike many innovations, OF is an entire management
system. Consequently, adoption of OF is likely to differ as a social and economic
process from the diffusion of technologies such as herbicides and farm machinery.
Contrary to most other farm innovations, and the dominant trend of agricultural
development, OF tends to reduce capital-intensity. specialisation. and land procluctiyity.
Public versus private costs and benefits are important in terms of the return to
individual land users, the type of farmer likely to adopt OF, and public funding of the
technology. Organic fanning has been developed by farmers largely separate to both Ii the scientific community and agribusiness. and it has evolved from a fatming
philosophy into a technology with commercial potential.
To study' OF within this framework, several types of information are required. First,
characteristics of OF as a technology need to be identified: how does OF differ from
3
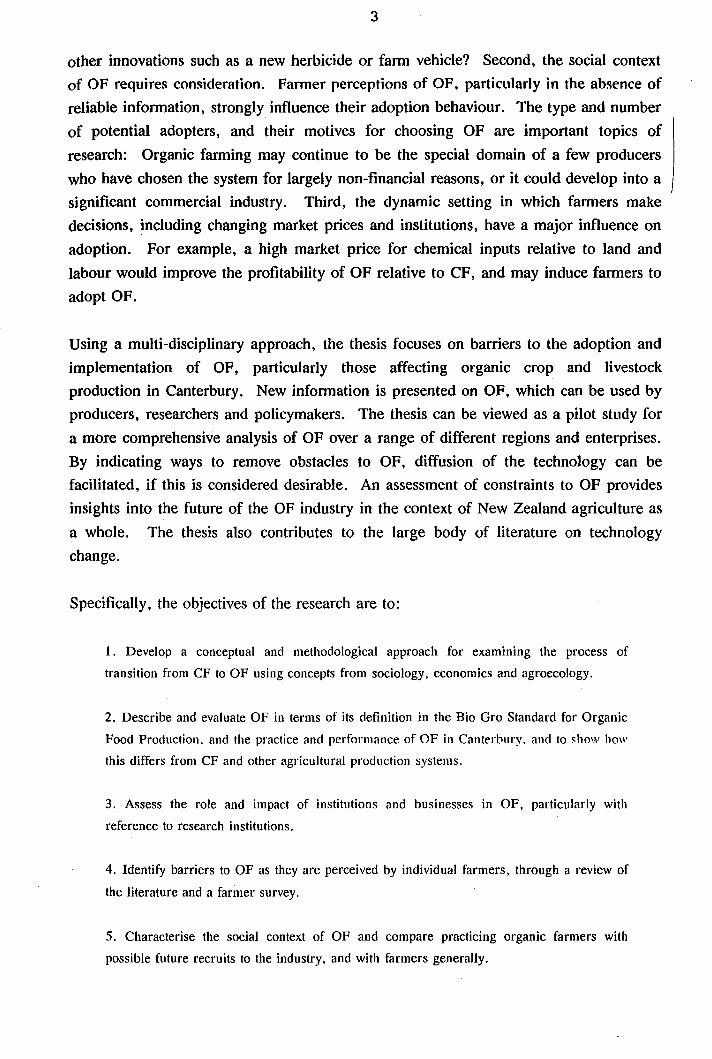
other innovations such as a new herbicide or farm vehicle? Second, the social context of OF requires consideration. Fanner perceptions of OF. particularly in the absence of reliable information, strongly influence their adoption behaviour. The type and number of potential adopters, and their motives for choosing OF are important topics of research: Organic farming may continue to be the special domain of a few producers who have chosen the system for largely non-financial reasons, or it could develop into a significant commercial industry. Third, the dynamic setting in which farmers make decisions, ~ncluding changing market prices and institutions, have a major influence on adoption. For example, a high market price for chemical inputs relative to land and labour would improve the profitability of OF relative to CF, and may induce farmers to adopt OF.
Using a multi-disciplinary approach, the thesis focuses on barriers to the adoption and implementation of OF, particularly those affecting organic crop and livestock production in Canterbury. New information is presented on OF, which can be used by producers, researchers and policymakers. The thesis can be viewed as a pilot study for a more comprehensive analysis of OF over a range of different regions and enterprises. By indicating ways to remove obstacles to OF, diffusion of the technology can be facilitated, if this is considered desirable. An assessment of constraints to OF provides insights into the future of the OF industry in the context of New Zealand agriculture as a whole. The thesis also contributes to the large body of literature on technology change.
Specifically, the objectives of the research are to:
1. Develop a conceptual and methodological approach for examining the process of
transition from CF to OF using concepts from sociology. economics and agroecology.
2. Describe and evaluate OF in terms of its definition in the Bio Gro Standard for Organic
Food Production. and the practice and performance of OF in Canterbury. and to show how
this differs from CF and other agricultural production systems.
3. Assess the role and impact of institutions and businesses in OF, particularly with
reference to research institutions.
4. Identify barriers to OF as they are perceived by individual farmers, through a review of
the literature and a farmer survey.
5. Characterise the social context of OF and compare practicing organic farmers with
possible future recruits to the industry, and with farmers generally.
4
6. Assess major trends in agriculture which Me likely to inflllf!nce the competitive po!;ition
of OF.
1.2 SCOPE OF THE INVESTIGATION
To enc0n:tpass a wide range of interconnected issues, a multi-disciplinary approach
which included concepts from sociology, economics and ecology was considered
necessary. A mixed-method research design was chosen which included participant
observation, interviewing and postal surveying the 13 practicing Canterbury organic
crop and livestock farmers and 52 South Island farmers who were known to have a
strong interest in OF. An extensive review was also undertaken of previous OF studies
in New Zealand and overseas, and the Hterature on CF provided a further comparative
data base. Information was thereby obtained from conventional farmers, producers
considering adoption of OF, farmers undergoing transition, and established organic
producers. Time and resource constraints limited the study in terms of location
(Canterbury and the South Island) and farm enterprises (cereal crop, sheep and cattle
production).
1.3 ORGANISATION OF THE THESIS
This report is organised into three parts. Part I, the conceptual and methodological
approach is reported in Chapters 2 and 3. The main body of the thesis is contained in
Part II. Chapter 4 discusses the Bio Gro standard and its relationship to alternative
farm systems, the role of research institutions and businesses in OF, and farmer
information requirements. The practice of OF in Canterbury is discussed in Chapter 5,
and Chapter 6 considers economic features of the system. Social characteristics of OF,
and farmer perceptions of barriers to adoption are analysed in Chapter 7. Chapter 8
identifies factors outside of the influence of individual fmmers. including markets for
organic produce, and changing farm input costs. Finally. Chapter 9 in Part I I I
summarises the main findings of the study, provides an overview of the significance of
different barriers, and indicates further research needs.
Additional information is included in appendices. Appendix A is the letter of
introduction to the 13 Canterbury practicing organic farmers. interview and postal
survey forms are included in Appendices B,C and D. Gross margin comparisons of OF

5
and CF enterprises and crop rotations are detailed in Appendix E. From in-depth
interviewing. four personality profiles were made of Canterbury organic producers.
These are included in Appendix F. Farmers considering adoption of OF were queried
about the changes which they anticipated would be necessary to adopt OF. These are
summarised in Appendix G.
6
CHAPTER 2. CONCEPTUAL FRAMEWORK
2. 1 Introduction
2.2 Literature review
2.3 The adoption-diffusion model
2.4 The induced innovation model
2. 5 Agroecosyst~ms theory
2.6 Towards an integrated approach
2.1 INTRODUCTION
In this chapter, concepts are introduced which guide the approach of the thesis. A
brief review of the literature on barriers to organic farming (OF) suggests that a range
of factors may be important. The two main perspectives which have been applied to
the adoption of new technologies in agriculture, the adoption-diffusion and induced
innovation models, are discussed in sections 2.3 and 2.4. Agroecology, which views
the farm as an ecological system, is introduced in section 2.5. Limitations of each
approach are identified and, in section 2.6, a three-tiered approach is developed. This
multi-disciplinary approach aids the analysis of barriers inherent in the OF technology
itself (for example pest control problems), blocks at the farmer decision-making level
(such as incompatibility with farmer values), and obstacles that arise from the setting in
which farm decisions are made (for example unfavourable trends in farm input prices).
2.2 LITERATURE REVIEW
Generally, the literature on constraints to OF identifies a broad range of issues, but
gives little indication of their relative importance for Canterbury crop and livestock
fanning. Economic studies suggest that the costs of conversion. including an initird \
drop in yield, increased labour and management requirements. marketing difficulties
and reduced land productivity are significant (Oelhaf. 1978). Technical problems slIch
as weed control, institutional factors including a policy bias towards conventional
agriculture, and social factors such as opposition from neighbouring producers are also
likely to be important (Aubert. 1982).
Wearing (1988) considered that several characteristics of pesticide technologies favour
their adoption over biological or integrated pest management strategies. According to
Wearing (1988), chemical controls tend to fit farmers' needs more readily than

7
biological controls: pesticides are often simpler and more convenient to use, and they
are therefore less management-intensive. Pesticides provide more rapid control of a
wider range of pests, and permit greater management flexibility. For example,
herbicides remove constraints to crop rotation design, whereas the effect of different
crops on weed control is an important constraint in OF. Chemical controls are often
more cost-effective, and are supported by a large marketing and information industry.
The attitl:ldes of farmers, and problems experienced by organic farmers are a further
obstacle to OF. Although a number of researchers have studied organic farmer
behaviour using survey techniques (for example Dalecki and Bealer, 1984; Foster and
Miley, 1983; Harris et al. 1980; Lockeretz and Wernick, 1980; and United States
Department of Agriculture (USDA), 1980), only one study (Blobaum, 1983) directly
addressed the constraints and difficulties experienced by organic farmers. In Blobaum's
(1983) postal survey of 183 commercial organic farmers in the American MidWest,
weed problems were cited as the main disadvantage of the system by 28% of
. respondents, followed by increased labour demand (8%), marketing and social
opposition. Twenty nine farmers hesitated before trying OF because of a lack of
information (28%), fear of a radical drop in yields (17%), concern over weed problems
(17%), and landlord objections (10%). Farmer perceptions of OF, and their behaviour
in the absence of information therefore had an important effect on adoption behaviour.
However, Blobaum's (1983) study also illustrated the limitations of a survey approach.
The sample only included farmers who had used OF methods for at least three years.
These producers had therefore overcome barriers to conversion and did not represent
farmers generally. Consequently, inferences drawn from the survey (and the barriers
which it identified) did not apply directly to conventional farmers. In addition,
institutional barriers such as a public policy bias towards conventional farming (CF)
may not be obvious to individual producers, and would therefore be underrepresented in a survey.
Institutional influences of technological change. rather than individual falmer attitudes.
have been the major cause of increasing use of pesticides and the development of large.
specialised, capital-intensive farms in the United States, according to MacIntyre (\ 987).
Factors such as government policies, changing market prices, the lobbying power of
chemical interests, and production advantages in using chemicals have favoured
development of CF (MacIntyre, 1987; Youngberg and Buttel, 1984). When viewed in
context of the conditions in which agriculture has evolved, these factors can be
considered as barriers to the spread of OF.
8
In summary, the literature on OF suggests that a wide range of factors influence
adoption of OF by farmers. An assessment of barriers to adoption and'implementation
of OF requires consideration of the characteristics of OF as a technology, farmer
attitudes and behaviour, and the wider agricultural setting. Significant obstacles to
adoption and implementation of OF, which may include technical, economic and social
factors, are likely to vary between different farm enterprises and situations. Therefore,
a conceptual approach must be flexible and broad enough to encompass these potential
constraints.
2.3 THE ADOPTION-DIFFUSION MODEL
The classic adoption-diffusion model is based on 'an innovation which is communicated
through certain channels over time among members of a social system. '1 It therefore
views the spread of an innovation as a social process, in which the social and economic
,setting and personal characteristics of individuals influence their receptivity to
innovations. 'An innovation is an idea, practice, or object that is perceived as new by
an individual or other unit of adoption. It matters little, so far as human behaviour is
concerned, whether or not the idea is "objectively" new as measured by the time since
its first use or discovery. '2 This is significant in the case of OF, a system which has its
roots in traditional agriculture, but whose practice since World War II has been
confined to only a small part of the farming population. Changes in the farming
industry and in consumer tastes have made OF a 'new' alternative to the mainstream of
New Zealand agriculture.
The adoption-diffusion model includes several concepts which are useful to this study.
First, it emphasises the individual farmer's decision to adopt or reject an innovation and
identifies the innovation decision as a point at which barriers to adoption of OF can
occur. Second, there are several steps in an individual's adoption decision: knowledge
that the technology exists, development of an opinion about the innovation. a decision
to adopt or reject it, implementing the technology. and reevaluation of the decision.
For present purposes, barriers to OF refers to constraints to all of these stages. Third.
by studying the population of adopters and nonadopters, the model attempts to explain
and predict the spread of an innovation. Organic producers deviate from the behaviour
of farmers as a whole, and their motivations and differences from other farmers are an
important factor in the diffusion of OF. Fourth, individuals with different personalities
and socio-economic characteristics are likely to adopt innovations at different rates.
Early adopters, for example, tend to be better educated, venturesome, and own
1 E.M. Rogers; F.F. Shoemaker. Communication of innovations: a cross-cultural approach. New York, Free Press, 1971. p.18.
2 E.M. Rogers. The Diffusion of Innovations 3rd. edition. New York, Free Press, 1983. p.ll.

9
specialised, larger farms. Fifth, innovations are communicated between individuals
along different channels. The more personal the channel of communication, the more
likely it· is to persuade and change. The process will also be enhanced if the source and
recipients are of the same political, social and economic domains. Information needs
and sources are significant for this study due to the heavy reliance on skilled
management in OF, the lack of information available to producers, the separation
existing between OF and scientific communities, and the need for communication
between these two groups if a cost-effective research and extension service is to
develop. Sixth, people are generally only receptive to innovations which meet their
needs and desires and are compatible with their values and beliefs (Solo, 1972).
Potential barriers could therefore arise from the philosophy and social distinctions of
organic and bio-dynamic (BD) farming.
The adoption-diffusion model approach emphasises study of adopting and non-adopting
farmers as a means to identify influences of the diffusion of innovations. For example,
Murray (1986) surveyed the attitudes of high country pastoral farmers in his study of
the adoption of exotic forestry in the South Island. However, a major criticism of the
adoption-diffusion approach raised by Es (1983) was that the voluntaristic notion of
individual farmers making independent decisions is of questionable relevance in the
contemporary world. In many situations, the decision to adopt or reject has been taken
out of the individual farmer's hands. External factors are therefore important: unless
the required institutional structure is in place, farmers are unable to adopt new
technologies (Solo, 1972). For example, in a study of the spread of innovative rice
technologies in Taiwan, Ruttan (1972) considered that factors beyond the control of
individual farmers, such as the establishment of farmer organisations, determined the
rate of change. A study of the diffusion of OF, therefore, also requires consideration
of broader influences on farmer behaviour.
Es (1983) also charged that the model rarely applies to innovations that are aimed at
environmental protection and conservation. Research on resource-conserving farm
behaviour based on the adoption-diffusion model is only appropriate where such actions
meet the assumptions of the model: voluntarism on the part of the farmer and a
personal economic advantage. Policies which are designed to alleviate the external
environmental costs of agriculture such as downstream water pollution are not justified
in terms of farm-firm (private) benefits, but in terms of their public good. Canterbury
fanners do adopt OF on a voluntary basis, and current economic conditions suggest that
such a change may be profitable, although external environmental benefits may also be
important to the adoption decision. Because the goals of resource conservation and
immediate economic gain can conflict, it follows that farmers most responsive to

10
resource conservation and public welfare considerations are not necessarily the same
ones most responsive to innovations that are designed to solely to enhance productivity
(Taylor and Miller, 1978). The ability of the model to predict diffusion patterns of OF
may therefore be limited, and farmer motivations and characteristics, are important
research questions for this study.
2.4 THE INDUCED INNOVATION MODEL
It is economic trends that induce farmers to make certain decisions, according to
induced innovation theory (Hayami and Ruttan, 1971). From this perspective, farms
are small, price-taking firms whose profitability and management decisions are largely
determined by market and institutional factors. Two local examples are the expansion
of the fine wool industry following favourable market prices, and the change in
management of cowshed wastes on dairy farms after the forced intemalisation of
pollution costs by water quality regulations. The relative scarcity, and hence price, of
. agricultural inputs, particularly land and labour, favour some farm systems over others.
For example, labour-intensive techniques are far more prevalent in developing nations
than developed countries in which land-intensive 'factory farming' often prevails. The
input and output structure of OF differs from CF. The following paragraphs show how
the relative costs of land, labour and chemicals and price differences between
conventionally and organically marketed produce act either as barriers or inducements
to use OF methods on each farm.
In terms of input use, OF typically uses less chemicals, more labour, and more land to
achieve the same output as CF (Carter and Lohr, 1986). Applying the induced
innovation model (based on concepts discussed by Ellis (1988) and Carter and Lohr
(1986», one would therefore expect farmers (and agricultural research) to be induced to
adopt OF when the cost of chemicals is hi gh relative to the prices of land and labour.
There are three types of efficiency which are relevant to the induced innovation model
(Carter and Lohr, 1986). For a technically efficient firm, inputs are employed in such
a manner that the quantity of output is maximised, no matter how the inputs are
recombined. If a firm is allocatively efficient. the inputs are used in such a way that
profits are maximised. If a firm is both -technically and allocatively efficient, it is also
economically efficient.
Figure 2.1 shows the technical efficiency of three different farm systems (conventional,
low-input and organic) in terms of the quantity of output (yield of wheat) for a given
11
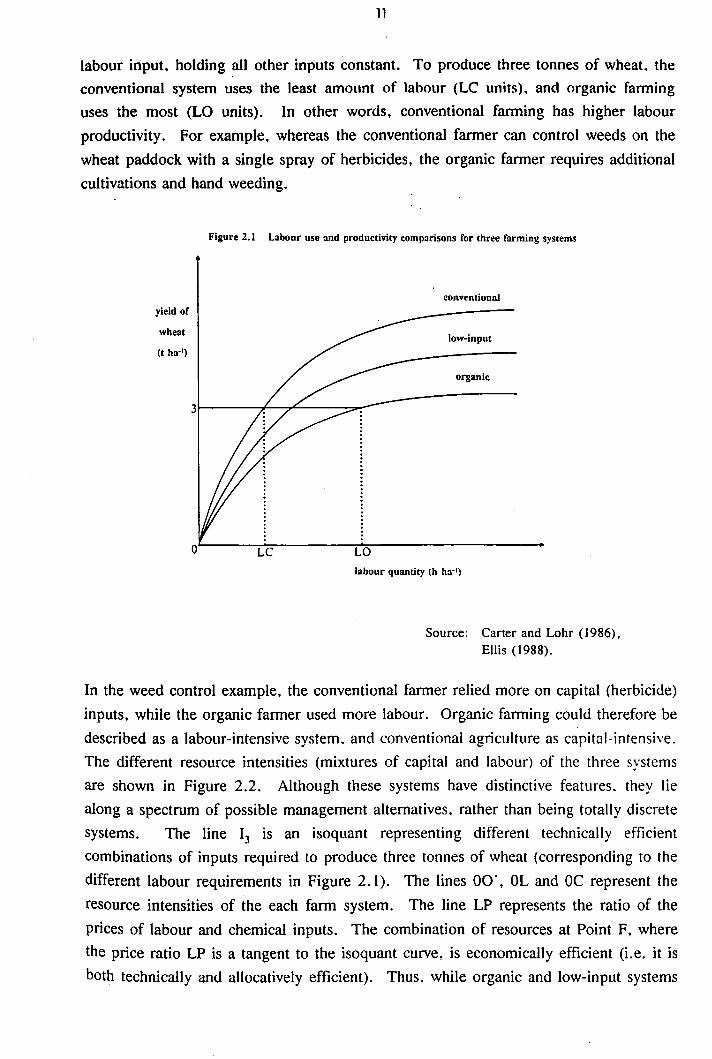
labour iriput. holding all other inputs constant. To produce three tonnes of wheat. the conventional system uses the least amount of lahour (LC units). and organic farming uses the most (LO units). In other words, conventional farming has higher labour productivity. For example, whereas the conventional farmer can control weeds on the wheat paddock with a single spray of herbicides. the organic farmer requires additional cultivations and hand weeding.
yield of
wheat
(t ha- I)
Figure 2. I Labour use and productivity comparisons for three fanning systems
conventional
low-input
organic
labour quantity (h ha- I )
Source: Carter and Lohr (1986), Ellis (1988).
In the weed control example. the conventional farmer relied more on capital (herbicide) inputs, while the organic farmer used more labour. Organic farming could therefore be described as a labour-intensive system. and conventional agriculture as capital-intensi\'e. The different resource intensities (mixtures of capital and labour) of the three systems are shown in Figure 2.2. Although these systems have distinctive features. they lie along a spectrum of possible management alternatives. rather than being totally discrete systems. The line 13 is an isoqmint representing different technically efficient combinations of inputs required to produce three tonnes of wheat (corresponding to the different labour requirements in Figure 2.1). The lines 00', OL and OC represent the resource intensities of the each farm system. The line LP represents the ratio of the prices of labour and chemical inputs. The combination of resources at Point F, where the price ratio LP is a tangent to the isoquant curve, is economically efficient (i.e. it is both technically and allocatively efficient). Thus. while organic and low-input systems

1-2
are both technically efficient at points G and H, conventional farming is the most profitable system at that ratio of input prices. This makes it economically rational to employ the conventional farm system in the economic conditions shown in Figure 2.2.
labour
input
Figure 2.2 Resource intensity functions for three fanning systems
organic
low-input
c
····~ .. : ... ~ ... -.. -... -... -.. -... -... -.. ----Il
~--------------~----------~~------~~ pi P chemical input
Source: Carter and Lohr (1986). Ellis (1988).
However, if the cost of chemicals rises relative to the cost of labour (and/or labour costs fall in relation to other inputs), the price ratio shifts to L'P' (Figure 2.2), and conventional farming is no longer the most economically efficient system. For example, chemicals might increase in price because of changes in supply and demand, rising fuel costs, or removal of subsidies. Conventional practices such as monthly drenching of lambs were designed for price ratio LP. when applying heavier rates of fertiliser and pesticides was profitable. In the short term. conventional faJmers adjust their spending, for example by drenching less often. but basically remain using conventional methods. In the longer term. the change in relative factor prices induces farmers to search for production methods which are more profitable when less of the expensive resource, in this case chemicals. is used. Research and development into chemical-saving technologies are also induced by the change in factor prices. because the market for these technologies improves and farmers' concerns (according to the model) guide the research agenda of public research agencies.
13
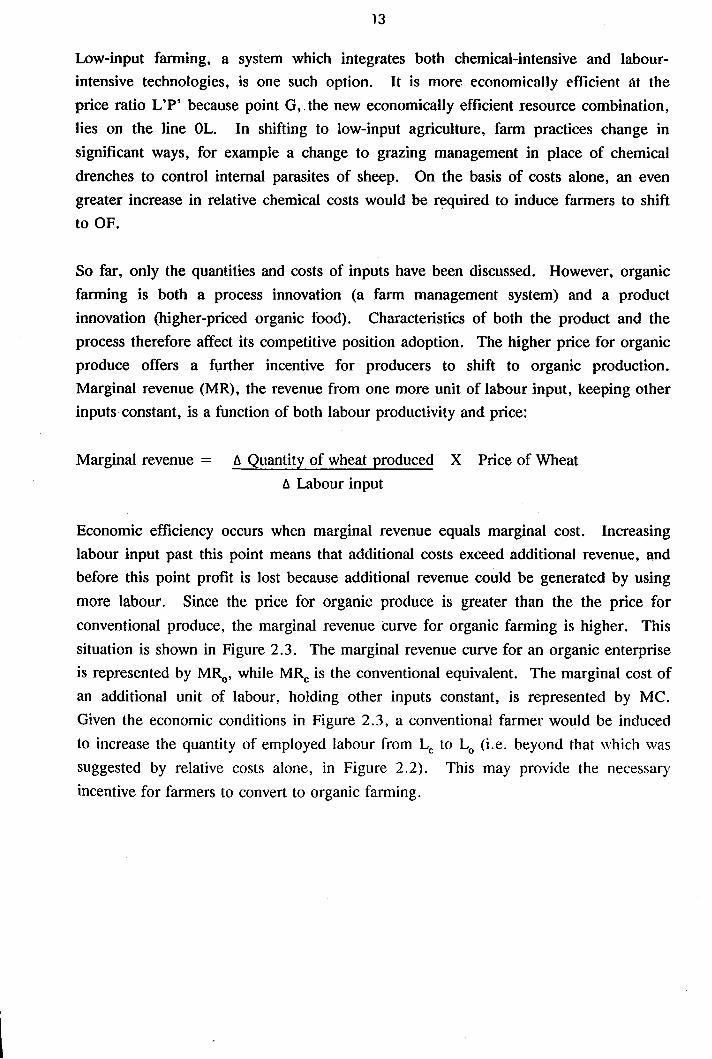
Low-input farming, a system which integrates both chemical-intensive and labour
intensive technologies, is one such option. It is more economically efficient at the
price ratio L'P' because point G, the new economically efficient resource combination,
lies on the line OL. In shifting to low-input agriculture, farm practices change in
significant ways, for example a change to grazing management in place of chemical
drenches to control internal parasites of sheep. On the basis of costs alone, an even
greater increase in relative chemical costs would be required to induce farmers to shift
to OF.
So far, only the quantities and costs of inputs have been discussed. However, organic
farming is both a process innovation (a farm management system) and a product
innovation (higher-priced organic food). Characteristics of both the product and the
process therefore affect its competitive position adoption. The higher price for organic
produce offers a further incentive for producers to shift to organic production.
Marginal revenue (MR), the revenue from one more unit of labour input, keeping other
inputs constant, is a function of both labour productivity and price:
Marginal revenue = 6 Quantity of wheat produced X Price of Wheat
6 Labour input
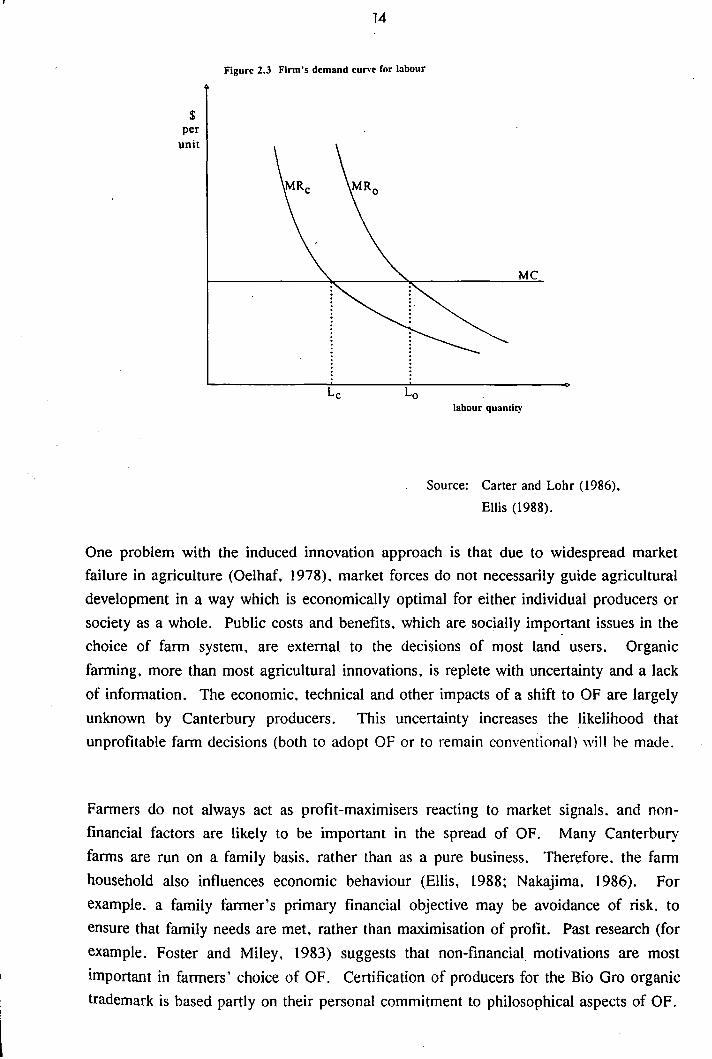
Economic efficiency occurs when marginal revenue equals marginal cost. Increasing
labour input past this point means that additional costs exceed additional revenue, and
before this point profit is lost because additional revenue could be generated by using
more labour. Since the price for organic produce is greater than the the price for
conventional produce, the marginal revenue curve for organic farming is higher. This
situation is shown in Figure 2.3. The marginal revenue curve for an organic enterprise
is represented by MRo' while MRc is the conventional equivalent. The marginal cost of
an additional unit of labour, holding other inputs constant, is represented by MC.
Given the economic conditions in Figure 2.3, a conventional farmer would be induced
to increase the quantity of employed labour from Lc to Lo (i.e. beyond that which was
suggested by relative costs alone, in Figure 2.2). This may provide the necessary
incentive for farmers to convert to organic farming.
$ per
unit
14
Figure l.J Firm's demand cUl"\'e for labour
Me
labour quantity
Source: Carter and Lohr (1986). Ellis (1988).
One problem with the induced innovation approach is that due to widespread market failure in agriculture (Oelhaf. 1978). market forces do not necessarily guide agricultural development in a way which is economically optimal for either individual producers or society as a whole. Public costs and benefits. which are socially important issues in the choice of farm system, are external to the decisions of most land users. Organic farming. more than most agricultural innovations. is replete with uncertainty and a lack of information. The economic. technical and other impacts of a shift to OF are largely unknown by Canterbury producers. This uncertainty increases the likelihood that unprofitable farm decisions (both to adopt OF or to remain conventional) will be made.
Farmers do not always act as profit-maximisers reacting to market signals. and non-financial factors are likely to be important in the spread of OF. Many Canterbury farms are run on a family basis. rather than as a pure business. Therefore. the farm household also influences economic behaviour (Ellis, 1988; Nakajima. 1986). For example. a family farmer's primary financial objective may be avoidance of risk. to ensure that family needs are met, rather than maximisation of profit. Past research (for example. Foster and Miley. 1983) suggests that non-financial motivations are most important in farmers' choice of OF. Certification of producers for the Bio Gro organic trademark is based partly on their personal commitment to philosophical aspects of OF.
15
2.5 AGROECOSYSTEMS THEORY
The two models discussed above provide useful concepts for assessing barriers to OF. The induced innovation model shows the impact that external economic conditions, such as changing input prices, can have on farm decision-making. The innovation-diffusion model takes a sociological perspective of adoption at the individual farmer level, 'where factors such 'as personal attitudes to soil conservation are important.
However, neither approach seriously examines, nor treats as a variable, the characteristics of the innovation itself. ,The adoption-diffusion model predicts that technologies which are compatible with farmer values, can be tried on a limited basis, are simple, and have clear economic benefits will be taken up by farmers quickly. However, it was pointed out above that innovations which are not purely profit-oriented, such as OF, are not successfully addressed by the model. Also, the significance of these factors to adoption is far from clear. For example, New Zealand producers have rapidly diversified into deer velvet production for the Asian market, despite the cultural differences between the product and its market on the one hand, and the values of rural New Zealanders on the other. The induced innovation approach views the innovation as an economic black box which has competitive advantages when certain economic conditions are met. Non-financial aspects of an innovation are not considered by the induced innovation model. In-depth analysis of the OF system is central to this thesis given the variability in OF, the widely differing performance of the system in different situations, and the lack of information about the nature of conversion to OF by Canterbury farmers.
Agroecology, a theoretical perspective which applies ecological principles to agricultural production, views farm management decisions and technologies from a system perspective. A system is a cohesive entity whose character cannot be explained by the isolated study of its component parts (Rountree, 1977). An agroecological approach has been used to compare different farm and natural ecosystems (Odum. 1985; Altieri, 1983), as a framework for agricultural research (Hart. 1979). to analyse nutrient cycling in New Zealand pastoral systems (O·Connor. 1989). and to trace the historical development of farm practices (Aldag, 1987). From this perspective. the farm organism, paddock, farm and district are hierarchicaI1y connected systems. Ecological, technical, economic, and sociological aspects of farm production are held to be interconnected influences of farm management decisions, and technologies are considered in terms of their effects on the farm system.
r 16
Agroecosystems theory provides several useful concepts for this study. The concept of the fann system has. phiJosophical and practical significance .in OF. The Bio Gro Standard for Organic Food Production includes several holistic guiding management principles, and ecologically-sensitive farm system design is required to minimise nutrient loss and prevent pest outbreaks in the absence of chemical inputs. Agroecology emphasises the hierarchy of different levels of agricultural production. Barriers to the conversion of a single farm unit to OF are likely to differ from constraints on a regional scale. The model also attempts to integrate several disciplinary perspectives, and emphasises the limitations of considering one aspect of a technology in isolation. As a farm decision-making model, however, agroecology has limited predictive ability in its present state of development. Ecological aspects of agriculture are experienced as socio-economic phenomena, and the model provides little indication of how these phenomena actually influence technological change.
2.6 TOWARDS AN INTEGRATED APPROACH
The disciplinary constraints of these three perspectives limit their ability to assess the full range of issues identified by past research on OF. For conservation technologies, Nowak (1983) redefined the boundaries of the adoption decision to incorporate ecological, technologic~~ economic and social influences. These factors are in tum ., affected by the availability of information, assistance and market incentives, and the impacts of the market and regulations. Nowak (1983) placed less emphasis on individual voluntaristic decision-making and more on the constrained environment in which farmers operate. Under his approach, adoption and non-adoption were not seen as mutually exclusive, dichotomous decisions. For example, a farmer may decide to adopt certain aspects of OF and integrate them with chemical controls. Nowak stated that for future research on the adoption of new conservation technologies,
'It is clear that future technologies will have to be evaluated in terms of their
agronomic, ecological, economic and social consequences. There is no such
thing as a neutral technology. Because of this, it is vital that we comprehend
why these technologies are being adopted or rejected, by whom, and at what rate.' 3 .
The conceptual approach of this study has two main features. First, a multi-diSciplinary perspective is taken, because it is difficult to reduce all barriers to OF into SOciological, economic or ecological terms. The innovation-diffusion, induced innovation and agroecological perspectives view OF from different angles. They
3 P.J. Nowak. The adoption and diffusion of soil and water conservation technologies. The Rural Sociologist 3(2) : 83-89, 1983. p.89.

r 17
provide useful insights into the innovation, rather than identify discrete and separate constraints to adoption. Second, barriers are analysed at three levels: the technology itself, the farm decision-maker, and the farming environment. These three levels are also interconnected. For example, OF tends to increase labour demand, which may be a limiting resource for an individual producer, and also affects the competitive position of OF when labour costs rise or fall relative to other inputs. The three levels of analysis are divided conceptually in the thesis to provide a structure for analysing the range of issues affecting adoption.
The innovation technology is discussed in Chapters 4 to 6. Organic farming has a strict ~et of institutional constraints, the Bio Gro Standard, with which producers must comply. One barrier of this type is a restriction on bought-in livestock, which excludes farmers from fattening conventionally-grown store lambs and selling them as ,'organic' within twelve months. Research and information on OF is also discussed, and the lack of information about markets for organic produce ,is identified as one problem for producers. Technical aspects of converting to OF are described in Chapter 5, and control of internal parasites of sheep is identified as a major problem. Economic features of the system are critically evaluated in Chapter 6, which shows that the performance of OF relative to CF varies widely in different situations.
The primary unit of analysis in Chapter 7 is the farm decision-maker and the adoption decision. This decision is considered by the adoption-diffusion model as the point at which barriers to adoption occur. The chapter discusses the characteristics, attitudes and motivations of organic farmers and farmers considering adoption of OF. For each farmer, the decision to convert to organic methods is influenced by a complex set of influences such as personal objectives, the attitudes of close friends, and the needs of the household, which is unique to each situation. Perceptions of OF, particularly in the absence of information about the technology, are important determinants of adoption behaviour. Barriers at the farmer level include a perception that OF is a high-risk, unprofitable. or socially incompatible farming alternative.
~
In Chapter 8, the focus moves to the dynamic setting in which farm decisions are made. The induced innovation model, which considers technological change to be induced by changing market conditions, is relevant at this level of analysis. Markets for organic produce, technological developments and changing patterns of farm expenditure are examples of broader factors which affect adoption decisions. For example, pesticide costs have fallen slightly relative to the cost of wage labour in the last decade, which provides a disincentive to totally exclude chemicals from the farm system.

, CHAPTER 3. METHODOLOGY
3.1 Introduction 3.2 Methodological approach 3.3 Data sources 3.4 The research programme 3.5 S!.Jlvey objectives and procedure 3.6 Data analysis 3.7 Potential for bias
3.1 INTRODUCTION
18
This chapter describes the methods used to collect and analyse data. In section 3.2, approaches taken by previous studies and features of different survey methods are discussed. The following sections discuss sources of information (section 3.3), the timetable of research activities (3.4), the type of information collected in the survey and the manner in which it was obtained (3.5), and the analysis of survey data (3.6). In the last section (3.7), the significance of possible sources of bias is discussed.
3.2 METHODOLOGICAL APPROACH
Because no single data collection method would be adequate to cover all aspects of barriers to adoption and implementation, a broad, multi-disciplinary research methodology was chosen involving a mixed-method design. The use of different sources of data, observers, methods or theories, which is termed triangulation, is an established methodological strategy (Greene and McClintock, 1985). Triangulation can strengthen the validity of the overall findings, and lead to greater consistency. enrichment and clarification of results. Combining quantitative and qualitatiye methnc1<; can offset some of the biases. measurement errors. and limitations of each method. In
addition, every technique has strengths and weaknesses, and a combined strategy can maximise the benefits from limited research resources.
Most of the primary data colJection effort was devoted to surveying organic farmers. The individual farmer, according to the innovation-diffusion model, is the most important level of analysis for studying barriers to entry. As well, detailed information about organic farming (OF) was needed for other parts of the study, and organic producers themselves were the main source of practical expertise. Original research

, 19
was required because of the variability of organic farming under different farming situations, including different fann enterprises. and nationa1, regional and even fann-specific conditions.
Participant observation, structured interviewing, and postal survey methods were employed. Several texts, including Alreck and Settle (1985), Converse and Presser (1986) and Lofland and Lofland (1984) were consulted for appropriate survey techniques. Previous studies of organic farming have taken several methodological approaches, including postal surveys (for example Blobaum, 1983), farm visits (Vine and Bateman, 1981), case studies (Wookey, 1987), plot experiments and computer models (K. Olson et al., 1983), and reviews (Cacek and Langner, 1986), and these provided addition guidance on an appropriate methodology. Some general characteristics of the three survey methods used in the thesis are summarised in Table 3.1.
Table 3.1 Characteristics of different survey methods
Subjectivity/ Type of Research investment Sample size Survey method: researcher bias information per observation
participant observation high qualitative large small
structured interviews moderate qual/quant moderate moderate
postal questionnai re low quantitative small large
Source: Mann (1976).
Participant observation is a sociological method in which the .... investigatnr estrthljdws
and sustains a many-sided and relatively long-term relationship with a human association in its natural setting, for the purpose of developing a scientific understanding of that association.'1 It can be combined with intensive interviewing. which is unstructured but guided conversation ' ... whose goal is to elicit from the interviewee rich, detailed materials that can be used in qualitative analysis.·2 The advantage of greater depth per observation is balanced by a higher demand for research resources per farmer and hence a smaller sample size, greater subjectivity and potential for researcher bias, and the difficulty of using qualitative information for comparative
1 J .. ~ofland; L.H. Lofland. Analysing social sel1ings: a guide (0 qualitative observation and analysis. 2nd EditIon. Belmont, California: Wadsworth, 1984. p.12.
2 ibid., p.12.

20
purposes. Structured intelViews employ specific questions. IntelViewer bias is thereby reduced, and replication is facilitated. however the interview becomes less f1exihle. IntelViews combined with farm visits allowed visual obselVation of the farm practices and performance, and put the participants more at ease. Postal questionnaires are well suited to large samples and quantitative information, however the richness of detail of each obselVation is limited by the inability of the researcher to personally discuss the meaning behind responses with the farmer. In this study, postal questionnaires complemented farmer intelViews by providing more objective information which could be directly compared with past research (for example Fairweather's (l987a) study of conventional farmer attitudes, and OF studies by Blobaum, 1983; Conacher and Conacher, 1982; Foster and Miley, 1983; and Vine and Bateman, 1981).
Rather than sUlVeying a wide range of organic producers, in-depth data was sought from a small population of farmers with similar production systems. The question 'Why adopt?' is an important factor in the study of conselVation technologies (Nowak, 1983) which requires personal, in-depth information. Detailed information about OF as a technology was also needed by the study, which necessitated farm visits and personal intelViews. Limiting the sample to a small, discrete population clarified the analysis, given the variability encountered by past researchers (for example Vine and Bateman, 1981; Conacher and Conacher, 1982) and the limited resources available.
3.3 DATA SOURCES
The group of 13 Canterbury organic livestock and cereal crop producers was chosen as the sUlVey population for several reasons. Because of its size and proximity to Lincoln College, the entire population could be sUlVeyed. This sector of the OF industry may be of major commercial importance: sheep and crop production predominate in the region and New Zealand as a whole, and an export organic grain and meat industry has been proposed (Galloway, 1988; Williams. 1988). In November 1987. when the study began, all of the Bio Gro large-scale cereal and livestock farms in the South Island were in Canterbury. Secondary data on conventional and organic mixed farming existed, and the MAF research program was centred on this production system. During the course of the study, other farm types were also visited on BPC inspections.
Farmers at various stages of adoption of organic farming were sUlVeyed. Prev~ous
stUdies, such as Blobaum (1983), usually only sUlVeyed established organic farmers. However, this approach ~as considered inadequate because perceptions of barriers are likely to differ between organic farmers and producers generally. Also, farmers

2-1
currently converting to OF can more accurately recall initial motivations, problems and experiences than established organic farmers who adopted the system at some time in the past. Sampling new recruits to the industry therefore reduces the likelihood that recall errors will be made. Four groups of farmers were studied. Established organic producers (EOP) who had used OF methods for several years, farmers who were currently changing their production systems (transitional organic producers, TOP), and individuals who had expressed a strong interest in the system, but had not yet changed to OF (prospective organic producers, PROS), were interviewed and/or sent postal questionnaires. Existing attitudinal, economic and agronomic information provided a data base on conventional farmers (CP). Specific definitions of the four groups and the sampling procedures used were (Table 3.2):
Table 3.2 Classification of different farmer groups
Farmer classification Specifica tion
'Established' organic producers:! Those with full Bio Gro or equivalent (EOP) organic status (cf. Chapter 4), and
organic for at least two years.
'Transitional' organic producers: l Those with transitional Bio Gro status (TOP) as of 15 November 1987, and organic
for less than two years.
'Prospective' organic producers: (PROS)
'Conventional' producers: (CP)
Those who did not have Bio Gro or Demeter status, but had expressed a strong interest in organic production by: (1) attending a Bio-Dynamic field day at a Canterbury mixed cropping farm on 5-6 March 1988, or (2) applying for Bio Gro or Demeter, or (3) putting their names on the mailing list of NZ Bio Grains Ltd. (an organic distributing and marketing company).
Those who were unaware of. or did not have a strong interest in OF as an option for their properties.
Sampling procedure
Intensive interviews
Structured interviews, Postal survey
Postal survey
Literature review
1. EOP and TOP combined are referred to in the text as practicing organic farmers (PRAC).
'Practicing and prospective organic farmers were also required to own or operate falms over 30 hectares, gain their main source of income from cereal crops, sheep or cattle, and be located in Canterbury (in the case of the PRAC) or Canterbury, Otago or Southland (in the case of the PROS). Characteristics of the 13 practicing organic farms in Canterbury are summarised in Table 3.3. The mean productive area of farms owned by the PRAC was 254.6 hectares (s.d. = 161.3, n= 13), while the average of the PROS
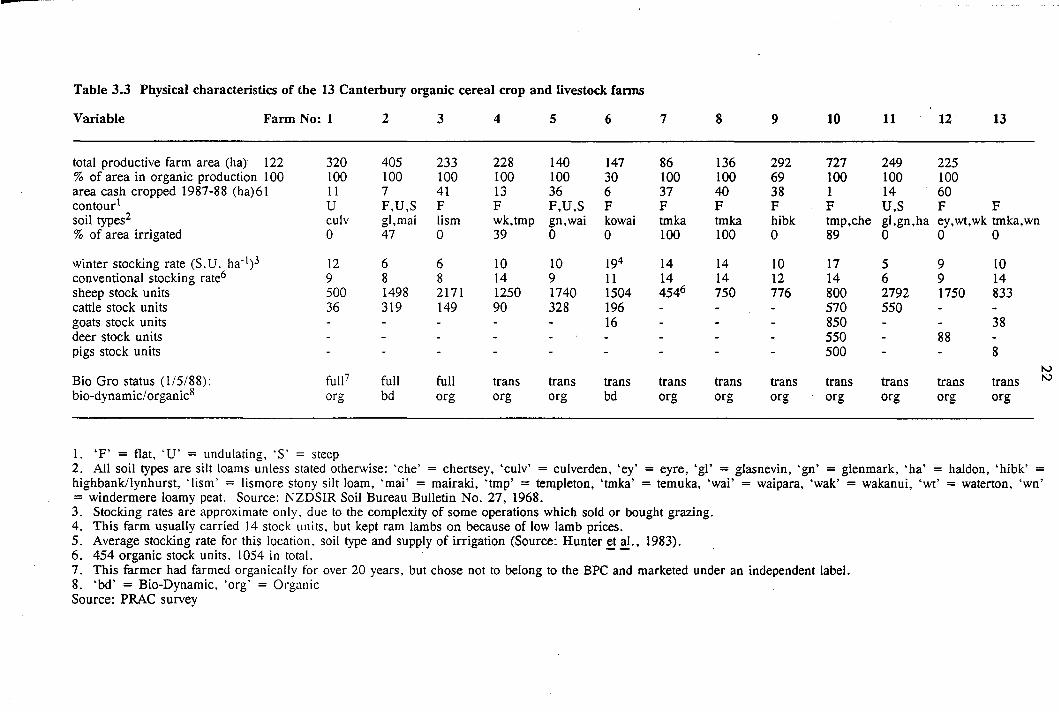
Table 3.3 Physical characteristics of the 13 Canterbury organic cereal crop and livestock farms
Variable Farm No: 1 2 3 4 5 6 7 8 9 10 11 12 13
total productive farm area (ha) 122 320 405 233 228 140 147 86 136 292 727 249 225 % of area in organic production 100 100 100 100 100 100 30 100 100 69 100 100 100 area cash cropped 1987-88 (ha)61 II 7 41 13 36 6 37 40 38 1 14 60 contour1 V F,V,S F F F,V,S F F F F F U,S F F soil types2 culv gl,mai lism wk,tmp gn,wai kowai tmka tmka hibk tmp,che gl,gn,ha ey,wt,wk tmka,wn % of area irrigated 0 47 0 39 0 0 100 100 0 89 0 0 0
winter stocking rate (S. V. ha- 1)3 12 6 6 10 10 194 14 14 10 17 5 9 10 conventional stocking rate6 9 8 8 14 9 11 14 14 12 14 6 9 14 sheep stock units 500 1498 2171 1250 1740 1504 4546 750 776 800 2792 1750 833 cattle stock units 36 319 149 90 328 196 570 550 goats stock units 16 850 38 deer stock units 550 88 pigs stock units 500 8
'" Bio Gro status (1/5/88): fulI 7 full full trans trans trans trans trans trans trans trans trans trans '" bio-dynamic/ organicS org bd org org org bd org org org org org org org
1. 'F' = flat, 'V' = undulating, 'S' = steep 2. All soil types are silt loams unless stated otherwise: 'che' = chertsey, 'culv' = culverden, 'ey' = eyre, 'gl' = glasnevin, 'gn' = glenmark, 'ha' = haldon, 'hibk' = highbankllynhurst, 'Iism' = lismore stony silt loam, 'mai' = mairaki, 'tmp' = templeton, 'tmka' = temuka, 'wai' = waipara, 'wak' = wakanui, 'wt' = waterton, 'wn' = windermere loamy peat. Source: NZDSIR Soil Bureau Bulletin No. 27, 1968. 3. Stocking rates are approximate only. due to the complexity of some operations which sold or bought grazing. 4. This farm usually carried 14 stock units, but kept ram lambs on because of low lamb prices. 5. Average stocking rate for this location. soil type and supply of irrigation (Source: Hunter et aI., 1983). 6. 454 organic stock units. 1054 in total. --7. This farmer had farmed organically for over 20 years, but chose not to belong to the BPC and marketed under an independent label. 8. 'bd' = Bio-Dynamic, 'org' = Organic Source: PRAC survey

23
group was 176.4 hectares (s.d. = 118.6. n=41). Farms owned by the PRAC were more diversified. less variahle hetween fanns. and more crop-oriented than the PROS group. Further comparisons between practicing organic. prospective organic and conventional producers are made in Chapter 7.
Comparative data sources included Clark and Burtt (1986) and experts in conventional farm management for technical infonnation; Clark et al.. (1988) and farm advisors for economic data; personal farmer characteristics from Fairweather (1987) and Pryde and McCartin (1986); farm characteristics and agricultural trends from the NZ Meat and Wool Board's Economic Service annual farm surveys, and Hunter et a1.. (1983). Numerous studies of organic farming were utilised. including technical publications (for example the Elm Farm Research Centre. 1986), sociological work (e.g. Foster and Miley. 1983), economic studies (e.g. Cacek and Langner, 1986), and ecological research (e. g. Lowrance et al.. 1985). Market research was also included in the study,
. for example the Horticultural Market Research Unit's (1986) study of marketing prospects for organic horticultural produce. Studies of the adoption of related technologies also yielded useful information. notably MacIntyre's (1987) analysis of the spread of pesticides in the United States, and Wearing's (1988) study of the implementation of integrated pest management systems.
3.4 THE RESEARCH PROGRAlYIME
The research programme is summarised in Table 3.4. As the sample size of each group of farmers increased. and more information was obtained. data collection techniques became increasingly quantitative. structured and objective. Each stage guided the later survey questions. which had a more closed. simple and structured design.
Tllble 3.4 The research programme
Jan - Nov 1987: November 1987:
Dec 1987 - Feb 1988:
February - April 1988: May 1988:
June - August 1988:
August 1988: September 1988: Oct 1988 - Feb 1989:
Lilerature review Leller of introduction and telephone call to interview participants Participant observation nnd intensive interviews with three EOP nnd one TOP. Write up of farm reports nnd verificntion with BPC inspector nnd farmers. Development of approach and questionnaire design Structured interviews of nine TOP. postal questionnaires to all PRAC. Data annlysis and development of postnl questionnaire for PROS. Mailout of postal questionnnires to 52 PROS. Two postal reminders nnd dnta nnalysis Results wrillen up.

24
3.5 SURVEY OBJECTIVES AND PROCEDURE
At each stage of the research program, the following types of information were
collected from each individual farmer:
Farm characteristics
Farmer's personal characteristics and motivations, and the role of household and community
Technical aspects of conversion to OF
Economic and other performance aspects of conversion to OF
Farmer interactions with other businesses and institutions
Information needs and sources
3.5.1 Initial contact with the practicing organic farmers
Names of the PRAC population were obtained from R.A. Crowder, a BPC inspector
and executive member. A letter of introduction, which is included in Appendix A, was
sent 'on 15 November 1987 and a telephone call one week later established that all of
the 13 PRAC were willing to cooperate and permit access to the BPC files. This
information provided an initial data base including soil types, farm size and other
characteristics, Bio Gro status, farm practices and enterprises, and the inspector's
assessments of farm performance including soil structure, weed and pest infestation,
animal health and yields.
3.5.2 Participant observation and in-depth interviews: practicing organic farmers
A combination of participant observation and intensive interviewing methods was
employed to study the three EOP and one TOP. The TOP was recommended by the
Managing Director of New Zealand Bio Grains Ltd. as a highly competent farmer.
One objective was to develop in-depth case studies of commercial OF systems. based
on the experience of expert farmers. A further aim was to explore the imp0l1ance of
different barriers using an open-ended research design which allowed individuals to
identify the factors they considered relevant, without limiting them to a preconceived
range of variables. The results from this stage also helped the later design of structured
questionnaires.
25
Information was collected by living and working with three PRAC families for one
week each, and intensively interviewing a fomth participant on three separate occasions
for a total of 10 hours. Notes were taken during discussions in the field and in the
evenings. Where possible, the farmer and his partner were interviewed on all of the
farms. Farm reports were written immediately after each farm visit.
Membership an~ participation in various OF organisations by the researcher, a further
type of participant observation, contributed useful insights into the industry. Biological
Producers Council (BPC) inspections of Canterbury organic farms, and BPC
inspectorate, executive and annual general meetings were attended. Field days and
conferences run by the Bio-Dynamic Fanning and Gardening Association, Soil and
Health Association, and Nutrition Society were attended. Membership in these
organisations improved access to data sources, and increased the author's acceptance by
participating farmers.
3.5.3 Structured interviews and postal questionnaires: practicing organic farmers
, The next stage was to collect data from the nine remaining TOP. This group of
farmers was currently experiencing barriers to implementation of organic faming. A
large body of information was sought, induding written and oral responses from the
participants, which was sufficiently standardised to be used for comparative purposes.
Accordingly, a combined approach of an interview and postal questionnaire was taken.
After setting an interview time by telephone, the farmers were sent postal
questionnaires two weeks before the interview (Appendix B) .
. Partly because the author was a student from Lincoln College, all farmers were willing
to cooperate in the study. The introductory letter stressed that the research project did
not aim to 'test' organic farming's performance, and that issue identification was more
important. Several farmers were initially distrusting and suspicious for several reasons.
including the opinion that there had been an 'overkill' of researchers interested in their
practices and performance, who had provided little feedback to the innovators
themselves; in difficult times and with a competitive market. economic data was
sensitive; one farmer did not believe the investigation would take important personal
factors such as family considerations into account when the motivation for conversion
were considered; farmers never have 'spare' time and they were unsure of the worth of
the study.

26
These hurdles to access were overcome by assurances of confidentiality and the
provision of infotmation to fanners during the year and after the thesis was completed.
The author tried to establish himself as willing and interested to learn from their
experience, and a rapport was usually rapidly estabHshed.
With a small sample size, a full pilot study was not feasible, however postal
questionnaires were sent to two fanners in the participant observation subgroup who
agreed to fill out a shortened survey form, and three transitional farmers were
interviewed a week before the other farmers. The main change was to remove several
questions from the survey because of its length.
The following interviews were structured around discussion of the farmers' written
responses, and required 3 hours to complete. In addition, completing the postal survey
form required another hour, which was longer than most farmers would have liked. In
cases where the questionnaire had not been completed, questions which were to be
compared with other written surveys were filled out by the farmer either in a break in
the, interview, or after the interview and then posted to the interviewer. Other, less
method-sensitive questions were discussed and filled out during the interview. The
structure of the verbal questionnaire (Appendix C) was therefore only a guide, and
many of the questions were answered by simply discussing the written responses. The
main differences between the questions in the verbal and postal parts of the survey was
that the verbal questions were more open, and asked for information about farm
practices such as cultivation techniques which was difficult to standardise in a postal
questionnaire.
3.5.4 Postal questionnaires: prospective organic farmers
Finally, a postal questionnaire (Appendix D) was sent to PROS to identify differences
between the PRAC and this group of (possibly) future organic farmers. Prospective
organic fanners' perceptions of the technical and peIformance features of organic
farming were compared with rep011ed pelformance. Information was also sought on
how farmers gained information and first became involved in OF.
Survey forms were posted to the 52 PROS. Questionnaires were printed on yellow
paper for visual impact, and a covering Jetter and franked envelope were also enclosed.
Mter the initial maHout and two follow-ups, 90.4% were returned (n=47), of which
78.9% (n=41) were usable questionnaires from respondents who met the criteria for a
prospective organic farmer. The survey form was shorter than the TOP questionnaire,

27
and it included a large proportion of closed questions with room for added. comments.
Many farmers put considerable effort into the survey~ and added valllable details about
their farming histories and motivations.
3.6 DATA ANALYSIS
Most data analysis was exploratory, and only a small number of simple statistical tests
(chi-square and Student t tests) were employed using a ninety-five percent critical level
of significance. Much of the information was presented in summary tables in Chapters
4 to 8. All primary data was collected on an anonymous basis, and Tables 3.3, 5.5 and
5.6 are the only presentation of data on an individual farm basis.
Differences in economic performance were estimated by several methods to reduce bias.
These techniques included gross margin calculations, farmers' personal assessments,
and comparisons with expert estimates of yield for each property. The four participant
observation farm reports were summarised as one-page personality profiles (Appendix
F). Characteristics of practicing and prospective organic farmers were also measured
quantitatively. Hypotheses developed from the OF and adoption-diffusion literature
were tested statistically. Secondary information on agricultural trends was analysed
from the perspective of induced innovation theory.
3.7 POTENTIAL FOR BIAS
The potential for interviewer bias in participant observation was very high. The
author's personal view, as an ecologist and scientist, was that while he was sympathetic
to the concepts of low-input and sustainable agriculture, he was not convinced that
these were best achieved by removing all chemical inputs. The author considered strict
organic production to be a rational choice of production system principally on the
grounds of commodity prices and personal falmer preference.
In each part of the study, independent sources of verification were sought to minimise
the risk of unintended bias. The four participant observation farm rep0l1s were verified
by sending a copy to the farmer for comment or correction, by discussion with a BPC
inspector and by referring to BPC files. In all cases, only minor corrections were
necessary to the reports. The length of time spent with each farmer gave the author a
good indication of his views and experiences. The entire popUlation of Canterbury
organic farmers was interviewed. Reference to expert opinion and the literature on
organic farming provided additional checks.

28
Wherever possible, more than one research method was used to assess a single
phenomenon. For example, TOP attitudes were assessed by written responses in
addition to interview techniques. However, triangulation was limited by the fact that the
same researcher undertook each stage of data collection and analysis. As well,
considerable bias was possible from written survey methods. The postal questionnaire
to transitional farmers was probably too long, and farmers found that it was 'like filling
·out a census'. In contrast, they were more willing to undertake an interview, and were
very open to discussing personal reasons for adopting OF. A problem with written
attitudinal scaled questions was that they were not always answered in terms of personal
views and experiences. For example, one farmer ranked 'opportunity for leisure' as a
very important motivation for farming, despite working a 90 hour Week.

PART II
RESULTS AND DISCUSSION

29
CHAPTER 4. INSTITUTIONS AND INFORMATION
4.1 Introduction 4.2 The Biological Producers Council and the Bio Oro Standard 4.3 Research, extension and information 4.4 Agribusiness 4.5 Summary
4.1 INTRODUCTION'
Several types of institutional arrangements can af!"ect entry into organic farming (OF): agencies which promote, research, or oppose OF; special purpose legislation, notably the Bio Gro regulations; and the more general legal and social framework in which organic farmers operate, including property rights, markets and statutes. Institutional constraints to OF may also include opposition from chemical industry interests, limited access to credit, and a research and extension bias towards conventional agriculture (CF) (Oelhaf, 1978).
This chapter deals principally with the Bio Gro Standard for Organic Food Production and the roles of research and extension agencies in the organic industry. The Bio Gro Standard and the certification process are discussed in section 4.2. Results from an American study (Blobaum, 1983) and the survey of South Island farmers identify information needs and sources, and farmer perceptions about the roles of the Ministry of Agriculture and Fisheries (MAF) and other research and extension agencies (section 4.3). The impacts of two other business groups (credit agencies and chemical industry interests) are briefly discussed in section 4.4. ' The chapter concludes with a summary of the institutional barriers to OF (section 4.5).
4.2 THE BIOLOGICAL PRODUCERS COUNCIL AND THE BIO GRO STANDARD
4.2.1 The Bio Gro Standard The strict definition 'Of organic farming used in the thesis is adopted from the Bio Gro Standard for Organic Food Production. Bio Gro is the organic trademark of the Biological Producers Council (BPC), and the Bio Oro Standard specifies restricted and pennissible farm practices, and includes guiding management principles. The BPC is

30
affiliated to the International Federation of Organic Agriculture Movements (IFOAM),
an international organic quality control body. . Bio Oro is therefore international1y
recognised, and the Standard is similar to those of other member associations such as
the British Soil Association. Another trademark, Demeter, is owned and administered
by the Bio-Dynamic (BO) Farming and Gardening Association of New Zealand. The
Demeter Standard specifies similar chemical restrictions as Bio Gro, and for these
purposes BD is considered as a special case of organic farming. Bio-dynamics supports
a system of agriculture developed fro~ the teachings of Rudolf Steiner, and is part of a
global anthroposophical movement (anthroposophy is the spiritual world view
developed by Rudolf Steiner). For these purposes, BD is considered a special case of
organic farming.
The critical distinction between OF and other farm systems is the exclusion of
pesticides and chemically process fertilisers (Lockeretz and Wernick, 1980). However,
OF has evolved from a number of different sources (Vine and Bateman, 1981), and
alternative agriculture is a semantic maze of terms. Some of the terms which have been
'. used to refer to 'organic' farming, but which in fact differ in significant ways, include
low-input farming, sustainable agriculture, bio-dynamics, and ecological agriculture.
Definitions of these terms are given in the glossary of terms appended to the text. In
following paragraphs, the principles, specificati.ons and administration of the Bio Oro
Standard are discussed.
The aims of organic farming, as interpreted by IF®AM, are:
(1) To produce a sufficient quantity of highly nutritious foodstuffs.
(2) To provide agricultural producers with a safe and satisfying work environment and a reasonable return.
(3) To raise livestock in conditions which allow them to perform all the innate aspects of their behaviour.
(4) To work in conjunction with natural processes, rather than trying to dominate them.
(5) To enhance soil fertility, with great emphasis being placed on soil organic matter and soil biology.
(6) To close the production system as much as possible. On-farm resources and local, renewable inputs are preferred. The farm should be as self-regulating and selfsustaining as possible, with little need for external control and inputs.
(7) To minimise environmental degradation, and to preserve the genetic diversity of the agricultural system and its surroundings.

31
These principles are interpreted in a set of standards with which a fanner must comply
for Bio Oro certification. These specifications are reviewed every two years. In their
present form, the main features of the Bio Gro Standard are:
(1) All inputs to the farm system must be of a type approved by the BPC. Slow-release and humus-based fertilisers which encourag~ and require biological activity in the soil are preferred. These include animal manures and plant material, compost, biological activators, rock minerals, and herbal and homeopathic solutions.
(2) Chemically synthesized compounds, such as superphosphate, anthelmintic drenches, growth hormones and pesticides are not permitted at any stage of the production, processing and distribution stages. However, limited chemical use is permitted where herbal or physically prepared compounds are not available as a curative rather than a routine measure.
(3) Animals must be managed with respect to their welfare, and a diseased animal must not . go untreated in order that it may be called organic. Livestock treated with restricted animal remedies lose their Bio Gro status for 12 months, and must be kept separate from the organic flock for a designated period.
(4) Livestock bought onto the farm each year must not exceed 10 percent of the capital stock figures. They must be kept separate from the organic flock for a period and require 12 months to elapse before they can be sold as Bio Gro.
(5) The amount of supplementary feed brought onto the property from non-Bio Gro sources may not exceed 15 percent of the total annual dry matter intake of the animal. Animals grazing on non-Bio Gro land or con,suming more than this amount lose their Bio Gro status for 12 months.
(6) Plant and equipment which come into contact with chemicals (for example a contractor's spray rig) are prohibited if uncontaminated alternatives are available.
(7) There must be no parallel production: Crops and stock to be sold as organic must be clearJy distinguishable by marking, variety, breed or type from conventionally grown produce.
(8) The label is two-tiered. For both full Bio Gro and Bio Gro in transition, the farm area must be farmed using organic methods for a minimum period of 24 months. The farm area is the unit which is awarded the Bio Gro label. Full Bio Gro is awarded when the BPC is satisfied that the need for routine use of restricted practices has been eliminated. The Bio Gro label can be issued for part or all of the farm production system, and can also be awarded to approved 'organic' commercial products.
(9) Organic produce must have an acceptably low level of chemical residues. This is one percent of the conventional maximum permissible levels (as specified in the New Zealand Food Regulations) for human consumption. Possible chemical contamination from neighbouring land, the water source, persistent soil residues, major roads (lead accumulation), shared farm equipment, and industry should therefore be minimal
(10) Farm practices must not violate the principles outlined in the standards.
(11) Annual inspections of the farm are made at the cost of the producer.

32
Several of the above specifications greatly limit the economic and technical feasibility of
organic farming in a number of situations. Total elimination of chemicals reduces the
profitability of organic farming in farm locations and for crops which show high
productivity responses to chemical use, and for which non-chemical strategies are
inadequate. For example, sheep producing regions which require routine vaccination of
livestock may be unable to profitably adopt OF. This represents a significant constraint
on the expansion of organic farming. In addition, organic farmers are unable to
routinely employ a small chemical input to prevent pest outbreaks, such as anthelmintic
administration on the basis of faecal egg counts in sheep. In the future, possible
restrictions on genetically-modified crops may further limit the ability of organic
farming to eliminate chemical use.
Restrictions on the quantities of brought-in feed and livestock can also reduce the
profitability of organic farming. Certain production systems, such as hill country
farms; are highly reliant on imported feed. Consequently, stocking rates and
productivity are limited by this requirement, unless the number of lowland organic
farms increases sufficiently to provide a reliable feed supply. The 12 month quarantine
period for brought-in livestock excludes fattening store lambs imported from non-Bio
Gro farms, which may also affect store cattle. Again, the small number of producers
limits the range of feasible organic enterprises. This livestock restriction also
necessitates development of a breeding flock for lamb-producing farms, which increases
the cost of establishing an OF system. Restrictions on spray equipment also increase
investment costs for those producers intending to spray liquid fertilisers.
The physical requirements for OF also deny Bio Gro status to a large number of farms.
Because of past chemical use, persistent pesticide residues in Canterbury soils greatly
limit the ability of farms to produce animal products which have low chemical residue
concentrations. This aspect of the Bio Gro standard had yet to be ligorollsly enforced.
but it presents a significant constraint to the industry.
4.2.2 The BPC Review Process
To apply for the Bio Gro label, a producer joins the BPe, and pays an inspection fee.
The producer supplies the BPC with information about the faIm's management history.
proposed organic enterprises, layout, location and a management plan for conversion.
The farm is then inspected by a trained, semi-voluntary inspector, whose expenses
(excluding labour) are reimbursed by the BPe, Annual inspections are made of the
property, and farmers reapply each year. An inspector's report is prepared which is

33
distributed among other inspectors, who gather twice each year to collectively decide
on the status of each property. The BPC informs the fanner of the 'decision, and
specifies required changes.
Bio Gro is a marketing symbol and standard which was developed by organic fanners in
the Biological Producers Council in 1984, in response to a growing concern that
without a consistent standard for produce marketed as 'organic', there was no
protection of the consumer and bona fide organic producers. The Bio ·Gro standard
also left quality control in the hands of producers. Two important consequences have
arisen from this path of development. First, while Bio Gro protects the interests,
domestic markets and ideals of established organic producers (EOP), its rigorous
specifications limit the ability of new producers to enter the industry. Second, it is
based on producers' perceptions of organic farming, and IFOAM guidelines, despite
the faCt that consumer specifications for an organic product are more important in
terms of marketing. Consumer demands have yet to be clearly established, and may
differ from the Bio Gro Standard. This is an important topic for market research,
'·because it is possible that most consumers would be satisfied with a less rigorous
standard. This possibility is discussed in Chapter 8.
From participant observation of the BPC review process, it was apparent that the issue
of undefined consumer demands was also important with respect to quality control.
Based on the subjective assessments of inspectors, it was difficult for farmers who were
not personally co~mitted to full conversion of the farm to OF to achieve Bio Gro
status. The market for organic produce is vulnerable to abuse, and continuous
enforcement of the Bio Oro Standard would be both costly and impractical. Farmer
integrity was therefore viewed as an essential requirement for Bio Gro certification.
Producers with off-farm income sources were considered more willing and able to
accept production losses than those relying totally on farm income, farmer ability was
held to be important to ensure the producer was a 'good advertisement' of the standard.
and farmers who were well known in organic circles were also favoured for Bio Oro. If
consumer demand is primarily for a low chemical residue product. residue testing of
organic produce may be a more important. less subjective, and perhaps more effective
means of controlling food quality which could complement or replace faIm inspections.
Residue testing is the basis of quality control for at least one health food trademark in
the United Kingdom (Cutting, 1986).
The BPC organisational structure is a constraint to the expansion of organic farming.
The roles of the BPC include the ownership and administration (review of standards,
34
inspection, certification, and enforcement) of the Bio Gro label, lobbying on behalf of
producers. and a focus for social gathering and information exchange. As a semi
voluntary organisation, its resources and infrastructure were stretched by the demands
of a growing number of new organic producers, and a constant stream of new farming
products requiring consideration in terms of the Bio Gro Standard. In an expanded
commercial industry, a shift to a more commercial/professional basis would be required
to meet increased administrative demands, the need for standardised quality control,
and coordination of marketing and other activities. This might include the employment
of either fully-paid inspectors, or the infrastructure of the MAF. However, as the next
section shows, some organic producers expressed strong views about the role of
bureaucratic institutions in the OF industry.
4.3 RESEARCH AND EXTENSION AGENCIES AND INFORMATION
A lack of information about the technical and economic aspects of organic farming is an
important limitation of the technology. Twenty eight percent of respondents in an
American organic farmer survey (Blobaum, 1983) hesitated before adopting OF due to
a lack of information. In the South Island survey, 14.6% of the prospective organic
farmers (PROS) were deterred from adopting OF because of a lack of information
(Chapter 7, section 7.3.3). Organic farming has been described as an information
based production system (Coleman, 1985) because of its reliance on management rather
than capital inputs. For example, soil fertility maintenance under OF relies largely on
crop rotational design and conservation of nutrients, rather than direct fertiliser
applications. Furthermore, producers adopting OF lose the information support
available to conventional producers (CP), and must instead invest in research and
development on an individual farm basis. Research is therefore critical to the expansion
of organic farming.
Oelhaf (1978) contended that the nature of organic farming research needs ancl
widespread market failure in agriculture has resulted in a research bias towards CF. On
the basis of short-term cost-effectiveness, the market for research favours rapid
development of management solutions which can be patented and sold directly to
producers, for example herbicides and growth hormones. In contrast. OF research
needs are frequently long-term, require a holistic approach, lack the funding support of
chemical companies, and are often concerned with the external (social) costs and
benefits of farm practices. For example, it is difficult to directly recover the cost of
research on the impacts of cultivation practices on soil biology. Public funding is
therefore necessary to acquire this type of information.

35
This point is particularly relevant in the present user-pays environment ~or research and
extension. In the past, a cooperative relationship existed hetween innovative fanners.
extension agents and researchers in New Zealand, which resulted in the design and
diffusion of innovative farm systems (McArthur, 1987). In the OF industry, most
practical expertise currently lies with producers themselves. The MAF has recently
allocated public funds to research and development of organic farming. However,
subsidisation has not been extended to farm extension services. Practicing organic
fanners expressed concern that while the MAF had free access to farmer expertise,
which could then be sold to other competing producers, the PRAC were required under
user-pays to pay for information from the MAF. This caused resentment among the
PRAC, created an obstacle to cooperative development between scientific and OF
communities, and presented an additional cost to the PROS. To remove this problem,
payment of the PRAC for their information, or subsidisation of research and extension
during the early development of the OF industry are possible options.
To establish a cost-effective research and extension service, significant changes would
be"required to the information sources currently used by organic farmers. Respondents
to Blobaum's (1983) survey relied on unorthodox information sources, notably other
organic farmers and members of the OF industry, books and magazines, salespeople,
meetings, health food shops, and farmers' own experimentation. However, most
farmers had a strong interest in further research being undertaken by scientific
institutions. In New Zealand, the relationship between organic farmers and the
scientific community has been strained in the past (Haynes and Swift, 1984).
The reliance on unorthodox information sources was confirmed by the South Island
survey. Practicing organic fanners rated a series of different information sources
according to how helpful they had been in providing information about OF (Table 4.1).
The most important information sources were articles, books written by organic
farmers, and shared experiences and expertise, particularly with other PRAC. The BPC
and BO Association were also cited as useful information sources. Extension and
research agencies were not delivering the information which these farmers required.
although several of the PRAC were also resistant to advice from farm advisors. R.A. /'
Crowder, Who ran the Lincoln College biological husbandry unit and was President of
the BPC, was the most helpful research contact. Stock and station agents were rated
the least helpful, which was not surprising due to their conventional training and
personal interest in chemical sales. Radio and television programs lacked the in-depth
information required for farming decisions.
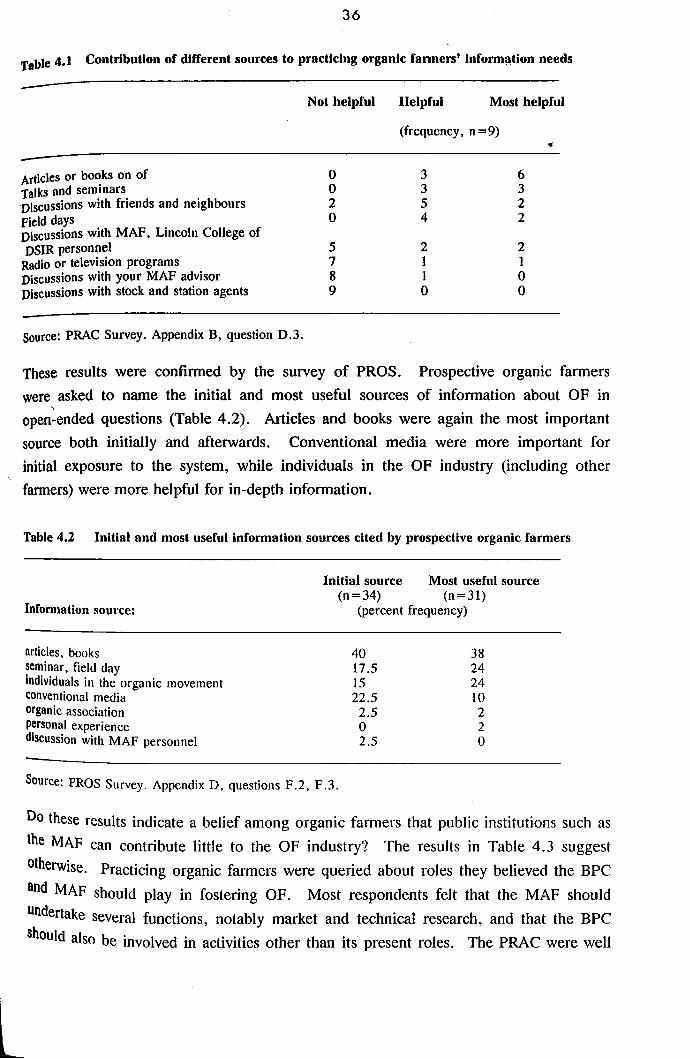
36
Table 4.1 Contribution of different sources to practicing organic fanners' informQtion needs
Articles or bo~ks on of Talks and semmars "Discussions with friends and neighbours Field days Discussions with MAF. Lincoln College of DSIR personnel
Radio or television programs Discussions with your MAF advisor Discussions with stock and station agents
Source: PRAC Survey. Appendix B, question D.3.
Not helpful Helpful Most helpful
(frequency, n = 9)
o o 2 o 5 7 8 9
3 3 5 4
2 1 1 0
• 6 3 2 2
2 1 0 0
These results were confirmed by the survey of PROS. Prospective organic fanners were asked to name the initial and most useful sources of information about OF in open~ended questions (Table 4.2). Articles and books were again the most important source both initially and afterwards. Conventional media were more important for initial exposure to the system, while individuals in the OF industry (including other fanners) were more helpful for in-depth information.
Table 4.2 Initial and most useful infonnation sources cited by prospective organic farmers
L
Information source:
articles, books seminar, field day individuals in the organic movement conventional media organic association personal experience discussion with MAF personnel
Initial source Most useful source (n=34) (n=31)
(percent frequency)
40 17.5 15 22.5
2.5 o 2.5
38 24 24 lO 2 2 o
Source: PROS Survey. Appendix D, questions F.2, F.3.
Do these results indicate a belief among organic farmers that public institutions such as the MAF can contribute little to the OF industry? The results in Table 4.3 suggest otherwise. Practicing organic farmers were queried about roles they believed the BPC and MAF should play in fostering OF. Most respondents felt that the MAF should undertake several functions, notably market and technical research, and that the BPC should also be involved in activities other than its present roles. The PRAC were well

37
informed of the MAF's intentions through the BPC, and while this may lhave affected their responses. during the interview this question was discussed in some depth. One aD farmer stated that the BD Association should undertake all of the above activities, and that the BPC should also monitor legislation and make submissions where
necessary.
Table 4.3 The preferred roles of the MAF and BPC: responses of practicing organic farmers
No involvement Research into organic practices Market research Marketing and promotion Advisory ~ervice for organic farmers Quality control for products and inputs Inspections of farms Independent organic label and standards
Source: PRAC Survey. Appendix B, question F.2.
MAF BPC ,(frequency, n=9)
o 8 8 5 6 5 5 1
o 4 6 5 5 6 6 8
An advisory service would be welcomed by some of the PRAC, however independence was stressed by several as an important reason for choosing of in the first place. Only one farmer thought the MAF should develop a separate organic trademark. All other PRAC felt strongly that the BPC should retain control over the Bio Oro standard, and that this should remain the dominant organic trademark. Opposition from these producers to the introduction of a different standard would therefore be likely. While half of the PRAC thought the MAF should participate in inspection of farms, it was apparent during the interviews that others strongly opposed this. To ensure that inspectors adhered to the guiding principles of the standards, some screening of the MAF staff was thought necessary. To most farmers, the role of the MAF should be a sllpportive one. with ultimate control of the industry remaining with the prnducers themselves.
Given these obstacles to a cost-effective research and extension service, what infOnnation needs were specified by the practicing and prospective organic farmers? In response to an open-ended question (Table 4.4). the main information needs related to organic markets, animal health remedies, technical and financial information, and soil biology and fertility. These needs are similar to the problems and disadvantages of the system which were identified by the farmers (Chapter 7, Table 7.9). A notable
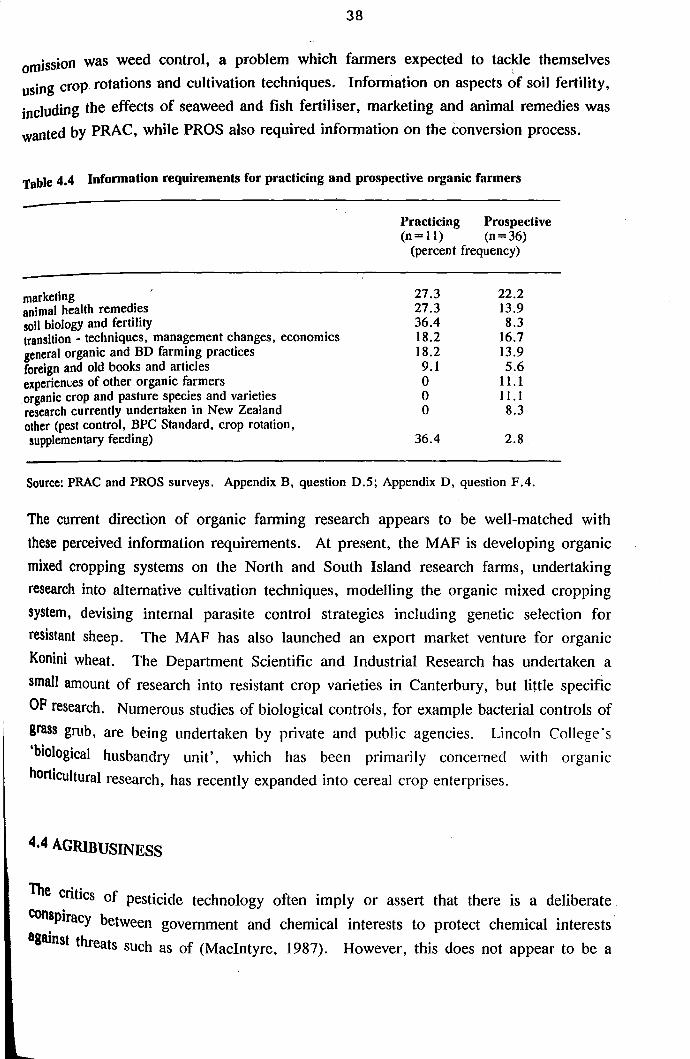
38
omission was weed control, a problem which farmers expected to tac~le themselves using crop rotations and cultivation techniques. Information on aspects of soil fertility, including the effects of seaweed and fish fertiliser, marketing and animal remedies was wanted by PRAC, while PROS also required information on the conversion process.
Table 4.4 Information requirements for practicing and prospective organic farmers
marketing animal health remedies 5011 biology and fertility transition - techniques, management changes, economics general organic and BD farming practices foreign and old books and articles experienl:es of other organic farmers organic crop and pasture species and varieties research currently undertaken in New Zealand other (pest control, BPC Standard, crop rotation, supplementary feeding)
Practicing Prospective (n= 11) (n=36)
(percent frequency)
27.3 22.2 27.3 13.9 36.4 8.3 18.2 16.7 ]8.2 13.9 9.1 5.6 0 11.1 0 ] 1.1 0 8.3
36.4 2.8
Source: PRAC and PROS surveys. Appendix B, question D.S; Appendix D, question F.4.
The current direction of organic farming research appears to be well-matched with these perceived information requirements. At present, the MAF is developing organic mixed cropping systems on the North and South Island research farms, undertaking research into alternative cultivation techniques, modelling the organic mixed cropping system, devising internal parasite control strategies including genetic selection for resistant sheep. The MAF has also launched an export market venture for organic Konini wheat. The Department Scientific and Industrial Research has undertaken a small amount of research into resistant crop varieties in Canterbury, but little specific OF research. Numerous studies of biological controls, for example bacterial controls of grass gmh, are being undertaken by private and public agencies. Lincoln College's 'biological husbandry unit'. which has been primarily concerned with organic horticultural research, has recently expanded into cereal crop enterprises.
4.4 AGRIBUSINESS
The critics of pesticide technology often imply or assert that there is a deliberate conspiracy between government and chemical interests to protect chemical interests· ag .
IUnst threats such as of (MacIntyre, 1987). However, this does not appear to be a
39
significant barrier to OF. It is certainly true that individuals and organisations tend to pursue their interests, and Chemical companies in New Zealand have reacted against -the upsurge in of by widely distributing New Zealand Farm Progress, a publication which stresses the more radical aspects of environmentalism. Chemical interests have far greater resources than the alternative agriculture movement. However, MacIntyre (1987) concluded that pesticides would still have received extensive use in the United States, had there been a total absence of conspiratorial behaviour. As well, integrated pest management consultants in New Zealand did not consider such opposition to be a major barrier to the implementation of integrated pest management (a system which incorporates biological and chemical pest control~) in this country (Wearing, 1988). The experiences and perceptions of the practicing and prospective organic farmers also did not indicate that opposition from agribusiness was a major barrier. Results in Chapter 7 show that opposition from these sources was not considered a major barrier by practicing and prospective organic farmers. The reaction of credit agencies and other businesses such as stock and station agents to Canterbury farmers' change to organic methods varied according to each individual representative's opinion. l The attitudes of creditors included one negative, three neutral, five mixed and three favourable responses. All of the PRAC obtained credit from conventional sources, although one BD farmer obtained development capital from Prometheus, an alternative cooperative finance company. Stock agents tended to be more positive than station agents, presumably because their business was less affected by reduced chemical sales.
4.5SUMMARY
In this chapter, the institutional barriers to organic fanning (OF) have been reported, and OF has been defined. The strict definition of organic farming in the thesis is the Bio Gro Standard for Organic Food Production, and bio-dynamics is considered as a special case of organic farming. The Bio Gro Standard includes guiding management principles. permitted and restricted practices, and it is administered by the Biological Producers Council (BPC).
The Bio Gro Standard is a very strict definition of organic fatming which attempts to eliminate all possible sources of chemical contamination of produce. Some of its specifications limit the technical and economic feasibility of organic farming for a range of crops and farm locations. Because Bio Gro completely excludes most chemical inputs, the risk of pest outbreaks and productivity losses is increased, particularly in regions with chronic pest problems and for enterprises such as wheat production which I PRAC survey. Appendix B. question F.1.

40
are vulnerable to pest loss. The rigour of the Bio Oro Standard therefore represents a significant constraint to expansion of organic fflrming and the ahility of producers to supply organic produce. Production costs are also increased, because organic producers are unable to employ chemical controls or genetic engineering when they are least-cost. Organic farms are unable to buy in and fatten store lambs and cattle because of the 12 month quarantine period under Bio Oro. Persistent pesticide residues
I in soil eliminate a large number of farms in Canterbury from achieving Bio Oro
certification.
Other aspects of Bio Oro also create barriers to the expansion of organic farming. Bio Oro is a marketing symbol, however its rigorous specifications and philosophical elements are based on the perceptions of established organic producers, and International Federation of Organic Agriculture Movements (IFOAM) guidelines, rather than consumer demand. An important research priority is therefore to identify the qualities which consumers demand in an 'organic' product, which could form the basis of a marketing strategy for the OF industry. An alternative to Bio Oro may be a more profitable marketing standard. If consumers principally demand a product which is low in chemical residues, then quality control should be based principally on testing actual residue levels in food. At present, the BPC relies instead upon subjective assessments of the farmers' commitment to avoiding chemical use. In) addition, the BPC organisational structure is a constraint to the OF industry. For OF to evolve into a commercial industry, a more commercial/professional infrastructure is required in place of the present semi-voluntary structure. This may require an expanded role for the BPe or greater activity by outside organisations such as the Ministry of Agriculture and Fisheries (MAF).
A lack of information about the technical and economic aspects of organic farming is another limitation of this management-intensive technology. Practicing (PRAC) and prospective (PROS) organic farmers perceived several information needs. These related to organic markets, animal health remedies, technical and financial information. and soil biology and fertility. Because significant externalities exist in OF research. public funding is required if these infOlmation needs are to be met. The present publicly-fUnded MAF research strategy appears to be well-matched to the perceived needs of ~racticing and prospective organic fmmers. However. the user-pays approach to farm extension created an information and communication balTier between the scientific and OF communities. Despite the fact that the MAF had free access to the expertise of the organic fanners, the PRAC were required to pay for information from the MAF. User-pays caused resentment among the PRAC, created a barrier to cooperation between

41
scientifiC and OF communities, and presented an additional cost to farmers considering adoption '(PROS). To remove this prohlem. payment of the PRAC for their information, or subsidisation of research and extension during the early development phase of the OF industry are possible options. Some of the PRAC resisted' the involvement of outside agencies such as the MAF in some aspects of the industry. However, all of the PRAC favoured the MAF undertaking market, economic and technical research. Practicing and prospective organic farmers relied primarily on unorthodox information sources such as other fanners and specialist books and articles, rather than farm advisors. Dissemination of research results through these channels and/or a significant change in existing infonnation sources would be required for agencies such as the MAF to develop a cost-effective research and extension service.
Opposition from chemical industry interests and agribusiness has been suggested as a barrier to OF. The image among fanners of organic fanning is affected by propaganda by both the chemical and OF industries. However, the results of the pra<;:ticing and prospective farmer surveys and previous research suggests that if a farmer perceives OF to be a viable alternative, opposition from these sources is not a major barrier.
This chapter has discussed the Bio Gro Standard as an institutional constraint, and has identified fanners' perceived infonnation needs. The next chapter shows how producers interpreted the Bio Gro Standard in a commercial setting, and the technical difficulties that were encountered once chemical inputs were removed.

-
4-2
CHAPTER 5. ORGANIC FARM PRACTICES 5. t Introduction 5.2 Strategies for conversion 5.3 Changes in farm practices 5.4 Bio-dynamic agriculture 5.5 Summary
5.1 INTRODUCTION
,-
Organic fanning (OF) is a management system which differs from conventional agriculture (CF) primarily in its approach to soil fertility and pest control (Oelhaf, 1978). However, when one removes chemical inputs from the production system a broad range of technical changes are required. In addition, the Bio Gro standards and the particular requirements of the bio-dynamic (BD) system further restrict and/or alter fann management. This chapter describes the technical aspects of changing to OF, based on the experiences of Canterbury organic crop and livestock producers.1 The purpose of the chapter is to provide infonnation about OF as a technology, and to identify technical barriers to OF. In section 5.2 different strategies for conversion to OF are assessed. Differences between organic and conventional fanning practices are identified in section 5.3. In section 5.4 BD fann practices are described, and a summary of the chapter is provided in section 5.5.
5.2 STRATEGIES FOR CONVERSION
One hypothesis in the innovation-diffusion model is that technologies which can be tried out on a limited basis before full adoption (which are termed 'trialable' innovations by Rogers (1983), p.15) have less uncertainty and are more rapidly adopted than technologies which are all or nothing. The experiences of the Canterhl_1ry practicing organic farmers (PRAC) suggest that OF has low trialability. Many of the benefits of organic farming are likely to be long-telm. for example improvements in soil fertility, and yields during the first season are frequently low (USDA. 1980). In Contrast, many of the costs. such as management retraining. are immediate. All but two PRAC converted the entire faIm area to OF in one move (termed 'full' conversion). The reasons why farmers chose full conversion over 'stepwise' (i.e. gradual) change provide useful insights into the OF technology.
I C~~::h:ublications which discuss technical aspects of converting to and practicing OF include Vine an: :nd Conacher (1982), Elm Farm Research Centre (1986), Steiner (1958), Turner (1951),
ateman (1981), and Woo key (1987).
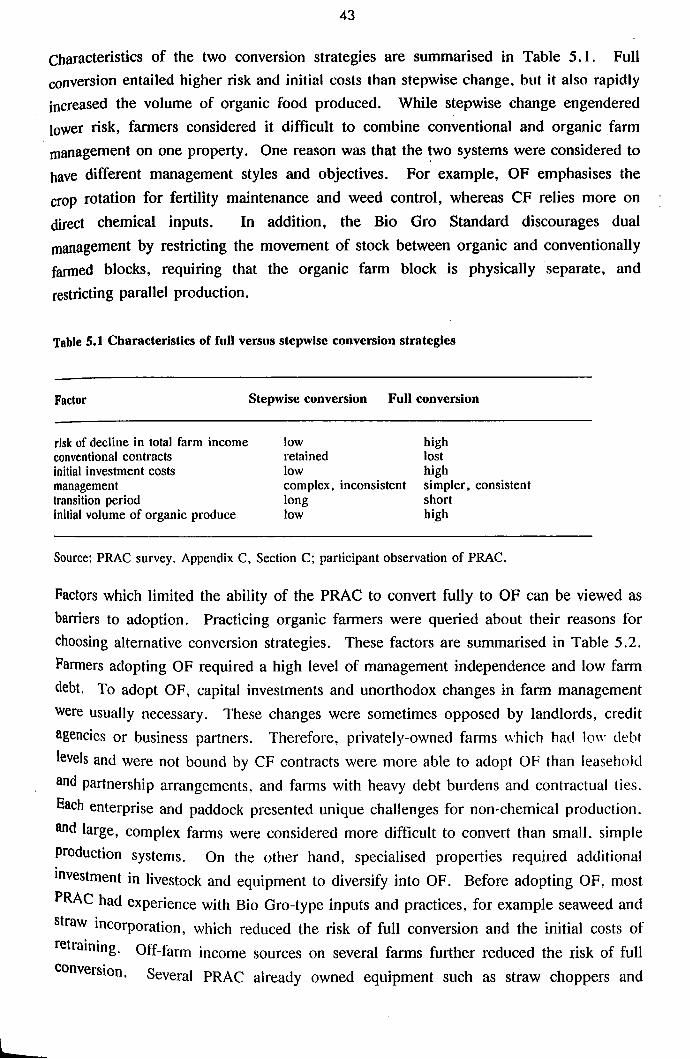
L
43
Characteristics of the two conversion strategies are summarised in Table 5.1. Full conversion entailed higher risk and initial costs than stepwise change. hut it also rapidly increased the volume of organic food produced. While stepwise change engendered lower risk, farmers considered it difficult to combine conventional and organic farm management on one property. One reason was that the ~o systems were considered to have different management styles and objectives. For example, OF emphasises the crop rotation for fertility maintenance and weed control, whereas CF relies more on direct chemical inputs. In addition, the Bio Oro Standard discourages dual management by restricting the movement of stock between organic and conventionally farmed blocks, requiring that the organic farm block is physica1Jy separate, and restricting parallel production.
Table 5.1 Characteristics of full versus stepwise conversion strategies
Factor
risk of decline in total farm income conventional contracts initial investment costs management transition period Initial volume of organic produce
Stepwise conversion Full conversion
low retained low complex, inconsistent long low
high lost high simpler, consistent short high
Source: PRAC survey. Appendix C, Section C; participant observation of PRAC.
Factors which limited the ability of the PRAC to convert fully to OF can be viewed as barriers to adoption. Practicing organic farmers were queried about their reasons for choosing alternative conversion strategies. These factors are summarised in Table 5.2. Fanners adopting OF required a high level of management independence and low farm debt. To adopt OF, capital investments and unorthodox changes in farm management were usually necessary. These changes were sometimes opposed by landlords, credit agencies or business partners. Therefore, privately-owned falms which had low debt levels and were not bound by CF contracts were more able to adopt OF than leasehold and partnership arrangements. and falms with heavy debt burdens and contractual ties. Each enterprise and paddock presented unique challenges for non-chemical production. and large, complex farms were considered more difficult to convert than small. simple prOduction systems. On the other hand, specialised properties required additional investment in livestock and equipment to diversify into OF. Before adopting OF, most PRAC had experience with Bio Oro-type inputs and practices, for example seaweed and straw incorporation, which reduced the risk of full conversion and the initial costs of retraining. Off-farm income sources on several farms further reduced the risk of full conversion. Several PRAC already owned equipment such as straw choppers and

44
minimum-tillage drills, and fanned mixed crop and livestock systems, which also reduced the initial capital outlay.
Table 5.2 Farm characteristics and the choice of full versus stepwise conversion strategies
Factor
soil fertility level chronic pest problems commitment of farmers debt:equity ratio farm size complexity diversity ties to contracts tenure, ownership off-farm income sources
Stepwise conversion chosen
high present uncertain high debt level large complex highly specialised yes leasehold, partnerships no
Full conversion chosen
low absent personally committed low debt level small simple moderately diverse no owner-operated yes
Source: PRAC survey. Appendix C, Section C; participant observation of PRAC.
Biological factors also affected the rate of conversion. Fields with depleted soil fertility were put into pasture before sowing organic cereal crops. Control of pests was required before pesticides could be removed: on one Canterbury organic property, barley grass (Hordeum spp.) became such a problem following conversion that the owner sprayed glyphosate. On Barry Wookey's organic farm in the United Kingdom (Wookey, 1987), the strategy was to attain adequate weed control on individual paddocks using herbicides and fallowing before they were incorporated into the OF rotation. The effect of past chemical use on initial productivity under OF is unclear. Wall and Strong (1987) showed that ivermectin drench residues in cow pats can depress soil biology and manure decomposition. Heavy applications of inorganic N or P fertilisers can temporarily suppress microbiological processes, while excessive rates of pesticides can also have a damaging effect on soil biology (USDA, 1980). However, the USDA (1980) also cited experimental evidence showing that microbial and earthworm populations can be up to five times greater in no-till soils (a system whkh relies heavily on herbicide applications) than in soil tilled with the moldboard plow.

45
5.3 CHANGES IN FARM PRACTICES
The following section summarises the main technical changes undergone on the thirteen
Canterbury organic farms.2 The emphasis in this discussion is on the key differences
between organic and conventional mixed crop and livestock systems. The practices
described are not necessarily the most productive or profitable OF methods, but are a
description of how the PRAC interpreted the Bio Gro standard. One notable feature of
the PRAC population was the high degree of variability between farms including
differing levels of input use, and practices employed by BD farmers.
Conventional mixed crop and livestock systems in New Zealand generally use few
chemical inputs compared with specialised, capital-intensive production systems
(G.A.G. Frengley, pers.comm.), and adoption of organic farming was largely a shift in
emphasis rather than a complete change. Furthermore, when one refers to 'organic'
farming practices, they are rarely unique to OF, and are employed on many CF
systems. Many OF practices involved a direct substitution of permitted Bio Gro inputs
(such as herbal drenches and rock phosphate) for synthetic pesticides and fertilisers.
Other changes included a shift from preventative use of chemicals such as annual sheep
dips to curative use in situations where non-chemical methods were inadequate.
5.3.1 Changes in Farm Enterprises
Another principle of the innovation-diffusion model is that complex innovations are
adopted more slowly than simple technologies (Rogers. 1983). Increased diversification
(and hence complexity) was one of the principle changes undergone by the PRAC.
Improved pest and fertility control was one motivation for diversification. For
example, control of nematode parasites in sheep is considerably easier in a diversified
production system than a specialised, intensive farm. Diversified farm systems are able
to reduce parasite infestation of sheep and pasture by taking paddocks out of the sheep
grazing rotation (Familton et al.. 1986; Morley and Donald. 1980). A mixed
production system was also favoured by PRAC because of the availability of premium
prices for cereal crops and the need for a pasture phase in the crop rotation for fertility
maintenance. Practicing organic farmers also changed to un0l1hodox health food crops
which had a high price on organic product markets, such as amaranthus.
Another aspect of diversification was the on-farm and/or cooperative processing of
grain products. Three PRAC owned small stone mills, while six PRAC cooperatively
owned a central processing plant. The processing and direct marketing of value-added
2 Source: PRAC survey. Appendix B, Section E; Appendix C, Section D.

L
46
products was employed, rather than exporting unrefined, bulk products such as straw and hay from the farm system. This policy had several effects, including a closer relationship with consumers, greater control over food quality, return of the premium price to the producers, and conservation of nutrients on the property. On the cost side, labour and processing costs per unit of product increased compared with bulk conventional processing. This was contributed to the high price for organic produce.
5.3.2 Pasture diversification
The New Zealand pastoral industry is based on ryegrass and white clover species, which remained the principle pasture combination on 62 % of the Canterbury organic farms. However, alternative species were also sown, sometimes in mixtures of up to ten different grass, legume and broadleafed plants, on part of most properties. The preferred species included lucerne, red and white clover, timothy, chicory, narrow-leafed plantain, dogstail, sheeps burnett, cocksfoot, prairie grass and tall fescue. An example of a diversified pasture is included in Appendix E.4.3. Several benefits of herb species in pasture mixtures have been reported by organic farmers overseas. These include the ability to access minerals from the lower soil profile and incorporate them into the surface layer, the capacity to improve soil structure by creating root channels, improved drought-tolerance, and animal health benefits (Woodward and Foster, 1988). Grass species such as tall fescue and cocksfoot tolerate grass grub better than ryegrass, and also perform well in drought and low-fertility conditions (Pottinger et aI., 1987).
However, Woodward and Foster (1988) concluded from a literature review, field trials and a survey of organic farms in Britain and Wales that due to the poor establishment and survival of herbs in rotationally grazed pasture, their purported soil improving qualities are unrealistic. The authors did, however. find empirical evidence that herbs have high palatability and mineral content. and considered that strong aneccl(.tal evidence exists of animal health benefits. Woodward and Foster (1988) contended that. in modem rotational systems, the high cost of sowing these herbs as part of a ley mixture is wasteful, and instead recommended that farmers sow herbal strips adjacent to or cutting across the pasture, to improve herb survival. Cost (up to three times the cost of ryegrass/white clover mixtures). slow establishment, additional management requirements and poor availability of seed were further disadvantages of the mixed herb pasture. These factors led some PRAC to sow limited alternative pasture mixes, rather than a full mixed herb pasture.

l
47
5.3.3 Control of pasture pests
Conventional control of pasture weeds relies on developing a vigorous unifonn sward of
clovers and grasses. Herbicides may be used for pasture establishment, however hard
grazing with sheep is often preferable to herbicide application on established swards
because herbicides are costly, have little effect against mature weeds, and may reduce
pasture production through causing damage to clovers (Clark and Burtt, 1986).
Mowing or topping of deep-rooting weeds such as thistles make pastures less unsightly
and help stock gain access to them. However, according to Clark and Burtt (1986) this
rarely helps weed eradication. Hand grubbing of noxious weeds such as nodding
thistles is also common on all Canterbury fanns.
Most of the PRAC held to the organic philosophy that weeds should be managed as a
resource (for example as stock feed) rather than as a pest to be eradicated.
Considerable importance was placed on problem prevention in this and other aspects of
pest control, for example careful seed bed preparation and the timing of events to
ensure rapid pasture establishment. When control was considered necessary, hand
grubbing, grazing, mowing and/or cultivation were employed, all of which tended to
increase labour costs. Based on fanners' own assessments,3 Biological Producers
Council (BPC) inspectors' reports, and the personal assessment of the author, the
degree of weed infestation in pastures appeared to be no worse than neighbouring
properties, or when compared with past weed control. Barley grass (Hordeum spp.),
wild oats (Avena spp.) and thistles were important exceptions, which frequently
required mowing and/or hand grubbing. The slow establishment of a mixed herb
pasture on one farm led to heavy infestation with fathen (Chenopodium albium) and
Scotch thistles (Cirsium vulgare), which were simply left to be outcompeted by
productive species. Until this eventuated, however, production was lost and the weeds
were allowed to seed.
Grass grub (Costelytra zealandica) and porina (Wiseana spp.) are significant pasture
insect pests in Canterbury, and their control relies upon the application of pesticides
such as lindane, mob stocking, the sowing of resistant grass species. cultivation
(Pottinger et a1., 1987), heavy rolling, or soil innoculation with parasitic bacteria
(Jackson et a1., 1988). On the Canterbury organic farms, control relied on heavy
rolling, the sowing of resistant grasses, and on one farm the soil was innoculated with
parasitic bacteria. Based on the subjective assessments of the PRAC, these pests had
not worsened since converting to OF. However, they appeared to have depressed
pasture production on several fanns.
3 PRAC survey. Appendix B, Section E.
L
48
5.3.4 Livestock management
One aspect of organic livestock production which has important financial implications is
the effect of reinoving chemical inputs on stocking rate (SR). Under OF, three major
effects on SR are changes in pasture production, Bio Gro restrictions on brought-in
feed supplies (which limits SR during drought and winter periods), and animal health.
Control of nematode parasites, which are the most. economica1Jy significant internal
parasite of sheep in New Zealand (Ross, 1982), is affected by SR in several ways
(Morley and Donald, 1980). Given equal starting conditions, an increase in SR will,
generally, increase the contamination of the pasture, decrease the quantity and quality
of pasture present, and make infective stages more available to sheep. High SR also
renders conditions less favourable for parasite survival and development, and decrease
the consumption of pasture per animal. Overall, therefore, high SR is likely to lead to
increased worm burden in sheep, and a greater need for anthelmintic treatment.
Consequently, this may necessitate lower SR under OF.
Several factors were likely to affect pasture production under OF. First, pasture species
such as cocksfoot were chosen which generally had a lower maximum production level
than ryegrass, but which were well-suited to low-fertility growing conditions (Pottinger
et al., 1987). Second, the quantity of fertilisers applied on the Canterbury organic
farms was lower than conventional levels, and the type of fertiliser source changed to
slow-release nutrient sources, such as rock phosphate. Third, a residual effect from
past fertiliser applications was likely to have an important effect on phosphorous (P)
levels once superphosphate applications were stopped (During, 1984). Fourth, soil
type and inherent soil nutrient status were important. A recent study of dairy
production in Taranaki (Roberts and Thomson, 1988) suggested that on at least some
soil types, pasture production and soil fertility may not drastically decline once
conventional fertiliser applications are removed. The improved productivity response of
pasture production to fertiliser applications on New Zealand soils generally. however. j's
well-documented (During, 1984). Of the PRAC. only three farmers reported a
noticeable decline in pasture production after adopting OF. all of whom had regularly
applied superphosphate before conversion. The remaining fanners had generally
applied little superphosphate in the past several seasons. and perceived no change or a
slight improvement in pasture production.
In the United Kingdom survey (Vine and Bateman, 1981), organic farms had, on
average, a 20% lower SR compared with a conventional standard. In the PRAC group,
the desire for low stress, low labour, more 'natural' management (for example set
stOCking and reduced stock density) affected stocking policies of several farmers.
49
However the demands of commercial management were often of overriding importance.
Rotational grazing predominated, and only one farmer set stocked outside the lambing
season. A paired sample t-test compared the SR on organic farms with an estimate of
the average conventional SR on the basis of farm location, soil type and irrigation
supply (Hunter et al., 1983). The t-statistic was not significant at the 95 % level (the
mean difference was only -0.03 S. U .ha-J). Stocking rate generally remained unchanged
after conversion, and actually increased on two farms which carried stock through
winter due to low lamb prices. However, the four low, fertility dryland farms had
between 20 and 30% lower stock density than conventional levels (Chapter 3, Table
3.3).
Whereas lambs are conventionally vaccinated at weaning and as adults for several
diseases, the Bio Oro system does not allow routine use of these or any other chemical
treatments. Some animal diseases can only be preventatively treated, for example facial
eczema (Pithomyces chartarum), and once symptoms become visible production losses
and/or death are inevitable. This Bio Oro restriction increased the level of management
required to avoid disease problems, and made farms more vulnerable to disease
outbreaks. However, farmers reported no major change in animal health with two
important exceptions: internal and external parasites. In both of these cases, the shift
to OF was a change to curative use, rather than removal, of chemical inputs.
Control of internal parasites in lambs was the greatest practical problem on most of the
farms. Under conventional management, the recommended control strategy (Ross,
1982) is to preventatively drench lambs every 21-28 days, drench ewes occasionally
pre-lamb, and to also control larval contamination of pastures by grazing management.
Except at low stocking rates with abundant feed, non-chemical strategies were generally
inadequate on the Canterbury organic farms. Table 5.3 shows that since converting,
almost all of the PRAC still relied on at least occasional drenching of the diseased
lambs, which greatly limited their ability to produce Bio Oro lambs. Dirty stock were
treated and either returned to the flock. sometimes after running on a separate
'quarantine' paddock, or were sold as conventional stock. Because herbal drenches had
mixed results, eliminating the need for any type of anthelmintic was of increased
importance. Control strategies included selecting for resilient lines. restricting the
quantity of brought-in stock, including cattle and cropping in the farm system. running
lambs on crop stubbles, low density stocking, and attention to diet. A variety of home
made drenches were also administered, with little evidence of anthelmintic effects. A
commercial test of various solutions including herbal and homeopathic drenches used in
Canterbury did not have any statistically significant effect on faecal egg concentrations
(J. Manhire, pers. comm.). The one farmer who had not needed to drench since

50
adopting OF two years previously had closed a large part of the fann to the flock during winter. This had been possible hecallse of low stocking rates. feeding sheep on neighbouring land, and the provision of large quantities of hay. However. because the neighbouring fann was not. Bio Gro, these sheep lost their 'organic' status for 12 months.
Table 5.3 Anthelmintic drenching of sheep on Canterbury organic farms
Anthelmintic drenching program Number of farms (n= 13)
Pre-Iamb ewes + routine lambs 3 Routine administration to lambs 2 Curative treatment of lambs 7 No chemical drenches since conversion 1
Source: PRAC survey. Appendix C, question D.6.
An annual dip for lice is a legal requirement for conventional fanners, however dispensation can be sought from the Ministry of Agriculture and Fisheries (MAF). Dipping to remedy other external parasites (flies, keds and mites) is also an integral part of parasite control on many conventional properties. Most of the Canterbury organic farms required at least an occasional sheep dip for lice or fly strike (Table 5.4). To reduce the need for dipping, sheep were run in smaller mobs, less stock were bought in, greater attention was paid to diet, fann boundaries were double fenced, and sheep were crutched and shorn to reduce flystrike. One farmer had considered pre-lamb shearing as a lice control, however the sheep had insufficient wool for this to be worthwhile. Derris dust was mentioned by two PRAC as an organic control agent, and one also used elemental sulphur. The BPC is presently negotiating with a commercial company for an acceptable conventional dip with a short withholding period, which should significantly reduce this problem.
Table 5.4 Chemical dipping of sheep on Canterbury organic farms
Dipping program
Routine annual administration Occasional, curative treatment None since conversion
Number of farms (n= 13)
3 6 4
Source: PRAC survey. Appendix C, question D. 7.
51
Increased emphasis on diet for animal health was another feature of organic livestock
production in Canterbury. In New Zealand, Il!,ineral deficiencies are widespread
because of soil type, location and the export of minerals in produce sold off the farm
(During, 1984). These nutrients, which are essential for plant or animal growth and
immunity to disease, are usually provided to livestock in the form of mineral drenches,
licks and feed additives. The PRAC drenched ewes and lambs up to 10 times a year
with commercial and homemade tonics,: seaweed or fish extracts, and herbal
anthelmintics. Selenium and mineral drenches and licks were also used on several
farms, however the BPC prefers farmers to apply minerals to the soil rather than
directly to animals to maintain the soil-plant-animal link. The mixed herb pasture,
crop stubbles, weeds, and winter feed crops provided additional varied feed sources.
5.3.5 Crop Rotations
The roles of the crop rotation in maintaining soil fertility (including nutrient levels, soil
organic matter, and soil structure) and the controlling pests is of considerable
importance under OF (Elm Farm Research Centre (EFRC), 1986). The EFRC (1986)
outlined several guiding principles in the design of organic crop rotations, given
resource and environmental constraints and market prices. In general, organic crop
rotations should alternate deep-rooting and shallow-rooting plants for soil structure,
high and low root biomass crops to enhance soil biology, nitrogen-fixing and nitrogen
demanding crops, slow-growing crops and weed-suppressing crops. Productivity is also
improved by providing adequate breaks between plants which host the same animal
pests and diseases, and using cover crops as much as possible to reduce soil erosion.
On Canterbury organic farms, the general change in crop rotations was towards greater
use of short term pasture and nitrogen-fixing plants to replenish soil fertility, and a
corresponding reduction in cash cropping. However, the chosen crop rotations (Table
5.5) were little different to many conventional mixed crop anel livestock farm" "'hich
also rely on grass and legume species for soil fertility anel pest control (G.A.G.
Frengley, pers. ,comm.). Most falms had between four and six years in pasture
followed by three years in crops, often including at least one feed and/or legume crop.
This alternated soH and nutrient- building and depleting crops and reduced pest levels.
Wheat, a nitrogen-demanding crop. was generally the first or second crop out of
pasture, and double-cropping was rare, to avoid nutrient depletion and disease
problems. Small seed crops were not a regular part of the organic rotation, in pat1
because of the Bio Gro restriction on herbicides which are often required for these
crops. Most farms were only in the second or third year of the rotation, so the stated

52
rotation was highly experimental. Only one PRAC kept strictly to an established rotation.
Table 5.5 Crop rotations on Canterbury organic farms.
Farm no:1 Description of rotation plan
(1) autumn wheat ~ 1 year oats, barley or rye ~ 1 year oats, barley, rye or wheat ~ root crop ~ 6 years mixed pasture
(2) spring wheat / winter tick beans ~ spring oats / cover crop ~ spring rape / autumn rye ~ 4 years mixed pasture . On lighter land: lupins or barley ~ autumn oats ~ spring rape / autumn rye/lentils ~ 10 years pasture
(3) autumn rye, or oats green feed ~ wheat or oats in autumn or spring ~ 6-7 years pasture
(4) wheat / green feed ~ wheat or other cereal crop / greenfeed ~ wheat or other cereal crop ~ 5 years mixed pasture
(5) wheat / greenfeed ~ oats or barley ~ rye ~ 4 years pasture Or: rape / autumn wheat, undersown clover ~ spring barley / greenfeed ~ 4 years pasture
(6) wheat or barley / greenfeed ~ rye/oats ~ 4 years pasture
(7) wheat / tick beans, lupins ~ oats, peas or .Iupins ~ dry beans / green manure ~ amaranthus ~ 4 years pasture
(S) wheat ~ alternative crops (e.g. buckwheat, amaranthus, beans) ~ 5 years pasture Or: wheat ~ barley ~ 5 years pasture
(9) autumn wheat ~ peas ~ barley ~ 3-4 years pasture
(10) wheat / green feed ~ barley ~ peas ~ 4-6 years mixed pasture On Lighter land: wheat. undersown clover ~ barley / greenfeed oats ~ wheat ~ new pasture
(11) Pasture. with occasional feed crop
(12) No fixed rotation 25% in crop. some in straw crops for four years. but decreasing the acreage in cash crops.
(13) wheat ~ peas ~ wheat ~ new pasture
CONVENTIONAL ROTATIONS (G.A.G. Frengley. pers. comm.):
(A) Mixed cropping: peas ~ wheat ~ barley ~ ryegrass ~ white clover ~ 3 years grazing (B) Intensive: Grow whatever crops are most profitable provided soil fertility and plant
disease requirements are met.
1. Refer to Table 3.3 for a description of the different farms. Source: PRAC survey. Appendix C. question D.S.

53
5.3.6 Cultivation and weed control
Important management objectives under OF are the conservation and build up of soil
organic matter and enhancement of soil biological activity. One consequence of moldboard
plowing, which inverts the top soil layer, is the rapid oxidative loss of soil organic matter
(USDA, 1980). Most organic fanners instead use disc and chisel implements, and
minimise disturbance of the soil profile (Conacher and Conacher~ 1982; EFRC, 1986;
Turner, 1951; USDA, 1980; Vine and Bateman, 1981). In Canterbury, the majority of
PRAC also favoured shallow cultivation, and/or the use of chisel or disc implements (Table
5.6). The preferred tillage program was similar to the conventional minimum tillage
system, which minimises disturbance of the soil profile and controls weeds by repeated
shallow cultivation with spring-tyned harrows (G.A.G. Freng]ey, pers. comm.). Subsoiling
was also common. However, variability was again a feature of the group: one PRAC was
returning to deep moldboard plowing, and two PRAC used a rotary hoe.
The control of crop weeds was, second to animal health control, the major pest control
challenge for PRAC. The main problem crop weeds were Californian thistles (Cirsium
arvense), which have a rapidly spreading growth habit; docks (Rumex spp.), which have
resilient tap roots; couch (Agropyron repens), which spreads take-all disease of wheat; and
wild oats (Avena spp.), which has a highly resilient seed and is difficult to control by crop
rotation, hand grubbing, fallowing or cultivation.· On at least two farms visited, weeds
caused major production losses to isolated crop paddocks.
The greatest problem for weed control under OF was usually encountered in the first crop
out of pasture. To overcome this problem, PRAC commonly employed a one to three
month fallow prior to crop establishment, with one or more weed strikes followed by
surface cultivation. A summer fallow was used for perennial weeds on some properties,
and in exceptional cases paddocks remained out of production for over a year. Fallowing,
which removes soil cover. can increase soil erosion and nutrient leaching (Cameron and
Haynes, 1986), and decreases fann income by removing farm land from production. The
need for additional mechanical weed control under OF also increased labour and tractor
costs. A number of alternative non-chemical weed control strategies are practiced overseas.
particularly in Europe (Vine and Bateman, 1981). These include mechanical hoeing of
precision-drilled crops post-drill harrowing and rolling. brush-type implements. and flame
weeding.
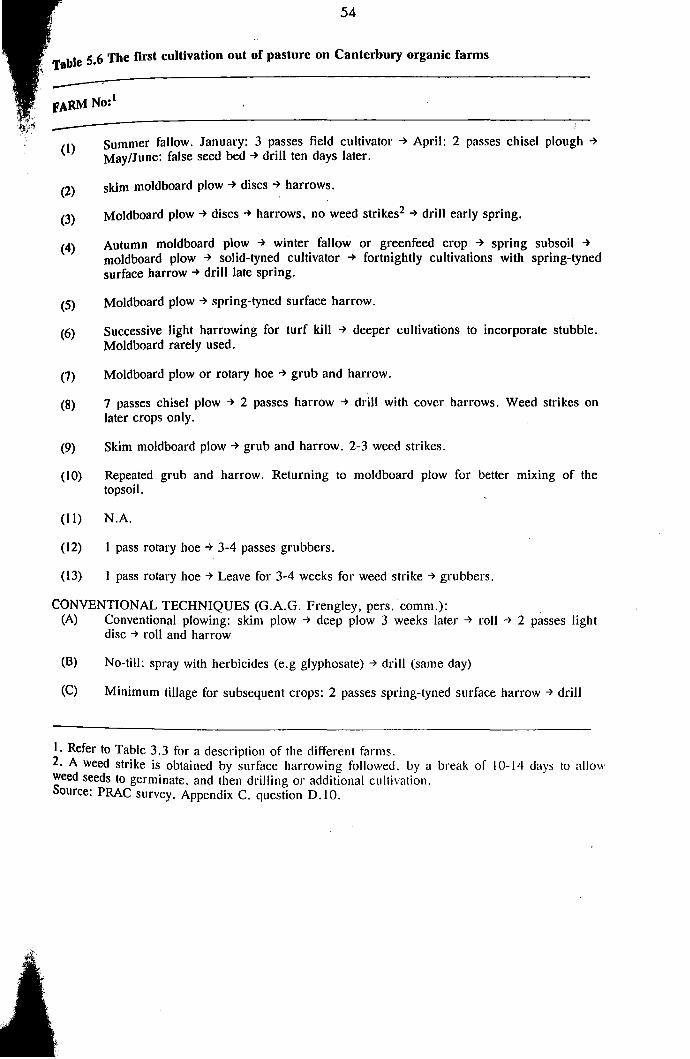
54
Table 5.6 The first cultivation out of pasture on Canterbury organic farms
-(1)
(2)
(3)
(4)
(5)
(6)
(7)
(8)
(9)
(10)
(II)
(12)
(13)
Summer fallow. January: 3 passes field cultivator ~ April: 2 passes chisel plough ~ May/June: false seed bed ~ drill ten days later.
skim moldboard plow ~ discs ~ harrows.
Moldboard plow ~ discs ~ harrows, no weed strikes2 ~ drill early spring.
Autumn moldboard plow ~ winter fallow or greenfeed crop ~ spring subsoil ~ moldboard plow ~ solid-tyned cultivator ~ fortnightly cultivations with spring-tyned surface harrow ~ drill late spring.
Moldboard plow ~ spring-tyned surface harrow.
Successive light harrowing for turf kill ~ deeper cultivations to incorporate stubble. Moldboard rarely used.
Moldboard plow or rotary hoe ~ grub and harrow.
7 passes chisel plow ~ 2 passes harrow ~ drill with cover harrows. Weed strikes on later crops only.
Skim moldboard plow ~ grub and harrow. 2-3 weed strikes.
Repeated grub and harrow. Returning to moldboard plow for better mixing of the topsoil.
N.A.
1 pass rotary hoe ~ 3-4 passes grubbers.
I pass rotary hoe ~ Leave for 3-4 weeks for weed strike ~ grubbers.
CONVENTIONAL TECHNIQUES (G.A.G. Frengley, pers.comm.): (A) Conventional plowing: skim plow ~ deep plow 3 weeks later ~ roll ~ 2 passes light
disc ~ roll and harrow
(B) No-till: spray with herbicides (e.g glyphosate) ~ drill (same day)
(C) Minimum tillage for subsequent crops: 2 passes spring-tyned surface harrow ~ drill
I. Refer to Table 3.3 for a description of the different farms. 2. A weed strike is obtained by surface harrowing followed. by a break of 10-14 days to allow weed seeds to germinate, and then drilling or additional cultivation. Source: PRAC survey. Appendix C. question D.IO.
55
5.3.7 Control of other crop pests
Cereal crop diseases and their control in Canterbury have been described by Clark and
Burtt (1986). On conventional farms, insecticides are usually confined to curative use on
cereal crops after a pest has become established, however fungicides are commonly used as
sprays, granules, or seed treatments. Plant diseases are spread' through the soil, air or
seed. Seed treatments control disease on or in the seed, as well as protecting the seedlings
against soil-borne pathogens. Conventional controls also combat disease by removing its
source, for example through crop rotations and hygiene, altering the soil, crop and storage
conditions in favour of the host plant, and using resistant varieties. The most significant
diseases are take-all disease in wheat and barley, stripe rust in wheat, and several other
fungal and viral diseases. These are controlled by chemical treatment, weed control, crop
rotation, and sowing time. Lacking specific remedies, the PRAC relied on crop rotations
and cultivar selection to control insect pests and disease. Rust in wheat, and in isolated
instances barley and oats, were perceived to be a cause of crop losses on several farms,
particularly for susceptible varieties such as Hilgendorf (refer to Chapter 6, Table 6.2).
One seed merchant was developing organic seed treatments based on 'natural' (i.e.
acceptable to Bio Gro) ingredients, and considered that organically-acceptable products will
be likely in the future (J. Manhire, pers. comm.).
5.3.8 Seed Source
Conventional farmers usually buy certified seed that has been treated with a fungicide,
which has a high rate of germination, is free from weed seeds and disease and provides
some protection for the vulnerable growing plant Clark and Burtt, 1986). Seed treatment
is restricted by the Bio Gro standard and, whenever possible, the PRAC used untreated
seed from their own farm, from seed merchants, or from other PRAC. For example, one
BD farmer sowed barley which was in its seventh generation on the farm. and returned
acceptable yields and quality. The perceived benefits of keeping seed lines included
reduced cost, supply of untreated seed, and genetic selection for local growing conditions.
Part of the cost advantage was negated by up to 20 percent heavier sowing rates used on
some farms, and added labour costs of preparing clean seed lines.

56
5.3.9 Crop Residues
Whereas most conventional cropping farmers bum their straw after cereal crops are harvested, all of the PRAC incorporated crop stubbles into the soil. Crop residues were baled and used for feed and compost material, or were mechanically chopped and/or grazed by sheep to accelerate decomposition. Several PRAC claimed that the soil structure, worm population and straw decomposition rate had improved after several years of incorporating straw and using other organic practices. Only two PRAC sold hay or straw, most preferring to maintain as closed a system as possible, with only more concentrated produce leaving the farm. Stubble incorporation and bumoff are compared in Table 5.7. Other consequences of incorporating straw that were mentioned by PRAC were a delay in the sowing of subsequent crops caused by the time required to decompose the straw, increased labour and fuel costs, and the contribution of safe pasture (i.e. pasture which has a low level of infestation with nematode parasites).
Table 5.7 A comparison between incorporation and burnoff of crop residues
Factor
Soil structure Soil organic matter Soil biology Likelihood of pest transference Possibility of phytotoxicity Rate of mineralisation of nutrients
Effect on nitrogen availability
Ease of working soil
Need for special equipment Labour, fuel costs
Source: Charman (1986).
5.3.10 Fertility Maintenance
Incorporation
improved increased improved moderate present slow, especially initially
can immobilise N, especially initially
stubble can hinder cultivation
moderate high
Burnoff
not improved not increased depressed low absent high
N rapidly available
less trash present in soil
low low
Conventionally, pastures in Canterbury usually receive an annual topdressing of 125-
250 kg ha- 1 of superphosphate and lime at one tonne per hectare every seven years. depending on soil type and land use. under a conventional system. Pastures may be drilled with superphosphate and/or. nitrogenous fertiliser for rapid establishment. In addition, cash crops commonly receive 125 kg ha- l of urea and superphosphate (J.K. Lay, peTS. comm.).

57
In contrast, the PRAC relied heavi1y on the crop rotation and conservation of nutrients (for example straw incorporation) for soil fertility maintenance. Canterhury organic producers also applied a wide variety of types and quantities of fertilisers. All of the PRAC valued seaweed-based or fish-based fertilisers, despite a lack of support by MAF for the 'Maxi Crop' soil additive, and these were the main fertilisers applied on half of the Canterbury organic farms. Other fertilisers included chicken and pig manure, blood and bone, dolomite, lime, potash, reactive phosphate rock, elemental sulphur, and mineral fertilisers. Compost was generally considered uneconomic to prepare, however it was deemed to be more important in the BD system for long-term soil fertility and as a medium for homeopathic preparations by BD farmers. On one BD farm, compost was prepared by placing cattle in a holding pen for three days, and mixing the accumulated manure with straw and homeopathic preparations in a long pile. The Bio Gro standard permits sources of the complete range of essential nutrients. A previous comparison of the soil fertility on organic and conventional farms in New Zealand (Haystead, 1987) found that organic farms were able to maintain nutrient levels which were comparable with conventional farms, and results from a study in the Palouse region of Washington in the United States (Reganold et al., 1987) suggest that OF may effectively conserve soil organic matter in some situations. However, two features of organic farming fertility maintenance caused significant disadvantages compared with conventional inputs. First, some Bio Gro inputs were less readily available and more expensive than their CF equivalents, and second, little information was available to producers on the preparation, use, nutrient status, and economic benefits of these 'organic' fertilisers.
5.3.11 Storage
Conventionally stored grain is usually fumigated with pesticides to reduce losses to insects and fungi (Clark and Burtt, 1986). However. the Bio Gro Standard does not permit chemical treatment during storage. In most cases. PRAC simply remo'oec1 pesticides for grain storage. On one organic falm. carbon dioxide was used in sealed silos, and diatomaceous earth was used on another property. The removal of storage pesticides increased the risk of grain losses. however pest losses were not reported by any of the producers.

58
5.4 BIO-DYNAMIC AGRICULTURE
Although bio-dynamics (BD) is considered a special case of organic farming in the
thesis, important distinctions exist between the two management systems. In addition
to removing chemical inputs, BD includes the application of herbs and preparations,
often in extremely dilute doses, the belief in cosmic influences on farm production, and
the timing of farming events relative to the positions of the moon, planets, and stars.
This section describes technical aspects of BD in terms of practices employed and
motivations behind each farm practice. The following account, which is based on a BD
crop and livestock field-day held in March 1988, interviews with BD farmers, and BD
texts (Podolinsky, 1985; Steiner, 1958) is not intended to imply that BD practices have
. been proved (or disproved) to be effective. Before describing BD farm practices, this
issue needs to be addressed ..
Bio-dynamic farmers claim that their methods have been proven to work, and that their / /
system is 'absolute, actual science'. 4 A considerable amount of research has been
undertaken by BD workers, and a visiting expert, Professor H. Koepf, recently visited
New Zealand with a large amount of data supporting the efficacy of the BD system.
Unfortunately, much of this research has not been independently replicated and/or is
not published in English. One barrier to scientifically analysing BD is that although the
effects of the system can be measured, the 'philosophy and explanation of BD controls
are based on concepts and influences which are not accepted as being within the realm
of science. The extent to which the BD system relies on a sympathetic farmer was
disputed by BD proponents. If the system is subjective, in that the feelings, attitudes
and ideas of the farmer can determine the efficacy of BD measures, this is a further
problem for scientific assessment. In this research project, little independent evidence
was found to support the efficacy of BD practices. The level of pest control and
performance on the Canterbury BD farms was not noticeably different to the organic
properties. In addition, field trials of homeopathic worm drenches did not have any
statistical effect on faecal egg counts of lambs (1. Manhire. pers. comm.). Howeyer.
considerable anecdotal evidence was presented by BD followers supporting their claims.
Bio-dynamic producers were unable to report independent comparisons of BD and
organic farms.
Several beliefs underly BD, stemming from the teachings of Rudolf Steiner. These
include the beliefs that through the use of very small concentrations of substances, large
effects can result (similar to homeopathy); living things are affected by terresttial and
cosmic forces, many of which have very subtle effects; and through certain actions and
4 A. Podolinsky. Bio-dynamic agriculture: introductory lectures. Sydney: Gavemer Foundation, 1985. p.60.

59
timing of events, humans can influence these forces. These beliefs are reflected in
several distinctive fann practices.
The planting calendar, like all other aspects of BD, is under constant experimentation
and revision. The main influences are held to be the moon, solar system, sun, and the
zodiac. For example, the full moon was considered to be a time of increased moisture,
and was therefore thought to be a favourable time for planting crops. The nature of
farming is such that prevailing weather conditions and other practical considerations
often take precedence over the calendar, however the cosmic forces are viewed as
important influences to which the farmer should be sensitive. The moon clearly
influences physical and biological rhythms such as tidal changes. However the subtle
cosmic influences suggested by BD are highly questionable, and are largely a matter of
faith rather than scientifically accepted proof.
Eight main homeopathic preparations are reported by BD followers to affect soil
fertility and plant growth, health and development. The most important preparatiotSj , are preparation 500, made from cow manure prepared in a cow's hom, and spread a
an extremely dilute rate of 30g of preparation stirred into 381 of water over 1 hectare of
land, and preparation 501, which is made from specially prepared silica. Preparation
500 is believed to act below the earth surface, aiding root growth, microbial activity
and humus formation, while 501 is thought to increase the light-absorption,
development and resistance of plants to fungi and disease (Podolinsky, 1985). Other
preparations, based on different herbs, are believed to regulate mineral uptake,
nutritional quality, and plant disease. The preparations are either applied to compost
and then spread onto fann land, or are sprayed directly in very dilute concentrations.
The dilution involved means that the actual mineral content of the solution is
insignificant in terms of total soil nutrient levels, and like other uniquely bio-dynamic
practices, use of BD preparations runs contrary to orthodox and scientific thought on
soil husbandry. An important practical consideration of BD is the need for specialised
. equipment to stir the preparations in a specified manner. and also to spray the solutions
onto the field.
In addition to the preparations, the two main pest and fertility controls used in BD are
'peppering' and applying herbal liquid fertilisers. Peppering. according to BD
adherents, can be used for any pests including parasites. weeds and mammals. Pal1 or
all of the pest is collected, and then pulverised and burnt. A drop of this substance is
then diluted to one hundredth of its original strength several times, until it becomes so
dilute that no chemical trace of the substance remains. This process is termed
'potentising', because only the 'life force' of the substance is considered to remain in

60
the solution. The potentised solution is then sprayed onto the affected area or animals, and is said to sterilise the pest. Orthodox scientific explanations, such as the release of pest-deterring chemicals during the process, are not convincing due to the dilution involved. Another BD remedy to weed infestation is to collect a problem weed, make a liquid fertiliser out of the plants, and then spray the fertiliser back onto the affected area without potentising the solution. The justification given by BD producers was that when a soil imbalance occurs, such as a copper deficiency, weed species become established which have the ability to concentrate the deficient nutrient in their tissues by tapping mineral sources deep in the soil profile. Therefore, the reasoning follows, spraying the weeds back onto the paddock accelerates the process of correcting the imbalance. Again, this rationale is not supported by clear scientific evidence.
Given these reservations about BD, a limited comparison between BD and OF is shown in Table 5.10, based on the perceptions and experiences of practicing and prospective organic farmers. The greatest barriers to BD, as opposed to OF, are the lack of scientifically-proven information and the difficulty of undertaking scientific research, the higher demand for labour and management, increased complexity, and its social and cultural incompatibility with farmer values (which is discussed in Chapter 7). On the positive side, BD produce can fetch a higher price from anthroposophical consumers, and BD farmers are supported by the research and advisory service of the Bio-Dynamic Association. Bio-dynamics also has additional philosophical dimensions and perceived pest and fertility controls which are also viewed as benefits by some producers.
Table 5.8 A comparison of bio-dynamic and organic farm systems
Compared with organic farming, BD has the following characteristics:
Negative
higher initial investment cost: - spray and stirring equipment - complexity. new skills - no transitional label
higher management requirement more difficult to research more restrictive standard labour costs of using preparations more socially, philosophically and culturally removed from conventional farming
Positive
possible yield and pest control advantages
opportunity for additional personal challenge and fulfillment
long-established and efficient organisation. including a research and advisory service
higher price premium highly loyal consumers social and global network
Source: PRAC and PROS surveys. Appendix C, question E.2; Appendix D, question C.2.

61
5.5 SUMMARY
In this chapter, technical aspects of establishing and managing an organic farm were
discussed. Several technical barriers were identified. These included low trialability (the
ability to experiment with an innovation on a limited basis), increased complexity, certain
requirements to enable conversion to organic farming (OF), and control of animal health
and crop weeds.
Complexity and low trial ability , according to the adoption-diffusion model, are features of
an innovation which act as obstacles to adoption (Rogers, 1983). In addition, Wearing
(1988) considered that the simplicity, convenience and flexibility of pesticides compared
with biological pest controls was an important reason for most farmers' preference for
chemicals. The experiences of practicing Canterbury organic farmers (PRAC) suggest that
OF has low trialability. Factors which reduced trialability on Canterbury organic farms
included the long-term nature of suggested OF benefits such as soil improvements, the low
initial yields of organic crops, and Bio Gro obstacles to dual OF and conventional farming
(CF) management on one property. Organic farming appeared to be more limited to
diversified production systems with lower land productivity than CF. For example, non
chemical control of pests such as nematode parasites of sheep is most difficult in intensive,
specialised production systems (Familton et aI., 1986). This increased the management
complexity of the technology and may limit the feasibility of organic farming where land
values are high.
Two principal conditions were required to convert a farm to OF. When these requirements
were not met, they were obstacles to change. First, farmers required a high degree of
financial and management independence. Adoption of organic farming typically involved
capital investments, unorthodox management changes and an initial drop in income.
Therefore, owner-operated farms which were free of binding conventional contracts and
which had access to credit had fewer constraints to adoption than debt-laden farms with
leasehold or partnership arrangements. Second. a high level of soil fertility and control of
pest problems was required before conversion. to ensure that productivity did not fall
drastically once chemical inputs were removed. In some cases. this necessitated application
of chemicals and/or the sowing of fields into pasture before an organic cash crop could be
sown.
The experiences of Practicing organic farmers in Canterbury (PRAC) discussed in section
5.3 suggest that pest control, rather than fertility maintenance and pasture production, is
the main technical problem for OF. Comparisons of organic and conventional farms
(Hay stead , 1987; Reganold et aI., 1987) show that OF may be able to maintain soil

62
fertility in the long term. Recent research in Taranaki (Roberts and Thomson, 1988)
suggests that removal of conventional fertiHser inputs does not lead to large productivity
declines on some soil types, and the Bio Gro Standard permits 'organic' sources of the fun
range of essential nutrients. However, 'organic' nutrient sources were in some cases more
expensive and less readily available than CF equivalents. In addition, little quantified
information was available to producers on the costs, benefits and use of different 'organic'
fertilisers. This problem is an important topic for research and extension.
In contrast, OF practices were inadequate to prevent some pest problems from occurring,
and once pest outbreaks occurred producers had few options other than to accept
production losses or to apply chemicals as a curative measure and lose organic status.
Control of internal and external parasites of sheep were the two major animal health
problems. Stocking rate (SR) is one determinant of nematode infestation (Morley and
Donald, 1980). On average, the SR on Canterbury organic farms was similar to a
conventional standard. However, the organic stock densities were highly variable and
several PRACintended to reduce SR in the future. At present stock densities, anthelmintic
drenching was required on all but one organic farm, and 69% of PRAC had dipped sheep
for lice or flystrike at least once since conversion. Development of animal health remedies
is clearly a top research priority for OF.
The control of crop weeds was the other major pest control challenge for PRAC. On at
least two farms visited, weeds caused major production losses on isolated crop paddocks,
and control was most difficult for the first crop out of pasture. The main problem. crop
weeds were Californian thistles (Cirsium arvense), which have a rapidly spreading growth
habit; docks (Rumex spp.), which have resilient tap roots; couch (Agropyron repens).
which spreads take-all disease of wheat; and wild oats (Avena spp.), which has a highly
resilient seed and is difficult to control by crop rotation, hand grubbing, fallowing or
cultivation. All of these practices involved costs in terms of labour, tractor work, and/or
lost production. Additional cultivations and fallowing increased the risks of damage to soil
structure (Gibbs, 1986). soil erosion (Beasley et at.. 1984). and nutrient leaching (Cameron
and Haynes, 1986). Considerable potential exists for developing mechanical weed control
strategies which are employed on overseas organic farms (Vine and Bateman. 1981). sllch
as flame weeding and inter-row cultivation of cereals.
Bio-dynamic farming (BD) is a special type of organic fanning system. Bio-dynamic
farmers employ additional fann practices which are reputed to improve soil fertility, pest
control and food quality. Bio-dynamic fann practices include an astrological fanning
calendar and the use of homeopathic (extremely dilute) solutions. On the basis of available
information, however, BD farms did not appear to perform differently from other

63
Canterbury organic farms. A limited comparison was made of BD and OF. Bio-dynamics
has advantages of a higher price premium from consumers who share anthroposophical
beliefs, research and advisory support from the BD Association, perceived pest and fertility
control advantages, and a complete personal and farming philosophy. On the other hand,
BD has higher labour costs, increased complexity and it was considered by some practicing
and prospective organic farmers to be incompatible with their personal values. In addition,
the underlying beliefs of BD such as the concept of life forces present obstacles to
scientifically analysing the production system.
This chapter has shown that once chemical inputs are removed from the farm system, a
large number of changes to farm management result. These included diversification,
sowing of alternative pasture species, development of a ewe breeding flock, greater
emphasis on animal diet, and changes to crop rotations, residue management, cultivation,
and seed sources. Clearly, these changes will have a major effect on farm profitability and
the public costs and benefits of farm practices. The economic consequences of adopting
OF are discussed in the next chapter.

64
CHAPTER 6. THE ECONOMICS OF ORGANIC FARMING
6.1 Introduction
6.2 Comparative research
6.3 Performance of Canterbury organic farms
6.4 Risk
6.5 Public costs and benefits
6.6 Summary
6.1 INTRODUCTION
The primary economic considerations for a farmer investing in a new technology are its
effect on the level and stability of farm income, and initial investment costs (Pigram,
1977). Consequently, farmers are unlikely to adopt an innovation which is perceived to
have high capital investment costs, low profitabiJity and/or a high level of risk. In.
contrast, features of a technology which increase profitability and/or decreases costs
provide a strong incentive to change. However, the simple question 'Does it pay?' is
an inadequate test of organic farming (OF) because public costs and benefits are also an
important aspect of comparing conventional farming (CF) and OF (Breimyer, 1984).
While public goods are often external to farm decision-making, personal farmer values
and changes in institutional arrangements (such as a charge on pesticide pollution)
make these features relevant to adoption. In addition, an analysis of public costs and
benefits is important to assess the justification for public funding of organic farming.
A complete economic analysis of organic farming versus CF systems is beyond the
scope of the thesis. Instead, this chapter seeks only to identify the key economic
differences between them. The economic literature on OF is reviewed in section 6.2
and new data from the survey of Canterbury producers are presented in section 6.3.
Data include farmers' assessments of changes in pelformance. comparisons between nF
and equivalent CF crop yields. and gross margin calculations for representative organic
and conventional fanning enterprises and crop rotations. Section 6.4 briefly discusses
the relevance of risk to the adoption of organic farming. Public costs and benefits are
assessed in section 6.5, and the chapter is summmised in section 6.6.

65
6.2 COMPARATIVE RESEARCH
In general, comparative studies of organic farming and CF have shown that OF is
neither clearly superior nor inferior in private economic terms. A number of
researchers, mainly in the Northern Hemisphere, have compared OF with some form of
conventional standard. These include Berardi (1978), Conacher and Conacher (1982),
Domanico et al. (1986), Klepper et al. (1977), Lockeretz et al. (1978), Lockeretz et al.
(1981), Sahs et al. (1988), and Vine and Bateman (1981). The principal New Zealand
study (Haystead, 1987) compared six pairs .of neighbouring organic and conventional
fanns. Important reviews were undertaken by the U.S.D.A. (1980), Vine and Bateman
(1981), Buttel et al. (1986) and Cacek and Langner (1986). Before discussing their
findings in greater detail, some conceptual and methodological shortcomings common
to these studies should be noted.
Previous comparisons of organic farming and CF should be interpreted with caution.
The OF technology is undeveloped compared with CF, and many of its suggested
benefits are long-term and environmental. The methodology of past research has been
criticised (Cacek and Langner, 1986; Lampkin, 1985), particularly the use of small
sample sizes and unrealistic modelling assumptions. Comparisons between whole
systems are difficult because of the range of important variables, and most studies have
ignored livestock enterprises which are an integral part of the organic mixed farm.
Little information exists on the period of transition from CF to OF, because most
studies have concentrated on established organic systems. Northern hemisphere results
can not be directly transferred to the New Zealand situation, because New Zealand
conventional farms differ from Northern Hemisphere farms in ways which are likely to
affect the comparative performance of organic farming and CF. The differences
between CF and OF are less significant in New Zealand than in the Northern
Hemisphere. For example, New Zealand conventional fanning, compared with
Northern Hemisphere CF, uses fewer ferti.lisers, and relies instead upon biological
nitrogen fixation by legumes; is less capital-intensive and more land-intensi\'e: and it
has a pastorally-based livestock production system. rather than relying on grain-feeding
and feed additives. In addition, New Zealand agriculture is set in a different economic.
social, biological and physical environment. In New Zealand, animals are grazed
throughout the whole year. rather than being housed in the winter. which affects the
SUpply of manure for fertiliser.
The consensus among on-farm studies is that the net income of organic farming is
comparable with CF in at least some situations, because the characteristically lower
yields are offset by lower operating costs and in some situations higher commodity
66
prices. A review of American research by Cacek and Langner (1986) found that the
results of plot experiments were consistent with studies of commercial farms, and that
only comparisons based on computer modelling consistently favoured conventional
farming. This may have been due to assumptions of the models, including the impacts
on yield and soil fertility of shifting to OF.
Previous studies have found that organic farms substituted labour, often from unpaid
family and voluntary sources, for capital inputs. Capital costs under OF were further
reduced by removing chemical inputs, keeping seed lines, reducing fertiliser use and
utilising livestock and green manures, and agricultural and industrial wastes as nutrient
sources, and owning a smaller quantity of generally older machinery (Berardi, 1978;
Culik, 1983; Vine and Bateman, 1981). Lockeretz et al. (1978) reported that the
labour requirement per hectare was only slightly higher on organic cropping farms
using modem machinery, compared with paired conventional properties. This finding
was supported by Vine and Bateman's (1981) study. However, labour cost per tonne of
output for different enterprises was 5-20% higher due to yield reductions.
Reported crop yields on organic farms tend to be 10 % to 20 % lower than conventional.
However, data from an American study (Lockeretz et al.. 1981) suggested that organic
crop yields may exceed conventional farm performance in drought years, possibly due
to a lower response to nutrient availability on conventional farms when weather
conditions are unfavourable (Klepper et al., 1977), and evidence that organic farms are
able to conserve and possibly enhance soil organic matter, which increases water
infiltration and retension (Reganold et at., 1987). This advantage may be restricted to
soil types which are naturally low in organic matter and which are vulnerable to over
cropping. Organic com and wheat yields, both nitrogen-demanding crops, do not tend
to perform as well as other cereals (Lockeretz et aI., 1978; Vine and Bateman, 1981).
No information was located on differences in grain quality, however this is also affected
by nitrogen availability (Scott, 1981).
Very little economic analysis of organic livestock production has been undertaken.
despite the fact that animals are an essential part of most organic falms (USDA. 1980).
British organic farms in Vine and Bateman's (1981) survey had an average 20% lower
stocking rates and 30% lower livestock outputs per adjusted forage acre compared to
regional figures. Beef growth rates and milk yield per cow appeared to be lower.
Subjectively, the data suggested that only the more skilful farmers applying high rates
of nutrient inputs achieved above 65 % of standard output per hectare. Vine and
Bateman (1981) concluded that pastoral production under OF compared less favourably
with CF than a cropping comparison. This conclusion was supported by the low level

67
of performance reported by Australian organic livestock farmers (Conacher and
Conacher, 1982).
Haystead's (1987) comparison of six pairs of organic and conventional New Zealand
farms found that while organic dairy farms were consistently more profitable than their
conventional neighbours, mixed crop and livestock properties had lower incomes.
Average net income per hectare (gross farm income minus farm operating costs) was·
only half of the conventional farm income on the two Canterbury organic mixed farms.
However, the sample size was very small, the conventional pair of one of the organic
farms had important physical differences (J. Scott, pers. comm.), and both mixed crop
and livestock farms were low-input systems in addition to excluding chemicals. The
monitoring program was comprehensive, and no significant differences were detected in
terms of pasture quality (clover content), soil fertility and biology (acidity and soil and
plant nutrients, earthworm numbers and microbial biomass), and animal health (stock
death and disease occurrence).
The overall profitability of organic farms appears to vary widely, therefore, between
different enterprises, input levels, and farmers. In their study of 80 British organic
farms, Vine and Bateman (1981) compared net farm income per hectare, and
management investment income per hectare and as a percentage of tenant's capital with
a regional conventional standard. Overall, the relative performance of the organic
farms was poor, however the top farmers using high levels of nutrient inputs sometimes
achieved higher performance than conventional. Net outputs in relation to variable
capital costs per hectare, a measure of capital productivity, was. higher than the
conventional standard for the majority of farmers at low input levels, and lower at high
levels of input. However, the higher technical efficiency at Jow input levels which this
result suggests was usual1y insufficient to offset total production losses. Average gross
output and expenditure and net output per hectare were lower, particularly on low
input farms.
At a macroeconomic level, the consequences of widespread conversion to OF in the
U.S. were modelled by K. Olson et al. (1982). The study predicted that farm income
at a national level would rise, export levels and total production were likely to fall.
food prices would increase, and regional shifts in production would occur. However.
these researchers used very conservative production parameters (notably a yield
reduction of more than 50%) to model the OF system, which were inconsistent with the
measured performance on commercial organic farms and plot experiments. What the
research did illustrate, however, was that widespread economic impacts would be likely
to result from an expansion of organic farming.

68
6.3 PERFORMANCE ON CANTERBURY ORGANIC FARMS
In this section, the performance of Canterbury organic farms is analysed, using data
collected during interviews with the thirteen practicing organic farmers (PRAC).
Changes in performance were measured in three ways, because of the limitations of
each method. First, the PRAC were asked to describe the changes in performance on
their properties during conversion to OF. Where possible, these were corroborated by
the independent assessments of BPC inspectors, MAF scientists, discussions with other
PRAC, and visits to farms by the researcher. Second, farm advisors provided a
comparative estimate of expected conventional crop yields on each farm. These were
compared with the reported organic yields. Third, gross margins were calculated over
conventional and organic crop rotations, using data from the farmer interviews, Lincoln
College farm budget manuals (Clark and Burtt, 1986; Clark et al., 1988, and previous
issues), and Lincoln College Farm Management Department staff.
6.3.1 Survey results
Farmers were asked to compare the farm's performance over the 1987-88 season with
the results they achieved in similar years under conventional management. Reported
changes in performance during the transition period are summarised in Table 6.1.
Because the data were collected on a confidential basis, individual farm data is not
presented, however details and examples are discussed in the text. The main changes
were a decrease in production costs, particularly for fertiliser and agrochemicals, and a
corresponding and smaller decline in productivity especially for wheat, the main cereal
crop. Consequently, net income was slightly higher than the farmers would have
expected had they remained conventional.

69
Table 6.1 Changes in the perfonnance of Canterbury organic farms during the transition period compared with past production: Fanners' own assessments
Performance indicator Mean % Change(l) Standard Range (%) n(2) devn. Low High
livestock costs/so u. -23 23 0 -50 7 meat production/s.u. same wool production/s.u. slight increase lambing percentage +4 6 -5 to 7
crop production costs -43 9 -30 -50 6 wheat yields -29 24 0 -65 10 yields of other grains -12 14 0 -30 7
labour demand +4 7 -to 15 10 fuel costs +1 8 -15 to 8 fertiliser costs -65 39 -toO 0 6 agrochemical costs -91 18 -toO -50 7 machinery costs +1 4 0 to 8
total farm costs -14 13 -40 0 8 total farm sales (gross) -8 16 -25 to 8 total net income +6 13 -25 20 8
1. The mean was only calculated for quantitative variables where n >5 farmers. 2. n = Number out of the 13 PRAC who put a percentage figure on the change during the transition period. Source: PRAC survey. Appendix B. question E.
Livestock In general, farmers reported reduced livestock production costs while maintaining a similar level of output. Reductions in livestock production costs were greatest on farms which had previously used large quantities of animal remedies. However, additional drenching of adult and young stock with herbal solutions increased stock handling costs. Stocking rate, which was discussed in Chapter 5, was similar to conventional levels on most farms. Due to animal health problems and a limited organic meat market, few 'organic' lambs were sold .. Little change in meat production per stock unit was reported, although four PRAC noticed slower lamb growth rates in the ahsence of drenching. Feed stress was experienced on several farms. which was attributed more to the prevailing drought conditions than to OF. Practicing organic farmers also reported fewer lambing problems and better ewe health. On most properties, lambing percentages were the same or slightly higher than they had been under past management, and the reported figures were similar to conventional averages1
for each farm location and production type. Wool production decreased by 20-30% on one heavily stocked farm, but it improved by up to 25 % on other propeliies, according to the farmers. Contract shearers on two farms remarked at the improved wool quality.
1 Source: New Zealand Meat and Wool Boards' Economic Service New Zealand Sheep and Beef Farm Survey, 1986.
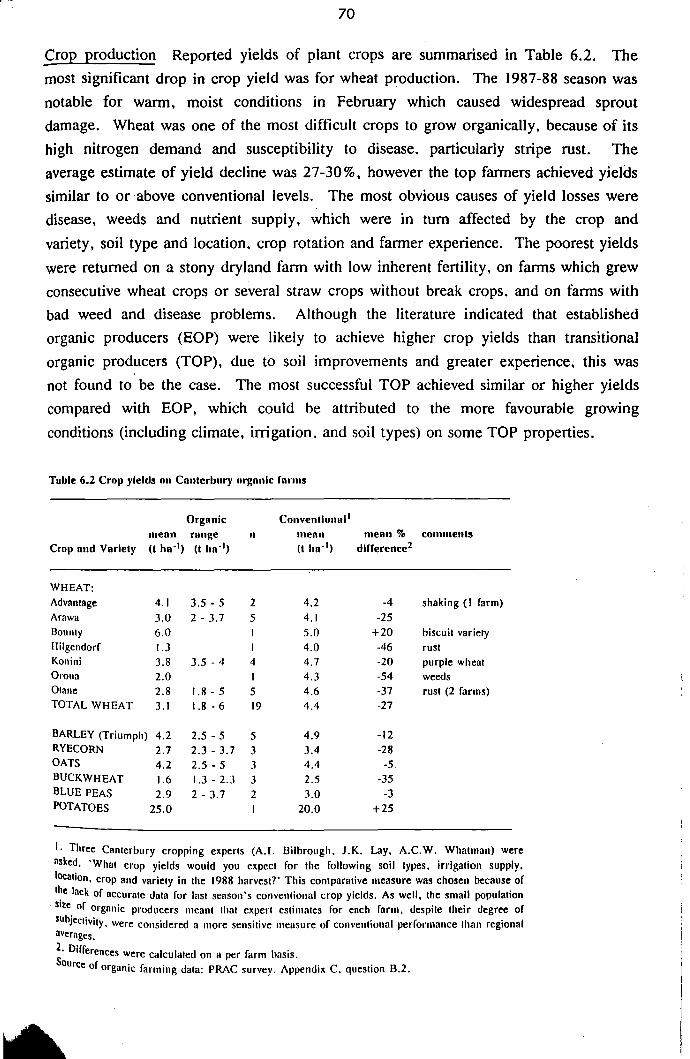
70
Crop production Reported yields of plant crops are summarised in Table 6.2. The most significant drop in crop yield was for wheat production. The 1987-88 season was notable for wann, moist conditions in February which caused widespread sprout damage. Wheat was one of the most difficult crops to grow organically, because of its high nitrogen demand and susceptibility to disease. particularly stripe rust. The average estimate of yield decline was 27-30%, however the top farmers achieved yields similar to or above conventional levels. The most obvious causes of yield losses were disease, weeds and nutrient supply. which were in tum affected by the crop and variety, soil type and location. crop rotation and fanner experience. The poorest yields were returned on a stony dryland fann with low inherent fertility, on fanns which grew consecutive wheat crops or several straw crops without break crops. and on farms with bad weed and disease problems. Although the literature indicated that established organic producers (EOP) were likely to achieve higher crop yields than transitional organic producers (TOP), due to soil improvements and greater experience, this was not found to be the case. The most successful TOP achieved similar or higher yields compared with EOP, which could be attributed to the more favourable growing conditions (including climate, irrigation, and soil types) on some TOP properties.
Tobie 6.2 Crop yields on Canterbury orgnnlc forms
Orgnnic Conventlonnl' menn range n menn menn % comments
Crop ond Vnrlety (t hn-') (t hn-') (t ho-') dlfference2
WHEAT: Advantage 4.1 3.5 - 5 2 4.2 -4 shaking (I farm) Arawa 3.0 2 - 3.7 5 4.1 -25 Bounty 6.0 5.0 +20 biscuit variety Hilgendorf 1.3 4.0 -46 rust Konini 3.8 3.5 - 4 4 4.7 -20 purple wheat Oroua 2.0 I 4.3 -54 weeds Otane 2.8 1.8 - 5 5 4.6 -37 rust (2 farms) TOTAL WHEAT 3.1 1.8 - 6 19 4.4 -27
BARLEY (Triumph) 4.2 2.5 - 5 5 4.9 -12 RYECORN 2.7 2.3 - 3.7 3 3.4 -28 OATS 4.2 2.5 - 5 J 4.4 -5. BUCKWHEAT 1.6 1.3 - 2.3 3 2.5 -35 BLUE PEAS 2.9 2 - 3.7 2 3.0 -3 POTATOES 25.0 20.0 +25
I. Three Canterbury cropping experrs (A.I. Bilbrough. 1.K. L1Y. A.C.W. Whatman) were asked. 'What crop yields would you expect for the following soil types. irrigation supply. location. crop and variety in the 1988 harvest?' This comparative measure was chosen because of Ihe lack of accurate data for last season's conventional crop yields. As well, the small population
. size of organic producers meant Ihat expert estimates for each farm, despite their degree of Suhjectivity. were considered a more sensilive measure of conventional performance Ihan regional averages.
2. Differences were calculaled on a per farm basis. Source of organic farming data: PRAC survey. Appendix C. question B.2.

71
The smaller drop in yield for other crops~ at an average 14%, was attributed to their better performance in low-fertility soils, and improved disease and weed resistance compared with wheat. Production of crops such as ryecom and triticale was limited more by markets than technical problems. However, amaranthus yielded less than 0.6 tonnes per hectare, and weeds claimed an entire amaranthus paddock on one farm. This illustrated the risk involved in undertaking new crop enterprises in addition to the change to a new production regime.
New capital investments The cost of establishing an OF operation is a significant barrier to many farmers who currently face severe credit restrictions. The level of investment required for conversion by the PRAC depended on how well existing farm capital matched the demands of organic farming. A large part of the initial investment was in 'human' capital, i.e. the gaining of new skills and access to markets, which included research and development on an individual farm basis. Diversification increased the cost of setting up an organic farm: for cropping farms, a major investment was development of a ewe breeding flock, while livestock farmers faced investment in crop production equipment. Tree planting was a further investment for some producers. However, although tree planting was encouraged by the Biological Producers Council (BPC) , it was not an essential investment. In general, OF required the same equipment as CF, but several exceptions were notable. Bio-dynamic farming (BD) required additional investment in stirring equipment (cost approximately $3,000) for BD preparations, and spraying equipment ($3,000) was required by both BD farmers and organic farmers intending to spray liquid fertilisers. Several farmers intended investing in specialised equipment for mechanical weed control, handling crop residues, and working in straw-covered soils. Investment in processing plant and machinery for the production of flour and rolled oats was undertaken by most producers on an individual or collective basis. This was a significant cost (approximately $10,000 for a small mill), however this investment would not be essential for future organic producers, because several outlets now process organic grain. In addition. contracting. cooperative ownership and home design and building of equipment reduced investment costs for some PRAC.
Profitability Table 6.3 summarises the malO factors affecting profitability on the \
Canterbury organic farms. According to PRAC estimates. total expenditure and revenue fell by an estimated 14% and 6% respectively. The fall in total expenditure Was greatest on farms which had previously operated high-input conventional farms, and which had removed almost all fertiliser inputs. Increased labour demand was one factor which raised the cost of organic farming. Additional labour was necessary for management planning, manual and mechanical weeding, additional marketing and
72
processing activities, the spraying of homeopathic preparations on BD farms, and in
some cases increased stock handling. The increased labour was estimated hy PRAC at
only 4 % higher on average (range -10 % to + 15 %) compared with their previous
conventional management. However, a comparison of organic farming and CF labour
demand based on wheat enterprise gross margins later in the chapter suggested a higher
labour demand.2 Labour demand for OF wheat production was 92 % higher per hectare
assuming 4 hours of hand weeding was necessary, and 26 % higher with no hand
weeding. This anomaly indicates a need for additional research on the resource
requirements of organic farming, including labour demand. Increased labour demand
was not usually reflected in higher cash expenses, because farmers worked longer
hours, used family labour, or employed voluntary workers. On one BD farm, for
example, unpaid labour sources contributed 15.5% of total labour requirements. The
two main sources of voluntary_ labour were German agricultural students employed on
BD farms and Willing Workers. On Organic Farms ('WWOOFers') who were mainly
young overseas tourists who contributed largely unskilled labour usually for up to six
week periods. All of the Canterbury organic farms were run by between 1.1 and 2.5
labour units. Labour demand was highest on farms with large cropping enterprises,
and on BD farms because of the need fo~ special sprays and preparations.
2 Including cultivation, drilling, fertiliser application, pest control, and harvesting activities.

?3
Table 6.3 Factors affecting the profitability of the organic system
(A) COSTS Factors increasing costs
Farm system costs of diversification additional management for problem prevention
Pasture higher cost of sowing mixed pasture
Livestock additional stock handling - herbal drenching and grazing management
less intensive production methods, sometimes including stocking rate
Crop additional cultivations, hand roguing and fallowing required for weed control
Fixed costs additional investment required - new skills, livestock, equipment
(B) REVENUE
Factors reducing revenue
lower yield lower cosmetic quality of some crops no premium available on some crops. notably wool
Factors decreasing costs
benefits of rotational husbandry agrochemicals removed reduction in fertiliser application timeliness of operations plant and animal breeding for immunity and performance under organic conditions
use of waste products from on-farm and off-farm sources as fertilisers
improved productivity of alternative pasture species at low nutrient levels
fewer reported animal health problems use of home-grown feed supplements cheaper animal remedies used
reported soil improvements - less abrasion of equipment - fewer cultivations required
use of kept seed lower harvest and freight costs due to lower yields
avoidance of debt general thrift, and making and repairing own machinery
employment of family and voluntary labour employment of contractors
Factors increasing revenue
price prem i lim added value by processing and/or retailing increasing efficiency of resource lise e.g. system design. deep-rooting plants. recycling. soil conservation
Source: Vine and Bateman (1981): PRAC survey.

74
The change in gross income varied considerably between farms, and depended on the
magnitude of the production losses. and the amount of produce sold at a premium.
Unless a premium price was available to offset the drop in yield, it appeared that a
low-input conversion strategy had short-term advantages over maintaining high fertiliser
costs during transition. Only three PRAC reported a drop in net farm income after
adopting OF. On four other farms, net income remained the same, while the
remainder experienced increases of between 10 and 25 %. This result was surPrising
given the drop in yields on some Canterbury organic farms, the initial drop in income
which has been reported by other studies (for example Elm Farm Research Centre,
1986), and the gross margin calculations later in this chapter. Although most of the
PRAC described the organic part of their farming operations as profitable, many were
in financial difficuHy. This they attributed to the general state of farming, with high
interest rates and low commodity prices, rather than the conversion to OF. Limited
cash flow made adoption of organic farming difficult, and one PRAC commented that
the change was not a good proposition if a farm was in financial difficulty. He added
that when an organic farm failed, people attributed it to the type of production rather
than broader economic factors.
All but two PRAC said that the profitability of their operations relied on an organic
premium. However, the majority of farmers obtained most of their income from
conventional markets, not organic. Farms varied considerably in the amount of
produce being sold as organic, from a high of 75 % for one EOP to zero for two TOP
(mean 23.5%, standard deviation 20.9). Consumer loyalty to established producers
was a barrier to new producers hoping to sell organic produce on the domestic market.
Marketing issues are discussed in greater depth in Chapter 8.
6.3.2 Gross Margins
A further measure of comparative pelfolmance is provided by the calculation of grll"<:
margins (GM). Gross margins are a simple means for comparing enterprises. but care
must be taken in their interpretation. Gross margins assume that each enterprise is
independent of all other farming activities. both technically and financially. They also
assume that each additional unit of production is worth as much as. and costs as much
as, each preceding unit. Only direct and variable costs are included in the GM. and
fixed costs such as rates and interest, and the investment costs discussed earlier are not
accounted for.

75
Results are highly dependent on the assumptions of the gross margins, and although
these can be varied using sensitivity analysis, it is difficult to model a representative
('average') organic or conventional operation given the variability between farms.
Because of the importance of interconnections between enterprises, and the contribution
that indirect management inputs make to productivity on organic farms, a comparison
of a single conventional and organic wheat enterprise can be misleading and analysis
over a entire crop rotation is required. A complete assessment requires the preparation
of full budgets induding fixed costs, however the following is intended as a preliminary
analysis.
Comparisons were made between wheat enterprises, livestock production systems, and
mixed cropping rotations under a conventional and organic regime. The Lincoln
College farm manuals (Clark and Burtt, 1986; Clark et at., 1988, and previous issues),
and Lincoln College Farm Management Department staff were used as a basis for
conventional farm practices and performance. The results of the Canterbury PRAC
survey and previous studies (Haystead, 1987; Vine and Bateman, 1981) provided an
'average' organic crop and livestock farming programme.
Several limitations of the OF data are important to note. These included a high degree
of subjectivity, relying on farmers' own estimates of yield and costs, the variability
between Canterbury organic farms and the small population size, and the difficulty of
assessing the risk of crop failure and the costs of pest control and losses due to pests.
As well, the OF programme chosen was representative of the system practiced by these
farmers, and to develop the most profitable organic programme would require a
separate optimisation exercise. The crop rotation results are presented in terms of
returns per hectare, while the livestock enterprises also include returns per stock unit
and the rate of return on the capital stock value. In many farm management decisions,
maximisation of returns to capital or labour may be of greater significance than land
productivity. Sensitivity analysis compared the two systems when the assumptions of
the organic regime were varied. Detailed assumptions and calculations are presented
in Appendix E.
Livestock The principal assumptions employed for the Corriedale ewe breeding flock
comparison in Table 6.4 were that the conventional falm had a stocking rate of 14
stock units per hectare, 1000 ewes were tupped with a lambing percentage of 110,
replacement stock were bred on the farm, and 80% of the wether lambs were sold
prime. Labour costs for shearing, crutching and animal health were included. The
differing production parameters for the organic enterprise included a 10 % lower
stocking rate, a slower lamb growth rate and a price premium of 20% on half the prime
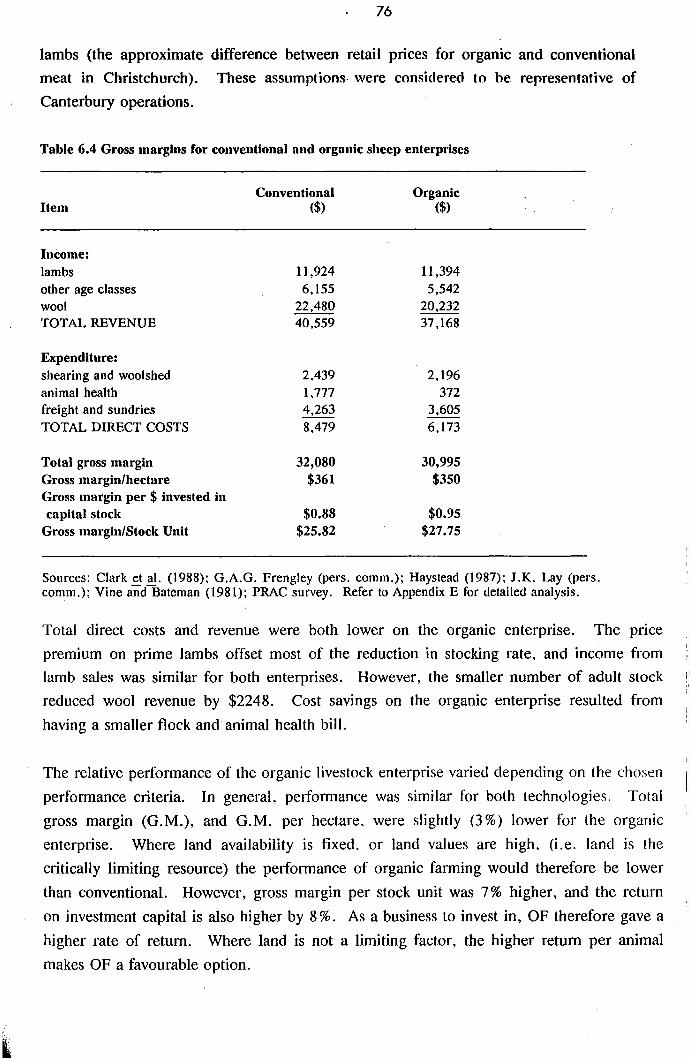
76
lambs (the approximate difference between retail prices for organic and conventional meat in Christchurch). These assumptions- were considered to be representative of Canterbury operations.
Table 6.4 Gross margins for conventional and organic sheep enterprises
Conventional Organic Item ($) ($)
Income: lambs 11,924 11,394 other age classes 6.155 5,542 wool 22,480 20.232 TOTAL REVENUE 40.559 37,168
Expenditure: shearing and woolshed 2,439 2,196 animal health 1.777 372 freight and sundries 4,263 3,605 TOTAL DIRECT COSTS 8,479 6,173
Total gross margin 32,080 30,995 Gross margin/hectare $361 $350 Gross margin per $ invested in capital stock $0.88 $0.95
Gross margin/Stock Unit $25.82 $27.75
Sources: Clark ~!!. (1988): G.A.G. Frengley (pers. comm.); Haystead (1987): 1.K. Lay (pers. comm.); Vine and Bateman (1981); PRAC survey. Refer to Appendix E for detailed analysis.
Total direct costs and revenue were both lower on the organic enterprise. The price premium on prime lambs offset most of the reduction in stocking rate, and income from lamb sales was similar for both enterprises. However, the smaller number of adult stock reduced wool revenue by $2248. Cost savings on the organic enterprise resulted from having a smal1er flock and animal health bill.
The relative performance of the organic livestock enterprise varied depending on the chosen performance criteria. In general, pelformance was similar for both technologies. Total gross margin (G.M.), and G.M. per hectare. were slightly (3%) lower for the organic enterprise. Where land availability is fixed. or land values are high. (i.e. land is the critically limiting resource) the performance of organic farming would therefore be lower than conventional. However, gross margin per stock unit was 7 % higher, and the return on investment capital is also higher by 8 %. As a business to invest in, OF therefore gave a higher rate of return. Where land is not a limiting factor, the higher return per animal makes OF a favourable option.

77
When the above assumptions about the stocking rate and price premium for the organic enterprise were varied, the matrix in Tahle 6.5 was obtained. Assuming no premium price, the returns per stock unit were consistently higher than the conventional level, due to cost savings. However, stocking rate had a major effect on overall profitability. Even if aB stock (except wool) received a price premium of 20% (a highly favourable assumption which was not achieved by any of the Canterbury fanns), G.M. per hectare was low. In practice, productivity per stock unit is likely to increase due to feed availability and reduced pest problems, which might offset some of this loss. On the other hand, if the organic enterprise was able to maintain stocking rates on a par with conventional properties, animal health savings resulted in higher income per hectare even when no stock was sold at a premium.
Table 6.5 Sensitivity of organic sheep gross margins per hectare to different production parameters
Stocking rate (per cent of conventional level) 1
80% 90% 100% Price premiums:
no premium $304 $342 $380
half prime lambs @ 20% $311 $350 $389
all stock (except wool) @ 20% $336 $378 $420
Conventional: $361 ha-1
1. Conventional stocking rate is 14 S.U. ha-1. Therefore 90% = 12.6 S.U. ha-1 and 80% = 11.2 S.U. ha-1. Sources: Clark et al. (1988); G.A.G. Frengley, (pers. comm.); Haystead (1987); 1.K. Lay (pers. comm.); Vine and-Bateman (1981); PRAC survey.
Wheat Gross margins were also calculated for ;:m ()rganic wheat enterrri<;e. ancl were compared to an equivalent conventional enterprise in Canterbury (Table 6.6). It was assumed that all spraying and harvesting were done by contract. and labour costs for cultivation were also included. The organic enterprise required two additional sUlface cultivations and four hours of hand weeding for weed control. It used cheaper untreated, certified seed, and the only direct nutrient inputs were two applications of seaweed fertiliser. The yield on the organic fatm was 30 % lower and returned a 20 % price premi urn.

78
Table 6.6 Gross margins for conventional and organic wheat enterprises
Item ($/ha)
Income: Yields (t/ha) Price (90 index, delivered) TOTAL REVENUE
Expenditure: Cultivation Seed Fertiliser Weed, Pest and Disease Freight, harvest and Irrigation TOTAL DIRECT COSTS
Gross Margin per hectare
Conventional
5 $200
$1000
$72 $86 $50
$202 $305 $715
$285
Organic
3.5 $240 $840
$117 $77 $82 $32
$218 $526
$314
Sources: Clark et a!. (1988); G.A.G. Frengley (pers. comm); J.K. Lay (pers. comm.); PRAC survey. Refer to Appendix E for detailed analysis.
The gross margin per hectare was 10 % higher on the organic wheat enterprise than its conventional equivalent. Total revenue was lower because the price premium did not offset the yield reduction. However, total costs were also lower due to savings in seed, pesticides, and the handling of a smaller tonnage of grain. Fertiliser costs were actually higher due to the expense of applying 'Maxi Crop' fertiliser by contract. In a BD system, up to seven herbal sprays were commonly applied to a wheat crop, with a cost of $98 ha-1 for application alone. The cost-efficiency of these practices is therefore of considerable importance to the profitability of the enterprise. Labour costs under OF were higher due to hand weeding and additional tractor work.
The importance of maintaining crop yields when a farm is converted to OF is clearly shown in Tahle 6.7. When yields fell to 60% of conv('ntinmll lewIs. which occasionally occurred on Canterbury organic farms. profitability was very km". However. if only a small yield drop resulted. a better return was highly feasible. When produce was not sold at a price premium. which is a likely situation during the first one or two seasons before a farm gains Bio Gro. then a yield drop in excess of 20% meant that the farmer was worse off than under CF.

79
Table 6.7 Sensitivity of organic wheat gross margins to different production parameters
Yield (t/ha) 60% lower (2) 30% lower (3.5) same (5)
Price premium:
None -$39 $174 $387
20% $41 $314 $587
50% $161 $524 $887
Conventional: $285 ha- l
Sources: Clark et al. (1988); G.A.G. Frengley (pers. comm); J.K. Lay (pers. comm.); PRAC survey.
Crop rotations A comparison over an entire crop rotation is. one means of incorporating factors such as fallowing and greenfeeds which are likely to affect the overall performance of organic farming and CF. Using Table 5.5 in Chapter 5 as a guide, the following crop rotation was chosen as being representative of a Canterbury organic mixed farm on a medium soil:
wheat/undersown red clover -+ peas -+ barley -+ pasture 5 years
The equivalent conventional mixed crop rotation (G.A.G. Frengley, pers. comm.) was:
peas -+ wheatlgreenfeed -+ barley -+ ryegrass -+ white clover -+ pasture 2 years
The organic crop rotation differed in several ways from the CF rotation. The OF rotation had a longer period in soil-restoring pasture, wheat was the first crop out of pasture, straw crops did not follow each other, no small seed crops were taken because of the absence of herbicides and highly soluble feltiJisers. greater emphasis was placed on herbaceous pasture species as a nutrient source. less feltiliser was applied. and fallowing and cultivation were relied upon more for weed control. Undersown red clover contributed nitrogen to the growing wheat crop. and had an additional role as stock feed in the following winter.
To compare the crop rotations, the gross margins from each year were averaged to give a mean annual income for a hectare of land under either system. Finally, yield and commodity price assumptions for the organic crop rotation were varied to indicate best and worst cases. These data are presented in Table 6.8. If no price premiums were

80
returned to the farmer, which is a reasonable assumption during the transition phase,
and production levels fell by levels which were representative of PRAC, then the annual
average OF OM was only 71 % of the CF standard. Under present economic
conditions, conventional farmers are barely able to cover fixed costs such as interest
payments. Consequently, this loss of income represents a significant economic
obstacle. Using 'standard' assumptions. OF had a 14% lower annual average OM per
hectare than conventional. This :contradicts the performance reported by PRAC, which
indicates the need for a more rigorous and extensive data base for economic analysis.
The 'standard' performance also does not suggest a profit incentive to adopt OF. With
only a small improvement in the production assumptions, however, OF performance
was comparable with CF. As ,Appendix E shows, whereas the cropping phase of the
OF crop rotation compared very favourably with CF enterprises, the pasture phase was
longer and less profitable. This suggests that an organic production system based
around crop production is likely to be more profitable than an organic livestock
production system. The 'worst case' performance showed, not surprisingly, that if
large yield reductions occur, and organic markets were unavailable, a large drop in net
income resulted. The 'best case' option showed that under highly favourable conditions
(which have yet to be achieved by any PRAC, and would probably require research and
improved marketing of organic farming) OF was able to far outperform CF.

81
Table 6.8 Comparison of average annual gross margins (GM) for organic and conventional crop rotations.
Annual average GM as a per cent Production assumptions GM per hectare of conventional
Conventional 277 100
Organic:} worst case: no premium, poor yield 116 42
no premiums: average yield 196 71
standard: average yield and premiums 237 86
best case: high yield and premiums 413 149
1. 'worst case' ,assumes no price premiums, 20% lower stocking rate (SR) , 60% lower wheat yield and a 30% reduction in yields of other crops. This was worse than the performance achieved on any of the Canterbury organic farms.
'no premiums' assumes representative yields for Canterbury organic farms, including a 10% 'ower SR 30% lower wheat yield, 10% lower yields for other crops, but with no price premiums. This is representative of the first one or two seasons of production, before a farm is able to achieve Bio Gro status and sell produce as 'organic'.
'standard' assumes the same yields as 'no premiums', but with a 20% premium on wheat, a 10% premium on other crops, and a 20% premium on organic prime lambs. These assumptions form the basis for the analysis in Appendix E, and are the closest representation of the performance on Canterbury organic farms.
'best case' assumes the same SR and yields as conventional, a 50% wheat premium, a 30% premium on other crops, and a 20% premium on all classes of stock. This performance was better than that achieved on any of the Canterbury organic farms.
Sources: Clark et al. (1988) and previous issues; G.A.G. Frengley, (pers. comm.); J.K. Lay, (pers. comm.); PMC survey. Refer to Appendix E for a detailed comparison of the 'standard' case.
6.3.3 Summary
In summary, this analysis offers several insights into the economics of organic farming. First. net income from OF was comparable with CF. but the performance of PRAC' did not indicate a strong profit incentive to adopt OF. Second. OF showed the potential In
be more profitable than CF in some situations. particularly for crops such as oats which have a premium market and yield well under OF conditions. In contrast. livestock enterprises were a less profitable part of the mixed crop and livestock system. Third. OF reduced operating costs, but it also involved increased labour demand and capital investment costs to establish the system. Fourth, the increased demand for land and labour may be limiting for some farmers, but the additional labour was usually provided by family or voluntary labour sources on Canterbury organic farms. Fifth, the gross margin calculations disagreed to some extent with organic farmers' assessments of farm profitability and labour demand, and a more rigorous and extensive data base
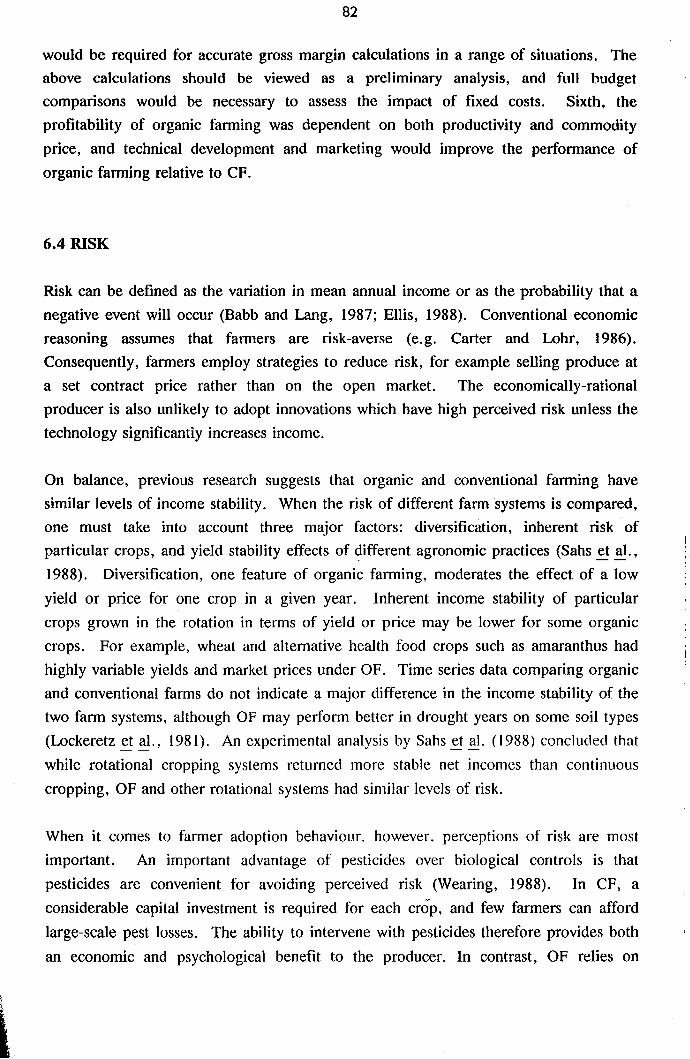
82
would be required for accurate gross margin calculations in a range of situations. The
above calculations should be viewed as a preliminary analysis, and full budget
comparisons would be necessary to assess the impact of fixed costs. Sixth, the
profitability of organic farming was dependent on both productivity and commodity
price, and technical development and marketing would improve the performance of
organic farming relative to CF.
6.4 RISK
Risk can be defined as the variation in mean annual income or as the probability that a
negative event will occur (Babb and Lang, 1987; Ellis, 1988). Conventional economic
reasoning assumes that farmers are risk-averse (e.g. Carter and Lohr, 1986).
Consequently, farmers employ strategies to reduce risk, for example selling produce at
a set contract price rather than on the open market. The economically-rational
producer is also unlikely to adopt innovations which have high perceived risk unless the
technology significantly increases income.
On balance, previous research suggests that organic and conventional farming have
similar levels of income stability. When the risk of different farm systems is compared,
one must take into account three major factors: diversification, inherent risk of
particular crops, and yield stability effects of ~ifferent agronomic practices (Sahs et al.,
1988). Diversification, one feature of organic farming, moderates the effect of a low
yield or price for one crop in a given year. Inherent income stability of particular
crops grown in the rotation in terms of yield or price may be lower for some organic
crops. For example, wheat and alternative health food crops such as amaranthus had
highly variable yields and market prices under OF. Time series data comparing organic
and conventional farms do not indicate a major difference in the income stability of the
two farm systems, although OF may perform better in drought years on some soil types
(Lockeretz et aI., 1981). An experimental analysis by Sahs et al. (1988) concluded that
while rotational cropping systems returned more stable net incomes than continuous
cropping, OF and other rotational systems had similar levels of tisk.
When it comes to farmer adoption behaviour. however. perceptions of risk are most
important. An important advantage of pesticides over biological controls is that
pesticides are convenient for avoiding perceived risk (Wearing, 1988). In eF, a
considerable capital investment is required for each crop, and few farmers can afford
large-scale pest losses. The ability to intervene with pesticides therefore provides both
an economic and psychological benefit to the producer. In contrast, OF relies on

83
problem prevention rather than cure, and reduces farmer intervention. When pest
outbreaks occur. organic farmers must either resort to chemical treatment or accept pest
losses. The perceived risk of organic farming is therefore likely to be an important
psychological barrier to adopting OF.
When considering the risks inherent in different production systems, public risks are
also relevant. One feature of pesticides is that much of their social, environmental
costs and risk are hidden or long-term, and they are therefore not perceived or
accounted for by land-users (Wearing, 1988). In contrast, OF emphasises the
externalities of farm practices and is perceived by organic farmers to have lower public
costs than CF. In the next section, the significance of these externalities is discussed.
6.5 PUBLIC COSTS AND BENEFITS
Although it is widely claimed that many of the advantages of organic farming are public
rather than private benefits, on analysis the environmental benefits of organic farming
are not clearly superior to CF. The essential point of this section is that while the
guiding philosophy of organic farming emphasises the externalities of farm practices,
OF is not necessarily more environmentally benign than technologies which use
chemical inputs. This is because chemical use can in some circumstances cause less
environmental damage and are less demanding of resources than non-chemical options.
For example, weed control under OF may require extensive fallowing, with a resulting
environmental damage in terms of soil structure (Gibbs, 1986), wind erosion (Beasley
et al., 1984), and nitrate leaching (Cameron and Haynes, 1986). In contrast, a
conventional farmer may be able to eradicate the problem with a rapidly bio-degradable
herbicide. One significance of public costs and benefits is that when they are
internalised into farm accounting by changes in regulations (for example a tax on soil
erosion or pesticide pollution), the relative performance of different farm systems may
also change. The public costs and benefits of organic falming are also important to
assess the justification for public sponsoring of organic farming research and
development. Suggested implications for public policy are briefly discussed at the end
of this section.
The guiding principles of the Bio Oro Standard emphasise the values of animal welfare.
environmental protection, sustainability, self-sufficiency and soil conservation. For
several PRAC, these principles were important personal values which were reflected in
fann practices such as the provision of wildlife habitat, and self-sufficiency in food and
timber supply. However, if future organic farmers adopt the technology principally for

84
economic gain then they will optimise production within market, rather than environmental. constraints. Consequently. an OF industry based on private profit will be environmentally benign only to the extent that such practices are profitable and/or are required by the Biological Producers Council (BPC). From participant observation of the BPC farm review process, it was apparent that the interpretation of the Bio Gro guiding principles was increasingly left to individual producers. Consequently, the public goods and benefits of organic farming need to be analysed in this light.
While evidence exists that OF is more soil-conserving than CF in some situations (Reganold et aI., 1987), the weed control and cultivation practices employed by PRAC increased the risk of soil erosion. The philosophy of organic farming places considerable emphasis on soil conservation, and a USDA (1980) report on OF found that organic farmers tended to use recommended soil conservation strategies including tree planting and shallow cultivation. In addition, a study undertaken in the Palouse region of Washington State in the United States (Reganold et al., 1987) suggested that in some farming conditions, OF effectively conserves soil organic matter. Reganold et al. (1987) compared two long-term (since 1948) organic and conventional properties in the U.S. whose soil-forming factors, except for management, were equal. The study found that the organically-managed soil had significantly higher organic matter content, thicker topsoil depth, higher polysaccharide content, lower modulus of eruption and less soil erosion than the conventionally-farmed soil. However, physical differences from Canterbury conditions, including the greater importance of water erosion in the Palouse versus wind erosion in Canterbury, limit the relevance of these results. Several of the practices employed by PRAC, including the incorporation of organic matter, sowing of cover crops, and shallow cultivation reduce the risk of wind erosion (Beasley et a1., 1984). However, the use of bare fal10wing and repeated cultivation for weed control under OF can damage soil structure (Gibbs, 1986) and increase the risk of wind erosion (Beasley et aI., 1984). A model1ing study (Domanico et aI., 1986) compared the profitability of organic farming, conventional plowing, and no-till agriculture when soil erosion was limited to specific rates. While OF was more profitable than [l
conventional plowing at low rates of soil erosion. the no-till system had a higher net income than both of these options at low levels of soil erosion. These data do not suggest that soil conservation is a clear public benefit of organic farming.
Another public cost of agricultural practices is the loss of nutrients and resulting off-site pollution from leaching and runoff. In Canterbury, nitrate pollution of groundwaters is a significant issue (Quin and Burden, 1979). Nitrate leaching can cause economic losses to producers, acidification of soils, eutrophication of water bodies, and human and animal health problems (Cameron and Haynes, 1986). The major source of nitrate
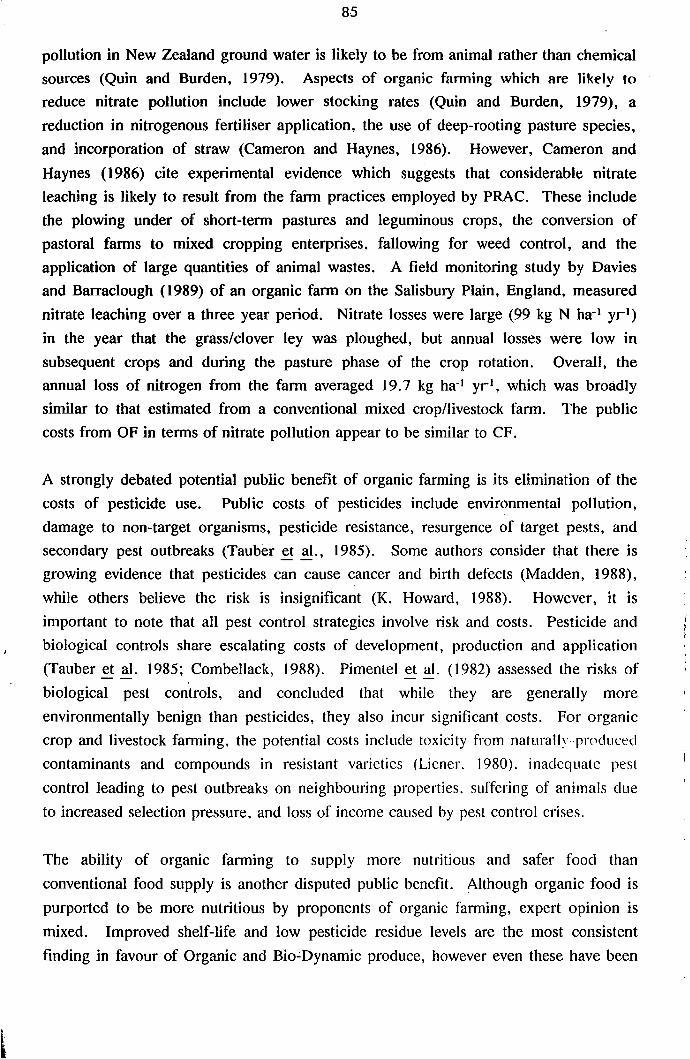
85
pollution in New Zealand ground water is likely to be from animal rather than chemical
sources (Quin and Burden, 1979). Aspects of organic fanning which are likely to
reduce nitrate pollution include lower stocking rates (Quin and Burden, 1979), a
reduction in nitrogenous fertiliser application, the use of deep-rooting pasture species,
and incorporation of straw (Cameron and Haynes, 1986). However, Cameron and
Haynes (1986) cite experimental evidence which suggests that considerable nitrate
leaching is likely to result from the fann practices employed by PRAC. These include
the plowing under of short-term pastures and leguminous crops, the conversion of
pastoral farms to mixed cropping enterprises, fallowing for weed control, and the
application of large quantities of animal wastes. A field monitoring study by Davies
and Barraclough (1989) of an organic farm on the Salisbury Plain, England, measured
nitrate leaching over a three year period. Nitrate losses were large (99 kg N ha-1 yrl)
in the year that the grass/clover ley was ploughed, but annual losses were low in
subsequent crops and during the pasture phase of the crop rotation. Overall, the
annual loss of nitrogen from the farm averaged 19.7 kg ha-l yrl, which was broadly
similar to that estimated from a conventional mixed cropllivestock farm. The public
costs from OF in terms of nitrate pollution appear to be similar to CF.
A strongly debated potential public benefit of organic farming is its elimination of the
costs of pesticide use. Public costs of pesticides include environmental pollution,
damage to non-target organisms, pesticide resistance, resurgence of target pests, and
secondary pest outbreaks (Tauber et aI., 1985). Some authors consider that there is
growing evidence that pesticides can cause cancer and birth defects (Madden, 1988),
while others believe the risk is insignificant (K. Howard, 1988). However, it is
important to note that all pest control strategies involve risk and costs. Pesticide and
biological controls share escalating costs of development, production and application
(Tauber et a1. 1985; Combellack, 1988). Pimentel et a1. (1982) assessed the risks of
biological pest controls, and concluded that while they are generally more
environmentally benign than pesticides, they also incur significant costs. For organic
crop and livestock farming. the potential costs include toxicity from naturally-produced
contaminants and compounds in resistant varieties (Liener. 1980). inadequate pest
control leading to pest outbreaks on neighbouring properties. suffering of animals due
to increased selection pressure, and loss of income caused by pest control crises.
The ability of organic farming to supply more nutritious and safer food than
conventional food supply is another disputed public benefit. Although organic food is
purported to be more nutritious by proponents of organic farming, expert opinion is
mixed. Improved shelf-life and low pesticide residue levels are the most consistent
finding in favour of Organic and Bio-Dynamic produce, however even these have been

86
disputed (Horticulture Market Research Unit, 1986). The anti-pesticide lobby claims
that tests of pesticide toxicity and monitoring programs are inadequate and
inconclusive, and that proven links exist between pesticide use and human illness
(White and Painter, 1988). At the same time, many scientists and bureaucrats believe
that the risk to the public is very small, especially compared with other health risks
such as smoking and drinking (K. Howard, 1988). Scientists also point out that many
naturally-occurring toxins pose significant health risks to humans and animals (Wogan
and Busby, 1980).
In terms of reducing chemical use generally, a large-scale shift to OF is unlikely to be
the most economically or technically-efficient strategy. New Zealand annually spends
over $100 million on pesticides alone (Combellack, 1988). Integrated pest
management (IPM) utilises all available methods, including biological and chemical
control strategies, to reduce pest populations. By employing these techniques in a
complementary manner, IPM is more flexible and cost-effective than OF. Rather than
shifting to mechanical and biological control, Combellack (1988) considered that
herbicide use in Australia could be most effectively and profitably reduced by more
efficient use of chemical inputs. This, Combellack contended, could be achieved by
increased application efficiency, more effective formulations and adjutants, careful
timing of applications, spraying weeds only when they occur, and acceptance of lower
levels of weed control consistent with optimising economic returns.
The oil shocks of the 1970's and the rising price of oil-based products encouraged some
researchers in the United States (for example Pimentel et al., 1983; Berardi, 1977;
Klepper et al., 1977) to assess the potential of organic farming as a means of
conserving fossil fuel resources in agriculture. In addition to conserving limited fossil
fuel stocks, a low-energy technology could reduce the vulnerability of agriculture to
fluctuations in energy availability and price. In general, the studies found that OF was
more efficient than CF in terms of the quantity of food output produced by a given
fossil fuel input. This difference was mainly due to the reliance of CF nn nitr0gen0t1s
fertiliser. However, Canterbury organic farms are not clearly more energy-efficient.
because New Zealand CF relies primarily on nitrogen-fixing fel1ilisers rather than
nitrogen fertilisers. In a Canterbury study. McChesney et al. (1978) found that 60 % of
the energy consumption on mixed cropping faIms was from fuel use. 16% from
fertiliser and only 1 % from agrochemicals. Organic farms use physically processed
fertilisers such as dolomite and rock phosphate, which require energy for their
excavation, processing and distribution. They may also increase fuel consumption
through additional mechanical weed control. The lower yields which characterise OF
also reduce the efficiency of energy conversion.
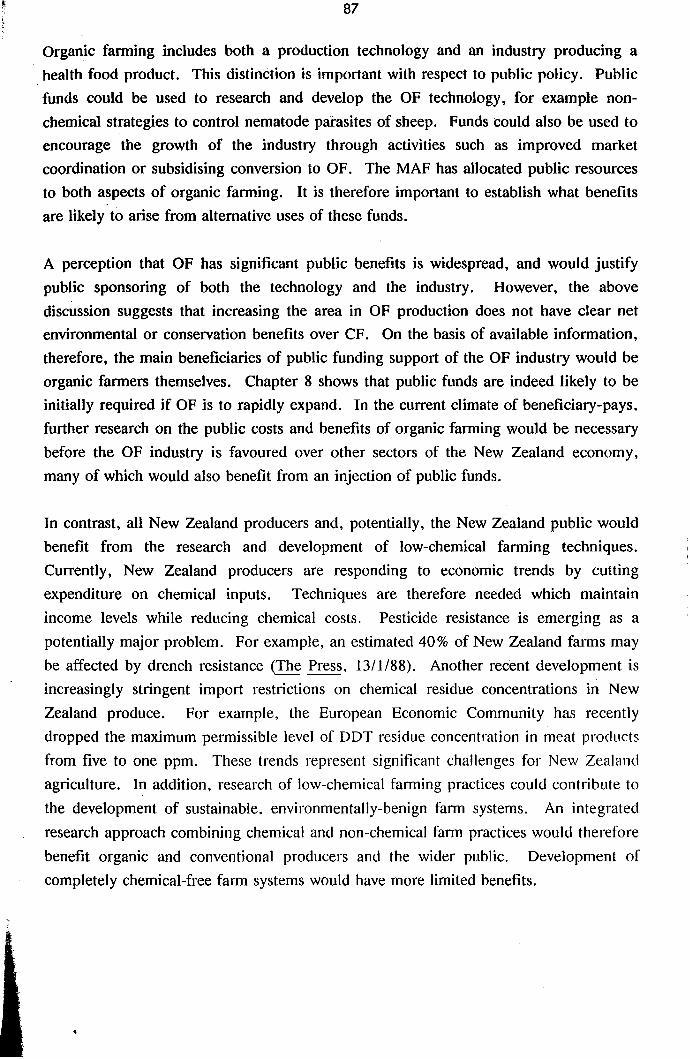
87
Organic farming includes both a production technology and an industry producing a health food product. This distinction is important with respect to public policy. Public funds could be used to research and develop the OF technology, for example non-chemical strategies to control nematode parasites of sheep. Funds could also be used to encourage the growth of the industry through activities such as improved market coordination or subsidising conversion to OF. The MAF has allocated public resources to both aspects of organic farming. It is therefore important to establish what benefits are likely to arise from alternative uses of these funds.
A perception that OF has significant public benefits is widespread, and would justify public sponsoring of both the technology and the industry. However, the above discussion suggests that increasing the area in OF production does not have clear net environmental or conservation benefits over CF. On the basis of available information, therefore, the main beneficiaries of public funding support of the OF industry would be organic farmers themselves. Chapter 8 shows that public funds are indeed likely to be initially required if OF is to rapidly expand. In the current climate of beneficiary-pays, further research on the public costs and benefits of organic farming would be necessary before the OF industry is favoured over other sectors of the New Zealand economy, many of which would also benefit from an injection of public funds.
In contrast, all New Zealand producers and, potentially, the New Zealand public would benefit from the research and development of low-chemical farming techniques. Currently, New Zealand producers are responding to economic trends by cutting expenditure on chemical inputs. Techniques are therefore needed which maintain income levels while reducing chemical costs. Pesticide resistance is emerging as a potentially major problem. For example, an estimated 40% of New Zealand farms may be affected by drench resistance (The Press, l3/1/88). Another recent development is increasingly stringent import restrictions on chemical residue concentrations in New Zealand produce. For example. the European Economic Community has recently dropped the maximum permissible level of DDT residue concentration in meat products from five to one ppm. These trends represent significant challenges for New Zealand agriculture. In addition, research of low-chemical falming practices could contribute to the development of sustainable. environmentally-benign falm systems. An integrated research approach combining chemical and non-chemical farm practices would therefore benefit organic and conventional producers and the wider public. Development of completely chemical-free farm systems would have more limited benefits.

88
6.6 SUMMARY
This chapter identified key economic differences between organic (OF) and
conventional (CF) farming. Economic factors which are likely to affect adoption of
organic farming were assessed, including profitability, investment cost, risk, and public
costs and benefits. Taking all of these factors into account, the economic
characteristics of organic farming wil1 greatly affect its rate of adoption.
A lack of economic information is a barrier to adoption of organic farming.
Incomplete information results in inefficient management decisions, and uncertainty is a
disincentive to adopt OF. Gross margins (GM) ca1culated in this chapter were based on
highly limited information. Gross margin estimates differed from the labour demand
and profitability reported by Canterbury organic producers. A more rigorous and
extensive data base would be required to accurately compare the economics of organic
farming and CF in a range of situations. The gross margins in this chapter should be
viewed as a preliminary analysis of organic farming, and full budgets would be
necessary to encompass fixed costs and initial capital investments.
Net income under OF was similar to CF. In general, lower yields were balanced by a
reduction in production costs and, in some cases, higher commodity prices. On
average, practicing organic f~rmers (PRAC) estimated that net income had increased
slightly. Gross margins were averaged over conventional and organic farming crop
rotations. The OF production assumptions were representative of Canterbury organic
farms, and included a 30% lower wheat yields and 10% lower yields for other crops
compared with conventional. A 10% reduction in stocking rate was also assumed
necessary for animal health reasons. Organic price premium assumptions were 20% for
wheat, 10% for other crops, and 20% for prime lambs. Production costs were lower
under OF compared with CF, for example 26 % lower for a wheat enterptise
compatison. Labour demand increased, although the labour requirements of organic
farming were not accurately measured. On average. the PRAC estimated that lub0ur
demand had only increased by 4 %. but a gross margin comparison suggested that
labour demand for a wheat enterprise was at least 26% higher. Higher labour costs
were not usually reflected in increased cash expenditure on Canterbury organic farms.
because farmers worked longer hours. used unpaid family and had access to voluntary
labour sources. Overall. the OF gross margin was ) 4 % lower than the conventional
level. These data suggest that while net income under OF is similar to CF in some
situations, adopting the technology is unlikely to result in a major improvement in net
income. However, if higher productivity and/or commodity prices were assumed, OF
outperformed CF. As a largely undeveloped technology, the profitability of organic
farming could benefit from technical, economic and market research.
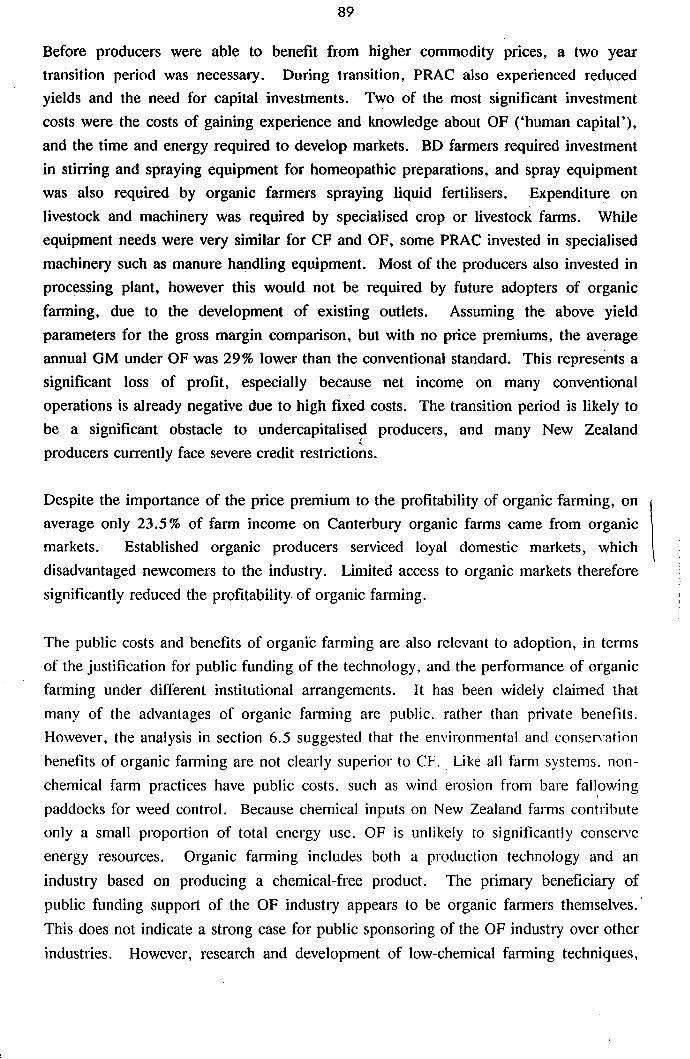
89
Before producers were able to benefit from higher commodity prices, a two year
transition period was necessary. During transition, PRAC also experienced reduced
yields and the need for capital investments. Two of the most significant investment
costs were the costs of gaining experience and knowledge about OF ('human capital'),
and the time and energy required to develop markets. BD farmers required investment
in stirring and spraying equipment for homeopathic preparations, and spray equipment
was also required by organic farmers spraying liquid fertilisers. Expenditure on
livestock and machinery was required by specialised crop or livestock farms. While
equipment needs were very similar for CF and OF, some PRAC invested in specialised
machinery such as manure handling equipment. Most of the producers also invested in
processing plant, however this would not be required by future adopters of organic
farming, due to the development of existing outlets. Assuming the above yield
parameters for the gross margin comparison, but with no price premiums, the average
annual GM under OF was 29% lower than the conventional standard. This represents a
significant loss of profit, especially because net income on many conventional
operations is already negative due to high fixed costs. The transition period is likely to
be a significant obstacle to undercapitalise? producers, and many New Zealand
producers currently face severe credit restrictions.
Despite the importance of the price premium to the profitability of organic farming, on \
average only 23.5 % of farm income on Canterbury organic farms came from organic
markets. Established organic producers serviced loyal domestic markets, which
disadvantaged newcomers to the industry. Limited access to organic markets therefore
significantly reduced the profitability. of organic farming.
The public costs and benefits of organiC farming are also relevant to adoption, in terms
of the justification for public funding of the technology, and the performance of organic
farming under different institutional arrangements. It has been widely claimed that
many of the advantages of organic farming are public. rather than private benefits.
However, the analysis in section 6.5 suggested that the environmental and conseryatioJl
benefits of organic farming are not clearly superior to CF .. Like all farm systems. non
chemical farm practices have public costs. such as wind erosion from bare fallowing 1
paddocks for weed control. Because chemical inputs on New Zealand farms contlibute
only a small proportion of total energy use. OF is unlikely to significantly conserve
energy resources. Organic farming includes both a production technology and an
industry based on producing a chemical-free product. The primary beneficiary of
public funding support of the OF industry appears to be organic farmers themselves.'
This does not indicate a strong case for public sponsoring of the OF industry over other
industries. However, research and development of low-chemical farming techniques,

90
the technology side of organic farming, would benefit conventional and organic
producers and the wider pubJic. Rising chemical costs. pesticide resistance, and import
restrictions on pesticide residues in food indicate a need to development ways to
profitably reduce chemical use. In addition, research of the OF technology could aid in
the development of environmentally-benign farming systems .. The techllology aspect of
organic farming therefore appears to have significant public benefits.
This chapter concludes the analysis of characteristics of the OF technology.. One
recurring theme has been the lack of information and the importance of farmer
perceptions about OF, rather than. established fact. For example, economic
comparisons of organic farming and CF suggest that the variation in annual income
(risk) for both production systems is similar. Pesticides are convenient for avoiding
perceived risk: if a producer suspects a pest outbreak, he or she can intervene with a
pesticide. However, OF removes this option and instead relies largely on problem
prevention. In the eyes of some producers, the OF strategy is likely to increase the
perceived risk of pest losses. To other producers, the perceived public risk of chemical
use is an incentive to adopt OF. The next chapter shows that how an individual
perceives OF has a major bearing on whether or not the farmer will adopt the
technology.
91
CHAPTER 7. ORGANIC FARMERS AND THE ADOPTION DECISION
7. 1 Introduction 7.2 Previous investigations 7.3 Survey results 7.4 Summary
7.1 INTRODUCTION
As of March 1988, only 13 Canterbury farmers were producing organic sheep and cereal crops, despite a considerable level of interest expressed in the technology from the rural sector. This interest is evidenced by increasing press coverage, Ministry of Agriculture and Fisheries (MAF) involvement, and high levels of attendance at organic farming (OF) conferences. The image of organic farming as a viable farming alternative is, according to the adoption-diffusion model, the primary determinant of whether farmers will adopt the technology (Rogers, 1983). The slow spread of organic farming therefore suggests that frumers perceive significant bruners to change. The current interest in OF is motivated by economic factors (Lacy, 1986; Galloway, 1988; R. Scott, 1987; Williams, 1988), whereas OF has in the past been viewed primarily as an environmental farming philosophy (Vine and Bateman, 1981). Whether farmers perceive OF as an environmental philosophy or a commercial innovation influences both the type of individual likely to adopt the technology (Taylor and MiHer, 1978).
In other chapters, the characteristics of organic fanning were described. Attention now turns to the innovators themselves and their decision to adopt OF. In section 7.2, data from previous investigations are used to develop hypotheses about the type of producer likely to adopt OF. These hypotheses are tested in section 7.3, based on personality profiles of four practicing Canterbury organic farmers (PRAC). and results of PRAC and prospective organic falmer (PROS)I surveys. Farmer pei"Ceptions of the aclnmt;H!eS and problems of organic falming are also identified in section 7.3. By studying established organic producers. those who are cUlTently undergoing transition. producers who are considering adoption. and other farmers. insights can be gained about the past. present and future of the industry. Significant differences. if any. in the social characteristics of organic and conventional producers (CP) can also be identified. In the final section, these results and their significance are summarised.
1 These terms are strictly defined in Chapter 3.

92
7.2 PREVIOUS INVESTIGATIONS
Studies of organic farmers in the United States (Harris et al., 1980; Lockeretz and
Wernick, 1980; USDA, 1980; Foster and Miley, 1983; Blobaum, 1983; Dalecki and
Bealer, 1984), the United Kingdom (Vine and Bateman, 1981) and Australia (Conacher
and Conacher, 1982) have attempted to identify farmer motivations for choosing OF,
and the features which make this small minority of individuals different from other
producers. A number of autobiographical works by organic farmers (for example
Turner, 1951; Wookey, 1987) and scattered biographical articles in OF publications
have also contributed sociological material. In addition, a large body of research has
investigated the adoption of other technologies (Rogers, 1983). Using an inductive
approach, this data base was used to develop generalisations and hypotheses which,
combined with the PRAC case studies, guided survey design and analysis.
One aspect of the adoption-diffusion model is the hypothesis that innovative farmers
differ in important ways from later adopters. In a comprehensive review of adoption
diffusion research, Rogers (1983) characterised the "ideal" innovator. Some features of
the early adopting farmer type compared with other members of the rural community,2
along with their degree of support from the OF literature,3 are:
Risk-taking, venturesome The same age as other farmers
More educated Higher social status (this applies mainly to early adopters rather than innovators)
More cosmopolitan Communication with other innovators
Larger farms
More commercially oriented
More favourable attitude to borrowing credit More specialised operations Less dogmatic More contact with change agents4
(?)
(SS: Harris ~ ~., 1980; Lockeretz and Wernick, 1980; USDA, 1980; Dalecki and Bealer, 1984) (S: USDA, 1980; Dalecki and Bealer, 1984)
(N: Blobaum, 1983; Conacher and Conacher, 1982) (S: Foster and Miley, 1983)
(SS: Blobaum, 1983; Foster and Miley, 1983) (N: Lockeretz and Wernick, 1980; USDA. 1980: Youngberg and Butte!' 1984) (N: Lockeretz and Wernick. 1980: Vine and Bateman. 1981: Conacher and Conacher. 1982: Foster and Miley. 1983)
(N: ibid.) (N: Vine and Bateman. 1981) (N: Foster and Miley, 1983) (S: Lockeretz and Wernick, 1980; Vine and Bateman, 1981; Blobaum, 1983)
2 E.M. Rogers. The Diffusion of Innovations, 3rd Edition, New York: The Free Press, 1983. 3 'ss' = strong support, 'S' = tentative support, 'N' = opposing evidence, '?' = lack of evidence. 4 Change agents are individuals who influence clients' innovation decisions in a direction deemed
desirable by a change agency (Rogers, 1983), such as sales representatives for organic fertiliser Companies, and organic distributors.

93
Clearly, organic farmers do not fit the mould of the ideal innovator. This is not
surprising in the light of Taylor and Miller's (1978) conclusion that .... farmers who
adopt environmental innovations have a different orientation toward farming than do
farmers who adopt commercial innovations.'5 In many ways, OF is a regressive, rather
than a progressive technological change, in that it reverses many of the trends of
Western agriculture such as increased specialisation, farm size and substitution of
capital for labour. In addition, public costs and benefits, rather than private financial
benefits, have been important motivations for producers choosing OF (Foster and
Miley, 1983). The diffusion of organic farming is therefore likely to differ as a social
process from the diffusion of innovations such as farm machinery and pesticides.
However, Taylor and Miller (1978) considered that the adoption-diffusion model was
still relevant to innovations such as OF if environmental. motivations were taken into
account. Accordingly, the adoption-diffusion model is. used as a framework for this
chapter, while most of the following hypotheses are developed from the literature
specific to OF, rather than the general adoption-diffusion model.
(1) Adopters of organic funning share several similar features with New ?ealand fanners general /y. Both
groups generally own and operate family fanns on freehold land. They also share a similar age
distribution. level offanning experience, and management ability.
In the United States, a high percentage. of organic farmers own all or most of the land
which they farm (USDA, 1980). Several reasons have been suggested for why OF is
largely confined to the owner-operated family farm. These include the provision of
cheap family labour (Berardi, 1978), sensitivity to local farming conditions and the
absence of landlord objections (Blobaum, 1983). It has 'also been suggested that
owner-operators are more willing to undertake long-term investment in soil resources,
because of a greater concern for future generations compared with absentee owners
(Odum, 1984). In practice, however, the level to which farmers 'plough back'
investment capital into the farm is determined by a wide range of factors such as
inflation, price support schemes, and the rate of return on alternative investments
(Pryde. 1987). In New Zealand agriculture generally. the owner-operated family farm
is also the dominant pattern of ownership, although farm demography is continually
changing (Fairweather, 1987).
One stereotype of the organic farmer is a young urban dropout choosing an antiquated.
labour-intensive farm system largely for philosophical reasons (Lockeretz and Wernick,
1980). However, survey comparisons undertaken by Lockeretz and Wernick (1980),
and also the USDA (1980) and Dalecki and Bealer (1984) indicate that organic farmers
share the same age, level of farming experience and management ability as
5 D.L. Taylor and W.L. Miller. 'The adoption process and environmental innovations: a case study of a government project'. Rural Sociology, 43(4) : 634-648, 1978. p.634.

94
conventional producers. Farmer age may affect adoption of organic farming through
differences in farming and life experiences, levels ~f farm debt, ambitions and family
pressures, and the physical ability to substitute labour for capital.
(2) Organic farmers own smoJler fanns 'han 'he conventional average.
This observation has been confirmed by several surveys (for example Lockeretz and
Wernick, 1980; USDA, 1980). It is technically feasible to apply OF on a large scale
(USDA, 1980; Conacher and Conacher, 1982; Wookey, 1987), although OF is more
management-intensive than conventional farming (CF) (Coleman, 1985). Youngberg
and Buttel (1984) asserted that, 'The fact that there are some large organic farms. while
the majority of organic farms are small by U.S. standards, lies in the risks and
problems associated with the conversion from conventional to organic farming, rather
than in major diseconomies of scale once the conversion process has been completed. '6
(3) On average, organic farmers are bener educaled 'han conven,ional farmers.
This observation was made by surveys undertaken in the U.S. by the USDA (1980) and
Dalecki and Bealer (1984), however it was not confirmed by Harris et at. (1980). A
high level of education is characteristic of early adopters (Rogers, 1983) and
environmentally-minded individuals (Lowe and Rudig, 1986). Eckersley (1988)
believed that higher education has a broadening effect which makes an individual more
open-minded, independent, astute and critical. However, the potential also exists for
students to be indoctrinated by their conventionally-trained tutors.
(4) Organic farmers are motivated more by way-of-life and less by profit and social prestige, compared with
conventional farmers.
Farmers who adopt conservation technologies have a different orientation towards
farming than other farmers (Taylor and Miller. 1978). Non-financial motivations were
identified as important farming objective in all previous OF surveys (Lockeretz and
Wernick, 1980; Vine and Bateman, 1981; Conacher and Conacher. 1982; Foster and
Miley, 1983). Organic farming has a negative social image among farmers generally
(Conacher and Conacher. 1982; Foster and Miley. 1983). and innovative farmers often
meet with social opposition from their peers (Rogers. 1983).
(5) Farmers adopt OF for a variety of reasons, including health, environmental, production and financial
concerns. The initial stimulus and motivation for adoption varies between individuals, and contact with
other members of the OF industry is an important cue to change.
Previous research has found that the decision to adopt OF is motivated by a complex of
factors. These include health and safety issues related to chemical use; farm production
6I.G. Youngberg; F.B. Buttel. 'Public policy and sociopolitical factors affecting the future of Sustainable farming systems.' p.167-185. In: Organic farming: current technology and its role in a SUstainable agriculture. A.S.A. Special Publication No. 46, 1984. p.175

95
and husbandry concerns; financial reasons; and environmental, philosophical and
ideological motivations (Lockeretz and Wernick, 19'80; Vine and Bateman. 1981 :
Conacher and Conacher, 1982; Foster and MiJey, 1983). The relative importance of
these factors is unclear and varies between studies. This may be largely attributable to
differences in questionnaire design and analysis. Organic .farming has been viewed as
both a 'preventive innovation'? , i.e. a new technology that an individual adopts to
avoid unwanted future occurrences (such as pest resistance). and as a positive change
(for example the production of healthier food). Initial stimuli for change (which Rogers
(1983) terms 'cues-for-action'8 ) have mainly been encouragement from someone in the
organic movement (such as a farmer, relative, salesperson or public speaker) and
personal concerns such as a dislike of chemicals (Vine and Bateman, 1981; Blobaum,
1983).
(6) Practicing (PRAC) and prospeclive organic farmers (PROS) have different socio-economic characteristics.
PROS also have a more economic orientation towards OF than PRAC.
Whereas OF has previously been adopted primarily for non-profit reasons, it has been
suggested that most New Zealand farmers are now interested in OF as a remedy to the
present depressed economic conditions (Lacy, 1987). However, as yet there is no
empirical evidence to support this contention. In addition, according to the adoption
diffusion model, the socio-economic characteristics of innovative farmers differ from
later adopters (Rogers, 1983).
(7) A number of barriers to the adoplion and impiementalion of organic fanning are perceived by farmers.
A number of barriers have been identified by non-empirical studies such as Madden
(1988). When asked to identify the greatest disadvantages of organic farming, organic
fanners in the U.S. cited weed control (58%), increased labour demand (8%),
marketing difficulties (6%), and social pressure (2%) (Blobaum, 1982; n=125
respondents) .
7 E.M. Rogers. The Diffusion o/Innovations, 3rd Edition. New York: The Free Press, 1983. p.171. 8 ibid., p.171.
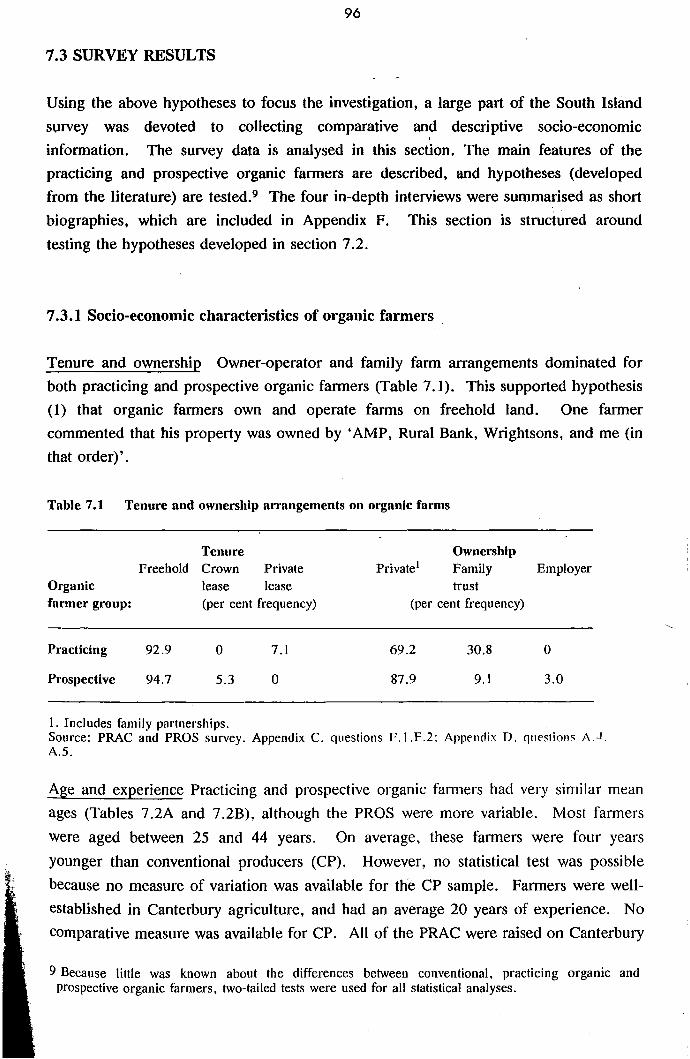
96
7.3 SURVEY RESULTS
Using the above hypotheses to focus the investigation, a large part of the South Island survey was devoted to collecting comparative and descriptive socio-economic information. The survey data is analysed in this section. The main features of the practicing and prospective organic farmers are described, and hypotheses (developed from the literature) are tested.9 The four in-depth interviews were summarised as short biographies, which are included in Appendix F. This section is structured around testing the hypotheses developed in section 7.2.
7.3.1 Socio-economic characteristics of organic farmers
Tenure and ownership Owner-operator and family farm arrangements dominated for both practicing and prospective organic farmers (Table 7.J). This supported hypothesis (1) that organic farmers own and operate farms on freehold land. One farmer commented that his property was owned by 'AMP, Rural Bank, Wrightsons, and me (in that order)'.
Table 7.1 Tenure and ownership arrangements on organic farms
Tenure Ownership Freehold Crown Private Private! Family Employer
Organic lease lease trust farmer group: (per cent frequency) (per cent frequency)
Practicing 92.9 0 7.1 69.2 30.8 0
Prospective 94.7 5.3 0 87.9 9.1 3.0
1. Includes family partnerships. Source: PRAC and PROS survey. Appendix C. questions F.I.F.2: Appendix D. qllestion" A.J. A.5.
Age and expel;ence Practicing and prospective organic fanners had very similar mean ages (Tables 7.2A and 7.2B), although the PROS were more variable. Most farmers were aged between 25 and 44 years. On average, these farmers were four years younger than conventional producers (CP). However, no statistical test was possible because no measure of variation was available for tJ{e CP sample. Farmers were well-established in Canterbury agriculture, and had an average 20 years of experience. No comparative measure was available for CP. All of the PRAC were raised on Canterbury
9 Because little was known about the differences between conventional, practicing organic and prospective organic farmers, two-tailed tests were used for all statistical analyses.

97
farms. Both practicing and prospective organic farmers included a spectrum from newcomers to farm management through to semi-retired farmers. Althollgh a small difference in the average age was indicated by these results, and the comparison is limited by available information on CP, these results do not suggest a major difference in the age and number of years farming between organic and conventional farmers. This gives limited support to hypothesis (1) and does not suggest that farmer age is an important constraint to adoption of organic farming.
Table 7.2A Age and experience of organic farmers
Practicing (n= 13) Prospective (n=41) Conventional mean s.d. range mean s.d. range
Age 40.5 7.1 29-52 40.2 lOA 26-72 44.01
Years lived on the present property 29.3 14.8 7-53 19.7 13.7 0.5-47
Years worked on farms 21.2 9.0 8-30 18.8 11.70.5-47 Years managed farms 13.6 8.2 1-30
Source: J.G. Pryde and P.J. McCartin, 'Survey of New Zealand Farmer Intentions and Opinions October-December 1986'. AERU Research Report No. 188, Lincoln College, August 1987. This is the weighted average of 478 Canterbury, Otago and Southland farmers. A measure of variance was not included in the text. Organic farmer data from PRAC and PROS surveys: Appendix B, questions 1.1, B.l, B.2, BA; Appendix D, questions B.l, B.2, G.1.
Table 7.2D Age distribution of organic fanners
Farm group
Practicing
Prospective Total
25-34
1504
34.1 29.6
Age Class 35-44 45-54 (per cent frequency)
61.5
41.5
46.3
23.1 12.2 14.8
>55
o 12.2 9.3
Source: PRAC and PROS surveys. Appendix B. question I.l: Appendix D. G.l.
n
13 41 54
Farm size and class Little difference was found between the mean farm sizes of practicing and prospective organic farmers (Table 7.3). However, the PROS owned a greater variety of farm types and sizes than the PRAC. On average, both groups owned smaller farms than the conventional average sized farm. This supported hypothesis (2) in section 7.2 that adopters of organic fanning own smaller farms than the conventional average, but it does not suggest that OF is limited by scale. A

98
statistically significant chi-square test found that a larger proportion of mixed farms were interested in or had converted sample of conventional sheep farms. highly diversified.
to OF than would be expected from a mndom In particular, farms owned by the PRAC were
Table 7.3 Size and class of survey fanns compared with national averages
Farm type) Class 2 Class 6 Class 7 Class 8 (hill country, (mainly sheep, (finishing, (mixed sheep,
Farmer group: South Island) some cropping) crop) crop)
Prospective mean2 615ha 222.lha 184.4ha 177 .Oha n 2 13 13 13 s 431.3 162.8 62.3 58.2 range 310-920.5 42-600ha 107-287ha 33-242ha
Practicing mean 727ha 300.5ha 172.6ha n 1 4 8 s 80.1 69.5 range 228-405ha 86-292ha
Conventional mean 1757ha 353ha 181ha 264ha (1985-86)1 n 900 4100 3700 1800
l. Source: New Zealand Meat and Wool Board's Economic Service, New Zealand Sheep and Beef AnnuaL Farm Survey, 1985-86. This annual survey divides New Zealand sheep and beef farms into eight subgroups. Class 2, South Island hill country, includes mainly fine wool sheep farms carrying around 3 S.U. ha-1. Class 6, South Island finishing-breeding farms, includes farms which breed their own replacements and frequently have some cash cropping. Class 7, South Island intensive finishing farms. carry around 13 S.U. ha -1 with cash crop returns increasing in importance. Class 8. South Island mixed cropping and finishing farms, have a high proportion of income from grain and small seeds. 'n' refers to the approximate number of New Zealand farms in each class. Organic farmer data from PRAC and PROS surveys. Appendix C, sections B,D; Appendix D. section A. 2. Mean effective farm area (hectares). 3. A chi-square test of the cell frequencies was significant at the 95 % level (X2 = 7 . 816, d. f. = 2).
Education The practicing and prospective organic fanners had a higher level of education compared with conventional farmers. to a statistically significant degree. Prospective organic fanners were particularly well educated. Nearly a third of the practicing and prospective organic fanners held university qualifications. which ranged from the Diploma in Agriculture through to a Masters degree in Sociology and Political Studies, and nearly half had undertaken post-secondary school study. This result supports hypothesis (3) in section 7.2, that organic falmers are, on average, better educated than CP.
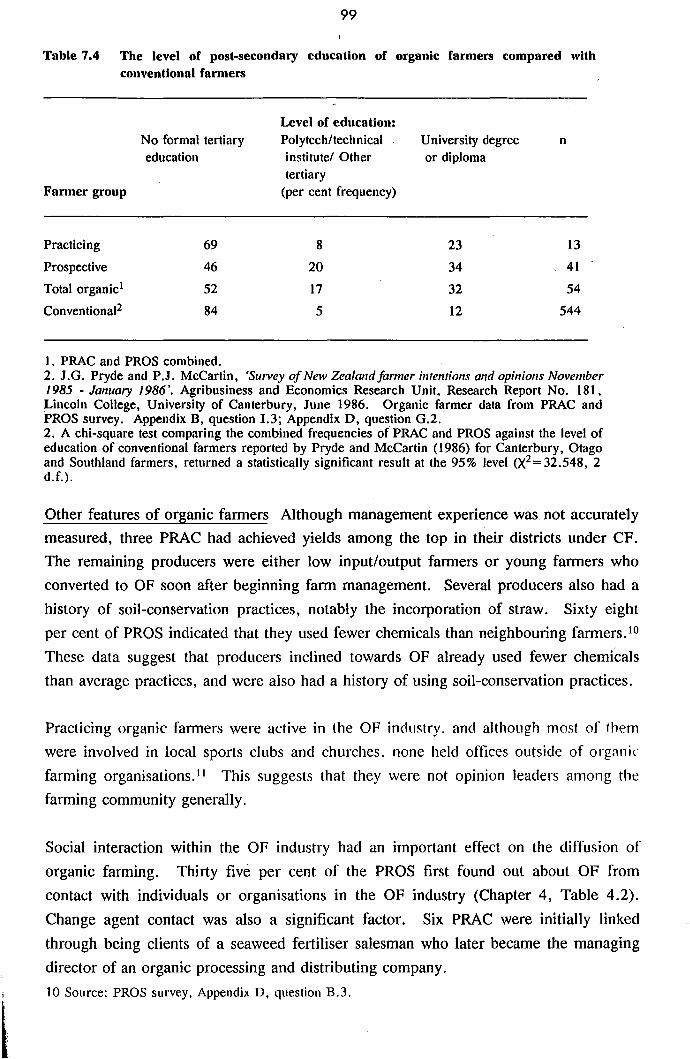
99
Table 7.4 The level of post-secondary education of organic farmers compared with conventional farmers
Farmer group
Practicing Prospective Total organicl
Conventional2
No formal tertiary education
69 46 52 84
1. PRAC and PROS combined.
Level of education: Poly tech/technical institute/ Other tertiary
(per cent frequency)
8 20 17 5
University degree or diploma
23 34 32 12
n
13
41 54
544
2. J.G. Pryde and P.J. McCartin, 'Survey of New ZealandJarmer intentions and opinions November 1985 - January 1986'. Agribusiness and Economics Research Unit, Research Report No. 181, Lincoln College, University of Canterbury, June 1986. Organic farmer data from PRAC and PROS survey. Appendix B, question 1.3; Appendix D, question G.2. 2. A chi-square test comparing the combined frequencies of PRAC and PROS against the level of education of conventional farmers reported by Pryde and McCartin (1986) for Canterbury, Otago and Southland farmers, returned a statistically significant result at the 95% level (X2=32.548, 2 d.f.).
Other features of organic farmers Although management experience was not accurately measured, three PRAC had achieved yields among the top in their districts under CF. The remaining producers were either low input/output farmers or young farmers who converted to OF soon after beginning farm management. Several producers also had a history of soil-conservation practices, notably the incorporation of straw. Sixty eight per cent of PROS indicated that they used fewer chemicals than neighbouring farmers. lo
These data suggest that producers inclined towards OF already used fewer chemicals than average practices, and were also had a history of using soil-conservation practices.
Practicing organic farmers were active in the OF industry. and a1though most of them were involved in local sports clubs and churches. none held offices outside of orgnnic farming organisations.l 1 This suggests that they were not opinion leaders among the farming community generally.
Social interaction within the OF industry had an important effect on the diffusion of organic farming. Thirty five per cent of the PROS first found out about OF from contact with individuals or organisations in the OF industry (Chapter 4, Table 4.2). Change agent contact was also a significant factor. Six PRAC were initially linked through being clients of a seaweed fertiliser salesman who later became the managing director of an organic processing and distributing company. 10 Source: PROS survey, Appendix D, question B.3.
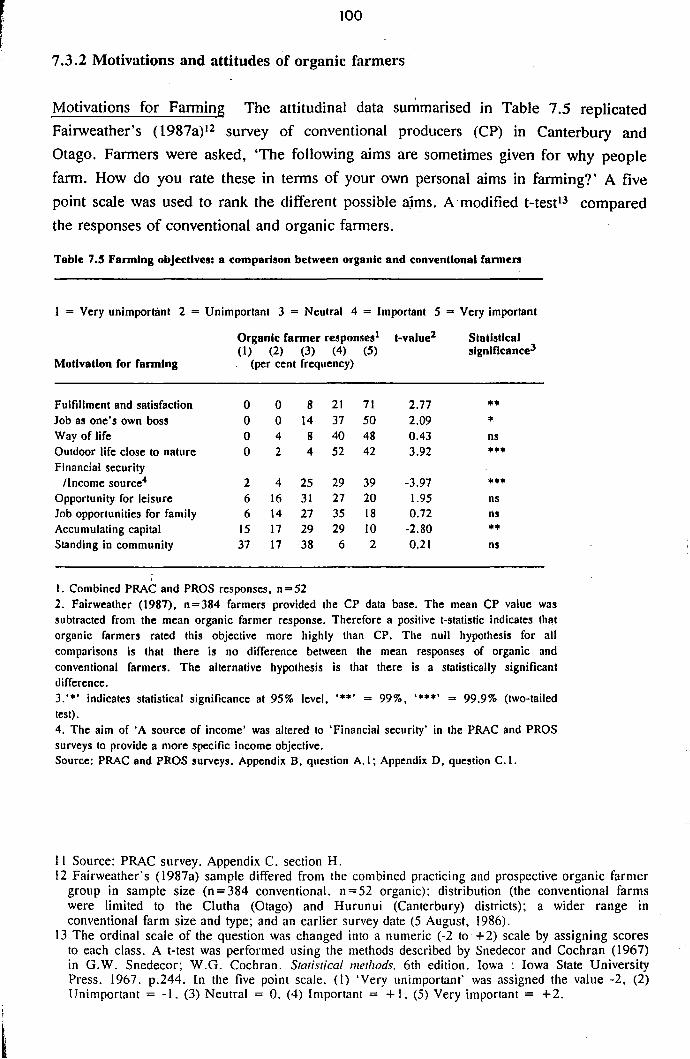
r f
100
7.3.2 Motivations and attitudes of organic farmers
Motivations for Fanning The attitudinal data summarised in Table 7.5 replicated Fairweather's (1987a)12 survey of conventional producers (CP) in Canterbury and Otago. Fanners were asked, 'The following aims are sometimes given for why people farm. How do you rate these in tenns of your own personal aims in farming?' A five point scale was used to rank the different possible ajms. A "modified t-test13 compared the responses of conventional and organic fanners.
Table 7.S Fanning objectives: a comparison between organic and conventional ranners
I = Very unimportimt 2 = Unimportant 3 = Neutral 4 = Important 5 = Very important
Organic ranner responses I t-value2 Statistical (I) (2) (3) (4) (5) slgnlficanceJ
Motivation ror fanning (per cent frequency)
Fulfillment and satisfaction 0 0 8 21 71 2.77 •• Job as one's own boss 0 0 14 37 50 2.09 • Way of life 0 4 8 40 48 0.43 ns Outdoor life close to nature 0 2 4 52 42 3.92 ••• Financial security
IIncome source4 2 4 25 29 39 -3.97 ••• Opportunity for leisure 6 16 31 27 20 1.95 ns Job opportunities for family 6 14 27 35 18 0.72 ns Accumulating capital 15 17 29 29 10 -2.80 •• Standing in community 37 17 38 6 2 0.21 ns
I. Combined PRAC and PROS responses, n = 52 2. Fairweather (1987). n=384 farmers provided the CP data base. The mean CP value was subtracted from the mean organic farmer response. Therefore a positive t-statistic indicates that organic farmers rated this objective more highly than CPo The null hypothesis for all comparisons is that there is no difference between the mean responses of organic and conventional farmers. The alternative hypothesis is that there is a statistically significant difference. 3,'·' indicates statistical significance at 95% level, ••• ' = 99% •••••• = 99.9% (two-tailed test). 4. The aim of 'A source of income' was altered to 'Financial security' in the PRAC and PROS surveys to provide a more specific income objective. Source: PRAC and PROS surveys. Appendix B. question A.I; Appendix D. question C.I.
II Source: PRAC survey. Appendix C. section H. 12 Fairweather's (l987a) sample differed from the combined practicing and prospective organic farmer
group in sample size (n=384 conventional. n=52 organic): distribution (the conventional farms were limited to the Clutha (Otago) and Hurunui (Canterbury) districts); a wider range in conventional farm size and type; and an earlier survey date (5 August. 1986).
13 The ordinal scale of the question was changed into a numeric (-2 to +2) scale by assigning scores to each class. A t-test was performed using the methods described by Snedecor and Cochran (1967) in G.W. Snedecor; W.G. Cochran. Statistical methods. 6th edition. Iowa: Iowa State University Press. 1967. p.244. In the five point scale. (I) 'Very unimportant' was assigned the value -2. (2) Unimportant = -I. (3) Neutral = O. (4) Important = + I. (5) Very important = +2.

101
The practicing and prospective organic fanners considered personal objectives including personal fulfi11ment, independence, and an outdoors way of life more imporhmt than financial gain and social status. The organic fanners also rated non-financial objectives, except for 'A way of life' higher than CPo They did not place as much emphasis on financial considerations, although the difference in questionnaire design was a confounding variable. These results supported hypothesis (4) in section 7.2 that -organic fanners are motivated more by non-financial concerns than CPo Because both the conventional and combined prospective and practicing organic fanners rated social standing as having little importance, there was no statistical difference between the two samples. The null hypothesis (that there was no difference in the average importance placed on social standing by the two samples) therefore cannot be rejected.
Reasons for choosing organic farming In this part of the chapter, the reasons why farmers chose OF are identified, and the hypothesis that financial motivations for adopting OF are more important for PROS than PRAC is tested. Farmers' reasons for choosing OF were analysed in several ways. The case studies provided in-depth examples of the factors contributing to the adoption decision. Survey respondents were asked to rate a series of statements and to identify the main advantages of organic fanning for their farms. Producers also indicated why they were interested in organic, bio-dynamic, or low-input farming.
The case studies (Appendix F) illustrate in richer detail many of the themes identified by the survey. The initial stimulus for change differed between farmers, for example a negative experience with pesticides versus a growing philosophical commitment to a holistic way of life. The four PRAC also perceived a need to change from CF, for reasons such as the perceived environmental impacts of farm practices. The motivations and philosophies of these four farmers, their backgrounds and social interactions show the features which make organic farmers both distinctive and vatiable. The case studies include examples of the three main motivation types that were also suggested by the survey methods: a concern for the soil and the link between health rmd nutrition, a personal holistic philosophy. and an extension of a low-input farming style (a mixture of personal and financial factors). For the three established Canterbury organic farmers, philosophical and personal considerations were of oveniding importance in their choice of organic farming. The motivations of the transitional organic fanner were primarily soil-related and. for him. the adoption of organic farming was a management, rather than a personal decision. This farmer was also more integrated into the conventional farming community than the earlier adopters. Once the decision was made to adopt OF, the producers were committed to change, and 'barriers' were viewed as challenges rather than insurmountable obstacles.
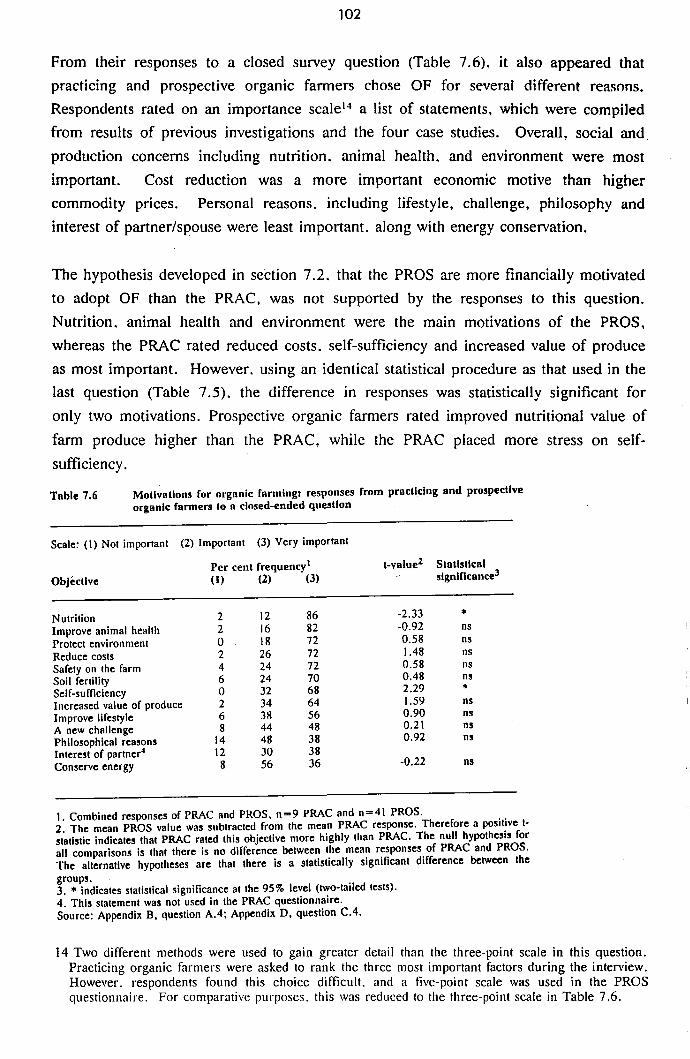
102
From their responses to a closed survey question (Table 7.6), it also appeared that practicing and prospective organic farmers chose OF for several different reasons. Respondents rated on an importance scale l4 a list of statements, which were compiled from results of previous investigations and the four case studies. Overall, social and, production concerns including nutrition. animal health. and environment were most important. Cost reduction was a more important economic motive than higher commodity prices. Personal reasons. including lifestyle, challenge, philosophy and interest of partner/spouse were least important. along with energy conservation.
The hypothesis developed in section 7.2. that the PROS are more financially motivated to adopt OF than the PRAC, was not supported by the responses to this question. Nutrition. animal health and environment were the main motivations of the PROS. whereas the PRAC rated reduced costs. self-sufficiency and increased value of produce as most important. However. using an identical statistical procedure as that used in the last question (Table 7.5). the difference in responses was statistically significant for only two motivations. Prospective organic farmers rated improved nutritional value of farm produce higher than the PRAC, while the PRAC placed more stress on self-sufficiency.
Table 7.6 Motivations for organic farming: responses from practicing and prospective organic farmers to a closed-ended question
Scale: (I) Not important (2) Important (3) Very important
Per cent frequency· t-value2 Statistical Objective (I) (2) (3) slgnlficance3
2 12 86 -2.33 • Nutrition Improve animal health 2 16 82 -0.92 ns Protect environment 0 18 72 0.58 ns Reduce costs 2 26 72 1048 ns Safety on the farm 4 24 72 0.58 ns Soil fertility 6 24 70 0048 ns
32 68 2.29 • Sel f-su fliciency 0 Increased value of produce 2 34 64 1.59 ns Improve lifestyle 6 38 56 0.90 ns A new challenge 8 44 48 0.21 ns Philosophical reasons 14 48 38 0.92 ns Interest of partner4 12 30 38 Conserve energy 8 56 36 -0.22 ns
1. Combined responses of PRAC and PROS. n=9 PRAC and n=41 PROS. . . 2. The mean PROS value was subtracted from the mean PRAC response. Therefore a poSlt!ve t-statistic indicates that PRAC rated this objective more highly than PRAC. The null hypotheSIS for all comparisons is that there is no difference between the mean responses of PRAC and PROS. The alternative hypotheses are that there is a statistically significant difference between the groups. . 3 .• indicates statistical significance at the 95% level (two-tailed tests). 4. This statement was not used in the PRAC questionnaire. Source: Appendix B. question AA; Appendix D. question CA.
14 Two different methods were used to gain greater detail than the three-point scale in this question. Practicing organic farmers were asked to rank the three most important factors during the interview. However. respondents found this choice difficult. and a five-point scale was used in the PROS questionnaire. For comparative purposes. this was reduced to the three-point scale in Table 7.6.
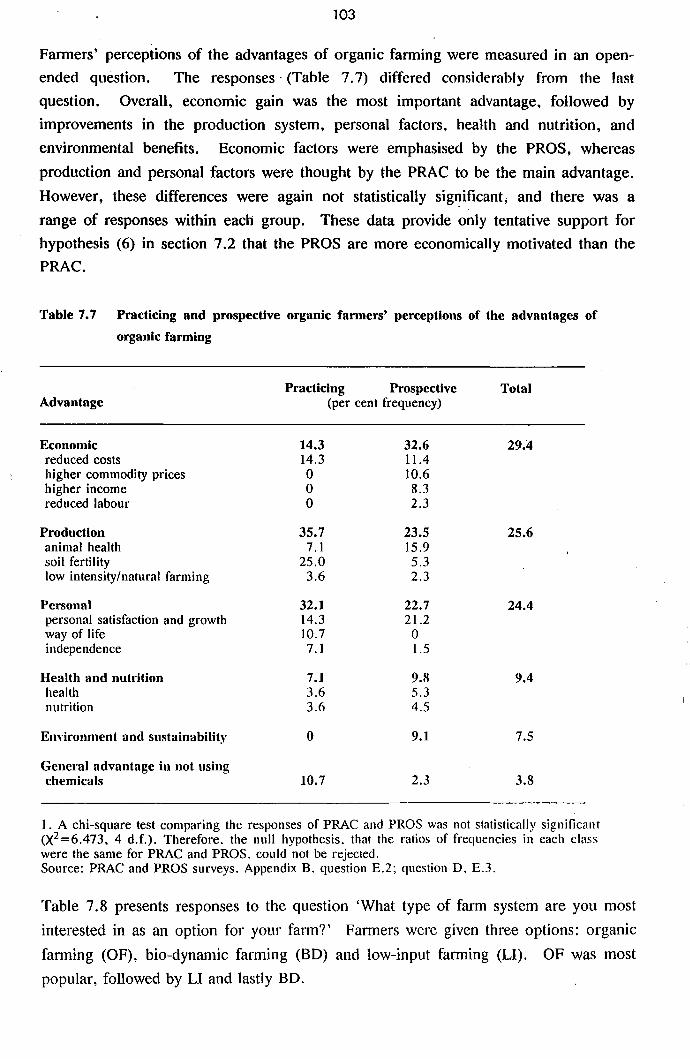
103
Fanners' perceptions of the advantages of organic fanning were measured in an open-ended question. The responses' (Tahle 7.7) differed considerahly from the last question. Overall, economic gain was the most important advantage, followed by improvements in the production system, personal factors, health and nutrition, and environmental benefits. Economic factors were emphasised by the PROS, whereas production and personal factors were thought by the PRAC to be the main advantage. However, these differences were again not statistically sig~ificant; and there was a range of responses within each group. These data provide only tentative support for hypothesis (6) in section 7.2 that the PROS are more economically motivated than the PRAC.
Table 7.7 Practicing and prospective organic farmers' perceptions of the advantages of organic farming
Practicing Prospective Total Advantage (per cent frequency)
Economic 14.3 32.6 29.4 reduced costs 14.3 11.4 higher commodity prices 0 10.6 higher income 0 8.3 reduced labour 0 2.3
Production 35.7 23.5 25.6 animal health 7.1 15.9 soil fertility 25.0 5.3 low intensity/natural farming 3.6 2.3
Personal 32.1 22.7 24.4 personal satisfaction and growth 14.3 21.2 way of life 10.7 0 independence 7.1 1.5
Health and nutrition 7.1 9.8 9.4 health 3.6 5.3 nutrition 3.6 4.5
Em'ironment and sustainability 0 9.1 7.5
General advantage in not using chemicals 10.7 2.3 3.8
1. A chi-square test comparing the responses of PRAC and PROS was not statistically significant (X2=6.473, 4 d.£.). Therefore. the null hypothesis. that the ratios of frequencies in each class were the same for PRAC and PROS. could not be rejected. Source: PRAC and PROS surveys. Appendix B. question E.2; question D, E.3.
Table 7.8 presents responses to the question 'What type of farm system are you most interested in as an option for your fmm?' Fanners were given three options: organic farming (OF), bio-dynamic farming (BD) and low-input farming (LI). OF was most popular, followed by LI and lastly BD.

104
Table 7.8 The type of fann system aimed for by practicing and prospective organic farmers
Organic Bio-Dynamic Other n Fanner group: (per cent frequency)
Practicing 38.5 15.4 46.2 13 Prospective 46.3 22.0 31.7 41 Total 44.4 20.4 35.2 54
t. These two farmers described their system as 'sustainable bio-dynamic' 2. Mainly low-input farming, but also including 'sustainable agriculture' and 'low-input organic' . 3. Aside from two farmers who were interested in 'sustainable agriculture', the remaining PROS in the 'other' class were principally livestock farmers wanting to achieve a low-input system. Source: PRAC and PROS survey. Appendix C, question E.2; Appendix D, question C.2.
Livestock farmers were principally interested in LI, which does not strictly exclude chemical inputs, because of anticipated problems with animal health and tree establishment, limited organic markets for animal products, and financial constraints on diversifying into a totally new farm system. Low-input agriculture was also more compatible with the values of some farmers. One respondent wrote, 'I am an enthusiastic Christian. The "Natural Way as Created" lends itself very well to our ideals. 1 haven't studied Steiner, but astrology and potions are not biblically acceptable. '
There was a stepwise progression from LI to OF and, sometimes, to what one farmer referred to as the Rolls Royce of alternative agriculture, BD. LI was viewed as a useful interim system, and parts of the three technologies were not considered to be incompatible. As well, OF and BD methods were sometimes first tried in the family vegetable garden and then expanded from the consumer pati of the farm, the household, to the main productive area. Bio-dynamics was chosen by some respondents because of its holistic, whole system approach which applied to both personal growth and production techniques. and the higher premium ayaiJable (In Demet~r produce. The Bio-Dynamic Farming and Gardening AssociatiQn was also thought by some producers to be highly efficient. and oriented towards farming rather than production standards. which was a criticism of the Biological Producers Council. A further attraction of BD was the range of methods. in which several farmers had complete faith. These practices were described by one PROS as a 'full range of weapons'.
105
7.3.3 Perceived barriers
Several questions' were asked to eHcit information about farmers' perceptions of
barriers. In one question, respondents were asked to identify the main disadvantages
and problems of organic farming for their properties. Practicing organic farmers were
also asked to suggest why so few producers have so far adopted OF. The likelihood
that the PROS would adopt OF in the next three years also provided information about
perceived barriers.'
Practicing organic farmers were asked to describe the main problems and difficulties
they were currently experiencing under OF, and PROS were queried about the main
disadvantages of adopting OF on their properties. The responses are summarised in
Table 7.9. Economic factors were most frequently cited as problems with OF, followed
by production difficulties, fisk and uncertainty, and the transition period. The
perceived problems differed between practicing and prospective organic farmers to a
statistically significant degree. Risk and uncertainty were not viewed as major problems
by the PRAC, who tended to undertake their own experimentation, did not rely on fann
advisors, and were confident that OF was feasible. Instead, specific production
problems were cited by the PRAC, particularly animal health and weed control.
Having already converted to OF, the transition period was not viewed as a major
barrier. In contrast, the PROS also had considerable reservations about the economic
and technical feasibility, transition period, and risk and uncertainty of the system.
Prospective organic farmers also anticipated increased labour demand would be a
problem, whereas the PRAC were largely able to meet additional labour requirements
from unpaid sources such as voluntary student labour.

106
Table 7.9 Practicing and prospective organic farmers' perceptions of the main problems and disadvantages of organic farming
Disadvantage
Production animal health and welfare. especially parasite control
other aspects of pest control. especially weeds
maintaining soil fertility buying in stock feed
Economic drop in yields. especially initially drop in income. especially initially marketing increased labour demand
Transition retraining. new skills capital outlay. including cost of new pasture
length of transition
Risk and uncertainty lack of information risky and uncertain markets
Social intolerance
Practicing 1 Prospective2
(per cent frequency)
63.6 30.1
31.8 10.7
27.2 14.6 4.5 3.9 0 1.0
27.2 46.6 4.5 16.5
13.6 11.7 9.1 6.8 0 11.7
4.5 10.7 4.5 3.9
0 3.9 0 2.9
4.5 10.7 4.5 3.9 0 6.8
0 1.9
1. 'Problems or difficulties' of organic farming. n=9 respondents 2. 'Disadvantages' of converting to organic farming, n=39 respondents
Total
33.9
44.6
9.9
9.9
1.7
3. A chi-square test comparing the frequencies in Table 7.14 returned a significant result at the 95% level (X2=9.998. 3 d.f.). Source: PRAC and PROS surveys. Appendix B. question E.3; Appendix ~, question E.4.
A related open-ended question asked the PRAC why they thought so few Canterbury fanners had adopted OF (Table 7.10). Practicing organic fanners had considerable exposure to the opinions of other producers through field days. talks. and daily contact. The ovelwhelming belief was that, particularly in the CUtTent economic climate. producers were unwilling and, in many cases, unable to risk trying an innovation which has considerable 'uncertainty and a generally negative image' among farmers. Stronger marketing, market growth, and market incentives such as assured ptices with' prompt payments were advocated by three· fmmers as solutions for these batTiers. MAF and
. . Lincoln College involvement in education, resea1"ch and providing information was suggested by the five PRAC. One fanner thought a change in the press and public image of organic fanning would also help the industry. However, the PRAC varied in their opinion of how desirable an expansion of organic farming was likely to be. Several producers were concerned that a rapid influx of new, financial~y motivated organic farmers

107
would lead to a decHne in standards and oversupply of limited domestic markets. To other producers, expansion of the industry was viewed as a positive development.
Table 7.10 Reasons why practicing organic farmers thought few Canterbury farmers currently use organic methods.
Barrier to adoption
new and risky, farmers too conservative unproven or difficult Markets a lack of information little desire to change a lack of confidence that organic farming is viable
higher labour requirement viewed as too low-technology viewed as too idealistic 'long hair and beads' image
Source: PRAC survey. Appendix B, question E.5
Per cent frequency (n=l1)
30 15 15 10
10 5 5 5 5
Prospective organic farmers estimated the likelihood that they would adopt OF in the next three years (Table 7.11). Only 27% of the farmers were unlikely to change in this time, and no respondents definitely would not convert. However, in response to another question,I5 only 29% of farmers had applied for Bio Gro certification. Farmers expressed considerable reservations about such a change, including technical difficulties, which were mentioned by seven farmers; markets (six fanners), 'If a sustainable market was there with prompt payments I would definitely convert.'; the current economic situation, which increased farm debt and caused some farmers to be risk-averse (six farmers), 'Farming is only just viable using every resource and trick I know, without experimenting with new systems or cutting out some of my available methods. " ' ... due to the farming climate we may not be here in three years time.': and a lack of information and general uncertainty (six fmmers).
] 5 Appendix D, question D. 3.

Table 7.11
108
The likelihood that prospective organic farmers would convert to organic farming in the next three years
Likelihood of adopting
Don't Know Definitely Will Not Very Unlikely Not Likely Likely Highly Likely Definitely Will Convert
Per cent frequency (n=41)
17.1 o 9.8
17.1 14.6 19.5 22.0
Source PROS survey. Appendix D, question C.3. J
Prospective organic farmers' perceptions of organic farming The above data suggest that the PROS perceived a range of advantages and disadvantages of organic farming. Because prospective organic farmers' perceptions of organic farming played a significant role in their decision to adopt, this aspect of adoption was investigated in the postal questionnaire. Respondents were queried about the expected time required for conversion, anticipated changes in performance during the first three seasons, and required changes to farm practices. These variables were measures of the perceived costs and benefits of conversion (for example a long time period would be a barrier; reduced farm costs an incentive). The results are included in Appendix G.
In summary, the PROS appeared to have a realistic expectation of the consequences of adopting OF on their farms. The majority (53.7 %) of respondents expected it would take between two and five years to convert their farms to a fully productive OF system (Appendix G,Table G. J). Expected changes in performance (Appendix G, Table G.2) were similar to those reported by the PRAC in Chapter 6, Table 6.1. Most of the
, PROS predicted little change in the net income. and slightly lower gros<; snles and fnrm
production costs. In addition, most respondents did not expect dramatic changes in I hl' level of pest control, and animal production per stock unit. and slight decreases in crop yields and pasture production. Table G.3 in Appendix G shows that a large proportion of f81mers intended to diversify their f81m systems. reduce stocking rates and change the crop rotation if chemical inputs were removed. These changes were identical to those undergone on most Canterbury organic farms, which were described in Chapter 5.

109
7.4 SUMMARY
In this chapter, several questions about organic farmers and their perceptions were
addressed: 'How db practicing organic farmers differ from the new wave of interested
producers, and from farmers generally?' 'What are the key motivations for farmers'
interest in OF?' 'How do farmers perceive OF?' 'What are the main perceived
obstacles to adopting and implementing OF?'. In general, the results of the practicing
(PRAC) and prospective (PROS) organic farmer surveys were similar to past research.
Farmers who adopted or were likely to adopt OF shared several characteristics with
farmers generally. These included a similar age and a dominance of owner-operated
family farm arrangements. Practicing organic farmers came from Canterbury rural
backgrounds, and both practicing and prospective organic farmers included a range of
ages and levels of farming experience, with an average 20 years farming experience.
The practicing and prospective farmers were variable and did not indicate that OF is
restricted to a highly limited range of situations or type of farmer. However, several
differences were identified between producers inclined towards OF and farmers
generally. These were:
(1) A higher average level of education among organic farmers, although OF was certainly not restricted to well-educated individuals.
(2) A smaller than average farm size, although again the practicing and prospective organic farmers included a wide range of farm sizes.
(3) A predominance of mixed crop and livestock farms, rather than single species production systems. presumably due to the economic and technical advantages of mixed OF.
(4) Greater contact with other members of the OF industry, including other PRAC and change agents such as organic fertiliser salespeople.
(5) Previous experience \\'ith low-input or soil conservation practices. which are two
aspects of the OF technology.
(6) Greater emphasis on non-financial farming objectives such as independence and personal fulfillment.
(7) The perceived need for a change from conventional farming (CF). A variety of reasons were cited. including the cost structure of CF. public costs such as soil erosion and pesticide pollution, and the need for a holistic and/or chemical-free production system.
(8) The perception that removing chemical inputs and replacing them with OF practices is
a feasible alternative to CF.

One hypothesis of the adoption-diffusion model is that innovative farmers have different
socio-economic characteristics compared with later adopters. However. the PROS
shared similar socio-economic features with the PRAC. The survey results did not
suggest a departure from the present characteristics of organic farmers. In fact, the
notable feature of the PROS group was its variability in farm size and type, age and
experience. Prospective organic farmers had a higher average level of education and
included a larger number of livestock-only farms compared with the PRAC.
The decision to adopt OF was made for a wide range of reasons, and the initial stimuli
and motivations varied considerably between farmers. Economic, ' technical,
environmental, personal and health reasons were all important to the innovation
decision, and OF was not seen as either a purely financial or environmental innovation.
Among other images, OF was viewed as a more profitable low-input system, an
environmental and healthy alternative, and a personally satisfying and challenging
option. Improvements in animal health and soil fertility were considered to be the
main technical benefits, however difficulties with both of these factors were anticipated
or experienced by many farmers. Cost savings were viewed as slightly more important
than increased commodity prices, however both were required to raise income levels
and induce many farmers to change.
It has been suggested that New Zealand producers are now primarily interested in OF
as a commercial innovation, and that environmental and other non-financial motivations
are irrelevant (Lacy, 1986). The hypothesis that the PROS were more interested in OF
for economic reasons than the PRAC was not clearly supported by the survey results.
The case studies (Appendix F) showed that philosophical motivations were of
overwhelming importance to established organic farmers, and in the case of the
transitional farmer the innovation decision was more management-based. In an open
ended question on the perceived advantages of organic I farming, the PROS rated
economic factors more highly than the PRAC. However, the PROS did not anticipate
that major improvements in net farm income would result from adopting OF. This
result did not suggest a profit motive for the PROS. Furthermore. in response to a
closed-ended question, the PRAC placed slightly more emphasis on financial concerns
than the PROS. It was possible that faImers misread this question as 'What are the
characteristics of organic or bio-dynamic farming?'. rather than 'What are the reasons
for your interest?'. Considerable potential for questionnaire bias existed in the closed
question, and a three-point scale may have been insufficient to identify differences in
responses. What was clear from the survey was that the image of organic farming and
the adoption decision will probably continue to be many-sided, rather than purely
philosophical or financial.

111
A significant proportion of farmers expressed an interest in low-input/sustainable farm
systems. in addition to OF and BD. Low-inpl1t farming had fewer perceived pest
control, social and financial disadvantages, but still aimed to reduce capital
expenditure. The inability to fetch higher commodity prices under a low-input system
was of little significance for wool farmers, because at present no organic wool market
exists. Perceived social and economic barriers increased along the spectrum from low
input ... organic farming ... bio-dynamics. While BD was viewed as the ultimate system
by some farmers, it was incompatible with the religious beliefs of others. For some
PROS, both OF and BD still had a 'long hair and beads' image. However, according
to survey results, social status was of little significance to the practicing organic,
prospective organic, or conventional farmers.
When it comes to adoption behaviour, according to the adoption-diffusion model,
farmer perceptions of an innovation are most important. Several perceived barriers to
adopting and implementing OF were identified by the surveys. According to practicing
organic farmers, the present agricu1tural setting, and the precarious situations of many
fanners has led many producers to be highly risk-averse. They are consequently
unwilling and/or unable to invest in diversification into OF. Several PROS appeared to
question the technical and economic feasibility of organic farming and viewed it as a
risky and uncertain option. The main anticipated production problems cited by the
PROS were animal health and weed control. Perceived economic problems included
the impacts on yield and income, labour demand, and uncertain markets for organic
produce. The capital outlay and period of lost income initially was also perceived to be
disadvantages. Only 29% of the PROS had applied for Bio Gro certification. The
main factors which deterred the PROS from adopting the technology were perceived
technical difficulties (17.1 % of respondents), current economic conditions and the
resulting rise in farm debt and risk-avoiding behaviour (14.6%), uncertainty of markets I
(14.6 %) and a lack of information (14.6 % ). This result suggests that expansion of the
supply of organic produce is likely to be gradual. at least over the next two years.
because of the time required to change production systems.
In contrast, once farmers decided to adopt OF. they usually became fully committed to
the change. Changes in animal health. weed control and net income were problems
experienced by the PRAC. However. unless these factors actually threatened the
viability of the farm, they were viewed as challenges or difficulties rather than major
barriers to implementing OF.
Several possible remedies to these perceived barriers were advocated by some PRAC.
Market promotion would reduce the risk of oversupply, and the guarantee of more

112
secure payments for produce would reduce the risk of producing unorthodox crops such
as amaranthus. A further suggestion was increased research to overcome the
production and economic problems experienced by the PRAC. It was suggested that by
supplying information about OF to producers general1y, the widepread perception of
organic farming as a high-risk innovation would change. It is important to note,
however, that several PRAC considered that rapid expansion of organic farming could
lead to oversupply to limited domestic markets and a drop in production standards.

113
CHAPTER 8. THE FARM DECISION·MAKING ENVIRONMENT
8.1 Introduction
8.2 Economic conditions
8.3 Technological developments
8.4 Sociological factors
8.5 Summary
8.1 INTRODUCTION
The rise in interest in organic farming (OF) since the early 1980's can not be attributed
to advances in OF practices, nor to attitudinal changes in farmers. It is perhaps more
correct1y seen as a response to developments in the social, technical and economic
environment in which farmers make decisions. In the last four years New Zealand
agriculture has responded rapidly to changing prices, increased exposure to market
forces, and general financial hardship. These and other factors, for example the
development of genetic engineering technologies, the continuing interest in 'hobby
farming', and pest resistance to agrochemicals have a major effect on farmer behaviour
and technological change.
An individual farmer considering whether to adopt OF makes the decision in a dynamic
socio-economic setting. As only one of many producers and members of society, the
farmer exerts little influence on the outside world. He or she must therefore treat
market, institutional, social and ecological conditions as constraints within which
personal objectives must be met.
In this chapter, an attempt is made to isolate different aspects of the farm decision
making environment that are likely to affect adoption decisions. These environmental
factors are divided for conceptual simplicity into economic. technical. ecologic[tl and
social categories, although they are in practice interconnected. The induced innovalioll
model is applied to explain the effects of changing farm input and commodity markets
in section 8.2. M. Olson's (1971) theory of group behaviour is applied to the
formation of a centralised OF producer board. In the next section. technological
developments such as the evolution of new arable farming techniques are discussed.
Sociological factors (section 8.4) are also examined. The final section summarises the
main features of the decision-making environment and their influence on OF adoption.

114
8.2 ECONOMIC CONDITIONS
In this section, the influence of commodity and farm input markets on the the future of (
organic farming is considered. An expanded OF industry is largely dependent on access to sizeable, lasting and premium-priced markets. However, a number of marketing obstacles exist, and decisions. have yet to be made regarding a marketing strategy for the industry. These issues are addressed in part 8.2{1. The induced innovation model predicts that high commodity prices for organic produce and/or a rise in chemical costs relative to land and labour would induce farmers to adopt OF. The influence of current economic trends is discussed in part 8.2.2.
8.2.1 Markets for organic produce
The current state of conventional commodity markets provides an incentive to diversify into OF. New Zealand red meat and other products face falling commodity prices (Easton, 1987), deregulation, shrinking export quotas, and import restrictions such as the recent banning of beef hormones by the European Economic Community. In contrast, demand for organic produce is growing and the market is currently undersuppJied (Horticultural Market Research Unit (HMRU), 1986). However, several issues remain unresolved concerning organic product markets. Little information is available on the current marketing situation. In this section, organic markets are examined in some detail, drawing upon original research and market surveys in New Zealand and overseas (Alvensleben, 1981; Alvensleben and Altmann, 1986; FDA Consumer July-August 1986; Elm Farm Research Centre (EFRC), 1986; HMRU, 1986; Lamb, 1988; Meat and Livestock Commission (MLC), 1987; Soil and Health, Winter 1988; Werner and Alvensleben, 1984).
The price premium and market size For the most part, the price premium for organic produce is a simple consequence of demand exceeding supply (EFRC. I QRr, L
Therefore, unless demand for organic produce grows faster than an increase in supply. the price for organic produce will decline. This suggests that if producers are to be encouraged to adopt OF, then market promotion would also be required. In the United 1 Kingdom, the EFRC (1986) found that organic vegetables usually returned a higher premium (50-100%) than cereal crops (20-35%), which in tum exceeded other plant and animal-based products. Prices tended to remain more constant throughout the year than conventional markets, however local markets could rapidly become oversupplied and cause the premium to tail off.

115
In Canterbury, 20% is a typical organic wheat premium; 10% is usual for other crops '\ . (J. Manhire,pers. comm.). In general, Canterbury organic producers found that outlets offering very high prices to producers were less reliable at paying their accounts. Second 'grade produce was sold for a sman premium as organic chicken feed. Flour typically retailed for 100% higher than conventional prices, and meat products were sold at a 20% premium. Premiums were collected at each link in the marketing and processing chain, and direct marketing of added value products was employed by Canterbury organic producers.
The lack of information about organic markets, including market size and consumer preferences, limits the ability of the OF industry to target specific products and consumer groups. This strongly indicates a need for market research. In most Western countries, organic markets are below one per cent of fresh produce sales, and less for processed goods and meat. However, while 10 % has been widely quoted as a potential market size for organic produce (for example HMRU, 1986), the market has yet to be quantified. Preliminary market research suggests that less than one per cent of j Christchurch consumers actively seek out organic food (c. Lamb, pers. comm.). Market size is dynamic, and is affected by factors such as personal attitudes and product availability. The market for organic produce is growing by up to 50% a year in some countries, and the U.S.A, U.K., European Community and Japan are potential markets for New Zealand organic producers (HMRU, 1986).
The small market for organic animal products is likely to reduce the profitability of organic farming in Canterbury, because livestock are an integral part in all of the
\
region's organic cereal cropping farms. [n Canterbury, the market for organically ) produced fibres such as wool and leather was insignificant, and the organic meat market was very small. Hyperallergenic consumers present a possible market for organic wool, and one New Zealand producer exported bio-dynamically grown wool to the United States. The Meat and Livestock Commission (MLC) (1987) did not expect the market share for alternative meat products in the United Kingdom to exceed 0.1 cr;. by 1002. and other consumer surveys show low consumption of organic meat among organic food buyers (for example Werner and Alvensleben. 1984). A recent market survey of Christchurch households (Lamb. 1987) found that while 29% of meat eaters considered that the health aspect of eating meat was important. their response appeared to be reduced meat intake, rather than a change to organic products. One possible reason for the lack of demand is widespread vegetarianism among health-conscious, 'alternative' consumers. Another is the downward trend in the red meat market and an increase in poultry and fish consumption (FDA Consumer July-August 1986). Unless organic meat could be successfully marketed as a 'healthy' product, such as 'low-fat, tender' lamb, a

116
major change in consumer perception would be required for the organic meat market to expand. Influencing levels of demand is more difficult and expensive than servicing existing markets or promoting a brand name (Brodie and Ameyde, 1987).
For Canterbury cereal foods, the major demand both domestically and overseas appeared to be for bulk orders to large processing, distribution and retailing companies. However, because of the current fragmentation of the producer industry, large orders and guarantees of continuity of supply could not be met. Canterbury producers instead competed for small domestic orders. Consequently, several producers were forced to sell a large proportion of organic grain on the conventional market. Despite interest from supermarkets, sales of organic produce were mainly limited to specialist health food shops. In addition. promotion of organic farming was limited to voluntary organisations such as the Soil and Health Association. This situation indicates that a need exists for improved coordination of production and marketing activities, possibly in the form of a centralised marketing, agency.
Marketing infrastructure A decision to be faced by the OF industry is wheth.er an organic producers marketing board should be established. Alternative institutional arrangements include an expansion of the Biological Producers Council (BPC). a greater role for a private company such as New Zealand Bio Grains Ltd., 1 or increased I Ministry of Agriculture and Fisheries (MAF) involvement. The MAF has already instigated a venture to export organic Konini wheat to Europe. Advantages of centralised marketing could include the pooling of produce between fanns and improved continuity of supply; improved coordination between different sectors of the industry. such as producers and processors; reductions in faIm input, processing, marketing and distribution costs; and market promotion. An earlier chapter (Chapter 4, section 4.2.2) also identified the BPC organisational structure as a constraint to the expansion of organic farming. A change from the present semi-voluntary structure of the BPC would be required in an expanded OF industry to meet increased greater administrative demands. the need for standardised quality control. and to coordinnte marketing and other activities.
Assuming that a centralised producer body is viewed as a positive development. it is likely that public funding would initiaJly be required to establish such an organisation. Mancur Olson's The Logic of CoJlective Action (M. Olson. 1971) provides insights into the behaviour of farmer groups. M. Olson (1971) viewed individuals as rational, utility-maximising actors who essentially join groups for their own private benefit, rather than for the good of the group itself or the wider pUblic. For example, a farmer
1 New Zealand Bio Grains Ltd. is a processing, marketing and distribution cooperative owned by six organic. farmers and an entrepreneur, which is based in Ashburton.
117
is more 1ikely to join a group which offers members cheaper fertiliser (a private benefit) than a group which lobbies government on behalf of farmers generally (a public benefit). According to M. Olson (1971), three obstacles exist to establishing a farmer group. These are: (1) the free rider problem (if a person does not have to join) the group to get group benefits, then why should he or she bother joining); (2) the inconsequentiality problem (as an individual, each person's contribution to the group is insignificant, so why bother); and the organising problem (the costs of organising large groups are considerable, and create a hurdle that must be jumped before any of the collective benefits can be obtained) (Mitchell, 1979). These problems create significant obstacles to farmers spontaneously organising themselves into a centralised marketing organisation. It is therefore likely that a publicly funded initiative from an organisation such as the MAF would necessary to establish a central marketing body. However, resistance to centralisation is likely from some organic producers who value their independence, and from established producers who already service loyal consumer markets. From discussions with organic producers, it was apparent that producers are likely to resist changes in the industry which reduce their control over decision-making. Therefore, a joint BPC and MAF strategy which aimed principal1y to improve coordination of production, processing, distribution and retailing facilities is less likely to be resisted than an independent MAF attempt to centralise the industry.
Consumer attitudes and behaviour One feature of organic markets is that two different consumer groups are significant, both of which present marketing challenges. The first group consists of consumers who regularly buy organic produce and value organic food for a complex of different reasons. 2 Consumption of organic food by this group is limited more by availability than price. Certain values which this market associates with organic food create barriers to supply. These include a preference for locally-grown produce, resistance to fumigation and deep-freezing of imported foodstuffs, a preference for unprocessed goods and avoidance of certain processing techniques such as irradiation, vegetarianism, resistance to big-business involvement, and concern about how the food is distributed.
The second market group has less rigorous product specifications. ancl is therefore easier to supply. but it is less willing to pay a higher price for organic produce than the first group. This market is composed of the significant and growing) proportion of
2 Refer to the HMRU (1986) report for a description of the typical consumer of organic food. 3 Among consumers generally, ' ... foods which can make health-related claims represent the only
growth area at present in the [United Kingdom] food market.' (HMRU, 1986, p.75). However, for 85% of the U.K. population, health considerations are secondary to other considerations such as taste in deciding which foods to purchase (Winwood, 1987). Winwood (1987) concluded that few people regard additives and pesticides as sufficiently important to affect buying behaviour, and other research suggests that the vitamin/mineral content, salt, sugar and fat contents are increasingly more important than additives and food processing among U.S. shoppers (FDA Consumer July-August 1986). This suggests that the 'healthy' food market is also a specific target group of consumers.

118
consumers who rarely or never buy organic produce, but who have a simple and often I i11-defined preference for 'healthy' food. They are most concerned with chemicals which become newsworthy issues, such as growth hormones and DDT. The quality demands of these consumers may therefore be met by labelling of chemicals used in the production of foodstuffs, chemical residue tests of produce, and/or a less rigorous health grade than the Bio Gro Standard.
Organic standards Given that a market exists for produce which is low in chemicals, but is not truly 'organic', a central marketing decision is whether to produce a less rigorous grade than Bio Gro, for example the 'Conservation grade'.4 Such an intermediate position represents a compromise between conventional and IFOAM standards. Possible advantages of a 'Conservation grade' product approach are fewer barriers to production, reduced risk of pest losses, and greater compatibility with existing farming methods. 'Conservation grade' also provides a financial incentive to reduce chemical use, which could result in resource conservation, environmental benefits, and expansion of organic farming itself. Few conflicts of interest would arise for an agency marketing both Conservation grade and conventionally grown produce, because the Conservation system does not suggest that all chemicals are harmful. However, the lower premium (8% in the U.K.) limits the profitability of exporting Conservation grade food, and access to organic export markets may become restricted to IFOAM trademarks. The IFOAM is reportedly negotiating with the European Economic Community for exclusive control of organic food markets in Europe. If successful, all produce sold as 'organic', 'natural' or 'biological' would require IFOAM certification.5 However, the MLC (1987) considered that this eventuality was unlikely. This is a critically important factor to establish for the future of organic produce exports. In addition, resistance from some Bio Gro producers would be likely,6 and organic farmers' sales may be undercut by cheaper 'Conservation grade' produce. There is no infrastructure or brand name recognition for 'Conservation grade' in this country, and to launch a new standard would require additional promotion.
4 The 'Conservation grade' is described by the Guild of Conservation Food Producers as a controlled-input system which avoids the use of persistent residual agrochemicals and fertilisers (Cutting. 1986). The Guild stresses that the system is not organic. but can be used as a 'weaning' period for full conversion to chemical-free production. A restricted number of fertilisers. insecticides and herbicides, including MCPA, MCPB and glyphosate. are permitted. Fungicides are not permitted as seed dressings or foliar sprays, and residue tests are made of grain samples.
The sale and production of 'Conservation grade' produce is reportedly increasing in the United Kingdom and France (Cutting, 1986; MLC, 1987). At present, half of the alternative market for meat in the United Kingdom is for produce which has simply been grown without hormones, rather than organically grown, and the U.S. and France have similar low-chemical markets (MLC, 1987).
5 Bernward Geier, President of IFOAM, unpublished paper presented to the New Zealand Soil and Health Association annual conference, May 1988.
6 Refer to Chapter 4, Section 4.3

119
Conflicts of interest Resistance from conventional marketing agencies to the sale and promotion of organic produce was significant at both local and export levels. and was evidenced by opposition from the Kiwifruit Marketing Board to exports of organic kiwifruit (HMRU, 1986), and attempts by Canterbury producers to promote org~nic meat in Christchurch. Active promotion of organic produce based on raising the public perception of pesticide risks may jeopardise larger sales of conventional produce (MLC, 1987). However, the HMRU (1986) considered that the smaIt ~olume of organic produce would probably have an insignificant impact on the clean, green image promoted by conventional New Zealand exporters, and it may be possible to market organic food as a separate, alternative product.
Export markets Significant barriers exist to exporting organic produce. The United States, Europe, the United Kingdom and Japan were identified as potential organic export markets by the HMRU (1986).Vecause organic produce faces the same quota restrictions as conventional foodstuffs, alternative crops such as konini wheat which lack quota restrictions are more readily sold. These non-traditional crops also carry greater risk, because their conventional price is usually low. Freight costs are high, and both import restrictions and concern for cosmetic quality vary widely between markets (HMRU, 1986). New Zealand is a major supplier to the international market for most pastoral products, but it is an insignificant grain exporter. The current size of the total global organic meat market can only absorb a fraction of total NZ exports. In contrast the organic grain market could easily be swamped by major exporters such as Australia and the United States] The acreage of European farms in organic production is rapidly increasing, encouraged in some countries by government subsidisation. For example, from 1984 to 1987, the area in organic production in the United Kingdom doubled to 12,000 hectares, and 0.8% of the farm area in Switzerland is already farmed organically.7 [Unless New Zealand organic produce is promoted as the highest possible quality, it will compete directly with this large increase in production~
In contrast, domestic demand appears to be far greater than the entire sllr'r'ly "f
Canterbury organic wheat. if repoi·ted interest from processing outlets is accurate. G-he domestic market also has the advantage of being easier to supply: freight costs are lower, communication is easier. and fewer links in the marketing chain exist between producer and consumer. It has less risk and could be considered a transition to the later development of an exp0l1 industry J
7 Bernward Geier, President of IFOAM. Unpublished paper presented to the Soil and Health Association annual conference, May 1988.
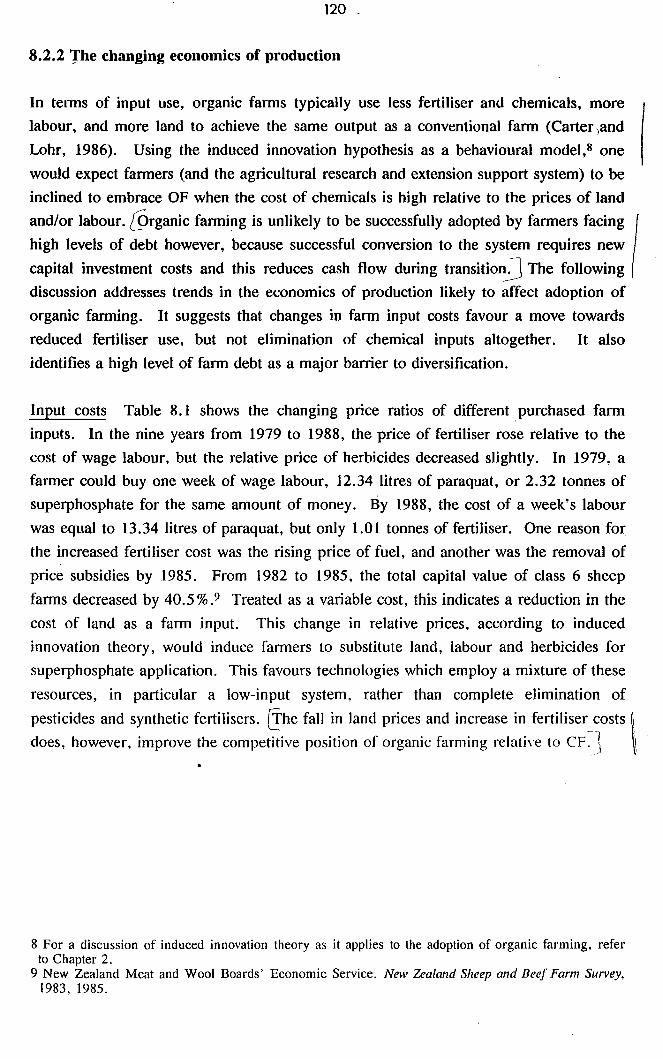
120
8.2.2 The changing economics of production
In terms of input use, organic farms typically use less fertiliser ami chemicals, more labour, and more land to achieve the same output as a conventional farm (Carter)and Lohr, 1986). Using the induced innovation hypothesis as a behavioural model,s one would expect farmers (and the agricultural research and extension support system) to be inclined to embrace OF when the cost of chemicals is high relative to the prices of land and/or labour. L9rganic farming is unlikely to be successfully adopted by farmers facing I high levels of debt however, because successful conversion to the system requires new . capital investment costs and this reduces cash flow during transitionJ The following discussion addresses trends in the economics of production likely to affect adoption of organic farming. It suggests that changes in farm input costs favour a move towards reduced fertiliser use, but not elimination of chemical inputs altogether. It also identifies a high level of farm debt as a major barrier to diversification.
Input costs Table 8.1 shows the changing price ratios of different ,purchased farm inputs. In the nine years from 1979 to 1988, the price of fertiliser rose relative to the cost of wage labour, but the relative price of herbicides decreased slightly. In 1979, a farmer could buy one week of wage labour, 12.34 litres of paraquat, or 2.32 tonnes of superphosphate for the same amount of money. By 1988, the cost of a week's labour was equal to 13.34 litres of paraquat, but only 1.01 tonnes of fertiliser. One reason for the increased fertiliser cost was the rising price of fuel, and another was the removal of price subsidies by 1985. From 1982 to 1985, the total capital value of class 6 sheep farms decreased by 40.5 %.9 Treated as a variable cost, this indicates a reduction in the cost of land as a farm input. This change in relative prices, according to induced innovation theory, would induce falmers to substitute land, labour and herbicides for superphosphate application. This favours technologies which employ a mixture of these resources, in particular a low-input system, rather than complete elimination of pesticides and synthetic fertilisers. [!he fall in land prices and increase in fertiliser costs I, does, however. improve the competitive position of organic farming relati\'e to CF l \
8 For a discussion of induced innovation theory as it applies to the adoption of organic farming, refer to Chapter 2.
9 New Zealand Meat and Wool Boards' Economic Service. New Zealand Sheep and Beef Farm Survey, 1983, 1985.

121
Table 8.1 Changing prices of herbicide and fertiliser relative to labourl
Labour2 Herbicide3 Fertiliser4
(one week's (litres of (tonnes of Year wages) paraquat) superphosphate)
1979 1 12.34 2.32
1982 1 12.45 1.09
1985 1 11.17 0.97
1988 1 13.43 1.01
1. Source: Clark et al. (1988) and previous issues of the Lincoln College Financial Budget Manual. - -2. One week's wages for a permanent sheep farm employee over 20 years of age. 3. One litre of (20% concentration) paraquat. 4. One tonne of superphosphate, including price subsidies ($32/tonne in 1979 and $15/tonne in 1982)
Commodity prices The removal of supplementary minimum prices and a decline in red meat priceslO were also shown by Chiao (1989) to induce the profit-maximising fanner to reduce the rate of fertiliser application in the short term. The economically-efficient rate of fertiliser application occurs where marginal revenue (for example of lamb production) equals the marginal cost of fertiliser. Marginal revenue is a product of commodity price and marginal output, the quantity of extra lamb produced from applying one more unit of fertiliser. In Figure 8.1, MR} represents the marginal revenue curve at a high product price for lamb. The economically-efficient quantity of fertiliser is Fl' at the point where MR} equals MC, the marginal cost of fertiliser. When the price of lamb falls, the marginal revenue curve shifts inwards to MR2 and the economically-efficient fertiliser quantity falls to F2. This induces the profit-maximising fanner to reduce fertiliser use from F} to F2. This represents a further incentive for fanners to reduce chemical lise and shift towards a low-input (~md orgAnic) production
system. In practice. this model is made more complex by the residual effect or fertiliser applications on soil phosphorous reserves. which also affects the optimal fertiliser rate (Chiao, 1989).

S per
unit
122
Figure 8.1 Fertiliser application dec:ision-makinjl model
Me
Fl fertiliser quantity
Adapted from Chiao (1989)
Patterns of expenditure Recent changes in fann expenditure suggest a move by New Zealand fanners towards low-input production. The dominant trend in New Zealand farm expenditure has been increasing substitution of capital for labour. For example, in 1970171 wages accounted for 12.6 % of total expenditure on class 6 sheep and crop farms. By 1983/84, wages fell to 7.4% of total farm expenditure. In the same period, expenditure on pesticides and fertilisers remained constant at around 16 % of total expenditure, while interest payments rose from J4.6% to 20.3%.1l These changes in farm expenditure can be attributed to factors such as government policies encouraging increased levels of production, and increased labour productivity through the development of new technologies. However. from 1983 to J986 the level of capital expenditure fell by 27%, mainly through cuts in land development. machinery and vehicles (Table 8.2). This was effectively a move towards low-input agriculture.
11 New Zealand Meat and Wool Boards' Economic Service. New Zealand Sheep and Beef Farm Survey, 1971, 1984. Class 6 farms include South Island farms which breed their own replacements and frequently have some cash cropping.
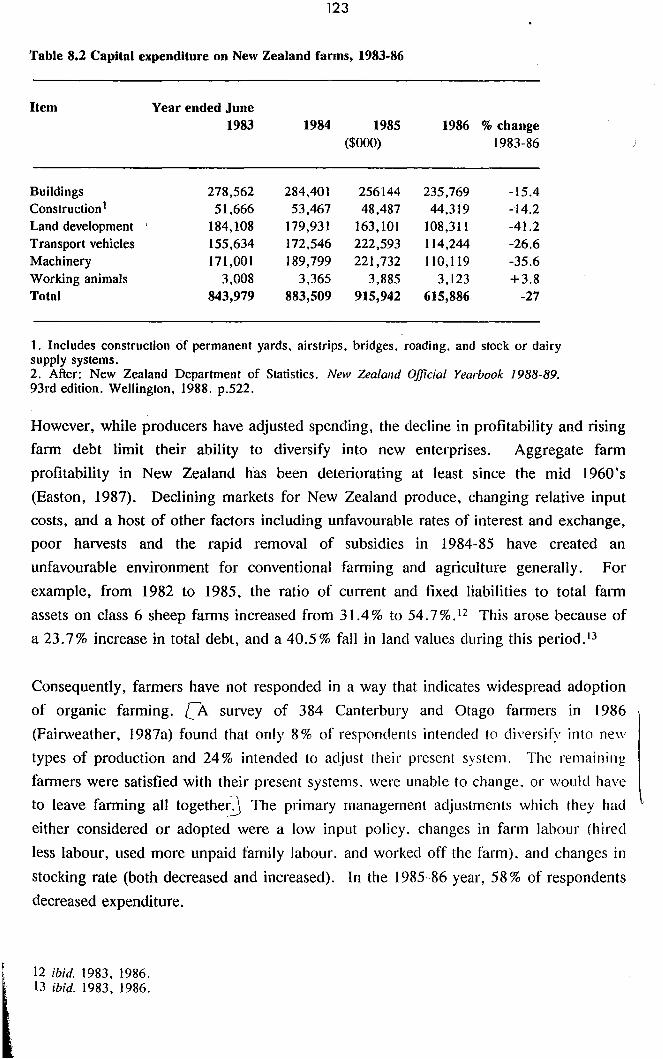
123
Table 8.2 Capital expenditure on New Zealand farms, 1983-86
Item Year ended June 1983 1984 1985 1986 % change
($000) 1983-86
Buildings 278,562 284,401 256144 235,769 -15.4 Construction I 51,666 53,467 48,487 44,3]9 -14.2 Land development , 184,108 179,931 163,101 108,3]1 -41.2 Transport vehicles 155,634 172,546 222,593 114,244 -26.6 Machinery 171,001 189,799 221,732 110,119 -35.6 Working animals 3,008 3,365 3,885 3,123 +3.8 Total 843,979 883,509 915,942 615,886 -27
1. Includes construction of permanent yards, airstrips, bridges. roading. and stock or dairy supply systems. 2. After: New Zealand Department of Statistics. New Zealand Official Yearbook 1988-89. 93rd edition. Wellington, 1988. p.522.
However, while producers have adjusted spending, the decline in profitability and rising farm debt limit their ability to diversify into new enterprises. Aggregate farm profitability in New Zealand has been deteriorating at least since the mid 1960's (Easton, 1987). Declining markets for New Zealand produce, changing relative input costs, and a host of other factors including unfavourable rates of interest and exchange, poor harvests and the rapid removal of subsidies in 1984-85 have created an unfavourable environment for conventional farming and agriculture generally. For example, from 1982 to 1985, the ratio of current and fixed liabilities to total fa 1m assets on class 6 sheep farms increased from 31. 4 % to 54.7 % Y This arose because of a 23.7% increase in total debt, and a 40.5% fall in land values during this period.13
Consequently, farmers have not responded in a way that indicates widespread adoption of organic farming. CA survey of 384 Canterbury and Otago farmers in 1986 (Fairweather, 1987a) found that only 8 % of respondents intended to diversify into new types of production and 24% intended to adjust their present system. The remainillg farmers were satisfied with their present systems. were unable to change. or would have to leave farming all togethe0 The primary management adjustments which they had either considered or adopted were a low input policy. changes in farm labour (hired less labour, used more unpaid family labour. and worked off the farm). and changes in stocking rate (both decreased and increased). In the 1985-86 year, 58% of respondents decreased expenditure.
]2 ibid. 1983, 1986. 13 ibid. 1983, ]986.

124
The induced innovation approach to the adoption of organic farming has several interesting features. First, it identifies several important economic factors. These include land, labour and capital costs, commodity prices, operating vs. opportunity costs, fixed vs. variable costs, and risk. Also, research and development costs for OF have been mainly borne by the farmers themselves, and research institutions have) lagged behind these innovative farmers. Only after economic trends appeared to favour OF was MAF "induced" to undertake research and development, and interest in the system expanded from a s~an number of philosophically-motivated farmers. The user-pays philosophy may have been an important stimulus to MAF involvement in research and marketing, because of the economic need to respond to farmer demands, and the opportunity to create revenue and jobs for MAF. However, economic conditions and farmer behaviour (as well as technological and ecological factors) indicate a far greater level of demand for technologies which reduce capital expenditure (Le. low-input technologies) than for OF. A shift to low-input farming methods is therefore a rational change, according to economic theory, and low-input farming ~ se is therefore an important topic for research.
8.3 TECHNOLOGICAL DEVELOPMENTS
Johnson (1988) identified several technological developments which are likely to affect U.S. agriculture in the next century. Genetic engineering has the potential to develop highly resistant and productive strains of crop and livestock species which could boost productivity and reduce chemical costs. Information technologies will be able to replace labour in practical tasks, such as irrigation control, and management functions through computerised decision-making (artificial intelligence). Other developments in agricultural engineering can be expected to continue to reduce the labour-intensity of agriculture. Johnson (1988) also predicted a continuing heavy emphasis on chemical and biological pest controls, but with more consideration of their effects on the food chain and environment.
These developments can be expected to affect the adoption and competitive position of organic farming in several ways. [Because OF is an undeveloped field. considerable potential exists for the development of improved non-chemical pest controls and labour-saving technologies, such as flame weeding equipmen~ Expensive capital equipment is well suited to large, specialised farms due to economies of scale. Organic farms tend to be smaller and more diversified than the conventional average (USDA, 1980), but they are not limited by scale. Because OF is a management-intensive and largely undeveloped production system, it could benefit from the development of information

125
technologies. Specifications of the Bi~ Oro Standard, notably possible restrictions on
genetic engineering, and resistance from consumers (and some producers) seeking a
"natural" product are potential barriers to utilising these technologies. The
development of non-chemical control strategies in response to pest resistance and
market restrictions on chemical use, for example selective breeding of nematode
resistant sheep, is likely to benefit both OF and CF. Aside from restrictions on genetic
engineering, OF stands to gain as much from technological developments as other
production systems.
8.4 SOCIOLOGICAL FACTORS
Previous research suggests that social barriers exist to adopting OF. From case study
research, Foster and Miley (1983) concluded that the social context of organic
agriculture includes both farmers and consumers, who share similar values, activities,
and social ties. PotentiaJly, this organic 'community' (Foster, and Miley, 1988) could
exclude outsiders, such as farmers wanting to adopt OF. In addition, OF has a
negative social image among some farmers (Conacher and Conacher, 1982), and the
values and social network of an organic community may be viewed as incompatible with
the values of conventional producers.
In some cases, social aspects of organic farming were a barrier to adoption. In
'Canterbury, reactions of neighbours to the endeavours of organic farmers were mixed. 14
In several cases, according to the practicing organic farmers, scepticism was giving way
to increasing interest, while the hipp~ image prevailed among other farmers.
Interaction between organic producers was a notable feature of the group's behaviour.
Farmers shared information, marketed in cooperative groups, and met regularly.
However, the organic farmers did not form a close-knit, exclusive community. Social
contacts with other farmers were equally important, and organic farmers actively
recruited new producers into the industry. Philosophical. marketing and per<;()llnl
differences also divided the group. If the commercial image of organic farming
increases through the efforts of organisations such as the MAF. and it is shown to be
profitable through the performa~ce of organic farmers, social and ideological ban-iers to
adoption are likely to decline in importance. Deer velvet production is one example of
an enterprise which has rapidly increased in New Zealand in response to a profit
incentive, despite differences between the values of Asian consumers and New Zealand
producers. Social barriers to bio-dynamic farming (BD) are, however, more
significant. Contact between BD producers and consumers was closer than existed in
the OF industry. Bio-dynamics has a distinctive philosophical basis, anthroposophy. 15
14 Source: PRAC survey. Appendix C. section G. 15 Anthroposophy is the body of spiritual and mystical teachings of Rudolf Steiner.
126
Several practicing and prospective organic farmers felt that BD was incompatible with their personal beliefs, and this significantly affected their choice of farm system (Chapter 7, Section 7.3).
[ihe rise of the hobby farmer and the continuing dominance of the family fann favours expansion of organic farming. jFairweather (1987) described changes in the social organisation of rural communities in New Zealand. Since the 1890's, family farms have risen in dominance, and their importance is i11ustrated by the fact that 67% of work on New Zealand sheep farms was done by the owners themselves. 16 However, in the last two decades the number of small (1-19 ha) farms producing sheep/beef or horticultural goods has doubled, and large, absentee-owned, capital-intensive farms have also increased. The rise in small holdings may be a response to increasing part-time fanning by people who also hold non-farm jobs and the cost and time required to establish large properties (Fairweather, 1987). &obby farming is well-suited to OF because off-farm income sources reduce the risk of diversification into OF and "lifestyle" farmers may well place considerable emphasis on the "healthy" and "natural" aspects of organic farming. In addition, the small farm size and provision of cheap family labour are favourable conditions for labour-intensive production J
8.5 SUMMARY
The recent rise in interest in organic farming (OF) is primarily due to changes in the social, technical and economic environment in which farmers make decisions. As one individual among many producers and members of society, a farmer exerts little influence on the outside world, and must respond to changing conditions such as market prices and social change. In this chapter, an attempt was made to isolate different aspects of the dynamic farm decision-making environment that are likely to affect the decision to adopt OF.
Markets for organic produce were addressed in section 8.2. Conventional markets for
New Zealand produce are characterised by falling commodity prices. deregulation. shrinking export quotas, and import restrictions such as the recent ban on beef hormones by the European Economic Community. This situation provides an incentive to diversify into the growing and high-priced organic food market. The future of an expanded OF industry is largely dependent on access to sizeable, lasting and premium-priced markets. However, it is important to note several potential barriers to the expansion of organic product markets.
16 New Zealand Meat and Wool Boards' Economic Service, Supplement to the New Zealand Sheep and Beef Farm Survey, 1986.

127
The premium price for organic produce is principally a resuh of excess demand due to growing consumer preference for organic food and constraints on supply. Organic markets are therefore vulnerable to oversupply, and a resulting drop in product price. Market promotion would reduce the risk of oversupply if more producers are to adopt OF. At present, however, market promotion of organic produce is limited to word-of-mouth and voluntary efforts by individuals in the OF industry.
The existing organic market infrastructure, which is fragmented and based largely on individual and voluntary efforts, is poorly suited to an expanded OF industry. The lack of coordination between production, processing, distribution and marketing activities limited the ability of Canterbury producers to meet large orders and to guarantee continuity of supply. This meant producers competed for small orders and small-scale health food outlets. Consequently, a considerable amount of organic produce was sold on the conventional market. Improved market coordination would increase the effective market size (because the number and range of available outlets would increase), increase farm income (by raising the proportion of produce sold at higher prices), reduce market risk and uncertainty, and enable expansion of organic farming to a large-scale industry with export potential. Development of a centralised organic producers agency is one option for the OF industry to improve market coordination, promotion and other benefits such as reduced production costs. However, resistance from some producers, and the problems identified by M. Olson's (1971) theory. of group behaviour create obstacles to organic farmers independently organising into a centralised group. Public funding would therefore probably be needed to initially establish a marketing body. A joint strategy by the Ministry of Agriculture and Fisheries (MAF) and the Biological Producers Council (BPC) which aimed principally to improve market coordination would be less likely to engender resistance from producers than a separate MAF initiative to centralise the industry.
~emand for organic produce is growing both domestically and overseas. Export markets offer a large market size. higher retail prices and the opportunity tn e;lrn foreign exchange. However. significant barriers exist to exporting organic produce. notably high costs, greater risk and imp0I1 restrictions. Considerable potential exists for developing the domestic market. which could be viewed as a transition to future exports. Resistance from conventional marketing agencies was encountered by organic producers at domestic and export levels. on the grounds that bulk conventional markets may be jeopardised by promoting organic produce as a healthier product. Promotion of organic food on the basis of a separate, wholesome image would reduce the conflict of interests with conventional marketing agencies .. J

128
Organic food markets are small (generally less than one per cent). and organic produce tends to be bought by a specific sector of the consumer market. However. a lack of information about organic product markets limits the ability of the OF industry to target products and consumer groups. The Bio Gro Standard is a highly rigorous organic label which may be poorly matched to the demands of many consumers for a 'healthy' product. Alternatives to Bio Oro, such as the labelling of chemicals used to produce all foods, residue testing of produce, or a less rigorous health food standard may appeal to a wider consumer market. However, these benefits are balanced by resistance from organic producers to alt~rnative production standards, and the cost of launching a new trademark.
An induced innovation approach was applied to explain the effect of changing farm input and commodity prices on adoption behaviour. In terms of input use, organic farms typically use less fertiliser and chemicals, more labour and more land to achieve the same output as a conventional farm. Using the induced innovation approach, therefore, one would expect farmers (and the agricultural research and extension support system) to be inclined to embrace OF when the cost 'of chemicals is high relative to the prices of land and/or labour. Low commodity prices relative to organic produce, and the availability of credit to meet the initial investment costs also favour adoption of organic farming.
From an analysis of trends in the economics of production, the following factors are therefore relevant to the adoption of organic farming. In the last ten years, the price of fertiliser has increased and pesticides have remained constant relative to labour. In addition, the price of land has fallen. According to the induced innovation model, this change in relative input prices would induce farmers to substitute land, labour and herbicides for superphosphate. It does not indicate that complete elimination of pesticides and chemical fertilisers is economically efficient. However, the rise in fertiliser costs and the drop in price of land improves the competitive position of organic farming relative to CF. The removal of supplementary minimum prices and n decline in red meat prices also induces the profit-maximising farmer to reduce fertiliser use. Unless the price premium for organic produce is high relative to conventional food prices, these price trends favour low-input farming. rather than OF. The rise in farm debt reduces the ability of producers to make the necessary investments to diversify into OF, and presents an obstacle to change. On undercapitalised falms, this could make adoption of organic farming unfeasible.
Farmers in New Zealand have adjusted to present economic conditions in a manner which was predicted by the induced innovation model. Farm spending has declined,
129
particularly in fertiliser use, but fanners have not responded in a way which indicates
widespread adoption of organic fanning. A recent survey (Fairweather. 1987a) fOl1nd
that only 8 % of respondents intended to diversify into new types of production, and
24 % intended to adjust their present system. Farmer behaviour therefore indicates a
greater demand for low-input fanning t11an OF. A shift to low-input farming is a
rational change, according to economic theory, and low-input farming per se is
therefore an important topic for research.
Non-economic aspects of the farm decision-making environment are also relevant to
adoption decisions. The likely impact of technological developments was discussed in
section 8.3. Organic farming, as a largely undeveloped and management-intensive
production system, stands to gain considerably from the development of information
and labour-saving technologies. Increasing pesticide resistance and the development of
low-chemical pest control strategies could benefit both OF and conventional fanning.
Genetic engineering has the potential to develop highly resistant and productive strains
of crop and livestock species which reduce chemical costs. Consequently, the possible
restriction on genetically-modified crops by the Bio Oro Standard is likely to be the
most important technological constraint on OF.
In section 8.4, sociological factors were assessed. Organic farming has a negative
social ,image among some producers. However, if OF continues to be promoted as a
commercial technology, social barriers to adoption are likely to decline. Although one
feature of the Canterbury organic farmers was their high degree of interaction, the
producers did not fonn a close-knit, exclusive group. Social barriers to bio-dynamic
farming (BD) are more likely to be important. Several practicing and prospective
organic farmers considered that the values, social ties and cultural origins of BD were
incompatible with their personal outlook. This perception had an important influence
on their preferred farm system. The rise of the hobby fann and the continuing
importance of family farming in New Zealand favours expansion of organic farming.
Although OF is not limited by scale, small family farms are we]) suited to OF for
several reasons: off-farm income sources reduce the risk of adoption. the lifestyle n<;pf'ct
of part-time farming lends itself to the philosophy of organic farming. and the provision
of cheap famBy labour and small farm size favour labour-intensive farm methods.

PART III
SUMMARY AND CONCLUSION
131
CHAPTER 9. SUMMARY AND CONCLUSION
9.1 Introduction
9.2 Review of the research methods
9.3 Review of the main findings
9.4 Policy implications and research recommendations
9.1 INTRODUCTION
Recent changes in New Zealand agriculture indicate a need to investigate organic farming
(OF) as a commercial alternative to conventional farming (CF). New Zealand conventional
producers currently face low profitability and rising debt, due to a high cost structure and
declining markets for conventionally-grown produce. The emergence of public costs
associated with CF, for example pesticide resistance, also suggest that public policies
towards alternative production technologies should be reassessed. The essential features of
organic farming are the removal of chemical inputs from production, an environmental
philosophy, and an emphasis on soil husbandry. Organic farming therefore shows promise
as a low-cost, environmenta1ly-benign technology. A growing market for premium-priced
organic produce is a further incentive for farmers to adopt OF. However, while interest in
OF from producers and public agencies is increasing, OF is currently limited to a small
number of commercial producers (91 producers with the organic Bio Oro label nationwide,
and a sma11 number of independent producers). Previous research indicates that significant
obstacles exist to adopting and implementing OF, which include technical, social and
economic factors. The important hurdles are likely to vary between different enterprises
and locations. A lack of information is available on the technical and economic feasibility
of organic farming in a New Zealand setting.. This uncertainty increases the risk that
producers will make inefficient management decisions, and that scarce public resources will
be wastefully allocated.
Using a multi-disciplinary approach. the thesis considered OF within the framework nf the
adoption and diffusion of innovations. This approach is reviewed in section 9.2. The main
focus was on barriers to the adoption and implementation of organic falming by
Canterbury cereal crop and livestock falmers. New information on the OF technology was
presented and factors affecting the future of the OF industry were discussed. The main
findings are presented in section 9.3. Suggested implications for policy and research are
discussed in section 9.4.

132
9.2 REVIEW OF THE RESEARCH METHODS
A multi-disciplinary approach was used to analyse barriers to the adoption and
implementation of organic farming. Previous research identified a range of potential
constraints, including technical, economic, institutional and social factors. These data
suggested a broad approach was appropriate which considered characteristics of the OF
technology (for example the ability to control crop weeds under OF). farmer attitudes and
behaviour (such as perceptions of risk and feasibility), and the wider agricultural setting
(for example market prices for different farm inputs). Concepts from three disciplines
contributed to the conceptual framework. The adoption-diffusion model is a sociological
approach which emphasises the individual farmer's decision to adopt an innovation based
on his or her perceptions of the innovation. Perceptions of organic farming and social
characteristics of organic and other farmers are predicted by the adoption-diffusion model
to affect its adoption. Changing farm input and commodity markets are predicted by the
induced innovation model, an economic perspective. to induce farmers to choose the most
economically-efficient technology. For example, a high price for organic produce relative
to conventionally-grown food provides an incentive to adopt OF. Agroecosystt'ms theory,
a branch of ecology, emphasises the interconnection between different components of
agricultural production systems and the limitations of studying a technology from a single
disciplinary perspective.
In retrospect, the multi-disciplinary approach of the study was appropriate, given the range
of barriers which were identified as important. A multi-disciplinary approach appears to be
well-suited to technologies which are not purely financial in nature (which includes most
innovations). The adoption-diffusion, induced innovation, and agroecosystem models
contributed useful concepts for analysing barriers to OF, although each individual approach
had shortcomings. The agroecosystems concept of linkages between the technology,
decision-maker and farming environment was a feature of organic farming adoption. For
example, the labour-intensity of organic farming affected the resource requirements for
production, the employment of family and voluntary vs. paid labour. and the competitiye
position of organic farming when wages increase relative to other farm inputs. The most
important barrier identified by the adoption-diffusion model was the significance of
farmers' perceptions of organic farming as a high-risk innovation with questionable
economic and technical feasibility. The adoption-diffusion approach also provided a
framework for analysing the social aspects of organic farming. However, the adoption
diffusion model had little power to predict the type of farmer who is interested in OF.
This was presumably because the characteristics of the OF technology. and farmers'
motivations for adopting OF differ from productivity-increasing innovations such as new
herbicides and farm machinery. The induced innovation approach provided a useful

133
framework for analysing the influence of economic trends on adoption of organic farming.
The induced innovation model accurately predicted the current drop in capital expenditure
on New Zealand farms, and the economic interest in OF as an alternative technology.
The study concentrated on in-depth analysis of the population of 13 Canterbury organic
cereal crop and livestock producers. Several factors contributed to this choice. Research
resources were limited, and previous studies have noted considerable variability between
organic farms. A lack of data was available on OF in New Zealand and detailed
information about the OF technology was considered necessary. Important barriers are
likely to differ between enterprises and locations'. For example, cosmetic quality is likely
to be a more important constraint to producing organic apples than organic wheat.
Therefore, in-depth analysis of one sector of the OF industry was chosen, rather than
surveying a large sample and collecting less detail on individual cases. Cereal crop and
livestock enterprises are of regional and national importance and have been targeted by the
Ministry of Agriculture and Fisheries (MAF) as a potential organic food export industry.
All commercial scale (over 30ha) organic crop and livestock farmers in the South Island
were located in Canterbury. Secondary data on organic and conventional farming were
also available for these enterprises. The population of Canterbury organic crop and
livestock farmers was small and variable, and the data base on CF was incomplete.
Therefore, the ability to undertake tests of statistical significance was limited. Generalising
research results was also limited by differences between the survey population and other
sectors of the OF industry. Accordingly, a logical extension of this study would be to
assess other sectors such as dairy and horticultural production. Viewed as case studies,
research on these sectors would contribute to the larger picture of the OF industry as a
whole.
Because no single data collection method was considered adequate to cover all aspects of
barriers to OF, a mixed-method research design was chosen. A literature review provided
initial information on organic farmers and the OF technology. However. primary data
collection was also considered necessary because of differences between falming conditions
in New Zealand and overseas, and the absence of New Zealand infOlmation. The use of
case study, interview, postal questionnaire and literature review techniques permitted
triangulation of results to minimise bias. However. the ability to triangulate was limited by
the fact that one researcher collected all of the primary information. An independent
analysis would be required to adequately check for participant-observation bias. Data was
collected from farmers at different stages of adopting OF, because it was hypothesised that
their experience and perceptions of barriers to OF were likely to differ. Four practicing
organic producers (PRAC) were studied using participant observation techniques.
Participant observation provided rich qualitative detail, but it was highly demanding of

134
research resources and vulnerable to interviewer bias. The participant observation was
particularly useful for understanding farmer motivations. and practical aspects of the OF
production system. The remaining nine PRAC were surveyed using structured interview
and postal questionnaire methods. Structured interviews were more efficient than
participant observation for addressing specific questions, but limited the flexibility of the
interview. Fifty two farmers who had expressed a strong interest in OF but had yet to
adopt (prospective organic farmers, PROS) were also sent postal survey forms. After the
initial mailout and two follow-ups, 90.4% were returned (n=47), of which 78.9% (n=41)
were usable questionnaires from respondents who met the survey criteria. The postal
survey was well suited to a large sample size and collection of quantitative information, but
lacked the richness of personal detail required to understand the meaning behind farmers'
responses. Secondary data sources were relied upon to provide information about
convent.ional farmers. One possibly useful extension of the study would be to survey
conventional producers. A conventional farmer survey would provide a more complete
comparative data base and accurately measure conventional farmers' perceptions of organic
farming.
9.3 REVIEW OF THE MAIN FINDINGS
This section presents the main results of the study. In the following sections, features of
the OF technology which are likely to affect adoption, such as profitability and investment
requirements. are assessed. Adoption of organic farming is considered on an individual
farm basis in part 9.3.2. The discussion concludes with a review of institutions and market
trends that are likely to influence adoption behaviour.
9.3.1 Characteristics of the organic farming technology
The strict definition of organic farming used in the thesis is adopted from the Bin Gro
Standard for Organic Food Production. Bio Gro is the organic trademark of the Biological
Producers Council (BPC). a semi-voluntary organisation which is affiliated to other OF
organisations through the International Federation of Organic Agriculture Movements
(IFOAM). Bio-dynamic farming (BD). a chemical-free fatm system which is based on the
teachings of the philosopher Rudolf Steiner. is considered as a special case of organic
farming for these purposes. The Bio Gro Standard is a rigorous definition which seeks to
eliminate all possible sources of chemical contamination of produce. It specifies restricted
and permissible farm practices and inputs, for example the use of rock phosphate fertiliser
in place of superphosphate. The Bio Gro Standard also includes management guidelines

135
which emphasise nutrition, human and animal welfare, environmental protection, self
sufficiency, and soil 'improvement.
When the Bio Gro Standard was interpreted in a commercial setting, a wide range of
management changes were undertaken by the PRAC. These changes included
. diversification into new enterprises, the sowing of alternative pasture species, development
of a ewe breeding flock, greater emphasis on diet to maintain animal health, and changes
to crop rotations, residue management, and cultivation. Once chemical inputs were
removed, the PRAC were largely restricted to diversified, management-intensive production
systems. For example, non-chemical control of internal parasites of sheep is most difficult
in intensive, specialised production systems (Familton et al., 1986). This resulted in
increased management complexity and reduced flexibility. These two features of the OF
technology are identified in the adoption-diffusion model as barriers to adoption.
According to this approach, farmers are most likely to adopt simple innovations which
conveniently meet their needs. Another feature of innovations, trial ability , is defined by
the adoption-diffusion model as the ability to experiment with an innovation on a limited,
trial basis. An innovation which can be tried out before full-scale adoption has less
uncertainty and is generally adopted faster than technologies which are all or nothing.
Organic farming appeared to have low trialability. Many of the suggested benefits of
organic farming, for example improvements to soil fertility, are long-term andare therefore
not amenable to trials. Obstacles such as Bio Gro regulations also limited the ability of the
PRAC to gradually convert to OF. Complexity, flexibility and trialability are features
which reduce the likelihood that a producer will choose OF over other technologies. Once
Canterbury producers had actually adopted OF, different obstacles were encountered.
The main technical problem faced by the PRAC was pest control, particularly control of
animal parasitic disease and crop weeds. Because the Bio Gro Standard permits a full
range of substitutes for conventional fertilisers, soil fertility maintenance did not appear to
be a major problem. In contrast, non-chemical substitutes are lacking for key New
Zealand pests (Wearing. 1988), Consequently. when pest outbreaks occurred the PRAC
had few options other than to accept production losses or to apply chemicals as a clIratiYe
measure. Control of internal and external parasites of sheep were the two major animal
health problems. Anthelmintic drenching was required on an but one Canterbury organic
farm, and 69 percent of the PRAC had dipped sheep for lice or fly strike at least once
since adoption. The most important effect of these measures was to severely limit the
ability of the PRAC to produce Bio Gro lambs. Because stocking rate is a major
determinant of nematode infestation of sheep (Morley and Donald, 1980), a reduction in
stocking rate and a resulting drop in land productivity may also be necessary under OF.
The main problem weeds were Californian thistles (Cirsium arvense), which have a rapidly

136
spreading growth habit; docks (Rumex spp.), which have resilient tap roots; couch (Agropyron repens), which spreads take-all disease of wheat: and wild oats (Avena spp.), which has a highly resilient seed and is difficult to control without herbicides. The principal costs of crop weeds were losses in productivity either directly through depressing yields or by requiring paddocks to be left bare fallow and out of production for up to a year. Bare fallowing also increased the risk of wind erosion, sediment and nutrient pollution of water, and damage to soil structure. Production costs also rose through the additional need for manual and mechanical weeding. For many producers, the effect of these technical changes on initial investment costs, risk and farm income are likely to be the primary considerations when considering adoption of organic farming.
Previous research and the performance of Canterbury organic farms suggested that net income under OF was similar to CF. In general, lower yields were balanced by a reduction in production costs and, in some cases, higher commodity prices. On average, the PRAC reported a slight (6%) increase in net income compared with their performance under CF management. Average annual gross margins were calculated for an OF crop rotation, using production assumptions which were representative of Canterbury organic farms. These included 10-20% price premiums on some crops, 30% lower wheat yields, 10% lower yields for other crops, and a 10% lower stocking rate compared with a standard conventional operation (based on the Lincoln College Financial Budget Manual (Clark et al., 1988 and past issues». The average OF gross margin was 14% lower than the conventional level. Variable production costs were lower for the OF enterprises, for example 23% lower in a wheat enterprise comparison. Although OF appeared to be a viable alternative to CF, the data did not suggest a strong profit motive to adopt the technology. However, with higher productivity and/or commodity prices (i.e. more favourable production assumptions), OF outperformed CF. Because the OF technology and marketing is largely underdeveloped, technical and market research therefore have the potential to improve the profitability of organic farming. Before a farm could gain the benefit of higher prices, however, producers faced a transition period of at least two years. This period was a significant economic obstacle.
During. the period of transition from conventional to organic faIming. the PRAC experienced reduced yields, an absence of price premiums. and capital investment costs. The average annual gross margin for OF when produce was sold at conventional plices (using the above yield assumptions) was 29% lower than the conventional standard. This represented a significant loss of profit. Yields were also highly variable, particularly for wheat, which could be attributed to factors such as differing growing conditions, crop varieties, and levels of experience. In addition to this initial loss of income, the PRAC faced significant capital investment costs. Specialised farms required investment in

137
livestock or cropping equipment to diversify into a mixed operation. The machinery used
on organic farms was similar to CF, however some PRAC also invested in specialised
equipment such as manure handling equipment. Bio-dynamic farmers invested in stirring
and spraying equipment for liquid fertilisers (up to $6,000). Most of the PRAC also
invested in grain processing plant (approximately $10,000), however this would not be
required by future adopters of organic farming because processing outlets have now been
established. These aspects of transition present important barriers to undercapitalised
producers, and many New Zealand farmers currently face high levels of farm debt and
resulting credit restrictions.
Investment in retraining ('human capital') was also a major cost of adopting OF, due to a
lack of information and research about basic technical and economic aspects of the
technology. Organic farming relies largely on management information, such as crop
rotation design, rather than direct capital inputs such as herbicides and mineral fertilisers.
However, producers adopting OF lost the information support available to conventional
producers. Practicing organic farmers instead relied upon research and development on a
per farm basis. Widely varying and unorthodox practices were employed on Canterbury
organic farms, for example seaweed and herbal drenching of sheep. The benefits of many
of these techniques have yet to be established, and research could improve the efficiency of
the OF technology. Important research priorities, such as the effect of crop rotation design
on weed infestation, are likely to be neglected in a user-pays environment. This is because
the required research programmes and their benefits are frequently long-term in nature, the
research requires a holistic approach, and the outcomes rarely result in a patentable" r" product such as a soil additive. Since a lack of technical and economic information is a {
I major constraint to OF, publicly sponsored research would probably be necessary to meet
these needs.
Another consequence of a lack of information was that farmers appeal:ed to have widely
varying perceptions of the risk and feasibility of organic farming. Economic comparisons
of organic and conventional falming suggested that the level and stability of farm incnme
for both production systems is similar. However. an important economic ancl psychological
advantage of pesticides over biological controls is that pesticides are convenient for
avoiding perceived risk (Wearing. 1988). In contrast. OF relies on problem prevention
rather than cure, and reduces farmer intervention. A perception that OF increases the risk
of income loss is a barrier to adoption for some farmers. To other producers. the
perceived public risks of chemical use is an incentive to adopt the technology. How an
individual's perceived risk affects the adoption decision is reviewed in the next section.

138
9.3.2 Adoption of organic farming
The principle difference between individuals who adopted OF and other producers was one of attitudes. Organ~c producers perceived a need to change from CF for a variety of reasons, and they viewed replacing chemical inputs with OF practices as a feasible and attractive alternative. Practicing organic farmers viewed the technology as a more profitable, low-input system than CF, an environmental and healthy alternative, and a personally satisfying and challenging option. Financial concerns were only one aspect of the adoption decision for both practicing and prospective organic farmers.
The main problems experienced by the PRAC were control of crop weeds~~alJ.d parasites of
production problems threatened the viability of the farm, they were viewed as challenges rather than major barriers. In contrast, several PROS questioned the feasibility of organic farming, and some viewed it as a risky and uncertain option. While the majority of the PROS thought that it was likely they would adopt OF in the next three years, only 29% had actually applied for Bio Gro. The main factors which deterred the PROS from adopting OF were perceived technical difficulties (l7~ 1 %); current economic conditions, which increased farm debt and made farms risk averse (14.6%); uncertainty of organic product markets (14.6%); and a lack of information (14.6%). Practicing organic farmers also believed that few Canterbury producers have so far adopted OF because the present economic conditions and the precarious situations of many farmers have led producers to be highly risk-averse. Consequently, they are unwilling and/or unable to diversify into OF. A recent survey (Fairweather, 1987) of conventional farmers found that only 8% of respondents intended to diversify into new types of production, and 24 % intended to adjust their present systems. These data suggest that most farmers do not perceive a need to adopt alternative production technologies as a remedy to the ills of CF. The analysis also indicates that the OF industry is unlikely to rapidly expand without changes in farmin conditions, organic product markets. and the supply of research and extension.
For some farmers, the perceived social features of organic agriculture act as a disincentive to adopt the technology. In Canterbury. the reactions of neighbours to the endeavours of the PRAC were mixed, and the 'long hair and beads' image prevailed among some I
conventional farmers. Increasingly, OF is being promoted by agencies such as the MAF as a commercial innovation, and this negative image of organic farming appears to be reducing in importance. Organic farming has evolved from a largely urban, home gardening base in New Zealand. However, present day PRAC shared many social and economic characteristics with other farmers, such as a rural upbringing and owner-operated I

139
family fa~ arrangements. Although interaction between the PRAC was one notable aspect of the group's behaviour, the PRAC did not form a c1ose-knit, exc1usive community. The values and philosophy of organic farming, such as soil conservation and environmental protection, are shared by many farmers and are also unlikely to present a barrier to adoption. Bio-dynamic farming, however, was an exception. Bio-dynamics featured a distinctive spiritual philosophy and close interaction between consumers and producers of BD food, many of whom have links with Austria and/or Germany, the centre of BD. To several PROS, the BD philosophy was perceived to be incompatible with their personal and/or religious beliefs. For some producers, however, the added dimensions of BD were a major attraction. It is important to note that New Zealand producers have diversified into products such as deer velvet for the Asian market, despite cultural differences between the product and its market on the one hand, and _ the values of New Zealand rural communities on the other. If OF is shown to be a highly profitable alternative, these social barriers may become insignificant.
Assuming that a farmer perceives that adoption of organic farming is both a worthwhile and compatible change, several characteristics of the farm itself can act as major obstac1es. The physical requirements for OF deny Bio Gro status to a large number of farms. Because of past chemical use, persistent pesticide residues are widespread in Canterbury soils. Soil residues greatly limit the ability of farms to produce animal products which have low chemical residue concentrations. Until now, this aspect of the Bio Gro Standard has not been rigorously enforced. However, it presents a significant constraint to the industry. Before converting Canterbury organic farms to OF, a high level of soil fertility and control of pest problems was required to ensure that productivity did not fall drastically once chemical inputs were removed. In some cases, this made application of chemicals and/or the sowing of fields into pasture necessary before an organic cash crop could be grown. For future adopters, farms which have chronic pest problems, or which are vulnerable to mobile pests from surrounding farmland may be unable to to adopt OF. The importance of these factors are that they represent significant constraints to the supply of organic produce. Unless consumers have highly rigorous quality specifications fnr an1 "organic" or "natural " product. a production standard other than Bio Oro rna}' be more suitable for marketing purposes.
The economic and management r~guirements to adopt OF also present hurdles in some --------- ._-,.-. - ~--~
situations. Adoption of 6rgaTliclarming by ~Canterbury producers typically involved capital investment, unorthodox management changes, and an initial drop in income. Therefore, leasehold and partnership arrangements, high debt levels, and binding conventional contracts were constraints to adoption. In some cases, this a gradual adoption process necessary. Organic farming generally increased l-abour demand. The increased labour

140
demand was estimated at only 4 % higher on average (range -10% to + 15 %) compared with their previous conventional management. However. additional laho\1f was required due to diversification, the need for additional management planning, manual and mechanical weeding, and in some instances increased stock handling. Labour demand was highest on Canterbury organic farms employing BD methods, and those with large cropping enterprises. A gross margin comparison of organic and conventional wheat enterprises suggested that labour demand :was at- least 26% higher per hectare under OF. This anomaly suggests a need for additional monitoring and research to accurately assess the resource requirements and profitability of organic farming. Labour is a limiting Tesource for many farmers. However, the higher labour costs under OF did not increase cash expenditure on Canterbury organic farms, because the PRAC worked longer hours, used unpaid family labour, and had access to voluntary had access to unpaid family and voluntary labour. Voluntary labour sources included German agricultural students and 'Willing Workers On Organic Farms' (generally young tourists working for up to six week periods). On one BD farm, voluntary labour contributed 15.5% of total labour demand.
9.3.3 The influence of the farm decision-making setting
When the cost of labour is low relative to other inputs, the performance of organic farming compares favourably with CF. The rise of the small-scale hobby farmer and the predominance of family farm arrangements in New Zealand therefore favour expansion of organic farming. When it comes to employing wage labour, an individual producer has little control over the market price of labour and other inputs. The farmer is a price-taker, and his or her choice \ of farm technology is largely determined by outside conditions such as regulations and market prices. For example, chemical use is low in underdeveloped countries where labour is a cheaper resource than chemicals. Therefore, in addition to th~ OF technology and farmer attitudes, the setting in which farm decisions are made also affects adoption of organic farming.
The effects of changing faIm input prices and commodity markets were analysed using an induced innovation approach. Organic farming typically uses less feliiliser and chemicals. more land and more labour to achieve the same output as CF. The induced innovation I
hypothesis predicts that farmers would adopt OF when the costs of fertilisers and chemicals I
are high relative to land and labour costs. In the last ten years, the price of fertiliser has fallen and pesticides have remained constant relative to labour. The price of land has also fallen. These trends in farm input costs provide an incentive to reduce fertiliser use relative to other inputs, but they do not indicate that complete elimination of pesticides and fertilisers is economically efficient. Commodity markets are also relevant to the choice of

141
production system. Declining prices for conventional produce following the removal of
supplementary minimum prices also make reduced fertiliser use an economically rational
choice (Chiao, 1989). New Zealand producers have reacted by cutting expenditure,
particularly on. fertilisers. Unless the price of organic produce is high relative to
conventional food prices, these economic trends favour a reduced chemical input
production system, rather than OF. The market for organic produce is therefore likely to
have a major effect on the future of organic farming.
I The current state of conventional New Zealand product markets provide an incentive to
diversify into OF. In recent years, conventional commodity markets . have been
characterised by low commodity prices, deregulation, shrinking export quotas and
increasing import restrictions on chemical residue levels in food. In contrast, the demand
for organic produce is growing and in many cases exceeds available supply. This excess
demand has created price premiums for many organic crops and products. However, while
considerable potential exists for organic food markets, a number of marketing obstacles
deserve mention.
A significant price premium is available for many organic foods. Average price premiums
obtained by PRAC were 20% for wheat, 10% for other crops, and 20% for meat. For the
most part, the price premium is a simple consequence of demand exceeding supply. This
suggests that if more producers are to be encouraged to adopt OF, then market promotion
of organic produce would be required if present prices are to be maintained. The main
demand for organic produce is for foods such as fresh fruit and vegetables which have a
healthy image. In most Western countries, organic markets are below one percent of fresh
produce sales, and less for processed goods and meat. Previous research and the
experiences of the Cantebury organic producers suggest that the organic meat market is
particularly small. This may be attributable to widespread vegetarianism among organic
food consumers, an unhealthy image for red meat, and a trend towards white meat
consumption. A notable feature of organic markets is the lack of information about factors
such as market size and consumer preferences. ,which limits the ability of the OF indu<;Iry
to target specific products and consumer groups. This clearly suggests a need for market
related research.
Given that demand for organic food is growing both in New Zealand and overseas. a
central decision for the OF industry is whether to develop a strategy based on domestic or
export markets, or both. Significant barriers exist to exporting organic produce.
Exporting involves high costs of supply including freight, tariffs and communication. A
large number of links exist in the marketing chain between the producer in New Zealand
and the overseas consumer, and price premiums tend to be collected at each link.

142
Therefore, while export markets have the potential benefits of a high level of demand and the opportunity to earn foreign exchange. the higher retail prices may not he returned to the New Zealand producer. The m~in obstacle for organic meat exports is the very small size of the international organic meat market, while the organic grain market is vulnerable to oversupply from large grain-producing countries and the increasing number of organic producers in Europe. In contrast, the domestic market has cost advantages and less risk, and could potentially absorb a large increase in production. One factor which limits both domestic and export sales of organic produce is opposition from conventional marketing agencies to the sale and promotion of organic produce as a higher quality, safer product than conventional food. However, if the small volume of organic produce can be promoted as a separate, alternative product, few conflicts of interest are likely to arise.
Another limitation to the OF industry is the existing organisational structure. The development of a centralised producer body is one option for the OF industry. In Canterbury, the major demand for cereal products appears to be for large orders which require a guarantee of continuity of supp]y. Overseas, the expansion of the OF industry has been accelerated by a shift from specialist health food outlets to supermarket chains stocking a wide range of readily available organic products. However, due to the fragmentation of the OF industry, the PRAC competed for smaller domestic orders, and a large proportion of produce was sold at conventional prices. At present, market promotion of organic produce was limited to voluntary organisations and the BPC itself is also a semi-voluntary organisation. In an expanded OF industry, the need for coordination and administration of marketing activities would require a more commercial arrangement. A central producers body could take the form of an increased role for the BPC, a private company, or increased MAF involvement. Potential advantages include improved market coordination, reduced costs, and market promotion. Resistance could be expected from some organic producers who value their independence, and from established organic producers who already service loyal domestic markets. The barriers identified by M. Olson (1971) are also relevant. . These include the problems of free riders who need not join an organisation to gain group benefits. the belief of individuals that their ~ingle contriblltion is inconsequential, and the costs of establishing a large organisation. These obstacles suggest that a publicly funded initiative from an agency such as the MAF would be required to develop a central marketing organisation. Another decision on the structure of the OF industry is whether to base OF on the Bio Oro trademark. which has a rigorous production standard, or to adopt a less strict approach aimed at the larger health food market.
There are two target markets for alternative produce. The first group consists of consumers who actually buy organic produce, are willing to pay a higher price, but who present obstacles to large-scale marketing such as a preference for locally-produced goods

143
and resistance to big-business. The second group consists of the larger proportion of
consumers to whom the health aspect of food is sufficiently important to affect their buying
behaviour. A fully organic Bio Oro product may not be necessary to meet quality demands
of this second consumer group. Instead, the demands of these consumers may be better
met by labelling of chemicals used in the production of foodstuffs, or by chemical residue
tests of produce. Both of these options would leave consumers more able to make an
informed choice between different standards of produc¢. Another alternative is to adopt a
trademark and production standard which represents a compromise between IFOAM and
conventional standards. A major benefit of a less rigorous production standard than Bio
Oro would be greater ease of supply. Disadvantages include a lack of brand name
recognition or infrastructure for a new standard, the possibility that the price of Bio Oro
produce would be undercut, and likely opposition from Bio Oro producers.
9.4 POLICY IMPLICATIONS AND RESEARCH RECOMMENDATIONS
In this section the justification for pubJic sponsoring of organic farming is examined.
Effective uses of public funds to remove barriers to organic farming are discussed, and
public benefits of organic farming are assessed. Organic farming involves both a chemical
free production technology and an industry producing a high-valued health food product.
This distinction between the production technology and industry is important in terms of
public policy. The Ministry of Agriculture and Fisheries has recently allocated public
resources to developing both the technology of organic farming (for example developing
non-chemical control strategies for nematode parasites of sheep) and the marketing capacity
of the OF industry (for example quality control and marketing ventures). It is important to
examine the likely benefits of a1temative uses of these public funds. At present, OF is
confined to a small number of commercial producers servicing the dome~tic market. The
results of this study suggest that OF is unlikely to rapidly expand without changes in
farming conditions, increased research and extension support, and/or a change in the
marketing structure and organisation of. the OF industry. Careful use of public funcl<; could
remove information and marketing constraints to the industry. However. in the current
climate of beneficiary-pays a strong case is necessary before OF is publicly sponsored in
preference to other sectors of the economy.
A central question in terms of public policy is whether expansion of organic falming is
publicly desirable. Organic farming is widely perceived to have significant public benefits
over conventional farm practices. On analysis, however, OF is not clearly more
environmentally benign than farm systems which utilise some chemical inputs. All farm
practices have public costs. For example, pesticide use may cause secondary pest

144
outbreaks and damage to non-target organisms. A potential public cost of organic farming
is inadequate pest control leading to pest outhreaks on neighbouring properties. Excluding
all chemical inputs from farm production may increase public costs in some situations. For
example, bare fallowing for weed control under organic farming incurs environmental costs
including damage to soil structure, increased risk of wind erosion and nutrient leaching. In
contrast, appJication of a rapidly degrading herbicide may use less energy, allow land to
rapidly return to full: production, and cause less environmental damage. The organic
farming philosophy emphasises environmental protection, soil conservation and energy
conservation. However, if producers adopt organic farming primarily for profit, then
management decisions will be made principally within financial, rather than environmental
constraints. Overseas research suggests that organic farming is a more energy-conserving
technology than conventional agriculture. However, conventional farm production in New
Zealand is based on nitrogen-fixation by legumes, rather than the fossil fuel-based nitrogen
fertilisers used in the Northern Hemisphere. Improved energy-efficiency is therefore
unlikely to be a significant benefit of organic farming in New Zealand. On the basis of
present information, therefore, it appears that the principle beneficiaries of policies which
aim specifically to expand the organic farming industry would be organic producers
themselves. Given the present support of the organic farming industry by the MAF and the
prevailing public opinion, further research on the public costs and benefits of organic
farming is clearly warranted.
In contrast, research and development of low-chemical farming techniques have potential
public benefits to organic and conventional producers, and also to the wider public.
Recent developments in New Zealand agriculture indicate a need for low-chemical
production techniques. At present, many New Zealand producers are reducing' capital
expenditure on chemical inputs. The induced innovation model suggests that in the present
economic conditions, a low-input production system is an economically rational choice.
Research into OF could provide conventional producers with the means to improve income
with few chemical inputs. Examples of low input farm practices which are currently being
researched include the use of phosphate rock in place of superphosphate and the 5hift from
lamb to wool production. Pesticide resistance has emerged as a significant problem in New
Zealand. New Zealand exporters also need strategies to cope with increasingly stringent
import restrictions on maximum permitted chemical residue levels. In addition. research of
low-chemical farming practices could lead to the development of fatm production systems
which integrate chemical and non-chemical methods in a sustainable and environmentally
beni gn manner.
Given these important considerations how could public funds be most effectively employed
to remove barriers to OF? And what public benefits would arise from alternative uses of

145
public funds? The following points identify several specific priority areas and strategies for
improved research, extension and marketing. Public funding is recommended for those
activities which are likely to provide significant public benefits, and which are not likely to
be undertaken by private commercial interests.
(1) Farm systems research is central to the development of non-chemical management
techniques. Organic farming is a management-intensive technology which lacks basic
information about technical and economic aspects of production. The resulting uncertainty
acts as a deterrent to adoption and limits the ability of producers to profitably implement
the system. A reductionist approach is inappropriate for many OF research topics, because
the effects on the whole fann system are important. For example, grazing management
strategies to control internal parasites of sheep are likely to constrain crop rotation design.
Information is currently lacking on basic aspects of farm management. These include
strategies for conversion to OF, the benefits and use of different fertiliser types, the choice
and management of low fertility pasture species, non-chemical control of internal parasites,
supplementary feeding of livestock, control of crop weeds, and strategieS for conversion.
In addition, further research is required on economic characteristics of organic farming,
including its performance relative to CF, its resource requirements, and the optimum mix
of crop and livestock enterprises. This information would improve the efficiency of organic
farming systems, -reduce the uncertainty of adoption, and enable development of integrated
low-input farm systems. The benefits from research would therefore not be confined to
organic producers, and public support of this research is warranted.
, (2) To undertake this research, a coordinated research strategy combining investigations in
publicly-owned research farms with research and monitoring of commercial organic farms
should receive greater emphasis. The MAF has already converted two of its research farms
to organic production. Additional benefits are likely from on-farm research of commercial
farm properties. These include a close relationship between producers and public agencies,
the flow of information in both directions between producer and researcher. direct benefits
to organic producers from research. and a high profile of organic farming reseflrrh in the
farming community. From discussions with organic fatmers and IVIAF personnel. it \\"as
apparent that communication between these two groups could be improved. Practicing and
prospective organic farmers relied mainly on unorthodox information sources such as OF
books, magazines and organisations. rather than farm advisors or scientific researchers.
However, PRAC favoured more scientific research on OF, and there is considerable
potential for collaboration between researchers and farmers. Monitoring of organic farms
would also provide a cost-efficient means of collecting data, which would enable accurate
calculations such as. gross margins for chemical-free enterprises. The beneficiaries of this
type of research program would therefore not be confined to organic farmers.
146
(3) Information support systems should be developed for adopting and established organic
producers, and extension should initially he subsidised. Existing agricultural knowledge
could beappJied to OF, which relies largely on accepted good husbandry techniques such
as crop rotation design. Combined with existing overseas data and original research and
monitoring, this could provide the basis for a farm extension service. A cooperative
approach between innovative farmers and publicly funded research and extension agents has
in the past contributed greatly to agricultural development in New Zealand (McArthur,
1987). The user-pays approach to farm extension is a barrier to cooperative development
of organic farming and low-input farming techniques, because it deters organic producers
from communicating with extension agents. Subsidising extension services to new organic
producers would also reduce the uncertainty and perceived risk of adopting these new
methods, and could be phased out once the industry was well established. The hurdle of
transition to OF would be lowered if producers were supported with technical and
economic information.
(4) Research on the public costs and benefits of organic faiming is required to determine
appropriate public policies towards OF. Organic farming has the potential to reduce public
costs associated with conventional agriculture, such as pesticide toxicity to natural
ecosystems, domestic animals and humans. Public costs may also be significant, for
example inadequate pest control leading to pest outbreaks on neighbouring properties.
What aspects of organic farming can contribute to the design of sustainable and
environmentally-benign agricultural systems? What are the likely impacts of widespread
adoption of organic farming in terms of public and private costs and benefits?
(5) Other sectors of the OF industry should be analysed, on a farm type, regional or
product basis. This study was confined to Canterbury cereal crop and livestock production.
The important issues are likely to differ among the various and diverse industry sectors.
Accordingly, a case by case approach is likely to be most effective to identify the main
obstacles and potentials facing PaJiicular sectors of the farming industry.
(6) Organic food is mainly consumed by a particular group of shoppers. and demand for I
organic food varies between different products such as meat. vegetables and processed I
goods. There is little systematic information about basic features of organic product
markets. Important questions include: Who are the consumers of organic food? Why do
they buy organic produce and what specifications do they have for an "organic" product?
Where are they located? How much are they willing to pay? Research into markets for
organic produce would enable targetting of specific products and consumer groups by the
industry. The principle beneficiaries of this research are commercial industry interests, and
private companies are already undertaking this type of marketing study. Therefore,
publicly funded agencies have little role in this area.

147
(7) One of the principle choices for the OF industry is whether to remain solely with Bio
Oro. or whether to consider alternative quality standards such as residue-tested produce. A
higher initial investment would be necessary to launch a totally new product than would be
required to develop Bio Oro. At this stage, the most important limitation of a less rigorous
organic food trademark than Bio Oro is the likely opposition from practicing organic
fanners. Initially, an alternative standard may be counterproductive to the OF in~ustry, in
that practicing organic producers (who are already struggling financially) may be undercut
by lower prices for an alternative health food product. If a public agency such as the MAF
launched a new alternative food label, this would be likely to create a further obstacle to
cooperation between producer and public agency. If a significant proportion of consumers
demand a product other than Bio Oro, this niche would be met by private marketing
bodies. Public agencies such as the MAF therefore h~ve little role in establishing a new
organic food trademark. If a new trademark is promoted, it will be important to establish
what role IFOAM is likely to have in the future: Will IFOAM standards be adopted by
overseas countries to the exclusion of other organic and low-chemical trademarks? If so,
how widespread is this likely to be, and with what effect on market access?
(8) Another marketing choice is between an export or domestically-oriented industry, or
both. Available infonnation suggests that sufficient consumer demand exists to concentrate
on domestic marketing, which also has cost and risk advantages over exports. A sound
domestic industry could later act as a springboard to export markets. Further development
of the industry, including an increase in the number of suppliers and improved
organisation, is necessary before the potential benefits of exports (large market size, higher
retail prices, and foreign exchange) are likely to be returned to New Zealand producers.
(9) No matter where organic produce is sold, the existing market infrastructure is a major
constraint to the industry. The lack of coordination of marketing activities greatly limits
the ability of producers to sell organic produce and to provide processors, distributors and I,
retailers with large, reliable supplies. By improving the existing level of industry
organisation, fanners could sell a greater volume of produce on the organic nlnrket nnd
thereby improve farm income. This would in turn induce farmers to adopt OF. The
uncertainty of organic food markets, which was a significant deterrent to adopting OF.
would be reduced. In addition. the effective size of organic food markets would expand
because producers would be able to supply bulk orders. This would enable a larger
number of producers to adopt OF without the risk of oversupply and a decline in price
premiums. The ability to supply large orders is also essential if a significant export
industry is to develop. An improved infrastructure would be necessary to coordinate
research and the diffusion of information, and to ensure standardised quality control.
Public funding would initially be required to develop a commercial infrastructure because

148
barriers exist to farmers becoming organised into groups, such as the cost of establishing a
large organisation. The existing infrastmcture, skills and experience of the MAF are well
suited to establishing a nation-wide industry network. Joint funding of a BPC and MAF
initiative to establish a marketing infrastructure for organic produce is likely to be the most
cost-effective use of public funds in the area of marketing. A MAF initiative which was
viewed as separate and independent would be resisted by some organic producers, who
strongly expressed their desire to retain control over industry decisions.

149
ACKNOWLEDGEMENTS
I would like to thank a number of people and organisations who made this study
possible. First, I am indebted to the farmers who willingly gave their time and energy
to the research project, and who openly discussed their personal views and experiences.
I began the study knowing very little about organic farming, and what I have learnt has
been based largely' on their expeltise. Other members of the organic farming industry
have been very helpful and provided stimulating ideas, notably Bob Crowder, Nigel van
DQrsser , Jon Manhire, Warwick Hobbs and David Musgrave. The Biological Producers
Council, Bio-Dynamic Farming and Gardening Association and Soil and Health
Association allowed me access to a considerable amount of information over the last
year.
Ken Leathers, my supervisor. has been an excellent guide throughout the study. Ken
has kept me on track, introduced new perspectives and at the same time allowed me
considerable freedom of thought. John Hayward and the people in the Centre for
Resource Management have provided an enjoyable and stimulating working
environment. I would particularly like to thank Angus MacIntyre for his constructive
and incisive criticism of my work. Lincoln College provided funding for the survey
research, and is increasingly becoming committed to research of 'alternative'
agriculture. John Lay and Gerald Frengley were extremely helpful and patient in
explaining the 'conventional' Canterbury farm. Thanks also to John Fairweather and
Tom .Makowski for their ideas and criticisms of the sociological aspects of organic
farming. and Charles Lamb f~r his marketing expeltise. Trevor Atkins and Mike Daly
of the Ministry of Agriculture and Fisheries provided useful criticisms, ideas and
information.
The fact that I have emerged from the study with (most of) my sanity intact has been
due to the SUpp0l1 of my friends and flatmates. especially Gahan. Phil1ipa. Kees. John.
Ross. Ken. Paul and Linda.
150
REFERENCES
ALDAG, R. Simple and diversified crop rotations - approach and insight into agroecosystems. p.l00-114. In: Schulze, E.D. and Zwolfer, H.; editors. Ecological Studies, Vol. 61. Berlin, Springer-Verlag, 1987.
ALRECK, P.L.; SETTLE, RB. The sUivey research handbook. Illinois: Richard D. Irwin, 1985.
ALTIERI, M.A.; editor. Agroecology - the scientific basis of alternative agriculture. Division of Biological Control, University of California, Berkeley, 1983.
ALVENSLEBEN, R von. (Consumer attititudes to "biologically" produced fruit and vegetables). Agra Europe 22(14), 1981. From: CAB Abstracts 1972-1983, 1415168 OR024-00858.
ALVENSLEBEN, R. von ; ALTMANN, M. The demand for organic food: results of a consumer survey. (Translated from German). Agranvirtshaft 35(10) : 289-295, 1986.
ANDERSON, P.R.D. Impediments to the development and use of alternative energy technologies. Thesis, M.Sc., University of Canterbury, New Zealand. 1984.
AUBERT, C. Conversion to biological agriculture. p.22-25. In: Hill, S.; Ott, P.; editors. Basic techniques in ecological farming: 1978 !FOAM conference proceedings. Basil, Switzerland: Birkhauser, 1982.
BABB, E.M.; LONG, B.F. The role of alternative agriculture enterprises in a changing agricultural economy. Southern Journal of Agricultural Economics July 1987 : 7-20.
BAKER, R. Biological control of plant pathogens: definitions. p.25-39. In: Hoy, M.A.; Herzog, D.C.; editors. Biological control in agriculturallPM systems. Orlando, Florida: Academic Press, 1985.
BEASLEY, RP.; GREGORY, J.M.; McCARTY, T.R. Erosion and pollution control, 2nd edition. Ames: Iowa State University Press, 1984.
BERARDI, G. Organic and conventional wheat production: examination of energy and economics. AgroEcosystems 4 : 367-376, 1978.
BILBROUGH, A.I. Personal communication. 1988.
BIO-DYNAMIC FARMING AND GARDENING ASSOCIATION OF NEW ZEALAND. Sample Demeter contract. 1988.
BIOLOGICAL PRODUCERS COUNCIL. Draft oj the Bio Gro Standard for Organic Food Production. July 1988.
BLAKE. H. The social impacts oj hortiClIltural development in Canterbury. Dissertation. MSc. University of Canterbury, New Zealand. 1984.
BLOBAUM, R. Barriers to conversion to organic farming practices in Midwestern United States. In: Lockeretz, W.; editor. Environmentally sOllnd agricullllre: 1982 IFOAM cOI~rerence proceedings. New York: Praeger, 1983.
BREIMYER, R.F. Economics of farming systems. p.163-166. In: Bezdicek, D.F.: Power. J.F.: editors. Organic farming: curre1ll technology and its role in a slIstainable agriculture. American Society of Agronomists, Special Publication No. 46. 1984.
BRODIE, R.;AMEYDE, A. van. Advertising and promotion. p.15.1-15.11. In: Wallace, L.T.; Lattimore, R.; editors. RuraL New Zealand - what next? Lincoln College, University of Canterbury, New Zealand, 1987.
BUTTEL, F.R.; GILLESPIE, G.W. Jr.; JANKE, R; CALDWELL, B.; SARRANTONIO, M. Reduced input agricultural systems: a critique. The Rural Sociologist 6(5) : 350-370, 1986.

151
CACEK, T.; LANGNER, L.L. The economic implications of organic farming. American Journal of Alternative Agriculture 1(1) : 25-29, 1986.
CAMERON, K.C.; HAYNES, RJ. Retension and movement of nitrogen in soils. p.166-241. In: Haynes, RJ., Cameron, K.C., Goh, K.M.; Sherlock, R.; editors. Mineral nitrogen in the plant soil system New York: Academic Press, 1986.
CARSON, R Silent Spring. London: Hamish Hamilton, 1963.
CARTER, H.O.; LOHR, L. Efficiency and productivity concepts and issues for a sustainable agriculture. p.145-168. In: Sustainability of California Agriculture. A Symposium. University of California, 1986. .
CHARMAN, P.E.V.; editor. Conservation farming. Soil Conservation Service of New South Wales, February 1985.
CHIAO, Y.S. Is the recent sharp drop in fertiliser usage a major concern for pastoral production? Unpublished manuscript, Policy Services, MAFCorp, Wellington, 1989.
CLARK, M.B.; BURTT, E.S.; editors. Lincoln College technical budget manual. Department of Farm Management and Valuation, Lincoln College, University of Canterbury, 1986.
CLARK, M.B.; FLEMING, P.H.; BURTT, E.S.; editors. Lincoln Col/ege financial budget manual. Department of Farm and Property Management, Accounting and Valuation, Lincoln College, University of Canterbury, 1988 and previous editions.
COLEMAN, E. Toward a new MacDonalds farm. p.50-55. In: Edens, T.C.; Fridgen, C.; Battenfield, S.L.; editors. Sustainable agriculture and integratedfarm systems: 1984 /FOAM conference proceedings. East Lansing: Michigan State university Press, 1985.
COMBELLACK, J.H. Resource allocations for future weed control activities. (Unpublished research paper) Department of Conservation, Forests and Lands, Keith Turnbull Research Institute, Australia, 1988.
CONACHER, A.; CONACHER, J. Organic farming in Australia. Geowest No.18, Occasional Paper, Department of Geography, University of Western Australia, December 1982.
CONVERSE, J.M.; PRESSER, S. Survey questions. Sage University Paper 63, California, 1986.
CONWAY, G.R The properties of agroecosystems. Agricultural Systems 24 : 95-117, 1987.
CROSSON, P.R.; OSTROV, J.E. Alternative agriculture: sorting out its environmental benefits. Resources Summer 1988 : 13-16.
CULIK, M.N. The KlIIztown farm report - a study of a low-input crop/livestock farm. Kutztown, Pennsylvania: Rodale Research Centre, 1983.
CUTTING, O. Growing market for 'conservation grade' cereals. Arable' farmil1g Fdwunry I QRf' : 17-28.
DALECKI, M.G.; BEALER, B. Who is the 'organic' farmer? The' Rliral Sociologist 4(1) 11-18, 1984 _
DAVIES, G.P.; BARRACLOUGH, D. Nitrate leaching at Rushall farm Wiltshire 1985-88. IFOAM 7 : 3-5, 1989.
DOMANICO, J.L.; MADDEN, P.; PARTENHEIMER. E.J. Income effects of limiting soil erosion under organic, conventional, and no-till systems in Pennsylvania. American Jounal of Alternative Agriculture 1(2) : 75-82, 1986.
DOVER, M; TALBOT, L.M. To feed the Earrh: agroecology for sustainable development. World Resources Institute, 1987.
DURING, C. Fertilisers and soils in New Zealand farming. Government Printer, Wellington, 1984.

152
EASTON, B. Agriculture in New Zealand's economy. p.2.1-2.14. In: Wallace, L.T.; Lattimore, R; editors. Rural New Zealand - what next? Lincoln College, University of Canterbury. New Zealand, 1987.
ECKERSLEY, R. Green politics and the new class: selfishness or virtue? Centre for Environmental Studies, University of Tasmania, 1988.
ELLIS, F. Peasant economics: farm households and agrarian development. Cambridge, Cambridge University Press, 1988.
ELM FARM RESEARCH CENTRE (EFRC). COllverting to Organic Farming. Hamstead Marshall, Berkshire, 1986.
van ES, J.C. The adoption/diffusion tradition applied to resource conservation: inappropriate use of existing knowledge. The Rural Sociologist 3(2): 76-81, 1986.
FAIRWEATHER, J. Farm size and population. p.4.1-4.14. In: Wallace, L.T.; Lattimore, R; editors. Rural New Zealand - what next? Lincoln College, University of Canterbury, New Zealand, 1987.
FAIRWEATHER, J.R Farmers' responses to economic restructuring: preliminary analysis of survey data. Research Report 187. Agribusiness and Economics Research Unit, Lincoln College, University of Canterbury, New Zealand, July 1987a.
FAMILTON, A.S.; NICOL, A.M.; MCANULTY, R Epidemiology of internal parasites of sheep on irrigated pasture and the possible control measures. Sheep and Beef CallIe Society of the New Zealand Veterinary Association: proceedings of the Society's 16th seminar, Massey University, New Zealand, 1986.
FDA CONSUMER. Shopping for the second 50 years. July-August 1986 : 29-31.
FOOD ENGINEERING. Is natural better? June 1987 : 97-103.
FOOD TECHNOLOGY. How safe is your food? July 1988 : 20-22.
FOSTER, G.S.: MILEY, J.D. Organic farmers and organic nonfarmers: the social context of organic agriculture. The Rural Sociologist 3(1) : 16-22, 1983.
FRENGLEY, G.A.G. Personal communication. 1988.
GALLOWAY. J. MAFTech gets serious about organics. AgriSearch November 19884-5.
GEIER, B. (President of IFOAM). Unpublished paper presented to Soil and Health Association Annual Conference, 1988.
GIBBS, RJ. Changes in soil stmcture under different cropping systems. Thesis. PhD, Lincoln College. University of Canterbury, New Zealand. 1986.
GREENE, J.; McCLINTOCK, C. Triangulation in evaluation - design and analysis issues. Evaluation Review 9(5) : 523-545, 1985.
HAINES, M. An introduction to farmillg systems. London: Longman. 1982.
HARRIS, C.K.; POWERS, S.E.; BUTTEL. F.H. Myth and reality in organic fan)ling: a profile of conventional and organic farmers in Michigan. In: Dalecki. M.G.: Bealer. B. Who is the "organic farmer"? The Rural Sociologist 4(1): 11-18. 1984.
HART, RD. Ecological framework for multiple cropping research. p.40-56. In: Francis, C.A.; editor. Multiple cropping systems. New York: MacMillan.
HARTE, A.J.; PACKER, LJ. Stubble management. p.32-36. In: Charman, P.E.V.; editor. Conservation Farming. Soil Conservation Service of New South Wales, February 1985.
HAYAMI, Y.; RUTTAN, V.W. Agricllltural development: an international perspective. Baltimore : John Hopkins Press, 1971.

153
HAYNES, RJ.; SWIFT, RS. The beliefs of organic farmers. New Zealand Journal oj Agriculture, March 1984 : 9-10.
HAYSTEAD, A. Organic farming survey. Soil and Health Spring 1987 : 8-12.
HIDE, R; SHARP, B. A critical examination oj subsidy to catchme1l1 works and proposals Jor reJonn. Draft final report to Ministry of Works and Development, Centre for Resource Management, Lincoln College, University of Canterbury, New Zealand. 1986.
HORTICULTURAL MARKET RESEARCH UNIT (HMRU). Organic horticulture - New Zealand production and export prospects. 1986.
HOWARD, Sir A. An agricultural testament. London: Oxford University Press, 1943.
HOWARD, K. A perspective on hazard and risk. Abstract of a manuscript presented to the Nutrition Society of New Zealand Annual Conference, 1988.
HOWE, K.R Two dogmas of educational research. Educational Researcher October 1985 : 10-18.
HUFFAKER, C.B. Biological control in integrated pest management: an entomological perspective. p.13-23. In: Hoy, M.A.; Herzog, D.C.; editors. Biological control in agricultural 'PM systems. Orlando, Florida: Academic Press, 1985.
HUNT, D. Responsibility to future people. p.61-76. In: J. Howell; editor. Environment and ethics - a New Zealand c01l1ribution. Centre Jor Resource Managemel1/, Lincoln College, University oj Cal1/erbury, 1986.
HUNTER, G.G.; LYNN, I.H.; PRICKETT, R.C. New Zealand land resource inventory. South Island stock carrying capacity supplement. National Water and Soil Conservation Organisation, 1983.
JACKSON, T.A.; PEARSON, J.F.; BROAD, T.M.; O'CALLAGHAN, M.; MAHANTY, H.K. Surface application of the bacterium Serratia elltomophila for the control of grass grub in Canterbury. Proceedings of the 41st Weed and Pest Col1/rol Conference, p.108-Il2, 1988.
JOHNSON, G.L. Technological innovations with implications for agricultural economics. p.82-104. In: Hildreth, RJ.; Lipton, K.L.; Clayton, K.C.; O'Connor, C.C.; editors. Agriculture and rural areas approaching the twenty-first cenllIry - challenges Jor agricultural economics. Ames, Iowa: Iowa State University Press, 1988.
KLEPPER, R.; LOCKERETZ, W.; COMMONER, B:; GERTLER, M.; FAST, S.; O'LEARY, D.; BLOBAUM, R. Economic performance and energy intensiveness on organic and conventional farms in the Corn Belt: a preliminary comparison. American Journal of Agricultural Economics February 1977 : 1-12.
LACY, H. de. Profitability the yardstick. not semantic argument. New Zealand Journal of Agriculture November 1987: 28.
LAMB, C.G. Meat: a consumer survey of Christchurch households. Department of Agricultural Economics and Marketing, Lincoln College, University of Canterbury, November 1987.
LAMB, C.G. Personal communication. 1988.
LAMPKIN, N. Biological farming systems in Europe. p.84-95. In: Edens, T.e.; Fridgen. C.: Battenfield, S.L.; editors. Sustainable agriculture and illtegratedfarm systems: 19841FOAM conference proceedings. East Lansing: Michigan State university Press, 1985.
LAY, J.K. Personal communication. 1988.
LIENER, I.E.; editor. Toxic constituents in food. New York: Academic Press, 1980.
LOCKERETZ, W.; SHEARER, G.; KLEPPER, R.; SWEENEY, S. Field crop production on organic farms in the Midwest. Journal of Soil and WaleI' Conservation May/June 1978 : 130-134.
LOCKERETZ, W.; SHEARER, G.; KOHL, D.H. Organic farming in the cornbelt. Science 211 : 540-547, 1981.

154
LOCKERETZ, W.; WERNICK, S. Commercial organic farming in the corn belt in comparison to conventional practices. Rural Sociology 45(4): 708-722~ 1980.
LOFLAND, J.; LOFLAND, L.H. Analysing social settings: A guide to qualitative observation and analysis. 2nd. edition. Belmont, California: Wadsworth, 1984.
LOWE, P.D.; RUDIG, W. Review article: Political ecology and the social sciences - the state of the art. British Journal of Political Science 16 : 513-550, 1986.
LOWRANCE, R.; STINNER, B.R, HOUSE, G.J. Agricultural ecosystems - unifYing concepts. New York: John Wiley and Sons, 1984. .
McARTHUR, A. Innovation, information and communication. p.3.1-3.1O. In: Wallace, L.T.; Lattimore, R; editors. Rural New Zealand - what next? Lincoln College, University of Canterbury, New Zealand, 1987.
McCHESNEY, LG.; BUBB, J.W.; PEARSON; R.G. Energy use on CanterbUlY mixed cropping farms: a pilot survey. Joint Centre for Environmental Sciences, Occasional Paper No.5, Lincoln College, University of Canterbury, New Zealand. May 1978.
MaclNTYRE, A.A. Why pesticides received extensive use in America: a political economy of agricultural pest management to 1970. Natural Resources Journal 27(3): 533-578, 1987.
MADDEN, P. The future of alternative agriculture. Forum for applied research alld public policy Summer 1988: 71-78.
MANHIRE, J. Personal communication. 1988.
MANN, P.H. Methods of sociological enquiry. Oxford: Basil Blackwell, 1976.
MEAT AND LIVESTOCK COMMISSION (MLC). Specialist markets Jor alternative meat production systems. June 1987.
MITCHELL, R. The ecological basis for comparative primary production. p.13-54. In: LOWRANCE, R; STINNER, B.R., HOUSE, G.J. Agricultural ecosystems - IInifjing concepts. New York: John Wiley and Sons, 1984.
MITCHELL, R.C. National environmental lobbies and the apparent illogic of collective action. p.87-121. In: Russell, C.S.; editor. Collective decision-making: applications from public choice theory. Baltimore: John Hopkins University Press, 1979.
MORLEY, F.H.W.; DONALD. A.D. Farm management and systems of helminth control. Veterinary parasitology 6 : 105-134. 1980.
MURRAY, P.H. Attitudes and Opinions of High Coulllry Pastoral Farmers Concerning Exotic Forestry. Thesis, M.AppI.Sc., University of Canterbury, New Zealand. 1986.
D. MUSGRAVE. Personal communication. 1988.
NAKAJIMA, N. Subjective equilibrium theOlY of the farm household. Tokyo. Elsevier. 1986.
NEW ZEALAND DEPARTMENT OF SCIENTIFIC AND INDUSTRIAL RESEARCH. General swwy of the soils of the South Island, New Zealand. Soil Bureau Bulletin No. 27, Government Printer, Wellington, 1968.
NEW ZEALAND DEPARTMENT OF STATISTICS, New Zealalld OJficial Yearbook /988-89. 93rd edition. Wellington, 1988.
NEW ZEALAND FARM PROGRESS. Various issues.
NEW ZEALAND MEAT AND WOOL BOARDS' ECONOMIC SERVICE, Annual review of the New Zealand Sheep and Beef Industry 1987-88. August 1988.
NEW ZEALAND MEAT AND WOOL BOARDS' ECONOMIC SERVICE. The New Zealand Sheep and Beef Farm Surveys and Supplements to the New Zealand Sheep and Beef Farm Surveys, 1967-86.

155
NEWTON, M.; HOWARD, K.M.; KELPSAS, B.R.; DANHAUS, R.; LOTTMAN, C.M.; DUBELMAN, S. Fate of glyphosate in an Oregon forest ecosystem. Journal of agricultural and food chemistry 32(5): 1144-1151, 1984.
NOWAK, P.J. Adoption and diffusion of soil and water conservation practices. The Rural Sociologist 3(2): 83-89, 1983.
O'CONNOR, K.F. Pastures and soil fertility. Chapter 5. In: Langner, R.M.H.; editor. Pasture and pasture plaJlls: the New Zealal/d perspective. Oxford: Oxford university Press, 1989.
ODUM, E.P. Properties of agroecosystems. p.5-11. In: Lowrance, R.; Stinner, B.R., House, G.J. Agricultural ecosystems - unifying concepts. New York: John Wiley and Sons, 1984.
OELHAF, R.C. Organic agriculture - economic and ecological comparisons with convetttional methods. Monclair : Allanheld, Osmun, 1978.
OLSON, K.D.; LANGLEY, J.; HEADY, E.O. Widespread adoption of organic farming practices: estimated impacts on U.S. agriculture. Journal of Soil and Water Conservation. JanuaryFebruary 1982 : 41-45.
OLSON, M. The logic of collective action: public goods and the theory of groups. Cambridge: Harvard University Press, 1971. .
PERELMAN, M. Natural resources and agriculture under capitalism: Marx's economic model. American Journal of Agricultural Economics. November 1975: 701-704.
PIGRAM, J.J. Agricultural systems in transition. Agricultural Systems 2(1): 3-15, 1977.
PIMENTEL, D.; GLENISTER, C.; FAST, S.; GALLAHAN, D. An environmental risk assessment of biological and cultural controls for organic agriculture. p.73-83. In: Lockeretz, W.; editor. Environmentally sound agriculture: 1982 [FOAM conference proceedings .. New York: Praeger, 1983.
PODOLINSKY, A. Bio-dynamic agriculture: introductory lectures. Sydney: Gavemer Foundation Publishing, 1985.
POTTINGER, R.P.; LANE, P.M.S.; EAST, R. Pasture renovation for greater productivity. Ruakura Agriculture Centre, Ministry of Agriculture and Fisheries, 1987.
PRYDE, J. Capital and agriculture. p.6.1-6.14. In: Wallace, L.T.; Lattimore, R.; editors. Rural New Zealand - what next? Lincoln College, University of Canterbury, New Zealand. 1987.
PRYDE, J.; McCARTIN, P.J.Survey offarmer intentions and opinions, October-December 1986. Agribusiness and Economics Research Unit Research Report 188, Lincoln College, University of Canterbury, August 1987.
QUIN. B.F.; BURDEN. R.J. The effects of land use and hydrology on groundwater qualitv in Mid-Canterbury. New Zealand. Progress in Water "fecllllology 11(6) : 433-448. 1979.
RAYNER, T. Regulation. p.20.1-20.10. In: Wallace. L.T.: Lattimore. R.: editors. Rum! Nell" Zealand - what next? Lincoln College. University of Canterbury. New Zealand. 1987.
REGANOLD, J.P.; ELLIOTT, L.F.: UNGER. Y.L. Long-term effects of organic and conventional farming on soil erosion. Na/ure 330 : 370-372. 1987.
ROBERTS. A.H.C.; THOMSON, N.A. The consequence of not applying superphosphate fertiliser on Taranaki dairy pasture. Proceedings of the New Zealand Grassland Association 49 : 161-165, 1988.
ROGERS, E.M. Diffusion of innovations, 3rd edition. New York: The Free Press, 1983.
ROGERS, E.M.; SHOEMAKER, F.F. Communication of innovations: a cross-cultural approach. New York: The Free Press, 1978.
ROSS, A.D.; editor. Control of internal parasites of sheep. Animal Industries Workshop, Lincoln College, 1982.

156
ROUNTREE,J.H. Systems thinking - some fundamental aspects. Agricultural Systems 2(4) : 247-254, 1977. .
RUTTAN, V. Planning technological advance in agriculture: the case of rice production in Taiwan, Thailand and the Philippines. Ch.3. In: Solo, R.A.; Rogers, E.M. Inducing technologicaL change for economic growth and developmell1. Michigan: Michigan State University Press, 1972.
SAHS, W.W.; HELMERS, G.A.; LANGEMElER, M.R. Comparative profitability of organic and conventional crop production systems in east-central Nebraska. p.397-405. In: Allen, P.; Dusen, D. van; editors. Global perspectives on agroecology and sustainable agricultural systems. Proceedings of the 6th International Scientific Conference of the IFOAM. Agroecology program, University of California, Santa Cruz, 1988.
SCHUMACHER, E.F. Small is beaLllifuL: a study of economics as if people mattered. London : Abacus, 1974.
SNEDECOR, G.W.; COCHRAN, W.G. Statistical methods. 6th edition. Iowa: Iowa State University Press, 1967.
SCOTT, J. Personal communication. 1988.
SCOTT, R Policy and prospects. Soil and Health, Winter 1987 : 14-15.
SCOTT, W.R. Improving wheat quality by agronomic management. Proceedings Agronomic Society of New Zealand 11 : 91-98, 1981.
SOLO, RA. Technology transfer. Ch.l In: Solo, R.A.; Rogers, E.M. Inducing technological change for economic growth and deveLopment. Michigan: Michigan State University Press, 1972.
SOUTHERN PASTORAL LANDS COMMISSION. Report of the Commission to inquire into and report upon Southern Pastoral Lands. New Zealand House of Representatives, Appendix to the Journals. 1920 Volume 1: C-15.
STEINER, R. Agriculture: a course of eight lectures. London: Rudolf Steiner House, 1958.
TAUBER, M.J.; HOY, M.A.; HERZOG, D.C. Biological control in agricultural IPM systems: a brief overview of the current status and future prospects. p.3-9. In: Hoy, M.A.; Herzog, D.C.; editors. BiologicaL control in agricultural JPM systems. Orlando, Florida: Academic Press, 1985.
TAYLOR, D.L.; MILLER, W.L. The adoption process and environmental innovations: a case study of a government project. Rural sociology 43(4) : 634-648, 1978.
TAYLOR, J. (1987) Pointing the way to parasite control. New Farmer and Grower 1987: 26-27.
TAYLOR, N.; ABRAHAMSON, M.; WILLIAMS, T. Rural change: issues for sociaL research, social assessment and integrated rural policy. Discllssion Paper. Centre for Resollrce Management. Lincoln College, New Zealand. 1987.
THE ECONOMIST. March 2, 1985.
THE PRESS. Christchurch, New Zealand. 13 January. 1988.
TURNER, N. Fertility farming. London: Faber and Faber. 1951.
UNITED STATES DEPARTMENT OF AGRICULTURE. Report and recommendations on organic farming. 1980.
VINE, A.; BATEMAN ,D. Organic farming in Englalld and Wales: practice. peliormance and implications. Department of Agricultural Economics, The University of Wales, Aberystwyth, 1981.
WALL, R; STRONG, L. Environmental consequences of treating cattle with the anti-parasitic drug Ivermectin. Nature 327 : 418-421, 1987.

157
WALLACE, L.T.; R. LATTIMORE; editors. Rural New Zealand - what next? Lincoln College, University of Canterbury, New Zealand, 1987.
WEARING, C.H. Evaluating the IPM implementation process Annual Review of Entomology 33 : 17-38, 1988.
WERNER, J.; ALVENSLEBEN, R. von. Consumer attitudes towards organic food in Germany (F.R.). Acta horticulturae 155: s.221-227. 1984.
WHATMAN, A.C:W. Personal communication. 1988.
WHITE, A.; PAINTER, C. The dangers ~r pesticides. Abstract of a manuscript presented to the Nutrition Society of New Zealand Annual Conference. 1988.
WIDDOWSON, R. W. Towards holistic agriculture - a scientific approach. Oxford : Pergamon Press, 1987.
WILLIAMS, T. Testing the commercial waters for organic grain. AgriSearch November 1988 : 2-3.
WINWOOD, J. Food trends in the 1980·s. Food manufacture September 1987 : 61-63.
WOGAN, G.N.; BUSBY. W.F. Naturally occurring carcinogens. p.329-364. In: Liener, I.E.; editor. Toxic constituents in plant foodstuffs. 2nd ed. New York: Academic Press. 1980.
WOODMANSEY, R.G. Comparative nutrient cycles of natural and agricultural ecosystems: a step towards principles. p.145-156. In: LOWRANCE, R.; STINNER, B.R., HOUSE, G.J. Agricultural ecosystems - unifying concepts. New York: John Wiley and Sons, 1984.
WOODWARD. L.; FOSTER, L. The use of herbal leys in modern British organic farming systems. p.421-431. In: Allen, P.; Dusen, D. van; editors. Global perspectives on agroecology and sustainable agricultural systems. Proceedings of the 6th International Scientific Conference of the IFOAM. Agroecology program, University of California, Santa Cruz, 1988.
WOOKEY, B. Rushall - the story of an organic farm. Oxford: Basil Blackwell, 1987.
WYNEN. E; FRITZ. S. Sustainable agriculwre: a viable alternative. National Association for Sustainable Agriculture. Australia. Discussion Paper No.1, 1987.
YOUNGBERG. I.G.; BUTTEL. F.R. Public policy and sociopolitical factors affecting the future of sustainable farming systems. p.167-185. In: Bezdecik. D.F.; Power, J.F.; editors. Organic farming: current technology and its role in a sustainable agriculture. American Society of Agronomy. Special Publication No. 46. 1984.

158
APPENDIX A LETTER OF INTRODUCTION TO CANTERBURY ORGANIC
FARMERS
Dear Mr. Smith,
Centre for Resource Management,
Lincoln College,
Ph. 252 811·ext. 8716.
10 November, 1987.
I am a postgraduate student at Lincoln College undertaking a year
long study of organic farming in Canterbury. The study aims· to identify barriers to
adopting and practicing organic farming methods. Organic farming shows considerable
potential to expand. However a lack of information is available as to what changes are
required to convert a farm to organic methods, and what the consequences are likely to
be. The purpose of the study is to identify important issues, rather than to compare
organic and conventional farming.
At present, most organic farming expertise lies with organic farmers
themselves. J/ understand from Bob Crowder that you are a practicing organic farmer,
and I would very much like the chance to meet with you and discuss your views and
experiences. I will be calling you by telephone in the next week to see if you are
willing t9 take part in the study. All participating farmers will be sent a summary .of
the final report.
Yours sincerel y ,
Paul Fisher.
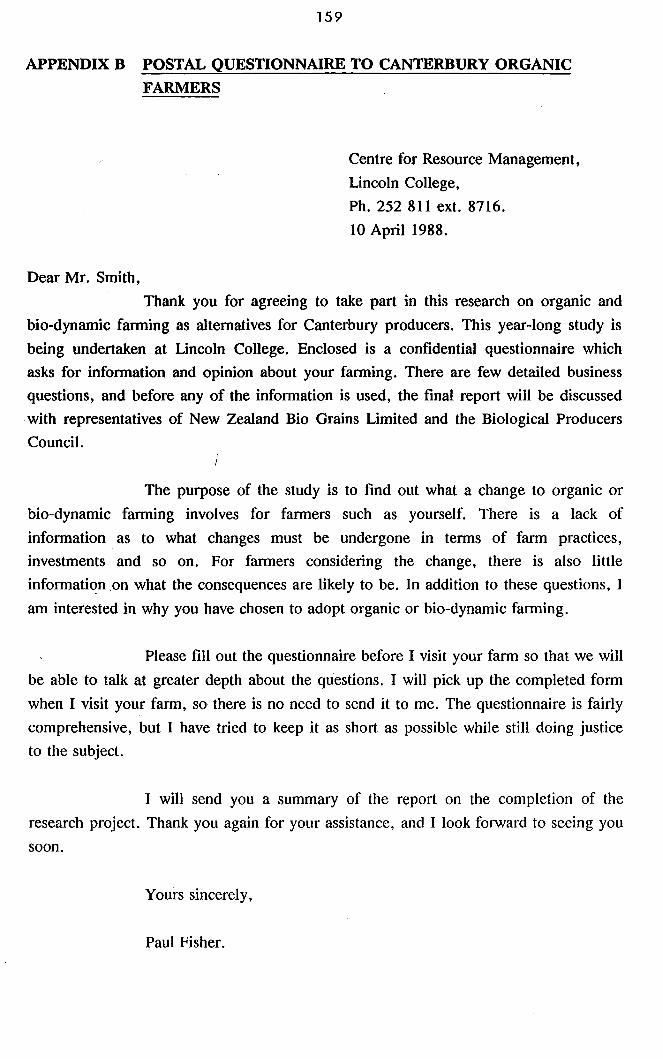
159
APPENDIX B POSTAL QUESTIONNAIRE TO CANTERBURY ORGANIC
FARMERS
Dear Mr. Smith,
Centre for Resource Management,
Lincoln College,
Ph. 252 811 ext. 8716.
10 April 1988.
Thank you for agreeing to take part in this research on organic and
bio-dynamic farming as alternatives for Canterbury producers. This year-long study is
being undertaken at Lincoln College. Enclosed is a confidential questionnaire which
asks for information and opinion about your farming. There are few detailed business
questions, and before any of the information is used, the final report will be discussed
with representatives of New Zealand Bio Grains Limited and the Biological Producers
Council.
The purpose of the study is to find out what a change to organic or
bio-dynamic farming involves for farmers such as yourself. There is a lack of
information as to what changes must be undergone in terms of farm practices,
investments and so on. For farmers considering the change, there is also little
infonnati~non what the consequences are likely to be. In addition to these questions, I
am interested in why you have chosen to adopt organic or bio-dynamic fanning.
Please fill out the questionnaire before I visit your fann so that we will
be able to talk at greater depth about the questions. I will pick up the completed form
when I visit your farm, so there is no need to send it to me. The questionnaire is fairly
comprehensive, but I have tried to keep it as short as possible while still doing justice
to the subject.
I will send you a summary of the report on the completion of the
research project. Thank you again for your assistance, and I look forward to seeing you
soon.
Yours sincerely,
Paul Fisher.
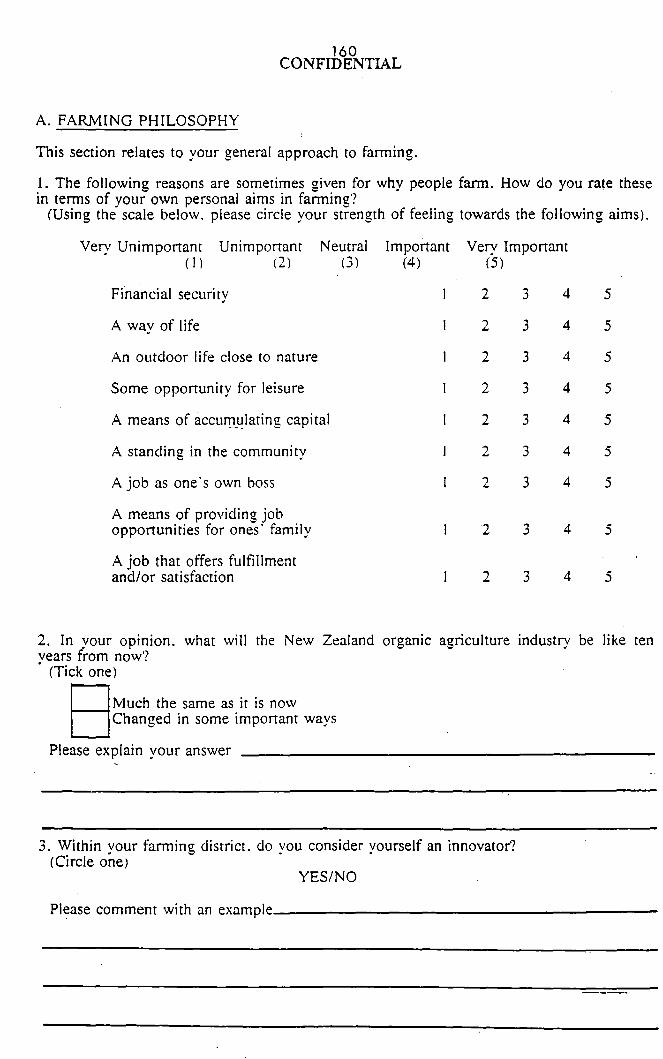
A. FARMING PHILOSOPHY
160 CONFIDENTIAL
This section relates to your general approach to fanning.
1. The following reasons are sometimes given fOf why people fann. How do you fate these in tenns of your own personal aims in fanning?
(Using the scale below. please circle your strength of feeling towards the following aims).
Very Unimportant Unimportant Neutral Important Very Important ( I ) (2 ) (3) (4 ) (5)
Fi"nancial security 2 3 4 5
A way of life 2 3 4 5
An outdoor life close ro nature 2 3 4 5
Some opportunity for leisure 2 3 4 5
A means of accumulating capital 2 3 4 5
A standing in the community 2 3 4 5
A job as one' sown hoss ., 3 4 5 4-
A means of providing job opportunities for ones' family 2 3 4 5
A job that offers fulfillment and/or satisfaction 2 3 4 5
2. In your opinIOn. what will the New Zealand organic agriculture industry be like ten vears from now? . (Tick one)
D Much the same as it is now D Changed in some important ways
Please explain your answer
3. Within your fanning district. do you consider yourself an innovator? (Circle one)
YES/NO
Please comment with an example _____________________ _

J61_ CONFIDENTIAL
4. How important were each of the following factors TO YOUR DECISION to begin Organic or BioDynamic farming?
(Circle one)
(Not important (I) Moderately important (2) Very important (3»
The improvement of soil fertility 2 3
Nutritional quality of the food you produced 2 3
Safety on the farm from not using chemicals 2· 3
Making the farm more self-sufficient (i.e.-reducing the need for off-farm inputs) 2 3
Increase the value of farm produce .., 3 ... Reduce farm input costs 2 3
Conserving energy resources 2 3
Improving stock health 2 3
Improving your lifestyle 2 3
Protecting the natural environment 2 3
A new challenge to me 1 2 3
Philosophical reasons 2 3
Other reasons (Specify) 2 3
Please comment
B. EXPERIENCE
1. For how many years have you lived on the property you now farm? YEARS -------
2. In what year did you first manage this farm? 19
3. In what year did you first start converting your farm to an Organic or Bio-Dynamic system (i.e. one that would comply to BioGro or Demeter (Bio-Dynamic) standards)? 19
4. For how many years have you been farming? YEARS -------
5. For how many years do" you intend to continue farming?
YEARS -------6. Do you hope to hand the farm over to your children at some time in the future?
(Circle one) ______________ ---"-YES/NO
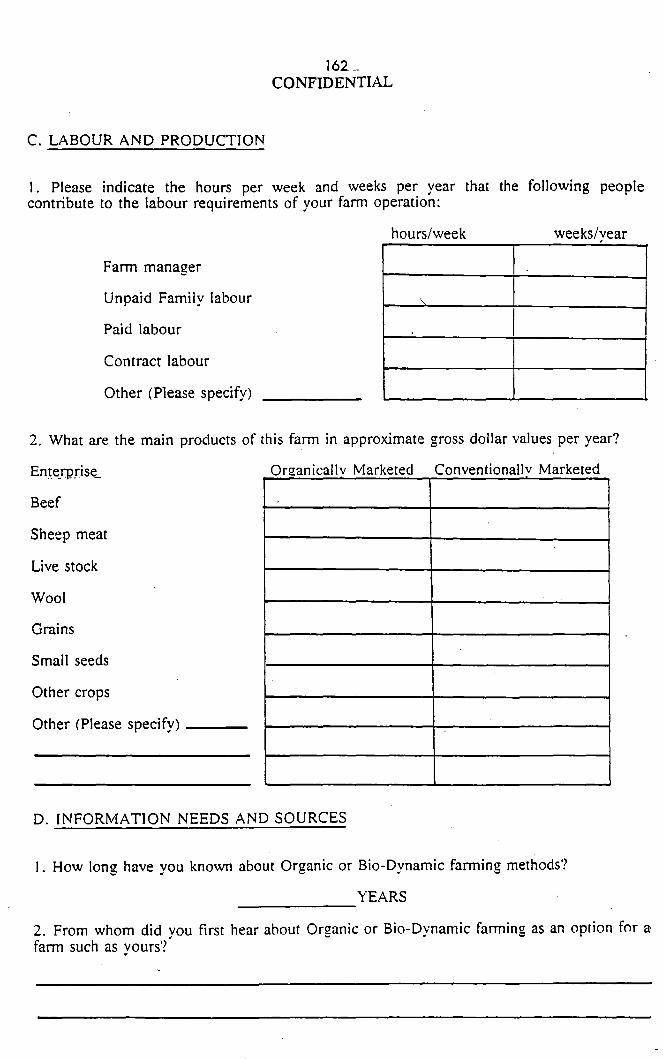
C. LABOUR AND PRODUCTION
162 __ CONFIDENTIAL
1. Please indicate the hours per week and weeks per year that the following people contribute to the labour requirements of your farm operation:
Farm manager
Unpaid Family labour
Paid labour
Contract labour
Other (Please specify)
hours/week weeks/vear .
'" . I
2. What are the main products of this farm in approximate gross dollar values per year?
Or!!anicallv Marketed Conventionallv Marketed
Beef
Sheep meat
Live stock
Wool
Grains
Small seeds
Other crops
Other (Please specify) __ _
D. INFORMATION NEEDS AND SOURCES
I. How long have you known about Organic or Bio-Dynamic farming methods?
YEARS -------2. From whom did you first hear about Organic or Bio-Dynamic farming as an option for a fann such as yours'?
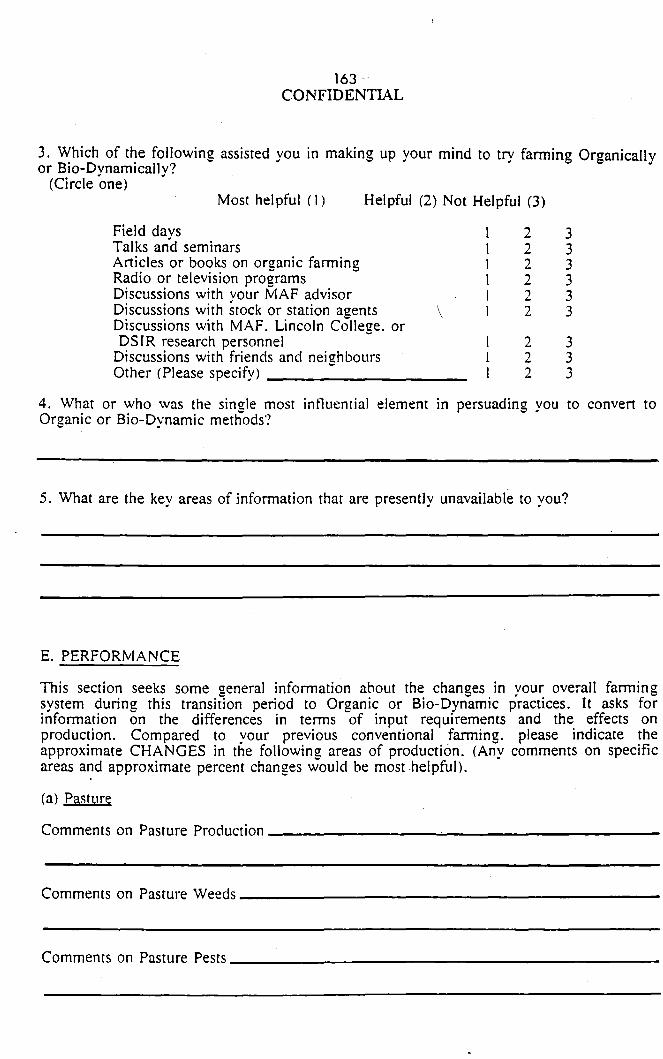
163·· CONFIDENTIAL
3. Which of the following assisted you in making up your mind to try fanning Organically or Bio-Dynamically?
(Circle one) Most helpful (I) Helpful (2) Not Helpful (3)
Field davs 2 3 Talks an"d seminars 2 3 Articles or books on organic fanning 2 3 Radio or television programs 2 3 Discussions with your MAF advisor .., 3 ... Discussions with stock or station a!!ents \ 2 3 Discussions with MAF. Lincoln College. or DS rR research personnel 2 3
Discussions with friends and neighbours 2 3 Other (Please specify) .., 3 ...
4. What or who was the sinczle most intluential element in persuading you to convert to Organic or Bio-Dynamic methods?
5. What are the key areas of infonnation that are presently unavailable to you?
E. PERFORMANCE
This section seeks some general infonnation about the changes in your overall fanning system during this transition period (0 Organic or Bio-Dynamic practices. It asks for infonnarion on the differences in tenns of input requirements and the effects on production. Compared to your previous conventional farming. please indicate the approximate CHANGES in the following areas of production. (Any comments on specific areas and approximate percent changes would be most .helpful).
(a) Pasture
Comments on Pasture Production ________________________ _
Comments on Pasture Weeds _______________________ _
Comments on Pasture Pests ________________________ _

-164 CONFIDENTIAL
(b) Livestock Productj,;tv
Livestock production costs / stock unit __ % higher / lower
Meat production / stock unit ______ % higher / lower
Wool production / srock unit ______ % higher / lower I
Comments
(c) Livestock Health
Lambing Percentage ______ % higher / lower
'Lambing Percentage last year was ................ %
Comments on Internal' Parasites ______________________ _
Comments on External. Parasites ______________________ _
_ Comments on Disease _. _________________________ _
(d)~
Crop production costs t ha . _-----% higher / lower .... ':.
Crop Yields: Wheat .: ______ % higher / lower
Other grains ~ _____ % higher / lower
Comments on these and other crops ____________________ _
Comments on Crop P~s--__ --------------------
Comments on Crop Dis.eases _______________________ _
Comments on Crop W·e·eds _______________________ _

(e) Lahour demand
165 CONFIDENTIAL
Labour time requirement _______ % higher / lower
Comments _________________________________________________________ ___
(f) Fuel consumption
_____ % higher / lower
Comments __________ ----------------------------------------------
(g) Feniliser costs
_____ COC higher / lower
Comments ________ -------------------------------------------
(h) A!Zrochemical costs
_____ % higher / lower
Commenrs __________ ---------------------------------------------
(i) Machiner\.' Costs. Repair" and Maintenonce. _____ % higher / lower
Conlmenrs _______________________________________________________ _
(j) Toral Fann Production Cnsts _____ '0 higher / lower
Commenrs, __________ ----------------------------------------------------
(k) Total Fann Gross Sale::
______ cc higher / lower
Comments
(I) Total Fann Net Income
_______ (:;. higher.' lower
Comments

166 CONFIDENTIAL
2. Taking every thing into account. how satisfied are you with the results from farming Organically or Bio-Dynamically thus far?
§ comPletelY satisfied . Moderately satisfied. or
Not at all satisfied?
3. List in order of importance the main advantage(s) of fanning Organically or Bio-Dynamically on this property.
Most important
2nd -----------------------------------------------------------3rd ______________________________________________________________ __
4th ------------------------------------------------------------4. List in order of importance the main problems or difficulties in farming organically on this property.
Nlost important __________________________________________________________ __
2nd ~----------------------------------------------------------
3rd --------------------------------------------------------------------4th ---------------------------------------------------------------------5. Whv are there presently so few Canterburv cropping and livestock fanners fanning or!!anicallv'? .... .
6. What changes could be made ro encourage the future of organic fanning in Canterbury?
F. INSTITUTIONS
I. What attitudes or reactions. if any. have you perceived from businesses you deal with (such as agrochemical companies and their representatives. and srock and station agents) to your conversion to organic fanning? (Please explain or give examples if possible).
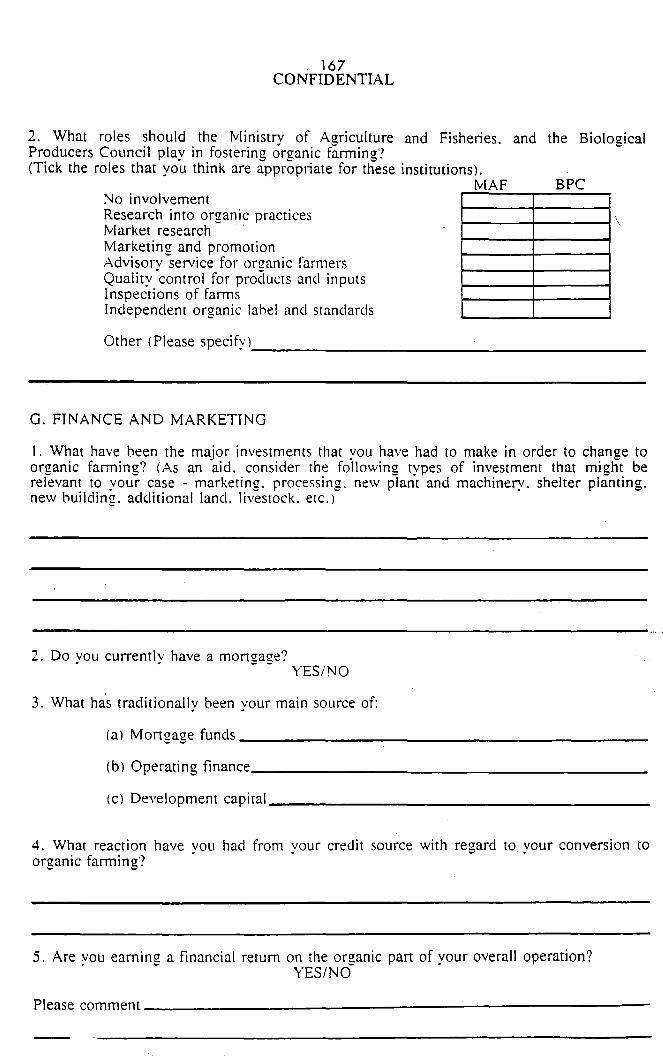
167 CONFIDENTIAL
2. What roles should the Ministry of Agriculture and Fishelies. and the Biological Producers Council play in fostering organic farming? (Tick the roles that you think are appropliate for these institutions).
MAF BPC No involvement Research into organic practices \ Market research . Marketing and promotion Advisorv service for org:anic farmers Quality 'control for products and inputs I nspections of farms Independent organic label and standards
Other (Please specify) ----------------------------------------------
G. FINANCE AND MARKETING
I. What have been the major investments that you have had to make in order to change to organic farming? (As an aid. consider the following types of investment that might be relevant to your case - marketing. processing. new plant and machinery. shelter planting. new building. additional land. livestock. etc.)
2. Do vou currentlv have a mortg:ag:e? . . - - YES/NO
3. What has traditionally been your main source of:
(a) ~Iortgage funds ______________________________________________ __
(b) Operating finance ______________________ _
(c) Development capital _______________________________________ _
4. What reaction have you had from your credit source with regard to your conversion to organic farming?
5. Are you earning a financial return on the organic part of your overall operation? YES/NO
Please comment ________________________________ _

_168 CONFIDENTIAL
6. Is the premium market price for organic produce essential to the profitability of your organic operarions?
YES/NO
7. If there was no special market for organic produce. would you: (Tick one)
§'Remain chemical-free Use some chemicals but less than you used in the past Return to the way you were farming before
Please comment _____________________________ _
H. SOCIAL
I. What associations are vou a memher of? (for example farmer groups. organic groups. marketing bodies. sporring grollps. Church)
+
2. Do vou hold offices in any of the above associations? " "YES/NO
3. Have you personally taken any steps to promote organic farming in your area? YES/NO
Please comment -------------------------------------
I. PERSONAL INFORMATION
I. Your age ______ Years
2. Place of birth of (i) yourself ______________________ _
(iil your spouse
3. Please list any formal or post-secondary qualifications
4. Does your familv have any other sources of income besides farrnin!!'? " " "YES/NO -

_169_ CONFIDENTIAL
5. What percentage of your total household income comes from off the farm?
% ------6. Your total family income falls into which group?
(Tick one)
~ $0 - $ 9 999 $ 1 0 000 - $ 1 9 999 $20 000 - $29 999 >$30 000

170
APPENDIX C INTERVIE"r SURVEY FORM FOR CANTERBURY ORGANIC FARMERS
Stress confidentiality of answers.
A GENERAL FARM CHARACTERISTICS
For this part of the interview. I want to get a picture of the main characteristics of your farm. and check the details that I have taken from the BPC inspections.
Postal Address
Telephone Number __________ _
The farm is located on ______ ---.,-__ Rd.
A.I Area ORGANIC CONVENTIONAL TOTAL
All enterprises ha ha ha
Permanent Pasture ha ha ha
Crop Rotation: Crops ha ha ha
Temo Past ha ha ha
A.2Soils'
The main soil types and their properties are:
TYPE I HA I FERTILITY COLLOID .,.- D R.A.I NAG E (H/ivl/U (LM/H) (P/tvllG)
I I I \
I Have you had any soil tests recei1tly'?
YES / NO
What are the main nutrient deficiencies of your soil?
Before vou chanl!ecl to an orl!anic or BioDvnamic svstem. what \vas the condition of thei soil compared to ·your neighbo-urs'? Was it: . .
WORSE THAN ( I) ABOUT THE SAME (2) BETIER THAN (3) o

171
CONFIDENTIAL
A.3 What is the contour of most of the farm?
Flat (I) Rolling (2) Steep (3)
I rri Irati on
HA PERCENT OF FARM AREA
- - - - - -A.4 What is your water source? ____________________ ..:..-. __ _
Wh . f f ... d') (ff at proportIon 0 your arm IS Irngate ............... 10
What irrigation methods do you use?
Do you have any plans to increase your irrigation system'? YES/NO
BECAUSE -------------------------------------
A.5 Are there any other notable physical characte:isrics (such as wind. erosion. temperature. location. stones) of your farm that limit or affect your production?
A.6 Shelter
Assessment of shelter planting on the property'?
Little shel ter (1) Average shelter (2) Extensive shelter (3) Extensive planting (4)
D Do you have plans to increase the shelter?
YES/NO Comments ___________________________________ __

B ENTERPRISES
B.1 Livestock
type
B.2 Crops
type
breed
172 CONFIDENTIAL
age class
variety
quantity
area yield

1Z3 CONFIDENTIAL
8.3 What BioGro or Demeter standard do you have on your produce?
Livestock .......................................... .
Crops .............................................. .
Other .............................................. .
c TRANSITION PROCESS
C.1 What was your basic strategy for conversion to organic or Bio-Dynamic farming?
C.2 Why did you choose to convert in this way?
C.3 Do you plan to convert the whole farm to organic production methods? (If relevant)
YES / NO
C.4 What is the time schedule for conversion of your fann to organics? (If relevant)

PAST PRESENT
D PAST AND PRESENT MANAGEMENT PRACTICES
PLEASE OUTLINE YOUR PAST AND PRESENT PRACTICES IN TERMS OF:
D.1 ENTERPRISES AND PRODUCTS
D.2 PASTURE COMPOSITION
D.3 STOCK MANAGEMENT
Set Stocking or Rotational Grazing? -how long left on paddocks if set stocked -how frequently shift sto.ck if rotation
D.4 Supplementary Feed

175 PAST PRESENT
0.5 Stocking Rate
0.6 Internal Parasite Control - Scouring problems: how much and what time of year?
- Drenching
Safe Pastures. other control methods for internal parasites
0.7 External Parasite Control

0.8 CROPPING
Rotation
0.9 Seed Source
0.10 Cultivation
PAST
0.11 Crop Residue Management
0.12 Fertility Maintenance
__ 176 I PRESENT

0.13 Processing
0.14.WEED CONTROL
- Crops
Pasture
PAST
0.15 INSECT PEST CONTROL
- Crops
Pasture
0.16 DISEASE CONTROL
177 PRESENT

178
0.17 Do you think there are any practices or ideas from organic farming that could improve conventional fanning. without the fanns becoming entirely chemical-free?
YES/NO Comment __________________________________________________________ _
E FARl\IlING PHILOSOPHY
E.I Have vour attitudes towards farming changed in any way since you began converting to organic farming?
YES/NO COMMENT __________________________________________________ __
E.2 ORGANIC OR BIODYNAMIC?
What type of fann system are you trying to achieve? Would you call it an organic farm, a BioDynamic farm. or something else such as a low-input or sustainable farm?
Organic (1)
Bio-Dynamic (2)
Other (3)
IF OTHER, please explain
D IF YOU ARE AN ORGANIC FARMER. then please answer the following questions:
What is your opinion of Bio-Dynamic fanning?

179
fann? Are there any aspects of Bio-dynamics that you would consider trying on your
IF YOU AR~ A BIO-DYNAMIC FARMER. then please answer these questions:
What are the main reasons for your fanning Bio-Dynamically rather than I
organically?
E.3 When you were farming conventionally. were there any contributed to your change to organic fanning?
. YES/NO
IF YES, what were the problems you experienced?
production problems that
" ' I'ill II,' I,',i:" iii' ",' I II ~
-------------------------------- II:'
11'11 ---------------------------------------------------------------------,' 1III1 ',I -----------------------:'---111,
-----------------------------ci:I':, I",'
F INSTITUTIONS ['" i
:1:( F.I Is the tenure on your farm freehold or some type of lease?
Freehold (including mortgaged freehold) Crown lease Private lease Other lease Other (5)" Specify --------------------------
Does the type of tenure affect the way you fann?
ha ha ha ha
. Ii 'I' li'l II ,;
1,1:, I'!
I, :
II'" ! ' I , r ' I'
I!' ,I, :,"1
-----------------:------------------- I' 1,1'
F.2 Who has ownership of your fann?
Individual (1) Partnership (2) Special Partnership (3)
. __ Private Company (4) Public Company (5) Co-operative (6) Government or Local Body (7) Trust (8) Other (9) Soecifv
, !
II" ,:i,l

180
G SOCIAL
Gol How would you describe your neighbour's attitude towards your changing to organic methods?
Go2 Does that matter much to you?
Go3 Do you have farmers coming to you who are interested in going organic?
YES / NO
G.4 From your experience so far, what advice would/do you give to farmers who are interested in trying organic farming? 0 :
H SPOUSE
Hoi What influence did your partner/spouse have in your decision to convert to methods? [Discuss with partner/spouse if possible]
I:
organicl'
II

181
APPENDIX D QUESTIONNAIRE TO PROSPECTIVE ORGANIC FARMERS
Dear Sir/Madam,
Centre for Resource Management,
Lincoln College,
Canterbury .
Ph. 252 811 ext. 8716.
2 August 1988.
Enclosed is a confidential questionnaire which asks for information about your
farming. This survey is part of a year-long study being undertaken by Lincoln College into
Organic and Bio-Dynamic farming methods as alternatives for Canterbury farmers. I understand
that you are or have been interested in Chemical-free farming as an option for your farm. The
sample of farmers for this questionnaire was collected with the permission of representatives from
the Biological Producers Council, the Bio-Dynamic Association, and New Zealand Bio Grains
Ltd.
The purpose of the study is to find out what a change to Organic or Bio-Dynamic
farming would involve for individual farmers such as yourself. There is a lack of information as
to what changes must be undergone to become Organic or Bio-Dynamic in terms of practices,
investments, and so on. For farmers considering such a change, there is little information as to
what the consequences are likely to be.
In this part of the study, I am interested in what changes and consequences you think
would arise from changing your farm to an Organic or Bio-Dynamic system. Established and
transitional Organic and Bio-Dynamic farmers have already been interviewed, and information
from other studies has been collected. The value of the study relies on your participation.
The questionnaire does not take long to fill out, and can be mailed to me in the
enclosed stamped envelope. I will then send you a summary of the report on the completion of
the research project. Thank you again for your assistance.
Yours sincerely,
Paul Fisher.
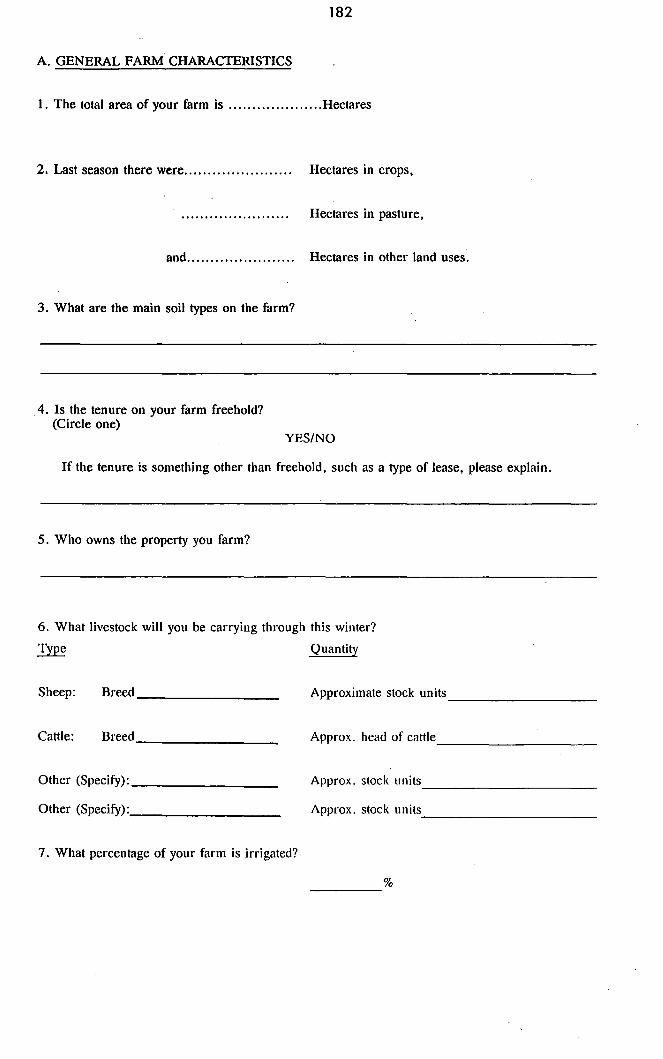
182
A. GENERAL FARM CHARACTERISTICS
1. The total area of your farm is .................... Hectares
2. Last season there were ...................... .
and ...................... .
3. What are the main soil types on the farm?
4. Is the tenure on your farm freehold? (Circle one)
Hectares in crops,
Hectares in pasture,
Hectares in other land uses.
YES/NO
If the tenure is something other than freehold, such as a type of lease, please explain.
5. Who owns the property you farm?
6. What livestock will you be carrying through this winter? ~ Quantity
Sheep: Breed ________ _ Approximate stock units -------------------
Cattle: Breed ______________ _ Approx. head of cattle ---------------------Other (Specify): ________ _ Approx. stock units -----------------------Other (Specify):, ________ _ Approx. stock units, -----------------------
7. What percentage of your farm is irrigated?
% --------

183
8. What are the main sources of income on your farm? (Rimk the four enterprises that contribute
the most to your total farm income. Use '1' for the higliest, down to '4' for the least of these),
r---
i---
r--
~
t---
Wool
Sheep breeding
Lamb production
Lamb fattening
Cattle fattening
Cattle breeding
Dairy
Selling live stock
Cereal cropping
Other crops
Selling grazing rights
Selling hay
Fodder cropping Other (Please Specify): ______________________ _
B. EXPERIENCE
1. For how many years have you lived on the property you now farm?
YEARS -------
2. For how many years have you been farming?
___________ YEARS
3. Compared to your neighbours and taking into account all chemicals that you use on your farm at present (including pesticides, fungicides, inorganic fertilisers and drenches), do you use: (Tick one)
Please comment
More Chemicals
The Same Amount of Chemicals
Fewer Chemicals
----------------------------------

184
C. FARMING PHILOSOPHY
1. The following reasons are sometimes given for why people farm. How do you rate these in terms of your own personal aims in farming?
(Using the scale below, please circle your strength offeeling towards the following aims).
Very Unimportant Unimportant Neutral Important Very Important (1) (2) (3) (4) (5)
Financial security 1 2 3 4 5
A way of life 1 2 3 4 5
An outdoor life close to nature 1 2 3 4 5
Some opportunity for leisure 1 2 3 4 5
A means of accumulating capital 1 2 3 4 5
A standing in the community 1 2 3 4 5
A job as one's own boss 2 3 4 5
A means of providing job opportunities for ones' family 1 2. 3 4 5
A job that offers fulfillment and/or satisfaction 1 2 3 4 5
2. What type of farm system are you most interested in as an option for your farm? Would you call it an Organic farm, a Bio-Dynamic farm, or something else such as a low-input or sustainable farm.
(Tick one)
Organicl
Bio-Dynamic2
Other
Please explain your preference: -------------------------------------------------
1 An organic farm excludes chemicals such as pesticides and synthesized fertilisers including superphophate, and relies instead upon mechanical and biological controls. It emphasizes the importance of the organic component of the soil.
2 A Bio-Dynamic farm also excludes chemical inputs but it is based upon the philosophy of Rudolf Steiner. and uses an astrological planting calendar and homeopathic preparations.
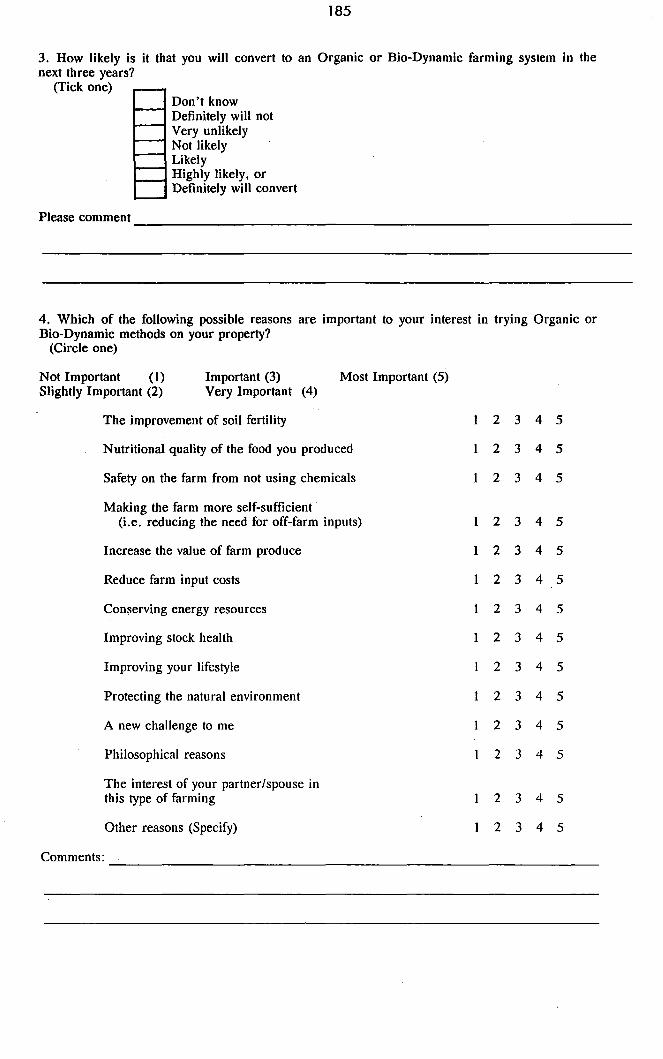
185
3. How likely is it that you will convert to an Organic or Bio-Dynamic farming system in the next three years?
(Tick one)
Please comment
Don't know Definitely will not Very unlikely Not likely Likely Highly likely. or Definitely will convert
-----------------------------------------------------------------
4. Which of the following possible reasons are important to your interest in trying Organic or Bio-Dynamic methods on your property?
(Circle one)
Not Important (1) Important (3) Most Important (5) Slightly Important (2) Very Important (4)
The improvement of soil fertility 1 2 3 4 5
Nutritional quality of the food you produced 1 2 3 4 5
Safety on the farm from not using chemicals 1 2 3 4 5
Making the farm more self-sufficient (Le. reducing the need for off-farm inputs) 1 2 3 4 5
Increase the value of farm produce 1 2 3 4 5
Reduce farm input costs 1 2 3 4 5
Conserving energy resources 1 2 3 4 5
Improving stock health 1 2 3 4 5
Improving your lifestyle 1 2 3 4 5
Protecting the natural environment 2 3 4 5
A new challenge to me 2 3 4 5
Philosophical reasons 2 3 4 5
The interest of your partner/spouse in this type of farming 2 3 4 5
Other reasons (Specify) 2 3 4 5
Comments:
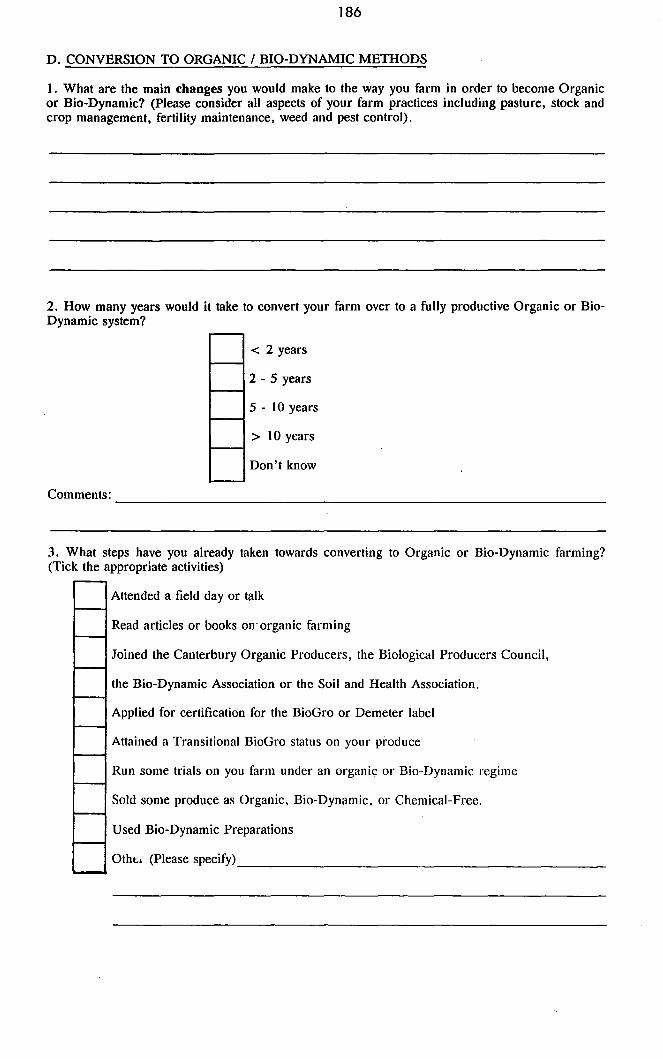
186
D. CONVERSION TO ORGANIC / BIO-DYNAMIC METHODS
1. What are the main changes you would make to the way you farm in order to become Organic or Bio-Dynamic? (Please consider all aspects of your farm practices including pasture, stock and crop management, fertility maintenance, weed and pest control).
2. How many years would it take to convert your farm over to a fully productive Organic or Bio-Dynamic system?
< 2 years
2 - 5 years
5 - 10 years
> 10 years
Don't know
Comments: ----------------------------------------------------------------
3. What steps have you already taken towards converting to Organic or Bio-Dynamic farming? (Tick the appropriate activities)
Attended a field day or talk
Read articles or books on' organic farming
Joined the Canterbury Organic Producers, the Biological Producers Council,
the Bio-Dynamic Association or the Soil and Health Association.
Applied for certification for the BioGro or Demeter label
Attained a Transitional BioGro status on your pi'oduce
Run some trials on you farm under an organic or Bio-Dynamic regime
Sold some produce as Organic, Bio-Dynamic, or Chemical-Free.
Used Bio-Dynamic Preparations
Otht;.~ (Please specify) ___________________________ _

187
E. FARM PERFORMANCE (Productivity, Animal Health, etc.)
1. If you have run any trials using Organic or Bio-Dynamic methods on your farm, please outline how you undertook the trials and what results you achieved.
2. What changes in performance (if any) would you expect to achieve in the first three years under an Organic or Bio-Dynamic system on your farm, compared to the performance you achieve now in an average year:
(Using the scale below circle the change in performance that you would expect)
o = Don't know or not relevant 1 = Much lower/worse than at present 2 = Lower/worse than at present
Pasture production
Lamblng percentage Animal health
Wool production/stock unit
Cattle production/stock unit Weed control Pest control
Disease control
Cereal crop yields
Total farm production costs Total farm gross sales
Total farm net income
Comments:
3 = Same as at present 4 = Higher/better than at present 5 = Much higher/better than at present
o o o o o o o o o o o o
1
1
1 1
1 1
1
1
1
2
2 2 2 2 2 2
2
2 2 2 2
3 4 5 3 4 5 3 4 5 3 4 5 3 4 5 3 4 5 3 4 5 3 4 5 3 4 5 3 4 5 3 4 5 3 4 5
------------------------------------------------~--------------
3. List in order of importance the main advantages of changing your farm over to an Organic or Bio-Dynamic system.
Most important -------------------------------------------------------------2nd ----------------------------------------------------------------------3rd ----------------------------------------------------------------------4th -----------------------------------------------------------------------

188
4. List in order of importance the main disadvantages of changing your farm over to an Organic or Bio-Dynamic system?
Most important ______________________________ _
2nd ----------------------------~------------
3rd -----------------------------------------4th -----------------------------~--------------------
F. INFORMATION NEEDS AND SOURCES
1. How long have you known about Organic or Bio-Dynamic farming methods?
____________ YEARS
2. From whom did you first hear about Organic or Bio-Dynamic farming as an option for a farm such as yours?
3. What has been the most useful source of information on organic or Bio-Dynamic farming methods?
4. What are the key areas of information about Organic or Bio-Dynamic farming that are presently unavailable to you?
G. PERSONAL INFORMATION
1. Your age is Years --------
2. Please list any formal or post-secondary qualifications
3. What percentage of your total household income comes from sources other than the farm?
% -----------4. Is your farm profitable at the moment?
YES/NO
Please comment --------------------------------------------------

189
APPENDIX E COMPARISON OF THE GROSS MARGINS FOR CONVENTIONAL
AND ORGANIC CROP ROTATIONS
E.l INTRODUCTION This appendix presents detailed calculations of organic and conventional gross margins for wheat and sheep enterprises, and over an entire crop rotation. The sources of data on conventional practices and prices were Lincoln College farm budget manuals (Clark and Burtt, 1986; Clark ~ .!!!., 1988 and previous editions) and Lincoln ColJege Farm Management Department staff (J.K. Lay and G.A.G. Frengley). Data on organic farms were based on the survey of Canterbury practicing organic producers, and the literature on organic production.
E.2 SHEEP GROSS MARGIN E.2.l Production Parameters: For the sheep gross margin calculation, the following assumptions were made:
(1) The gross margin is for a Corriedale flock, selling genuine 5 year old ewes and breeding own replacements. Ewes are on hand for 4 lambings. All ewes including two tooths are mated to a Corriedale ram. Hoggets are culled as two tooths (20%). Eighty percent of wether lambs are sold as prime for export, and surplus ewe lambs and remaining wether lambs are sold as stores. Breeding own replacements is effectively required by the Bio Gro standard at present because of restrictions on bought-in stock and the small number of sheep-breeding properties. (2) The organic enterprise assumes a 10 percent lower stocking rate, (12.6 stock. units per hectare compared to 14 S.U. ha-1 for an 89ha property) because most of the Canterbury organic farmers had either reduced stock density below conventional levels or intended to in the future, and Vine and Bateman (1981) reported 20 percent lower stocking rates on British organic farms compared with regional averages. Lambs on the organic enterprise take 3 more weeks to mature, to account for production losses among young stock due to illness and possible feed stress. A slower lamb growth rate was reported by three organic farmers. To accommodate this loss in income to the farmer, the net present value of organic lambs was discounted at a rate of 20% per annum over three weeks (for example $11.00 was discounted to $10.87). (3) Ewes and hoggets clip 4.1 kg wool, and lambs are not shorn. No major difference in wool production was reported by Canterbury farmers. (4) The death rate is 4 percent for both enterprises. Stock deaths and illness were reported to be similar under both regimes by Haystead (1987) and the Canterbury organic farmers. There are no major foot rot, lice or other disease problems in either enterprise. Lambing percentage on both farms is 1] 0 percent survival to sale. It is assumed that production losses are accounted for by lamb growth rate. and no drop in lambing percentage was reported by the Canterbury farmers. (5) Anthelmintic drenches used in the conventional enterprise include selenium and any other deficient minerals. Half of the organic lambs require drenching with anthelmintics. and all stock receives at least two herbal drenches. This was assumed because almost all Canterbury farmers drenched the poorest lambs on a curative basis and four continued to routinely drench sheep with anthelmintics. As well, more emphasis was placed on supplementary feeding, and frequent drenching with cider vinegar, garlic, seaweed and other solutions increased the labour requirement on most farms. (6) Aside from undrenched prime lambs which return a 20% premium price, all produce is sold on the conventional market. This assumption was made because 20% is the current retail price premium in Christchurch, the organic meat market at present is very small and only four of the Canterbury farmers sold any organic lamb, and data was not available on the price paid to producers.

190
(7) It is assumed that the farm has sufficient labour and capital resources to carry out routine work. Shearing, crutching and dipping are done by contract. Labour costs of drenching are included at $8 per hour for both enterprises, because labour is treated as a variable cost where farm practices differ. This amount is approximately equal to the cost of wages of management used in the Lincoln College Budget, while around $5 per hour is the award wage for a young, semi-skilled wage worker. (8) Organic capital stock are valued at conventional prices because at present there is no significant market for live organic animals.
Table E.I Capital Stock Wintered
Conventional Organic Class No. Value S.U. No. Value S.U.
Ewe Hoggets @$24 376 $9024 226 338 $8122 203 2th Ewes @$30 250 $7500 250 225 $6750 225 Breeding Ewes @$25 750 $18750 750 675 $16875 675 Rams @$50 20 $1000 16 18 $1800 14 Total 1396 $36274 1242 1256 $32647 1117
Dollar investment in sheep per stock unit = $29.21 for both enterprises.
Table E.2 Income from organic and conventional sheep enterprises
Conventional Organic No. @($) Value No. @($) Value
prime wether lambs 440 20 $8800 198 19.771 $3914 198 23.72 $4697
store mixed sex lambs 284 ] 1 $3124 256 10.87 $2783 cull hogget/2ths 111 25 $2775 100 25 $2500 5 year old ewes 160 18 $2880 144 18 $2592 cull ewes to works 50 10 $500 45 10 450
wool (kg) 5620 4 $22480 5058 4 20232 TOTAL REVENUE $40559 $37168
l. organic lamb net present values were discounted at 20 percent per annum over three weeks.

191
Table E.3 Expenditure on organic and conventional sheep enterprises
Conventiona 1 Organic No. Cost Subtotal No. Cost Subtotal
Shearing ewes @$90.50/l00 1000 $905 900 $815 hoggets @$90.50/l00 370 $335 333 $301
Tup Crutch ewes @$32.00/100 1010 $323 909 $291
Main Crutch ewes @$38.00/100 990 $376 $1939 891 $339 $1746
W oo[shed Expenses -including shearing plant expenses and wool packs approx. 40c/ewe and 27c/hgt $500 $450
Animal Hea[th -Conventional Ewes pre-Iamb: drench @ 26c/dose 990 $257 vaccinate @ 28c/dose 990 $277 labour 3 hours @ $8.00/hour $24
Lambs docking 20 hours @ $8/hour $160 vaccination @ 28c/dose 1100 $308 drenching at 11c/dose 2072 $228 (replacements 3 times, primes 1.5, stores 1)
labour 9 hours @ $8/hour $72 Dipping @ 29c each 1500 $435 labour 2 hours to yard sheep @ $8/h 2 ·$[6 $1777
Organic Ewes 3 herbal drenches @ 3c/dose 900 $27 labour 9 hours @ $8/hour $72
Lambs anthelmintic drench @ llc/dose 495 $54 herbal drenches @ 2c/dose 3728 $75 (rep[acements 6 times, primes 3. stores 2)
labour 18 hours "@ $8/hour $144 $372 Eartags @ 30c ea. 376 $113 338 $101 Cartage - (100 km travel) Prime lambs @ $1.91 ea. 440 $840 396 $611 Store lambs @ $1.82 ea. 284 $517 256 $286 Culled stock @ $2.36 ea. 271 $640 244 $576 Works ewes @ $2.93 ea. 50 $147 45 $132 Wool @ $1O.76/bale 31 $334 $2478 28 $301 $1906
Selling Charges -Yard fees @ 43c ea. 555 $239 . 500 $215 Commission @ 5.5% $483 $722 $433 $648
Ram Purchase - @ $190 ea. 5 $950 5 $950 TOTAL DIRECT COSTS $8479 $6173
TOTAL GROSS MARGIN $32080 30995 GROSS MARGIN per $ invested in sheep $0.88 $0.95 GROSS MARGIN per Stock Unit $25.82 $27.75 GROSS MARGIN per hectare $361.48 $349.65 Interest on Capital Stock Value
@20% per annum $7255 $6529 RETURN per Stock Unit (after interest) $19.99 $21.90 RETURN per hectare $279.86 $275.94

192
E.3 WHEAT GROSS MARGIN (Arawa ex pasture)
E.3.1 Production Parameters:
The following gross margins for Arawa wheat compare the organic mixed cropping
enterprise with a conventional mixed cropping farm on a medium soil type in Canterbury.
The following assumptions were made:
(1) The conventional paddock is skim ploughed at the beginning of March, and then deep ploughed in late March. After this it is rolled, disced, and harrowed and drilled in late May along with 125kg ha-1 of urea. The organic enterprise begins cultivation in early February using a similar program, but uses heavy discs in place of deep moldboard ploughing. It has an additional two surface cultivations at the beginning and middle of May for weed control. No fertiliser is applied in the organic enterprise aside from two applications of liquid seaweed soil conditioner. Cultivation -practices varied widely between Canterbury organic farms, and for all cropping enterprises in these gross margin calculations it is assumed that one or more additional cultivations are required for weed control (refer to Chapter 5 for details of farm practices). The cost of cultivation includes a labour payment of $8 per hour. (2) The organic enterprise has a 30 percent lower yield and returns a 20 percent price premium. This was a typical yield among experienced cropping farmers on a medium soil during and after transition (refer to Chapter 6). The premium is set at a moderate level which could be used by farmers for budgeting purposes (1. Manhire, pers. comm.). Initially, a farmer undergoing transition may not be able to receive any premium, while more lucrative contracts were possible as farmers became more established. (3) In the conventional enterprise, Avadex is sprayed at 51 ha-1 and Glean at 20g ha- I for the control of various weeds and wild oats, and a fungicide is sprayed once. The organic farmer spends four hours per hectare hand roguing broad-leafed weeds and wild oats. The degree of hand weeding varied considerably between Canterbury organic farms, and this is an estimate only. The efficacy and profitability of hand weeding wild oats is questionable. (4) All spraying and harvesting is done by contract. (5) The organic farmer uses untreated, certified seed at a 10% lower cost than the treated price.

193
Table E.4 Income and expenditure for wheat enterprises
Conventional Organic
Income: Yield (t/ha) 5 3.5 Price per tonne (90 index,· delivered) $200 $240 TOTAL REVENUE $1000 $840
Expenditure (per hectare): Cultivation -hours 3.5 5.7 60 kW tractor @ $20.60/hour (Fuel $10.60; R&M $2; Labour $8) $72 $117
Seed. - 120 kg/ha @$714/tonne treated $86 @$642/tonne untreated $77
Fertiliser -Urea 125 kg/ha @$400Itonne $50 MaxiCrop seaweed 5 I/ha @ $5.42/1 (twice) $54 Application (contract) $28 $82
Weed, Pest and Disease -Avadex (herbicide) 511ha @ $16.9111 $85 Application (contract) $14
Glean (herbicide) 20g/ha @ $1.40/g $28 Application (contract) $14
Tilt (fungicide) 0.511ha @ $94/1 $47 Application (contract) $14 $202
Hand weeding 4 hours @ $8/hour $32 Irrigation - 50mm application (Electricity $11.40; R&M $3.60) $15 $15
Harvest - @ $42/tonne (in silo, contract) $210 $147
Freight - @ $16/tonne $80 $56 TOTAL DIRECT COSTS $715 $526
TOTAL GROSS MARGIN $285 $314
E.4 CROP ROTATIONS
E.4.1 Introduction Using Table 5.8 in Chapter 5 as a guide, the following crop rotation was chosen as being, representative of a Canterbury organic mixed farm on a medium soil:
wheat/undersown red clover -+ peas -+ barley -+ pasture 5 years
The equivalent conventional mixed crop rotation was:
peas -+ wheat/greenfeed -+ barley -+ ryegrass -+ white clover -+ pasture 2 years

194
E.4.2 The conventional rotation Peas ~ wheat/greenfeed ~ barley ~ ryegrass ~ white clover ~ pasture 2 years
(I) Field peas ('Blue') The paddock is disced twice at the end of July and then ploughed, heavily harrowed, vi bra-tillered to mix in the Treflan herbicide, rolled and drilled at the end of August. 290 kg/ha of peas are sown with 125kg/ha of Cropmaster 15.
Table E.5 Income and expenditure for conventional Blue peas enterprise
Income: 3 tonnes/ha @ $280/tonne Peavine (in paddock) 60 bales/ha @ $1.20 TOTAL REVENUE
Expenditure (per hectare): Cultivation -60kW tractor 4 hours @ $20.60 (Fuel $10.60; R&M $2; Labour $8)
Seed - 290 kg @ $620/tonne Fertiliser Cropmaster 15 125kg/ha @ $387 It
Weed control Treflan 2.51/ha @ $13llitre application (contract)
Irrigation - 2 X 50mm application @$15 (Elec. $11.40; R&M $3.60)
Harvest 3 tonnes/ha @ $55ltonne (in silo; contract)
Freight - 3 tonnes @ $16/tonne TOTAL DIRECT COSTS
TOTAL GROSS MARGIN
(2) Wheat Crop (Arawa ex peas)
$33 $14
$840 $72
$912
$82
$180
$48
$47
$30
$165 $48
$600
$312
Following the pea harvest in February, the paddock receives two grubbings in March-April and another grubbing in May. It is drilled in late May, with the inputs and yield described in section E.3.
Table E.6 Income and expenditure for conventional Arawa wheat crop
TOTAL GROSS INCOME TOTAL DIRECT COSTS
TOTAL GROSS MARGIN
(3) Greenfeed oats (ex wheat)
$1000 $715
$285
After the wheat stubble has been burnt off, the paddock is grubbed three times in February and the crop is drilled at the end of February. Amuri oats are sown at a rate of 90 kg/ha. Nitrogen superphosphate is applied at 250kg/ha. The paddock is grazed during June and July.
If stock consume 590kg D.M.lyear, and one hectare produces 3500kg/ha, it would support 6 S.U.lha.

195
Table E.7 Income and expenditure for conventional greenfeed oats
Income: 6 S.U.lha @ $25.S2/S.U. (from E.2) TOTAL REVENUE
Expenditure (per hectare): Cultivation -2.5 hours @ $20.60/hour
Seed - 90kg/ha @ $495/tonne Fertiliser - 250kg/ha Supergro 30% Nitrogen @ $197. SI TOTAL DIRECT COSTS
TOTAL GROSS MARGIN per hectare
(4) Barley (Triumph; malting ex greenfeed)
$155 $155
$52 $45 $49
$145
$10
The paddock is disced twice at the end of July and then ploughed, heavy harrowed, grubbed and drilled at the beginning of September. A herbicide, Glean, and a fungicide, Tilt, are used for pest control.
Table E.8 Income and expenditure for conventional Triumph barley enterprise
Income: 5 tonnes/ha @ $170/tonne TOTAL GROSS INCOME
Expenditure (per hectare): Cultivation -60kW tractor - 3.5 hours @ $20.60/h
Seed - 120kg/ha @ $490/tonne Fertiliser - Superphos 125 kg/ha @ $182/t Urea 125 kg/ha @ $400/tonne
Pest control -Glean (herbicide) 20g/ha @ $1.40/g application (contract)
Tilt (fungicide) 0.51/ha @ $94/litre application (contract)
J rrig-ation -2 X 50mm application @ $15/application (Elec $11.40; R&M $3.60)
Harvest - 5 tonnes @ $42/tonne (in silo; contract)
Freight - 5 tonnes @ $16/tonne (silo to port)
TOTAL DIRECT COSTS
TOTAL GROSS MARGIN per hectare
(5) New grass for Nui seed (ex barley)
$23 $50
$28 $14 $47 $14
$850 $850
$72 $59
$73
$103
$30
$210
$80 $627
$223
Following the barley harvest in January, the paddock receives two grubbings and lime is worked i_uto the soil. Cultivation follows a programme of grub, harrow and roll in sequence twice for

196
weed control. As well, 2,4DB is sprayed at 211ha for control of broad leaf weeds, after ground cover of pasture species is fairly complete. A fungicide, Tilt. is also applied at a rate of 0.5I1ha. New pasture is drilled with a mixture of 23kg/ha Nui ryegrass and 3kg/ha Huia white clover sown with 230kg/ha of superphosphate.
This new grass is given a light first grazing in May and is lightly grazed over the winter to allow light into the clover seedlings. Then although the paddock is not available for the whole spring period. the equivalent spring grazing rate is 6 S.U.lha. The paddock is closed from grazing in the middle of September and at the end of September receives 250kg/ha of sulphate of ammonia. In early January, the crop is mown and left for 5-6 days before being headed.
An estimated feed production of 2200kg/ha over the grazing period represents an annual grazing equivalent of 3.7 S. U ./ha. Additional income from grazing is therefore $25. 821S. U. X 3.7 S. U . (from E.2) = $96
Table E.9 Income and expenditure for conventional Nui ryegrass enterprise
Income: Yield 1000kg/ha F.D.; 25% loss on machine dressing. Thus yield becomes 750 kg/ha M.D. 750 kg 1st generation Nui @ $1.20/kg Ryegrass straw 100 bales/ha sold in the paddock @ 70c/bale. Grazing TOTAL REVENUE
Expenditure (per hectare): Seed bed preparation: 60kW tractor - 4.5 hours @ $20.60/h
Seed - 23kg/ha Nui ryegrass @ $2.70/kg - 3kg/ha Huia white clover @ $4.50/kg
Fertiliser -lime 2.5 t/ha @ $20.00/tonne delivered superphosphate 230kg/ha @ $18l.48 sulphate of ammonia $250kg/ha @ $222.04
Pest control -MCPB 211ha @ $8.33/litre application (contract)
Tilt 0.51/ha @ $94/1itre application (contract)
Irrigation -2 X 50mm application @ $15/application (Elec $11.40; R&M $3.60)
Harvest - \ mowing 1.75 hours @ $20.60/hour header (contract) 0.63h/ha @ $200/h
Freight -900kg (F.D.) @ $16
Seed dressing 900kg @ 12c/kg TOTAL DIRECT COSTS
TOTAL GROSS MARGIN per hectare
,r _
$62 $14
$48 $42 $56
$17 $14 $47 $14
$36 $126
$900 $70 $96
$1066
$93
$76
$146
$92
$30
162
$14 $108 $721
$345
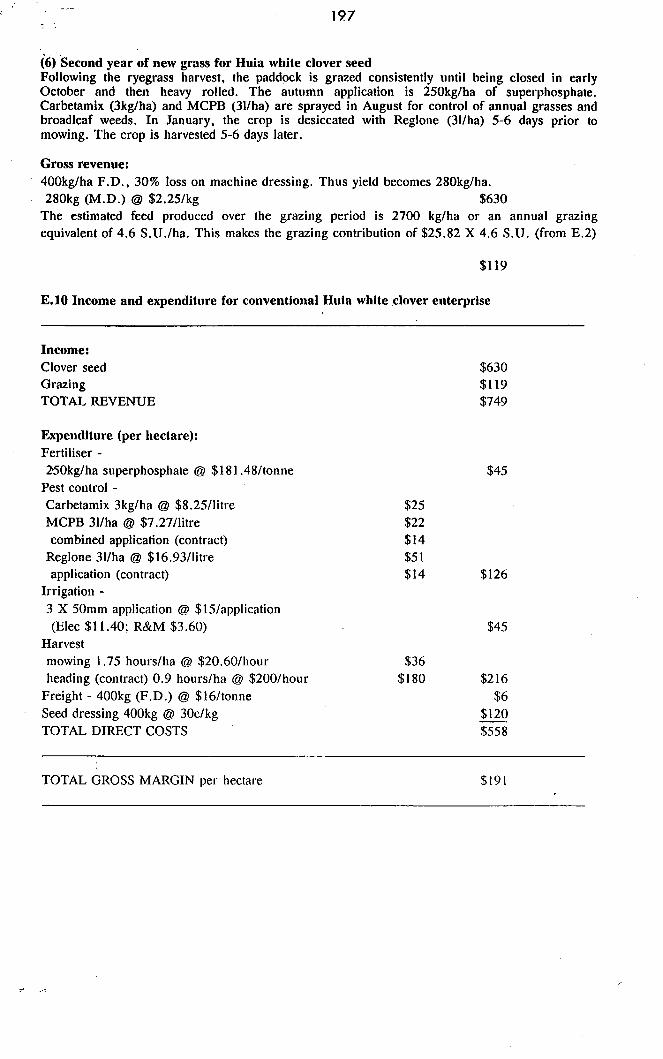
197
... (6) Second year of new grass for Huia white clover seed Following the ryegrass harvest, the paddock is grazed consistently until being closed in early October and then heavy rolled. The autumn application is 250kg/ha of superphosphate. Carbetamix (3kg/ha) and MCPB (3I/ha) are sprayed in August for control of annual grasses and broad leaf weeds. In January, the crop is desiccated with Reglone (3I/ha) 5-6 days prior to mowing. The crop is harvested 5-6 days later.
Gross revenue: 400kg/ha F.D .• 30% loss on machine dressing. Thus yield becomes 280kg/ha. 280kg (M.D.) @ $2.25/kg $630
The estimated feed produced over the grazing period is 2700 kg/ha or an annual grazing equivalent of 4.6 S.U.lha. This makes the grazing contribution of $25.82 X 4.6 S.U. (from E.2)
$119
E.IO Income and expenditure for conventional Huia white.c1over enterprise
Income: Clover seed Grazing TOTAL REVENUE
Expenditure (per hectare): Fertiliser -2'50kg/ha superphosphate @ $181.48/tonne
Pest control -Carbetamix 3kg/ha @ $8.25/litre MCPB 3l/ha @ $7.27Ilitre combined application (contract)
Reglone 3l/ha @ $16.93/litre application (contract)
Irrigation -3 X 50mm application @ $15/application (Elec $11.40; R&M $3.60)
Harvest mowing 1.75 hours/ha @ $20.60/hour heading (contract) 0.9 hours/ha @ $200/hour
Freight - 400kg (F.D.) @ $16/tonne Seed dressing 400kg @ 30c/kg TOTAL DIRECT COSTS
\
TOTAL GROSS MARGIN per hectare
$25 $22 $14 $51 $14
$36 $180
$630 $119 $749
$45
$126
$45
$216 $6
$120 $558
$191

19.8
(7) Pasture (2 years grazing) The pasture is grazed and hay is made in the slimmer. Fertiliser is applied in the alltumn. The hay making charges are assessed as that of providing the 14 S. U .Iha with 2 bales of hay per S. U. for wintering, i.e. 28 bales/ha required. This represents 20% of the normal hay crop of 140 bales/ha.
The estimated utilised feed during the grazing period is 8250 kg/ha D.M., which at 590 kg D.M.lS.U. means a stocking rate of 14 S.U.lha.
Table E.ll Income and expenditure for conventional grazing enterprises
Income: 14 X $25.82/S.U. (from E.2) TOTAL REVENUE
Expenditure (per hectare): Fertiliser -250kg/ha. superphosphate @ $181.48/tonne
Hay making-mowing and. raking 0.2 hours/ha @ $20.60/hour baling and collecting (contract) -28 bales/ha @ 87c/bale
TOTAL DIRECT COSTS
TOTAL GROSS MARGIN per hectare per annum
Summary of the conventional crop rotation:
$4
$24
$361 $361
$45
$28 $73
$288
The gross margin per hectare has been assessed for each crop in the conventional rotation given one set of parameters. Certain anomalies exist, such as the liming charge at pasture establishment which in actual fact should be shared by each crop. Similarly the seed and cultivation charges for the ryegrass crop should be apportioned over the pasture's life for a more accurate picture of the -individual crop's contribution. Given that such anomalies exist, a summary of the gross margins on the conventional farm is presented below.
Table E.12 Summary of the conventional crop rotation
Year Crop
Peas 2 Wheat! green feed 3 Barley 4 Ryegrass 5 White clover 6 Pasture 7 Pasture
Gross margin ($/ha)
312 295 223 345 191 288 288
The total gross margin over the seven year rotation is $1942, and the average annual gross margin for the conventional crop rotation is therefore $277 /ha/year.

199
E.4.3 Organic crop rotation wheat/undersown red clover ~ peas ~ barley ~ pasture 5 years
(1) Wheat crop (Arawa ex old pasture) The procedure outlined in section E.3 is used for this crop. As well, Grasslands Pawera red clover is oversown in September at 4kg/ha. The additional cost is Red clover seed - 4kg @ $9.50/kg = $38 Heavy rolling - 0.6 h/ha @ $20.60 = $12
Table E.13 Income and expenditure for organic Arawa wheat enterprise
TOTAL REVENUE
TOTAL DIRECT COSTS
TOTAL GROSS MARGIN per hectare
(2) Greenfeed red clover, crop stubble and volunteer weeds (ex wheat)
$840
$576
$264
After the wheat has been harvested in late January, the straw is chopped and clover and weeds are left until March. From then until August, the paddock is consistently grazed lightly over the winter to help spread and break down the straw at an estimated 5 stock units per hectare. Five months grazing at this stock density gives the equivalent of 2 stock units. The cost of oversowing red clover is included in the wheat gross margin.
Table E.14 Income and expenditure for organic greenfeed enterprise
TOTAL REVENUE 2 S.U. X $21.85
TOTAL DIRECT COSTS
TOTAL GROSS MARGIN per hectare
(3) Field Peas (Blue ex greenfeed)
$44
$0
$44
The paddock is disced twice at the end of July and then ploughed, heavy harrowed, rolled, and then three passes with the surface harrow, and drilled in late September. 290kg/ha of untreated, certified seed is sown, and a seaweed spray is applied in November at 5l/ha. The yield is 10% lower than for the conventional pea enterprise, and a 10% premium is added to the crop value. The two pea crop yields in the Canterbury organic farmer population were 2 and 3.9 tonnes per hectare. Ten percent is a typical premium on organic crops other than wheat (1. Manhire, pers. comm.). Four hours are spent hand weeding the hectare of land. and the pea vine is chopped out of the header, rather than being baled and sold.

200
Table E.15 Income and expenditure for organic Blue peas enterprise
Income: 2.7 tonnes/ha @ $308/tonne TOTAL REVENUE
Expenditure (per hectare): Cultivation - 5 hours @ $20.60_ Seed - 290kg/ha @ $558 MaxiCrop seaweed 51/ha @ $5.42Ilitre application (contract)
Hand weeding 4 hours @ $8/personhour Irrigation - 2 X 50mm applications @ $15/appl'n. Harvest - 2.7 tonnes @ $55/tonne Freight - 2.7 tonnes @ $16/tonne TOTAL DIRECT COSTS
TOTAL GROSS MARGIN per hectare
(4) Barley (Triumph ex peas) ,
$27 $14
$832 $832
$103 $162
$41 $32 $30
$149 $43
$560
$272
After the pea harvest in early February. the paddock is disced twice in March-April and is grubbed in May. It is then left fallow over the winter. and is worked (heavy harrow. grub and surface harrowing) from the end of July until the beginning of September. when barley is drilled. The barley yield is 10 percent below the conventional figure (refer to Table 7.4). and this is offset by a ten percent price premium. A seaweed spray is the only fertiliser.
Table E.16 Income and expenditure for organic barley enterprise
Income:
4.5 tonnes/ha @ $187/tonne TOTAL REVENUE
Expenditure (per hectare): Cultivation - 5.5 hOUfS @ $20.60/hoUf Seed - 120kg/ha @ $44l1tonne MaxiCrop 51/ha @ $5.42/litre application (contract)
Hand weeding 4 hours @ $8/personhollr Irrigation - 2 X 500101 application @ $15/app\' n. Harvest - 4.5 tonnes @ $42/tonne
Freight - 4.5 tonnes @ $16/tonne TOTAL DIRECT COSTS
TOTAL GROSS MARGIN per hectare
$27 $14
$842 $842
$133 $53
$41
$32 $30
$189 $72
$550
$292

201
(5) Pasture (5 years grazing ex barley) Following the barley harvest in January. the paddock receives two grubbings. and 2.5 tonnes per hectare of lime is worked into the soil. Cultivation follows a programme of grub. harrow, and roll in sequence three times to achieve effective weed control. A mixed pasture is sown which includes Huia white clover. Pawera red clover, Saranac lucerne, Kahu timothy, Matua prairie grass, Roa tall fescue, chicory, Kahu cocksfoot, Maru phalaris, and salad burnett. This was chosen on the basis of reported pasture mixes used by Canterbury organic farmers, and discussion with a mixed pasture consultant (D. Musgrave, pers. comm.). Pasture mixes varied widely among the Canterbury organic farmers, and ryegrass and white clover still predominated. However, diverse· pastures were used widely by the established producers and to varying degrees on other properties.
The seed is drilled with 200kgiha of reactive phosphate rock. Seaweed is sprayed onto the field once annually at 5l1ha. Fertiliser use varied considerably between the Canterbury organic farmers, and this is one of. the higher application rates. The pasture is grazed lightly over the winter and early spring, and fully rotationally grazed at 12.6 stock units per hectare (10 percent lower than the conventional enterprise) for the next five years. Hay making charges are assessed as that required to provide 12.6 S.U'/ha with 2 bales of hay each (i.e. 25 bales/hal.
Table E.17 Income and expenditure for organic grazing enterprise
Income: 12.6 S.U.lha @ $2,7.75IS.U. (AVERAGE REVENUE PER ANNUM) $350 TOTAL REVENUE OVER FIVE YEARS $1750
Expenditure (per hectare): Cultivation - 6.5 hours @ $20.60 $134 Seed -2.5kg Huia white clover @ $3.70 $9 2.5kg Pawera red clover @ $9.50 $24 2kg Saranac lucerne @ $10.00 $20 lkg Kahu timothy @ $6.00 $6 Skg Matua prairie grass @ $2.50 $20 Skg Roa tall fescue @ $7.00 $56 lkg chicory @ $11.50 $12 2kg Kahu cocksfoot @ $4.60 $9 2.5kg Salad burnett @ $5.00 $13 1 kg Phalaris @ $7.00 $7
$176 Fertiliser -2.5 t/ha lime @ $20.00/tonne delivered $50 200kg/ha reactive phosphate rock @ $155.69It $31 MaxiCrop 5 X·,5>lIha @ $5.42Ilitre $136 5 applications (contract) @ $14 $70 $287
Hay making - 5 X (mowing and raking 0.2h/ha @ $20.60 $21 baling and collecting (contract) -2.5 bales/ha @ 87c/bale) $110 $131
TOTAL DIRECT COSTS OVER FIVE YEARS $728 AVERAGE DIRECT COSTS per annllm 146
AVERAGE GROSS MARGIN per hectare per annum $204

202
Table E. 18 Summary of the organic crop rotation:
Year Crop
1
Gross margin ($/ha)
----------------------------------------------------------------------2 3 4 5 6 7 8
wheatl green feed peas barley pasture pasture pasture pasture pasture
308 272 292 204 204 204 204 204
The total gross margin over the eight year crop rotation is therefore $1892, and the average annual gross margin for the organic crop rotation is $237/ha/year.

APPENDIX F CASE STUDIES OF CANTERBURY ORGANIC FARMERS
The following short biographies summarise the results of the participant observation and in-depth interviewing of four practicing organic farmers. The first three profiles are of established organic farmers with full Bi? Oro, Demeter or equiva1ent,' while the fourth is of a highly proficient transitional organic fanner. These summaries expand upon the questionnaire results which are analysed in Chapter 7, - section 7.3. Pseudonyms are used.
Farmer (1) : Mr. Robert Davidson. Mr. Davidson is one of the true pioneers of organic farming (OF) in New Zealand, with over twenty years experience in chemical-free management on his mixed farm. He illustrates the mix of a philosophical commitment to natural farming and a practical belief in the importance of soil management that typifies the older breed of organic farmer. As well, Mr. Davidson's emphasis on independence and his personal experiences have contributed to his choice of farm system.
Mr. Davidson became a devout Christian as a teenager. The workings of the natural world hold a sense of wonderment for him, and OF was the 'obvious' choice in order to work with God's design, rather than try to fight natural, forces with chemicals. With a scientific and enquiring mind, OF a1so made good farming sense to Mr. Davidson, and he noted from an early age the effect of a fertile topsoil on plant hea1th. Through his travels and many visitors, and the high profile he had in the early organic movement, Robert Davidson has met many of the important international figures in OF. From his Anglo-Saxon perspective, Mr. Davidson views bio-dynamics (BD) as irrational, spiritualist and culturally incompatible with his farming philosophy.
Robert Davidson was brought up on the family farm, and left school at 15 to work for his father. Mr. Davidson senior leased the property and produced winter feed for hill country sheep stations. When he was 19. Mr. Davidson went into a farm machin~'1"\
business with his brother. After returning to the property with his \,·ife. RobtTt
Davidson built the family home, and using his engineering skills he has made much of the farm's equipment. The farm is now a freehold mixed crop and livestock operation. The health of one of the Davidsons' children suffered through a series -of unfortunate experiences with doctors, drugs and. they suspect. herbicides. This and other negative experiences have led them to avoid conventional medicine and chemicals when possible, and were factors in deciding to farm organically.

204
Independence is a strong theme in all aspects of Mr. Davidson's life. He attends a
non-hierarchical community Church, rather than a larger. hnreaucratic institution. Mr . . Davidson is now less active in the OF industry, and the current emphasis on nutrition
and finances differs from his soil-oriented approach. Many seminars have been given
by Mr. Davidson to farmer and consumer groups to promote the concept, however he
is concerned that farmers may become involved in OF for the wrong (i.e. financial)
reasons. He is the only organic farmer in the Canterbury group who is not a member
of the Biological Producers Council (BPC), partly because he considers that it is too
easy for farmers to obtain full Bio Gro status. Mr. Davidson avoids overdraft to the
extent of selling farm machinery, which leaves control over farm decisions in his own
hands.
Farmer (2) Mr. Phillip Gray
Mr. Gray has been farming bio-dynamically with his wife Ruth Gray for nine years.
The Grays illustrate the differences in the cultural and philosophical outlook in the BD
system compared with organic or conventional farming, and the importance of the
community concept to BD. A different background and set of beliefs underlay their
choice of BD.
The Grays met at university where Phillip Gray was completing a Bachelor degree in
agricultural engineering and Ruth Gray was studying languages. Mr. Gray was
influenced by Rachel Carson's Silent Spring (Carson, 1963), although he was not active
in the 1970's environmental movement, and he had an early desire to fann in an
ecologically sensitive manner. One of Mr. Gray's sisters lives nearby on a largely self
sustainable farmlet.
While on their 'Overseas Experience' trip to Europe for several years, Phillip and Ruth
Gray were interested in finding out more about BD, which is centred in Germany.
After initial difficulties, it was as if they were channeled towards BD. and the couple
visited a number of BD falms. They returned to Canterbury enthusiastic to shn,,',' 111;11
Steiner's principles could successfully be applied on the family farm. For I'vI r. Gr~1 y.
OF was not the complete alternative. and the added dimensions of BD' have provided
stimulation and fulfillment. The couple are anthroposophists. and bring their
philosophy into their diet, medicine and lifestyle.
The farm is owned by a family company. and Mr. Gray took over management on his
return from Europe. After the first season, during which the farm suffered from
overgrazing, Mr. Gray reduced the stocking rate, increased the cropping, and began
converting the farm to a BD regime. Phillip Gray's father gave him a five year
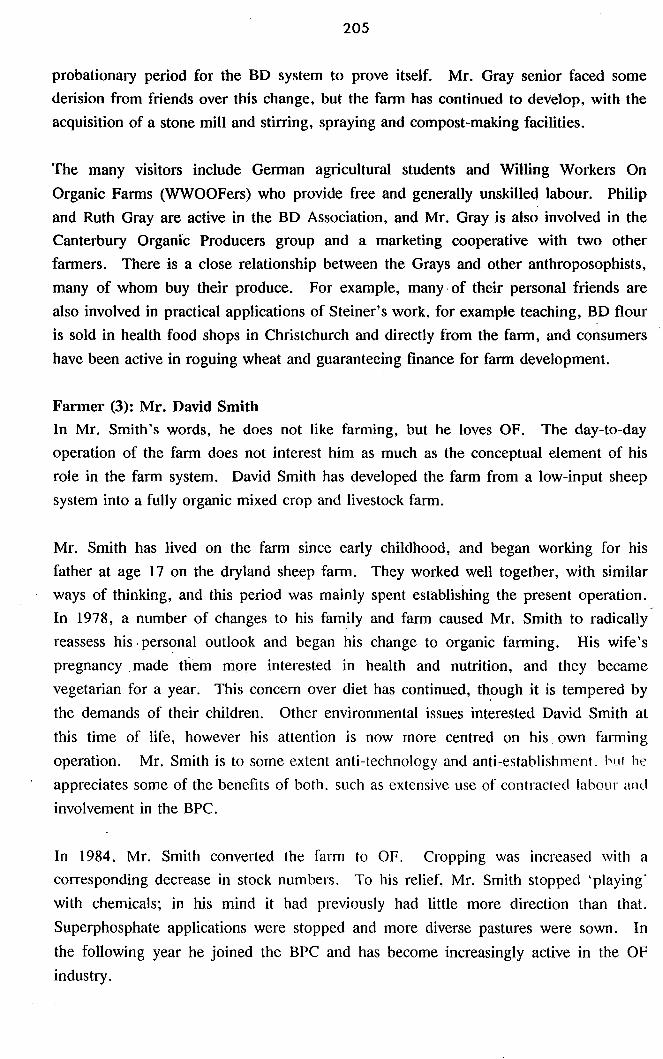
205
probationary period for the BD system to prove itself. Mr. Gray senior faced some
derision from friends over this change. but the farm has continued to develop, with the
acquisition of a stone mill and stirring, spraying and compost-making facilities.
The many visitors include German agricultural students and Willing Workers On
Organic Farms (WWOOFers) who provide free and generally unskilled labour. Philip
and Ruth Gray are active in the BD Association, and Mr. Gray is also involved in the
Canterbury Organic Producers group and a marketing cooperative with two other
farmers. There is a close relationship between the Grays and other anthroposophists,
many of whom buy their produce. For example, many· of their personal friends are
also involved in practical applications of Steiner's work, for example teaching, BD flour
is sold in health food shops in Christchurch and directly from the farm, and consumers
have been active in roguing wheat and guaranteeing finance for farm development.
Farmer (3): Mr. David Smith
In Mr. Smith's words, he does not like farming, but he loves OF. The day-to-day
operation of the farm does not interest him as much as the conceptual element of his
role in the farm system. David Smith has developed the farm from a low-input sheep
system into a fully organic mixed crop and livestock farm.
Mr. Smith has lived on the farm since early childhood, and began working for his
father at age 17 on the dryland sheep farm. They worked well together, with similar
ways of thinking, and this period was mainly spent establishing the present operation.
In 1978, a number of changes to his family and farm caused Mr. Smith to radically
reassess his· personal outlook and began his change to organic farming. His wife's
pregnancy . made tliem more interested in health and nutrition, and they became
vegetarian for a year. This concern over diet has continued, th~ugh it is tempered by
the demands of their children. Other environmental issues interested David Smith at
this time of life, however his attention is now more centred on his. own farming
operation. Mr. Smith is to some extent anti-technology and anti-establishment. '~lJt he
appreciates some of the benefits of both. such as extensive use of contracted labour and
involvement in the BPC.
In 1984. Mr. Smith converted the farm to OF. Cropping was increased with a
corresponding decrease in stock numbers. To his relief. Mr. Smith stopped 'playing'
with chemicals; in his mind it had previously had little more direction than that.
Superphosphate applications were stopped and more diverse pastures were sown. In
the following year he joined the BPC and has become increasingly active in the OF
industry.

206
Independence is also important to David Smith. He prefers hiring contractors for
ploughing, driHing, harvesting and sheari'ng, rather than have a full-time employee.
Mr. Smith can relate to the contractors as equals and they are both skilled and efficient.
He is prepared to let parts of the farm, such as the machinery, run down rather than go
into overdraft, so that he does not have to answer to creditors or follow the advice of a
farm advisor. Much of Mr. Smith's soCial contact is with other organic farmers and
people not involved in: the local farming scene. He finds it supportive to know there
are other organic farmers having similar experiences to himself, and he prefers contact
with a few people where the conversation is on a personal level rather than about meat
prices and dagging.
Farmer (4): Mr. Ross Green Ross and Mary Green have farmed their property since 1968, before which Mr. Green
worked on the farm for his father. Mr. Green is active in the local community, and his
family is well-established in the district. He is a Director of New Zealand Bio Grains
Ltd., and was described by the Managing Director as the 'deepest thinker' of the
group. Mr. Green is one of the 'new breed' of farmers who have recently adopted
organic methods following years of experience with other soil conservation practices.
Mr. Green has a strong belief in the importance of a good soil structure and earthworm
popUlation, and sees the adoption of organic farming as the extension of his soil
building farming philosophy. He has had a history of early adoption of soil-related
technologies. In the past, his soil management was based on a combination of straw ,
incorporation, greenfeed crops, applications -of seaweed soil conditioner, subsoiling and
minimal tillage. Like the other members of NZ Bio Grains Ltd., Ross Green is a long
time client of the seaweed salesman who first established the company. For seven years
prior to conversion, Mr. Green direct drilled crops, a technique which relies heavily on
chemical weed control, and later shifted to a minimal tillage system.
In addition to this long-term commitment to soil-related practices. Ross was an e,lrh'
adopter of other innovations including irrigation. conservation tillage. and he \\'as the
first New Zealand farmer to own certain models of seed drill. subsoiler and combine
harvester. He has had no formal training. and is critical of the closed-minded nature of
Lincoln College. Despite this. the farm has often been used for research. pat1icularly
on the effects of the various innovative practices. which further indicates Mr. Green's
ability as a farmer.
Environmental, economic and other motivations are secondary to soil considerations in
Mr. Green's decision to adopt OF. However the system must still prove itself
207
financially if he is to continue. Promises of reliable, high-priced markets have not
eventuated, and the current situation is a difficult time to adopt a new technology. Mr.
Green regrets the return of weed problems to the farm, although his long cultivation
period has led to better weed control than many other transitional farmers. He would
prefer that limited chemical use such as glyphosate ('Roundup'), a rapidly degradable
herbicide, was permitted by the BPe standards for problems such as barley grass.
However Mr. Green is very conscious of the importance of consumer confidence in the
Bio Gro label, and this is a strong incentive to remain strictly chemical-free. On the
positive side, he welcomes the return to more tractor work and the reduction in stock
work which has been brought about by a change to a less intensive rotational grazing
system. Mrs. Green still applies some pesticides to the vegetable and flower garden,
and the family's diet is typical of rural families.

208
APPENDIX G PROSPECTIVE ORGANIC FARMERS' EXPECTATIONS REGARDING ADOPTION OF ORGANIC FARMING
" Table G.l The expected number of years required to convert prospective farms to an organic or bio-dynamic system.
Years to convert
<2 years 2-5 years 5-10 years > 10 years Don't know
Per cent frequency (n=41)
14.6 53.7 14.6 o
17.0
Source: PROS survey. Appendix D, question D.2.
Table G.2 Change in performance expected by prospective organic farmers during the first three years of organic production
o = Don't know or not relevant 3 = Same as at p'resent 1 = Much lower/worse than at present 4 = Higher/better than at present 2 = Lower/worse than at present 5 = Much higber/better than at present
Variable: (0) (1) (2) (3) (4) (5) Modal class (per cent frequency)
Pasture production 22 0 29 22 22 5 Slightly worse Weed control 17 15 32 22 12 2 Slightly worse Animal pest control 22 7 24 24 20 2 Same/slightly worse Disease control 20 7 32 15 17 0 Mixed Crop yields 51 7 20 17 5 0 Slightly worse Lambing percentage 20 2 15 41 22 0 . Same Animal health 10 5 24 15 34 12 Mixed Wool production 22 2 10 39 20 7 Same Cattle production 49 0 2 29 15 5 Same Costs1 17 15 44 20 5 0 Slightly lower Sales 15 0 32 29 22 2 Same Net income 17 0 17 29 17 10 Same
1. This variable was ambiguous because lower costs are better. not worse. In the table. I = much lower, 2 = lower, 3 = same, 4 = higher. 5 = much higher for this factor. Farmer responses to change in production costs were interpreted by cross-referencing with other questions on the survey form. but should be treated with caution. Source: PROS survey. Appendix D. question E.2.

209
Table G.3 Farm management changes expected by prospective organic farmers to be necessary to adopt organic farming
In addition to changes in fertility maintenance and pest control practices, prospective organic farmers expected to:
Diversify livestock (increase cattle, goats) pastures enterprises
Change crop rotation Reduce stock density Plant more trees (feed, shelter, soil erosion control)
Use BD preparations Change management style, system Incorporate straw Increase cultivation
per cent frequency (n=41)
20.7 8.6 6.9 15.5 15.5
8.6 5.2 3.4 3.4 3.4
Source: PROS survey. Appendix D, question D.l.