Lightweight Floor/Ceiling Systems with Improved Impact ... · PDF filefloor/ceiling can have...
13
BUILDING ACOUSTICS · Volume 17 · Number 2 · 2010 Pages 129–141 129 Lightweight Floor/Ceiling Systems with Improved Impact Sound Insulation Hyuck Chung 1 , Colin Fox 2 , George Dodd 3 and Grant Emms 4 1 School of Computing and Mathematical Sciences, Auckland University of Technology, New Zealand 2 Department of Physics, University of Otago, New Zealand 3 School of Architecture, University of Auckland, New Zealand 4 SCION Research, Rotorua, New Zealand ABSTRACT Contrary to common belief, a relatively simple and practical lightweight timber based floor/ceiling can have impact sound insulation superior to that of concrete slab based systems. This paper presents examples of such systems that include vibration isolation/damping features, such as rubber ceiling batten clips, glass fibre wool, and a sand-sawdust mixture layer. We give enough details to reproduce our experiments and build the proposed lightweight systems. INTRODUCTION A room with good heat and sound insulation can make us feel secure and comfortable. Our interest in this paper is in sound insulation that can be achieved using lightweight floor/ceiling systems or lightweight timber-framed systems (LTFS). In general, the more money and time one spends, the higher sound insulation performance one can achieve. In the past, thick and heavy, e.g., concrete slabs, has been a well-accepted method to achieve good sound insulation. However, timber-based lightweight construction methods are more favourable in countries, such as New Zealand, Canada, and Scandinavian countries where timber is more economical and environmentally sustainable. In this paper we present several examples of lightweight timber based floor/ceiling systems that have higher sound insulation performances than the concrete slab based systems. As the popularity of LTFS grows, the systems weakness in sound insulation in the low- to mid-frequency range has become apparent. The lightness of the system, which is an advantage in terms of construction, is in this case a main reason for the poor performance. Our objective is then to improve the low to mid-frequency sound insulation without increasing the total weight of the system. In this article we describe how the theory and the experiments have been used together to come up with novel designs of the lightweight floor/ceiling systems. In 2006 the authors produced a technical report [3] for Forest & Wood Products Australia (formerly Forest and Wood Products Research and Development). This article gives structural vibration and subjective listening test parts of the report.
Transcript of Lightweight Floor/Ceiling Systems with Improved Impact ... · PDF filefloor/ceiling can have...

BUILDING ACOUSTICS · Volume 17 · Number 2 · 2010 Pages 129–141 129
Lightweight Floor/Ceiling Systems with Improved Impact Sound Insulation
Hyuck Chung1, Colin Fox2, George Dodd3 and Grant Emms4
1School of Computing and Mathematical Sciences, Auckland University of Technology, New Zealand
2Department of Physics, University of Otago, New Zealand3School of Architecture, University of Auckland, New Zealand
4SCION Research, Rotorua, New Zealand
ABSTRACTContrary to common belief, a relatively simple and practical lightweight timber basedfloor/ceiling can have impact sound insulation superior to that of concrete slab based systems.This paper presents examples of such systems that include vibration isolation/damping features,such as rubber ceiling batten clips, glass fibre wool, and a sand-sawdust mixture layer. We giveenough details to reproduce our experiments and build the proposed lightweight systems.
INTRODUCTIONA room with good heat and sound insulation can make us feel secure and comfortable.Our interest in this paper is in sound insulation that can be achieved using lightweightfloor/ceiling systems or lightweight timber-framed systems (LTFS). In general, themore money and time one spends, the higher sound insulation performance one canachieve. In the past, thick and heavy, e.g., concrete slabs, has been a well-acceptedmethod to achieve good sound insulation. However, timber-based lightweightconstruction methods are more favourable in countries, such as New Zealand, Canada,and Scandinavian countries where timber is more economical and environmentallysustainable. In this paper we present several examples of lightweight timber basedfloor/ceiling systems that have higher sound insulation performances than the concreteslab based systems.
As the popularity of LTFS grows, the systems weakness in sound insulation in thelow- to mid-frequency range has become apparent. The lightness of the system, whichis an advantage in terms of construction, is in this case a main reason for the poorperformance. Our objective is then to improve the low to mid-frequency soundinsulation without increasing the total weight of the system. In this article we describehow the theory and the experiments have been used together to come up with noveldesigns of the lightweight floor/ceiling systems. In 2006 the authors produced atechnical report [3] for Forest & Wood Products Australia (formerly Forest and WoodProducts Research and Development). This article gives structural vibration andsubjective listening test parts of the report.

During the project, 26 variations of LTFS were built. The designs were madeincrementally complex. At each step of design changes, a theoretical model andarchitectural practicalities contributed to choose which component and how to changeit. The theoretical model was built to predict the low-frequency vibrations of the floorand the ceiling surfaces when damping, stiffness, or sizes of various components werechanged. Thus it kept us from wasting our time on building clearly inferior designs.
The designs we present were also evaluated in listening tests [3]. These verified thatin realistic settings the lightweight floor/ceiling systems can have better soundinsulation than a 150mm thick concrete slab with suspended ceiling panels. The use ofa sand and sawdust mixture in the upper layer of the system improves the performancessignificantly. This debunks the widely held belief (e.g. [2]) that LTFS cannot performas well as their concrete counterpart.
In the following sections we will present:
1. Detailed measurements of the surface motion using a laser-vibrometer.2. Recording and recreating the impact sound from the structure.3. Listening tests to assess the performance of the systems.
Design specifications of selected experimental floor/ceiling systems will also begiven. Material properties and details of proprietarily products are given in theappendix.
EXPERIMENTAL SETUPSTwo series of experiments were conducted to assess the performance of eachfloor/ceiling design. First, detailed vibration measurements of the ceiling and floorsurfaces gave us the low-frequency behaviour of the structure, such as resonancefrequencies and modal shapes. Second, we recorded the sound from each structureresulting from various impact sources on the floor surface. The recordings were thenplayed back to human subjects, who graded the LTFS.
130 Lightweight Floor/Ceiling Systems with Improved Impact Sound Insulation
Figure 1. An electrodynamic shaker (left) and setups of the laser vibrometer tomeasure the ceiling (right).

Vibration of the floor and the ceilingsEach design was constructed and tested in a purpose-built test rig (see Figure 1). Anelectrodynamic shaker provided a localized vertical force on the upper surface,connected through a wire stinger and a reference force transducer. The force transducermeasured how much force was applied to to the floor. The shaker body was mountedon a beam resting on supports, which sat on the concrete collar surrounding the floor,and the beam itself was isolated from the concrete collar by very resilient pads made ofpolyester fibre infill. A pseudo-random signal was used as excitation, with a bandwidthfrom 10Hz to 500Hz, for a duration of 2 seconds (to achieve a frequency resolution of0.5Hz).
We used a scanning laser vibrometer (Polytec PSV 300) to measure the velocitynormal to the surface of the floor and ceiling for each of the test designs. A grid with aspatial resolution of 10-14cm was obtained to map the surface velocity of the floor andceiling relative to the input force. Both amplitude and phase information were recordedat each frequency. Figure 1 shows the laser-vibrometer setup for measuring floor andceiling vibrations. The scanning vibrometer can capture fine details of the surfacemotion as shown in Figure 2. The overall vibration response was measured in terms ofthe root-mean-square (RMS) velocity in dB (also shown in Figure 2), as this gives ameasure of average radiated sound power at each frequency.
Recording impact sounds and listening testsExperimental floor/ceiling systems were constructed in the ceiling opening (7m by3.2m) of a purpose-built concrete block reverberation chamber. In total 26 systems werebuilt and tested according to ISO 140-6. We made near-field recordings underneath theceilings (70mm from the ceiling) at 4 microphone positions spaced across a diagonal ofthe chamber of a sequence of impact excitations of each floor/ceiling construction.These excitations comprised –
BUILDING ACOUSTICS · Volume 17 · Number 2 · 2010 131
80
70
60
50
40
30
20
√<v2 >
, dB
(re
: 50x
10–8
ms)
20 40 60 80 100 120 140 160 180 200
Frequency (Hz)
Displacement per unit force at 20Hz, and at phase 90° relative to force
Ver
tical
dis
plac
emen
t (m
)
x 10-6
6
4
2
0
-2
-4
-6
-3-2
-1 -6-5
-4-3
-2-1
x (m) y (m)
Figure 2. Top: the RMS velocity of the ceiling, as a function of frequency. Bottom:a mesh plot of the amplitude of vertical displacement of the ceiling andfloor for the second resonant mode (at about 20Hz).

• the standard tapping machine at a central floor position• heavy tyre drops at 4 positions along a diagonal (above the mic positions) • a 72Kg male walking along the diagonal • the same male running along the same diagonal • light impact ball drops at the 4 diagonal positions
In each case simultaneous recordings were made from the 4 near-field microphones.The RT (Reverberation time) of the chamber was reduced for these recordings by layingout a complete floor covering of thick polyester sound absorber. The aim was to reducereverberant sound picked up by the near-field microphones. The recordings were playedback in a simulated living room that conforming to IEC 268-13. The room itself wasequipped with 4.2 loudspeaker reproduction system (4 loudspeakers in the ceilingcavity and 2 sub-woofers in the room). Our approach was novel in the following ways:
1. The listening room (Figure 3) was furnished to look and feel like a domestic envi-ronment
2. The hidden loudspeakers provided directional realism for the impact sound3. The system was equalized to provide a flat frequency response down to 16Hz (see
Figure 4)
The individual loudspeakers in the ceiling of the listening room were each fed withone channel of the recordings. The 2 woofer loudspeakers were fed an average mix ofthe low frequency signals from the 4 microphones. The levels at the subject’s listeningposition were adjusted to account for differences in RT between the reverberationchamber and the listening room based on the ISO 140 impact measurement spectra.
31 subjects were invited to participate as assessors for the initial experiment. Theywere chosen to provide a group spanning a wide age range (mean age 31 years,maximum 61 years) and between males and females. Also they were only included if,based on the subjects’ own reporting, they were free from any hearing impairment. Eachparticipant was asked to complete profiling questionnaires to collect information ontheir listening habits, noise sensitivity, and privacy rating.
The impact insulation performance of a concrete slab floor (150mm thick) with asuspended plasterboard ceiling was taken as a reference and the LTF floor recordingswere paired with the equivalent recording from the concrete slab and presented in anA/B comparison for assessment of (a) preference and (b) difference. A selection wasmade of 8 floors considered most relevant to the overall project. This, together with 4impact types (walking on bare floor, walking on carpeted floor, tapping machine andball drop), gave 32-paired assessments for each subject.
The preference question took the form of a 2-Alternative-Forced-Choice experimentwith no ties allowed [5] and for this the subjects were asked to imagine they were goingto live in an apartment where they had to choose a floor/ceiling construction to separatethem from the apartment above. The presented sounds in each pair being the typicalsounds they might hear from 2 alternative floor/ceiling constructions. In each case oneof the pair was the sound from the concrete reference floor although this was notcommunicated to the subjects.
132 Lightweight Floor/Ceiling Systems with Improved Impact Sound Insulation

The difference question took the form of asking the subjects to mark on a continuoussemantic differential scale how different the pair of sounds seemed. The extremes of thescale were marked Not significantly different and Markedly different and the mid pointwas marked Noticeably different.
DESIGNS AND PERFORMANCESFigure 5 shows the design of a common joist floor, which has a plywood upper layer,supporting timber joists, and a suspended ceiling panel underneath. All other designswe present are developments on this basic configuration. We made three kinds ofchanges to the top layer: variation of its mass, its stiffness, and its damping. Ourexperiments have shown that increasing damping between components, rather thanincreasing the mass or the stiffness, is most effective at reducing the vibration responseof this type of floor.
BUILDING ACOUSTICS · Volume 17 · Number 2 · 2010 133
Figure 3. Listening room simulating an average living room with commonfurniture settings.
100
90
80
70
60
50
40
30
20
Leve
l (dB
)
12.5 20 31.5 50 80 125 200 315 500 800 1.25k 2k 3.15k 5k 8k 12.5k 20k
Frequency Hz
Response in the IEC Listening Room
Figure 4. Listening room sound level across the frequency range.
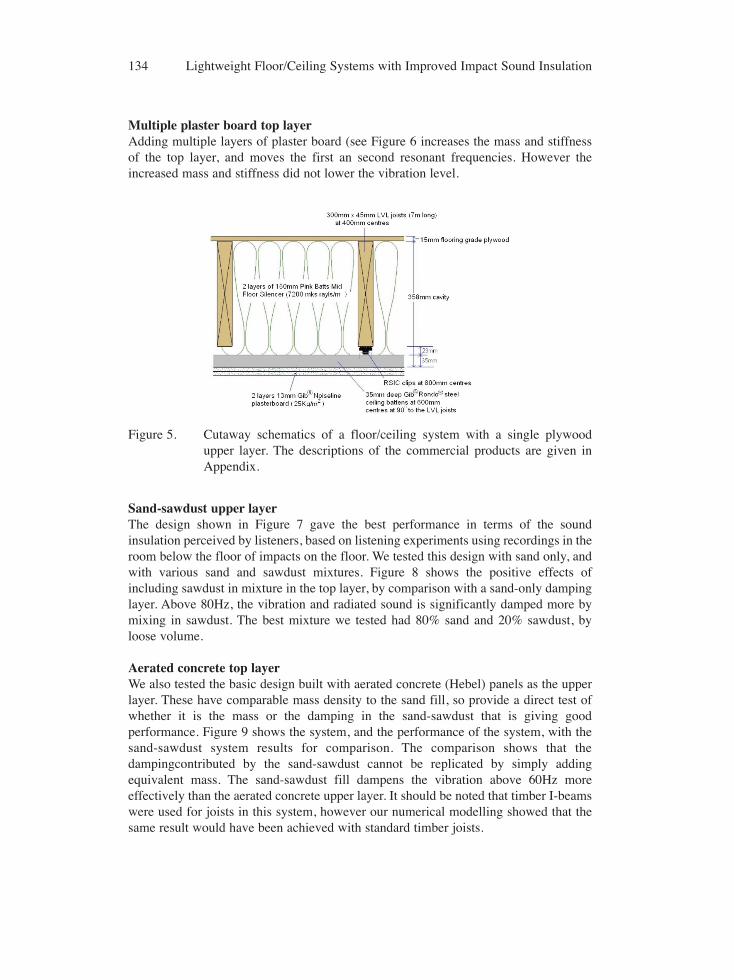
Multiple plaster board top layerAdding multiple layers of plaster board (see Figure 6 increases the mass and stiffnessof the top layer, and moves the first an second resonant frequencies. However theincreased mass and stiffness did not lower the vibration level.
Sand-sawdust upper layerThe design shown in Figure 7 gave the best performance in terms of the soundinsulation perceived by listeners, based on listening experiments using recordings in theroom below the floor of impacts on the floor. We tested this design with sand only, andwith various sand and sawdust mixtures. Figure 8 shows the positive effects ofincluding sawdust in mixture in the top layer, by comparison with a sand-only dampinglayer. Above 80Hz, the vibration and radiated sound is significantly damped more bymixing in sawdust. The best mixture we tested had 80% sand and 20% sawdust, byloose volume.
Aerated concrete top layerWe also tested the basic design built with aerated concrete (Hebel) panels as the upperlayer. These have comparable mass density to the sand fill, so provide a direct test ofwhether it is the mass or the damping in the sand-sawdust that is giving goodperformance. Figure 9 shows the system, and the performance of the system, with thesand-sawdust system results for comparison. The comparison shows that thedampingcontributed by the sand-sawdust cannot be replicated by simply addingequivalent mass. The sand-sawdust fill dampens the vibration above 60Hz moreeffectively than the aerated concrete upper layer. It should be noted that timber I-beamswere used for joists in this system, however our numerical modelling showed that thesame result would have been achieved with standard timber joists.
134 Lightweight Floor/Ceiling Systems with Improved Impact Sound Insulation
Figure 5. Cutaway schematics of a floor/ceiling system with a single plywoodupper layer. The descriptions of the commercial products are given inAppendix.

Figure 10 shows numerical simulations of the effect of using various values ofstiffness and mass density in the upper layer [1]. The mass density and the stiffnesswere varied in order to confirm that the damping by the sand-sawdust could not beachieved by replacing it with layers that provide only mass and stiffness. That is, wewant to confirm and extend the conclusion reached from the comparison in Figure 9.Both simulations in Figure 10 show that an increase in mass and stiffness certainlylowers the vibration level above 80Hz. However the vibration level is still highlyvarying with frequency compared to the near flat response of the sand-sawdust floor.Furthermore, it takes an impractical amount of mass and stiffness to achieve aperformance comparable to that achieved with a sand-sawdust layer.
BUILDING ACOUSTICS · Volume 17 · Number 2 · 2010 135
Figure 6. Cutaway schematics of a floor/ceiling system with three plaster boards asthe upper layer.
Figure 7. Cutaway schematics of a floor/ceiling system with a sand-sawdustdamping layer.

Transverse stiffeningIn order to stiffen the floor perpendicular to the joists, we tried transverse stiffening asshown in Figure 11. The addition of transverse stiffeners was found to increase thefundamental frequency of the floor, and therefore to make it potentially noticeable tohuman hearing. This is particularly the case if the floor is relatively narrow. Thus,transverse stiffeners should not be installed between the floor edge and the next joist.As a consequence though, this introduces a rotational vibration mode in the floor, whichdepends on the bending stiffness of the upper layer. However, since it is an odd typemode (and hence having a tendency for canceling for radiated sound) the soundradiation efficiency would be low.
The effect of the stiffeners was to produce little change at frequencies below100Hz,but a poorer performance for frequencies above 100Hz. Transverse stiffeners madefrom I-beam sections were also added to the Hebel floor and their effect was againinsignificant. Thus we conclude that transverse stiffeners in floor designs provide littleacoustical benefit.
Table 1. Standard single figure ratings of the various floor/ceiling systems.
Top layer IIC Ln,w C1 Ln,w+Cl
Concrete slab 37 69 -12 57Single plywood 49 61 -1 603 plaster boards 61 45 1 46Hebel panel 35 72 -10 62Sand-sawdust 62 48 -2 46
Tapping machine resultsTable 1 shows the results of tapping machine experiments. A standard tapping machinewas used on the bare floor surface to measure the standard single figure ratings. We didnot use any additional surface cover (e.g. carpet) in order to create the most demandingcondition, and because it is common to have bare floors or parquet directly on top ofconcrete. The overall Ln,w rating of each floor was obtained using the relevant part ofISO 140 and ISO 717-2. The table shows IIC ratings in accordance with ASTM E989(Standard Classification for Determination of Impact Insulation Class) and spectrumadaptation terms Ln,w+ CI. Note that Ln,w+CI tends to have mid-frequency emphasis.The worst performing floors for high-frequency impact insulation as indicated by a highLn,w values are the systems with a 150mm concrete slab, and with aerated concretepanels. Although these systems would meet the Australian building code requirements(Ln,w+CI £62), they would not meet the New Zealand building code requirements(IIC≥55).
Listening test resultsThe intention was to use the difference judgements to provide a ranking of the differentfloor constructions relative to one another. It became evident, however, that subjectsapproached their judgement in two differing ways. This difficulty has prompted a repeat
136 Lightweight Floor/Ceiling Systems with Improved Impact Sound Insulation

stage of experimentation but the results from the 2AFC question do in general supportthe rankings found by the difference method (see Table 2).
Table 2. Rankings by Preference and Subjective Difference scores. Althoughmany more LTFS were ranked, we only show the LTFS mentioned in this paper.
Top layer Tapping machine Ball drop Walking
Concrete slab 5th 1st 3rdSingle plywood 4th 5th 5th3 plaster boards 2nd 4th 2ndHebel panel 3rd 3rd 4thSand-sawdust 1st 2nd 1st
BUILDING ACOUSTICS · Volume 17 · Number 2 · 2010 137
Varying upper layer
Plywood40mm sand40mm sand/sawdust
√<v2 >
, dB
(re
:5x1
0–8m
/s)
Frequency (Hz)
80
70
60
50
40
30
2020 40 60 80 100 120 140 160 180 200
Figure 8. Top: RMS velocity comparison between sand-sawdust and sand-onlyupper layer. Bottom: Photo of sand-sawdust layer before it is covered byplywood.

The cohort of subjects was too small to allow any clear indications of differencesbetween subjects of significantly different Noise Sensitivity or Privacy Rating. Whenthe subjects were divided into Low, Average and High groups for Noise Sensitivity andPrivacy Rating the results showed no consistent trend, - but with such small numbers ofsubjects in the extreme groups (e.g.~the High Noise Sensitivity and Low Privacy Ratinggroups each comprised only 3 subjects) this cannot be relied on as indicating nodependency.
When divided by sex a small but consistent difference between men and women wasevident (e.g. an average of 0.32 for the tapping machine and 0.53 for the Ball drop -these values being distances on the continuous scale of length 10) with women judgingdifferences overall to be slightly smaller.
When the subjects were divided into two age groups first those aged <30 (n=14) andthose aged >40 (n=10) the judgements were not different for the tapping machinesounds but for the Ball drops the younger subjects consistently judged the differenceslarger by an average of 1.2.
Apart from providing a direct indication of the relative satisfaction to occupants ofLTFS and standard concrete floor constructions we hoped that the subjectiveexperiment results would help clarify if existing objective measures are adequate forranking occupant preference. The issue here is that the standard building insulationmeasures [4] – even with the ISO low frequency extensions [6] – do not cover the fullbandwidth used in this experiment. However, Loudness (in Sones) and A-weighted SPLare both standardised measures and can be extended to include all the low frequencies(see [3] for the Loudness calculation). The correlations between Loudness and thesubjective preference scores are given in [3], and the results show surprisingly goodcorrelations for both the A-weighted SPL (Leq 10s) and Loudness with the subjectivejudgements.
138 Lightweight Floor/Ceiling Systems with Improved Impact Sound Insulation
Hebel concretesand-sawdust
√<v2 >
, dB
(re
:5x1
0–8m
/s)
Frequency (Hz)
80
70
60
50
40
30
2020 40 60 80 100 120 140 160 180 200
5.5m long 300mm I joists at 450mm centres
2 layers of 150mm Pink Batts MidFloor Silencer (7200 mks rayls/m)
75mm Hebel
358mm cavity
23mm
35mm
Figure 9. Left: RMS velocity comparison between the structures with sand-sawdust and equivalently weighted upper layers. Right: A cutawayschematics of the floor/ceiling system with aerated concrete upper layerand timber I-beams for the joists.

The rankings consistently show sand-sawdust system as either close to, or betterthan, the concrete reference construction whatever the impact source or floor covering.The critical condition is when the floor is subjected to heavy impact where theLoudness and A-weighted SPL results and the subjective preferences do distinguish thefloors as different. We note that Ln’w and IIC values are not helpful here because thetapping machine has such a different excitation spectrum.
Guidance can be found from the way in which semantic difference scale processinghas been carried out in other research on subjective judgements. We processed our scalewith a resolution of 1% but others divide their scales into categories with a muchcoarser resolution. For example in the most recent work (see [9] and [10]) it isrecommended to use a scale divided into only 5 categories. This would imply thatsubjective differences less than 2 in our results put the sounds in the same category ofacoustic perception and the associated floors into the same class of acoustic comfort.This is clearly the case for sand-sawdust system in the case of the ball drop where,although the mean preferences indicates a bias for the concrete slab floor, the subjectivedifference is less than 2 (i.e. 1.61 for the Ball drop).
Further guidance is found in the acoustic quality categories and classes of acousticalcomfort that are used in Europe (e.g. in the Nordic countries and Germany). Typicallydifferent categories or classes span a range of 5 - 7dB, and so impact levels that differby less than 5dB would be regarded as being subjectively in the same category. This isconsistent with the 5dB increments that are used in audiometry in order to create levelchanges, which are just noticeable to the average listener. The A-weighted SPL (Leq10s) values for sand-sawdust system and the reference concrete system in the abovesituation, in fact differ by less than 1dB.
It therefore seems a valid conclusion from this experiment that sand-sawdust system– and any similarly performing LTFS – provides a subjectively perceived performance,
BUILDING ACOUSTICS · Volume 17 · Number 2 · 2010 139
Varying stiffness of upper layer
2,000,000Nm162,000,000Nm1,458,000,000Nm
√<v2
>, d
B (
re:5
x10–
8 m/s
)
Frequency (Hz)
80
70
60
50
40
30
20
10200150100500
Varying mass density of upper layer
10kg/m2
80kg/m2
240kg/m2
√<v2
>, d
B (
re:5
x10–
8 m/s
)
Frequency (Hz)
80
70
60
50
40
30
20
10200150100500
Figure 10. Numerical simulations with various upper layer stiffness (top) and massdensity (bottom).

which is at least as acceptable as that of the 150mm concrete reference floor. This istrue, at least, for the range of normal impacts represented by the sources used in thisexperiment, but, as the reproduction system did not adequately reproduce the verylowest frequencies, confirmation is necessary from the next stage of planned subjectivetesting.
CONCLUSIONSA lightweight floor/ceiling system requires a range of components to achieve effectiveisolation of the ceiling layer from vibration induced in the floor surface above. Theinclusion of a sand-sawdust mixture layer has been found to provide effective vibrationdamping of the whole composite structure over a wide frequency range. In fact, a sand-sawdust layer results in a performance which is superior to the addition of mass orstiffeners to the upper layer. A notable advantage of the sand-sawdust design is that thebottom and top plywood panels in the upper layer are directly connected through theseparating battens (see Figure 7), which makes the system robust to building mistakes.Another advantage of such a highly damped system is that flanking transmission is wellattenuated.
The ultimate aim of research on the insulation provided by floor/ceiling systemsmust be to determine what is required to render impact noises completely non-problematic. In this project we have addressed an interim goal of demonstrating thatLTFS can be designed to match, or exceed, the insulation achieved by a concrete-basedfloor (interpreted as 150 mm slab with a plasterboard suspended ceiling). In addition wehave demonstrated that a Loudness calculation suitably extended to include the verylow frequencies provides a reasonably acceptable means for rank order LTFS for theirability to insulate against heavy and light impacts.
AKNOWLEDGEMENTThe authors would like to acknowledge G. Schmid of the Acoustics Research Centre atthe University of Auckland for the photos and design schematics of the floor/ceilingsystems.
140 Lightweight Floor/Ceiling Systems with Improved Impact Sound Insulation
Figure 11. Sytem with the transverse stiffeners.

REFERENCE1 H. Chung and G. Emms, “Fourier series solutions to the vibration of rectangular
lightweight floor/ceiling structures”, ACTA Acustica united with Acustica, 94(3),401-409 (2008)
2 W.E. Blazier and R.B. DuPree, “Investigation of low-frequency footfall noise inwood-frame, multifamily building construction” J. Acoust. Soc. Am., 96, 1521-1532 (1994)
3 G. Emms, H. Chung, G. Dodd, G. Schmid, and K. McGunnigle, “FWPRDCProject PN04.2005 Maximising impact sound resistance of timber framedfloor/ceiling systems” The Forest and Wood Products Research and DevelopmentCorporation. Australian Government, www.fwpa.com.au (2006)
4 ASTM Standard E989 Standard Classification for Determination of IIC
5 ASTM Standard E 2263-04 Standard Test Method for Paired Preference Test
6 ISO 140-6 Laboratory Measurement of Impact Sound Insulation
7 ISO 717-2 Rating of Sound Insulation in Buildings – Impact Sound Insulation
8 F.R. Mortensen. (2000). “Subjective Evaluation of Noise from Neighbours – withFocus on Low Frequencies” Publication 53, Dept of Acoustic Technology,Technical University of Denmark
9 A.C. Johansson “Drum sound from floor coverings - Objective and subjectiveassessments” PhD Thesis, Lund University, ISBN 91-628-6538-5, (2005)
10 R. Guski, “Psychological methods for evaluating sound quality and assessingacoustic information” ACTA Acustica 83, 765—774 (1997)
BUILDING ACOUSTICS · Volume 17 · Number 2 · 2010 141