LIGHTNING STRIKE MAPPING FOR PENINSULAR MALAYSIA … · LIGHTNING STRIKE MAPPING FOR PENINSULAR ......
13
Journal of Theoretical and Applied Information Technology 31 st December 2011. Vol. 34 No.2 © 2005 - 2011 JATIT & LLS. All rights reserved . ISSN: 1992-8645 www.jatit.org E-ISSN: 1817-3195 202 LIGHTNING STRIKE MAPPING FOR PENINSULAR MALAYSIA USING ARTIFICIAL INTELLIGENCE TECHNIQUES 1 M.K.HASSAN, 2 R. Z. ABDUL RAHMAN, 3 A..CHE .SOH., 4 M.Z.A..AB KADIR 1,2,3,4 Department of Electrical and Electronics, Faculty of Engineering, University Putra Malaysia, 43400, Serdang, Selangor Darul Ehsan, Malaysia E-mail : 1 [email protected] , 2 [email protected] , 3 [email protected] , 4 [email protected] ABSTRACT This research focuses on artificial intelligence (AI) techniques on mapping the lightning strike area in Peninsular Malaysia. Three AI techniques such as fuzzy logic, neural network and neuro-fuzzy techniques are selected to be explored in classifying the characteristics of lightning strike which are based on; level of strike (high, medium, low) and category of lightning (positive cloud-to-ground, negative cloud-to-ground, flash). Nine predefined areas in Peninsular Malaysia were chosen as a case study. The analysis was carried out according to twelve months lightning data strikes which had been made available by Global Lightning Network (GLN). All three AI techniques have successfully demonstrated the ability to mapping and classify lightning strikes. Each technique has shown very good percentage of accuracy in term of determining the area and characterizing the lightning strikes. The finding of this research can be made use in risk management analysis, lightning protection analysis, township planning projects and the like. Keywords: Lightning Strike, Classification, Fuzzy Logic, Neural Network, Neuro-Fuzzy 1. INRODUCTION Lightning strike comes about every day in the world. The lightning strike towards the surface on earth has been estimated at 100 times every second. Thus, almost every governments suffer major loses because of this phenomenon every year. It also would cause horrific injury and fatality to humans and animals. The lightning may affect almost every organ system as the current passes through the human body taking the shortest pathways between the contact points. There are 25.9% of lightning strike occurrences for victims who have sheltered under trees or shades, whereas 37% at open space area. Head and neck injury are two common areas which have an effect on the lightning strike victims with 77.78% and 74% respectively. Only 29.63% of the cases presented with ear bleeding [1]. United State National Lightning Safety Institution reported that Malaysia has highest lightning activities in the world whilst the average-thunder day level for Malaysia’s capital Kuala Lumpur within 180 - 260 days per annum [2, 3]. The isokeraunic level is approximately 200 thunderstorm days a year. The lightning ground flash density is about 15-20 strike per km 2 per year. Lightning has an extremely high current, high voltage and transient electric discharge. It is transient discharge of static electricity that serves to re-establish electrostatic equilibrium within a storm environment [1]. Malaysia lies near the equator and therefore it is categorized as prone to high lightning and thunderstorm activities [2]. Observations performed by the Malaysian Meteorological Services indicate that thunders occur 200 days a year in Malaysia. Thunderstorms have been suspected to have caused between 50% and 60 % of the transient tripping in the transmission and distribution networks for Tenaga Nasional Berhad (TNB), Malaysia’s electric power provider. The main reason could be short of precise and consistent
Transcript of LIGHTNING STRIKE MAPPING FOR PENINSULAR MALAYSIA … · LIGHTNING STRIKE MAPPING FOR PENINSULAR ......
Journal of Theoretical and Applied Information Technology 31st December 2011. Vol. 34 No.2
© 2005 - 2011 JATIT & LLS. All rights reserved.
ISSN: 1992-8645 www.jatit.org E-ISSN: 1817-3195
202
LIGHTNING STRIKE MAPPING FOR PENINSULAR MALAYSIA USING ARTIFICIAL INTELLIGENCE
TECHNIQUES
1M.K.HASSAN, 2R. Z. ABDUL RAHMAN, 3A..CHE .SOH., 4M.Z.A..AB KADIR 1,2,3,4Department of Electrical and Electronics, Faculty of Engineering,
University Putra Malaysia, 43400, Serdang, Selangor Darul Ehsan, Malaysia
E-mail: [email protected], [email protected], [email protected], [email protected]
ABSTRACT
This research focuses on artificial intelligence (AI) techniques on mapping the lightning strike area in Peninsular Malaysia. Three AI techniques such as fuzzy logic, neural network and neuro-fuzzy techniques are selected to be explored in classifying the characteristics of lightning strike which are based on; level of strike (high, medium, low) and category of lightning (positive cloud-to-ground, negative cloud-to-ground, flash). Nine predefined areas in Peninsular Malaysia were chosen as a case study. The analysis was carried out according to twelve months lightning data strikes which had been made available by Global Lightning Network (GLN). All three AI techniques have successfully demonstrated the ability to mapping and classify lightning strikes. Each technique has shown very good percentage of accuracy in term of determining the area and characterizing the lightning strikes. The finding of this research can be made use in risk management analysis, lightning protection analysis, township planning projects and the like. Keywords: Lightning Strike, Classification, Fuzzy Logic, Neural Network, Neuro-Fuzzy 1. INRODUCTION Lightning strike comes about every day in the world. The lightning strike towards the surface on earth has been estimated at 100 times every second. Thus, almost every governments suffer major loses because of this phenomenon every year. It also would cause horrific injury and fatality to humans and animals. The lightning may affect almost every organ system as the current passes through the human body taking the shortest pathways between the contact points. There are 25.9% of lightning strike occurrences for victims who have sheltered under trees or shades, whereas 37% at open space area. Head and neck injury are two common areas which have an effect on the lightning strike victims with 77.78% and 74% respectively. Only 29.63% of the cases presented with ear bleeding [1]. United State National Lightning Safety Institution reported that Malaysia has highest lightning activities in the world whilst the average-thunder day level for Malaysia’s capital Kuala Lumpur within 180 - 260 days per annum
[2, 3]. The isokeraunic level is approximately 200 thunderstorm days a year. The lightning ground flash density is about 15-20 strike per km2 per year. Lightning has an extremely high current, high voltage and transient electric discharge. It is transient discharge of static electricity that serves to re-establish electrostatic equilibrium within a storm environment [1]. Malaysia lies near the equator and therefore it is categorized as prone to high lightning and thunderstorm activities [2]. Observations performed by the Malaysian Meteorological Services indicate that thunders occur 200 days a year in Malaysia. Thunderstorms have been suspected to have caused between 50% and 60 % of the transient tripping in the transmission and distribution networks for Tenaga Nasional Berhad (TNB), Malaysia’s electric power provider. The main reason could be short of precise and consistent
ISSN:
lightnistudie Lightncurrenparticltypes (ii) clCloudthe chAboutMajorgrowindenoteand poMeanwhappencloud cloud. Positivchargelightniabout as thetravelswheremore aof thebuildsgroundbetweelectrichargeparticlThe aflowinovercois know The darea flightnigovernindustare; phousinand inThe lilevel olightnicloud-classifneural
Jou
1992-8645
ing data in Ms on lightning
ning dischargent flows due tles of positive of lightning d
loud-to-cloud d-to-ground denharge at the clot 25% of lirity of C2G ng ball [5, 6].ed as C2C occuositive charge while, intracns when someattract the pos
ve lightning tae flows insteading is positiveduring the pea
e storm is decas outside the c there is a poand more negae cloud, more in the upper d beneath then the cloud ic field. Theed particles les arise as chair prevents
ng. However, ome, a dischargwn as the nega
development ofor Peninsularing characterisnment assessmtrial ventures. rotector design
ng developmenndustrial suitabightning strikeof strike (highing (positive -to-ground, fication technil network and (
rnal of Theo
©
Malaysia to eand its mitigat
e occurs wheto exert a puand negative. T
discharge (i) cl(intercloud) (inoted as C2G
oud strike the gightning strik
lightning wi Cloud-to-clouurs when the nof different cl
cloud lightnine charge at thsitive charge at
ake places whed of electrons.
e in nature andak of severe thaying [6]. Poscloud and strikool of a negatiative charge bue and more ppart of the clohe cloud. Thand the grou
e pull towarand negativ
harge continuethe electric if this insula
ge will go off. ative lightning.
of lightning sr Malaysia wistic is an effoment for any
Such valuabln, prone area nt, theme parkbility locationse is classified, medium, low
cloud-to-grouflash). T
ques are (i) fu(iii) neuro-fuzz
oretical and31st Decem
2005 - 2011 JAT
ww
enable throughion [5].
en the electricull on chargedThere are threeloud-to-groundiii) intracloudhappens when
ground surfacekes are C2Gill appear asud (intercloud)negative chargeouds attractedng dischargehe base of thet the top of the
en the positive. About 5% ofd tend to comehunderstorm orsitive lightningkes the groundive charge. As
uilds at the basepositive chargeoud and on thehe separation
und creates anrds positivelyvely chargedes to build up
current fromator of air isThis discharge
trike mappingith regards to
fort to providehousing and
le assessmentsidentification
k constructions and et ceterad according tow) and types ofund, negative
The chosenfuzzy logic (ii)zy.
d Applied Inber 2011. Vol. 34TIT & LLS. All rig
ww.jatit.org
203
h
c d e d .
n . . s ) e . e e e
e f e r g d s e e e n n y d .
m s e
g o e d s ,
n .
o f e n )
2. M 2.1 P The has b1. Efollow
23
4567
89
F
AlthoIndonthat mbut tcapabclass The lLight(i) ticurrecharaFigur
nformation T4 No.2 ghts reserved.
METHODOLO
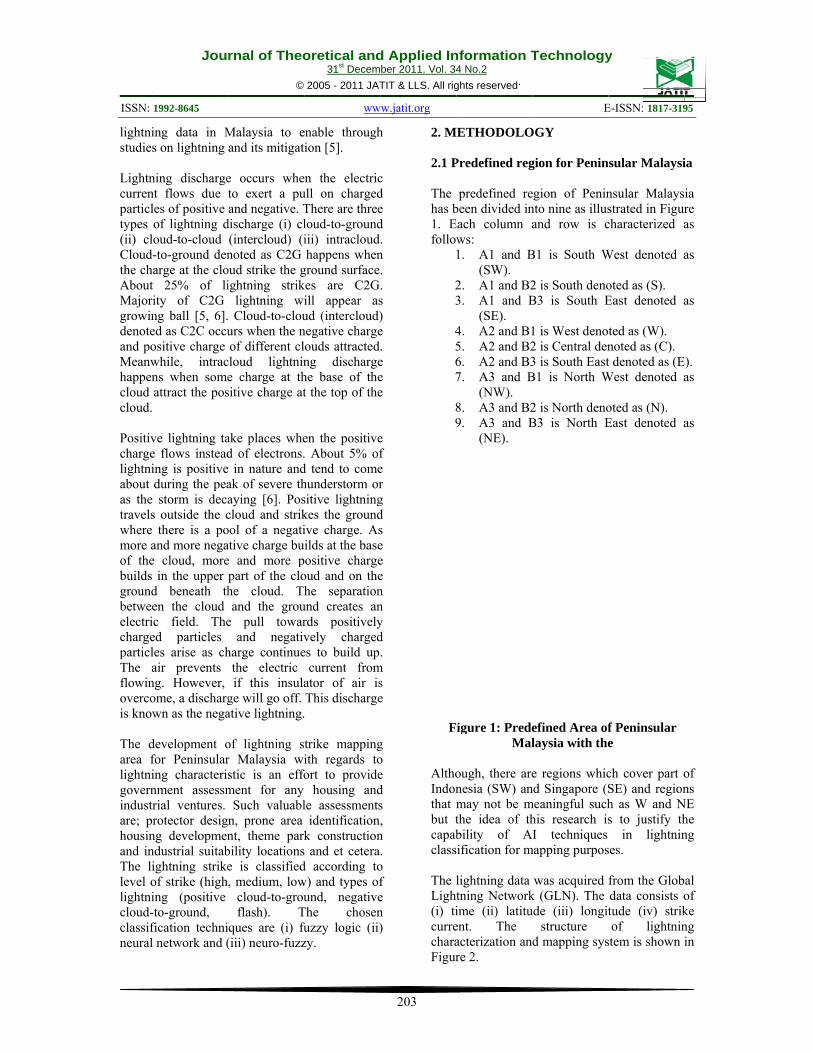
Predefined reg
predefined rebeen divided inEach column a
ws: 1. A1 and B
(SW). 2. A1 and B23. A1 and B
(SE). 4. A2 and B15. A2 and B26. A2 and B37. A3 and B
(NW). 8. A3 and B29. A3 and B
(NE).
igure 1: PredeMal
ough, there arenesia (SW) anmay not be mthe idea of thbility of A
sification for m
lightning data tning Networkime (ii) latituent. The acterization anre 2.
Technology
E
OGY
gion for Penin
egion of Peninnto nine as illusand row is c
B1 is South W
2 is South denoB3 is South E
1 is West deno2 is Central den3 is South EastB1 is North W
2 is North denoB3 is North E
efined Area oflaysia with the
e regions whicnd Singapore (Smeaningful suchhis research isI techniques
mapping purpos
was acquired k (GLN). The ude (iii) longit
structure d mapping sys
y
E-ISSN: 1817-319
sular Malaysi
nsular Malaysstrated in Figurcharacterized a
West denoted a
oted as (S). East denoted a
ted as (W). noted as (C). t denoted as (E
West denoted a
oted as (N). East denoted a
f Peninsular e
ch cover part oSE) and regionh as W and Ns to justify th
in lightninses.
from the Globdata consists otude (iv) strikof lightnin
stem is shown i
95
ia
ia re as
as
as
E). as
as
of ns
NE he ng
al of ke ng in
ISSN:
F
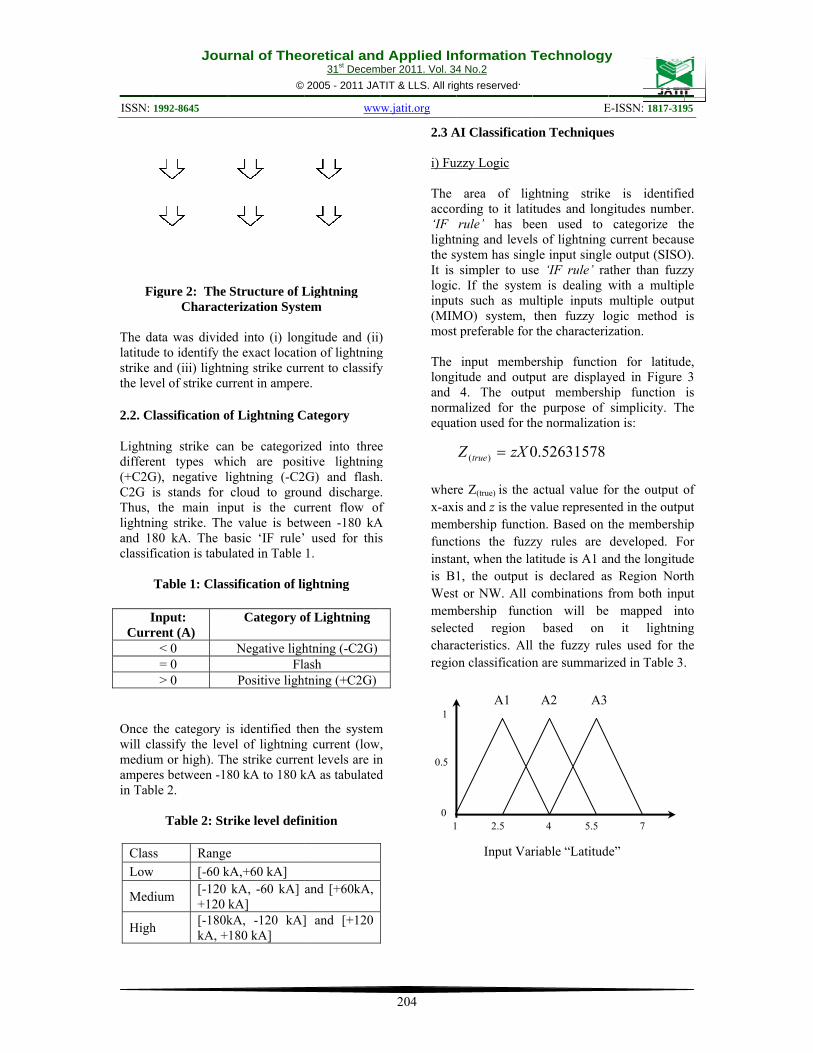
The dlatitudstrike the lev 2.2. C Lightndiffere(+C2GC2G Thus, lightniand 1classif
ICurr
Once will clmediuamperin Tab
ClasLow
Med
High
Jou
1992-8645
Figure 2: The Charact
data was dividede to identify thand (iii) lightn
vel of strike cu
lassification o
ning strike canent types whG), negative lis stands for the main inp
ing strike. The80 kA. The bfication is tabu
Table 1: Clas
Input: rent (A)
< 0 = 0 > 0
the category ilassify the lev
um or high). Thres between -18ble 2.
Table 2: Str
ss Rangew [-60 k
dium [-120 +120
h [-180kkA, +
rnal of Theo
©
Structure of Lerization Syst
ed into (i) lonhe exact locationing strike curr
urrent in ampere
of Lightning C
n be categorizhich are posilightning (-C2cloud to grouput is the cue value is betwbasic ‘IF rule’ulated in Table
ssification of li
Category o
Negative lighFla
Positive ligh
is identified thvel of lightninghe strike curren80 kA to 180 k
rike level defi
e kA,+60 kA]
kA, -60 kA] kA] kA, -120 kA]180 kA]
oretical and31st Decem
2005 - 2011 JAT
ww
Lightning tem
gitude and (ii)on of lightningrent to classifye.
Category
zed into threeitive lightning2G) and flashund dischargeurrent flow ofween -180 kA used for this1.
ightning
of Lightning
htning (-C2G)ash
htning (+C2G)
hen the systemg current (lownt levels are inkA as tabulated
nition
and [+60kA,
] and [+120
d Applied Inber 2011. Vol. 34TIT & LLS. All rig
ww.jatit.org
204
) g y
e g . . f
A s
m ,
n d
2.3 A i) Fu The accor‘IF lightnthe syIt is logicinput(MIMmost The longiand normequat
wherx-aximemfunctinstanis BWestmemselecchararegio
10
0.5
1
nformation T4 No.2 ghts reserved.
AI Classificatio
uzzy Logic
area of ligrding to it latirule’ has bening and levelystem has singsimpler to us
c. If the systemts such as muMO) system, t preferable for
input membeitude and outp4. The outp
malized for thetion used for th
re Z(true) is the is and z is the v
mbership functitions the fuzznt, when the la1, the output t or NW. All c
mbership functcted region acteristics. Allon classification
0)( zXZ true =
1 2.5
A1
Input Var
Technology
E
on Technique
ghtning strikeitudes and longeen used to ls of lightning gle input singlese ‘IF rule’ ram is dealing wultiple inputs then fuzzy lo
r the characteri
ership functioput are displayput membershe purpose of he normalizatio
actual value fovalue representon. Based on tzy rules are atitude is A1 anis declared ascombinations ftion will be
based on l the fuzzy ruln are summariz
52631578.0
4 5.5
A2 A3
riable “Latitud
y
E-ISSN: 1817-319
es
e is identifiegitudes numbecategorize thcurrent becaus
e output (SISOather than fuzzwith a multipmultiple outpuogic method zation.
on for latitudyed in Figure hip function simplicity. Th
on is:
for the output oted in the outputhe membershideveloped. Fond the longituds Region Nortfrom both inpu mapped int
it lightninles used for thzed in Table 3
7
de”
95
ed er. he se
O). zy le ut is
de, 3 is
he
of ut ip or de th ut to ng he .
Journal of Theoretical and Applied Information Technology 31st December 2011. Vol. 34 No.2
© 2005 - 2011 JATIT & LLS. All rights reserved.
ISSN: 1992-8645 www.jatit.org E-ISSN: 1817-3195
205
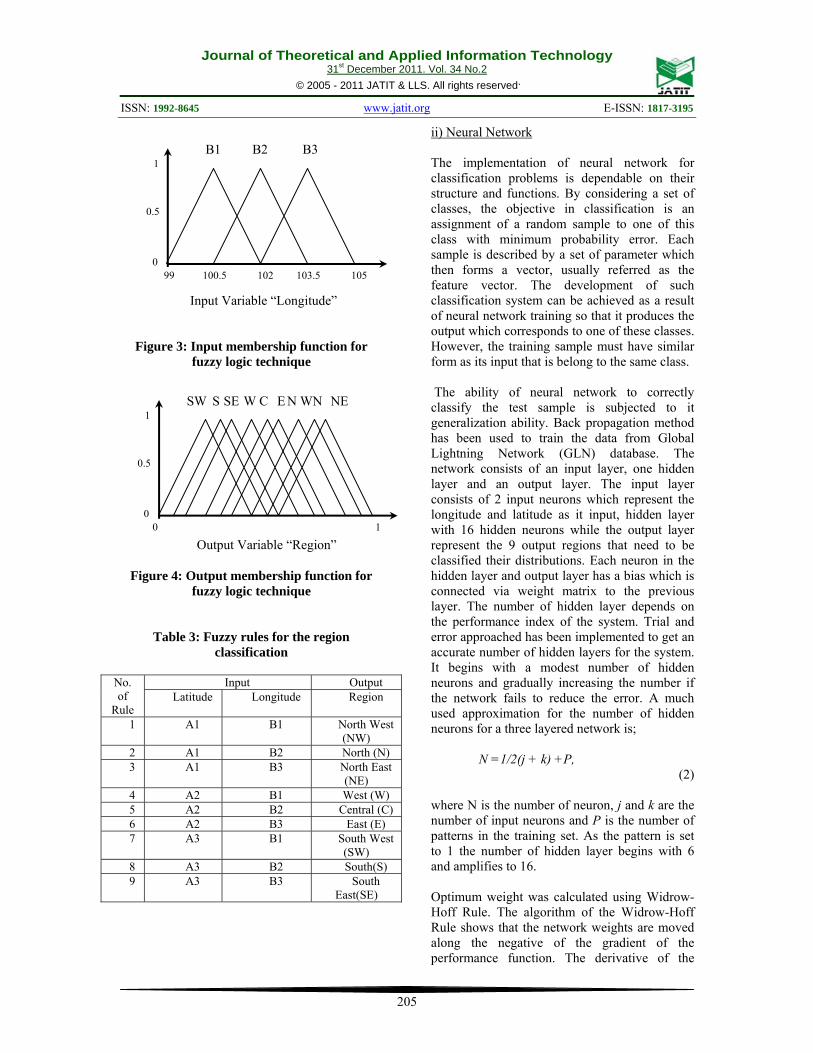
Figure 3: Input membership function for fuzzy logic technique
Figure 4: Output membership function for fuzzy logic technique
Table 3: Fuzzy rules for the region classification
No. of
Rule
Input Output Latitude Longitude Region
1 A1 B1 North West (NW)
2 A1 B2 North (N) 3 A1 B3 North East
(NE) 4 A2 B1 West (W) 5 A2 B2 Central (C) 6 A2 B3 East (E) 7 A3 B1 South West
(SW) 8 A3 B2 South(S) 9 A3 B3 South
East(SE)
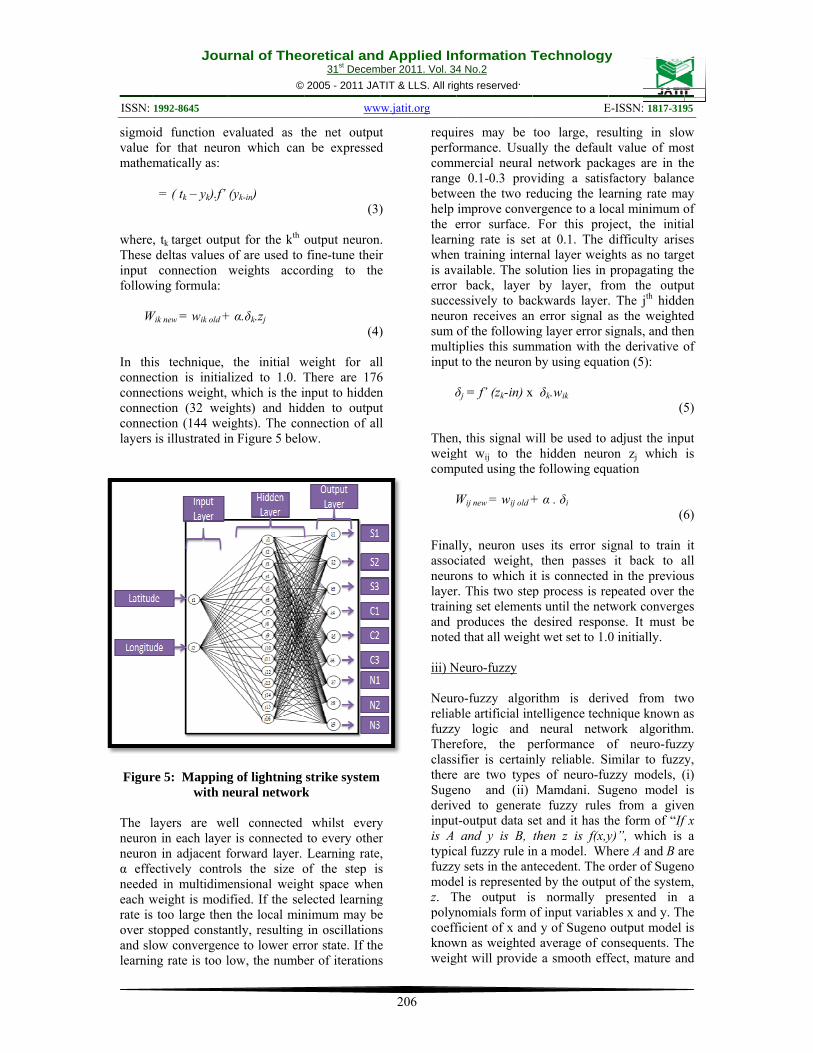
ii) Neural Network The implementation of neural network for classification problems is dependable on their structure and functions. By considering a set of classes, the objective in classification is an assignment of a random sample to one of this class with minimum probability error. Each sample is described by a set of parameter which then forms a vector, usually referred as the feature vector. The development of such classification system can be achieved as a result of neural network training so that it produces the output which corresponds to one of these classes. However, the training sample must have similar form as its input that is belong to the same class. The ability of neural network to correctly classify the test sample is subjected to it generalization ability. Back propagation method has been used to train the data from Global Lightning Network (GLN) database. The network consists of an input layer, one hidden layer and an output layer. The input layer consists of 2 input neurons which represent the longitude and latitude as it input, hidden layer with 16 hidden neurons while the output layer represent the 9 output regions that need to be classified their distributions. Each neuron in the hidden layer and output layer has a bias which is connected via weight matrix to the previous layer. The number of hidden layer depends on the performance index of the system. Trial and error approached has been implemented to get an accurate number of hidden layers for the system. It begins with a modest number of hidden neurons and gradually increasing the number if the network fails to reduce the error. A much used approximation for the number of hidden neurons for a three layered network is;
N =1/2(j + k) +P,
(2)
where N is the number of neuron, j and k are the number of input neurons and P is the number of patterns in the training set. As the pattern is set to 1 the number of hidden layer begins with 6 and amplifies to 16.
Optimum weight was calculated using Widrow-Hoff Rule. The algorithm of the Widrow-Hoff Rule shows that the network weights are moved along the negative of the gradient of the performance function. The derivative of the
99 100.5 102 103.5 105
B1 B2 B3
0
0.5
1
Input Variable “Longitude”
S C N SE E NE SW W N W
0 1 0
0.5
1
Output Variable “Region”
ISSN:
sigmovalue mathe
whereThese input follow
W
In thiconnecconnecconnecconneclayers
Figur
The lneuronneuronα effeneededeach wrate isover sand sllearnin
Jou
1992-8645
id function efor that neuromatically as:
= ( tk – yk).f’
, tk target outpdeltas values connection
wing formula:
Wik new = wik old +
is technique, ction is initialctions weight, ction (32 weiction (144 weiis illustrated in
re 5: Mappingwith n
layers are wen in each layern in adjacent fectively controd in multidimeweight is modis too large thenstopped constanow convergencng rate is too l
rnal of Theo
©
evaluated as ton which can
(yk-in)
put for the kth of are used to weights acco
+ α.δk.zj
the initial wlized to 1.0. Twhich is the i
ights) and hidights). The conn Figure 5 belo
g of lightning
neural network
ell connected r is connected forward layer. ols the size oensional weighified. If the seln the local minntly, resulting ce to lower errlow, the numb
oretical and31st Decem
2005 - 2011 JAT
ww
the net outputn be expressed
(3)
output neuronfine-tune their
ording to the
(4)
weight for allThere are 176input to hiddendden to outputnnection of allow.
strike system k
whilst everyto every otherLearning rate
of the step isht space whenlected learningnimum may bein oscillations
ror state. If theer of iterations
d Applied Inber 2011. Vol. 34TIT & LLS. All rig
ww.jatit.org
206
t d
)
. r e
)
l 6 n t l
y r , s n g e s e s
requiperfocommrangebetwhelp the elearnwhenis averrorsucceneurosum multiinput
δ
Thenweigcomp
Finalassocneurolayertrainiand noted iii) N NeurreliabfuzzyTherclassthereSugederivinputis A typicfuzzymodez. Tpolyncoeffknowweig
nformation T4 No.2 ghts reserved.
ires may be ormance. Usuamercial neural e 0.1-0.3 prov
ween the two reimprove conveerror surface.
ning rate is setn training intervailable. The sor back, layer essively to bacon receives anof the followiniplies this sumt to the neuron
δj = f’ (zk-in) x
n, this signal wght wij to the puted using the
Wij new = wij old +
lly, neuron usciated weight,ons to which ir. This two steping set elemenproduces the d that all weigh
Neuro-fuzzy
ro-fuzzy algorble artificial iny logic and efore, the p
sifier is certaine are two typeeno and (ii) ved to generatt-output data sand y is B,
cal fuzzy rule iny sets in the anel is represente
The output isnomials form oficient of x andwn as weightedght will provide
Technology
E
too large, resally the defaul
network packviding a satiseducing the leergence to a lo
For this projt at 0.1. The rnal layer weigolution lies in
by layer, frckwards layer.
n error signal ang layer error s
mmation with thby using equa
x δk.wik
will be used to hidden neuro
e following equ
+ α . δi
ses its error si, then passes it is connected p process is re
nts until the netdesired respon
ht wet set to 1.0
rithm is derintelligence tech
neural netwperformance only reliable. Sies of neuro-fu
Mamdani. Sute fuzzy ruleset and it has ththen z is f(x,yn a model. Wh
ntecedent. The ed by the outpus normally pof input variabd y of Sugeno d average of coe a smooth eff
y
E-ISSN: 1817-319
sulting in slot value of mo
kages are in thfactory balancarning rate ma
ocal minimum ooject, the initidifficulty arise
ghts as no targpropagating th
rom the outpu. The jth hiddeas the weightesignals, and thehe derivative o
ation (5):
(5
adjust the inpuon zj which uation
(6
ignal to trainit back to a
in the previouepeated over thtwork convergense. It must b0 initially.
ived from twhnique known awork algorithmof neuro-fuzzimilar to fuzzy
uzzy models, (ugeno model s from a givehe form of “If y)”, which is here A and B arorder of Sugenut of the systempresented in les x and y. Thoutput model
onsequents. Thfect, mature an
95
w ost he ce ay of al es
get he ut en ed en of
5)
ut is
6)
it all us he es be
wo as m. zy y, (i) is
en f x
a re no m,
a he is
he nd
ISSN:
efficieminimMamd
The efficietechnioutputmatheadvantpreferquite applichandwby Alachievfuzzy fuzzy-recogn100% For ligusing the arecharaclightnimeansapproastrike CanadThe licharacBould[12,13
Figu
The nis struNFC
Jou
1992-8645
ent gain schedumize the dedani model.
Sugeno modeency and suitaques. It also gt surface, whimatical examtage, the Sugence for compa number ofations worldw
written recognil-Alawi [9]. Tved 98.5% of
classification-gaussian neuranition system accuracy on
ghtning classifthe artificial inea and the levcterization, aning strike mapss classifier wach for measurmapping. The
dian Lightning ightning strikecterized to 1din criterion 3,14].
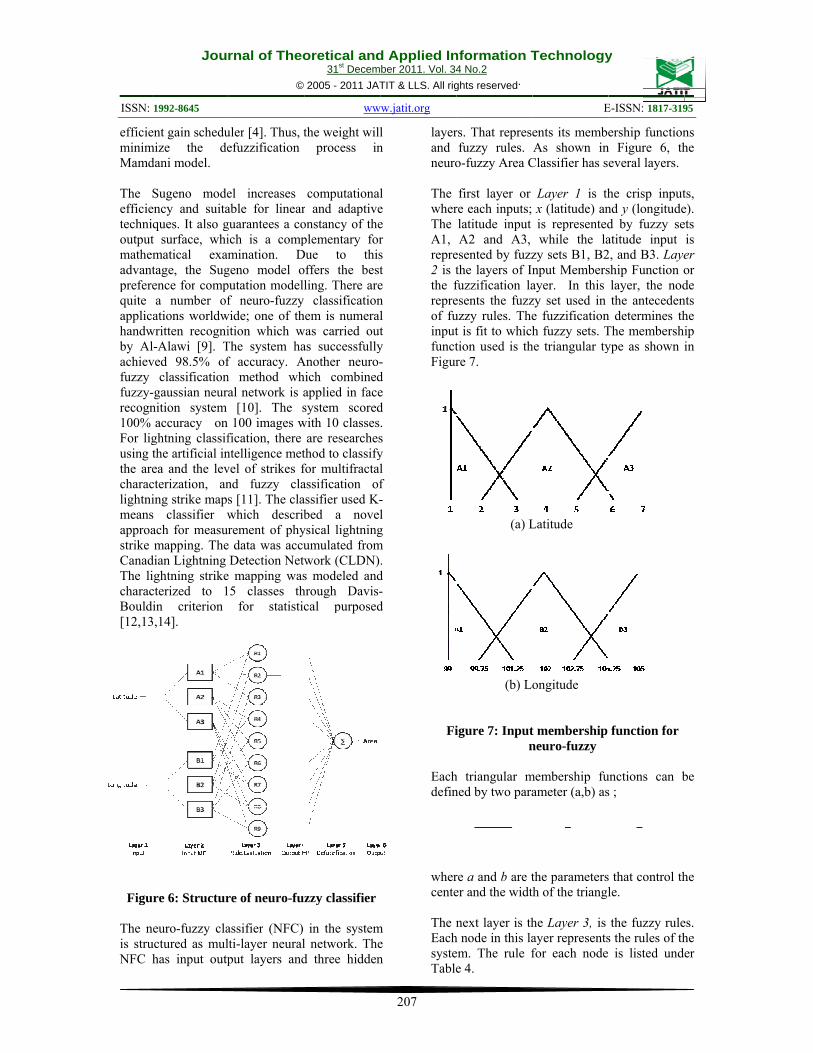
ure 6: Structur
neuro-fuzzy clauctured as mulhas input outp
rnal of Theo
©
uler [4]. Thus, tefuzzification
el increases able for linearguarantees a coich is a compmination. D
geno model oputation modellf neuro-fuzzy
wide; one of thition which w
The system haf accuracy. An method whal network is a
[10]. The s100 images w
fication, there ntelligence metvel of strikes fnd fuzzy clas [11]. The clawhich describrement of phy
e data was accuDetection Netw
e mapping was5 classes th
for statistic
re of neuro-fu
assifier (NFC) lti-layer neuralput layers and
oretical and31st Decem
2005 - 2011 JAT
ww
the weight willprocess in
computationalr and adaptiveonstancy of theplementary for
Due to thisoffers the bestling. There are
classificationhem is numeralwas carried outas successfully
Another neuro-hich combinedapplied in facesystem scored
with 10 classesare researches
thod to classifyfor multifractalassification ofassifier used K-bed a novel
ysical lightningumulated fromwork (CLDN)s modeled andhrough Davis-cal purposed
zzy classifier
in the systeml network. Thed three hidden
d Applied Inber 2011. Vol. 34TIT & LLS. All rig
ww.jatit.org
207
l n
l e e r s t e n l t y -d e d . s y l f -l g
m .
d -d
m e n
layerand neuro The wherThe A1, repre2 is tthe frepreof fuinputfunctFigur
Fi
Eachdefin
whercente
The nEachsysteTable
nformation T4 No.2 ghts reserved.
rs. That represfuzzy rules.
o-fuzzy Area C
first layer or re each inputs;latitude input A2 and A3,
esented by fuzzthe layers of Infuzzification laesents the fuzzuzzy rules. Thet is fit to whichtion used is thre 7.
(a) L
(b) Lo
igure 7: Inputn
h triangular mned by two para
re a and b are ter and the widt
next layer is thh node in this laem. The rule fe 4.
Technology
E
ents its membeAs shown in
Classifier has s
Layer 1 is thx (latitude) anis representedwhile the la
zy sets B1, B2nput Membersayer. In this zy set used in e fuzzificationh fuzzy sets. T
he triangular ty
Latitude
ongitude
t membership neuro-fuzzy
membership fuameter (a,b) as
the parametersth of the triangl
he Layer 3, is ayer representsfor each node
y
E-ISSN: 1817-319
ership functionn Figure 6, theveral layers.
he crisp inputnd y (longituded by fuzzy seatitude input 2, and B3. Layeship Function olayer, the nodthe anteceden
n determines thThe membershiype as shown i
function for
unctions can bs ;
s that control thle.
the fuzzy rules the rules of th
is listed und
95
ns he
ts, e). ets is er or de nts he ip in
be
he
es. he er
ISSN:
Node
1
2
3
4
5
6
7
8
9
It is al3 and node layer layers After is feddefuzzdefuzzmetho
wherethe ouFiguremembsystemhas 9NorthWWest (SW),
Fi
Jou
1992-8645
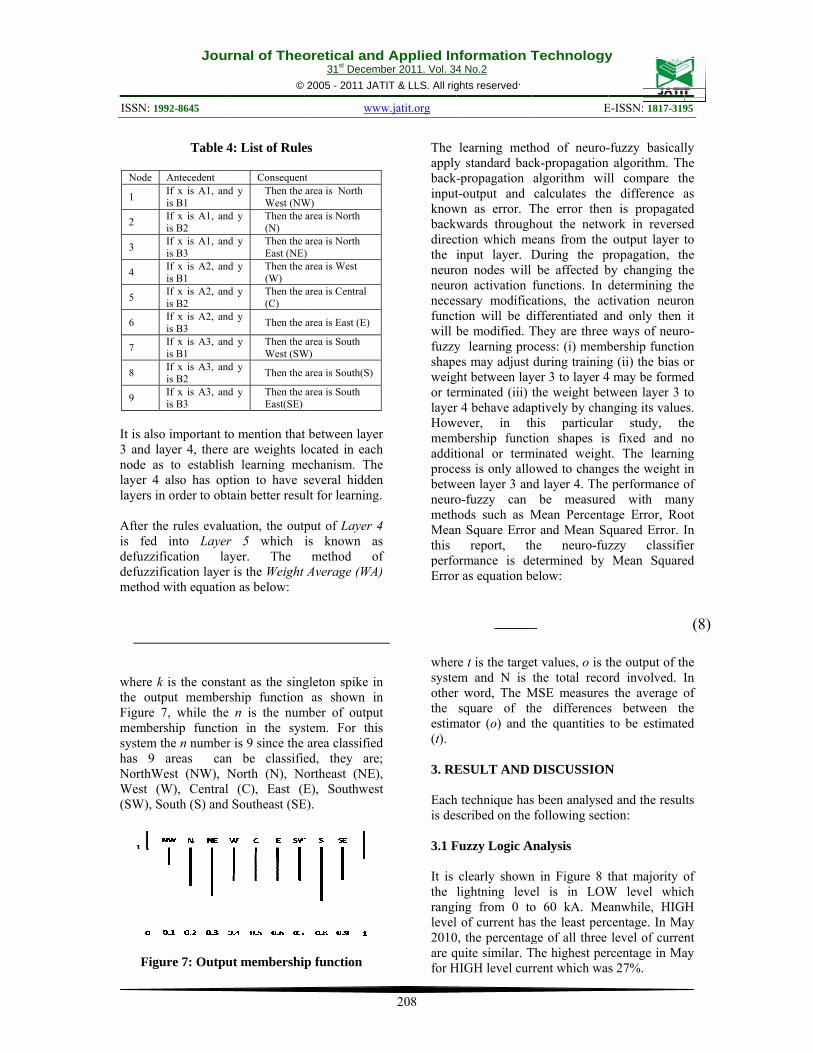
Table 4
Antecedent If x is A1, anis B1 If x is A1, anis B2 If x is A1, anis B3 If x is A2, anis B1 If x is A2, anis B2 If x is A2, anis B3 If x is A3, anis B1 If x is A3, anis B2 If x is A3, anis B3
lso important tlayer 4, thereas to establish4 also has opin order to obt
the rules evalud into Layerzification lazification layerod with equatio
k is the constutput membere 7, while thebership functiom the n number9 areas canWest (NW), N(W), CentralSouth (S) and
igure 7: Outpu
rnal of Theo
©
4: List of Rule
Consequend y Then the
West (NWd y Then the
(N) d y Then the
East (NE)d y Then the
(W) d y Then the
(C) d y Then the
d y Then the West (SW
d y Then the
d y Then the East(SE)
o mention that are weights lh learning me
ption to have stain better resu
uation, the outpr 5 which ayer. The r is the Weight on as below:
tant as the singrship function e n is the numon in the sysr is 9 since the n be classifieNorth (N), Nl (C), East (Ed Southeast (SE
ut membershi
oretical and31st Decem
2005 - 2011 JAT
ww
es
nt area is North
W) area is North
area is North ) area is West
area is Central
area is East (E)
area is South W)
area is South(S)
area is South
t between layerocated in eachechanism. Theseveral hidden
ult for learning.
put of Layer 4is known as
method ofAverage (WA)
gleton spike inas shown in
mber of outputstem. For thisarea classified
ed, they areortheast (NE)E), Southwest
E).
p function
d Applied Inber 2011. Vol. 34TIT & LLS. All rig
ww.jatit.org
208
r h e n .
4 s f )
n n t s d ; , t
The applybackinputknowbackwdirecthe neuroneuronecesfunctwill bfuzzyshapeweigor terlayerHowmemadditprocebetwneuromethMeanthis perfoError
whersysteotherthe estim(t). 3. RE Eachis de 3.1 F It is the rangilevel2010are qfor H
nformation T4 No.2 ghts reserved.
learning methy standard bac-propagation t-output and
wn as error. Twards through
ction which meinput layer. Don nodes will on activation ssary modification will be dbe modified. Ty learning proes may adjust
ght between layrminated (iii) tr 4 behave adap
wever, in thmbership funct
tional or termess is only allo
ween layer 3 ano-fuzzy can
hods such as Mn Square Error
report, thormance is der as equation b
re t is the targeem and N is r word, The Msquare of th
mator (o) and t
ESULT AND
h technique hasscribed on the
Fuzzy Logic A
clearly shownlightning leveing from 0 tol of current has0, the percentagquite similar. THIGH level cur
Technology
E
hod of neuro-ck-propagationalgorithm wilcalculates the
The error thenhout the netweans from the During the pbe affected b
functions. In dations, the ac
differentiated aThey are three ocess: (i) membduring training
yer 3 to layer 4the weight betptively by chanhis particulaion shapes is
minated weightowed to changnd layer 4. The
be measureMean Percentar and Mean Sqhe neuro-fuzetermined by elow:
et values, o is tthe total reco
MSE measureshe differencesthe quantities
DISCUSSION
s been analysedfollowing sect
Analysis
n in Figure 8 tel is in LOWo 60 kA. Mes the least percge of all three
The highest perrrent which wa
y
E-ISSN: 1817-319
-fuzzy basicalln algorithm. Thll compare the difference an is propagateork in reverseoutput layer t
propagation, thby changing thdetermining th
ctivation neuroand only then
ways of neurobership functiog (ii) the bias o
4 may be formetween layer 3 tnging its value
ar study, ths fixed and nt. The learnines the weight iperformance o
ed with manage Error, Rooquared Error. Izzy classifieMean Square
the output of thrd involved. I
s the average os between thto be estimate
N
d and the resultion:
that majority oW level whicanwhile, HIGcentage. In Malevel of curren
rcentage in Mas 27%.
95
ly he he as ed ed to he he he on it
o-on or ed to
es. he no ng in of ny ot In er ed
he In of he ed
lts
of ch
GH ay nt ay
(8)
Journal of Theoretical and Applied Information Technology 31st December 2011. Vol. 34 No.2
© 2005 - 2011 JATIT & LLS. All rights reserved.
ISSN: 1992-8645 www.jatit.org E-ISSN: 1817-3195
209
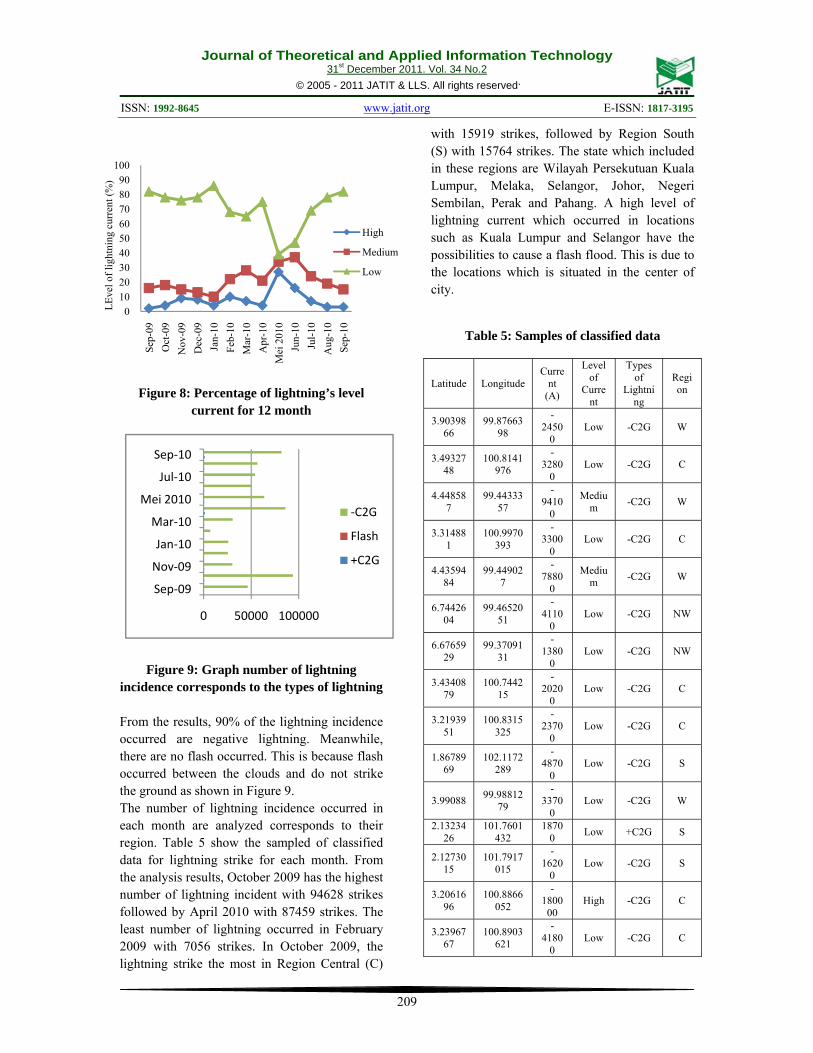
Figure 8: Percentage of lightning’s level current for 12 month
Figure 9: Graph number of lightning incidence corresponds to the types of lightning
From the results, 90% of the lightning incidence occurred are negative lightning. Meanwhile, there are no flash occurred. This is because flash occurred between the clouds and do not strike the ground as shown in Figure 9. The number of lightning incidence occurred in each month are analyzed corresponds to their region. Table 5 show the sampled of classified data for lightning strike for each month. From the analysis results, October 2009 has the highest number of lightning incident with 94628 strikes followed by April 2010 with 87459 strikes. The least number of lightning occurred in February 2009 with 7056 strikes. In October 2009, the lightning strike the most in Region Central (C)
with 15919 strikes, followed by Region South (S) with 15764 strikes. The state which included in these regions are Wilayah Persekutuan Kuala Lumpur, Melaka, Selangor, Johor, Negeri Sembilan, Perak and Pahang. A high level of lightning current which occurred in locations such as Kuala Lumpur and Selangor have the possibilities to cause a flash flood. This is due to the locations which is situated in the center of city.
Table 5: Samples of classified data
Latitude Longitude Curre
nt (A)
Level of
Current
Types of
Lightning
Region
3.9039866
99.8766398
-2450
0 Low -C2G W
3.4932748
100.8141976
-3280
0 Low -C2G C
4.448587
99.4433357
-9410
0
Medium -C2G W
3.314881
100.9970393
-3300
0 Low -C2G C
4.4359484
99.449027
-7880
0
Medium -C2G W
6.7442604
99.4652051
-4110
0 Low -C2G NW
6.6765929
99.3709131
-1380
0 Low -C2G NW
3.4340879
100.744215
-2020
0 Low -C2G C
3.2193951
100.8315325
-2370
0 Low -C2G C
1.8678969
102.1172289
-4870
0 Low -C2G S
3.99088 99.9881279
-3370
0 Low -C2G W
2.1323426
101.7601432
18700 Low +C2G S
2.1273015
101.7917015
-1620
0 Low -C2G S
3.2061696
100.8866052
-1800
00 High -C2G C
3.2396767
100.8903621
-4180
0 Low -C2G C
0102030405060708090
100Se
p-09
Oct
-09
Nov
-09
Dec
-09
Jan-
10Fe
b-10
Mar
-10
Apr
-10
Mei
201
0Ju
n-10
Jul-1
0A
ug-1
0Se
p-10
LEve
l of l
ight
ning
cur
rent
(%)
High
Medium
Low
0 50000 100000
Sep‐09
Nov‐09
Jan‐10
Mar‐10
Mei 2010
Jul‐10
Sep‐10
‐C2G
Flash
+C2G
Journal of Theoretical and Applied Information Technology 31st December 2011. Vol. 34 No.2
© 2005 - 2011 JATIT & LLS. All rights reserved.
ISSN: 1992-8645 www.jatit.org E-ISSN: 1817-3195
210
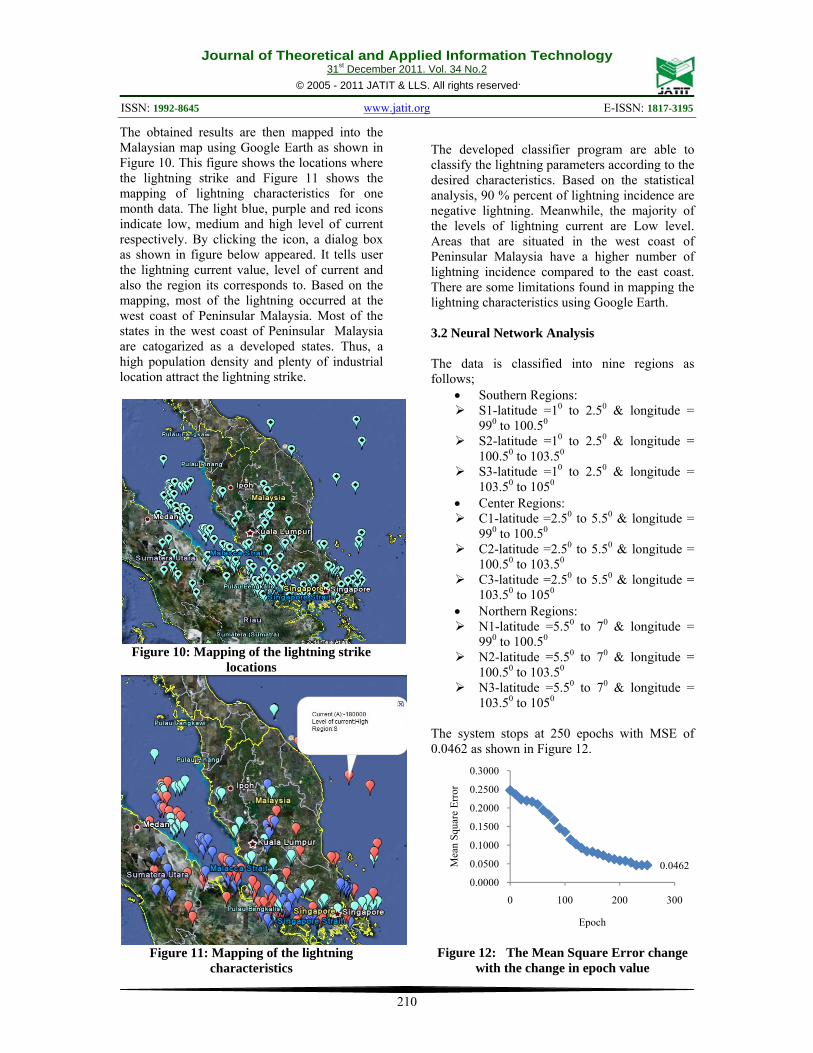
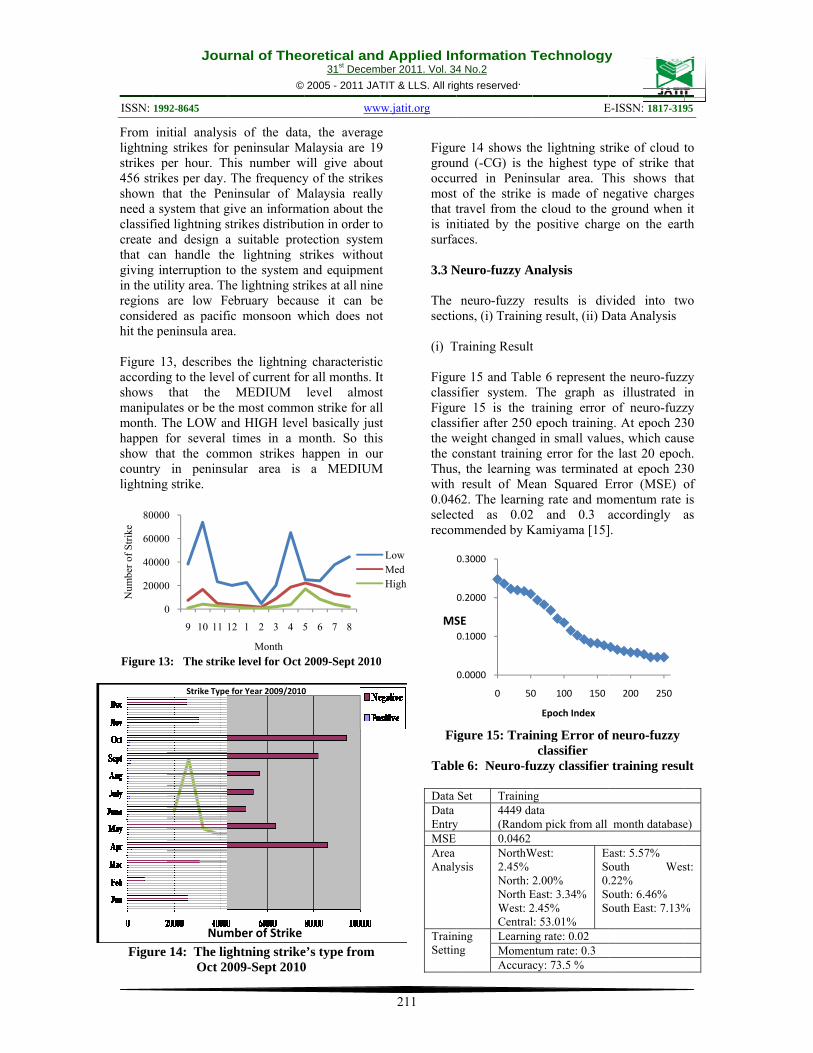
The obtained results are then mapped into the Malaysian map using Google Earth as shown in Figure 10. This figure shows the locations where the lightning strike and Figure 11 shows the mapping of lightning characteristics for one month data. The light blue, purple and red icons indicate low, medium and high level of current respectively. By clicking the icon, a dialog box as shown in figure below appeared. It tells user the lightning current value, level of current and also the region its corresponds to. Based on the mapping, most of the lightning occurred at the west coast of Peninsular Malaysia. Most of the states in the west coast of Peninsular Malaysia are catogarized as a developed states. Thus, a high population density and plenty of industrial location attract the lightning strike.
Figure 10: Mapping of the lightning strike
locations
Figure 11: Mapping of the lightning
characteristics
The developed classifier program are able to classify the lightning parameters according to the desired characteristics. Based on the statistical analysis, 90 % percent of lightning incidence are negative lightning. Meanwhile, the majority of the levels of lightning current are Low level. Areas that are situated in the west coast of Peninsular Malaysia have a higher number of lightning incidence compared to the east coast. There are some limitations found in mapping the lightning characteristics using Google Earth. 3.2 Neural Network Analysis The data is classified into nine regions as follows;
• Southern Regions: S1-latitude =10 to 2.50 & longitude =
990 to 100.50 S2-latitude =10 to 2.50 & longitude =
100.50 to 103.50 S3-latitude =10 to 2.50 & longitude =
103.50 to 1050 • Center Regions:
C1-latitude =2.50 to 5.50 & longitude = 990 to 100.50
C2-latitude =2.50 to 5.50 & longitude = 100.50 to 103.50
C3-latitude =2.50 to 5.50 & longitude = 103.50 to 1050
• Northern Regions: N1-latitude =5.50 to 70 & longitude =
990 to 100.50 N2-latitude =5.50 to 70 & longitude =
100.50 to 103.50 N3-latitude =5.50 to 70 & longitude =
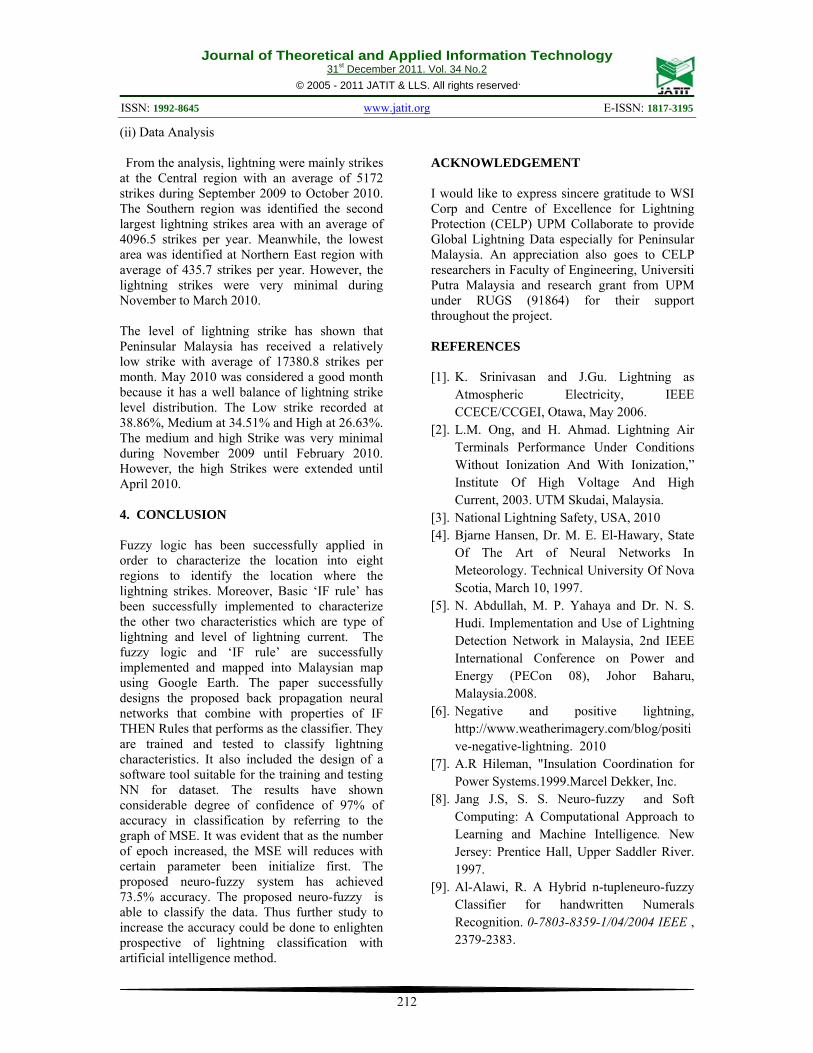
103.50 to 1050 The system stops at 250 epochs with MSE of 0.0462 as shown in Figure 12.
Figure 12: The Mean Square Error change
with the change in epoch value
0.04620.0000
0.0500
0.1000
0.1500
0.2000
0.2500
0.3000
0 100 200 300
Mea
n Sq
uare
Err
or
Epoch
ISSN:
From lightnistrikes456 stshownneed aclassifcreate that cgivingin the regionconsidhit the Figureaccordshowsmanipmonthhappenshow countrlightni
Figure
Figu
20
40
60
80
Num
ber o
f Stri
ke
Jou
1992-8645
initial analysing strikes fors per hour. Thtrikes per day. n that the Pena system that gfied lightning s
and design acan handle thg interruption tutility area. Th
ns are low Fdered as pacifie peninsula area
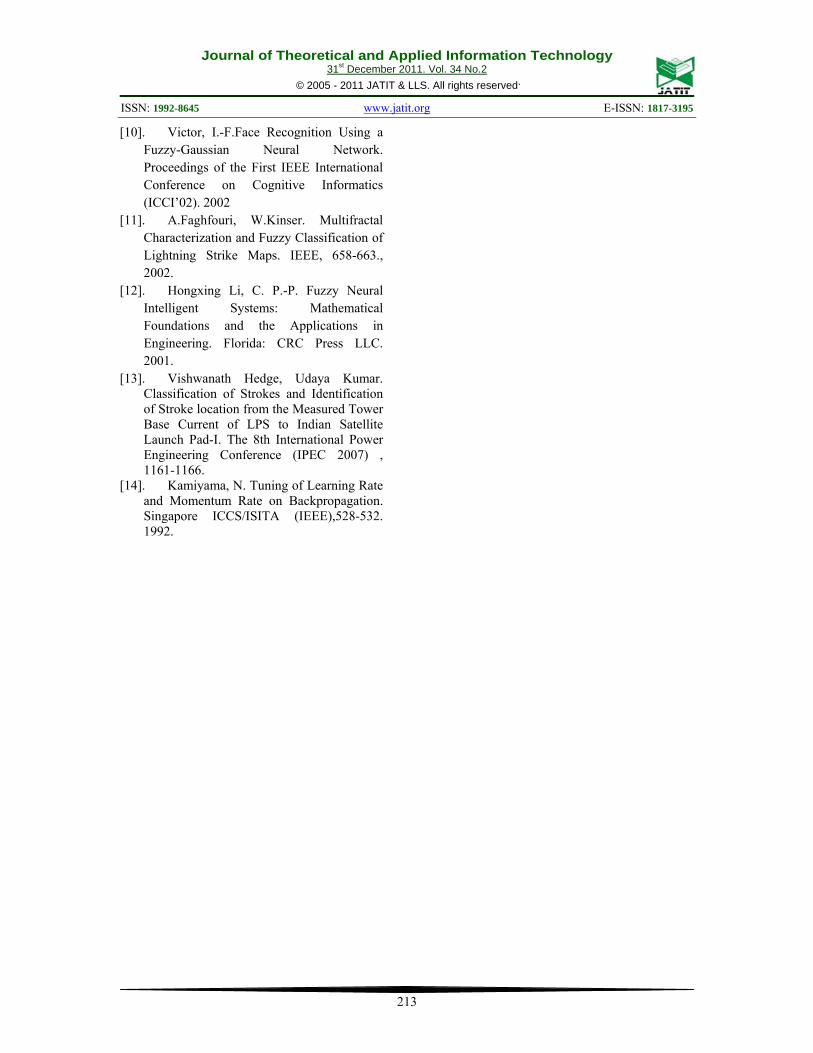
e 13, describesding to the leves that the pulates or be thh. The LOW ann for several that the com
ry in peninsuing strike.
e 13: The strik
ure 14: The ligOct 20
0
0000
0000
0000
0000
9 10 11 1
Num
Strike Type
rnal of Theo
©
is of the datar peninsular Mhis number wThe frequency
ninsular of Mgive an informastrikes distributa suitable prothe lightning sto the system ahe lightning strebruary becau
fic monsoon wa.
s the lightningel of current fo
MEDIUM he most commond HIGH levetimes in a m
mmon strikes hular area is
ke level for Oct
ghtning strike009-Sept 2010
12 1 2 3 4 5
Month
mber of Strike
e for Year 2009/2010
oretical and31st Decem
2005 - 2011 JAT
ww
a, the averageMalaysia are 19will give abouty of the strikes
Malaysia reallyation about thetion in order totection systemtrikes withoutand equipmentrikes at all nineuse it can be
which does not
g characteristicor all months. It
level almoston strike for alll basically just
month. So thishappen in our
a MEDIUM
2009-Sept 2010
e’s type from 0
5 6 7 8
0
d Applied Inber 2011. Vol. 34TIT & LLS. All rig
ww.jatit.org
211
e 9 t s y e o
m t t e e t
c t t l t s r
M
0
Figurgrounoccurmostthat tis insurfa 3.3 N The sectio (i) T FigurclassFigurclassthe wthe cThuswith 0.046selecrecom
Fi
Tabl Data Data EntryMSEArea Analy
TrainSettin
LowMedHigh
MS
nformation T4 No.2 ghts reserved.
re 14 shows thnd (-CG) is thrred in Penint of the strike travel from theitiated by the
aces.
Neuro-fuzzy A
neuro-fuzzyons, (i) Trainin
Training Result
re 15 and Tablsifier system. re 15 is the t
sifier after 250 weight changedconstant trainins, the learning
result of Me62. The learnincted as 0.02mmended by K
igure 15: Trai
le 6: Neuro-fu
Set Trainin
y 4449 da(Rando0.0462
ysis NorthW2.45%North: North EWest: 2Central
ning ng
LearninMomenAccura
0.0000
0.1000
0.2000
0.3000
0 50
SE
Technology
E
he lightning sthe highest typnsular area. T
is made of ne cloud to the positive charg
Analysis
results is divng result, (ii) D
t
le 6 represent The graph a
training error epoch training
d in small valung error for the
was terminateean Squared Eng rate and mo
2 and 0.3 aKamiyama [15]
ining Error ofclassifier
uzzy classifier
ng ata
om pick from all
West:
2.00% East: 3.34% 2.45% l: 53.01%
ES0SS
ng rate: 0.02 ntum rate: 0.3 acy: 73.5 %
0 100 150
Epoch Index
y
E-ISSN: 1817-319
trike of cloud tpe of strike thThis shows thnegative charge
ground when ge on the eart
vided into twData Analysis
the neuro-fuzzas illustrated i
of neuro-fuzzg. At epoch 23
ues, which cause last 20 epoced at epoch 23Error (MSE) oomentum rate accordingly a].
f neuro-fuzzy
r training resu
month database
East: 5.57% outh Wes.22% outh: 6.46% outh East: 7.13%
200 250
95
to hat hat es it th
wo
zy in zy 30 se h.
30 of is as
ult
e)
st:
%
Journal of Theoretical and Applied Information Technology 31st December 2011. Vol. 34 No.2
© 2005 - 2011 JATIT & LLS. All rights reserved.
ISSN: 1992-8645 www.jatit.org E-ISSN: 1817-3195
212
(ii) Data Analysis
From the analysis, lightning were mainly strikes at the Central region with an average of 5172 strikes during September 2009 to October 2010. The Southern region was identified the second largest lightning strikes area with an average of 4096.5 strikes per year. Meanwhile, the lowest area was identified at Northern East region with average of 435.7 strikes per year. However, the lightning strikes were very minimal during November to March 2010.
The level of lightning strike has shown that Peninsular Malaysia has received a relatively low strike with average of 17380.8 strikes per month. May 2010 was considered a good month because it has a well balance of lightning strike level distribution. The Low strike recorded at 38.86%, Medium at 34.51% and High at 26.63%. The medium and high Strike was very minimal during November 2009 until February 2010. However, the high Strikes were extended until April 2010. 4. CONCLUSION Fuzzy logic has been successfully applied in order to characterize the location into eight regions to identify the location where the lightning strikes. Moreover, Basic ‘IF rule’ has been successfully implemented to characterize the other two characteristics which are type of lightning and level of lightning current. The fuzzy logic and ‘IF rule’ are successfully implemented and mapped into Malaysian map using Google Earth. The paper successfully designs the proposed back propagation neural networks that combine with properties of IF THEN Rules that performs as the classifier. They are trained and tested to classify lightning characteristics. It also included the design of a software tool suitable for the training and testing NN for dataset. The results have shown considerable degree of confidence of 97% of accuracy in classification by referring to the graph of MSE. It was evident that as the number of epoch increased, the MSE will reduces with certain parameter been initialize first. The proposed neuro-fuzzy system has achieved 73.5% accuracy. The proposed neuro-fuzzy is able to classify the data. Thus further study to increase the accuracy could be done to enlighten prospective of lightning classification with artificial intelligence method.
ACKNOWLEDGEMENT
I would like to express sincere gratitude to WSI Corp and Centre of Excellence for Lightning Protection (CELP) UPM Collaborate to provide Global Lightning Data especially for Peninsular Malaysia. An appreciation also goes to CELP researchers in Faculty of Engineering, Universiti Putra Malaysia and research grant from UPM under RUGS (91864) for their support throughout the project.
REFERENCES [1]. K. Srinivasan and J.Gu. Lightning as
Atmospheric Electricity, IEEE CCECE/CCGEI, Otawa, May 2006.
[2]. L.M. Ong, and H. Ahmad. Lightning Air Terminals Performance Under Conditions Without Ionization And With Ionization,” Institute Of High Voltage And High Current, 2003. UTM Skudai, Malaysia.
[3]. National Lightning Safety, USA, 2010 [4]. Bjarne Hansen, Dr. M. E. El-Hawary, State
Of The Art of Neural Networks In Meteorology. Technical University Of Nova Scotia, March 10, 1997.
[5]. N. Abdullah, M. P. Yahaya and Dr. N. S. Hudi. Implementation and Use of Lightning Detection Network in Malaysia, 2nd IEEE International Conference on Power and Energy (PECon 08), Johor Baharu, Malaysia.2008.
[6]. Negative and positive lightning, http://www.weatherimagery.com/blog/positive-negative-lightning. 2010
[7]. A.R Hileman, "Insulation Coordination for Power Systems.1999.Marcel Dekker, Inc.
[8]. Jang J.S, S. S. Neuro-fuzzy and Soft Computing: A Computational Approach to Learning and Machine Intelligence. New Jersey: Prentice Hall, Upper Saddler River. 1997.
[9]. Al-Alawi, R. A Hybrid n-tupleneuro-fuzzy Classifier for handwritten Numerals Recognition. 0-7803-8359-1/04/2004 IEEE , 2379-2383.
Journal of Theoretical and Applied Information Technology 31st December 2011. Vol. 34 No.2
© 2005 - 2011 JATIT & LLS. All rights reserved.
ISSN: 1992-8645 www.jatit.org E-ISSN: 1817-3195
213
[10]. Victor, I.-F.Face Recognition Using a Fuzzy-Gaussian Neural Network. Proceedings of the First IEEE International Conference on Cognitive Informatics (ICCI’02). 2002
[11]. A.Faghfouri, W.Kinser. Multifractal Characterization and Fuzzy Classification of Lightning Strike Maps. IEEE, 658-663., 2002.
[12]. Hongxing Li, C. P.-P. Fuzzy Neural Intelligent Systems: Mathematical Foundations and the Applications in Engineering. Florida: CRC Press LLC. 2001.
[13]. Vishwanath Hedge, Udaya Kumar. Classification of Strokes and Identification of Stroke location from the Measured Tower Base Current of LPS to Indian Satellite Launch Pad-I. The 8th International Power Engineering Conference (IPEC 2007) , 1161-1166.
[14]. Kamiyama, N. Tuning of Learning Rate and Momentum Rate on Backpropagation. Singapore ICCS/ISITA (IEEE),528-532. 1992.
Journal of Theoretical and Applied Information Technology 31st December 2011. Vol. 34 No.2
© 2005 - 2011 JATIT & LLS. All rights reserved.
ISSN: 1992-8645 www.jatit.org E-ISSN: 1817-3195
214
AUTHOR PROFILES:
M.K Hassan was born in Melaka, Malaysia. He received the B.Eng (Hons) degree in Electrical and Electronic from University of Portsmouth, UK in 1998, M.Eng Electrical Engineering from Universiti
Teknologi Malaysia in 2001 and Ph.D degree from Universiti Putra Malaysia in 2011. Currently he is a senior lecturer at the Department of Electrical and Electronic Engineering, Universiti Putra Malaysia. His area of interest includes; control system, automotive control, electric vehicle, AI applications and renewal energy.
A. Che Soh, received her B.Eng. degree in Electronic/Computer and M.Sc. degree in Electrical and Electronics Engineering from the Universiti Putra Malaysia (UPM), Malaysia
in 1998 and 2002, respectively. In year 2011, she received a PhD Degree at Universiti Teknologi Malaysia (UTM), Malaysia. Currently, she is a Senior Lecturer at the Universiti Putra Malaysia (UPM), Malaysia. Her research interests include artificial intelligence, process control, control systems, robotics, and automation.
R.Z. Abdul Rahman received her B.E. degree in Electrical and Electronics Engineering from the Liverpool John Moores University, United Kingdom in 1998, and her M.E. degree
in Electrical Engineering from Universiti Teknologi Malaysia, Malaysia in 2001. Presently, she is a lecturer at Universiti Putra Malaysia, Malaysia. She is currently pursuing her PhD degree in fault detection and diagnosis at Universiti Teknologi, Malaysia. Her research interests include artificial intelligence, process control, control systems, fault detection, and diagnosis.
M. Z. A. Ab Kadir graduated with B.Eng degree in Electrical and Electronic from University Putra Malaysia in 2000 and obtained his PhD from the University of Manchester, United Kingdom in 2006 in
High Voltage Engineering. Currently, he is an Associate Professor in the Department of Electrical and Electronics Engineering, Faculty of Engineering, Universiti Putra Malaysia. To date he has authored and co-authored over 80 technical papers comprising of national and international conferences proceedings and citation indexed journals. His research interests include high voltage engineering, insulation coordination, lightning protection, EMC/EMI, keraunamedicine and power system transients.