
Life history variation along a salinity gradient in
14
AQUATIC BIOLOGY Aquat Biol Vol. 8: 15–28, 2009 doi: 10.3354/ab00203 Published online December 29 INTRODUCTION Coastal habitats are continually changing because they lie at the interface between land and sea. This dynamic interaction makes coastal systems highly vul- nerable to natural disturbances and climate change. Coastal environments are affected by storms, waves, and rainwater runoff, and changes in water tempera- ture, currents, winds, and solar radiance, as well as sea level (Bindoff et al. 2007, Nicholls et al. 2007). Salinity levels may also change, since tropical storms, prevail- ing winds, and rising sea levels can drive saltwater inland into lower-salinity coastal areas (Titus & Rich- man 2001, Nicholls et al. 2007). This saltwater intrusion is expected to become more prevalent as climates warm and sea levels rise, especially in areas such as the northern Gulf of Mexico that have a shallow coastal slope (Titus & Richman 2001). Louisiana is ex- periencing some of the highest rates of relative sea level rise (i.e. eustatic sea level coupled with subsi- dence) globally (1.0 to 1.2 cm yr –2 ) (Penland & Ramsey 1990, Bindoff et al. 2007). Tidally influenced coastal © Inter-Research 2009 · www.int-res.com *Email: [email protected] Life history variation along a salinity gradient in coastal marshes Shannon B. Martin 1, 2, *, Alan T. Hitch 1, 3 , Kevin M. Purcell 1, 4 , Paul L. Klerks 1 , Paul L. Leberg 1 1 Department of Biology, University of Louisiana at Lafayette, Lafayette, Louisiana 70504, USA 2 Present address: Florida Fish and Wildlife Conservation Commission, Fish and Wildlife Research Institute, Apalachicola Field Laboratory, Eastpoint, Florida 32328, USA 3 Present address: School of Forestry and Wildlife Sciences, Auburn University, Auburn, Alabama 36849, USA 4 Present address: Department of Biological Sciences, North Dakota State University, Fargo, North Dakota 58105, USA ABSTRACT: Coastal habitats are susceptible to changes in the environment associated with alter- ations in salinity. A field study was conducted on natural populations of the sailfin molly Poecilia latipinna, the western mosquitofish Gambusia affinis and the least killifish Heterandria formosa col- lected from coastal marsh sites along a salinity gradient, to investigate the influence of salinity on body condition and reproductive life history traits. In brackish marsh sites male P. latipinna had the best body conditions, while females had similar body conditions across all 3 marsh types. Female P. latipinna had greater reproductive allotment and fecundity in brackish marshes, where this fish was most abundant. Specimens of G. affinis collected from fresh marsh sites had less favorable body condition, and females had lower reproductive allotment and fecundity than those collected from higher salinities. While G. affinis was more abundant in freshwater marshes than in higher salinity marshes, this higher abundance did not correspond with a better body condition or higher reproduc- tive effort, suggesting that G. affinis may be stressed in freshwater. There was no difference in the conditions between (both male and female) H. formosa from fresh and intermediate marshes. Female H. formosa from fresh marshes had a similar reproductive allotment and lower fecundity than those from intermediate marshes. The 3 species exhibited different life history patterns along the salinity gradient, and some of these patterns conflicted with expectations based on species abundances. When assessing habitat quality along an environmental gradient, measures of abundance should be accompanied by more sensitive indicators of environmental stress. KEY WORDS: Sea level rise · Saltwater intrusion · Environmental stress · Environmental stability hypothesis · Density dependence · Gambusia affinis · Heterandria formosa · Poecilia latipinna Resale or republication not permitted without written consent of the publisher OPEN PEN ACCESS CCESS
Transcript of Life history variation along a salinity gradient in
AQUATIC BIOLOGYAquat Biol
Vol. 8: 15–28, 2009doi: 10.3354/ab00203
Published online December 29
INTRODUCTION
Coastal habitats are continually changing becausethey lie at the interface between land and sea. Thisdynamic interaction makes coastal systems highly vul-nerable to natural disturbances and climate change.Coastal environments are affected by storms, waves,and rainwater runoff, and changes in water tempera-ture, currents, winds, and solar radiance, as well as sealevel (Bindoff et al. 2007, Nicholls et al. 2007). Salinitylevels may also change, since tropical storms, prevail-
ing winds, and rising sea levels can drive saltwaterinland into lower-salinity coastal areas (Titus & Rich-man 2001, Nicholls et al. 2007). This saltwater intrusionis expected to become more prevalent as climateswarm and sea levels rise, especially in areas such asthe northern Gulf of Mexico that have a shallowcoastal slope (Titus & Richman 2001). Louisiana is ex-periencing some of the highest rates of relative sealevel rise (i.e. eustatic sea level coupled with subsi-dence) globally (1.0 to 1.2 cm yr–2) (Penland & Ramsey1990, Bindoff et al. 2007). Tidally influenced coastal
© Inter-Research 2009 · www.int-res.com*Email: [email protected]
Life history variation along a salinity gradient incoastal marshes
Shannon B. Martin1, 2,*, Alan T. Hitch1, 3, Kevin M. Purcell1, 4, Paul L. Klerks1, Paul L. Leberg1
1Department of Biology, University of Louisiana at Lafayette, Lafayette, Louisiana 70504, USA2Present address: Florida Fish and Wildlife Conservation Commission, Fish and Wildlife Research Institute,
Apalachicola Field Laboratory, Eastpoint, Florida 32328, USA3Present address: School of Forestry and Wildlife Sciences, Auburn University, Auburn, Alabama 36849, USA
4Present address: Department of Biological Sciences, North Dakota State University, Fargo, North Dakota 58105, USA
ABSTRACT: Coastal habitats are susceptible to changes in the environment associated with alter-ations in salinity. A field study was conducted on natural populations of the sailfin molly Poecilialatipinna, the western mosquitofish Gambusia affinis and the least killifish Heterandria formosa col-lected from coastal marsh sites along a salinity gradient, to investigate the influence of salinity onbody condition and reproductive life history traits. In brackish marsh sites male P. latipinna had thebest body conditions, while females had similar body conditions across all 3 marsh types. FemaleP. latipinna had greater reproductive allotment and fecundity in brackish marshes, where this fishwas most abundant. Specimens of G. affinis collected from fresh marsh sites had less favorable bodycondition, and females had lower reproductive allotment and fecundity than those collected fromhigher salinities. While G. affinis was more abundant in freshwater marshes than in higher salinitymarshes, this higher abundance did not correspond with a better body condition or higher reproduc-tive effort, suggesting that G. affinis may be stressed in freshwater. There was no difference in theconditions between (both male and female) H. formosa from fresh and intermediate marshes. FemaleH. formosa from fresh marshes had a similar reproductive allotment and lower fecundity than thosefrom intermediate marshes. The 3 species exhibited different life history patterns along the salinitygradient, and some of these patterns conflicted with expectations based on species abundances.When assessing habitat quality along an environmental gradient, measures of abundance should beaccompanied by more sensitive indicators of environmental stress.
KEY WORDS: Sea level rise · Saltwater intrusion · Environmental stress · Environmental stabilityhypothesis · Density dependence · Gambusia affinis · Heterandria formosa · Poecilia latipinna
Resale or republication not permitted without written consent of the publisher
OPENPEN ACCESSCCESS
Aquat Biol 8: 15–28, 2009
marshes are delineated along an environmental gradi-ent, with salinity levels decreasing farther inland(Odum 1988, Mitsch & Gosselink 2000) and are sus-ceptible to saltwater intrusion.
Changes in salinity can stress aquatic organismsresiding in coastal marshes. It may be possible todetect salinity stress before it reaches lethal levels byexamining variation in key life history traits of residentorganisms along a salinity gradient. Salinity changesmay result in stress due to the demands of maintainingosmotic balance (Nordlie 2006). The energetic costs ofdealing with stress and concurrently maintaininghomeostasis may constitute a substantial portion of theorganism’s energy budget and leave less energy avail-able for other functions (i.e. locomotion, growth, andreproduction) (Sibly & Calow 1989). As much as 25%of the energy remaining after basic maintenancerequirements are met may be required to cope with amild or brief disturbance (Wedemeyer et al. 1990). Lifehistory theory predicts that energy should then bereallocated to physiological maintenance of an organ-ism at the expense of growth and reproduction (Sibly &Calow 1989, Stearns 1992). This response to stresscould be detected by observing tactical changes in keylife history traits such as age and size at maturity,reproductive allotment, and number and size of off-spring (Roff 1992, Stearns 1992). Even populationdeclines as observed in fishes (Adams et al. 2003) andamphibians (Blaustein & Kiesecker 2002) may be dueto exposure to sublethal stress affecting the survivaland reproduction of a population’s members. Thestress may reduce an individual’s health and perfor-mance, which directly influences its fitness by way ofreduction in reproduction and/or survival through in-creased susceptibility to disease or predation (Wede-meyer et al. 1990). Tradeoffs between responses tosalinity stress and biotic factors such as competition orpredation can influence the occurrence of species andthus community structure (Dunson & Travis 1991).
Some of the most common resident fishes inhabitingthe vegetated margins of fresh and brackish marshesof the northern Gulf of Mexico are the sailfin mollyPoecilia latipinna, the western mosquitofish Gambusiaaffinis, and the least killifish Heterandria formosa(Martin 1980, Gelwick et al. 2001, Lorenz & Serafy2006). These 3 species of livebearing fishes belong tothe family Poeciliidae (Rosen & Bailey 1963). After alengthy step-wise acclimation process, all 3 speciescan tolerate a relatively broad range of salinity levels,at least for a short period of time (Meffe & Snelson1989). H. formosa is the least tolerant of elevated salin-ity levels, with a tolerance range of 0 to 20 ppt (S. Mar-tin pers. obs.), followed by G. affinis, with a range of 0to 58.5 ppt (Chervinski 1983), and P. latipinna is themost tolerant (0 to 80 ppt) (Nordlie et al. 1992). Even
though these 3 species occur along a salinity gradientof coastal marshes in Louisiana, their relative abun-dances differ with salinity: H. formosa and G. affinisoccur at higher densities at fresh marshes, while P.latipinna occurs at higher densities in intermediateand brackish marshes (A. T. Hitch et al. unpubl. data).These salinity preferences may not, however, be static,as Purcell et al. (2008) reported that G. affinis frombrackish marshes were locally adapted to elevatedsalinity. Poeciliids may serve as a good indicator spe-cies of environmental change given their opportunisticlife history strategy (Winemiller & Rose 1992) throughtheir plastic and quantifiable life history traits.
Some teleosts can only successfully reproduce withina more narrow range of salinities in which they occur(Griffith 1974). Because accelerated sea level rise andconsequent saltwater intrusion might negatively affectcoastal marsh fish populations, our objective was toexamine the variation in body condition and reproduc-tive life history traits in natural populations of poecili-ids that reside along a salinity gradient of coastalmarshes. If the local salinity creates chronic sublethalstress, then the energy allocated to additional osmo-regulation and the response to stress could reducethe resources allocated to reproduction. The divertedenergy allocated towards maintenance could affect lifehistory traits such as adult size, body condition, repro-ductive allotment, fecundity, as well as the timing andlevel of offspring provisioning (i.e. lecithotrophy ormatrotrophy). The 3 species in the present study differin various characteristics: (1) salinity tolerance: Heter-andria formosa < Gambusia affinis < Poecilia latipinna,(2) maternal provisioning: G. affinis < P. latipinna <H. formosa (Reznick & Miles 1989), and (3) body size:H. formosa < G. affinis < P. latipinna. On the basis ofthese differences, and assuming that salinity stress isthe major factor affecting differences in interspecificenergy allocation along a salinity gradient, we pre-dicted that H. formosa and G. affinis should be inbetter body condition, show higher reproductive allot-ment and produce more and larger offspring in fresh-water marshes, while P. latipinna should performbetter in habitats with higher salinity levels such asbrackish marshes. In addition to our results, we willdiscuss how factors varying along the gradient in asso-ciation with salinity might confound these predictions.
MATERIALS AND METHODS
Field collections. Individuals of Gambusia affinis,Heterandria formosa, and Poecilia latipinna were col-lected from May to August 2005 from populations alonga coastal salinity gradient from fresh (0 to 1 ppt), inter-mediate (1 to 8 ppt), to brackish (8 to 15 ppt) marshes
16
Martin et al.: Life history variation in coastal marshes
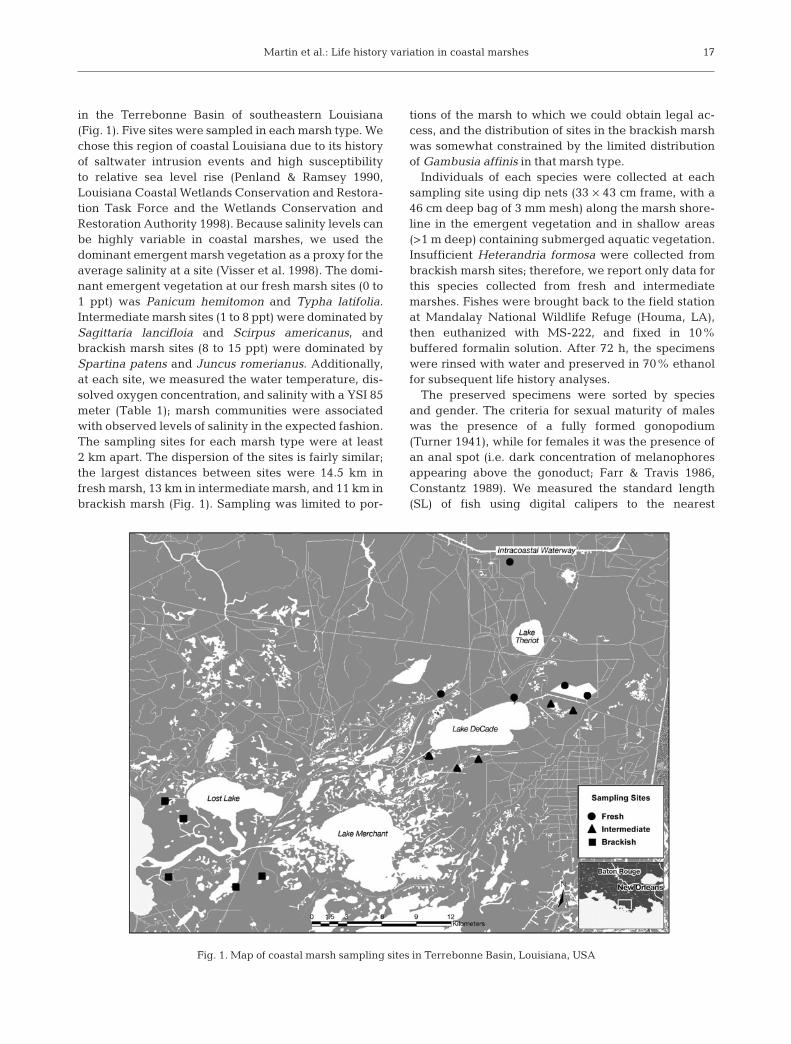
in the Terrebonne Basin of southeastern Louisiana(Fig. 1). Five sites were sampled in each marsh type. Wechose this region of coastal Louisiana due to its historyof saltwater intrusion events and high susceptibilityto relative sea level rise (Penland & Ramsey 1990,Louisiana Coastal Wetlands Conservation and Restora-tion Task Force and the Wetlands Conservation andRestoration Authority 1998). Because salinity levels canbe highly variable in coastal marshes, we used thedominant emergent marsh vegetation as a proxy for theaverage salinity at a site (Visser et al. 1998). The domi-nant emergent vegetation at our fresh marsh sites (0 to1 ppt) was Panicum hemitomon and Typha latifolia.Intermediate marsh sites (1 to 8 ppt) were dominated bySagittaria lancifloia and Scirpus americanus, andbrackish marsh sites (8 to 15 ppt) were dominated bySpartina patens and Juncus romerianus. Additionally,at each site, we measured the water temperature, dis-solved oxygen concentration, and salinity with a YSI 85meter (Table 1); marsh communities were associatedwith observed levels of salinity in the expected fashion.The sampling sites for each marsh type were at least2 km apart. The dispersion of the sites is fairly similar;the largest distances between sites were 14.5 km infresh marsh, 13 km in intermediate marsh, and 11 km inbrackish marsh (Fig. 1). Sampling was limited to por-
tions of the marsh to which we could obtain legal ac-cess, and the distribution of sites in the brackish marshwas somewhat constrained by the limited distributionof Gambusia affinis in that marsh type.
Individuals of each species were collected at eachsampling site using dip nets (33 × 43 cm frame, with a46 cm deep bag of 3 mm mesh) along the marsh shore-line in the emergent vegetation and in shallow areas(>1 m deep) containing submerged aquatic vegetation.Insufficient Heterandria formosa were collected frombrackish marsh sites; therefore, we report only data forthis species collected from fresh and intermediatemarshes. Fishes were brought back to the field stationat Mandalay National Wildlife Refuge (Houma, LA),then euthanized with MS-222, and fixed in 10%buffered formalin solution. After 72 h, the specimenswere rinsed with water and preserved in 70% ethanolfor subsequent life history analyses.
The preserved specimens were sorted by speciesand gender. The criteria for sexual maturity of maleswas the presence of a fully formed gonopodium(Turner 1941), while for females it was the presence ofan anal spot (i.e. dark concentration of melanophoresappearing above the gonoduct; Farr & Travis 1986,Constantz 1989). We measured the standard length(SL) of fish using digital calipers to the nearest
17
Fig. 1. Map of coastal marsh sampling sites in Terrebonne Basin, Louisiana, USA
Aquat Biol 8: 15–28, 2009
0.01 mm. A subset of randomly selected females wasdissected to remove reproductive tissues and devel-oping embryos. The developmental stage of embryoswas determined following the interpretation of Haynes(1995) of the 6-stage classification proposed by Rez-nick (1981). For each gravid female, embryos of thesame developmental stage were pooled, dried in agravity oven at 60°C for 24 h, and measured for drymass to the nearest 0.01 mg using a digital, analyticalbalance. The dry mass of pooled embryo was thendivided by the number of individual embryos withinthat group (i.e. processed together but data expressedas average mass per embryo). The relationship be-tween SL and dry body mass (i.e. slope of the regres-sion line) was used as an index of body condition(Anderson & Neumann 1996). For each species, gravidfemales from each site were assessed for their repro-ductive allotment by determining the gonadosomaticindex (GSI), which is the mass of reproductive tissuesand embryos divided by the total mass of the femalemultiplied by 100 (Roff 1992). We also used thesefemales to quantify fecundity or brood size (basedon Embryo Stages 2 to 6). In poeciliid fishes, embryosize can be influenced by the stage of development(Haynes 1995). To control for the influence of develop-mental staging on size, we used only Stage 5 embryos(most frequent stage in each species) to ascertain the
relationship between offspring size andnumber among marsh type. In addition,for Heterandria formosa we measuredthe number of simultaneously carriedbroods (i.e. the level of superfetation),the number of offspring per brood, andthe offspring mass by developmentalstage (Stages 3 to 6).
Statistical analyses. All statisticalanalyses were conducted using SASEnterprise Guide 4.1 (SAS Institute2007). Sample sizes for each treatmentcombination were unequal due to dif-ferences in abundances of mature indi-viduals at the time of collection. Nointerspecific or intersexual analyseswere conducted. Due to size differencesbetween species and to control for anysexual size dimorphism, males andfemales were analyzed separately foreach species. The hierarchical ex-perimental design consisted of 5 sam-pling sites within each of 3 marsh types(fresh, intermediate, and brackishmarshes). We sampled fish from 5 popu-lations in each marsh type to avoid rep-resenting a marsh type by a single sam-ple. Because of the need to control for
covariates such as SL or brood size, individuals werethe unit of replication. A nested analysis of covariance(ANCOVA) was used to address lack of independenceof individuals relative to the population samples withinmarsh type. We used this ANCOVA analysis to exam-ine effects of marsh type, each covariate, and inter-action between the covariate and marsh type for eachof the following traits: body condition of males andfemales, number of offspring, size, number of simulta-neous broods, and number of offspring per brood.
In fishes, fecundity generally increases with femalesize (Roff 1992). Female SL and/or the number of off-spring were used as covariates in ANCOVAs for allreproductive traits, except GSI, which is already nor-malized by female size. ANCOVA has been shown tobe more appropriate for controlling the effects of bodysize on body condition than other condition indices(Packard & Boardman 1988). We included GSI becauseof its widespread use in evaluations of the reproduc-tive biology of poeciliids. Whenever a significant corre-lation was detected between a dependent variable andfemale SL or the number of embryos per female, wereported the least-squares means (±1 SE) for theresults of the ANCOVA, controlling for the effects ofthe covariate. Data that did not meet the assumptionsof the ANCOVA were log transformed, and thesetransformations had the desired effect in all cases.
18
Marsh type Site Salinity Dissolved oxygen Water (ppt) (mg l–1) temperature (°C)
Fresh 1 0.17 (0.1–0.2) 3.47 (0.6–7.2) 26.73 (23.4–31.6)2 0.83 (0.7–1.0) 4.34 (0.4–12.1) 26.07 (15.2–32.1)3 0.37 (0.1–0.6) 3.35 (0.4–9.0) 23.83 (13.9–30.3)4 0.80 (0.6–1.0) 1.83 (0.7–4.0) 23.90 (14.9–29.9)5 0.47 (0.2–0.9) 2.36 (0.8–4.4) 23.07 (18.5–26.8)
Overall 0.53 ± 0.09 3.07 ± 0.94 24.72 ± 1.63mean
Intermediate 1 1.73 (1.2–2.1) 3.80 (1.1–5.4) 25.63 (22.7–30.6)2 2.30 (1.4–3.2) 3.11 (0.6–6.8) 27.77 (23.3–32.0)3 1.87 (1.6–2.1) 3.33 (0.4–6.1) 28.17 (23.1–33.2)4 2.87 (1.6–4.1) 3.18 (0.3–7.2) 25.77 (15.4–31.0)5 2.83 (1.5–4.3) 3.13 (0.3–8.7) 27.10 (15.1–33.8)
Overall 2.32 ± 0.24 3.31 ± 0.76 26.89 ± 1.68mean
Brackish 1 8.97 (8.1–10.7) 3.35 (0.3–5.1) 27.10 (26.5–27.7)2 8.67 (7.9–9.4) 5.25 (0.7–8.4) 27.77 (26.8–28.8)3 8.77 (8.0–9.7) 4.45 (0.7–8.5) 27.30 (25.2–29.4)4 9.73 (8.9–10.9) 6.40 (0.7–10.2) 26.50 (23.7–28.0)5 10.47 (8.8–12.8) 3.56 (0.1–6.3) 26.87 (22.0–30.5)
Overall 9.32 ± 0.35 4.60 ± 0.89 27.11 ± 0.55mean
Table 1. Means (and ranges) for water quality parameters measured at each ofthe 5 sample sites within fresh, intermediate and brackish marshes, with overall
mean ± 1 SE for each marsh type

Martin et al.: Life history variation in coastal marshes
Because superfetation was common in Heterandriaformosa, we used the REPEATED function in PROCMIXED (SAS Institute 2007). Each developmentalstage (Stages 3 to 6) was treated as a repeated mea-surement of embryo mass from the same female. Thisapproach allowed us to control for the lack of indepen-dence in embryo mass between broods of differentdevelopmental stages within an individual female.Whenever a significant difference was detected, aTukey’s post hoc multiple comparison test was con-ducted to find where the differences were betweentreatment effects. Interactions were removed from themodels if they were not statistically significant (α =0.05), and the remaining effects were assessed forthese reduced models.
RESULTS
Poecilia latipinna
Male P. latipinna exhibited a significant length–mass relationship (F1,184 = 1344.93; p < 0.001), but therewas no significant interaction between log SL andmarsh type on log dry mass (i.e. slopes were not signif-icantly different; F2,184 = 0.65; p = 0.521; Fig. 2a). The
difference in body condition was determined by com-paring least-square means after accounting for SL,given the parallel slopes of the regression lines. Malesfrom brackish marshes had higher dry mass for theirgiven SL (i.e. index of body condition) than those fromfresh marshes (F2,184 = 3.94; p = 0.027; Fig. 2a,b).Female P. latipinna exhibited a significant length–mass relationship (F1,336 = 6976.84; p < 0.001), but therewas no significant interaction between log SL andmarsh type on log dry mass (i.e. slopes were equal;F2,334 = 0.38; p = 0.687; Fig. 2c). Females exhibited asimilar index of body condition across marsh types(F2,336 = 0.40; p = 0.677; Fig. 2c,d). When the slopes ofregression lines were parallel, differences in femalebody condition were determined by the least-squaremeans of dry somatic mass (e.g. Fig. 2c,d).
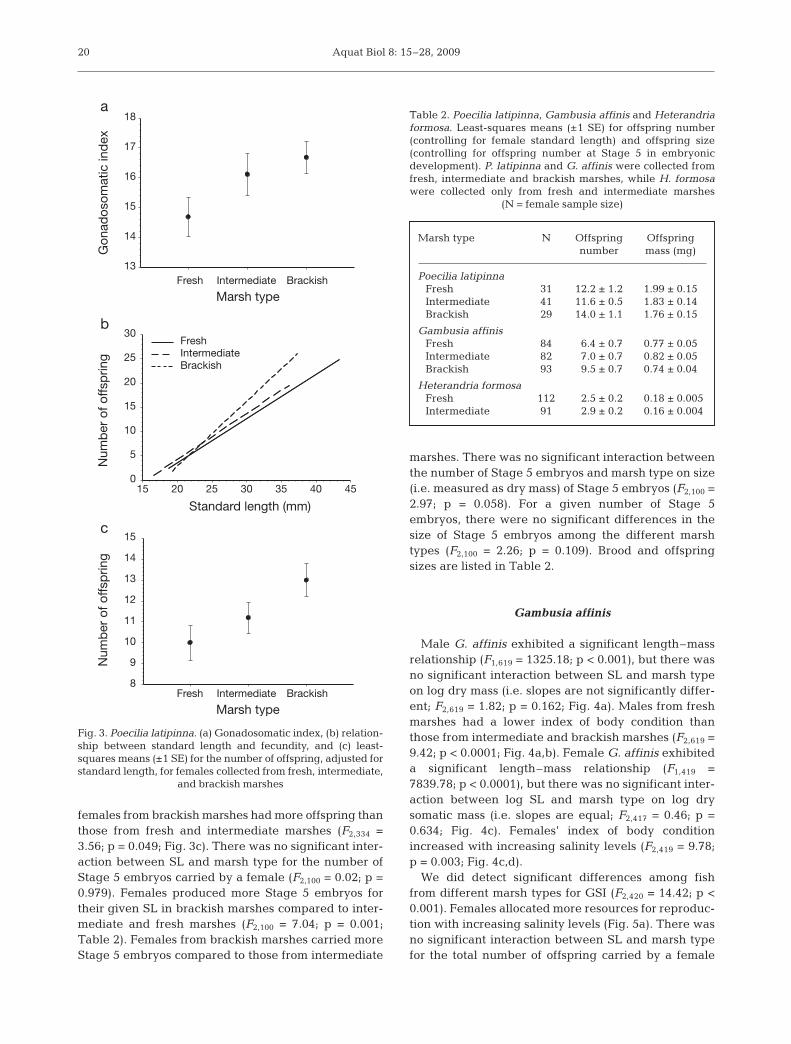
The amount of energy that females allocated toreproduction, measured as the GSI, differed betweenfish from the 3 marsh types (F2,334 = 4.02; p < 0.001).Females from brackish marshes exhibited a greaterGSI than those from fresh marshes (Fig. 3a). The totalnumber of offspring carried by a female was depen-dent on the female’s SL (Fig. 3b), but this relationshipwas independent of the marsh type from which the fishwere collected (i.e. slopes were not significantly dif-ferent; F2,334 = 0.73; p = 0.484). For their given size,
19
Marsh type
Log
dry
mas
s (m
g)
Marsh type
Log
dry
mas
s (m
g)
Log standard length (mm)
Log
dry
mas
s (m
g)
Log standard length (mm)
Log
dry
mas
s (m
g)
a
b
c
d
Fresh Intermediate Brackish1.95
1.96
1.97
1.98
1.99
Fresh Intermediate Brackish1.52
1.54
1.56
1.58
1.60
1.62
1.2 1.3 1.4 1.5 1.6 1.71.2
1.4
1.6
1.8
2.0
2.2
2.4
2.6
2.8FreshIntermediateBrackish
1.1 1.2 1.3 1.4 1.5 1.6 1.71.0
1.2
1.4
1.6
1.8
2.0
2.2
2.4
2.6FreshIntermediateBrackish
Fig. 2. Poecilia latipinna. (a) Relationship between standard length and body mass and (b) least-squares means (±1 SE) of drymass of males collected from fresh, intermediate, and brackish marshes. (c) Relationship between standard length and body mass
and (d) least-squares means (±1 SE) of dry mass of females collected from fresh, intermediate, and brackish marshes
Aquat Biol 8: 15–28, 2009
females from brackish marshes had more offspring thanthose from fresh and intermediate marshes (F2,334 =3.56; p = 0.049; Fig. 3c). There was no significant inter-action between SL and marsh type for the number ofStage 5 embryos carried by a female (F2,100 = 0.02; p =0.979). Females produced more Stage 5 embryos fortheir given SL in brackish marshes compared to inter-mediate and fresh marshes (F2,100 = 7.04; p = 0.001;Table 2). Females from brackish marshes carried moreStage 5 embryos compared to those from intermediate
marshes. There was no significant interaction betweenthe number of Stage 5 embryos and marsh type on size(i.e. measured as dry mass) of Stage 5 embryos (F2,100 =2.97; p = 0.058). For a given number of Stage 5embryos, there were no significant differences in thesize of Stage 5 embryos among the different marshtypes (F2,100 = 2.26; p = 0.109). Brood and offspringsizes are listed in Table 2.
Gambusia affinis
Male G. affinis exhibited a significant length–massrelationship (F1,619 = 1325.18; p < 0.001), but there wasno significant interaction between SL and marsh typeon log dry mass (i.e. slopes are not significantly differ-ent; F2,619 = 1.82; p = 0.162; Fig. 4a). Males from freshmarshes had a lower index of body condition thanthose from intermediate and brackish marshes (F2,619 =9.42; p < 0.0001; Fig. 4a,b). Female G. affinis exhibiteda significant length–mass relationship (F1,419 =7839.78; p < 0.0001), but there was no significant inter-action between log SL and marsh type on log drysomatic mass (i.e. slopes are equal; F2,417 = 0.46; p =0.634; Fig. 4c). Females’ index of body conditionincreased with increasing salinity levels (F2,419 = 9.78;p = 0.003; Fig. 4c,d).
We did detect significant differences among fishfrom different marsh types for GSI (F2,420 = 14.42; p <0.001). Females allocated more resources for reproduc-tion with increasing salinity levels (Fig. 5a). There wasno significant interaction between SL and marsh typefor the total number of offspring carried by a female
20
b
Standard length (mm)15 20 25 30 35 40 45
Num
ber
of o
ffsp
ring
0
5
10
15
20
25
30FreshIntermediateBrackish
Gon
ados
omat
ic in
dex
13
14
15
16
17
18N
umb
er o
f offs
prin
g
8
9
10
11
12
13
14
15
a
c
Marsh typeFresh Intermediate Brackish
Marsh typeFresh Intermediate Brackish
Fig. 3. Poecilia latipinna. (a) Gonadosomatic index, (b) relation-ship between standard length and fecundity, and (c) least-squares means (±1 SE) for the number of offspring, adjusted forstandard length, for females collected from fresh, intermediate,
and brackish marshes
Marsh type N Offspring Offspring number mass (mg)
Poecilia latipinnaFresh 31 12.2 ± 1.2 1.99 ± 0.15Intermediate 41 11.6 ± 0.5 1.83 ± 0.14Brackish 29 14.0 ± 1.1 1.76 ± 0.15
Gambusia affinisFresh 84 6.4 ± 0.7 0.77 ± 0.05Intermediate 82 7.0 ± 0.7 0.82 ± 0.05Brackish 93 9.5 ± 0.7 0.74 ± 0.04
Heterandria formosaFresh 112 2.5 ± 0.2 0.18 ± 0.005Intermediate 91 2.9 ± 0.2 0.16 ± 0.004
Table 2. Poecilia latipinna, Gambusia affinis and Heterandriaformosa. Least-squares means (±1 SE) for offspring number(controlling for female standard length) and offspring size(controlling for offspring number at Stage 5 in embryonicdevelopment). P. latipinna and G. affinis were collected fromfresh, intermediate and brackish marshes, while H. formosawere collected only from fresh and intermediate marshes
(N = female sample size)

Martin et al.: Life history variation in coastal marshes
(i.e. slopes are not significantly different; F2,420 = 2.59;p = 0.076; Fig. 5b). For their given size, females fromfresh to intermediate to brackish marshes producedincreasingly more offspring (F2,420 = 5.02; p = 0.008;Fig. 5c). Significant interaction was detected betweenSL and marsh type for the number of Stage 5 embryoscarried by a female (F2,258 = 3.74; p = 0.025). Femalesproduced more Stage 5 embryos for their given SL inbrackish marshes compared to fresh and intermediatemarshes (F2,258 = 3.07; p = 0.041) (Table 2). We detectedsignificant interaction between the number of Stage 5embryos and marsh type on the dry mass of Stage 5embryos (F2,258 = 3.17; p = 0.044). Females from brack-ish marshes produced larger Stage 5 embryos thanfemales from intermediate marshes, after controllingfor the number of Stage 5 embryos (F2,258 = 4.40;p = 0.013).
Heterandria formosa
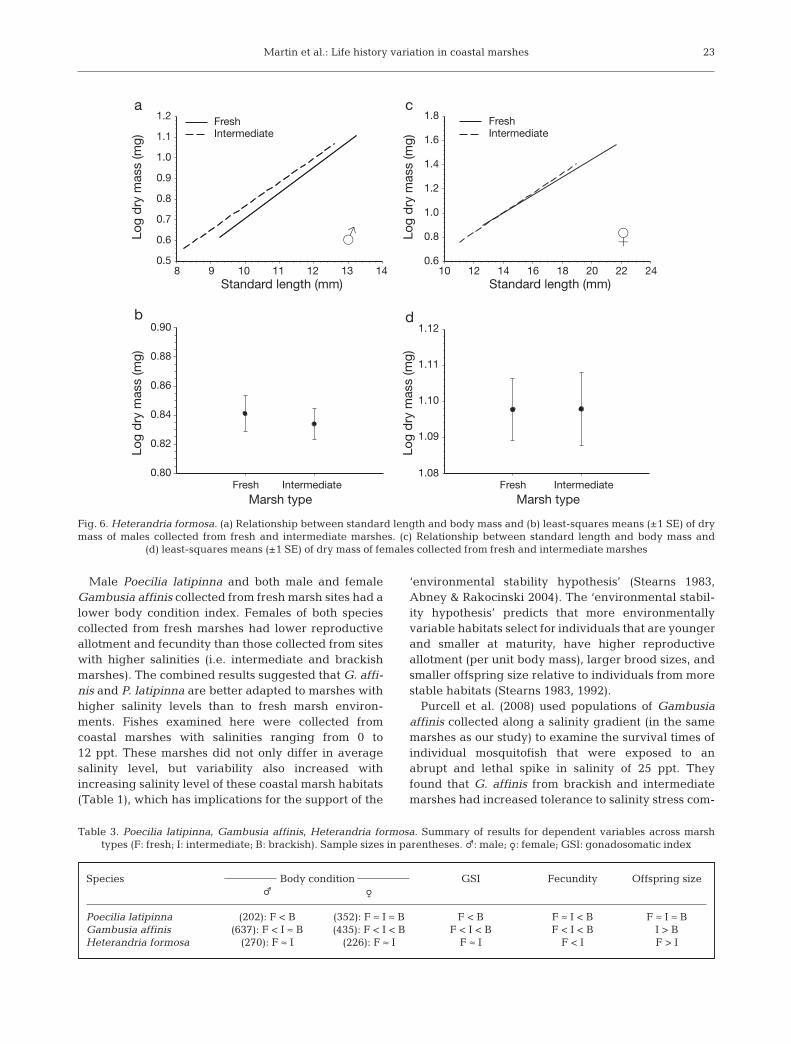
Male H. formosa exhibited a significant length–massrelationship (F1,258 = 524.00; p < 0.001), but there wasno significant interaction between SL and marsh typeon log dry mass (i.e. slopes are not significantly differ-
ent; F1,258 = 1.30; p = 0.256; Fig. 6a). Males from freshand intermediate marshes did not differ in body condi-tion index (F1,258 = 1.04; p = 0.312; Fig. 6a,b). Female H.formosa exhibited a significant length–mass relation-ship (F1,215 = 1457.17; p < 0.0001), but this relationshipwas similar among females from different marsh types(F1,215 = 2.06; p = 0. 153; Fig. 6c,d).
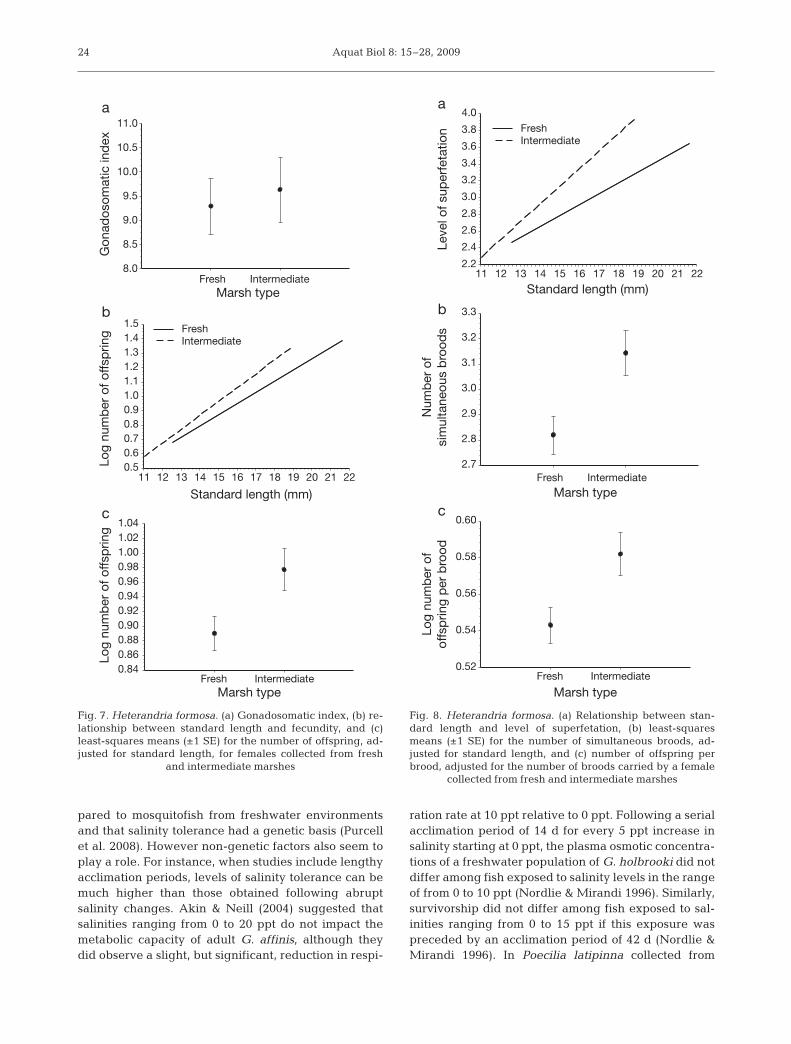
Females from fresh and intermediate marshes hadsimilar GSI (F1,216 = 0.20; p = 0.669; Fig. 7a). There wasa significant relationship between female SL andfecundity (F1,216 = 133.69; p < 0.001), but we did notdetect a significant interaction between female SL andmarsh type for the total number of offspring (i.e. slopesare not significantly different; F1,216 = 1.22; p = 0.271;Fig. 7b). For their given size, females from intermedi-ate marshes had more total offspring than those fromfresh marshes (F1,216 = 7.95; p < 0.0001; Fig. 7c). Therewas a significant relationship between female SL andthe number of Stage 5 embryos carried by a female(F1,202 = 3.74; p = 0.025), but no significant interactionbetween female SL and marsh type for the number ofStage 5 embryos carried by a female (F1,202 = 0.18; p =0.674). Females collected from intermediate marshesproduced more Stage 5 embryos for their given SLcompared to those from fresh marshes (F1,202 = 6.51;
21
1.34
1.36
1.38
1.40
1.42
1.44
1.1 1.2 1.3 1.4 1.5 1.60.8
1.0
1.2
1.4
1.6
1.8
2.0
2.2
1.05
1.06
1.07
1.08
1.09
1.10
1.11
1.12
1.13
10 11 12 13 14 15 16 17 18 19 200.70.80.91.01.11.21.31.41.51.61.7
Marsh type
Log
dry
mas
s (m
g)
Marsh type
Log
dry
mas
s (m
g)
Log standard length (mm)
Log
dry
mas
s (m
g)
Standard length (mm)
Log
dry
mas
s (m
g)
a
b
c
d
Fresh Intermediate BrackishFresh Intermediate Brackish
FreshIntermediateBrackish
FreshIntermediateBrackish
Fig. 4. Gambusia affinis. (a) Relationship between standard length and body mass and (b) least-squares means (±1 SE) of drymass of males collected from fresh, intermediate, and brackish marshes. (c) Relationship between standard length and body mass
and (d) least-squares means (±1 SE) of dry mass of females collected from fresh, intermediate, and brackish marshes

Aquat Biol 8: 15–28, 2009
p = 0.012) (Table 2). Females from intermediatemarshes had a greater number of Stage 5 embryoscompared to those from fresh marshes (F1,202 = 17.05;p < 0.0001), while females from fresh marshes pro-duced Stage 5 embryos with greater dry mass for thegiven number of Stage 5 embryos carried than thosefrom intermediate marshes (F1,202 = 13.74; p = 0.001).
We detected a significant interaction between marshtype and female SL on levels of superfetation or num-bers of simultaneous broods carried (F1,214 = 6.33; p =
0.013). Females from intermediate marshes exhibitedhigher levels of superfetation than did those from freshmarshes for their given SL (Fig. 8a). For their givenSL, female Heterandria formosa collected from freshmarshes carried fewer numbers of simultaneousbroods than those from intermediate marshes (F1,214 =4.24; p = 0.041; Fig. 8b). There was no significant inter-action between female SL and marsh type for the num-ber of offspring per brood (F1,214 = 1.23; p = 0.268).Females from intermediate marshes had a greaternumber of offspring per brood than those from freshmarshes for their given SL (F1,214 = 10.67; p = 0.001;Fig. 8c). We also detected a significant interactionbetween marsh type and developmental stage for thedry mass of embryos in Stages 3 to 6 (F3,214 = 9.51; p <0.001). Although there was no significant interactionbetween developmental stage and marsh type for off-spring dry mass (F3,214 = 1.29; p = 0.278), we did detectsignificant differences in offspring sizes among fishfrom the 2 marsh types (F1,214 = 11.41; p = 0.001).Females from fresh marshes produced larger embryosat later developmental stages compared to femalesfrom intermediate marshes (Fig. 9).
DISCUSSION
Our primary goal was to document the variation inbody condition and reproductive life history traits innatural populations of Poecilia latipinna, Gambusiaaffinis, and Heterandria formosa collected along asalinity gradient in coastal marshes susceptible to salt-water intrusion. We found significant variation in alltraits examined, except for the body condition ofH. formosa males and females and female P. latipinna(Table 3). Our results are congruent with those ofStearns & Sage (1980) and Brown-Peterson & Peterson(1990) for G. affinis and Trexler & Travis (1990) forP. latipinna. Both the current study and the earlierreports found that females from higher salinity habitatsexhibited greater reproductive allotment and fecun-dity than females collected in nearby lower-salinitysites. This pattern might be expected in sailfin mollies,which are generally most abundant in brackishmarshes and have relatively high salinity tolerance.However, it is unclear why this pattern would occur inG. affinis, which has lower salinity tolerance and isgenerally more numerous in freshwater sites. It isuncertain whether differences in the number ofembryos (controlling for female size) reflect typicalbrood sizes (Roff 1992, Stearns 1992) or differences inreproductive cycles among marsh types. The former isthe more conventional interpretation, but, in eithercase, marsh type has an effect on reproductive alloca-tion and fecundity.
22
b
Standard length (mm)
Log
num
ber
of o
ffsp
ring Fresh
IntermediateBrackish
Gon
ados
omat
ic in
dex
Log
num
ber
of o
ffsp
ring
a
c
Marsh typeFresh Intermediate Brackish
Marsh typeFresh Intermediate Brackish
0.70
0.75
0.80
0.85
0.90
0.95
14 16 18 20 22 24 26 28 30 320.5
0.6
0.7
0.8
0.9
1.0
1.1
1.2
1.3
13
14
15
16
17
18
19
20
Fig. 5. Gambusia affinis. (a) Gonadosomatic index, (b) relation-ship between standard length and fecundity, and (c) least-squares means (±1 SE) for the number of offspring, adjusted forstandard length, for females collected from fresh, intermediate,
and brackish marshes
Martin et al.: Life history variation in coastal marshes
Male Poecilia latipinna and both male and femaleGambusia affinis collected from fresh marsh sites had alower body condition index. Females of both speciescollected from fresh marshes had lower reproductiveallotment and fecundity than those collected from siteswith higher salinities (i.e. intermediate and brackishmarshes). The combined results suggested that G. affi-nis and P. latipinna are better adapted to marshes withhigher salinity levels than to fresh marsh environ-ments. Fishes examined here were collected fromcoastal marshes with salinities ranging from 0 to12 ppt. These marshes did not only differ in averagesalinity level, but variability also increased withincreasing salinity level of these coastal marsh habitats(Table 1), which has implications for the support of the
‘environmental stability hypothesis’ (Stearns 1983,Abney & Rakocinski 2004). The ‘environmental stabil-ity hypothesis’ predicts that more environmentallyvariable habitats select for individuals that are youngerand smaller at maturity, have higher reproductiveallotment (per unit body mass), larger brood sizes, andsmaller offspring size relative to individuals from morestable habitats (Stearns 1983, 1992).
Purcell et al. (2008) used populations of Gambusiaaffinis collected along a salinity gradient (in the samemarshes as our study) to examine the survival times ofindividual mosquitofish that were exposed to anabrupt and lethal spike in salinity of 25 ppt. Theyfound that G. affinis from brackish and intermediatemarshes had increased tolerance to salinity stress com-
23
Marsh type
Log
dry
mas
s (m
g)
Marsh type
Log
dry
mas
s (m
g)
Standard length (mm)
Log
dry
mas
s (m
g)
Standard length (mm)
Log
dry
mas
s (m
g)
a
b
c
d
FreshIntermediate
Fresh
Fresh Intermediate IntermediateFresh
Intermediate
0.80
0.82
0.84
0.86
0.88
0.90
1.09
1.08
1.10
1.11
1.12
8 9 10 11 12 13 140.5
0.6
0.7
0.8
0.9
1.0
1.1
1.2
10 12 14 16 18 20 22 240.6
0.8
1.0
1.2
1.4
1.6
1.8
Fig. 6. Heterandria formosa. (a) Relationship between standard length and body mass and (b) least-squares means (±1 SE) of drymass of males collected from fresh and intermediate marshes. (c) Relationship between standard length and body mass and
(d) least-squares means (±1 SE) of dry mass of females collected from fresh and intermediate marshes
Species Body condition GSI Fecundity Offspring sizem f
Poecilia latipinna (202): F < B (352): F ≈ I ≈ B F < B F ≈ I < B F ≈ I ≈ BGambusia affinis (637): F < I ≈ B (435): F < I < B F < I < B F < I < B I > BHeterandria formosa (270): F ≈ I (226): F ≈ I F ≈ I F < I F > I
Table 3. Poecilia latipinna, Gambusia affinis, Heterandria formosa. Summary of results for dependent variables across marsh types (F: fresh; I: intermediate; B: brackish). Sample sizes in parentheses. m: male; f: female; GSI: gonadosomatic index
Aquat Biol 8: 15–28, 2009
pared to mosquitofish from freshwater environmentsand that salinity tolerance had a genetic basis (Purcellet al. 2008). However non-genetic factors also seem toplay a role. For instance, when studies include lengthyacclimation periods, levels of salinity tolerance can bemuch higher than those obtained following abruptsalinity changes. Akin & Neill (2004) suggested thatsalinities ranging from 0 to 20 ppt do not impact themetabolic capacity of adult G. affinis, although theydid observe a slight, but significant, reduction in respi-
ration rate at 10 ppt relative to 0 ppt. Following a serialacclimation period of 14 d for every 5 ppt increase insalinity starting at 0 ppt, the plasma osmotic concentra-tions of a freshwater population of G. holbrooki did notdiffer among fish exposed to salinity levels in the rangeof from 0 to 10 ppt (Nordlie & Mirandi 1996). Similarly,survivorship did not differ among fish exposed to sal-inities ranging from 0 to 15 ppt if this exposure waspreceded by an acclimation period of 42 d (Nordlie &Mirandi 1996). In Poecilia latipinna collected from
24
b
Standard length (mm)
Log
num
ber
of o
ffsp
ring Fresh
Intermediate
Gon
ados
omat
ic in
dex
Log
num
ber
of o
ffsp
ring
a
c
Marsh typeFresh Intermediate
Marsh typeFresh Intermediate
0.840.860.880.900.920.940.960.981.001.021.04
11 12 13 14 15 16 17 18 19 20 21 220.50.60.70.80.91.01.11.21.31.41.5
8.0
8.5
9.0
9.5
10.0
10.5
11.0
Fig. 7. Heterandria formosa. (a) Gonadosomatic index, (b) re-lationship between standard length and fecundity, and (c)least-squares means (±1 SE) for the number of offspring, ad-justed for standard length, for females collected from fresh
and intermediate marshes
b
a
c
Marsh typeFresh Intermediate
Marsh typeFresh Intermediate
Standard length (mm)
FreshIntermediate
0.52
0.54
0.56
0.58
0.60
2.7
2.8
2.9
3.0
3.1
3.2
3.3
11 12 13 14 15 16 17 18 19 20 21 22
Leve
l of s
uper
feta
tion
2.2
2.4
2.6
2.8
3.0
3.2
3.4
3.6
3.8
4.0
Log
num
ber
of
offs
prin
g p
er b
rood
Num
ber
of
sim
ulta
neou
s b
rood
s
Fig. 8. Heterandria formosa. (a) Relationship between stan-dard length and level of superfetation, (b) least-squaresmeans (±1 SE) for the number of simultaneous broods, ad-justed for standard length, and (c) number of offspring perbrood, adjusted for the number of broods carried by a female
collected from fresh and intermediate marshes
Martin et al.: Life history variation in coastal marshes
freshwater and brackish (mean = 15 ppt) sites, theplasma osmotic concentrations did not significantly dif-fer over the range of salinity levels of from 0 to 75 ppt,and survival was affected only for salinities >70 ppt,where the brackish population had a higher survivor-ship (Nordlie et al. 1992). The environmental gradientalong which we collected these fish ranged in salinityfrom 0.1 to 12.8 ppt, which is within the salinity toler-ance limits of all 3 species. Despite their broad salinitytolerances, we did find significant variation in severalimportant life history traits in all 3 species (i.e. bodycondition, GSI, fecundity, and offspring size).
Leips & Travis (1999) reported variation in life historytraits among freshwater populations of Heterandriaformosa, which they attributed to differences in popu-lation densities and predation pressure. Our study isthe first known report of life history variation in H. for-mosa along a salinity gradient. Surprisingly, for afreshwater fish, H. formosa collected from intermedi-ate marshes had similar body condition index andreproductive allotment to those collected from fresh-water marshes. Female H. formosa collected from freshmarshes also had a lower fecundity (albeit similarreproductive allotment) compared to those from inter-mediate marshes. These differences in fecundity, num-ber of simultaneous broods, and number of offspringper brood were due to differences in the relationshipbetween offspring number and size. Female H. for-mosa collected from fresh marshes produced fewerbut larger offspring than females from intermediatemarshes. Similarity in reproductive allotment, despitedifferences in offspring sizes and numbers, indicates atrade-off between offspring size and number. The pat-tern of larger offspring sizes of H. formosa in freshmarshes (where they were most abundant) was similar
to that reported by Leips & Travis (1999) for least killi-fish in freshwater habitats with greater populationdensities.
Life history theory predicts that females with equalreproductive allotment maximize lifetime fitness byproducing fewer, larger offspring in stable environ-ments, with higher juvenile mortality or higher levelsof resource competition. Conversely, theory predictsthat females in fluctuating environments with higheradult mortality or lower levels of resource competitionshould produce more, smaller offspring (Stearns 1992).Gomes & Monteiro (2007) measured reproductive lifehistory traits of the poeciliid fish Poecilia viviparaalong a salinity gradient in Brazil and attributed thelife history variation to differences in predation regimerather than differences in mean and variance of salin-ity. Although we collected fishes along a salinity gradi-ent, other abiotic and biotic environmental factors(Dunson & Travis 1991), such as food quantity andquality (Reznick 1990), population density (Hughes1985, Leips & Travis 1999), and predation pressure(Reznick et al. 1990, Johnson 2001), could covary withsalinity and contribute to variation in life history traits.Controlled experiments should be conducted to assessthe influence of the many environmental factors thatvary along such a complex system as a salinity gradienton life history traits. Moreover, common-environmentexperiments (Martin 2008) are required to resolvewhether variation in life histories were due to pheno-typic plasticity or genetic differences between popula-tions (Sibly 1999, Conner & Hartl 2004).
Measures of relative abundance of target species arecommonly used to assess habitat quality (Garshelis2000, Pearce & Ferrier 2001, Johnson 2007). In ourstudy, both sailfin mollies and least killifish appearedto be in better condition in marsh types that also sup-ported higher densities of fish; this is consistent withthe expected association (based on theory) betweenhabitat quality and both individual condition and pop-ulation abundance. However, abundance does notnecessarily equal productivity (Pulliam 1988). Highabundance may reflect increased immigration ratesrather than being indicative of high local productivity(Van Horne 1983). Body condition and life history traitsassociated with reproduction may be more effectivemeasures of habitat quality. Variation in life historytraits of organisms that live along an environmentalgradient has important implications for stress toler-ance, life history evolution, and the direct impact ofabiotic factors on population demographics (Caswell1983, Sibly & Calow 1989, Stearns 1992). In our study,variation in the suite of traits we measured along asalinity gradient suggests that Gambusia affinis isstressed in fresh marshes. We found lower levels ofbody condition, lowered GSI, and lowered fecundity
25
Embryonic developmental stage3 4 5 6
Offs
prin
g d
ry m
ass
(mg)
0.00
0.05
0.10
0.15
0.20
0.25
0.30
0.35
0.40Fresh
Intermediate
Fig. 9. Heterandria formosa. Mean offspring size by develop-mental stage for H. formosa collected from fresh (N = 120) and
intermediate marshes (N = 106)

Aquat Biol 8: 15–28, 2009
for G. affinis in fresh marshes, where these fish weremost abundant, indicating that greater abundance didnot correspond with better condition and higher repro-ductive capacity.
Limited evidence exists from other studies to suggestthat freshwater would be more stressful to Gambusiaaffinis than those salinities observed in intermediatemarshes (Stearns & Sage 1980, Brown-Peterson &Peterson 1990). Additionally, Akin & Neill (2004) didreport an increase in respiration rates in G. affinis at0 ppt compared to at 10 ppt (though they did not feelthis increased respiration would be stressful to thefish). If salinity is not responsible for our observationand those reported in other studies, some other envi-ronmental factor (possibly associated with the salinitylevel) may be influencing the increased abundanceand decreased condition of G. affinis in freshwatermarsh habitats relative to intermediate marshes. Ourfindings are similar to those obtained from studiesconducted in marsh habitats in Texas (Stearns &Sage 1980) and Mississippi (Brown-Peterson & Peter-son 1990), and suggest that the causal mechanism issomewhat consistent across time and space. Given thediverse effects of salinity on other components ofmarsh systems, it is impossible to do more than specu-late on the biotic or abiotic factors that might explainthese results if salinity itself is not the causal factor.
Bachman & Rand (2008) reported that salinity stressdue to acute, abrupt changes in salinity negativelyimpacted the survival and development in Gambusiaholbrooki and Poecilia latipinna. Alcaraz & Garcia-Berthou (2007) found that as salinity increased G. hol-brooki exhibited higher reproductive investment, alower condition level, and a lower population density.We found that along a salinity gradient from fresh tobrackish marshes (0 to 12 ppt), several important lifehistory traits varied in natural populations of poeciliidfishes (Table 3). The patterns in variation of the suiteof life history traits we measured did not supportcausation by any single factor, although these patternsfit best the predictions from the ‘environmental stabil-ity hypothesis’. Moreover, in the case of G. affinis,embryo size and number (adjusted for SL) weresmaller and the body condition level lower, despitehigher densities. Further study is required to isolatethe primary environmental factor influencing life his-tory variation in these fishes from other potential envi-ronmental (e.g. predation pressure, population den-sity, and food availability) and genetic effects (Martin2008). Small-scale localized disturbance events (e.g.storm surges from tropical storms) and large-scaleactions such as sea level rise and climate change willmost likely influence the survival and reproduction oforganisms that live along a coastal environmentalgradient. Studies that examine the effects of salinity
stress, such as this present investigation, are essentialin understanding how global climate change and sealevel rise will impact organisms residing within thecoastal zone.
Acknowledgements. Comments by L. Rozas, J. Neigel,J. Albert, and several anonymous reviewers improved theoriginal manuscript. We appreciate the assistance by M.Collins (University of Louisiana at Lafayette) and the logisticalsupport provided by P. Yakupzack (USFWS) at MandalayNational Wildlife Refuge. We thank the EPA National Centerof Environmental Research and the Louisiana Board ofRegents EPSCor for funding this project. Although theresearch described in this article has been funded, in part, bythe United States Environmental Protection Agency throughGrant R-82942001-0 to the Louisiana Board of Regents, it hasnot been subjected to the agency’s peer and policy review pro-cess and therefore does not necessarily reflect the views of theagency and no official endorsement should be inferred. Thisresearch complied with all state and federal laws and was con-ducted following ethical requirements under the guidelines ofthe University of Louisiana at Lafayette Institutional AnimalCare and Use Committee (IACUC No. 2004-8717-020).
LITERATURE CITED
Abney MA, Rakocinski CF (2004) Life-history variation inCaribbean gambusia, Gambusia puncticulata puncticu-lata (Poeciliidae) from the Cayman Islands, British WestIndies. Environ Biol Fishes 70:67–79
Adams SM, Greeley MS, Law JM, Noga EJ, Zelikoff JT (2003)Application of multiple sublethal stress indicators to assessthe health of fish in Pamlico Sound following extensiveflooding. Estuaries 26:1365–1382
Akin S, Neill WH (2004) Routine metabolism of mosquitofish(Gambusia affinis) at three different salinities. Tex J Sci55:255–262
Alcaraz C, Garcia-Berthou E (2007) Life history variation ofinvasive mosquitofish (Gambusia holbrooki) along a salin-ity gradient. Biol Conserv 139:83–92
Anderson RO, Neumann RM (1996) Length, weight and asso-ciated structural indices. In: Murphy BR, Willis DW (eds)Fisheries techniques, 2nd ed. American Fisheries Society,Bethesda, MD, p 447–481
Bachman PM, Rand GM (2008) Effects of salinity on nativeestuarine fish species in South Florida. Ecotoxicology 17:591–597
Bindoff NL, Willebrand J, Artale V, Cazenave A and others(2007) Observations: oceanic climate change and sealevel. In: Solomon S, Qin D, Manning M, Chen Z andothers (eds) Climate change 2007: the physical sciencebasis. Contribution of Working Group I to the 4th as-sessment report of the Intergovernmental Panel on Cli-mate Change. Cambridge University Press, Cambridge,p 385–432
Blaustein AR, Kiesecker JM (2002) Complexity in conserva-tion: lessons from the global decline of amphibian popula-tions. Ecol Lett 5:597–608
Brown-Peterson N, Peterson MS (1990) Comparative life his-tory of female mosquitofish, Gambusia affinis, in tidalfresh-water and oligohaline habitats. Environ Biol Fishes27:33–41
Caswell H (1983) Phenotypic plasticity in life-history traits:demographic effects and evolutionary consequences. Am
26

Martin et al.: Life history variation in coastal marshes
Zool 23:35–46Chervinski J (1983) Salinity tolerance of the mosquitofish,
Gambusia affinis (Baird and Girard). J Fish Biol 22:9–11 Conner JK, Hartl DL (2004) A primer of ecological genetics.
Sinauer Associates, Sunderland, MAConstantz GD (1989) Reproductive biology of poeciliid fishes.
In: Meffe G, Snelson F (eds) Ecology and evolution of live-bearing fishes (Poeciliidae). Prentice-Hall, Inc., Engle-wood Cliffs, NJ, p 33–50
Dunson WA, Travis J (1991) The role of abiotic factors in com-munity organization. Am Nat 138:1067–1091
Farr JA, Travis J (1986) Fertility advertisement by female sail-fin mollies, Poecilia latipinna (Pisces, Poeciliidae). Copeia1986:467–472
Garshelis DL (2000) Delusions in habitat evaluation: measur-ing use, selection, and importance. In: Boitani L, Fuller TK(eds) Research techniques in animal ecology: controver-sies and consequences. Columbia University Press, NewYork, p 111–164
Gelwick FP, Akin S, Arrington DA, Winemiller KO (2001) Fishassemblage structure in relation to environmental varia-tion in a Texas Gulf coastal wetland. Estuaries 24:285–296
Gomes JL, Monteiro LR (2007) Size and fecundity variation inpopulations of Poecilia vivipara Block & Schneider(Teleostei; Poeciliidae) inhabiting an environmental gradi-ent. J Fish Biol 71:1799–1809
Griffith RW (1974) Environment and salinity tolerance in thegenus Fundulus. Copeia 1974:319–331
Haynes JL (1995) Standardized classification of poeciliiddevelopment for life-history studies. Copeia 1995:147–154
Hughes AL (1985) Seasonal trends in body size of adult malemosquitofish, Gambusia affinis, with evidence for theirsocial control. Environ Biol Fishes 14:251–258
Johnson JB (2001) Adaptive life-history evolution in thelivebearing fish Brachyrhaphis rhabdophora: geneticbasis for parallel divergence in age and size at maturityand a test of predator-induced plasticity. Evolution 55:1486–1491
Johnson M (2007) Measuring habitat quality: a review. Con-dor 109:489–504
Leips J, Travis J (1999) The comparative expression of life-history traits and its relationship to the numerical dynam-ics of four populations of the least killifish. J Anim Ecol 68:595–616
Lorenz JJ, Serafy JE (2006) Subtroprical wetland fish assem-blages and changing salinity regimes: implications foreverglades restoration. Hydrobiologia 569:401–422
Louisiana Coastal Wetlands Conservation and RestorationTask Force and the Wetlands Conservation and Restora-tion Authority (1998) Coast 2050: toward a sustainablecoastal Louisiana. Louisiana Department of Natural Re-sources, Baton Rouge, LA
Martin FD (1980) Poeciliidae—Livebearers. In: Lee DS,Gilbert CR, Hocutt CH, Jenkins RE, McAllister DE, Stouf-fer JR (eds) Atlas of North American freshwater fishes.North Carolina State Museum of Natural History, Raleigh,NC, p 537–557
Martin SB (2008) Reproductive strategies of coastal marshfishes: assessing alternative life history tactics in responseto environmental change. PhD dissertation, Department ofBiology, University of Louisiana at Lafayette
Meffe G, Snelson F (1989) An ecological overview of poeciliidfishes. In: Meffe GK, Snelson FF (eds) Ecology and evolu-tion of livebearing fishes (Poeciliidae). Prentice-Hall,Englewood Cliffs, NJ, p 13–31
Mitsch WJ, Gosselink JG (2000) Wetlands, 3rd edn. JohnWiley, New York
Nicholls RJ, Wong PP, Burkett VR, Codignotto JO (2007)Coastal systems and low-lying areas. In: Parry ML,Canziani OF, Palutikof JP, Linden PJvd, Hanson CE (eds)Climate change 2007: impacts, adaptation and vulner-ability. Contribution of Working Group II to the 4th As-sessment Report of the Intergovernmental Panel on Cli-mate Change. Cambridge University Press, Cambridge,p 315–356
Nordlie FG (2006) Physicochemical environments and toler-ances of cyprinodontoid fishes found in estuaries and saltmarshes of eastern North America. Rev Fish Biol Fish 16:51–106
Nordlie FG, Mirandi A (1996) Salinity relationships in a fresh-water population of eastern mosquitofish. J Fish Biol 49:1226–1232
Nordlie FG, Haney DC, Walsh SJ (1992) Comparisons ofsalinity tolerances and osmotic regulatory capabilities inpopulations of sailfin molly (Poecilia latipinna) from brack-ish and fresh waters. Copeia 1992:741–746
Odum WE (1988) Comparative ecology of tidal freshwaterand salt marshes. Annu Rev Ecol Syst 19:147–176
Packard GC, Boardman TJ (1988) The misuse of ratios,indices, and percentages in ecophysiological research.Physiol Zool 61:1–9
Pearce J, Ferrier S (2001) The practical value of modelling rel-ative abundance of species for regional conservation plan-ning. Biol Conserv 98:33–43
Penland S, Ramsey KE (1990) Relative sea-level rise inLouisiana and the Gulf of Mexico: 1908–1988. J Coast Res6:323–342
Pulliam HR (1988) Sources, sinks, and population regulation.Am Nat 132:652–661
Purcell KM, Hitch AT, Klerks PL, Leberg PL (2008) Adapta-tion as a potential response to sea-level rise: a geneticbasis for salinity tolerance in populations of a coastalmarsh fish. Evol Appl 1:155–160
Reznick D (1981) Grandfather effects: the genetics of inter-population differences in offspring size in the mosquitofish. Evolution 35:941–953
Reznick D (1990) Plasticity in age and size at maturity in maleguppies (Poecilia reticulata): an experimental evaluationof alternative models of development. J Evol Biol 3:185–203
Reznick DN, Miles DB (1989) Review of life history patterns inpoeciliid fishes. In: Meffe G, Snelson F (eds) Ecology andevolution of livebearing fishes (Poeciliidae). Prentice-Hall,Englewood Cliffs, NJ, p 125–148
Reznick D, Bryga H, Endler J (1990) Experimentally inducedlife-history evolution in a natural population. Nature 346:357–359
Roff DA (1992) The evolution of life histories. Chapman &Hall, New York
Rosen DE, Bailey RM (1963) The poeciliid fishes (Cyprinodon-tiformes), their structure, zoogeography, and systematics.Bull Am Mus Nat Hist 126:1–176
SAS Institute (2007) SAS Enterprise Guide 4.1: SAS OnDe-mand for academics. SAS Institute, Cary, NC
Sibly RM (1999) Efficient experimental designs for studyingstress and population density in animal populations. EcolAppl 9:496–503
Sibly RM, Calow P (1989) A life-cycle theory of responses tostress. Biol J Linn Soc 37:101–116
Stearns SC (1983) The evolution of life-history traits in mos-quitofish since their introduction to Hawaii in 1905: ratesof evolution, heritabilities, and developmental plasticity.Am Zool 23:65–75
Stearns SC (1992) The evolution of life histories. Oxford Uni-
27

Aquat Biol 8: 15–28, 2009
versity Press, OxfordStearns SC, Sage RD (1980) Maladaptation in a marginal pop-
ulation of the mosquito fish, Gambusia affinis. Evolution34:65–75
Titus JG, Richman C (2001) Maps of lands vulnerable to sealevel rise: modeled elevations along the US Atlantic andGulf coasts. Clim Res 18:205–228
Trexler JC, Travis J (1990) Phenotypic plasticity in the sailfinmolly, Poecilia latipinna (Pisces, Poeciliidae). 1. Fieldexperiments. Evolution 44:143–156
Turner CL (1941) Morphogenesis of the gonopodium inGambusia affinis affinis. J Morphol 69:161–185
Van Horne B (1983) Density as a misleading indicator of habi-tat quality. J Wildl Manag 47:893–901
Visser JM, Sasser CE, Chabreck RH, Linscombe RG (1998)Marsh vegetation types of the Mississippi River deltaicplain. Estuaries 21:818–828
Wedemeyer GA, Barton BA, McLeay DJ (1990) Stress andacclimation. In: Schreck C, Moyle P (eds) Methods forfish biology. American Fisheries Society, Bethesda, MD,p 451–489
Winemiller KO, Rose KA (1992) Patterns of life-historydiversification in North American fishes: implications forpopulation regulation. Can J Fish Aquat Sci 49:2196–2218
28
Editorial responsibility: Thomas Turner, Albuquerque, New Mexico, USA
Submitted: January 19, 2009; Accepted: October 21, 2009Proofs received from author(s): December 9, 2009


![Gene Regulatory Variation Mediates Flowering Responses to … · Gene Regulatory Variation Mediates Flowering Responses to Vernalization along an Altitudinal Gradient in Arabidopsis1[W][OPEN]](https://static.fdocuments.us/doc/165x107/5f98e88dad46a25c2151eba2/gene-regulatory-variation-mediates-flowering-responses-to-gene-regulatory-variation.jpg)