Life cycle assessment of floor care · 2011-06-02 · Life cycle assessment of floor care A...
72
Life cycle assessment of floor care A comparative study of the Twister™ method and floor care methods using polish and wax Henrik Larsson, Mattias Lindahl & Niclas Svensson Linköping, June 2009 Environmental Technology and Management Department of Management and Engineering (IEI) Linköping University
Transcript of Life cycle assessment of floor care · 2011-06-02 · Life cycle assessment of floor care A...

Life cycle assessment of floor care
A comparative study of the Twister™ method and floor care methods using polish and wax
Henrik Larsson, Mattias Lindahl & Niclas Svensson
Linköping, June 2009
Environmental Technology and Management Department of Management and Engineering (IEI)
Linköping University

2
The picture on the title page is taken by HTC Sweden AB.

3
Abstract In Today’s society there are a wide variety of floor and floor materials. An extensive range of products and methods are also used to ensure that these floors remain functional. All floor types and products create environmental impact of various kinds and magnitudes.
This study was initiated by the authors in order to evaluate the Twister™-method’s environmental pros and cons in relation to other traditional floor care methods. This has been ascertained through a Life Cycle Assessment which was conducted within the study. The study has been in co-operation with HTC Sweden AB, the developer of the Twister™-method.
A Life Cycle Assessment helps to identify and quantify the environmental impact of a product or a service, from a holistic perspective, which incorporates extraction of materials, their manufacture, use and waste management. The software application SimaPRo 7.0 has been used in this study, from which the Eco-indicator 99 method has been selected.
In the study, the Twister™ method is compared with other floor care methods using polish and wax. The analysis also includes a breakdown of the Twister™ method, as well as a breakdown of the Twister™ pad manufactured by HTC Sweden AB.
The results show that the elements of the Twister™ method with the greatest environmental impact are the scrubbing machine that is used and the energy consumption that the Twister™ method requires. The results also show that the Twister™ method has a significantly lower environmental impact than floor care methods using polish or wax. The parts of the Twister™ pad that have the greatest environmental impact are the industrial diamonds and the material that makes up the pad.

4
5
Table of contents 1 Introduction ........................................................................................................................ 9
1.1 Purpose ....................................................................................................................... 9 1.2 Target group and intended application....................................................................... 9 1.3 Layout and content ..................................................................................................... 9
2 Background ...................................................................................................................... 11 2.1 Definition of floor care............................................................................................. 11
2.1.1 Frequent care .................................................................................................... 11 2.1.2 Periodic maintenance ....................................................................................... 11 2.1.3 Chemical products............................................................................................ 11 2.1.4 Use of machines in floor care........................................................................... 12 2.1.5 Environmental labelling and legislation........................................................... 12
2.2 HTC Sweden AB...................................................................................................... 13 2.2.1 Twister™.......................................................................................................... 13
3 The LCA methodology..................................................................................................... 15 3.1 What is an LCA? ...................................................................................................... 15 3.2 Definition of goal and scope .................................................................................... 16
3.2.1 Function and functional unit ............................................................................ 16 3.2.2 System boundaries............................................................................................ 16
3.3 Inventory .................................................................................................................. 17 3.3.1 Data quality ...................................................................................................... 17
3.4 Environmental impact assessment ........................................................................... 18 3.4.1 Classification.................................................................................................... 18 3.4.2 Characterisation................................................................................................ 18 3.4.3 Weighting ......................................................................................................... 18
3.5 Interpretation of results ............................................................................................ 19 3.5.1 Uncertainty analysis and sensitivity analysis ................................................... 19
4 Previous studies of floor care ........................................................................................... 21 4.1 Identification of previous studies ............................................................................. 21 4.2 Studies of floor materials ......................................................................................... 21 4.3 Studies of floor care from a life cycle perspective................................................... 22 4.4 Studies of floor care from a working environment and health perspective ............. 23 4.5 Studies of environmental criteria ............................................................................. 24 4.6 Previous studies of Twister™ .................................................................................. 24
5 Objectives and scope........................................................................................................ 27 5.1 Functional unit.......................................................................................................... 27 5.2 Limitations ............................................................................................................... 27
5.2.1 System boundaries............................................................................................ 28
6 Inventory .......................................................................................................................... 31 6.1 Collection of data ..................................................................................................... 31
6.1.1 Materials supplied ............................................................................................ 31 6.1.2 Questionnaires.................................................................................................. 31 6.1.3 Interviews and e-mail ....................................................................................... 31
6.2 Inventory of Scenario Twister™.............................................................................. 31 6.3 Manufacturing phase ................................................................................................ 32

6
6.3.1 Industrial diamonds .......................................................................................... 32 6.3.2 Pads .................................................................................................................. 33 6.3.3 Binding agent ................................................................................................... 33 6.3.4 Transport .......................................................................................................... 33 6.3.5 Manufacture ..................................................................................................... 35
6.4 Usage phase.............................................................................................................. 35 6.4.1 Manufacture of reusable mop........................................................................... 35 6.4.2 Use of reusable mop......................................................................................... 36 6.4.3 Scrubbing machine........................................................................................... 36 6.4.4 Use of resources when cleaning with a scrubbing machine............................. 37
6.5 Waste management .................................................................................................. 37 6.6 Other scenarios......................................................................................................... 38
6.6.1 Scenario Polish................................................................................................. 38 6.6.2 Scenario Wax ................................................................................................... 39 6.6.3 Uncertainties regarding Scenario Polish and Scenario Wax............................ 39
7 Environmental impact assessment ................................................................................... 41 7.1 Modelling and description of the software............................................................... 41 7.2 Uncertainties in the use of databases........................................................................ 41 7.3 Comparison between the scenarios .......................................................................... 42
7.3.1 Scenario Twister™........................................................................................... 44 7.3.2 Scenario Polish................................................................................................. 44 7.3.3 Scenario Wax ................................................................................................... 44 7.3.4 Summary of the results of all the scenarios...................................................... 45
7.4 Scenario Twister™ broken down into fractions....................................................... 45 7.4.1 Reusable mop ................................................................................................... 46 7.4.2 The Twister™ pad............................................................................................ 46 7.4.3 Scrubbing machine........................................................................................... 46 7.4.4 Water consumption during cleaning ................................................................ 47 7.4.5 Energy consumption during floor care............................................................. 47 7.4.6 Washing the mop.............................................................................................. 47 7.4.7 Waste management .......................................................................................... 47 7.4.8 Summary of Scenario Twister™ broken down into fractions.......................... 47
7.5 Damage assessment of the Twister™ pad................................................................ 47 7.5.1 Industrial diamonds .......................................................................................... 48 7.5.2 Pads .................................................................................................................. 48 7.5.3 Binding agent ................................................................................................... 49 7.5.4 Transport .......................................................................................................... 49 7.5.5 Manufacture ..................................................................................................... 49 7.5.6 Summary of the Twister™ pad ........................................................................ 49
8 Sensitivity analysis........................................................................................................... 51 8.1 Scenarios for sensitivity analysis ............................................................................. 51
8.1.1 Scenario Double Wear ..................................................................................... 51 8.1.2 Scenario Extra Transport.................................................................................. 52
8.2 Results of the sensitivity analysis............................................................................. 52 8.2.1 Scenario Twister™........................................................................................... 53 8.2.2 Scenario Double Wear ..................................................................................... 53 8.2.3 Scenario Extra Transport.................................................................................. 53 8.2.4 Summary of the sensitivity analysis................................................................. 53
9 Discussion ........................................................................................................................ 55

7
9.1 Characterisation or damage assessment? ................................................................. 55 9.2 Differences in machines ........................................................................................... 55 9.3 Transport .................................................................................................................. 56 9.4 Choice of energy carrier ........................................................................................... 56 9.5 Comparison with previous studies ........................................................................... 56
9.5.1 Incorporating floor care in the floor’s life cycle .............................................. 57 9.5.2 Risks during waste management ...................................................................... 57 9.5.3 Time for frequent care...................................................................................... 57 9.5.4 How the Twister™ method relates to sick buildings ....................................... 58 9.5.5 The Twister™ method or ecolabelled chemicals? ........................................... 58
10 Conclusion........................................................................................................................ 61 10.1 Further work............................................................................................................. 61
11 References ........................................................................................................................ 63 11.1 Electronic sources .................................................................................................... 64
11.1.1 E-mail ............................................................................................................... 65 11.1.2 Verbal sources .................................................................................................. 65 11.1.3 Software ........................................................................................................... 65
12 Appendix 1 – Damage assessment ................................................................................... 67
13 Appendix 2 - Eco-indicator 99 ......................................................................................... 69 13.1 The term Environment according to Eco 99 ............................................................ 69 13.2 Characterisation........................................................................................................ 69
13.2.1 Human health ................................................................................................... 69 13.2.2 Ecosystem quality ............................................................................................ 70 13.2.3 Resources ......................................................................................................... 71
13.3 Weighting ................................................................................................................. 71

8

9
1 Introduction The first permanent floors were created when people decided to settle down and make permanent residences thousands of years ago. To start with these were simply trodden down earth. Since then, the demands placed on floors have increased, from aesthetic perspectives to demands for strength and durability, in addition to economic considerations. The development of floors has also changed from a dimension perspective, both with regard to their size and in terms of time. This has resulted in a wide variety of floor materials and manufacturing techniques. However, there is one thing that all floors have always needed: cleaning. With larger floor areas and newer materials, the development of more efficient floor care methods has moved ahead and new products have been created to make this easier. However, this development, in particular of cleaning chemicals, can result in the floor having an increased environmental impact during its lifetime. With more and more floor space, overall floor care is increasing, which can lead to an increased load on the environment when incorrect methods and chemicals are used. To make decisions relating to floor care methods easier, this report will focus on one floor care method and then attempt to chart the entire environmental impact that the floor care method generates based on current knowledge and technology, as well as to compare this floor care method with other methods.
1.1 Purpose This study was initiated by the authors in order to evaluate the Twister™-method’s environmental pros and cons in relation to other traditional floor care methods. The purpose is to describe the environmental impact caused by caring for one square metre of floor over the course of one year. This impact will also be analysed in relation to previous floor care studies.
In order to describe the environmental impact of the Twister™ method, a life cycle assessment will be carried out (from now on abbreviated to LCA).
1.2 Target group and intended application This study has several target groups, which means that the study, as far as possible, is striving to be transparent at the same time as attempting to satisfy all the target groups’ demands for quality.
Examples of target groups:
• Customers that use or want to use the Twister™ method and want to know how well the product does in comparison with other floor care methods.
• Those who have a general interest in floor care from a life cycle perspective.
1.3 Layout and content This report comprises nine chapters, as well as references and appendices. Providing a brief description of the report here reinforces the arguments within and clarity of the report.
Chapter 1 comprises an introduction, in which the purpose, target group and layout are presented.
Chapter 2 sets out the background, with a basic description of floor care, differences between different elements that can make up floor care, as well as a brief presentation of certain

10
legislation and environmental criteria relating to floor care in Sweden. This chapter also contains a description of HTC Sweden AB and its product, Twister™.
Chapter 3 presents the foundations for the implementation of the LCA, in terms of what is to be included.
Chapter 4 contains a summary of previous studies that this study uses.
Chapter 5 contains the first stage of the LCA, i.e. the objectives and scope of the assessment, as well as the limitations that have been applied to this study’s LCA.
Chapter 6 includes the inventory that has been implemented within this study with the aim of charting and gathering data for the analysis of the Twister™ method, as well as for the comparison floor care methods, polish and wax.
Chapter 7 contains the results of the environmental impact assessment’s analysis. The chapter includes the results of a comparison between the Twister™ method on the one hand and the floor care methods using polish and wax on the other, as well as a breakdown of the Twister™ method itself and a breakdown of the Twister™ pad.
Chapter 8 includes a sensitivity analysis, in which the Twister™ method is studied on the basis of major wear and additional transport.
Chapter 9 includes a discussion regarding thoughts that have arisen during the course of the study, as well as feedback regarding the results of previous studies in this field and other studies that can help to broaden the results.
Chapter 10 gives conclusions regarding the study, presenting proposals for further work and research.
References and appendices can be found at the end of the report.

11
2 Background This chapter contains a basic introduction to the topic of floor care as well as to HTC Sweden AB and their product, Twister™.
2.1 Definition of floor care Professional floor care in Sweden can be divided into several elements. When a floor is installed, basic cleaning or construction cleaning is performed. This is followed by regular maintenance in order to retain the function of the floor. In this study, such regular maintenance is divided up into frequent care and periodic maintenance, under the collective name of floor care.
The way in which floor care should be carried out varies considerably, depending on who you ask. The floor care methods recommended by floor manufacturers differ, not only in terms of the technical properties of different floor materials, but also in relation to the wishes of customers and other local conditions (Lundblad, 1994). The floor care methods are continually being developed, and several different methods may be applicable to the same type of floor.
Two of the more common floor care methods currently in use are wax treatment and polishing. Both methods entail the floor being given a basic treatment on installation, during which a protective layer of wax or polish is applied. This is followed by frequent care up until the floor needs to be restored to its original condition through what is referred to as periodic maintenance. (Paulsen, 1999)
2.1.1 Frequent care Frequent care refers to the daily or weekly cleaning that is performed. Depending on factors such as traffic load, dirt, type of premises, the age and structure of the floor covering, as well as the customer’s demands for cleanliness and lustre, the frequency and precision of the cleaning can vary considerably. (Paulsen, 1999)
2.1.2 Periodic maintenance Periodic maintenance is intended to make frequent care easier, as well as providing the floor with better protection (Nordic Ecolabelling, 2008). This is performed when the floor needs a more thorough clean, and can be due to the frequent care not being sufficient or to a higher load than normal, which has given rise to increased wear. The periodic maintenance entails that the floor is first restored through scouring and that the floor care agent is removed before new agent is applied. It is normally necessary for the premises to be closed off, as the chemicals used can be harmful to health (Paulsen, 1999).
2.1.3 Chemical products During both frequent care and periodic maintenance, chemicals or chemical products may be required. Regulations and directives for these differ depending on whether they are being used for frequent care or periodic maintenance. One reason for this is that the cleaning chemicals used during frequent care are considered to be dissolved in water, while most residual chemicals from periodic maintenance are considered to be in solid form, thus easier to prevent and handle any pollution (Rick, 2009). The difference between chemical products is also

12
evident in relation to environmental labelling. The use of chemicals contributes to numerous complications, depending on when and how they are used. If more chemicals are used during periodic maintenance, the need for cleaning chemicals during frequent care may be reduced. In addition, the handling of residual chemicals can vary. When the floor undergoes wear, the chemicals that have been bound to the floor through the periodic maintenance can be released into the air. This can give rise to a different environmental impact compared to scouring the floor in accordance with frequent care, when the chemicals are released into the scouring water. If the scouring water goes to the treatment plant via the sewage system or is collected and treated as hazardous waste, additional issues arise regarding the environmental impact of the chemicals. (Paulsen, 2008)
2.1.4 Use of machines in floor care In larger premises, it is worthwhile to use scrubbing machines rather than cleaning by hand. Frequent care with a scrubbing machine usually requires the floor to be dry-mopped first to remove any large gravel particles or other transitory dirt (Karlsson, 2008). The scrubbing machines either have built-in batteries that are charged between operations, or are supplied with electricity directly via a lead. Machines can be used for both frequent care and periodic maintenance. During periodic maintenance, machines other than scrubbing machines may be required, depending on the floor care method.
2.1.5 Environmental labelling and legislation The two major ecolabels in Sweden are the “Swan” and “Good Environmental Choice”. The Swan label includes criteria for floors, floor care, cleaning services, cleaning products and mops (Nordisk Miljömärkning, 2006; Nordic Ecolabelling, 2008a; Nordisk Miljömärkning, 2002; Nordic Ecolabelling, 2008b; Nordic Ecolabelling, 2008c). Each product and service has its own criteria. For example, the Swan distinguishes between products for frequent care and those for periodic maintenance, by dividing them into floor care and cleaning products. To satisfy the Swan label’s floor care criteria, the floor must be treated with polish or wax (Nordic Ecolabelling, 2008a).
For cleaning products that are to be labelled with the Swan, it is necessary for the product to have the lowest environmental impact within its category and for the substances that the product contains to have as little environmental impact as possible. At the same time, demands are placed on the product from a health perspective (Nordic Ecolabelling, 2008b).
Good Environmental Choice is one of the Swedish Society for Nature Conservation’s tools for reducing society’s environmental impact. Good Environmental Choice has criteria for cleaning chemicals that are used in frequent care, but has no criteria for periodic maintenance or the installation of floors. In addition, the labelling refers to the product itself and not to the application of the product (Öberg Huss, 2008). It is evident from the SSNC’s chemicals policy that the use of chemicals should be avoided as far as possible, and any use should be phased out (Swedish Society for Nature Conservation, 2004).
The legislation for chemicals and chemical products that are used during frequent care and periodic maintenance are contained in REACH and the Environmental Code (Jedvall, 2008). Cleaning chemicals that are used in frequent care also come under Regulation No. 648/2004 of the European Parliament and of the Council, as these can contain tensides (Rick, 2009). In other words, the use of chemicals requires some administration, but above all consideration.

13
2.2 HTC Sweden AB HTC Sweden AB (HTC) was founded in 1987 as a contractor company. The company has its registered offices in Söderköping and is owned by Håkan and Gunn Thysell who, together with 3iGroup, control the company (HTC Sweden, 2008).
From the outset, the focus was on the manufacture of floors. The company gradually developed its own methods and machines for this purpose. In 1992 it patented the grinding technique that it had developed, and today HTC and its subsidiary companies deliver their products all over the world. HTC has also developed a cleaning method, known as the Twister™ method.
2.2.1 Twister™ According to HTC (2008) it is possible, instead of using chemicals in the execution of floor care, to achieve equivalent results mechanically. The Twister™ method is based on a cleaning pad, prepared with millions of microscopic diamonds (from now on referred to as the Twister™ pad), polishing and cleaning the floor with water alone. As the floor care process is being carried out, the Twister™ pad is worn down without affecting the lifetime of the floor. The binding agent that secures the diamonds to the cleaning pad also contains a colour pigment, making it easy to see when it is time to change to a new Twister™ pad.
The Twister™ pad is mounted on a scrubbing machine or combined machine in the same way as a polishing pad, which means that there is no requirement for a specific machine in order to use this method. Before use with a scrubbing machine, the floor should be dry-mopped to remove larger particles, such as gravel and grains of sand (HTC Sweden, 2008).
The Twister™ method works on several floor materials, such as natural stone, terrazzo, wax-treated and polish-treated floors (HTC Sweden, 2008). At the time of writing this study, the cleaning method has been studied mostly on stone and concrete floors, although it has also been tested successfully on other floor materials, as stated.
If the Twister™ method is used during frequent care, no cleaning chemicals or periodic maintenance will be required (HTC Sweden, 2008).

14

15
3 The LCA methodology This chapter first explains how LCAs have been developed in terms of theory, and then what is required for a method to satisfy the stipulated demands in order to be referred to as an LCA according to the ISO 14040 series.
3.1 What is an LCA? The LCA methodology has its origins in the 1960s (Rydh et al., 2002). Before that, environmental measures consisted of diluting or dumping pollutants to the extent it was considered nature could cope with them. Through the energy crisis of the 1970s and the environmental disasters of the 1980s, the LCA method made a breakthrough. The environmental debate meant that life cycle methods came to include energy and material flows with the aim of reducing consumption.
Since the 1990s, the use of life cycle assessments has increased and the methods have been developed. They have become even more user-friendly and can be employed to assess environmental impact (Rydh et al., 2002).
The life cycle assessment methodology is attractive to industry as it manages the environmental aspects in a structured manner. It is also set up to handle technical systems, as well as to look at several environmental aspects simultaneously (Baumann & Tillmann, 2004).
A life cycle assessment is characterised by emissions, the use of resources and other environmental impacts in each relevant phase of a product’s life cycle being described “from the cradle to the grave” (Rebitzer et al., 2004). In other words, from the time materials and energy are extracted from nature until the time they are returned to nature. This is achieved by means of the product’s life cycle being divided into three overall phases (Rydh et al., 2002). The first phase relates to the production of materials and manufacture. This is followed by the usage phase, which includes the environmental impact to which the product gives rise, as well as the energy and resources that the product requires in order to fulfil its function. The final phase relates to the waste management of the product. Waste management can entail that the product is handled as a whole or dismantled, whereupon each component is handled separately; this takes place through dumping, incineration, composting or recycling.
In order to compare different manufacturing processes, or to demonstrate the need for rationalisation as well as substitution opportunities from a life cycle perspective, it may be appropriate to break down a product’s various phases and to identify the environmental impact of each phase. A breakdown of this type can hopefully reduce the overall environmental impact generated by a product or service. At the same time, the life cycle methodology is flexible and can be adapted to the relevant context and purpose of each study.
Generally speaking, LCAs include the following components:
• Definition of goal and scope
• Inventory
• Environmental impact assessment
• Interpretation of results
16
3.2 Definition of goal and scope The goal and scope of an LCA help to describe the system in which the product finds itself by defining a functional unit and the system’s limits (Rebitzer et al., 2004).
3.2.1 Function and functional unit The functional unit is important in order to be able to compare and analyse different types of service and product. A functional unit does not have to be linked to a particular type of material, but can entail comparing the actual function of a particular process (Rebitzer et al., 2004). In order better to compare different alternatives, the functional unit must specify three properties: sustainability, quantity and quality (Rydh et al., 2002).
• Sustainability refers to the length of the service life according to which the function should be calculated.
• The quantitative aspect assumes that it is possible to calculate inputs and outputs of energy and materials in order to satisfy the function.
• The qualitative aspect stipulates demands regarding what, in addition to the actual function, the product or service has to fulfil.
3.2.2 System boundaries An LCA is performed using methods that employ models. The models are used to simplify the reality, but at the same time demand limitations regarding what is to be included in the model and what is not covered. If these limitations are not implemented, an LCA will become complicated to implement. This is because a model can become infinitely large, which negates the primary purpose of using models. Below are some limitations that have to be handled in an analysis.
Limitation in relation to natural systems – Where does the life cycle start? This limitation is especially complicated when it comes to the recycling of materials and in particular renewable materials. Is the material that is being recycled replacing the same original material, or is a new market arising, and if so what material is being replaced?
Limitation in relation to the life cycle of other products – A product can be part of a flow of various products that a process can manufacture. At the same time, the life cycle of each machine that is required for the manufacture of the product can be included in the product’s life cycle. This means that a life cycle can grow through the web of different processes’ life cycles that it involves.
Geographic limitations – A product may be produced in one country, sold in another and waste management can take place in a third. Different countries have different conditions, both technical and legal, and this can cause difficulties in the modelling process. This is particularly true when assessing waste management. The legislation regarding the incineration of waste varies depending on the country in question. The definition of what is counted as waste also varies. At the same time, the variation between different countries’ recycling and incineration capacities is extremely important.
Time restriction – From what time perspective is the assessment carried out? Some substances take longer to break down naturally than others, and as a result the environmental impact over time can be greater than in a direct comparison. At the same time, a certain amount of time may be necessary to expand the existing capacity in order to cope with the amount that is intended to be processed. A product with a long life does not need to be better from an environmental perspective than one with a short life, although it may appear so at

17
first glance. If the lifetime of a product is short, it can be replaced by a new version sooner, which in turn hopefully has less of an impact on the environment.
Technological coverage – The data that is collected can occasionally describe the best technology that is available, or can describe an outdated technology, which means that the study can result in rash conclusions being drawn.
3.3 Inventory The first step of an inventory is to gather data for the various materials and processes that are required to satisfy the functional unit. After this, the raw materials and energy requirements are charted, as well as the emissions and waste, that the various materials and processes require and give rise to. During this charting process, the various inputs and outputs of materials and energy are compiled in data categories.
Carrying out an inventory is an active process. This system being studied is continually being expanded by means of knowledge about the studied system increasing when data are identified. This in turn can make demands for more data or for the system to be restricted. In order to make inventorying easier, it may be appropriate to use databases and data models to cover any gaps in the data or to rationalise the inventory process. At the same time, it is important for the quality of the gathered data to be actively checked. For example, data relating to the same product may differ depending on where the product is manufactured.
3.3.1 Data quality Occasionally it is not possible to obtain precise data. In such cases, educated guesses are required, not only by the person carrying out the study, but also by experts in the field. The reason for such guesses is that verifying data takes up considerable resources. For this reason, data should only be verified until it can be ascertained that the model’s behaviour probably corresponds with reality. This verification procedure should take place on the basis of several perspectives that are described below.
Time-related coverage – What is the oldest permitted data? Measurement equipment is continually being developed, and with this also the potential to reject/reinforce old theories. Within the academic sphere, there is an endeavour to link back to the original source, which can result in new findings being derived from old data. For this reason, it is necessary to adopt a position on each individual value that comes from a secondary source.
Geographic restrictions – Geographic restrictions are linked to the potential to obtain correct data that is valid at the measurement point. Even if current technology provides the potential to collect data that has not previously been measurable, this does not been that the technology is available to take measurements where it is needed. The choice that has to be made is whether measurements in similar environments should be used, or whether previous data from the correct geographic area should be used.
Data quantity – One area that is the subject of much debate from an LCA perspective relates to the quantity of data that is to be used. Should work be based on average values, specific data or marginal data? (Rebitzer, 2004) If a process requires electricity, should electricity consumption be calculated according to the ‘Swedish fuel mix’, i.e. the electricity that is currently produced in Sweden? Or is it the specific electricity that the supplier can deliver to the company that should be measured? Or should the data be calculated on the basis of the worst possible electricity production within the existing power network?

18
Technical restrictions – As mentioned previously, measurement equipment is being developed. However, it is still not possible to measure everything. This is partly for cost reasons, but also due to the fact that technical equipment is not able to identify all particles.
3.4 Environmental impact assessment The results that emerge from an inventory can be difficult to understand. Materials in different products or processes differ from one another, and materials and energy consumption vary. Several different methods can be used to simplify the results to make them more manageable. The methods take data from the inventory’s various data categories and compile these data in groups, before totalling each group. The various data categories are assessed by means of the selected method indicating the categories that produce a significant environmental impact during the life cycle. This is known as an environmental impact assessment, and includes the following elements:
• Classification
• Characterisation
• Weighting
3.4.1 Classification The purpose of classification is to sort the various data categories from the inventory phase, depending on their environmental impact. The classification does not give consideration to quantity or to the part of the life cycle chain that the environmental load affects. When a classification is carried out, it is important to possess knowledge about which environmental impact each data category comes under. A data category can belong to several environmental impact categories. The relationship between a data category and an environmental impact can consequently be complex, and in practice it is easiest to work on the basis of an existing classification (Rydh et al., 2002).
3.4.2 Characterisation The classification does not take quantity into account; this is done during characterisation. When characterisation takes place, inventory data are multiplied by category-specific and subject-specific equivalence factors. After this, all contributions in each environmental impact category are totalled. Equivalence factors such as greenhouse effect and strategic ozone can be seen from a global perspective, while other environmental impact categories can have local or regional factors. This means that several different characterisation methods (also known as characterisation models) may be required to assess the results, which naturally requires more resources and time (Rydh et al., 2002).
3.4.3 Weighting Weighting is used to weigh all data categories together to reach a single figure, which indicates the overall environmental impact (Rydh et al., 2002). This is done through an overall appraisal of the various environmental impact categories. Normalisation is carried out prior to weighting. Normalisation entails dividing the various values in the environmental impact categories by a reference value. The reference values are subjective and express different values such as political or moral values within a community in relation to changes in natural systems. The more a change deviates from the values, the higher the weighting given to the environmental aspect. The grounds for the values can include political decisions, the opinions of expert panels, economic conditions, etc. Precision as regards weighting is

19
restricted by simplifications and a lack of scientific data, which means that the methods for characterisation are more accepted as these are normally based on accepted scientific links. In other words, the results of a weighting process can vary depending on the values on which it is based. Weighting results should therefore not be used in marketing, for example, although they are suitable for internal use (Goedkopp & Spriensma, 2000).
3.5 Interpretation of results After the environmental impact assessment, the results should be interpreted. This is done in order to evaluate the results and the limitations contained within the results. The interpretation process is also a way of drawing conclusions from the results and putting forward recommendations. The interpretation also involves evaluating the quality of the data that the study has used. There are several ways of handling uncertainties regarding data quality. Two of these are uncertainty analyses and sensitivity analyses.
3.5.1 Uncertainty analysis and sensitivity analysis An uncertainty analysis is used to highlight uncertainties that exist in the three phases of an LCA: goal and scope, inventory and environmental impact assessment (Rydh, et al., 2002). The first phase contains uncertainties regarding the actual use of the product, such as service life, limitations and usage patterns. The second phase relates to uncertainties surrounding the collection of data, and the third phase encompasses uncertainties regarding characterisation factors and weighting. An environmental impact assessment can be said to cover all the stages from classification to weighting.
A sensitivity analysis is based on the structure of the model and/or parameter values varying on the basis of different hypotheses (Gustafsson, et al., 1982). The purpose is to see whether the model and selected parameters are reasonable and can also result in identification of the areas that require additional focus. This can be done by setting up a number of scenarios that are relevant for the study (Rydh, et al., 2002). The scenarios might relate e.g. to various process changes or changes to parameters.

20

21
4 Previous studies of floor care There are two reasons for presenting previous studies within floor care in this study. Firstly, to highlight the problems that exist when comparing floor care methods, and secondly to present the studies that have contributed data and lines of thought on which this study is based in part. In other words, there are more studies than those that are used in this study.
The previous studies that have been relevant for this study can be divided into various groups:
• studies that have focused on the indoor climate and the working environment
• studies that have focused on floor materials from a life cycle perspective
• studies of floor care from a life cycle perspective
• studies of floor care from a health and working environment perspective
4.1 Identification of previous studies Most of the earlier studies that have been used in this study have emerged through searches in library catalogues and scientific journals. Searches in library catalogues have helped in identifying literature that has subsequently been used. The scientific journals that have been selected for the purpose of studying floor care from a life cycle perspective are the “International Journal of Life Cycle Assessment” and the “International Journal of Cleaner Production”. In order to cover floor care from a health perspective as well, an article from the journal “Clinical Reviews in Allergy & Immunology” has been used. Studies carried out by the Swedish Environmental Protection Agency and Nordisk Miljömärkning have also been used to supplement the overall view that an LCA entails.
4.2 Studies of floor materials The idea behind reviewing previous LCA studies of floor materials is to generate an understanding of how common it is to include the actual floor care process in the overall life cycle. Has the floor care process been included, how has this been done and how has the use of chemicals been demarcated or calculated?
In “Comparative Life Cycle Assessment of flooring materials: ceramic versus marble tiles” published in the Journal of Cleaner Production 10, two different floor materials, ceramics and marble, have been compared from a life cycle perspective (Nicoletti et al., 2002). The conclusion is that marble has less of an environmental impact. However, the study has been entirely demarcated from the user phase, which means that all the impact of floor care and floors’ differing needs for floor care have been completely ignored.
In “Life cycle Assessment Study on Resilient Floor Coverings” published in the International Journal of Life Cycle Assessment 2, different floor materials were compared from a life cycle perspective (Günther & Langowsko, 1997). In this study, the floor’s usage phase was handled as a separate system, with reference for example to the fact that the manufacturer of the floor cannot influence the usage phase in the same way as other phases in the floor’s life cycle. The study did not look at the symptoms of sick buildings, referring to a lack of toxicity data for many substances. The study came to the conclusion that the floor care during a floor’s life can require more energy and water consumption than required in the manufacture of the floor.

22
In “Life cycle analysis of floor materials” issued by the Swedish Council for Building Research, three different floor materials have been studied from a life cycle perspective (Jönsson et al., 1994). The study does not include maintenance in the actual life cycle assessment, rather being based on the assumption that the different floors employ similar floor care, and that these cancel each other out in terms of assessment. The reason for the environmental impact of maintenance not being included more clearly in the study is that “the recommendations from the floor manufacturers and manufacturers of cleaning substances would give an overly uncertain picture of the actual situation” (Jönsson et al., 1994). However, the study maintains that cleaning and maintenance have a significant environmental impact, and that continued research is required. The Swan labelling of floor care agents is considered to be a step in the right direction. It also emerges in the study that mopping is performed to a greater extent than necessary. This may be positive from a hygiene perspective, although perhaps not from an environmental perspective (Jönsson et al., 1994).
In “Livscykelanalys av industrigolv - En jämförande studie av HTC SuperfloorTM och ett epoxigolv” [“Life cycle assessment of industrial flooring – A comparative study of HTC Superfloor™ and an epoxy floor”], published at Linköping University, two floors are studied from a life cycle perspective, an epoxy floor and an HTC Superfloor™ (Hellström, 2006). The conclusion demonstrates that HTC Superfloor™ has less of an environmental impact from a life cycle perspective than the epoxy floor. Maintenance is calculated on the basis of the restoration work carried out for the floors. Frequent care and periodic maintenance are not included, as they are not considered to be harmful to the environment.
4.3 Studies of floor care from a life cycle perspective By studying previous LCA studies of floor care, the focus has been on how the floor care process has been calculated and how the use of chemicals has been demarcated or calculated.
“Miljöpåverkan av golvvård” [“Environmental impact of floor care”], published by the Royal Institute of Technology, looks at the importance of including the environmental impact of floor care during the usage phase in the floor covering’s life cycle (Lundblad, 1994). The conclusion was that floor care during the usage phase could have a greater environmental impact than during the production phase, depending on the demands for floor care that are stipulated in order to retain the quality of the floor. This means that floor care should be included in the overall life cycle assessment of a floor, according to Lundblad (1994). At the same time, it is predicted that floor care agents will be developed, moving towards greater environmental requirements and ecolabelling of floor care products in order to guide the market. The properties of carpets will also be developed, resulting in a reduction in the environmental impact caused by the chemicals.
In “The Maintenance of Linoleum and PVC Floor Coverings in Sweden” published in the International Journal of Life Cycle Assessment 8, two different floor care methods are compared on the basis of several scenarios (Paulsen, 2003). One is a polish-based method and the other a wax-based method. The results show that the wax-based floor care method was considered to be better than the polish method in several cases, depending on the chosen cleaning method. The report supplies data, primarily regarding energy and the environmental impact of chemicals calculated on the basis of the dry substance. As a further development, a method for the quantitative assessment of floor care chemicals is required. The study is based on an earlier thesis by Paulsen (1999), which is more comprehensive regarding how the results have been calculated. The thesis maintains that the need for environmental product declarations for cleaning materials and machines can lead to improved data. Some data have been taken from the thesis for use in this study.

23
In “Life cycle Assessment of Water-based Acrylic Floor Finish Maintenance Program”, published in the International Journal of Life Cycle Assessment 13, two floor care methods have been studied (Thabrew et al., 2007). One method is based on a zinc-based floor finish and the other on a non zinc-based floor finish. The results of the study showed that the life cycle of the zinc-based floor finish contributed with a lower environmental impact, as a consequence of a reduced need for frequent floor care. Unfortunately the study does not include a detailed account of the chemicals that were used. Furthermore, the majority of the assumptions do not correspond with the assumptions made in this study.
The factor that distinguishes “Life cycle Assessment of Water-based Acrylic Floor Finish Maintenance Program” was that the study gave consideration to the time of the day at which floor care was carried out (Thabrew et al., 2007). The study was based on the fact that the premises in question, which were not used by personnel at night, were switched to energy-saving mode (with reduced temperature and reduced lighting). At the times when floor care was carried out in the premises at night, the premises could not be switched to energy-saving mode.
By comparing the increased energy consumption required by the premises in order for floor care to take place at night with the overall environmental impact of the floor care processes from a life cycle perspective, it was ascertained that the majority of the environmental impact from the floor care process came from the fact that the energy-saving mode could not be used. The conclusion of this comparison was that the development of floor care methods should focus on increasing the time interval between floor care sessions (Thabrew et al., 2007).
4.4 Studies of floor care from a working environment and health perspective
Applying a working environment and health perspective to a study relating to a life cycle perspective is not obvious. The reason for doing so in this study is to see whether working environment or health aspects can carry greater weight than environmental arguments or actually reinforce them.
In “Miljöbedömning av byggmaterial under brukarperioden” [“Environmental assessment of building materials during the usage period”], published by SP Technical Research Institute of Sweden, paint and floor materials have been studied with regard to the emission of volatile organic compounds to the surrounding environment (Johnson, 1995). In the study, the impact of care and maintenance have been excluded from measurements. The reason for this exclusion is that the cleaning products differ as regards the emission of various substances. However, it is pointed out that office cleaning products can make a significant contribution. For example, it is mentioned that a school with a floor area of 10,000 m2 consumes more than a tonne of cleaning chemicals per year (Johnson, 1995).
In “Airborne Environmental Injuries and Human Health”, published in Clinical Reviews in Allergy and Immunology, a review of data regarding a number of illnesses related to airborne particles is presented (Borchers et al., 2006). The study observes that volatile organic compounds cannot be linked directly to sick buildings, but that together with ground-level ozone and other chemicals they can give rise to similar symptoms. By analysing 29 public buildings on the basis of the health effects that can be caused by spending time in these premises, it was observed that the cleaning products and water-based paint that are used in the buildings were responsible for the majority of the negative health effects related to eye, nose, throat and skin symptoms.

24
In “Belastningsarbetsskador vid städning” [“Repetitive strain injuries during cleaning”] issued by the Swedish Environmental Research Institute, a study was conducted into how different cleaning activities can contribute to attrition injuries (Antonsson et al., 2006). It emerges in the report that periodic cleaning is laborious and hard for the person doing it. It is also highlighted that working alone represents a safety risk and that some activities are so heavy that two people are required.
In “Sjuk av att vara inne?” [“Sick of being indoors?”], causes that can result in “sick building symptoms” are analysed, as well as how they can be prevented (Björk & Eriksson, 2000). “Sick building syndrome” is a collective name for symptoms that arise when people spend time in certain buildings. The person often experiences the symptoms when they are in the building, but the symptoms disappear when the person leaves it. When it comes to floor care, the authors are working on the basis of the dirty water being transported to the treatment plant through the drains; it consequently has to be biodegradable, and the chemicals must not be harmful to the user either. It is also maintained that suppliers of cleaning chemicals want to satisfy the user’s wishes to carry out floor care on different types of floor in the same way.
4.5 Studies of environmental criteria The purpose of including other studies of environmental criteria is primarily to see whether the results of this study’s LCA stand up in comparison with e.g. other ecolabelled products within floor care.
In “Miljöanpassad upphandling i praktiken” [“Environmentally adapted procurement in practice”], issued by the Swedish Environmental Protection Agency, 270 procurements by local authorities, county councils and governmental authorities have been examined (Sjöholm & Sunnermalm, 2007). In total this related to 27 different products and services, of which cleaning and office cleaning constitutes one. There were a total of ten procurements relating to cleaning and office cleaning in the study. The results show that all the procurements stipulated some form of environmental requirement, and that the procurements have given consideration to the environment. This has been achieved by placing some form of environmental requirement on the products used, either through ecolabelling or by them containing levels of chemical products that are as low as possible. In five of the procurements, mandatory requirements were placed on the supplier. For example, the Swedish National Audit Office stipulated execution conditions whereby the use of chemical and allied products should be reduced or entirely avoided and that cleaning methods that facilitate cleaning without chemicals should be used in the first instance (Sjöholm & Sunnermalm, 2007).
“Granskning av kriteriearbete för rengöringsprodukter i Svanenmärkningen” [“Examination of criteria work for cleaning products in relation to the Swan label”], issued by the Swedish Environmental Research Institute, aims to examine the Swan ecolabel’s criteria for eight cleaning products and to assess these criteria in relation to the ISO series that applies to LCAs (Lindfors, 1999). The study clearly shows that the Swan label does not live up to the ISO standard in several respects. This relates primarily to the absence of transparency and a relevant environmental impact assessment, as well as the fact that the Swan has a life cycle perspective that ends after the manufacture phase. According to Lindfors (2008), there is reason to assert that the conclusion of the report is still relevant.
4.6 Previous studies of Twister™ The Twister™ method is a relatively new product, although studies have already be conducted with regard to it. In “Miljöaspekter på golvvård” [“Environmental aspects of floor

25
care”], issued by the Swedish Society for Nature Conservation, the Twister™ method is compared with floor polish and wax (Alexandersson, 2006). The study focuses on the amount of chemicals that would not be required if the Twister™ method was used instead of polish and wax. In the study, no consideration has been given to the service life, function, working environment or distribution in the assessment of floor care method. To some extent, this study has used data taken from “Miljöaspekter på golvvård”.

26

27
5 Objectives and scope This chapter clarifies the starting point for the life cycle assessment of the Twister™ method based on the purpose of the study.
5.1 Functional unit The functional unit is set at “keeping clean one square metre of floor per year”. As clean is a qualitative measure, this study is based on the compared floor care methods managing to deliver equivalent results as regards cleanliness and that correspond with established customer requirements.
5.2 Limitations When an LCA is carried out, it is necessary for several limitations to be implemented. It is therefore important to present both what is included and what is not included. This LCA has focused on the following fractions:
• Production of materials and components that make up the Twister™ pad
• Transport of these materials and components, including packaging
• Energy consumption in the manufacture of the Twister™ pad
• Production of materials and components for a scrubbing machine, which is used during floor care with Twister™
• Production of a dry mop, which is used prior to floor care with Twister™
• Use of resources in the reuse of the dry mop
• Use of resources in the implementation of floor care with Twister™
• Estimated waste management for a used Twister™ pad
As the purpose has been to produce an LCA of the product that HTC supplies, the focus has been on the Twister™ pad. The Twister™ pad can be affixed to different types of scrubbing machine. The scrubbing machine on which this study is based is considered to be representative of the market. The same applies to the dry mop. For this reason, data relating to the scrubbing machine and dry mop are based on data from earlier studies.
During the course of the study, several perspectives have been developed regarding how different functions and processes are linked to the life cycle. To ensure that these perspectives do not increase the scope of this study, they have been demarcated in certain cases.
The factors that the life cycle does not take into consideration:
• The study does not give consideration to economic aspects, time aspects or aspects linked to the premises in which the materials for floor care are produced or used or in which the floor care process and its waste management take place.
• Alternative suppliers of materials for the Twister™ pad, which could e.g. alter the length of transport distances.

28
• Transport of the Twister™ pad or its packaging from HTC Sweden AB to any retailers or consumers.
The fact that transport to retailers or consumers is not included is due to the fact that this is specific in each case; in addition, this study does not want to be tied to existing customers.
5.2.1 System boundaries Based on the limitations, the system boundaries have contributed to making the study manageable. The adjustments that the system boundaries have generated have related to the handling of data that have emerged during the inventory, the models that the software employs, as well as the databases contained in the software. These restrictions are described below.
Restriction in relation to natural systems – This study is based on all products and materials that are used being manufactured from virgin raw materials. As a consequence, the results may change if recycled materials are used instead of virgin raw materials. The restriction is laid down as it is unclear whether the suppliers of materials and components use recycle materials.
Demarcation in relation to the life cycle of other products – This study focuses primarily on Twister™. Through the use of databases, however, it is possible to use the life cycles of other products and processes. When it comes to scrubbing machines and mops, however, this study has been restricted to materials and energy consumption during production, as the focus has been on the Twister™ pad.
Geographic restrictions – The geographic restrictions that can be of the greatest significance in this study relate to where the energy-intensive production takes place. In cases where production and process are deemed to take place in Sweden, Swedish electricity average has been used. For the production of industrial diamonds, the Irish electricity average has been used. Both the utilisation of the Twister™ method and waste management are calculated on the basis of a Swedish perspective.
There are also several geographic restrictions linked to the choice of databases, which is due to the fact that the software is Dutch. The majority of the calculation data contained in the databases is based on previous studies carried out in countries other than those that are relevant to the production of the Twister™ method and other products that are required in floor care.
Time restriction – The study focuses on floor care over the course of one year, although it has used data from previous studies that have been calculated on the basis of a floor’s lifetime, which corresponds to 20 years (Paulsen, 1999; Paulsen, 2003). As regards the lifetime of the products that are used in floor care with the Twister™ method, the lifetime of the scrubbing machine can be called into question. This is because new scrubbing machines may have been developed that have a lower environmental impact than the one currently in use. The Twister™ pads to which this study refers have been calculated on the basis of current data gathered from suppliers and users. If the production of subcomponents or the manufacturing phase of the Twister™ method should change, the results will also change. As a result, data to which this study refers may change during the lifetime of the floor. At the same time, it is reasonable to assume that there are no major changes during the period specified in the purpose of this study.
Technological coverage – Data for the Twister™ method are based on data collected during 2008. No analysis has been performed regarding how the data have been collected from suppliers and users. When it comes to data concerning the actual floor care process, the data

29
derive from previous studies that are a few years old. The studies carried out by Paulsen (1999; 2003) have been confirmed as still being relevant, although it should be added that if the environmental impact of chemical usage is included, the results of the studies would indicate a greater environmental impact (Paulsen, 2008). At the same time, the age of the data contained in the databases varies. The topicality of the databases is related to version of the program that is being used. Newer versions have more developed databases, although this does not necessarily mean that older versions contain incorrect values.

30

31
6 Inventory This chapter begins with a brief description of how data are collected, followed by a presentation of the various data and how they have been used.
6.1 Collection of data When collecting data, several different sources have been searched and used. This is both because individual sources have not been able to supply data for the entire life cycle, and in order to confirm data that has been considered uncertain. It can generally be said that the aim has been to search for data as close to the source as possible, i.e. suppliers and contact people at contacted companies. In those cases where it has not been possible to identify data relating to materials or processes, educated guesses have been made or secondary data of varying levels of quality have been used. In those cases where this study is comparable with earlier studies, data from these have been used to facilitate a possible comparison of results.
6.1.1 Materials supplied Studies carried out for HTC have been supplied by the company and include Alexandersson (2006) and Hellström (2006). Theses have constituted a basis in the formulation of a functional unit and the identification of important aspects, as well as contributing with data.
6.1.2 Questionnaires The supplied material, as well as studying previous studies relating to floor care and the manufacture of floors, made it possible to create a basic questionnaire that was sent to HTC. The questionnaire was a first step towards laying the foundations for the collection of data. Due to certain questions remaining and new questions arising, an additional questionnaire was created. In addition to the questionnaires, telephone interviews and e-mail have been used.
6.1.3 Interviews and e-mail Brief telephone interviews have been conducted, in part to gather data, but also to clarify various uncertainties that have been identified in earlier studies or to see whether the conclusions of earlier studies are still valid. The focus has not been on the actual implementation of the interview, and for this reason the interviews have not been recorded or transcribed; only notes have been used. The aim of the interviews has always been to move the study forwards by obtaining data, process descriptions or confirmation that data have been used correctly. This applies both to telephone interviews and e-mail. In those cases where an interview or e-mail forms the basis for an assertion, the contact person is noted, before subsequently being presented further in the references.
6.2 Inventory of Scenario Twister™ This section describes the various products and processes that are required when using the Twister™ method. The scenario is based on frequent floor care taking place 122 times a year (every three days). This ought to be sufficient to satisfy the quality requirements that are stipulated regarding the functional unit.
Under some of the products and processes, several different alternatives are presented regarding how they can be calculated. It should be pointed out that the Twister™ method in

32
this study means that two Twister™ pads have been used (Lundin, 2008). The transport route for each material is described under the relevant material, while the total inventory of transport is described in section 6.3.4. The supporting data that are presented under each heading are those that are used in Scenario Twister™ and that are described below. An overview of the actual model can be seen below in Figure 1.
Figure 1. Model of Scenario Twister™
6.3 Manufacturing phase The manufacture of a Twister™ pad takes place by spraying one side of a pad with industrial diamonds and binding agent. The pad is baked in an oven to get the binding agent to cure (Alexandersson, 2006). All the components for the Twister™ pad are bought in and transported to HTC in Söderköping. The transport of the components also entails the transport of each component’s packaging.
6.3.1 Industrial diamonds The industrial diamonds are purchased from the company Element Six and are delivered from Ireland to HTC. The diamonds are transported by sea from Ireland to Göteborg and then by lorry to Söderköping (HTC, 2008).
When this study was launched there was no data regarding the environmental impact from the production of industrial diamonds at the supplier Element Six (Homanen, 2008). As a result of this study, the gathering of data regarding the industrial diamonds has been speeded up so much that it has been possible to use the supplier’s information (Bozzonni, 2008). The alternative would have been to use an economic model to calculate any environmental impact on the basis of energy consumption. This would have been less reliable than the data that have now been used, as a product price includes items such as a profit margin, fixed costs and wages. In other words, the data that form the basis for industrial diamonds are more realistic than an economically calculated environmental impact.
In this study, the environmental impact of the industrial diamonds has been based on the material being graphite with a yield in terms of weight of 1:1 and an energy consumption during manufacture of 0.84 kWh/gram (Bozzoni, 2008). In order to calculate the environmental impact of the energy consumption, the energy has been based on the Irish electricity average (IEA, 2005).
Scenario Twister™
Manufacture of Twister™
Manufacture of reusable mop
Manufacture of scrubbing machine
Waste management Twister™
Use of
reusable mop
Use of
scrubbing machine
Industrial diamonds
Pads
Binding agent
Transports
Energy use

33
6.3.2 Pads The manufacture of the pads has been limited to the actual production of the material. The energy consumption that may be required for phasing out the material for the actual pad has not been taken into consideration, and no waste has been included either. The pad consists of polyester and weighs 170 grams (Alexandersson, 2006). The pads are shipped from the USA to Göteborg, from where they are transported by lorry via Jönköping and Norrköping to Söderköping (HTC, 2008; Jacobson, 2008). As there is no information about where in the USA the transport originates, it has been assumed that transport takes place from New York in Scenario Twister™. The choice of New York as the dispatch location is based on the freight routes that exist between Göteborg and the USA (Farnel Capital, 2008).
6.3.3 Binding agent Several chemicals are used in the production of the Twister™ pad. The chemicals are used to bind the industrial diamonds to the pad and to make it easier to determine when it is time to replace the pad (by means of the colour being worn down) (Alexandersson, 2006).
For reasons of confidentiality, the various chemical components that are required in the production of the Twister™ pad have been amalgamated to the term binding agent.
When applying the gathered data regarding the binding agent, several areas of uncertainty have emerged. One reason is that the product name is a sales name that does not always describe the content.
In those cases where it has been possible to identify the chemical constituents precisely, difficulties have been experienced in the actual implementation in the model. These difficulties are primarily due to restrictions in databases. For this reason, the chemicals that make up the binding agent have been handled as follows:
• All chemicals have been traced to the supplier, and the transport that the chemicals require has been implemented in the model.
• The chemicals that could possibly have a significant environmental impact have been implemented to the degree permitted by the databases.
• The chemicals that have been identified as having little environmental impact and/or that have been too difficult to implement in the model, due to deficiencies in the databases, have been calculated on the basis of their transport.
This method of dealing with chemicals has resulted in this study focusing on phenol (Frischknecht et al., 1996). In addition, the transport required by all the chemicals has been calculated. From a calculation perspective, it has been assumed that the chemicals have been transported from Kolding, Denmark by lorry to Söderköping, and from Devon, England by ship to Göteborg and then by lorry to Söderköping.
6.3.4 Transport Two tools have been used to calculate the freight distance. The first, Google Maps Sweden (Google 2008 – Map data 2008), has been used in the calculation of transport by road, and the other, SeaRates (Farnel Capital, Inc), has been used for transport by sea. The study has focused solely on the transport of materials for the production of the Twister™ pad. However, the distribution of the Twister™ pad and any transport of scrubbing machines has not been taken into consideration. This can be extremely important, as the scrubbing machine weighs 800 kg and is large and bulky to transport.

34
In those cases where it has been possible to identify the starting point for the transport, this has been selected and Söderköping has been specified as the destination. In some cases a number of different means of transport are employed, and the products have to be reloaded several times.
Table 1 shows the distance and the transport method that has been used in the calculation. It has been possible to trace transport on land to the extent that the distance to any reloading is included (Jacobson, 2008). All distances have been converted to kilometres. The chemicals have been added together after being calculated individually in order to ensure that the individual chemicals are not apparent. Table 1. Data for transport
Material Origin By road By sea Diamonds Ireland 331 km 1.685 kmPads USA 331 km 6.354 kmChemicals Varies 720 km 1.260 km
When collecting data for this study, it was ascertained that the packaging in certain cases weighed as much as or more than the actual product being transported. For this reason, the weight of the packaging has been added to the weight of the product when calculating the impact of transport. In most cases HTC has been able to reuse the packaging, for example in the case of loading pallets. As a result, it has been assumed that the packaging does not itself have any additional environmental impact. Table 2 presents the various weights of the materials, including packaging, per Twister™ pad. Just as with transport, the chemicals have been added together after having been calculated separately. Table 2. Weight including packaging
Diamonds 2.38 km Pads 348.1 g Chemicals 30.36 g
By adding the weight of the various materials that make up the Twister™ pad together with the distance each material is transported, the unit kgkm is generated. As a result, all transport can be calculated on the basis of means of transport (see Table 3). Table 3. Transport
Vehicle kgkm Lorry1 134 Bulk cargo vessel2 2,218 1 BUWAL 250, 1998 2 Frischknecht et al., 1996
For obvious reasons, there are numerous areas of uncertainty regarding the environmental impact of transport. As LCAs are normally carried out on products and services, the transport of materials and components as well as waste management normally make up more than 5 percent of the total environmental impact, which can be used as a guideline in this study (Jørgensen et al., 1996).
In this study, the primary areas of uncertainty regarding transport relate to HTC engaging shipping companies to deliver materials from the suppliers and to send the finished products to customers and retailers. This means that the actual environmental impact caused by the transport is not under HTC’s control, but rather under the control of the shipping company.

35
HTC can use several different shipping companies, which means that a more accurate assessment would require more in-depth investigation.
Shipping companies often deliver to central warehouses and transport goods together for cost reasons, which can result in the transport distance being longer than estimated (Jacobson, 2008).
There can also be a lack of players on some transport routes, which can result in the viability of the chosen transport route being open to discussion. This applies above all to transport by sea.
6.3.5 Manufacture The Twister™ pad is manufactured in Söderköping. The process takes place as follows: the pad is first sprayed with chemicals, which are mixed with the industrial diamonds. After this the pads are baked in an oven in order to cure the chemicals. Finally the product is packaged in order to be sent to the retailer or customer. It is estimated that 0.27 kWh are required to manufacture a Twister™ pad (HTC, 2008). The energy is assumed to comprise the Swedish electricity average (BUWAL 250, 1998; Frischknecht et al., 1996).
As an oven is used to cure the binding agent and the diamonds on the pad, the energy consumption per pad can vary depending on how many pads are produced per round. One possible reason for this variation is the energy consumption that is required to heat up the oven to the correct temperature. In the study, the energy consumption for heating up has been deemed to be minor.
6.4 Usage phase The Twister™ method includes primary cleaning with a dry reusable mop in order to remove larger particles. After this a scrubbing machine is used, which in this case is expected to use two 17-inch Twister™ pads. The lifetime of a Twister™ pad depends on how many square metres a Twister™ pad can clean before it is deemed to be used. This is because the effective surface of the pads is worn down as the floor care process proceeds. The lifetime varies significantly depending on a number of factors, such as the floor material, the need for floor care, the season, etc. The way in which the floor care process proceeds has been described and confirmed by both Karlsson (2008) and Lundin (2008). When collecting data, however, various figures regarding lifetime emerged (see Table 4). In the basic scenario, the lifetime is deemed to be 35,000 m2. This figure is used in the marketing and selling of the Twister™ method (Karlsson, 2008). Table 4. Lifetime for a Twister™ pad
Source m2 Aquatech1 35,000 ISS Cleaning2 21,000 – 28,000 1 Karlsson, 2008 2 Lundin, 2008
6.4.1 Manufacture of reusable mop The Twister™ method begins with dry-mopping the floor to remove larger gravel particles. The materials and energy consumed in the manufacture of a reusable mop are presented in

36
Table 5 (Paulsen, 1999).

37
Table 5. Manufacture of reusable mop
Wood1 5 gPolyester2 5 gElectricity from oil3 0.136 MJElectricity from the Swedish electricity average4 0.153 MJ1 Franklin Assoc, 1998 2 Dutch bureau of emission registrations, 1992
3 BUWAL 250, 1998
4 BUWAL 250, 1998, 1996; Frischknecht et al., 1996
6.4.2 Use of reusable mop A reusable mop is estimated to be sufficient to clean 900 m2 before needing to be washed, and after 100 m2 it is assumed to require vacuum-cleaning with a 1,000 W vacuum cleaner for 30 seconds. Washing of the mop is calculated on the basis of the detergent’s dry weight. Table 6 presents the materials and the energy that are required when using a reusable mop to clean one square metre. All the data for reusable mops and consumption of resources during dry mopping are taken from Paulsen (1999). Table 6. Resource consumption during dry-mopping
Resource Per m2
Mop usage 1.11*10-07 timesWater consumption during washing1 3.50*10-03 litresEnergy consumption, washing2 4.86*10-04 MJEnergy consumption, vacuum cleaning2 4.94*10-03 MJ1 Københavns Vand, 1999 2 BUWAL 250, 1998, 1996; Frischknecht et al., 1996
6.4.3 Scrubbing machine The Twister™ method assumes the use of some type of scrubbing machine. The Twister™ pad is available in several different sizes, depending on the scrubbing machine with which it is to be used. In this study, the scrubbing machine has been estimated to correspond to a Taski Combimat 4000. This is a combined machine that can be assumed to be representative of the larger machines on the Swedish cleaning market (Paulsen, 1999).
The machine is made of HDPE plastic and steel, and has a lead battery (see Table 7). As the service life of a scrubbing machine differs from that of other equipment used in floor care, the application of the scrubbing machine in the model has been handled in two ways. Firstly, the calculation regarding the scrubbing machine has been based on an economic depreciation period of 8 years. Secondly, the calculation has been based solely on consumables, thereby excluding the scrubbing machine.
The economic perspective has been used to make the environmental impact of the scrubbing machine manageable and to demonstrate how well the scrubbing machine does in comparison with other components that the Twister™ method requires. The viability of calculating on the basis of economic depreciation is open to discussion, as economic aspects can have restrictions other than environmental aspects.
The choice of solely calculating consumables and hence excluding the scrubbing machine from the life cycle is based on the fact that HTC cannot influence which scrubbing machine the customer uses, and that were the scrubbing machine to have a major impact, the viability of the rate of depreciation could be questioned. As a result, excluding the scrubbing machine should contribute to focusing on the method that HTC supplies and not on the scrubbing machine that is used to execute the method. It should be pointed out that excluding the

38
scrubbing machine does not entail excluding the resources that are required in the use of the scrubbing machine. Table 7. Taski Combimat 4000
Steel1 215 kgHDPE2 144 kgLead3 441 kgSwedish electricity average4 28045 MJ1 Frischknecht et al., 1996 2 BUWAL 250, 1998 3 Frischknecht et al., 1996 4 BUWAL 250, 1998, 1996; Frischknecht et al., 1996
6.4.4 Use of resources when cleaning with a scrubbing machine The scrubbing machine is estimated to consume one decilitre of water (which becomes dirty water as a result of the cleaning process) and 0.01 MJ per square metre of clean floor (Paulsen, 1999, Table 52; Karlsson, 2008). Energy consumption is calculated according to the Swedish electricity average. The scrubbing machine is calculated on the basis of being used every three days all year round, and of cleaning an area equivalent to 10,000 m2 each time. The service life of a scrubbing machine is set according to an economic depreciation period of 8 years (see Table 8). Water and energy consumption during cleaning are reported separately from now on in order to make it easier to compare the results. Table 8. Use of resources when cleaning with a scrubbing machine
Resource Per m2
Scrubbing machine 1.03*10-07 timesWater consumption1 0.1 litresEnergy consumption2 0.01 MJ1 Københavns Vand, 1999 2 BUWAL 250, 1998; Frischknecht et al., 1996
6.5 Waste management The waste from the Twister™ method can be divided up into three fractions: mop, dirty water and cleaning pad. Waste management is something that HTC cannot at present control. One way of solving part of this issue is for HTC to collect used Twister™ pads at the same time as delivering new ones. However, the consequences of such an action are so complex that there is not room for it in this study.
The reusable mop is reused after having been washed, which is described above. The variation in the content of the dirty water depends on what type of dirt was on the floor, and will not be considered further in this study.
The cleaning pads are discarded with other coarse waste, and are subsequently handled as normal household waste (Sjögren, 2008). The coarse waste is then transported in a 28-tonne lorry with an estimated transport distance of 30 km to an incineration facility (BUWAL 250, 1998). The assumption that a used Twister™ pad is incinerated is reasonable as long as the geographic restriction is set as Sweden.
In this study it has been calculated that the cleaning pad corresponds to the energy recovery when incinerating polyethylene of the same weight as the pad. Incineration has been calculated on the basis of an efficiency level of 90% and with an energy content of 43 MJ/kg (Tillmann et al. 1991). No emissions have been included in the calculation, as incineration is

39
assumed to take place through co-burning of other fractions. The energy that is recovered is expected to be used in district heating systems for homes, services, etc., and replaces a corresponding amount of energy from biofuels, in this case biomass from forests (BUWAL 250, 1998). The environmental impact of waste management is presented in
Table 9. The decision to allow a Twister™ pad to replace the corresponding energy quantity of biofuel during incineration is linked to the precautionary principle.
The precautionary principle in this case means that when there is uncertainty, calculations should be based on technology that is not the latest or the most environmentally friendly. For example, the amount of energy that is recovered when incinerating used Twister™ pads is replaced by energy at the margin (oil or coal). Based on the precautionary principle, any production of electricity during incineration has been ignored as not all heating plants can achieve this. For this reason, the result that emerges from the modelling process can indicate an environmental impact that is higher than is actually the case. This is because material and energy recycling that are better than the calculated figures can contribute to reducing the need for other material or energy sources, giving rise to a larger environmental impact.
Table 9. Waste management of Twister™
Resource Per Twister™Lorry1 30 kmIncineration of biofuels1 38.7 MJ1 BUWAL 250, 1998
6.6 Other scenarios In order to compare Twister with floor care methods that are based on polish or wax, two scenarios have been created in addition to Scenario Twister. These are Scenario Polish and Scenario Wax.
6.6.1 Scenario Polish This scenario is based on the floor having been treated with polish and on the frequent care being performed with a general detergent and a cleaning machine. The periodic maintenance takes place once a year, and the frequent cleaning takes place three times a week. Data have been taken from a previous study by Paulsen (2003), but with the difference that here they have been converted to match the functional unit in this study. The scenario includes only energy consumption, and does not take into account any environmental impact to which the chemicals may give rise when they are used in frequent care or periodic maintenance. Data for the manufacture of machines used in frequent care and periodic maintenance are also based on energy consumption. Data for this scenario is presented in Table 10.
Table 10. Input data for Scenario Polish
Parameter Energy (MJ)1 Frequent care 3.11Periodic maintenance 6.50Manufacture of machines 0.461 BUWAL 250, 1998; Frischknecht et al., 1996

40
6.6.2 Scenario Wax This scenario is based on the floor having been treated with wax and on frequent care taking place by means of the floor being scoured with a recyclable mop and a wax-based detergent. The periodic maintenance takes place once a year, and the frequent cleaning takes place three times a week. Input data have been taken from a previous study (Paulsen, 2003), but with the difference that here they have been converted to match the functional unit in this study. The scenario includes only energy consumption, and does not take into account any environmental impact to which the chemicals may give rise when they are used in frequent care or periodic maintenance. Data for this scenario is presented in Table 11. Table 11. Input data for Scenario Wax
Parameter Energy (MJ)1 Frequent care 12.75Periodic maintenance 0.69Manufacture of machines 0.141 BUWAL 250, 1998; Frischknecht et al., 1996
6.6.3 Uncertainties regarding Scenario Polish and Scenario Wax When creating Scenario Polish and Scenario Wax, efforts were made to ensure that the results would help to highlight the differences between the scenarios on the one hand and Scenario Twister™ on the other. To begin with, it was therefore desirable to use the same data for mopping and scrubbing machines if possible. However, this was changed as data for the scenarios was taken from Paulsen (2003) and not Paulsen (1999). With this, the potential to apply the same values for scrubbing machines used in Scenario Twister™ as in these scenarios was lost. This problem has been dealt with in two ways, as mentioned in section 6.4.3. As a result, Scenario Polish and Scenario Wax are calculated on the basis both of the manufacture of machines being included, and of the manufacture of machines being excluded.
The difference between Paulsen (1999) and Paulsen (2003) is that in the latter case, the data for floor care equipment, such as scrubbing machines and mops, is not sufficiently transparent to compare all the scenarios in this study. One thing that can be seen from the data taken from Paulsen (2003), however, is that the manufacture of the machines that are required for floor care with polish or wax constitutes a smaller proportion than the energy volume consumed during the frequent care or periodic maintenance.
For Scenario Polish and Scenario Wax, the environmental impact of the chemicals has also been calculated on the basis of energy consumption during the manufacture and transport of the chemicals. However, the actual environmental impact of the chemicals during usage and waste management has not been taken into consideration. This means that Scenario Polish and Scenario Wax have a lower calculated environmental impact than is actually the case. (Paulsen, 2008)
As both scenarios are calculated from an energy perspective, there is no reason to break them down any further. Such a breakdown would only present the environmental impact of the Swedish electricity average, and not that caused by floor care with the respective methods.

41

42
7 Environmental impact assessment This chapter contains the combined results of the environmental impact assessment based on the data contained in previous chapters. The chapter starts with a description of how this environmental impact assessment has been conducted and how it will subsequently be reported, as well as a presentation of areas of uncertainty that must be taken into consideration regarding databases. This will be followed by three sections presenting the actual results of the environmental impact assessment. The first is a comparison between the Twister™, polish and wax floor care methods. The comparison is based both on the machines required by the floor care methods being included and on these machines being excluded. After this there will be a breakdown of Twister™, to demonstrate which part of Twister™ has the greatest environmental impact. The third section is an analysis of the Twister™ pad, in order to demonstrate which material or process during manufacture has the greatest impact.
The environmental impact assessment is performed on the basis of a damage assessment. The values for the damage assessment can be found in Appendix 1 – Damage assessment. In order to facilitate and clarify the results of the modelling process, the results are presented as percentages, both in table form and in diagrams, with the focus on the damage assessment’s categories.
7.1 Modelling and description of the software The majority of the work in this study relates to generating a model to describe the systems that make up floor care. The model has been created in the program SimaPro 7.0. The program can use several LCA methods; in this study Eco 99 has been used. Data for the various methods, and hence the various damage models, can be found in several different databases contained within the program.
The choice of method is established after a trial run of the software and on the basis of the databases on which the software is based, as certain methods are better developed for specific databases. Section 6 indicates which database has been used for each product and process.
Eco 99 uses three damage categories: Human health, Ecosystem quality and Resources. A more detailed description of the method and its damage categories and their respective units can be found in Appendix 2 - Eco-indicator 99.
The results from the simulation in the program have been exported to Microsoft Office Excel 2003 in order to present the results in table and diagram form.
7.2 Uncertainties in the use of databases When implementing modelling with databases, compromises are necessary. These compromises usually relate to the selected material from the database corresponding with the existing material. At the same time there are deficiencies in the databases, as these are built up from previous studies.
In order to ensure the validity of the modelling and the databases used for this study, there has, during the modelling process, been active comparison of various databases and the viability of the values that the relevant databases have used. This comparison has taken place primarily on the basis of information about the database and how classification has taken place, at the same time as using some trial-and-error methodology. This has resulted for

43
example in the database that was selected from the beginning, which was the foundation for the calculation of the Swedish electricity average (BUWAL 250, 1998), being supplemented with even more correct values relating to Swedish nuclear power (Frischknecht et al., 1996).
In other words, databases should be amalgamated when using software that handles LCAs in order to highlight the most unrealistic values and to supplement those that are absent.
The modelling of transport has been the area relating to databases whose viability has been the most difficult to assess. Modelling of transport stipulates demands for knowledge about which type of vehicle has been used for the transport and from which database the values for the vehicle have been taken. Consideration must also be given to whether combined transport takes place or not. One way of managing this is to allocate the impact of transport on the basis of weight (Rydh et al., 2002). Allocation entails that the emissions to which the materials and energy consumption give rise are distributed between processes that are shared between products. In this case, the weight of the material that is transported has been linked to an assumption regarding the proportion of the total transport load that the selected material comprises. This has been done by means of the goods that have been transported by sea being given an allocation of 50 percent of the total environmental impact that freight with bulk load vessels encompasses, and goods that have been transported by land being given an allocation of 40 percent of the total environmental impact that freight with lorries encompasses (Frischknecht et al., 1996). The fact that the allocation is linked to weight and not to volume contributes to the uncertainty, as the pad is relatively light, yet at the same time is bulky.
7.3 Comparison between the scenarios In this section, the various scenarios are presented in comparison with the situation in the reference scenario, Scenario Twister™. The results are divided into two parts. The first part is a comparison between the scenarios including machines, in which the results are presented in Figure 2 and
Table 12. The second part is a comparison between the scenarios based solely on consumables, in which the results are presented in Figure 3 and Table 13. The figures are a graphic representation of the tables. This is followed by a brief analysis of what the results show.
The analysis is divided up according to scenario and describes first the results based on the comparison between the scenarios including the machines, and then the results based on the comparison between the scenarios excluding the machines (based on consumables). To avoid confusion, no comparisons will be drawn in this chapter between the various results based on the different calculation methods. However, it must be pointed out that figures and tables can generate the illusion that the environmental impact is increasing when only consumables are compared, which is not the case.

44
0%
50%
100%
150%
200%
250%
300%
350%
400%
Scenario Tw ister™ Scenario Polish Scenario Wax
Human Health Ecosystem Quality Resources
Figure 2. Damage assessment of the Twister™, Polish and Wax scenarios, including machines
0%
100%
200%
300%
400%
500%
600%
700%
800%
900%
1000%
Scenario Twister™ Scenario Polish Scenario Wax
Human Health Ecosystem Quality Resources
Figure 3. Damage assessment of the Twister™, Polish and Wax scenarios, consumables only

45
Table 12. Damage assessment of the Twister™, Polish and Wax scenarios, including machines
Damage category Human health Ecosystem quality Resources Scenario Twister™ 100% 100% 10% Scenario Polish 291% 172% 246% Scenario Wax 392% 232% 333%
Table 13. Damage assessment of the Twister™, Polish and Wax scenarios, consumables only
Damage category Human health Ecosystem quality Resources Scenario Twister™ 100% 100% 100% Scenario Polish 576% 681% 439% Scenario Wax 806% 953% 614%
7.3.1 Scenario Twister™ Scenario Twister™ is set as the reference, meaning that other scenarios are compared with this by means of the compared scenario’s environmental impact in the damage category being divided by the environmental impact that Scenario Twister™ has in each damage category. The scenarios that have a value higher than 100 percent are worse in environmental terms than Scenario Twister™.
The results clearly show that Scenario Twister™ has the lowest environmental impact of all the scenarios. This applies regardless of whether the scenarios have been calculated solely on the basis of consumables, or whether the environmental impact of the machines has been included in the calculation.
7.3.2 Scenario Polish When Scenario Polish is compared with Scenario Twister™, it can be seen that Scenario Polish is inferior in all damage categories, but is still better than Scenario Wax. Just as in Scenario Twister™, this position is irrespective of whether the calculation was based solely on consumables or included floor care including machines. However, the difference between the various scenarios varies depending on whether the machines are included or not.
Scenario Polish has a 191 percent higher impact as regards Human health, a 72 percent increase in deterioration of Ecosystem quality, and a 146 percent increase in Resources compared to Scenario Twister™ when machine are included in the calculation.
When the comparison is based solely on consumables, Scenario Polish has a 476 percent higher impact as regards Human health, a 581 percent increase in deterioration of Ecosystem quality, and a 339 percent increase in Resources compared to Scenario Twister™.
It should be pointed out that the scenario is based solely on energy consumption, and that any toxicity caused by the use of chemicals has been ignored. This could make the difference compared to other scenarios even greater. However, it is obvious that this scenario is clearly inferior from a life cycle perspective in all damage categories when compared to Scenario Twister™, regardless of whether the life cycle includes machines or is restricted solely to consumables.
7.3.3 Scenario Wax When compared to all the other scenarios, Scenario Wax has the greatest environmental impact in all damage categories. Just as in sections 7.3.1 and 7.3.2, the position is the same irrespective of whether the calculation was based solely on consumables or included floor

46
care including machines. However, the difference between the various scenarios changes depending on whether the machines are included or not.
Scenario Wax has a 292 percent higher impact as regards Human health, a 132 percent increase in deterioration of Ecosystem quality, and a 233 percent increase in Resources compared to Scenario Twister™ when machine are included in the calculation.
When the comparison is based solely on consumables, Scenario Wax has a 706 percent higher impact as regards Human health, a 853 percent increase in deterioration of Ecosystem quality, and a 514 percent increase in Resources compared to Scenario Twister™.
Just as in Scenario Polish, Scenario Wax is based on energy consumption any toxicity caused by the use of chemicals has been ignored. This means that the difference between other scenarios could be even greater. However, it is clear that this scenario is the worst from a life cycle perspective compared to the other scenarios, regardless of whether the life cycle includes machines or is restricted solely to consumables.
7.3.4 Summary of the results of all the scenarios It is clear that the scenarios Wax and Polish have a greater impact than Scenario Twister™, irrespective of whether the life cycle includes machines or is restricted solely to consumables. If the life cycle only covers consumables, the difference between the scenarios increases in favour of Scenario Twister™. In other words, the Twister™ floor care method has less environmental impact than both polish and wax according to these results.
7.4 Scenario Twister™ broken down into fractions As Scenario Twister™ includes more stages than just the Twister™ pad, the scenario has been broken down. This has been done to demonstrate how the various fractions included in Scenario Twister™ relate to each other, thereby distinguishing the contribution of the Twister™ pad to the overall impact. All the elements are weighed against the overall impact that Scenario Twister™ has in each individual damage category. The results are presented in Figure 4 and Table 14Error! Reference source not found.. The figure is an attempt to represent the results graphically. However, some fractions produce such low values that they cannot be seen from the graphic scale in the figure. One fraction has a negative value, which means that the overall impact in the damage category Human Health does not reach 100 percent. The table is followed by an analysis of the results, where each fraction is set against the total.
Table 14. Damage assessment Twister™
Damage category Human health Ecosystem quality Resources Reusable mop 0% 0% 0% Twister™ pad 8% 1% 15% Scrubbing machine 53% 76% 47% Energy consumption 35% 21% 30% Water consumption 1% 0% 4% Washing the mop 3% 2% 3% Waste management -2% 0% 0% Total 100% 100% 100%

47
-20%
0%
20%
40%
60%
80%
100%
Human Health Ecosystem Quality Resources
Waste management
Washing the mop
Water consumption
Energy consumption
Scrubbing machine
Tw ister™ pad
Reusable mop
Figure 4. Damage assessment Twister™
7.4.1 Reusable mop The impact caused by the reusable mop during floor care is so minimal that it is considered to constitute 0 percent in all damage categories. As a result it cannot be seen in Figure 4. However, this does not mean that the reusable mop does not have any environmental impact, rather that the impact is so small in comparison with the other components that are required in the floor care process that it is negligible.
7.4.2 The Twister™ pad During a year of floor care with the Twister™ method, the use of the Twister™ pad is responsible for 8 percent of the actual impact on Human health, 1 percent of the deterioration in Ecosystem quality and 15 percent of the Resources, out of the total impact to which the Twister™ method gives rise. The results show that the Twister™ pad is the third-largest contributory factor in the overall environmental impact caused by the Twister™ method.
7.4.3 Scrubbing machine During a year with the Twister™ method, the scrubbing machine is responsible for 53 percent of the actual impact on Human health, 76 percent of the deterioration in Ecosystem quality and 47 percent of the Resources, out of the total impact to which the Twister™ method gives rise. As a result, the scrubbing machine is the largest single contributory factor in the overall environmental impact caused by the Twister™ method. It should be pointed out that if the conditions are such that the floor is considered to require floor care more frequently than every three days and/or if the total surface is larger than specified and/or if the service life of the scrubbing machine is longer than the estimated depreciation time, the environmental impact caused by the production of the machine will be reduced. This is because the scrubbing machine’s overall environmental impact is divided between more cleaning sessions and more square metres.

48
7.4.4 Water consumption during cleaning During a year with the Twister™ method, water consumption is responsible for 1 percent of the actual impact on Human health, 0 percent of the deterioration in Ecosystem quality and 4 percent of the Resources, out of the total impact to which the Twister™ method gives rise. It is worth noting that there can be considerable variation within this area, depending on access to water and access to treatment.
7.4.5 Energy consumption during floor care During a year with the Twister™ method, the energy that the scrubbing machine uses is responsible for 35 percent of the actual impact on Human health, 21 percent of the deterioration in Ecosystem quality and 30 percent of the Resources, out of the total impact to which the Twister™ method gives rise. As a result, energy consumption during the floor care process represents the second-largest proportion of the overall environmental impact caused by the Twister™ method. Unlike the scrubbing machine, this impact increases if the conditions demand an increase in the frequency of floor care. It should be pointed out that the results can vary depending on the country in which the floor care is being performed. This result is based on floor care in Sweden.
7.4.6 Washing the mop During a year with the Twister™ method, the vacuuming and washing of the reusable mop is responsible for 3 percent of the actual impact on Human health, 2 percent of the deterioration in Ecosystem quality and 3 percent of the Resources, out of the total impact to which the Twister™ method gives rise. This result too can vary depending on the country in which the floor care is being performed.
7.4.7 Waste management Waste management from one year with the Twister™ method has not included the dirty water or the handling of ashes to landfill. The waste management relating to the Twister™ pad gives rise to an impact on Human health of - 2 percent, as well as an impact on Ecosystem quality and Resources of zero percent. The negative value in this damage category results from the energy that is recovered from the incineration of the Twister™ pad replacing heat produced from biofuel. It should be pointed out that the energy from waste management is lower than that used in manufacture, and hence it is not possible to improve the environment through the waste management of Twister™ pads.
7.4.8 Summary of Scenario Twister™ broken down into fractions The majority of the impact within Scenario Twister™ comes from the use of the scrubbing machine and the energy consumption when executing the actual floor care process. The Twister™ pad has an impact on overall Resources of 15 percent and is consequently the third-largest factor in this category. However, the Twister™ pad has a lower impact on Ecosystem quality than washing the mop. Neither water consumption nor waste management are of any major significance compared to the environmental impact of other factors. The manufacture of the reusable mop has such a minimal impact that it is not shown in the comparison with the other factors that the Twister™ method encompasses.
7.5 Damage assessment of the Twister™ pad The environmental impact to which the Twister™ pad gives rise derives from the materials and processes that the Twister™ pad comprises. By breaking these down, it can be seen

49
which part of the production process contributes the greatest impact. The Twister™ pad that is broken down is the same as in Scenario Twister™. All the elements are weighed against the overall impact that Twister™ pad has in each individual damage category. The results are presented in Figure 5 and Table 15. The figure is an attempt to represent the results graphically. However, certain fractions produce such low values that they cannot be seen from the graphic scale in the figure. The table is followed by an analysis of what the results show in each section. This is followed by a summary of the actual analysis.
0%
10%
20%
30%
40%
50%
60%
70%
80%
90%
100%
Human Health Ecosystem Quality Resources
Industrial diamonds Pads Binding agent Transports Manufacture
Figure 5. Damage assessment Twister™ pad
Table 15. Damage assessment Twister™ pad
Damage category Human health Ecosystem quality Resources Industrial diamonds 56% 48% 28% Pads 32% 22% 63% Binding agent 1% 1% 5% Transport 9% 17% 3% Manufacture 2% 12% 1% Total 100% 100% 100%
7.5.1 Industrial diamonds The industrial diamonds are the part of the Twister™ pad’s production that is responsible for the largest proportion of the overall impact. If the impact from a Twister™ pad is broken down, the industrial diamonds are responsible for 56 percent of the overall impact on Human health, 48 percent of the overall impact on Ecosystem quality and 28 percent of the overall impact on Resources caused by a Twister™ pad.
7.5.2 Pads The pad makes the second-largest contribution to the impact caused by the Twister™ pad. If the impact from a Twister™ pad is broken down, the pad is responsible for 32 percent of the

50
overall impact on Human health, 22 percent of the overall impact on Ecosystem quality and 63 percent of the overall impact on Resources caused by a Twister™ pad.
7.5.3 Binding agent When producing the Twister™ pad, the binding agent has an impact on Human health of 1 percent, an impact on Ecosystem quality of 1 percent and an impact on Resources of 5 percent, out of the total impact to which the manufacture of the Twister™ pad gives rise. The binding agent is consequently responsible for a small proportion of the overall impact caused by the Twister™ method.
7.5.4 Transport When producing the Twister™ pad, transport has an impact on Human health of 9 percent, an impact on Ecosystem quality of 17 percent and an impact on Resources of 3 percent, out of the total impact to which the manufacture of the Twister™ pad gives rise.
7.5.5 Manufacture When producing the Twister™ pad, the energy used by the manufacturing process has an impact on Human Health of 2 percent, an impact on Ecosystem quality of 12 percent and an impact on Resources of 1 percent, out of the total impact to which the manufacture of the Twister™ pad gives rise.
7.5.6 Summary of the Twister™ pad It is clear that the production of the industrial diamonds and the pad are responsible for the majority of the environmental impact caused by the Twister™ pad. The pad is also responsible for the majority of the environmental impact caused by transport, both because the pad is the heaviest of the constituents in a Twister™ pad, and because it has the longest transport distance.

51

52
8 Sensitivity analysis As the results of this study include areas of uncertainty regarding scope, data collection and models, the results are validated through a sensitivity analysis. The sensitivity analysis can be carried out to indicate which parts of the model affect the results most, or to manage those parts that incorporate most areas of uncertainty.
In order to validate the results of the environmental impact from the Twister™ method and at the same time compare with other floor care methods, the following hypotheses have been used:
• The transport distance and the means of transport differ from the data that have been collected.
• Wear of the Twister™ pad is greater than estimated.
8.1 Scenarios for sensitivity analysis In order to see how these hypotheses can affect the final results, two scenarios have been used to compare with Scenario Twister™. These scenarios are:
• Scenario Double Wear
• Scenario Extra Transport
During the course of the study, the introduction of more scenarios has been considered, but this has not been necessary as it has been possible to draw conclusions from the selected scenarios and the breakdown of Scenario Twister™ that cover the scenarios that have been thinned out.
8.1.1 Scenario Double Wear Scenario Double Wear has primarily been created to quality assure the assumptions relating to the lifetime of the Twister™ pads. However, the scenario can be used in two ways. Firstly, by seeing what happens if the lifetime is shorter than estimated. And secondly, by seeing what happens if the environmental impact that arises from the materials and processes required for a Twister™ pad were to be twice as large. The latter approach emerges as this scenario does not look at the lifetime of the Twister™ pad, but solely at the difference between Scenario Twister™ and this scenario. As a result, this scenario should be viewed as a significant part of the sensitivity analysis.
The scenario is based on the wear of the Twister™ pad being greater than in Scenario Twister™. This assumption is based on the various details regarding lifetime that emerged during data collection. In the scenario, it has been calculated that a Twister™ pad is able to clean half the area used in Scenario Twister™ before needing to be replaced. This results in an estimated lifetime of 17,500 m2, which is significantly lower than the estimate from ISS and should therefore cover any margin of error (Lundin, 2008). This means that the halving of the cleaning area for which one Twister™ pad is sufficient applies to both the pads that are used with Twister™. Other than this, Scenario Double Wear uses the same data and the same preconditions as Scenario Twister™.

53
8.1.2 Scenario Extra Transport Scenario Extra Transport has been created to quality assure the assumptions that have been made relating to transport. The areas of uncertainty that have been observed when calculating transport can be seen in section 6.3.4.
This scenario is based on the pad being transported from New York to Los Angeles by lorry (2800 km), before being transported by freighter via Panama (Freighter Oceanic, 15,000 km) to Göteborg. A freighter has a larger environmental impact than a bulk cargo vessel (Frischknecht et al., 1996). Other than this, Scenario Extra Transport uses the same data and the same preconditions as Scenario Twister™. The fact that the scenario is based on a much greater transport distance is related to all the areas of uncertainty that can exist within all transport sections. By increasing the transport distance for the part of the Twister™ pad that weighs most and is most bulky, as has been done in this scenario, any margin of error relating to transport should be covered.
8.2 Results of the sensitivity analysis In this section, the various scenarios are presented in comparison with the situation in the reference scenario, Scenario Twister™. The results are presented in Figure 6 and Table 16. The figure is a graphic representation of the table. This is followed by a brief analysis of what the results show.
0%
50%
100%
150%
200%
Scenario Tw ister™ Scenario Double Wear Scenario Extra Transport
Human Health Ecosystem Quality Resources
Figure 6. Sensitivity analysis
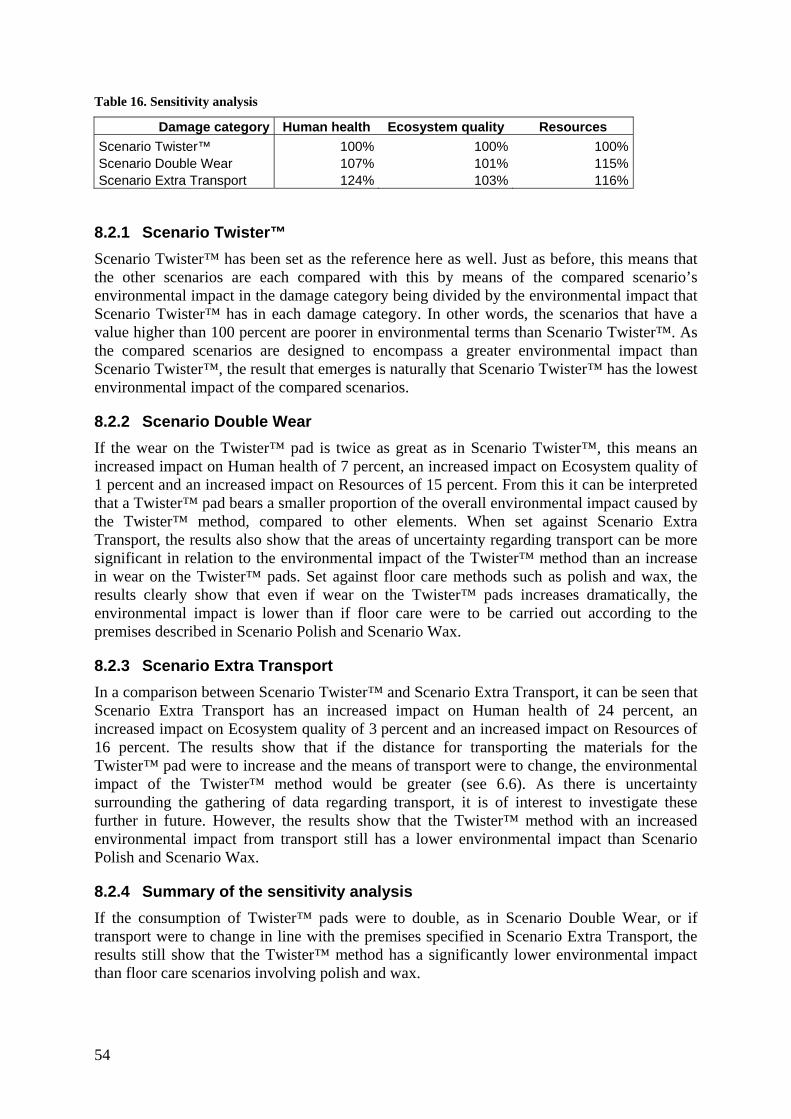
54
Table 16. Sensitivity analysis
Damage category Human health Ecosystem quality Resources Scenario Twister™ 100% 100% 100% Scenario Double Wear 107% 101% 115% Scenario Extra Transport 124% 103% 116%
8.2.1 Scenario Twister™ Scenario Twister™ has been set as the reference here as well. Just as before, this means that the other scenarios are each compared with this by means of the compared scenario’s environmental impact in the damage category being divided by the environmental impact that Scenario Twister™ has in each damage category. In other words, the scenarios that have a value higher than 100 percent are poorer in environmental terms than Scenario Twister™. As the compared scenarios are designed to encompass a greater environmental impact than Scenario Twister™, the result that emerges is naturally that Scenario Twister™ has the lowest environmental impact of the compared scenarios.
8.2.2 Scenario Double Wear If the wear on the Twister™ pad is twice as great as in Scenario Twister™, this means an increased impact on Human health of 7 percent, an increased impact on Ecosystem quality of 1 percent and an increased impact on Resources of 15 percent. From this it can be interpreted that a Twister™ pad bears a smaller proportion of the overall environmental impact caused by the Twister™ method, compared to other elements. When set against Scenario Extra Transport, the results also show that the areas of uncertainty regarding transport can be more significant in relation to the environmental impact of the Twister™ method than an increase in wear on the Twister™ pads. Set against floor care methods such as polish and wax, the results clearly show that even if wear on the Twister™ pads increases dramatically, the environmental impact is lower than if floor care were to be carried out according to the premises described in Scenario Polish and Scenario Wax.
8.2.3 Scenario Extra Transport In a comparison between Scenario Twister™ and Scenario Extra Transport, it can be seen that Scenario Extra Transport has an increased impact on Human health of 24 percent, an increased impact on Ecosystem quality of 3 percent and an increased impact on Resources of 16 percent. The results show that if the distance for transporting the materials for the Twister™ pad were to increase and the means of transport were to change, the environmental impact of the Twister™ method would be greater (see 6.6). As there is uncertainty surrounding the gathering of data regarding transport, it is of interest to investigate these further in future. However, the results show that the Twister™ method with an increased environmental impact from transport still has a lower environmental impact than Scenario Polish and Scenario Wax.
8.2.4 Summary of the sensitivity analysis If the consumption of Twister™ pads were to double, as in Scenario Double Wear, or if transport were to change in line with the premises specified in Scenario Extra Transport, the results still show that the Twister™ method has a significantly lower environmental impact than floor care scenarios involving polish and wax.

55

56
9 Discussion The results are discussed in this section. The discussion is based on the selection of the various perspectives that have emerged during the study, as well as on the link between the results of the environmental impact assessment and earlier studies. This section finishes with a conclusion and suggestions for further studies.
9.1 Characterisation or damage assessment? Characterisation is the stage before damage assessment. A calculation takes place between characterisation and damage assessment, in which the characterisation’s environmental aspects are converted to damage assessment categories. It should therefore be natural to compare the results based on the characterisation. This is to minimise any misleading interpretations that might be contained within the step between characterisation and damage assessment. As a result, it should theoretically be more accurate, when assessing the results, to do this on the basis of a characterisation instead of a damage assessment.
This has been taken into consideration, but as Scenario Wax and Scenario Polish are only calculated on the basis of energy consumption, the results could be misinterpreted. For example, the results would indicate the impact on ecotoxicity that corresponds to the impact of the Swedish fuel mix on the two scenarios, and not the impact on ecotoxicity of the actual floor care methods involving polish and wax. The same applies to other materials and products included in the Twister™ pad and which this study has taken from secondary data.
9.2 Differences in machines The use of machines and how these have been calculated in an LCA gives rise to several problems. This is partly to do with whether a product’s total environmental impact can be eliminated during its lifetime. If a floor is considered to be excessively soiled and floor care needs to be carried out more frequently than every three days, the environmental impact deriving from the machine’s production is reduced. This is because the machine’s environmental impact is divided between more floor care sessions and more square metres (without the overall environmental impact changing).
If the data on which Scenario Polish and Scenario Wax are based are compared, it emerges that the machines that are used, both for frequent care and periodic maintenance, are responsible for a smaller proportion of the overall energy consumption (i.e. environmental impact). At the same time, the individual element that had the greatest environmental impact within the Twister™ method is the scrubbing machine, which means that the data relating to the machinery for Scenario Polish and Scenario Wax should be questioned. This is even clearer in the comparison between the various scenarios when the machines are excluded. The comparison also indicates greater distance between Scenario Twister™ and the other scenarios in favour of Scenario Twister™.
A reasonable assumption would be that if the scrubbing machine and its energy consumption were the same in Scenario Polish and Scenario Wax as in Scenario Twister™, this part of the overall impact would be greater for floor care with Scenario Polish and Scenario Wax when comparing the scenarios including machines.

57
The reason for this study not being based on an equivalent scrubbing machine in all the scenarios is that there is no confirmation as to whether these floor care methods use scrubbing machines for the frequent care. This relates to the data on which Scenario Polish and Scenario Wax are based (see section 6.6.3). As a result, the gap between the Twister™ method and floor care using polish or wax would be considerably greater if data for scrubbing machine and energy consumption were considered to be the same in all scenarios. For Scenario Polish and Scenario Wax, there would also be additional environmental impact from the equipment that is required during the periodic maintenance.
9.3 Transport The calculation of transport is based on how far the components for the Twister™ pad have been transported. The comparison between Scenario Twister™ and Scenario Extra Transport shows a marked difference depending on the transport distance, but also depending on the choice of transport method. It is therefore essential to minimise the uncertainty surrounding transport data. This applies both to the data that have been gathered for this study from HTC, but also to the transport data collected from the databases. The fact remains that, even in the event of increased transport, Scenario Extra Transport is better than Scenario Polish and Scenario Wax. It should also be pointed out again that the transport of scrubbing machine components and the scrubbing machines themselves are neglected in this study. If transport were to be studied in greater depth, this should focus primarily on the transport of the scrubbing machines and not of the Twister™ pad. This is because the scrubbing machine components weigh significantly more than the Twister™ pad’s components.
9.4 Choice of energy carrier One area of debate relates to whether, when calculating energy consumption, the calculation should be based on energy that is at the margin or that which constitutes the majority the energy production. In this study, the energy source has come from the Irish and Swedish electricity averages. These electricity averages could be replaced with marginal electricity, which in this case would be coal power.
At an early stage of this study, a calculation was performed in which energy consumption derived from marginal electricity in all the scenarios. However, it became evident that the Irish electricity averages has a higher degree of impact than coal power, due to the composition of the databases. At the same time, the comparison between the various scenarios was misleading, as Scenario Polish and Scenario Wax are calculated solely on the basis of energy consumption. Because they are calculated with the Swedish electricity averages, Scenario Polish and Scenario Wax have a low environmental impact compared to what could have been the case had they been calculated based on marginal electricity. In other words, the environmental impact from Scenario Polish and Scenario Wax would be greater than calculated if the energy perspective had been energy at the margin.
9.5 Comparison with previous studies There are very few studies of floors conducted from a life cycle perspective that include floor care. One reason for this might be that a floor’s life cycle is viewed separately from floor care that includes frequent care and periodic maintenance (Jedvall, 2008; Paulsen, 2008). One factor that the few studies that have been conducted have in common, is that they all highlight the problems in obtaining data. The market for chemicals, floor care methods and cleaning equipment is large, and the various products differ markedly (Lundblad, 1994).

58
Just as in previous studies, this study includes simplifications. Parallels can still be drawn, however, both through the results of this study being clear and through the fact that earlier studies usually contain general conclusions.
9.5.1 Incorporating floor care in the floor’s life cycle When studies are conducted regarding floors, the importance of the intended floor care should be incorporated, which is not always the case (Nicoletti et al. 2002). One reason for this not taking place might be that the floor care method is not considered to be environmentally harmful. As a result, the conclusion is drawn that its environmental impact is minimal (Hellström, 2006). Other reasons can involve difficulties in obtaining data regarding the environmental impact of floor care (Jönsson et al., 1994).
Floor care should be included, however, as a floor’s usage period can have a greater environmental impact than the actual manufacture of the floor, a fact that has been demonstrated by Lundblad (1994) and Günther & Langowsko (1997).
If the usage period is included in a floor’s life cycle, the results of this study can demonstrate not only how the environmental impact of floor care can be reduced, but also how a floor’s total environmental impact can be reduced by switching to the Twister™ method from floor care methods such as wax and polish.
Floors and floor care products are continually being developed, resulting in less of an environmental impact than before, a point dealt with by Lundblad (1994) and with which other studies agree. Lundblad (1994) believes that the properties of carpets are moving towards a reduction in environmental impact from chemicals. However, even with the current level of knowledge, there is still a demand for more quantitative assessments of floor care chemicals (Paulsen, 2003). According to Paulsen (2008), the environmental impact that is linked to floor care chemicals would increase if the environmental impact of the chemicals could be better calculated. For this reason, the results of this study, which show that the Twister™ method has a lower environmental impact than floor care methods involving polish and wax, would still be correct even if the environmental impact of the chemicals was better investigated. Lundblad (1994) is no doubt correct when he observes that the need for chemicals has reduced. Whether it is floor care methods such as Twister™ that are contributing to this reduction, or whether it is the properties of carpets, is open to discussion.
9.5.2 Risks during waste management One major risk that the use of chemicals must always take into account, is incorrect waste management (Björk & Eriksson, 2000). It is difficult to assess the effects of this. This study has refrained from looking into the waste management of dirty water. However, it should still be possible to discuss the subject. As the waste water originating from the Twister™ method does not contain any detergent from frequent care, the environmental impact of the waste water should be lower than in the case of floor care using polish or wax, as any chemical residue is in solid form, not liquid (Rick, 2009). As a result, any mistakes in which waste water is released into the local sewage system could result in the treatment plant being better able to process the waste water than when cleaning chemicals are present.
9.5.3 Time for frequent care Other aspects that can be taken into account to obtain a more accurate picture relate to when the actual floor care process is carried out. This has not been taken into consideration in this study. It is reasonable to assume that the total time that is required for floor care per year reduces if periodic maintenance is avoided. This assumes that the need for frequent care

59
remains the same. As a result, the total environmental impact that the floor care process entails is reduced in premises that can utilise the opportunity of switching to an energy-saving mode (Thabrew et al., 2007). Avoiding periodic maintenance can also result in improved health for the personnel who perform the floor care, a factor which should also be taken in consideration (Antonsson et al., 2006).
9.5.4 How the Twister™ method relates to sick buildings One technical restriction that has been applied in this study relates to emissions to the air that arise when the Twister™ method is employed. The restriction has been applied as there is a lack of data, and the study has not included a measurement of such emissions. During floor care, symptoms linked to sick buildings can arise as a result of these emissions (Borchers et al., 2006). Previous studies regarding sick buildings have included restrictions in relation to chemical usage, as there has been no toxicity data for several substances (Günther & Langowsko, 1997). At the same time, it has been pointed out that cleaning products might be one of the factors that contributes most negative health effects relating to sick buildings and that can be linked to physical illness (Borchers et al., 2006). As the Twister™ method does not require chemicals, however, the risk of these symptoms should decrease, although further studies are required in order to verify this claim.
By switching to the Twister™ method, the access to chemicals would decrease. This ought to result in a smaller number of chemicals needing to be analysed with regard to volatile organic compounds in the surrounding environment, as has been described by Johnson (1995).
9.5.5 The Twister™ method or ecolabelled chemicals? Not all chemicals that are used in floor care, whether this relates to a floor care method based on polish or wax, are equally harmful to the environment. For this reason the discussion is being expanded a little, as e.g. Jönsons et al. (1994) feel that Swan labelling is a step in the right direction as regards floor care. This is reinforced by Sjöholm & Sunnermalm (2007), who describe how public departments handle the issue of reduced environmental impact from floor care through ecolabelled products.
At the same time, there are differences in the criteria between ecolabelled floors, floor care products, cleaning agents and cleaning services (Nordisk Miljömärkning, 2006; Nordic Ecolabelling, 2008a; Nordic Ecolabelling, 2008b; Nordisk Miljömärkning, 2002). This can mean that the environmental impact is shifted from burdening the cleaning agent to burdening the floor care products. Some criteria also require floor care methods to be based on polish or wax in order to be ecolabelled (Nordic Ecolabelling, 2008a). Good Environmental Choice could also be said to lack the holistic perspective that floor care actually requires for a life cycle perspective, as only cleaning chemicals can be ecolabelled at present (Öberg Huss, 2008).
This absence of an overall perspective or life cycle perspective can be likened to the LCA studies carried out on floors that neglect the usage phase, such as Nicoletti et al. (2002). When the focus is on comparing individual products and not the entire environmental impact to which a product gives rise during usage, the life cycle can be restricted such that it finishes too soon.
The criteria should be expanded so that there is an overall perspective, as was pointed out by Lindfors (1999) and which probably still applies (Lindfors, 2008). However, it can be seen from the Swedish Society for Nature Conservation’s chemicals policy (2004) that all chemical usage should gradually be phased out, if possible. As a result, it should be observed that the Twister™ method is well placed in relation to ecolabelled chemicals. The fact that the

60
Twister™ method, according to this study, also proves to be better in environmental terms than the comparison floor care methods using polish and wax, should make this even clearer.

61

62
10 Conclusion In this study, an LCA of the Twister™ method has been conducted on the basis of keeping one square metre of floor clean for one year. The results also include a comparison with two other floor care methods taken from previous floor care studies, one of which incorporates polish and the other one wax. The results have also included a sensitivity analysis through the use of two scenarios.
The results clearly show that the scrubbing machine and its energy consumption, which the Twister™ method has been estimated to use, has the greatest environmental impact in the case of floor care with the Twister™ method. In the manufacture of a Twister™ pad, it emerges that the industrial diamonds and the pad are responsible for the majority of the environmental impact caused by the Twister™ pad.
The results also clearly show that the Twister™ method has a much lower environmental impact than floor care methods using polish or wax, based on the conditions described in this study.
10.1 Further work This study has clear limitations that could be reduced by further studies on the topic. For example, HTC’s subcontractors could conduct life cycle assessments of the materials and products that HTC buys in to manufacture the Twister™ pad. This could be done to verify or replace the data that this study has used.
The study has focused on conducting an LCA on Twister™, which has taken place. In addition, the study has compared the Twister™ method with other floor care methods. As very few studies have been carried out regarding floor care products from a life cycle perspective, this is something that ought to be demanded more actively. This is particularly true regarding scrubbing machines, which proved in this study to be responsible for a significant environmental impact. The life cycle perspective should also apply to ecolabelling of floor care products/methods, regardless of whether this relates to the Good Environmental Choice or the Swan ecolabel.
As regards HTC, this study recommends four areas for further study, in addition to a more detailed analysis of the logistics that are used and their environmental impact.
The first study should illuminate the handling of the dirty water to which the Twister™ method gives rise, from an environmental perspective.
The second should focus on any airborne particles that arise when the Twister™ method is implemented. This is necessary in order to anticipate working environment and health-related requirements, such as requirements relating to Swan labelling (Nordic Ecolabelling, 2008a).
The third is a time measurement of Twister™. If a time measurement is supplemented with an analysis of the customer’s requirements, the Twister™ method could contribute to better optimisation of the premises’ utilisation, for example by means of the premises being switched to energy-saving mode.
The fourth involves studying whether the pads are manufactured from recycled plastic, or whether it is possible to change to pads comprising recycled plastic. The supplier should also ideally be located closer to HTC in order to further reduce the environmental impact.

63

64
11 References Alexandersson, P. (2006) Miljöaspekter på golvvård, Swedish Society for Nature Conservation, Stockholm, ISBN: 915587891-1
Antonsson, A-B., Schmidt, L., Hägg, G., Holmefalk, C. (2006) Belastningsskador vid standing - 17 städares berätterlser om sina anmälda arbetsskador, Swedish Environmental Research Institute, IVL Report B1704, Stockholm
Baumann, H. & Tillman, A-M. (2004) The hitchhiker’s guide to LCA : an orientation in life cycle assessment methodology and application, Studentlitteratur, Lund 2004 ISBN 9144023642
Borchers, A., Chang, C., Keen, C., Gershwin, E. (2006) Airborne Environmental Injuries and Human Health, Clinical Reviews in Allergy & Immunology volume 31, ISSN 1559-0267
BUWAL 250 (1998) Environmental. Series No. 250/1, Swiss Agency for the Environment, Forests and Landscape (SAEFL) Berne, 1998
Franklin Associates Ltd. (1998), USA LCI Database Documentation, Franklin Associates, Prairie Village, Kansas, USA.
Frischknecht, R., Bollens, U., Bosshart, S., Ciot, M., Ciseri, L., Doka, G., Dones, R., Gantner, U., Hischier, R., Martin, A. (1996) Ökoinventare von Energiesystemen. Grundlagen für den ökologischen Vergleich von Energiesystemen und den Einbezug von Energiesystemen in Ökobilanzen für die Schweiz,.Version. 3, Gruppe Energie - Stoffe - Umwelt (ESU), Eidgenössische Technische Hochschule Zürich und Sektion Ganzheitliche Systemanalysen, Paul Scherrer Institut, Villigen, www.energieforschung.ch, Bundesamt für Energie (Hrsg.), Bern.
Goedkoop, M. & Spriensma, R. (2001), The Eco-indicator 99 A damage oriented method for Life Cycle Impact Assessment Methodology report no. 1999/36A 22 Third Edition. PRé Consultants B.V., Amersfoort
Gustafsson, L., Lanshammar, H., Sandblad, B. (1982) System och modell – En introdukton till systemanalysen, Studentlitteratur, Lund 2003, ISBN 91-44-18551-0
Günther, A., Langowski, H-C. (1997) Life Cycle Assessment Study on Resilient Floor Coverings, International Journal of Life Cycle Assessment 1997:2: 73-80
Hellström, J. (2006) Livscykelanalys av industrigolv – En jämförande studie av HTC SuperfloorTM och ett epoxigolv, Linköping University, LiU-Tryck, 2006
Johnson, L. (1995) Miljöbedömning av byggmaterial under brukarperioden, SP Technical Research Institute of Sweden, SP Report 1995:46, Borås, ISBN 91-7848-574-6
Jørgensen, A-M., Ywema, P., Frees, N., Exner, S., Bracke, R. (1996) Transportation in LCA - A Comparative Evaluation of the Importance of Transport in Four LCAs, International Journal of Life Cycle Assessment 1 1996;4: 218-220
Københavns Vand. (1999). Grønt regnskab 1999. Copenhagen Water Supply.
Lundblad, D. (1994) Miljöpåverkan av golvvård – en betydelsefull del i golvmattans livscykel, Trita-Byma 1994:7, Stockholm, 1994

65
Nicoletti, G. Notarnicola, B., Tassielli, G. (2002) Comparative Life Cycle Assessment of flooring materials: ceramic versus marble tiles, Journal of Cleaner Production 2002:10: 283-296
Paulsen, J. (2003) The Maintenance of Linoleum and PVC Floor Coverings in Sweden, International Journal of Life Cycle Assessment 8 2003;6: 357-364
Paulsen, J. (1999) LCA på golvmaterial – fallstudier med särskild hänsyn till användningsfasen, Trita-Byma 1999:7, Stockholm, 1999 ISBN: 91-7170-462-0
Rebitzer, G., Ekvall, T., Frischknecht, R., Hunkeler, D., Norris, G., Rydberg, T., Schmidt, W.-P., Suh, S., Weidema, B.P., Pennington, D.W. (2004) Life cycle assessment, Part 1: Framework, goal and scope definition, inventory analysis and applications, Environmental International 2004;30: 701-720
Rydh, C., Lindahl, M., Tingström, J. (2002) Livscykelanalys: en metod för miljöbedömning av produkter och tjänster, Studentlitteratur, Lund, 2004, ISBN 91-44-02447-9
Sjöholm, U. & Sunnermalm, A. (2008) Miljöanpassad upphandling i praktiken – En genomgång av offentliga upphandlingar 2007, Swedish Environmental Protection Agency Report 5807, ISBN 978-91-620-5807-4.pdf
Swedish Society for Nature Conservation (2004) Kemikalier och avfall – The Swedish Society for Nature Conservation’s policy, Adopted by the Society’s Board of Directors in 2004, Birger Gustafsson AB, Stockholm, 2004. ISBN: 91 558 7821-0
Thabrew, L., Lloyd, S., Cypcar, CC, Hamilton, JD., Ries, R. (2007) Life Cycle Assessment of Water-based Acrylic Floor Finish Maintenance Programs, International Journal of Life Cycle Assessment 13 2008;6: 65-74
Tillman, A-M,. Baumann, H., Eriksson, E., Rydberg, T. (1991) Miljön och förpackningarna Livscykelanalyser för förpackningsmaterial – beräkning av miljöbelastning, SOU 1991:77, Nordsteds Tryckeri AB, Stockholm, 1991
Dutch bureau of emission registrations (1992) Process 1851
11.1 Electronic sources HTC Sweden AB (2008) Product catalogue 2008, http://www.htc-sweden.com/ariadne/files/HTC/TWISTER_II_broschyr_SV.pdf, acc: 24.12.2008
IEA (2008) Electricity/Heat data for Ireland in 2005, http://iea.org/Textbase/stats/electricitydata.asp?COUNTRY_CODE=IE, acc: 26.06.2008
Nordic Ecolabelling (2008a) Floor care products 051, version 3.1, http://www.ecolabel.se/Default.aspx?tabName=CriteriaDetail&menuItemID=6998&pgr=51, acc: 22.12.2008
Nordic Ecolabelling (2008b) Cleaning products 026, version 4.2, http://www.ecolabel.se/Default.aspx?tabName=CriteriaDetail&menuItemID=6998&pgr=26, acc: 22.12.2008
Nordic Ecolabelling (2008c) Micro fibre cloths and mops 083, version 1.4, http://www.ecolabel.se/Default.aspx?tabName=CriteriaDetail&menuItemID=6998&pgr=83, acc: 22.12.2008

66
Nordisk miljömärkning (2002) Swan label for Cleaning services 076, version 1.3., http://www.ecolabel.se/Default.aspx?tabName=CriteriaDetail&menuItemID=6998&pgr=76, acc: 22.12.2008
Nordisk miljömärkning (2006) Swan label for Floors, version 4.07, http://www.ecolabel.se/Default.aspx?tabName=CriteriaDetail&menuItemID=6998&pgr=29, acc: 22.12.2008
11.1.1 E-mail Homanen, Susanna, Environmental Co-ordinator Element6 Sweden, 21 April 2008 [email protected]
Bozzonni, Neil, Sales Manager Element6, 2 December 2008, [email protected]
11.1.2 Verbal sources Jacobson, Christer, Poståkeriet, Site Manager, telephone conversation, September 2008
Jedvall, Ingrid, Swedish Environmental Protection Agency, responsible for organic chemical industry, chemical issues, the plastics industry, industry expert systems, telephone conversation, December 2008
Karlsson, Jimmy, Aquatec, telephone conversation, May 2008
Lindfors, Lars-Gunnar, Swedish Environmental Research Institute, Head of Research, telephone conversation, December 2008
Lundin, Patrick, ISS Cleaning, Operations Manager, telephone conversation, September 2008
Paulsen, Jacob, SIS Miljömärkning AB, Product Manager for Floor coverings, telephone conversation, December 2008
Rick, Ulf, Swedish Chemicals Agency, telephone conversation, January 2009
Sjögren, Matts, ISS, Environmental Manager, telephone conversation, September 2008
Öberg Huss, Sara, Swedish Society for Nature Conservation, Quality Manager for Good Environmental Choice, December 2008
11.1.3 Software Google 2008 – Map data 2008, http://www.maps.google.se, acc: 23.09.2008
Farnel Capital, 2008, http://www.searates.com/reference/portdistance/, acc: 23.09.2008
PRé Consultants, SimaPro 7.0: SimaPro LCA software, Amersfoort, The Netherlands

67

68
12 Appendix 1 – Damage assessment Damage category Human health Ecosystem quality Resources
Unit DALY PDF*m2yr MJ surplusScenarios
Scenario Twister™ incl. machines 8,57*10-08 3,93*10-02 1,27*10-01
Scenario Polish incl. machines 2,49*10-07 6,77*10-02 3,13*10-01
Scenario Wax incl. machines 3,36*10-07 9,13*10-02 4,23*10-01
Scenario Double Wear 9,14*10-08 3,96*10-02 1,46*10-01
Scenario Extra Transport 1,06*10-07 4,04*10-02 1,47*10-01
Scenario Twister™, consumables only 4,13*10-08 9,49*10-03 4,51*10-02
Scenario Polish, consumables only 2,38*10-07 6,46*10-02 1,98*10-01
Scenario Wax, consumables only 3,33*10-07 9,04*10-02 2,77*10-01
Damage assessment Twister™ 1
Reusable mop 4,40*10-14 3,76*10-09 8,06*10-08
Twister™ pad 5,83*10-11 3,14*10-06 1,61*10-04
Scrubbing machine 3,75*10-10 2,45*10-04 4,88*10-04
Energy consumption 2,48*10-10 6,73*10-05 3,12*10-04
Water consumption 8,74*10-12 2,76*10-07 4,68*10-05
Washing the mop 2,46*10-11 6,61*10-06 3,22*10-05
Waste management -1,15*10-11 -6,77*10-07 4,61*10-08
Damage assessment Twister™ pad2
Industrial diamonds 5,66*10-07 2,66*10-02 7,88*10-01
Pads 3,29*10-07 1,20*10-02 1,76*10±00
Binding agent 6,82*10-09 3,48*10-04 1,41*10-01
Transport 9,35*10-08 9,6*10-03 9,02*10-02
Manufacture 2,41*10-08 6,54*10-03 3,03*10-02
1 Damage assessment for Twister™ is calculated on the basis of the floor care of one square metre. The results of the damage assessment for Twister™ have been converted to fit Scenario Twister™. This conversion has no impact as regards the results. 2 Damage assessment Twister™ pad has been calculated on the basis of the lifetime of a Twister™ pad. The results of Damage assessment Twister™ pad have been converted to fit Damage assessment for Twister™. This conversion has no impact as regards the results.

69

70
13 Appendix 2 - Eco-indicator 99 This appendix includes a summary of the method Eco-indicator 99 (Eco 99). A more detailed description of the method can be found in Goedkopp & Spriensma (2000). The method has a top-down perspective. This perspective entails that the study starts by defining what is required in order to conduct the assessment. This entails e.g. defining the term “environment” and how various environmental problems should be weighted.
13.1 The term Environment according to Eco 99 “A set of biological, physical and chemical parameters influenced by man, that are conditions to the functioning of man and nature. These conditions include Human Health, Ecosystem Quality and sufficient supply of Resources.” (Goedkopp & Spriensma, 2000, p. 9)
13.2 Characterisation The Eco 99 method uses three different categories to assess the environmental impact of a product’s or service’s life cycle. This takes place through a damage assessment based on three models, each of which is based on a number of environmental aspects. The three different models relate to human health, ecosystem quality and resources.
13.2.1 Human health This model is based on the underlying idea that all people, both now and in the future, should be free from environmental causes of diseases, disabilities or premature death.
In order to quantify the results from the model, some form of yardstick is required to measure the health of the population. Eco 99 uses the health indicator DALY, which stands for “Disability-Adjusted Life Years”. DALY measures overall ill health based on specific diseases and injuries. It compares time with disabilities with time lost due to premature death. This is achieved through the use of a number of different environmental aspects:
• Respiration-inhibitory effects (caused by both organic and inorganic substances)
• Carcinogenic effects
• Effects caused by climate change
• Radiation
• Changes in the ozone layer
However, Eco 99 has restricted itself to a number of aspects from the health perspective:
• The life cycle assessment gives consideration to anthropogenic emissions to the air, water and land. From this, working environment, indoor environment, traffic accidents and drugs are demarcated.
• The life cycle assessment does not include ill health caused by natural disasters, the prevailing climate or micro-organisms.
• The life cycle assessment does not give consideration to economic aspects, such as the consequences of having a low income.

71
• Other aspects linked to welfare.
13.2.2 Ecosystem quality Defining the concept of ecosystem and its limitations is relatively difficult. The term ecosystem quality, which is used in the method, includes energy, material and information flows. A high level of quality is characterised by low anthropocentric disruptions that do not affect the ecosystem. It is naturally complicated to determine the extent to which people affect the system, particularly when these flows act at several different levels within the ecosystem.
As a suitable indicator for the quality of the ecosystem, the diversity of species is used as a parameter. This selection is founded on the basic idea that no species will be affected by sudden changes to their population or their geographic spread. For this reason, the model concentrates on information flows at species level.
There are two different ways of looking at how the ecosystem is affected by people. The first is on the basis of a total and irreversible extinction of species. The second is on the basis of a reversible and irreversible disappearance of species or pressure on a species in a selected region over a specific period of time. The first approach is impossible to apply within the model. This is partly because its execution stipulates excessively high demands, and partly because the results would be bound to a geographic region whereas the model is of a general nature.
The second approach entails that a species can return to the region under particular conditions, despite the fact that it currently cannot live in the region. This results in the model being based on the assumption that it is always possible to restore an affected ecosystem. The calculation of any damage to the ecosystem in the model takes place according to the following equation:
“The relative decrease of the number of species (fraction)*area*time” (Goedkopp & Spriensma, 2000, p. 53).
Four different environmental aspects are used to calculate the impact on species:
• Ecotoxicity
• Acidification
• Eutrophication
• Land use
In order to calculate the effects of ecotoxicity, “Potentially Affected Fraction of species in relation to concentration of toxic substances” (PAF) (Goedkopp & Spriensma, 2000) is used. PAF expresses the number of species that are exposed to concentrations above “No Observed Effect Concentration” (NOEC) (Goedkopp & Spriensma, 2000).
In order to calculate the effects of acidification and eutrophication, Potentially Disappeared Fraction (PDF) is used, which employs “fate modelling” and damage modelling. In the case of acidification and eutrophication, this is based on NOx, SOx and NH3.
In order to calculate the effects of land use, PDF is used. The relationship between land use and the number of species is structured so that the number of species increases the more space they have at their disposal. The condition is that the converted area is an artificial creation that does not favour the wealth of species, and that the species that thrive in the converted area can equally well exist in natural areas. This means that if an area is partially converted, the number of species will decrease, both in the area that has been converted and in the remaining

72
area. It is also assumed that the natural area’s species have a higher value than the converted area.
13.2.3 Resources This model is based on the underlying idea that nature’s stock of non-living material, which is considered important for people, should also be available to future generations.
The model only includes two environmental aspects:
• Minerals
• Fossil fuels
Resources such as water and air are covered by the Human health model (see above), and other materials are counted as land use. As it is difficult to assess the remaining volume of minerals and fossil fuels, it is assumed that their continued extraction will require even more resources/energy than previously. This is based on the assumption that market forces will always extract the resources that are of the best quality and hence reduce the remaining virgin raw materials.
The model is therefore in two parts. The first part calculates how much of the raw material remains after extraction, while the second part calculates the damage caused by the actual extraction process, based on a surplus energy concept (MJ surplus) (Goedkopp & Spriensma, 2000).
13.3 Weighting The three different models can then be weighted between themselves to arrive at a single result. Eco 99 has been created for a European market and consequently has a reference value that corresponds with European conditions and values. As weighting would mean that the results of the study could not be used in marketing contexts, and considering that weighting is not necessary if the results are clear, no weighting will be performed (Goedkopp & Spriensma, 2000).
![Floor Strippers - Home | RJ Schinner Floor... · [Floor Care] 22 [Floor Care] 23 Floor Finishes & Sealers KEY CHARACTERISTICS BEST FOR PRODUCT CODE % OFF-THE-MOP MAINTENANCE SEMI-PERMANENT](https://static.fdocuments.us/doc/165x107/5b846d957f8b9a784a8c4361/floor-strippers-home-rj-schinner-floor-floor-care-22-floor-care-23.jpg)