LG Household & Health Care Ltd. and its subsidiaries · LG Household & Health Care Ltd. and its...
106
LG Household & Health Care Ltd. and its subsidiaries LG Household & Health Care Ltd. and its subsidiaries Consolidated financial statements or the years ended December 31, 2018 and 2017 with the independent auditor’s report
Transcript of LG Household & Health Care Ltd. and its subsidiaries · LG Household & Health Care Ltd. and its...

LG Household & Health Care Ltd. and its subsidiaries
LG Household & Health Care Ltd. and its subsidiaries
Consolidated financial statements or the years ended December 31, 2018 and 2017 with the independent auditor’s report

Table of contents
Independent auditor’s report Page Consolidated financial statements
Consolidated statements of financial position 1 Consolidated statements of income 3 Consolidated statements of other comprehensive income 4 Consolidated statements of changes in equity 5 Consolidated statements of cash flows 7 Notes to the consolidated financial statements 9

Independent auditor’s report
The Shareholders and Board of Directors LG Household & Health Care Ltd.
Opinion
We have audited the accompanying consolidated financial statements of LG Household & Health Care Ltd. and its subsidiaries (collectively referred to as the “Group”), which comprise the consolidated statements of financial position as of December 31, 2018 and 2017, and the consolidated statements of income, consolidated statements of other comprehensive income, consolidated statements of changes in equity and consolidated statements of cash flows for the years then ended, and the notes to the financial statements, including a summary of significant accounting policies.
In our opinion, the consolidated financial statements present fairly, in all material respects, the consolidated financial position of the Group as of December 31, 2018 and 2017, and its consolidated financial performance and its consolidated cash flows for the years then ended in accordance with Korean International Financial Reporting Standards.
Basis for opinion
We conducted our audit in accordance with Korean Auditing Standards (KGAAS). Our responsibilities under those standards are further described in the Auditor’s responsibilities for the audit of the consolidated financial statements section of our report. We are independent of the Group in accordance with the ethical requirements that are relevant to our audit of the consolidated financial statements in the Republic of Korea, and we have fulfilled our other ethical responsibilities in accordance with these requirements. We believe that the audit evidence we have obtained is sufficient and appropriate to provide a basis for our opinion
Key Audit Matters Key audit matters are those matters that, in our professional judgment, were of most significance in our audit of the consolidated financial statements of the current period. These matters were addressed in the context of our audit of the consolidated financial statements as a whole, and in forming our opinion thereon, and we do not provide a separate opinion on these matters. For each matter below, our description of how our audit addressed the matter is provided in that context.
We have fulfilled the responsibilities described in the Auditor’s responsibilities for the audit of the consolidated financial statements section of our report, including in relation to these matters. Accordingly, our audit included the performance of procedures designed to respond to our assessment of the risks of material misstatement of the consolidated financial statements. The results of our audit procedures, including the procedures performed to address the matters below, provide the basis for our audit opinion on the accompanying consolidated financial statements.
Ernst & Young Han YoungTaeyoung Building, 111, Yeouigongwon-ro, Yeongdeungpo-gu, Seoul 07241 Korea
Tel: +82 2 3787 6600 Fax: +82 2 783 5890 ey.com/kr

(1) Overstatements of revenues due to errors in recognizing variable consideration and consideration payable to the customer relating door-to-door sales channels and others.
As sales in the consolidated financial statements are one of key performance indicators of the Group’s financial performance, the sales in the consolidated financial statements are measured by taking account variable consideration and consideration payable to the customer through the door-to-door sales channel. Therefore we have identified the overstatement of revenue as a result of errors in recognition of variable consideration and consideration payable to the customer as a significant risk, considering the materiality and complexity of the estimates and calculations of items such as discounts, etc.
The main audit procedures that we conducted related to the considerations described above are as follows:
Verify abnormal items through requesting manually recorded journals for accounts related to the variable consideration and consideration payable to the customer
Confirm appropriate accounting treatment of revenue recognition in accordance to KIFRS 1115 Revenue from Contracts and Customers by reviewing nonstandard agreements concluded for the year ended December 31, 2018
Review reasonableness of revenue recognition by requesting and substantially testing documents regarding sales, discounts, and others
Conduct analytical procedures on items related to sales, discounts, and others, including trend analysis of monthly performance
(2) Appropriateness of disclosure on related party transactions and balances
As a member of LG Corp. Group affiliates, which is included as conglomerate affiliates under the Monopoly Regulations and Fair Trade Law, the Group has a large number of related parties and others according to Note 40. Related party transactions in the consolidated financial statements. We have identified the appropriateness of disclosure on related party transactions and balances as a significant risk, considering the possibilities of errors on disclosing the related party transactions and balances appropriately.
The main audit procedures that we conducted related to the considerations described above are as follows:
Confirm on whether the Group identified but did not disclose related party transactions and balances that existed by investigating shareholder, those charged with governance and board of director meeting minutes
Compare information disclosed by the Group with information of related party transactions and balances identified by the LG Corp., the representative of the LG conglomerate
Compare information disclosed by the Group with information of related party transactions and balances audited by component auditors
Perform analytical procedures on related party transactions and balances for the years ended December 31, 2018 and 2017
Review agreements related to related party transactions that resulted in significant changes Obtain confirmation of account receivables and account payables on material balances
(3) Impairment tests of goodwill and others
As per Note 18, Goodwill, Brand value and Bottler’s Agreement with indefinite useful lives (“Goodwill and others”) amount to 824,930 million, 416,107 million and 166,777 million and comprise 15.64%, 7.89% and 3.16% of total assets in the statement of financial position, respectively. We have identified the impairment tests of goodwill and others as a significant risk considering the possibility of errors in allocating goodwill to the appropriate CGU (or CGU group), complexity of estimation of value in use and involvement of subjective judgement.
The main audit procedures that we conducted related to the considerations described above are as follows:
Understanding and reviewing the appropriateness of the determination of CGU(or CGU group) and
goodwill allocation by inquiring with management and observation Evaluate capability and objectivity of external specialists utilized by the Group through reviewing
their profiles and confirming the certifications We review the rationality of assumption used in impairment tests by reviewing the communication
with internal and external experts We involved an EY internal valuation specialist to review the variable inputs used in the
measurement methods and valuation models used in calculating the recoverable amount of the CGU (or CGU Group) with an indication of impairment
We involved an EY internal valuation specialists to assist in reviewing business plans of CGU(or CGU group) with an indication of impairment
Responsibilities of management and those charged with governance for the financial statements
Management is responsible for the preparation and fair presentation of the consolidated financial statements in accordance with Korean International Financial Reporting Standards, and for such internal control as management determines is necessary to enable the preparation of consolidated financial statements that are free from material misstatement, whether due to fraud or error
In preparing the consolidated financial statements, management is responsible for assessing the Group’s ability to continue as a going concern, disclosing, as applicable, matters related to going concern and using the going concern basis of accounting unless management either intends to liquidate the Group or to cease operations, or has no realistic alternative but to do so. Those charged with governance are responsible for overseeing the Group’s financial reporting process. Auditor’s responsibilities for the audit of the consolidated financial statements Our objectives are to obtain reasonable assurance about whether the consolidated financial statements as a whole are free from material misstatement, whether due to fraud or error, and to issue an auditor’s report that includes our opinion. Reasonable assurance is a high level of assurance, but is not a guarantee that an audit conducted in accordance with Korean Auditing Standards (KGAAS) will always detect a material misstatement when it exists. Misstatements can arise from fraud or error and are considered material if, individually or in the aggregate, they could reasonably be expected to influence the economic decisions of users taken on the basis of these consolidated financial statements. As part of an audit in accordance with Korean Auditing Standards (KGAAS) we exercise professional judgment and maintain professional skepticism throughout the audit. We also:
Identify and assess the risks of material misstatement of the consolidated financial statements, whether due to fraud or error, design and perform audit procedures responsive to those risks, and obtain audit evidence that is sufficient and appropriate to provide a basis for our opinion. The risk of not detecting a material misstatement resulting from fraud is higher than for one resulting from error, as fraud may involve collusion, forgery, intentional omissions, misrepresentations, or the override of internal control.
Obtain an understanding of internal control relevant to the audit in order to design audit procedures that are appropriate in the circumstances, but not for the purpose of expressing an opinion on the effectiveness of the Group’s internal control.
Evaluate the appropriateness of accounting policies used and the reasonableness of accounting estimates and related disclosures made by management.
Conclude on the appropriateness of management’s use of the going concern basis of accounting and, based on the audit evidence obtained, whether a material uncertainty exists related to events or conditions that may cast significant doubt on the Group’s ability to continue as a going concern. If we conclude that a material uncertainty exists, we are required to draw attention in our auditor’s report to the related disclosures in the consolidated financial statements or, if such disclosures are inadequate, to modify our opinion. Our conclusions are
based on the audit evidence obtained up to the date of our auditor’s report. However, future events or conditions may cause the Group to cease to continue as a going concern.
Evaluate the overall presentation, structure and content of the financial statements, including the disclosures, and whether the financial statements represent the underlying transactions and events in a manner that achieves fair presentation.
Obtain sufficient appropriate audit evidence regarding the financial information of the entities or business activities within the Group to express an opinion on the consolidated financial statements. We are responsible for the direction, supervision and performance of the group audit. We remain solely responsible for our audit opinion.
We communicate with those charged with governance regarding, among other matters, the planned scope and timing of the audit and significant audit findings, including any significant deficiencies in internal control that we identify during our audit. We also provide those charged with governance with a statement that we have complied with relevant ethical requirements regarding independence, and to communicate with them all relationships and other matters that may reasonably be thought to bear on our independence, and where applicable, related safeguards.
From the matters communicated with those charged with governance, we determine those matters that were of most significance in the audit of the consolidated financial statements of the current period and are therefore the key audit matters. We describe these matters in our auditor’s report unless law or regulation precludes public disclosure about the matter or when, in extremely rare circumstances, we determine that a matter should not be communicated in our report because the adverse consequences of doing so would reasonably be expected to outweigh the public interest benefits of such communication. The partner in charge of the audit resulting in this independent auditor’s report is Cho, Sung Yeon. February 21, 2019
This audit report is effective as of February 21, 2019 the independent auditor’s report date. Accordingly, certain material subsequent events or circumstances may have occurred during the period from the auditor’s report date to the time this report is used. Such events and circumstances could significantly affect the accompanying consolidated financial statements and may result in modifications to this report.

LG Household & Health Care Ltd. and its subsidiaries
Consolidated financial statements for the years ended December 31, 2018 and 2017
“The accompanying consolidated financial statements, including all footnotes and disclosures, have been prepared by, and are the responsibility of, the Group.”
Suk Cha Chief Executive Officer LG Household & Health Care Ltd.
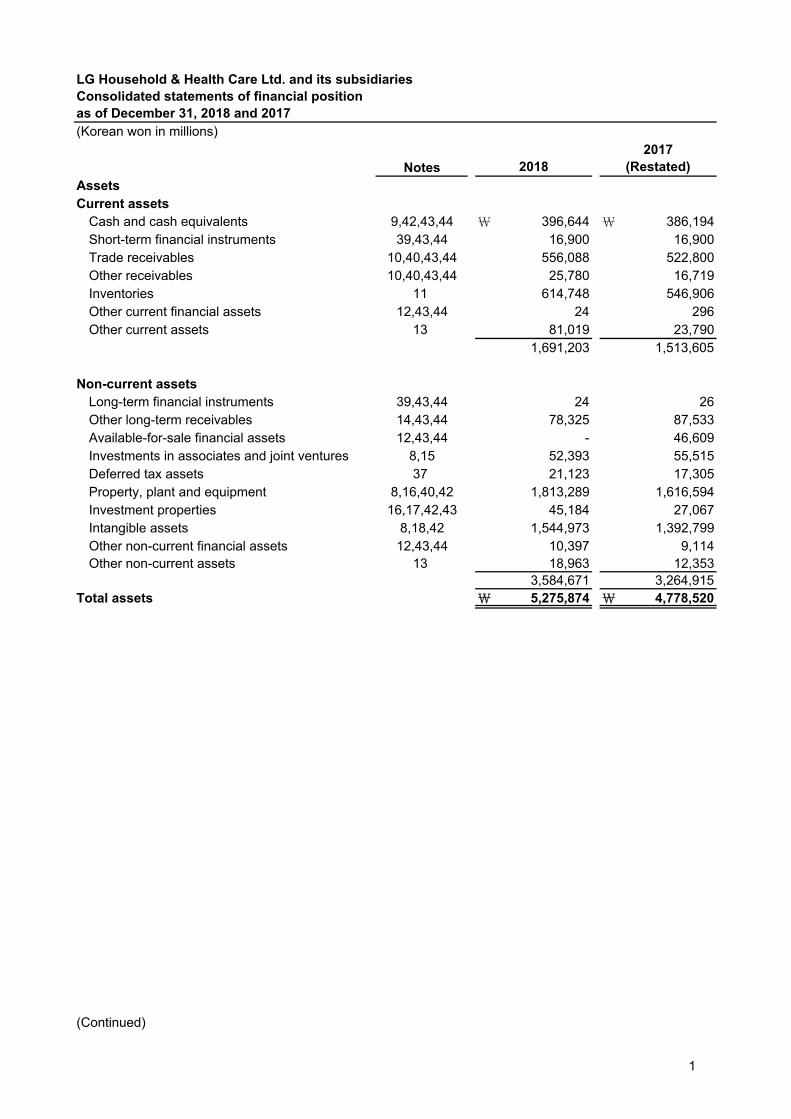
(Korean won in millions)
AssetsCurrent assets
Cash and cash equivalents 9,42,43,44 \ 396,644 \ 386,194Short-term financial instruments 39,43,44 16,900 16,900Trade receivables 10,40,43,44 556,088 522,800Other receivables 10,40,43,44 25,780 16,719Inventories 11 614,748 546,906Other current financial assets 12,43,44 24 296Other current assets 13 81,019 23,790
1,691,203 1,513,605
Non-current assetsLong-term financial instruments 39,43,44 24 26Other long-term receivables 14,43,44 78,325 87,533Available-for-sale financial assets 12,43,44 - 46,609Investments in associates and joint ventures 8,15 52,393 55,515Deferred tax assets 37 21,123 17,305Property, plant and equipment 8,16,40,42 1,813,289 1,616,594Investment properties 16,17,42,43 45,184 27,067Intangible assets 8,18,42 1,544,973 1,392,799Other non-current financial assets 12,43,44 10,397 9,114Other non-current assets 13 18,963 12,353
3,584,671 3,264,915Total assets \ 5,275,874 \ 4,778,520
TRUE TRUE
(Continued)
LG Household & Health Care Ltd. and its subsidiariesConsolidated statements of financial positionas of December 31, 2018 and 2017
20182017
(Restated)Notes
1

LG Household & Health Care Ltd. and its subsidiariesConsolidated statements of financial positionas of December 31, 2018 and 2017 (cont'd)(Korean won in millions)
LiabilitiesCurrent liabilities
Trade payables 19,40,43,44 \ 215,581 \ 231,497Other payables 19,40,43,44 258,640 238,250Short-term borrowings 10,20,39,42,43,44 210,810 71,041Current portion of long-term borrowings 21,42,43,44 13,566 5,000Current portion of long-term debentures 21,42,43,44 149,962 259,985Income tax payable 37 192,628 156,577Deferred revenue 22,24 25,709 24,230Refund liabilities 25 16,700 10,249Other current financial liabilities 42,43,44 199,699 180,345Other current liabilities 22,23,43,44 75,588 68,267
1,358,883 1,245,441
Non-current liabilitiesLong-term borrowings 21,39,40,42,43,44 7,132 18,342Long-term debentures 21,42,43,44 99,907 249,659Deposit received 43,44 7,325 8,352Post-employment benefit liabilities 26 34,257 34,718Deferred tax liabilities 37 119,996 107,513Other non-current financial liabilities 23,42,43,44 23,937 11,681Other non-current liabilities 23,43,44 30,417 21,031
322,971 451,296Total liabilities 1,681,854 1,696,737
Equity Issued capital 27 88,589 88,589Share premium 28 97,326 97,326Retained earnings 29 3,563,365 3,044,143Accumulated other comprehensive loss 30 (121,625) (132,784)Other components of equity 31 (115,589) (101,039)Equity attributable to equity holders of the parent 3,512,066 2,996,235Non-controlling interests 7 81,954 85,548
Total equity 3,594,020 3,081,783Total liabilities and equity \ 5,275,874 \ 4,778,520
TRUE TRUETRUE TRUE
The accompanying notes are an integral part of the consolidated financial statements.
Notes 20182017
(Restated)
2
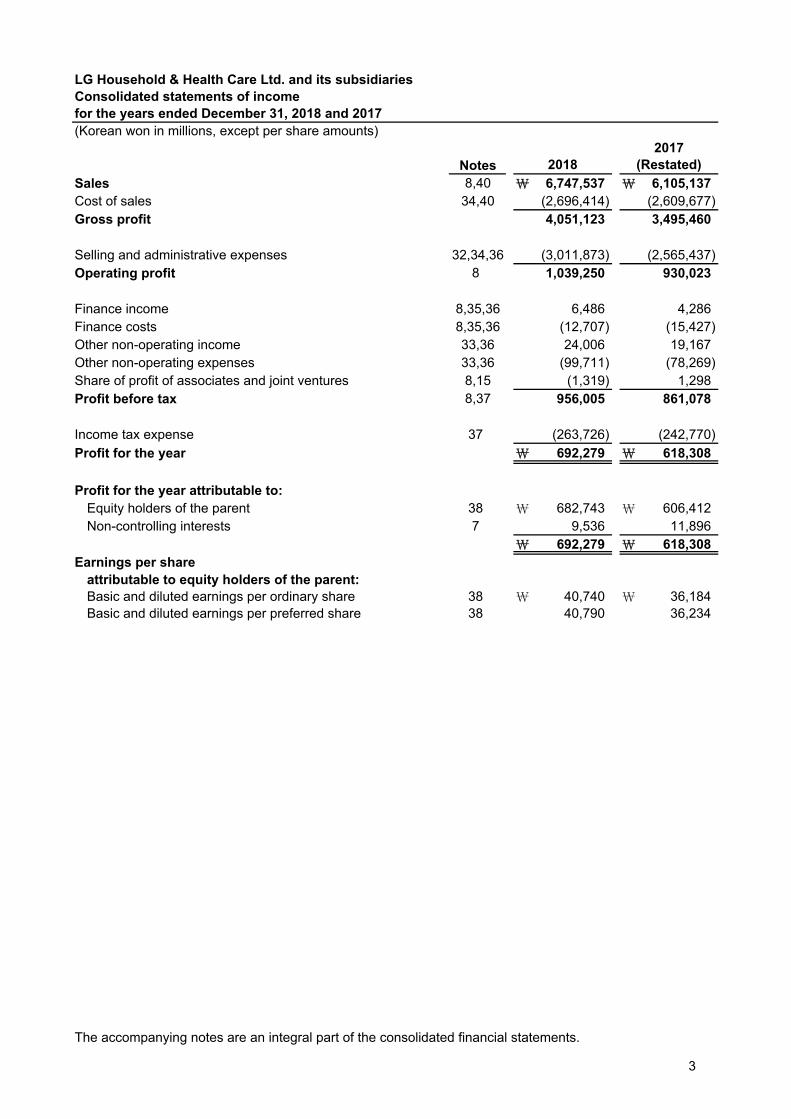
(Korean won in millions, except per share amounts)
Sales 8,40 \ 6,747,537 \ 6,105,137Cost of sales 34,40 (2,696,414) (2,609,677)Gross profit 4,051,123 3,495,460
Selling and administrative expenses 32,34,36 (3,011,873) (2,565,437)Operating profit 8 1,039,250 930,023
Finance income 8,35,36 6,486 4,286Finance costs 8,35,36 (12,707) (15,427)Other non-operating income 33,36 24,006 19,167Other non-operating expenses 33,36 (99,711) (78,269)Share of profit of associates and joint ventures 8,15 (1,319) 1,298Profit before tax 8,37 956,005 861,078 Income tax expense 37 (263,726) (242,770)Profit for the year \ 692,279 \ 618,308
Profit for the year attributable to:Equity holders of the parent 38 \ 682,743 \ 606,412Non-controlling interests 7 9,536 11,896
\ 692,279 \ 618,308Earnings per share TRUE TRUE
attributable to equity holders of the parent:Basic and diluted earnings per ordinary share 38 \ 40,740 \ 36,184Basic and diluted earnings per preferred share 38 40,790 36,234
TRUE TRUE
The accompanying notes are an integral part of the consolidated financial statements.
LG Household & Health Care Ltd. and its subsidiariesConsolidated statements of incomefor the years ended December 31, 2018 and 2017
Notes 20182017
(Restated)
3

(Korean won in millions)
Profit for the year \ 692,279 \ 618,308
Other comprehensive income (loss):Other comprehensive income not to be reclassified to profit or loss in subsequent periods (net of tax):
Re-measurements gain (loss) on the net defined benefit plans 26,29 (11,814) 25,535
Net loss on valuation of financial assetat fair value through OCI 12,30,36 (765) -
Net other comprehensive income (loss) not to be reclassified to profit or loss in subsequent periods (12,579) 25,535
Other comprehensive income to be reclassified toprofit or loss in subsequent periods (net of tax):
Net gain on available-for-sale financial assets 12,30,36 - 52Share of other comprehensive loss of a joint venture 15,30 216 (72)Exchange differences on translation of foreign operations 30 12,566 (41,569)
Net other comprehensive income (loss) to be reclassfied to profit or loss in subsequent periods 12,782 (41,589)
Other comprehensive income (loss) for the year, net of tax 203 (16,054)Total comprehensive income for the year, net of tax \ 692,482 \ 602,254
TRUE TRUETotal comprehensive income attributable to:
Equity holders of the parent \ 683,409 \ 590,651Non-controlling interests 7 9,073 11,603
\ 692,482 \ 602,254TRUE TRUE
The accompanying notes are an integral part of the consolidated financial statements.
2017(Restated)Notes 2018
for the years ended December 31, 2018 and 2017
LG Household & Health Care Ltd. and its subsidiariesConsolidated statements of other comprehensive income
4

(Kor
ean
won
in m
illion
s)
Not
esA
s of
Jan
uary
1, 2
017
(Res
tate
d )2
\88
,589\
97,3
26\
2,53
8,88
4\
(92,
400)\
(100
,633
)\
2,53
1,76
6\
88,4
82\
2,62
0,24
8Pr
ofit
for t
he y
ear
29-
-60
6,41
2-
-60
6,41
211
,896
618,
308
Re-
mea
sure
men
ts g
ain
on th
e ne
t def
ined
ben
efit
plan
s26
,29
--
24,6
23-
-24
,623
912
25,5
35N
et g
ain
on v
alua
tion
ofav
aila
ble-
for-s
ale
finan
cial
ass
ets
12,3
0-
--
52-
52-
52Sh
are
of o
ther
com
preh
ensi
ve lo
ss
of a
join
t ven
ture
15,3
0-
--
(72)
-(7
2)-
(72)
Exch
ange
diff
eren
ces
on tr
ansl
atio
n of
fore
ign
oper
atio
ns30
--
-(4
0,36
4)-
(40,
364)
(1,2
05)
(41,
569)
Tota
l com
preh
ensi
ve in
com
e-
-63
1,03
5(4
0,38
4)-
590,
651
11,6
0360
2,25
4
Cas
h di
vide
nds
29-
-(1
25,7
76)
--
(125
,776
)(5
,870
)(1
31,6
46)
Cap
ital r
educ
tion
of s
ubsi
diar
ies
--
--
--
(8,2
50)
(8,2
50)
Cha
nges
in n
on-c
ontro
lling
inte
rest
s-
--
--
-(4
45)
(445
)O
ther
s-
--
-(4
06)
(406
)28
(378
)A
s of
Dec
embe
r 31,
201
7\
88,5
89\
97,3
26\
3,04
4,14
3\
(132
,784
)\
(101
,039
)\
2,99
6,23
5\
85,5
48\
3,08
1,78
3
TRU
ETR
UE
TRU
ETR
UE
TRU
ETR
UE
TRU
ETR
UE
(Con
tinue
d)
Attr
ibut
able
to th
e eq
uity
hol
ders
of t
he p
aren
t
com
preh
ensi
vein
com
e (lo
ss)
com
pone
nts
of e
quity
Tota
lIs
sued
cap
ital
Shar
epr
emiu
mR
etai
ned
earn
ings
LG H
ouse
hold
& H
ealth
Car
e Lt
d. a
nd it
s su
bsid
iarie
sC
onso
lidat
ed s
tate
men
ts o
f cha
nges
in e
quity
for t
he y
ears
end
ed D
ecem
ber 3
1, 2
018
and
2017
Tota
l equ
ity
othe
rA
ccum
ulat
edO
ther
Non
-con
trol
ling
inte
rest
s
5

LG H
ouse
hold
& H
ealth
Car
e Lt
d. a
nd it
s su
bsid
iarie
sC
onso
lidat
ed s
tate
men
ts o
f cha
nges
in e
quity
for t
he y
ears
end
ed D
ecem
ber 3
1, 2
018
and
2017
(con
t'd)
(Kor
ean
won
in m
illion
s)
Not
esA
s of
Jan
uary
1, 2
018
\88
,589\
97,3
26\
3,04
4,14
3\
(132
,784
)\
(101
,039
)\
2,99
6,23
5\
85,5
48\
3,08
1,78
3Ef
fect
of a
dopt
ion
of
new
acc
ount
ing
stan
dard
s2,
29-
-(1
,394
)(7
25)
-(2
,119
)-
(2,1
19)
Prof
it fo
r the
yea
r29
--
682,
743
--
682,
743
9,53
669
2,27
9R
e-m
easu
rem
ents
gai
non
the
net d
efin
ed b
enef
it pl
ans
26,2
9-
-(1
1,20
2)-
-(1
1,20
2)(6
12)
(11,
814)
Net
loss
on
valu
atio
n of
fina
ncia
l ass
etat
fair
valu
e th
roug
h O
CI
12,3
0-
--
(731
)-
(731
)(3
4)(7
65)
Shar
e of
oth
er c
ompr
ehen
sive
loss
of
a jo
int v
entu
re15
,30
--
-21
6-
216
-21
6Ex
chan
ge d
iffer
ence
s on
tran
slat
ion
of fo
reig
n op
erat
ions
30-
--
12,3
83-
12,3
8318
312
,566
Tota
l com
preh
ensi
ve in
com
e-
-67
1,54
111
,868
-68
3,40
99,
073
692,
482
Cas
h di
vide
nds
29-
-(1
50,9
09)
--
(150
,909
)(1
0,82
5)(1
61,7
34)
Cha
nges
in n
on-c
ontro
lling
inte
rest
s29
--
(16)
16(1
4,55
0)(1
4,55
0)(1
,842
)(1
6,39
2)A
s of
Dec
embe
r 31,
201
8\
88,5
89\
97,3
26\
3,56
3,36
5\
(121
,625
)\
(115
,589
)\
3,51
2,06
6\
81,9
54\
3,59
4,02
0TR
UE
TRU
ETR
UE
TRU
ETR
UE
TRU
ETR
UE
The
acco
mpa
nyin
g no
tes
are
an in
tegr
al p
art o
f the
con
solid
ated
fina
ncia
l sta
tem
ents
.
Attr
ibut
able
to th
e eq
uity
hol
ders
of t
he p
aren
t
Acc
umul
ated
othe
rO
ther
Non
-con
trol
ling
Issu
ed c
apita
lpr
emiu
mea
rnin
gsin
com
e (lo
ss)
of e
quity
Tota
lin
tere
sts
Tota
l equ
itySh
are
Ret
aine
dco
mpr
ehen
sive
com
pone
nts
6

LG Household & Health Care Ltd. and its subsidiariesConsolidated statements of cash flowsfor the years ended December 31, 2018 and 2017(Korean won in millions)
Operating activitiesProfit for the year \ 692,279 \ 618,308Adjustments to reconcile profit before tax to net cash flows
Depreciation 135,694 127,125Amortization 21,753 19,289Post-employment benefits 43,993 48,457Provision for allowance for doubtful accounts (182) 1,335Provision for other allowance for doubtful accounts (958) 428Interest expenses 10,136 13,954Loss on foreign currencies translations 1,270 3,402Net profit on derivative instruments at financial assets at FVPL (910) -Net loss on derivative instruments at financial assets at FVPL 882 -Net profit on derivative instruments at financial debts at FVPL (527) -Loss from valuation of derivatives - 309Loss on disposal of property, plant and equipment 10,130 6,735Loss on disposal of intangible assets 436 1,798Impairment losses on property, plant and equipment 10,848 7,652Impairment losses on investment properties 932 220Impairment losses on intangible assets 28,981 773Income tax expenses 263,726 242,770Interest income (3,836) (3,480)Dividend income (19) (22)Gain on foreign currencies translations (992) (1,136)Gain on disposal of property, plant and equipment (2,007) (1,101)Gain on disposal of intangible assets (60) (1)Gain on disposal of investment properties - (322)Share of profit of associates and joint ventures 1,319 (1,298)Gain from asset contribution (35) -
Working capital adjustments:Trade receivables 3,679 (62,256)Other receivables 841 (2,377)Inventories (43,471) (16,587)Other current assets (57,653) 5,483Other non-current assets (3,945) 728Trade payables (42,740) 10,335Other payables 21,885 (13,458)Deferred revenue 2,171 (163)Refund liabilities (7,971) (402)Other current financial liabilities 30,050 2,527Other current liabilities 3,140 3,573Deposit received 381 (2,018)Payment of post-employment benefits (4,439) (2,431)Transfer of post-employment benefit liabilities 961 345Plan assets (64,310) (17,592)
Other non-current liabilities 7,046 (13,656)
Interest received 4,612 3,926Dividends received 2,483 3,550Interest paid (11,629) (14,364)Income tax paid (236,827) (234,881)
Net cash flows provided by operating activities \ 817,117 \ 735,477
(Continued)
20182017
(Restated)
7

LG Household & Health Care Ltd. and its subsidiariesConsolidated statements of cash flowsfor the years ended December 31, 2018 and 2017 (cont'd)(Korean won in millions)
Investing activitiesDecrease in short-term financial instruments \ 7,043 \ 10,000Decrease in other receivables 2,419 598Decrease in long-term financial instruments 493 1Decrease in other long-term receivables 19,766 14,432Proceeds from sale of property, plant and equipment 3,296 2,277Proceeds from sale of intangible assets 95 29Proceeds from sale of investment properties - 1,287Net cash inflows due to business combinations 7,846 -Increase in short-term financial instruments (5,000) -Increase in other receivables (695) (1,163)Increase in other long-term receivables (11,320) (10,392)Increase in other non-current financial assets (200) -Acquisition of available-for-sale financial assets - (40,623)Net cash outflows due to business combinations (89,907) (10,605)Acquisition of property, plant and equipment (356,285) (284,206)Acquisition of intangible assets (7,843) (6,601)Acquisition of other non-current assets - (8,833)
Net cash flows used in investing activities (430,292) (333,799)
Financing activities Proceeds from short-term borrowings 323,463 77,617Proceeds from long-term borrowings 2,356 15,582Repayment of short-term borrowings (237,236) (96,524)Repayment of current portion of long-term borrowings (7,121) (5,000)Repayment of long-term borrowings (17,943) -Repayment of current portion of long-term debentures (261,718) (180,000)Repayment of long-term debentures (720) -Repayment of convertible bonds (5,378) -Decrease in finance lease liabilities (139) (26)Acquisition of investments in subsidiaries (11,876) (20,000)Capital reduction of subsidiaries - (8,250)Changes in non-controlling interests - (556)Dividends paid (161,725) (133,964)
Net cash flows used in financing activities (378,037) (351,121)
Net increase (decrease) in cash and cash equivalents 8,788 50,557Cash and cash equivalents at January 1 386,194 338,852
Effect of exchange rate fluctuations on cash and cash equivalents 225 (331)Exchange differences on translation of foreign operations 1,437 (2,884)
Cash and cash equivalents at December 31 \ 396,644 \ 386,194TRUE TRUE
The accompanying notes are an integral part of the consolidated financial statements.
2018 2017
8

LG Household & Health Care Ltd. and its subsidiaries Notes to the consolidated financial statements December 31, 2018 and 2017
9
1. Corporate information LG Household & Health Care Ltd. (the “Company”) was established through a spin-off from LG Corp. (formerly, LGCI) on April 1, 2001 and listed its ordinary shares on the KOSPI market of the Korea Exchange (KRX) on April 25, 2001. As at the current reporting date, the Company’s headquarters is located at 58, Saemunan-ro, Jongno-gu, Seoul, Korea and the manufacturing plants are located in Cheongju, Ulsan, Onsan and Naju.
As of December 31, 2018, the Company’s issued capital amounts to \88,589 million (including preferred stock
amounting to \10,498 million), and the Company’s largest shareholder is LG Corp., which holds 34.03% of the
Company’s ordinary shares. The Company is authorized to issue 70 million shares of common and preferred shares in total at the par value
of \5,000 per share, and the shares issued and outstanding are comprised of 15,618,197 ordinary shares and
2,099,697 preferred shares as of December 31, 2018. Preferred shares are non-participating with no voting rights, and additional 1% per annum based on the face value of the shares will be paid in cash for preferred shares over the dividends on ordinary shares. The accompanying consolidated financial statements, for the year ended December 31, 2018, consist of the Company and its subsidiaries (collectively, the “Group”), its associates and joint ventures. Details of the subsidiaries and summarized financial information are provided in Note 5. 2. Basis of preparation and summary of significant accounting policies
2.1 Basis preparation The Group prepares statutory financial statements in the Korean language in accordance with Korean International Financial Reporting Standards (KIFRS) enacted by the Act on External Audit of Stock Companies. The accompanying consolidated financial statements have been translated into English from the Korean language financial statements. In the event of any differences in interpreting the consolidated financial statements or the independent auditors’ report thereon, the Korean version, which is used for regulatory reporting purposes, shall prevail. The consolidated financial statements have been prepared on a historical cost basis, except for financial instruments and others that have been measured at fair value. The consolidated financial statements are presented in Korean won (KRW) and all values are rounded to the nearest millions, except when otherwise indicated. The consolidated financial statements provide comparative information in respect of the previous period. In addition, the Group presents an additional statement of financial position at the beginning of the earliest period presented when there is a retrospective application of an accounting policy, a retrospective restatement, or a reclassification of items in the consolidated financial statements and these significantly affect the financial position at the beginning of the earliest period presented. 2.2 Basis of consolidation The consolidated financial statements comprise the financial statements of the Group and its subsidiaries as of December 31, 2018. Control is achieved when the Group is exposed, or has rights, to variable returns from its involvement with the investee and has the ability to affect those returns through its power over the investee. Specifically, the Group controls an investee if, and only if, the Group has: Power over the investee (i.e., existing rights that give it the current ability to direct the relevant activities of
the investee) Exposure, or rights, to variable returns from its involvement with the investee, and The ability to use its power over the investee to affect its returns
9

LG Household & Health Care Ltd. and its subsidiaries Notes to the consolidated financial statements December 31, 2018 and 2017
10
2.2 Basis of consolidation (cont’d) When the Group has less than a majority of the voting or similar rights of an investee, the Group considers all relevant facts and circumstances in assessing whether it has power over an investee, including: The contractual arrangement with the other vote holders of the investee Rights arising from other contractual arrangements The Group’s voting rights and potential voting rights The Group re-assesses whether or not it controls an investee if facts and circumstances indicate that there are changes to one or more of the three elements of control. Consolidation of a subsidiary begins when the Group obtains control over the subsidiary and ceases when the Group loses control of the subsidiary. Assets, liabilities, income and expenses of a subsidiary acquired or disposed of during the year are included in the consolidated statement of comprehensive income from the date the Group gains control until the date the Group ceases to control the subsidiary. Profit or loss and each component of other comprehensive income (OCI) are attributed to the equity holders of the parent of the Group and to the non-controlling interests, even if this results in the non-controlling interests having a deficit balance. When necessary, adjustments are made to the financial statements of subsidiaries to bring their accounting policies into line with the Group’s accounting policies. All intra-group assets and liabilities, equity, income, expenses and cash flows relating to transactions between members of the Group are eliminated in full on consolidation. A change in the ownership interest of a subsidiary, without a loss of control, is accounted for as an equity transaction. If the Group loses control over a subsidiary, it derecognizes the related assets (including goodwill), liabilities, non-controlling interest and other components of equity while any resultant gain or loss is recognized in profit or loss. Any investment is recognized at fair value. 2.3 Summary of significant accounting policies 2.3.1 Business combinations and goodwill Business combinations are accounted for using the acquisition method. The cost of an acquisition is measured as the aggregate of the consideration transferred measured at acquisition date fair value and the amount of any non-controlling interests in the acquiree. For each business combination, the Group elects whether to measure the non-controlling interests in the acquiree at fair value or at the proportionate share of the acquiree’s identifiable net assets. Acquisition-related costs are expensed as incurred and included in expenses. When the Group acquires a business, it assesses the financial assets and liabilities assumed for appropriate classification and designation in accordance with the contractual terms, economic circumstances and pertinent conditions as at the acquisition date. This includes the separation of embedded derivatives in host contracts by the acquiree. Any contingent consideration to be transferred by the acquirer will be recognized at fair value at the acquisition date. Contingent consideration classified as an asset or liability that is a financial instrument and within the scope of KIFRS 1109 Financial Instruments is measured at fair value with changes in fair value recognized either in either profit or loss or as a change to OCI. Contingent consideration that is classified as equity is not re-measured and subsequent settlement is accounted for within equity. If the contingent consideration is not within the scope of KIFRS 1109, it is measured in accordance with the appropriate KIFRS. Goodwill is initially measured at cost, being the excess of the aggregate of the consideration transferred and
the amount recognized for non-controlling interests, and any previous interest held, over the net identifiable
assets acquired and liabilities assumed. If the fair value of the net assets acquired is in excess of the aggregate
consideration transferred, the Group re-assesses whether it has correctly identified all of the assets acquired
and all of the liabilities assumed and reviews the procedures used to measure the amounts to be recognized
at the acquisition date. If the re-assessment still results in an excess of the fair value of net assets acquired
over the aggregate consideration transferred, then the gain is recognized in profit or loss.
10
LG Household & Health Care Ltd. and its subsidiaries Notes to the consolidated financial statements December 31, 2018 and 2017
11
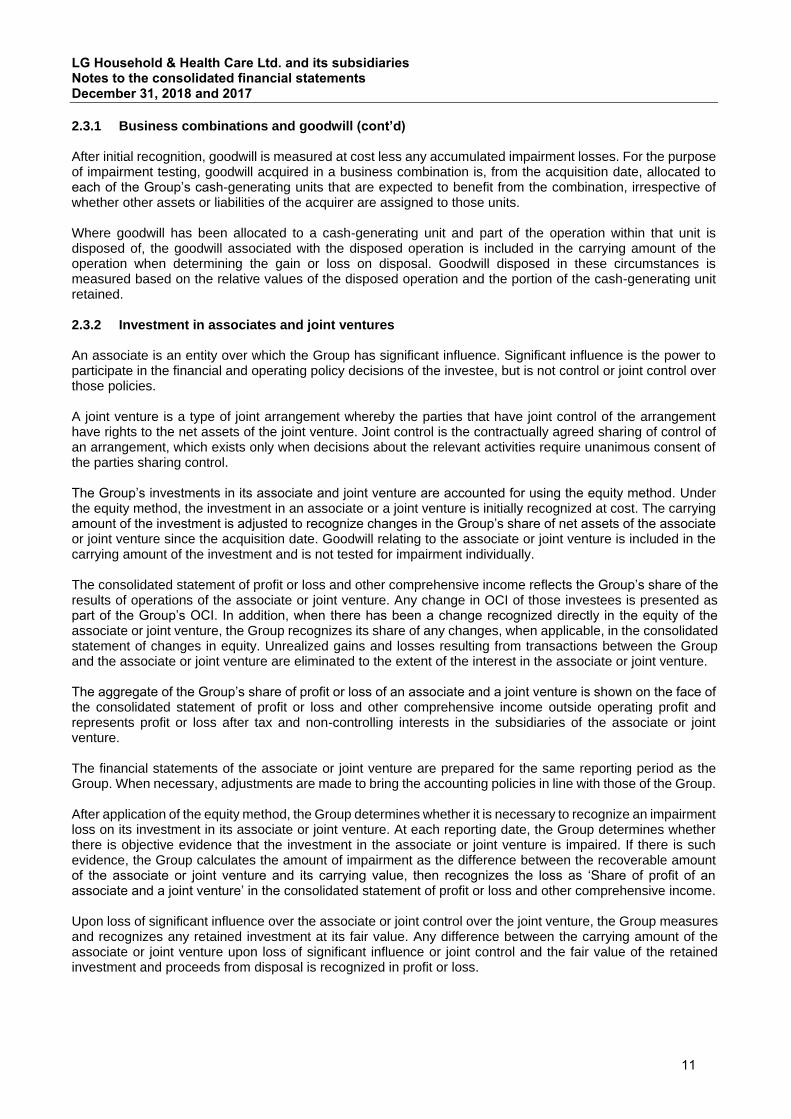
2.3.1 Business combinations and goodwill (cont’d) After initial recognition, goodwill is measured at cost less any accumulated impairment losses. For the purpose of impairment testing, goodwill acquired in a business combination is, from the acquisition date, allocated to each of the Group’s cash-generating units that are expected to benefit from the combination, irrespective of whether other assets or liabilities of the acquirer are assigned to those units. Where goodwill has been allocated to a cash-generating unit and part of the operation within that unit is disposed of, the goodwill associated with the disposed operation is included in the carrying amount of the operation when determining the gain or loss on disposal. Goodwill disposed in these circumstances is measured based on the relative values of the disposed operation and the portion of the cash-generating unit retained. 2.3.2 Investment in associates and joint ventures An associate is an entity over which the Group has significant influence. Significant influence is the power to participate in the financial and operating policy decisions of the investee, but is not control or joint control over those policies. A joint venture is a type of joint arrangement whereby the parties that have joint control of the arrangement have rights to the net assets of the joint venture. Joint control is the contractually agreed sharing of control of an arrangement, which exists only when decisions about the relevant activities require unanimous consent of the parties sharing control. The Group’s investments in its associate and joint venture are accounted for using the equity method. Under the equity method, the investment in an associate or a joint venture is initially recognized at cost. The carrying amount of the investment is adjusted to recognize changes in the Group’s share of net assets of the associate or joint venture since the acquisition date. Goodwill relating to the associate or joint venture is included in the carrying amount of the investment and is not tested for impairment individually. The consolidated statement of profit or loss and other comprehensive income reflects the Group’s share of the results of operations of the associate or joint venture. Any change in OCI of those investees is presented as part of the Group’s OCI. In addition, when there has been a change recognized directly in the equity of the associate or joint venture, the Group recognizes its share of any changes, when applicable, in the consolidated statement of changes in equity. Unrealized gains and losses resulting from transactions between the Group and the associate or joint venture are eliminated to the extent of the interest in the associate or joint venture. The aggregate of the Group’s share of profit or loss of an associate and a joint venture is shown on the face of the consolidated statement of profit or loss and other comprehensive income outside operating profit and represents profit or loss after tax and non-controlling interests in the subsidiaries of the associate or joint venture. The financial statements of the associate or joint venture are prepared for the same reporting period as the Group. When necessary, adjustments are made to bring the accounting policies in line with those of the Group. After application of the equity method, the Group determines whether it is necessary to recognize an impairment loss on its investment in its associate or joint venture. At each reporting date, the Group determines whether there is objective evidence that the investment in the associate or joint venture is impaired. If there is such evidence, the Group calculates the amount of impairment as the difference between the recoverable amount of the associate or joint venture and its carrying value, then recognizes the loss as ‘Share of profit of an associate and a joint venture’ in the consolidated statement of profit or loss and other comprehensive income. Upon loss of significant influence over the associate or joint control over the joint venture, the Group measures and recognizes any retained investment at its fair value. Any difference between the carrying amount of the associate or joint venture upon loss of significant influence or joint control and the fair value of the retained investment and proceeds from disposal is recognized in profit or loss.
11
LG Household & Health Care Ltd. and its subsidiaries Notes to the consolidated financial statements December 31, 2018 and 2017
12
2.3.3 Current versus non-current classification The Group presents assets and liabilities in the consolidated statement of financial position based on current/non-current classification. An asset is current when it is: Expected to be realized or intended to be sold or consumed in the normal operating cycle Held primarily for the purpose of trading Expected to be realized within twelve months after the reporting period, or Cash or cash equivalent unless restricted from being exchanged or used to settle a liability for at least
twelve months after the reporting period All other assets are classified as non-current. A liability is current when: It is expected to be settled in the normal operating cycle It is held primarily for the purpose of trading It is due to be settled within twelve months after the reporting period, or There is no unconditional right to defer the settlement of the liability for at least twelve months after the
reporting period The Group classifies all other liabilities as non-current. Deferred tax assets and liabilities are classified as non-current assets and liabilities. 2.3.4 Fair value measurement The Group measures financial instruments, such as, derivatives, at fair value at each balance sheet date. Fair value is the price that would be received to sell an asset or paid to transfer a liability in an ordinary transaction between market participants at the measurement date. The fair value measurement is based on the presumption that the transaction to sell the asset or transfer the liability takes place either: In the principal market for the asset or liability, or In the absence of a principal market, in the most advantageous market for the asset or liability The principal or the most advantageous market must be accessible by the Group. The fair value of an asset or a liability is measured using the assumptions that market participants would use when pricing the asset or liability, assuming that market participants act in their economic best interest. A fair value measurement of a non-financial asset takes into account a market participant's ability to generate economic benefits by using the asset in its highest and best use or by selling it to another market participant that would use the asset in its highest and best use. All assets and liabilities for which fair value is measured or disclosed in the consolidated financial statements are categorized within the fair value hierarchy, described as follows, based on the lowest level input that is significant to the fair value measurement as a whole: Level 1 — Quoted (unadjusted) market prices in active markets for identical assets or liabilities Level 2 — Valuation techniques for which the lowest level input that is significant to the fair value
measurement is directly or indirectly observable Level 3 — Valuation techniques for which the lowest level input that is significant to the fair value
measurement is unobservable For assets and liabilities that are recognized in the consolidated financial statements on a recurring basis, the Group determines whether transfers have occurred between Levels in the hierarchy by re-assessing categorization (based on the lowest level input that is significant to the fair value measurement as a whole) at the end of each reporting period.
12

LG Household & Health Care Ltd. and its subsidiaries Notes to the consolidated financial statements December 31, 2018 and 2017
13
2.3.4 Fair value measurement (cont’d) External professionals are involved for valuation of significant assets, such as investment properties and financial asset. Involvement of external professionals is decided upon by approval of chief financial officer. Selection criteria include market knowledge, reputation, independence and whether professional standards are maintained. The Group decides, after discussions with the Group’s external professionals, which valuation techniques and inputs to use for each case. At each reporting date, the Group analyses the movements in the values of assets and liabilities which are required to be re- measured or re-assessed as per the Group’s accounting policies. For this analysis, the Group verifies the major inputs applied in the latest valuation by agreeing the information in the valuation computation to contracts and other relevant documents. The Group, in conjunction with the Group’s external professionals, also compares each the changes in the fair value of each asset and liability with relevant external sources to determine whether the change is reasonable. On an interim basis, the Group and the Group’s external professionals present the valuation results to the Group’s independent auditors. This includes a discussion of the major assumptions used in the valuations. For the purpose of fair value disclosures, the Group has determined classes of assets and liabilities on the basis of the nature, characteristics and risks of the asset or liability and the level of the fair value hierarchy as explained above. Fair value related disclosures for financial instruments and non-financial assets that are measured at fair value or where fair values are disclosed, are summarized in the following notes: Notes
Disclosure for valuation methods, significant estimates and assumptions 3, 43 Quantitative disclosures of fair value measurement hierarchy 43 Financial instruments(Include instruments measured at amortized cost) 43 Investment properties 17,43 2.3.5 Foreign currencies The Group’s consolidated financial statements are presented in Korean won, which is also the parent company’s functional currency. Each entity, the Group determines the functional currency and items included in the financial statements of each entity are measured using that functional currency. 2.3.5.1 Transactions and balances Transactions in foreign currencies are initially recorded by the Group entities at their respective functional currency spot rates at the date the transaction first qualifies for recognition. Monetary assets and liabilities denominated in foreign currencies are retranslated at the functional currency spot rate of exchange at the reporting date. Differences arising on settlement or translation of monetary items are recognized in profit or loss with the exception of monetary items that are designated as part of the hedge of the Group’s net investment of a foreign operation. These are recognized in other comprehensive income until the net investment is disposed, at which time, the cumulative amount is reclassified to the income statement. Tax charges and credits attributable to exchange differences on those monetary items are also recorded in other comprehensive income. Non-monetary items that are measured in terms of historical cost in a foreign currency are translated using the exchange rates as at the dates of the initial transactions. Non-monetary items measured at fair value in a foreign currency are translated using the exchange rates at the date when the fair value is determined. The gain or loss arising on retranslation of non-monetary items is treated in line with the recognition of gain or loss on change in fair value of the item (i.e., translation differences on items whose fair value gain or loss is recognized in other comprehensive income or profit or loss is also recognized in other comprehensive income or profit or loss, respectively).
13

LG Household & Health Care Ltd. and its subsidiaries Notes to the consolidated financial statements December 31, 2018 and 2017
14
2.3.5 Foreign currencies (cont’d) The transaction date for determining the exchange rate to be applied on the initial recognition of the related asset, expense, income (or part of it) is the date when the Group first recognizes the relating non-monetary asset or non-monetary liability by making a prepayment or receiving an advance for the consideration. If there are multiple prepayments or advances received, the Group determines the transaction date based on each respective prepayment or advances received. 2.3.5.2 Group companies On consolidation, the assets and liabilities of foreign operations are translated into Korean won at the rate of exchange prevailing at the reporting date and their income statements are translated at average exchange rates during the reporting period. The exchange differences arising on translation for consolidation are recognized in other comprehensive income. On disposal of a foreign operation, the component of other comprehensive income relating to that particular foreign operation is recognized in profit or loss. Any goodwill arising on the acquisition of a foreign operation and any fair value adjustments to the carrying amounts of assets and liabilities arising on the acquisition are treated as assets and liabilities of the foreign operation and translated at the spot rate of exchange at the reporting date. 2.3.6 Property, plant and equipment Property, plant and equipment is stated at cost, net of accumulated depreciation and accumulated impairment losses, if any. Such cost includes the cost of replacing part of the property, plant and equipment and borrowing costs for long-term construction projects if the recognition criteria are met. When significant parts of property, plant and equipment are required to be replaced at intervals, the Group recognizes such parts as individual assets with specific useful lives and depreciates them accordingly. Likewise, when a major inspection is performed, its cost is recognized in the carrying amount of the plant and equipment as a replacement if the recognition criteria are satisfied. All other repair and maintenance costs are recognized in profit or loss as incurred. The present value of the expected cost for the decommissioning of an asset after its use is included in the cost of the respective asset if the recognition criteria for a provision are met. Depreciation of property and equipment is provided using the straight-line method over the estimated useful life of the assets as follows and assessed for impairment whenever there is an indication that the asset may be impaired:
Useful lives (years)
Buildings 20 ~ 50 Structures 20 ~ 50 Machinery 10 ~ 12 Vehicles 5 ~ 10 Tools and equipment 2 ~ 6 Furniture and fixtures 2 ~ 12 Other property, plant and equipment (“Other PP&E”) 4 ~ 5 At least the end of every reporting period, the Group reviews the residual values, useful lives and depreciation methods of assets, and if it judges after review that it is appropriate to change them, the Group applies changes in accounting estimates in accounting treatments. Depreciations are recognized in the consolidated statement of profit or loss in expense categories consistent with the function of the depreciate property, plant and equipment. Property, plant and equipment are derecognized either when they have been disposed of (i.e., the date when the acquirer obtains control of the asset) or when they are permanently withdrawn from use and no future economic benefit is expected from their disposal. The gain or loss from the disposal is the difference between the net proceeds on disposal and the carrying amount of the asset, and is recognized in profit or loss in the period of derecognition.
14

LG Household & Health Care Ltd. and its subsidiaries Notes to the consolidated financial statements December 31, 2018 and 2017
15
2.3.7 Leases The determination of whether an arrangement is, or contains, a lease is based on the substance of the arrangement at the inception date. The arrangement is assessed for (i) whether fulfilment of the arrangement is dependent on the use of a specific asset or assets or (ii) the arrangement conveys a right to use the asset or assets, even if that right is not explicitly specified in an arrangement. Group as a lessee A lease is classified as at the inception date as a finance lease or an operating lease. A lease that transfers substantially all the risks and rewards incidental to ownership to the Group is classified as a finance lease. Finance leases are capitalized at the commencement of the lease at the inception date fair value of the leased property or, if lower, at the present value of the minimum lease payments. Lease payments are apportioned between finance charges and reduction of the lease liability so as to achieve a constant rate of interest on the remaining balance of the liability. Finance charges are recognized in finance costs in the income statement. A leased asset is depreciated over the useful life of the asset. However, if there is no reasonable certainty that the Group will obtain ownership by the end of the lease term, the asset is depreciated over the shorter of the estimated useful life of the asset and the lease term. Operating lease payments are recognized as an operating expense in the income statement on a straight-line basis over the lease term. Group as a lessor Leases in which the Group does not transfer substantially all the risks and benefits of ownership of an asset are classified as operating leases. Initial direct costs incurred in negotiating an operating lease are added to the carrying amount of the leased asset and recognized over the lease term on the same basis as rental income. Contingent rents are recognized as revenue in the period in which they are earned. 2.3.8 Borrowing costs Borrowing costs directly attributable to the acquisition, construction or production of an asset that necessarily takes a substantial period of time to get ready for its intended use or sale are capitalized as part of the cost of the asset. All other borrowing costs are expensed in the period in which they occur. Borrowing costs consist of interest and other costs that an entity incurs in connection with the borrowing of funds. 2.3.9 Investment property Investment properties are measured initially at cost, including transaction costs. However, other costs occurred from ordinary management performance are expensed in the period in which they occur. Subsequent to initial recognition, investment properties are stated at depreciated cost less any accumulated impairment losses. Investment properties, except for land, are depreciated on a straight-line basis over estimated useful life as follows and assessed for impairment whenever there is an indication that the investment properties may be impaired:
Useful lives (years)
Buildings 25 ~ 50 The Group reviews the appropriateness of the residual values, useful lives and depreciation methods of investment properties, at the minimum, at the end of every reporting period, and if it is determined from the review that a change is required, the Group applies the accounting treatment for changes in accounting estimate. Depreciation is recognized in the consolidated statements of income in expense categories consistent with the function of the respective investment properties.
15

LG Household & Health Care Ltd. and its subsidiaries Notes to the consolidated financial statements December 31, 2018 and 2017
16
2.3.9 Investment property (cont’d) Investment properties are derecognized either when they have been disposed of (i.e., the date when the acquirer obtains control of the asset) or when they are permanently withdrawn from use and no future economic benefit is expected from their disposal. The difference between the net disposal proceeds and the carrying amount of the asset is recognized in the income statement in the period of derecognition. The amount of consideration to be included in the gain or loss from derecognition of the investment property is determined in accordance with the requirements of KIFRS 1115 for determining the transaction price. Transfers are made to (or from) investment property only when there is a change in use. 2.3.10 Intangible assets Intangible assets acquired separately are measured on initial recognition at cost. The cost of intangible assets acquired in a business combination is their fair value at the date of acquisition. Following initial recognition, intangible assets are carried at cost less any accumulated amortization and accumulated impairment losses. The useful lives of intangible assets are assessed as either finite or indefinite. Intangible assets with finite lives are amortized over the useful economic life and assessed for impairment whenever there is an indication that the intangible asset may be impaired. The amortization period and the amortization method for an intangible asset with a finite useful life are reviewed at least at the end of each reporting period. Changes in the expected useful life or the expected pattern of consumption of future economic benefits embodied in the asset are considered to modify the amortization period or method, as appropriate, and are treated as changes in accounting estimates. The amortization expense on intangible assets with finite lives is recognized in the consolidated statement of profit or loss and other comprehensive income as the expense category that is consistent with the function of the intangible assets. Intangible assets with indefinite useful lives are not amortized, but are tested for impairment annually, either individually or at the cash-generating unit level. The assessment of indefinite life is reviewed annually to determine whether the indefinite life continues to be supportable. If not, the change in useful life from indefinite to finite is made on a prospective basis. Intangible assets are amortized on a straight-line basis over useful lives as follows. However, as there are no foreseeable limits to the periods over which industrial property rights and other intangible assets, such as brand value and Bottler’s Agreement, are not amortized.
Intangible assets are derecognized either when they have been disposed of (i.e., the date when the acquirer obtains control of the asset) or when they are permanently withdrawn from use and no future economic benefit is expected from their disposal. Gains or losses arising from derecognition of an intangible asset are measured as the difference between the net disposal proceeds and the carrying amount of the asset and are recognized in the consolidated statements of income and other comprehensive income when the asset is derecognized. Research and development costs Research and development costs are expensed as incurred. 2.3.11 Inventories Inventories are valued at the lower of cost and net realizable value. Initial cost of inventories includes acquisition of inventories, production or conversion costs and other costs incurred in bringing each product to its present location and conditions. Unit cost of inventories is determined by using the gross average method and the moving weighted-average method except for materials in transit which are stated at cost by specific identification method.
Useful lives
(years)
Industrial property rights 5 ~10 Software 3 ~ 6 Other intangible assets 5 ~ 15
16

LG Household & Health Care Ltd. and its subsidiaries Notes to the consolidated financial statements December 31, 2018 and 2017
17
2.3.11 Inventories (cont’d) Net realizable value is the estimated selling price in the ordinary course of business, less estimated costs of completion and the estimated costs necessary to make the sale. 2.3.12 Impairment of non-financial assets The Group assesses, at each reporting date, whether there is an indication that an asset may be impaired. If any indication exists, or when annual impairment testing for an asset is required, the Group estimates the asset’s recoverable amount. An asset’s recoverable amount is the higher of an asset’s or cash-generating unit’s (CGU) fair value less costs of disposal and its value in use. Recoverable amount is determined for an individual asset, unless the asset does not generate cash inflows that are largely independent of those from other assets or groups of assets. When the carrying amount of an asset or CGU exceeds its recoverable amount, the asset is considered impaired and is written down to its recoverable amount. In assessing value in use, the estimated future cash flows are discounted to their present value using a pre-tax discount rate that reflects current market assessments of the time value of money and the risks specific to the asset. In determining fair value less costs of disposal, recent market transactions are taken into account. If no such transactions can be identified, an appropriate valuation model is used. These calculations are corroborated by valuation multiples, quoted share prices for publicly traded companies or other available fair value indicators. The Group bases its impairment calculation on detailed budgets and forecast calculations, which are prepared separately for each of the Group’s CGUs to which the individual assets are allocated. These budgets and forecast calculations generally cover a period of five years. For longer periods, a long-term growth rate is calculated and applied to project future cash flows after the fifth year. Impairment losses of continuing operations, including impairment on inventories, are recognized in the consolidated statement of profit or loss and other comprehensive income in expense categories consistent with the function of the impaired asset, except for properties previously revalued with the revaluation taken to OCI. For such properties, the impairment is recognized in OCI up to the amount of any previous revaluation. For assets excluding goodwill, an assessment is made at each reporting date to determine whether there is an indication that previously recognized impairment losses no longer exist or have decreased. If such indication exists, the Group estimates the asset’s or CGU’s recoverable amount. A previously recognized impairment loss is reversed only if there has been a change in the assumptions used to determine the asset’s recoverable amount since the last impairment loss was recognized. The reversal is limited so that the carrying amount of the asset does not exceed its recoverable amount, nor exceed the carrying amount that would have been determined, net of depreciation, had no impairment loss been recognized for the asset in prior years. Such reversal is recognized in the consolidated statement of profit or loss and other comprehensive income unless the asset is carried at a revalued amount, in which case, the reversal is treated as a revaluation increase. The following assets have specific characteristics for impairment testing: Goodwill Goodwill is tested for impairment annually as at specific time and when circumstances indicate that the carrying value may be impaired. Impairment is determined for goodwill by assessing the recoverable amount of each CGU (or group of CGUs) to which the goodwill relates. When the recoverable amount of the CGU is less than its carrying amount, an impairment loss is recognized. Impairment losses relating to goodwill cannot be reversed in future periods. Intangible assets Intangible assets with indefinite useful lives are tested for impairment annually as at specific time, individually or at the CGU level, as appropriate, and when circumstances indicate that the carrying value may be impaired.
17

LG Household & Health Care Ltd. and its subsidiaries Notes to the consolidated financial statements December 31, 2018 and 2017
18
2.3.13 Cash and short-term deposits Cash and short-term deposits in the consolidated statement of financial position comprise cash at banks and on hand and short-term deposits with a maturity of three months or less, which are subject to an insignificant risk of changes in value. 2.3.14 Financial instruments – initial recognition and subsequent measurement A financial instrument is any contract that gives rise to a financial asset of one entity and a financial liability or equity instrument of another entity. 2.3.14.1 Financial assets Initial recognition and measurement Financial assets are classified, at initial recognition, as subsequently measured at amortized cost, fair value through other comprehensive income (OCI), and fair value through profit or loss. The classification of financial assets at initial recognition depends on the financial asset’s contractual cash flow characteristics and the Group’s business model for managing them. With the exception of trade receivables that do not contain a significant financing component or for which the Group has applied the practical expedient, the Group initially measures a financial asset at its fair value plus, in the case of a financial asset not at fair value through profit or loss, transaction costs. Trade receivables that do not contain a significant financing component or for which the Group has applied the practical expedient are measured at the transaction price determined under KIFRS 1115. Refer to the accounting policies in section (e) Revenue from contracts with customers. In order for a financial asset to be classified and measured at amortized cost or fair value through OCI, it needs to give rise to cash flows that are ‘solely payments of principal and interest (SPPI)’ on the principal amount outstanding. This assessment is referred to as the SPPI test and is performed at an instrument level. The Group’s business model for managing financial assets refers to how it manages its financial assets in order to generate cash flows. The business model determines whether cash flows will result from collecting contractual cash flows, selling the financial assets, or both. Purchases or sales of financial assets that require delivery of assets within a time frame established by regulation or convention in the market place (regular way trades) are recognized on the trade date, i.e., the date that the Group commits to purchase or sell the asset. Subsequent measurement For purposes of subsequent measurement, financial assets are measured by as follows: Financial assets at amortized cost (debt instruments) Financial assets at fair value through OCI with recycling of cumulative gains and losses (debt instruments) Financial assets designated at fair value through OCI with no recycling of cumulative gains and losses
upon Financial assets at fair value through profit or loss
Financial assets at amortized cost (debt instruments) The Group measures financial assets at amortized cost if both of the following conditions are met: The financial asset is held within a business model with the objective to hold financial assets in order to
collect contractual cash flows And
The contractual terms of the financial asset give rise on specified dates to cash flows that are solely payments of principal and interest on the principal amount outstanding
Financial assets at amortized cost are subsequently measured using the effective interest (EIR) method and are subject to impairment. Gains and losses are recognized in profit or loss when the asset is derecognized, modified or impaired.
18

LG Household & Health Care Ltd. and its subsidiaries Notes to the consolidated financial statements December 31, 2018 and 2017
19
2.3.14 Financial instruments – initial recognition and subsequent measurement (cont’d)
Financial assets at fair value through OCI (debt instruments) The Group measures debt instruments at fair value through OCI if both of the following conditions are met: The financial asset is held within a business model with the objective of both holding to collect contractual
cash flows and selling
And
The contractual terms of the financial asset give rise on specified dates to cash flows that are solely payments of principal and interest on the principal amount outstanding
For debt instruments at fair value through OCI, interest income, foreign exchange revaluation and impairment losses or reversals are recognized in the statement of profit or loss and computed in the same manner as for financial assets measured at amortized cost. The remaining fair value changes are recognized in OCI. Upon derecognition, the cumulative fair value change recognized in OCI is recycled to profit or loss. The Group’s debt instruments at fair value through OCI includes investments in quoted debt instruments included under other non-current financial assets.
Financial assets designated at fair value through OCI (equity instruments) Upon initial recognition, the Group can elect to classify irrevocably its equity investments as equity instruments designated at fair value through OCI when they meet the definition of equity under KIFRS 1032 Financial Instruments: Presentation and are not held for trading. The classification is determined on an instrument-by-instrument basis. Gains and losses on these financial assets are never recycled to profit or loss. Dividends are recognised as other income in the statement of profit or loss when the right of payment has been established, except when the Group benefits from such proceeds as a recovery of part of the cost of the financial asset, in which case, such gains are recorded in OCI. Equity instruments designated at fair value through OCI are not subject to impairment assessment. The Group elected to classify irrevocably its non-listed equity investments under this category. Financial assets at fair value through profit or loss Financial assets at fair value through profit or loss include financial assets held for trading and financial assets designated upon initial recognition at fair value through profit or loss. Financial assets are classified as held for trading if they are acquired for the purpose of selling or repurchasing in the near term. Derivatives, including separated embedded derivatives, are also classified as held for trading unless they are designated as effective hedging instruments. Financial assets with cash flows that are not solely payments of principal and interest are classified and measured at fair value through profit or loss, irrespective of the business model. Notwithstanding the criteria for debt instruments to be classified at amortized cost or at fair value through OCI, as described above, debt instruments may be designated at fair value through profit or loss on initial recognition if doing so eliminates, or significantly reduces, an accounting mismatch. Financial assets at fair value through profit or loss are carried in the statement of financial position at fair value with net changes in fair value recognized in the statement of profit or loss. A derivative embedded in a hybrid contract, with a financial liability or non-financial host, is separated from the host and accounted for as a separate derivative if: the economic characteristics and risks are not closely related to the host; a separate instrument with the same terms as the embedded derivative would meet the definition of a derivative; and the hybrid contract is not measured at fair value through profit or loss. Embedded derivatives are measured at fair value with changes in fair value recognised in profit or loss. Reassessment only occurs if there is either a change in the terms of the contract that significantly modifies the cash flows that would otherwise be required or a reclassification of a financial asset out of the fair value through profit or loss category. A derivative embedded within a hybrid contract containing a financial asset host is not accounted for separately. The financial asset host together with the embedded derivative is required to be classified in its entirety as a financial asset at fair value through profit or loss.
19

LG Household & Health Care Ltd. and its subsidiaries Notes to the consolidated financial statements December 31, 2018 and 2017
20
2.3.14 Financial instruments – initial recognition and subsequent measurement (cont’d) Derecognition A financial asset (or, where applicable, a part of a financial asset or part of a group of similar financial assets) is primarily derecognized (i.e., removed from the Group’s consolidated statement of financial position) when: The rights to receive cash flows from the asset have expired, or The Group has transferred its rights to receive cash flows from the asset or has assumed an obligation to
pay the received cash flows in full without material delay to a third party under a ‘pass-through’ arrangement; and either (a) the Group has transferred substantially all the risks and rewards of the asset, or (b) the Group has neither transferred nor retained substantially all the risks and rewards of the asset, but has transferred control of the asset
When the Group has transferred its rights to receive cash flows from an asset or has entered into a pass-through arrangement, it evaluates if, and to what extent, it has retained the risks and rewards of ownership. When it has neither transferred nor retained substantially all of the risks and rewards of the asset, nor transferred control of the asset, the Group continues to recognize the transferred asset to the extent of its continuing involvement. In that case, the Group also recognizes an associated liability. The transferred asset and the associated liability are measured on a basis that reflects the rights and obligations that the Group has retained. Continuing involvement that takes the form of a guarantee over the transferred asset is measured at the lower of the original carrying amount of the asset and the maximum amount of consideration that the Group could be required to repay. 2.3.14.2 Impairment of financial assets Further disclosures relating to impairment of financial assets are also provided in the following notes:
Disclosures for significant assumptions Trade receivables, including contract assets
The Group recognizes an allowance for expected credit losses (ECLs) for all debt instruments not held at fair value through profit or loss. ECLs are based on the difference between the contractual cash flows due in accordance with the contract and all the cash flows that the Group expects to receive, discounted at an approximation of the original effective interest rate. The expected cash flows will include cash flows from the sale of collateral held or other credit enhancements that are integral to the contractual terms. ECLs are recognized in two stages. For credit exposures for which there has not been a significant increase in credit risk since initial recognition, ECLs are provided for credit losses that result from default events that are possible within the next 12-months (a 12-month ECL). For those credit exposures for which there has been a significant increase in credit risk since initial recognition, a loss allowance is required for credit losses expected over the remaining life of the exposure, irrespective of the timing of the default (a lifetime ECL). For trade receivables, the Group applies a simplified approach in calculating ECLs. Therefore, the Group does not track changes in credit risk, but instead recognizes a loss allowance based on lifetime ECLs at each reporting date. Information on the provision matrix for trade receivables the Group established is provided in Note 44. The Group considers a financial asset in default when contractual payments are 1 year past since the occurrence. However, in certain cases, the Group may also consider a financial asset to be in default when internal or external information indicates that the Group is unlikely to receive the outstanding contractual amounts in full before taking into account any credit enhancements held by the Group. A financial asset is written off when there is no reasonable expectation of recovering the contractual cash flows.
20

LG Household & Health Care Ltd. and its subsidiaries Notes to the consolidated financial statements December 31, 2018 and 2017
21
2.3.14.3 Financial liabilities Initial recognition and measurement Financial liabilities are classified, at initial recognition, as financial liabilities at fair value through profit or loss, loans and borrowings, payables, or as derivatives designated as hedging instruments in an effective hedge, as appropriate. All financial liabilities are recognized initially at fair value and, in the case of loans and borrowings and payables, net of directly attributable transaction costs. The Group’s financial liabilities include trade and other payables, borrowings, debentures and other non-current liabilities. Subsequent measurement The measurement of financial liabilities depends on their classification, as described below: Financial liabilities at fair value through profit or loss Financial liabilities at fair value through profit or loss include financial liabilities held for trading and financial liabilities designated upon initial recognition as at fair value through profit or loss. Financial liabilities are classified as held for trading if they are incurred for the purpose of repurchasing in the near term. This category also includes derivative financial instruments entered into by the Group that are not designated as hedging instruments in hedge relationships as defined by KIFRS 1109. Separated embedded derivatives are also classified as held for trading unless they are designated as effective hedging instruments. Gains or losses on liabilities held for trading are recognized in the statement of profit or loss and other comprehensive income. Financial liabilities designated upon initial recognition at fair value through profit or loss are designated at the initial date of recognition, and only if the criteria in KIFRS 1109 are satisfied. The Group has designated convertible preference shares (RCPS) issued by Tai Guk Pharm Co., Ltd as of fair value through profit or loss. Loans and borrowings After initial recognition, interest-bearing loans and borrowings are subsequently measured at amortized cost using the EIR method. Gains and losses are recognized in profit or loss when the liabilities are derecognized as well as through the EIR amortization process. Amortized cost is calculated by taking into account any discount or premium on acquisition and fees or costs that are a necessary part of the EIR. This category generally applies to interest-bearing loans and borrowings. For more information, refer to Notes 20 and 21 relating to borrowings and debentures. Derecognition A financial liability is derecognized when the obligation under the liability is discharged or cancelled or expires. When an existing financial liability is replaced by another from the same lender on substantially different terms, or the terms of an existing liability are substantially modified, such an exchange or modification is treated as the derecognition of the original liability and the recognition of a new liability. The difference in the respective carrying amounts is recognized in the statement of income. 2.3.14.4 Offsetting of financial instruments Financial assets and financial liabilities are offset and the net amount is reported in the consolidated statement of financial position if there is a currently enforceable legal right to offset the recognized amounts and there is an intention to settle on a net basis, to realize the assets and settle the liabilities simultaneously.
21
LG Household & Health Care Ltd. and its subsidiaries Notes to the consolidated financial statements December 31, 2018 and 2017
22
2.3.15 Derivative financial instruments Initial recognition and subsequent measurement Derivative financial instruments are initially recognized at fair value on the date on which a derivative contract is entered into and are subsequently remeasured at fair value. Derivatives are carried as financial assets when the fair value is positive and as financial liabilities when the fair value is negative. Any gains or losses arising from changes in the fair value of derivatives are taken directly to profit or loss.
2.3.16 Treasury shares Own equity instruments that are reacquired (treasury shares) are recognized at cost and deducted from equity. No gain or loss is recognized in profit or loss on the purchase, sale, issue or cancellation of the Group’s own equity instruments. Any difference between the carrying amount and the consideration, if reissued, is recognized in share premium. 2.3.17 Non-current assets held for sale or distribution to equity holders of the parent and
discontinued operations The Group classifies non-current assets and disposal groups as held for sale or for distribution to equity holders of the parent if their carrying amounts will be recovered principally through a sale or distribution rather than through continuing use. Such non-current assets and disposal groups classified as held for sale or as held for distribution are measured at the lower of their carrying amount and fair value less costs to sell or to distribute. Costs to distribute are the incremental costs directly attributable to the distribution, excluding the finance costs and income tax expense. The criteria for held for sale classification is regarded as met only when the sale is highly probable and the asset or disposal group is available for immediate distribution in its present condition. Actions required to complete the distribution should indicate that it is unlikely that significant changes to the distribution will be made or that the distribution with be withdrawn. Management must be committed to the distribution expected within one year from the date of the classification. Property, plant and equipment and intangible assets are not depreciated or amortized once classified as held for sale or as held for distribution. Assets and liabilities classified as held for sale or for distribution are presented separately as current items in the consolidated statement of financial position. A disposal group qualifies as discontinued operation if it is a component of an entity that either has been dispose of, or is classified as held for sale, and: Represents a separate major line of business or geographical area of operations Is part of a single coordinated plan to dispose or a separate major line of business or geographical area of
operations, or Is a subsidiary acquired exclusively with a view to resale Discontinued operations are excluded from the results of continuing operations and are presented as a single amount as profit or loss after tax from discontinued operations in the consolidated statements of income and other comprehensive income. 2.3.18 Cash dividend to equity holders of the parent The Group recognizes a liability to make cash or non-cash distributions to equity holders of the parent when the distribution is authorized and the distribution are no longer at the discretion of the Group. A distribution is authorized when it is approved by the shareholders. A corresponding amount is recognized directly in equity.
22

LG Household & Health Care Ltd. and its subsidiaries Notes to the consolidated financial statements December 31, 2018 and 2017
23
2.3.19 Pension benefits and other post-employment benefits The Group operates a defined benefit pension plan in Korea, which require contributions to be made to a separately administered fund. The cost of providing benefits under the defined benefit plan is determined using the projected unit credit method. Re-measurements, comprising of actuarial gains and losses, the effect of the asset ceiling, excluding net interest (not applicable to the Group) and the return on plan assets (excluding net interest), are recognized immediately in the consolidated statement of financial position with a corresponding debit or credit to retained earnings through OCI in the period in which they occur. Re-measurements are not reclassified to profit or loss in subsequent periods. Past service costs are recognized in profit or loss on the earlier of: The date of the plan amendment or curtailment, and The date that the Group recognizes restructuring-related costs Net interest is calculated by applying the discount rate to the net defined benefit liability or asset. The Group recognizes the following changes in the net defined benefit obligation under ‘cost of sales’ and ‘selling and administrative expenses’ in the consolidated statements of income and other comprehensive income: Service costs comprising current service costs, past-service costs, gains and losses on curtailments and
non-routine settlements Net interest expense or income The Group operates a defined contribution pension plan. When an employee renders services for a certain period of time, the amount contributed by the Group, in exchange for the services, is expensed except for those included as part of acquisition costs of a plan asset. The contribution made by the Group in excess of the required funding amount for services rendered until the end of the reporting period is recorded as an asset to the extent that future contribution can be reduced or returned in cash due to the excessive contribution whereas the contribution amount that falls short of the required funding amount is recorded as pension liabilities. 2.3.20 Provisions Provisions are recognized when the Group has a present obligation (legal or constructive) as a result of a past event, it is probable that an outflow of resources embodying economic benefits will be required to settle the obligation and a reliable estimate can be made of the amount of the obligation. When the Group expects some or all of a provision to be reimbursed, for example, under an insurance contract, the reimbursement is recognized as a separate asset, but only when the reimbursement is virtually certain. The expense relating to a provision is presented in the consolidated statements of income and other comprehensive income net of any reimbursement. 2.3.21 Revenue from Contracts with Customers The Group operates 3 business divisions, Beautiful, Healthy, Refreshing, and the Group provides finished goods, merchandises and services through contracts with customers. Revenue from contracts with customers is recognized when control of the goods or services are transferred to the customer at an amount that reflects the consideration to which the Group expects to be entitled in exchange for those goods or services. The Group has generally concluded that it is the principal in its revenue arrangements, except for the agency services below, because it typically controls the goods or services before transferring them to the customer. Sale of goods and merchandise
Revenue from the sale of goods and merchandise is recognized at the point in time when control of the asset is transferred to the customer, generally on delivery of the goods. The normal credit term is 30 to 90 days upon delivery. The Group considers whether there are other promises in the contract that are separate performance obligations to which a portion of the transaction price needs to be allocated. In determining the transaction price for the sale of goods, the Group considers the effects of variable consideration, consideration payable to the customer, identifying performance obligations, and principal and agent.
23

LG Household & Health Care Ltd. and its subsidiaries Notes to the consolidated financial statements December 31, 2018 and 2017
24
2.3.21 Revenue from Contracts with Customers (cont’d) 1) Variable consideration A. Rights of return Some contracts with customers provide a right of return. Currently, the Group recognizes revenue from the sale of goods measured at the expected value of the consideration receivable, net of returns. If revenue cannot be reliably measured, the Group defers revenue recognition until the uncertainty is resolved. Since contracts provide a customer with a right to return the goods, the consideration from the customer is variable. The Group uses the expected value method to estimate the goods that will not be returned because this method best predicts the amount of variable consideration to which the Group will be entitled. The constraining estimates of variable consideration are applied in order to determine the amount of variable consideration that can be included in the transaction price. The group presents refund liability and right of return asset separately in the statement of financial position.
B. Penalties Some contracts with customers include a clause that requires penalties to be paid to customers when there is a shortage of supply, delay in delivery or product defect for orders placed by customers. The Group recognizes the amount of penalties in selling and administrative expenses when the event occurs, and the amount is paid to the customers subsequently or offset with the amounts to be received from customers. Penalty provisions give rise to variable consideration, and will be required to be estimated at contract inception and updated thereafter.
The Group has decided to use the expected value method to estimate the amount of penalties to be paid in order to predict the amount of variable consideration to which the Group will be entitled. The Group applied the requirements on constraining estimates of variable consideration to determine the amount of variable consideration that can be included in the transaction price. C. Volume rebates The Group provides retrospective volume rebates to its customers on specific or unspecific products purchased by the customer once the quantity of products purchased during the period exceeds a threshold specified in
the provisions of certain contracts with customers. Volume rebates give rise to variable consideration, and will
be required to be estimated at contract inception and updated thereafter. The Group has decided to use the expected value method to estimate the volume rebates because this method better predicts the amount of variable consideration to which the Group will be entitled. To determine the variable consideration to be included in the transaction price, the Group applied the requirements of the restrictions to the variable consideration estimates and deducts the equivalent amount from revenue. 2) Consideration payable to customers
A. Distribution service In accordance with the sales contracts with customers, the Group is entitled for distribution services provided by some of its customers. The Group delivers its goods to the distribution centers owned by the customers, and the delivery of goods from the distribution centers to the final destinations is completed using the distribution services provided by the customers, and the related fees are paid to the customers. The Group accounts for consideration payable to a customer as a reduction of the transaction price and, therefore, of revenue unless the payment to the customer is in exchange for a distinct good or service that the customer transfers to the entity. The distribution services are not considered to be distinct from goods or service provided from customers, as the distribution services provided by the customers is in accordance with the contracts with customers to eliminate or reduce the Group’s obligation for the delivery of goods or services. Therefore the Group deducts the amount of fees paid to customers from revenue.
24

LG Household & Health Care Ltd. and its subsidiaries Notes to the consolidated financial statements December 31, 2018 and 2017
25
2.3.21 Revenue from Contracts with Customers (cont’d) B. Display incentives In accordance with the provisions of certain contracts with customers, the Group provides display incentives to its customers for displaying the Group’s products in specific areas of the customers’ stands. Furthermore, when the performance target set in advance is achieved, the Group provides incentives, and incentives for sales of new product within 6 months of release are provided. These amounts may subsequently be repaid in cash to the customer or offset against amounts payable by the customer. The Group accounts for consideration payable to a customer as a reduction of the transaction price and, therefore, of revenue unless the payment to the customer is in exchange for a distinct good or service that the customer transfers to the entity. The display services are not considered to be distinct from goods or service provided to customers, as the display services provided by the customers are not controlled or instructed by the Group. Therefore, the Group will deduct the amount of incentives paid to customers from its revenue. 3) Identifying performance obligations A. Points sales When the goods delivered to the distributors are sold at a discount, the Group provides the distributors with points, and the distributors can purchase goods using the points corresponding to the loss incurred from the discount. B. Provision of free goods As part of promotion activities, in accordance with the agreement, the Group provides the customers own or third party goods for free. A good or service that is promised to a customer is distinct if both of the following
criteria are met. ① The customer may benefit from the good or service on its own or together with other
resources that are readily available to the customer (i.e., those goods or services may be distinct). ② the
entity's obligation to transfer the good or service to the customer is separately identifiable from other obligation in the contract (i.e., the obligation to transfer the good or service is distinct within the context of the contract). When a customer purchases specific goods, the entity provides the customer a significant right to receive a merchandise or gift for free, and it is thus considered to be a separate performance obligation. Therefore, an entity shall allocate the transaction price to each performance obligation identified in the contract on a relative stand-alone selling price, and recognize it as cost of goods sold. 4) Principal versus agent considerations From time to time the Group enters into contracts with its foreign customers to provide transportation and insurance services for goods delivered. Under these contracts, the Group provides procurement services (i.e., selects suitable suppliers and manages the ordering and performance status of services). In these contracts, the Group is not considered to be primarily responsible for fulfilling the promise to provide the transportation and insurance services. The Group has determined that it does not control the services before they are provided to customers by other service providers, and hence, is an agent rather than principal in these contracts. The Group deducts the amount of transportation and insurance services from its revenue. Provision of technical skills Revenue is recognized over the period in which the technical skills are provided based on the time elapsed. The normal credit term is 30 to 90 days. Contract balance 1) Trade receivables A receivable represents the Group’s right to an amount of consideration that is unconditional (i.e., only the passage of time is required before payment of the consideration is due). Refer to accounting policies of financial assets in the Note 2.3.14.
25

LG Household & Health Care Ltd. and its subsidiaries Notes to the consolidated financial statements December 31, 2018 and 2017
26
2.3.21 Revenue from Contracts with Customers (cont’d) 2) Contract liabilities A contract liability is the obligation to transfer goods or services to a customer for which the Group has received consideration (or an amount of consideration is due) from the customer. If a customer pays consideration before the Group transfers goods or services to the customer, a contract liability is recognized when the payment is made or the payment is due (whichever is earlier). Contract liabilities are recognized as revenue when the Group fulfills performance obligations as per the contract. Assets and liabilities arising from rights of return Right of return assets Right of return asset represents the Group’s right to recover the goods expected to be returned by customers. The asset is measured at the former carrying amount of the inventory, less any expected costs to recover the goods, including any potential decreases in the value of the returned goods. The Group updates the measurement of the asset recorded for any revisions to its expected level of returns, as well as any additional decreases in the value of the returned products. Refund liabilities A refund liability is the obligation to refund some or all of the consideration received (or receivable) from the customer and is measured at the amount the Group ultimately expects it will have to return to the customer. The Group updates its estimates of refund liabilities (and the corresponding change in the transaction price) at the end of each reporting period. 2.3.22 Taxes 2.3.22.1 Current income tax Current income tax assets and liabilities for the current period are measured at the amount expected to be recovered from or paid to the taxation authorities. The tax rates and tax laws used to compute the amount are those that are enacted or substantively enacted, at the reporting date in the countries where the Group operates and generates taxable income. Current income tax relating to items recognized directly in equity is recognized in equity and not in the consolidated statement of profit or loss and other comprehensive income. Management periodically evaluates positions taken in the tax returns with respect to situations in which applicable tax regulations are subject to interpretation and establishes provisions where appropriate. 2.3.22.2 Deferred tax Deferred tax is provided using the liability method on temporary differences between the tax bases of assets and liabilities and their carrying amounts for financial reporting purposes at the reporting date. Deferred tax liabilities are recognized for all taxable temporary differences, except: When the deferred tax liability arises from the initial recognition of goodwill An asset or liability in a transaction that is not a business combination and, at the time of the transaction,
affects neither the accounting profit nor taxable profit or loss In respect of taxable temporary differences associated with investments in subsidiaries, associates and
interests in joint ventures, when the timing of the reversal of the temporary differences can be controlled and it is probable that the temporary differences will not reverse in the foreseeable future
Deferred tax assets are recognized for all deductible temporary differences, the carry forward of unused tax credits and any unused tax losses. Deferred tax assets are recognized to the extent that it is probable that taxable profit will be available against which the deductible temporary differences, and the carry forward of unused tax credits and unused tax losses can be utilized, except: When the deferred tax asset relating to the deductible temporary difference arises from the initial
recognition of an asset or liability in a transaction that is not a business combination and, at the time of the transaction, affects neither the accounting profit nor taxable profit or loss
26

LG Household & Health Care Ltd. and its subsidiaries Notes to the consolidated financial statements December 31, 2018 and 2017
27
2.3.22 Taxes (cont’d) In respect of deductible temporary differences associated with investments in subsidiaries, associates and
interests in joint ventures, deferred tax assets are recognized only to the extent that it is probable that the temporary differences will reverse in the foreseeable future and taxable profit will be available against which the temporary differences can be utilized
The carrying amount of deferred tax assets is reviewed at each reporting date and reduced to the extent that it is no longer probable that sufficient taxable profit will be available to allow all or part of the deferred tax asset to be utilized. Unrecognized deferred tax assets are re-assessed at each reporting date and are recognized to the extent that it has become probable that future taxable profits will allow the deferred tax asset to be recovered. Deferred tax assets and liabilities are measured at the tax rates that are expected to apply in the year when the asset is realized or the liability is settled, based on tax rates (and tax laws) that have been enacted or substantively enacted at the reporting date. Deferred tax relating to items recognized outside profit or loss is recognized outside profit or loss. Deferred tax items are recognized in correlation to the underlying transaction either in OCI or directly in equity. Deferred tax assets and deferred tax liabilities are offset if a legally enforceable right exists to set off current tax assets against current income tax liabilities and the deferred taxes relate to the same taxable entity and the same taxation authority. Tax benefits acquired as part of a business combination, but not satisfying the criteria for separate recognition at that date, are recognized subsequently if new information about facts and circumstances change. The adjustment is either treated as a reduction in goodwill (as long as it does not exceed goodwill) if it was incurred during the measurement period or recognized in profit or loss. The Company and its wholly-own subsidiaries have filed a consolidated tax return in accordance with Corporate Tax Act, and accordingly the Company recognizes the corporate income taxes, which it should pay on behalf of its subsidiaries, as current income tax liability and corporate income taxes receivable from (payable to) its subsidiaries as other accounts receivables(payables). 2.3.22.3 Sales tax Expenses and assets are recognized net of the amount of sales tax: When the sales tax incurred on a purchase of assets or services is not recoverable from the taxation
authority, in which case, the sales tax is recognized as part of the cost of acquisition of the asset or as part of the expense item, as applicable
When receivables and payables are stated with the amount of sales tax included The net amount of sales tax recoverable from, or payable to, the taxation authority is included as part of receivables or payables in the consolidated statement of financial position. 2.3.23 Government grants Government grants are recognized where there is reasonable assurance that the grant will be received and all attached conditions will be complied with. When the grant relates to an expense item, it is recognized as income on a systematic basis over the periods that the related costs, for which it is intended to compensate, are expensed. When the grant relates to an asset, it is recognized as income in equal amounts over the expected useful life of the related asset. When the Group receives grants of non-monetary assets, the asset and the grant are recorded at nominal amounts and released to profit or loss over the expected useful life in a pattern of consumption of the benefit of the underlying asset by equal annual instalments. When loans or similar assistance are provided by governments or related institutions, with an interest rate below the current applicable market rate, the effect of this favorable interest is regarded as a government grant. The loan or assistance is initially recognized and measured at fair value and the government grant is measured as the difference between the initial carrying value of the loan and the proceeds received.
27

LG Household & Health Care Ltd. and its subsidiaries Notes to the consolidated financial statements December 31, 2018 and 2017
28
2.4 New and amended standards and interpretations
The Group applied KIFRS 1115 and KIFRS 1109 for the first time. The nature and effect of the changes as a result of adoption of these new accounting standards are described below. Several other amendments and interpretations apply for the first time in 2018, but do not have an impact on the consolidated financial statements of the Group. The Group has not early adopted any standards, interpretations or amendments that have been issued but are not yet effective. 2.4.1 KIFRS 1115 Revenue from Contracts with Customers KIFRS 1115 supersedes KIFRS 1011 Construction Contracts, KIFRS 1018 Revenue and related Interpretations and it applies, with limited exceptions, to all revenue arising from contracts with its customers. KIFRS 1115 establishes a five-step model to account for revenue arising from contracts with customers and requires that revenue be recognized at an amount that reflects the consideration to which an entity expects to be entitled in exchange for transferring goods or services to a customer. KIFRS 1115 requires entities to exercise judgement, taking into consideration all of the relevant facts and circumstances when applying each step of the model to contracts with their customers. The standard also specifies the accounting for the incremental costs of obtaining a contract and the costs directly related to fulfilling a contract. In addition, the standard requires extensive disclosures. The Group adopted KIFRS 1115 using the full retrospective method of adoption. The effect of the transition on the current period has not been disclosed as the standard provides an optional practical expedient. The Group did not apply any of the other available optional practical expedients. The effect of adopting KIFRS 1115 is, as follows: Impact on the consolidated statement of financial position as of December 31, 2017(increase/(decrease)) (Korean won in millions):
Adjustments Dec. 31, 2017
Assets Other current assets 1)A \ 259 Deferred tax assets 3)A 292
Total assets 551
Liabilities Deferred revenue 3)A 2,768 Refund liabilities 1)A 259 Other current financial liabilities 3)A (1,643)
Total liabilities 1,384
Equity Retained earnings 3)A (833)
Total equity \ (833)
Impact on statement of income as of December 31, 2017(increase/(decrease) in profit) (Korean won in millions):
Adjustments Dec. 31, 2017
Revenue from contracts with customers 1)A,B, 2)A,B, 3)A, 4) \ (165,326) Cost of sales 3)A,B, 4) (148,750)
Gross profit 1)B,C, 2)A,B, 3)A,B, 4) (314,076) Selling and administrative expenses 1)B,C, 2)A,B, 3)A,B, 4) 313,750
Profit before tax from continuing operations 3)A (326) Income tax expense 3)A 84
Profit for the year from continuing operations 3)A (242)
Profit for the year \ (242)
28
LG Household & Health Care Ltd. and its subsidiaries Notes to the consolidated financial statements December 31, 2018 and 2017
29
2.4.1 KIFRS 1115 Revenue from Contracts with Customers (cont’d)
Impact on the equity as of January 1, 2017 (increase/(decrease)) (Korean won in millions):
Adjustments Jan. 1, 2017
Equity Retained earnings 3)A \ (592)
Total equity \ (592)
However, there was no impact on the net cash flows from operating activities. The cash flows from investing and financing activities were not affected. Also, there was no impact on basic and diluted earnings per share (EPS). The Group operates Beautiful (Cosmetics), Healthy (Household items), and Refreshing (Soft drinks) businesses and the Group provides finished goods, merchandises and services through contracts with customers. 1) Variable consideration
A. Rights of return Upon adoption of KIFRS 1115, the Group classified assets related to rights of return to right of return assets (Other current assets). The statement of financial positions of December 31, 2017 was restated, resulting in
recognition of Right of return assets and Refund liabilities of \259 million respectively. There is no effect on
the statement of income for the year ended December 31, 2017. B. Penalties Before adopting KIFRS 1115, the Group recognized this fee as part of selling and administrative expenses on the statement of profit and loss. Upon adoption of KIFRS 1115, the Group deducted the fee from revenue. There is no effect on the statement of financial position. The statement of income for the year ended December 31, 2017 was restated, resulting in a decrease in revenue from contracts with customers and selling and
administrative expenses of \2,086 million respectively.
C. Volume rebates The Group previously estimated the expected volume rebates using the probability-weighted average amount of rebates approach and recognized them as selling and administrative expenses on the statement of income. Upon adoption of KIFRS 1115, the Group deducted the expected rebates from revenue. There is no effect on the statement of financial position. The statement of income for the year ended December 31, 2017 was restated, resulting in a decrease in revenue from contracts with customers and selling and administrative
expenses of \72,219 million respectively.
2) Consideration payable to customers
A. Distribution service Before adopting KIFRS 1115, the Group recognized this fee as part of selling and administrative expenses on the statement of income. Upon adoption of KIFRS 1115, the Group deducted the commission from revenue. There is no effect on the statement of financial position. The statement of income for the year ended December 31, 2017 was restated, resulting in a decrease in revenue from contracts with customers and selling and
administrative expenses of \52,594 million respectively.
29

LG Household & Health Care Ltd. and its subsidiaries Notes to the consolidated financial statements December 31, 2018 and 2017
30
2.4.1 KIFRS 1115 Revenue from Contracts with Customers (cont’d) B. Display incentives Before adopting KIFRS 1115, the Group recognized this incentives part of selling and administrative expenses on the statement of income. Upon adoption of KIFRS 1115, the Group deducted the related amount from revenue. There is no effect on the statement of financial position. The statement of income for the year ended December 31, 2017 was restated, resulting in a decrease in revenue from contracts with customers and selling
and administrative expenses of \33,219 million respectively.
3) Identifying performance obligations A. Points sales Before the adoption of KIFRS 1115, the Group recognized the amount equal to the cost of the port in which it was obligated to pay the points as selling and administrative expenses on the statement of income, and as accrued expenses on the statement of financial positions. Upon adoption of KIFRS 1115, the Group deducted the relative stand-alone selling price of the points which would be payed from revenue, and recognized deferred revenue. The statement of financial positions of December 31, 2017 was restated, resulting in: an increase in deferred
tax assets and deferred revenue of \292 million and \2,768 million respectively; a decrease in other current
financial liabilities and retained earnings of \1,643 million and \833 million respectively. The statement of
income for the year ended December 31, 2017 was restated, resulting in: a decrease in revenue from contracts
with customers, selling and administrative expenses and income tax expenses of \1,029 million, \16,607
million and \84 million, and an increase in cost of sales of \15,904 million, respectively. Also, the statement
of changes in equity as of January 1, 2017 was also restated, resulting in a decrease in retained earnings of
\592 million due to accumulated effect related to the points sales.
B. Provision of free goods, and others Before adopting KIFRS 1115, the contracts were accounted for cost of sales or selling and administrative expenses. Upon adoption of KIFRS 1115, the transaction price was allocated to the significant rights based on the relative stand-alone selling price which is estimated to be exercised, and the related costs were recognized as cost of sales. There is no effect on the statement of financial position. The statement of income for the year ended December
31, 2017 was restated, resulting in an increase in cost of sales of \130,371 million, and a decrease in selling
and administrative expenses of \130,371 million respectively.
4) Principal versus agent considerations Before adopting KIFRS 1115, the Group accounted for the contracts related to the contracts with foreign customers to provide transportation and insurance services for goods delivered, as the principal. Upon adoption of KIFRS 1115, the Group decided to account for contracts as the agent, resulting in a decrease in related selling and administrative expenses and the equivalent amount was deducted from revenue from contracts with customers. There is no effect on the statement of financial position. The statement of income for the year ended December 31, 2017 was restated, resulting in a decrease in revenue from contracts with customers and selling and
administrative cost of \4,179 million and \6,654 million, and an increase in cost of sales of \2,475 million
respectively. 5) Presentation and disclosure requirements The Group disaggregates revenue recognized from contracts with customers into categories that depict how the nature, amount, timing and uncertainty of revenue and cash flows are affected by economic factors. It discloses information about the relationship between the disclosure of disaggregated revenue and revenue information disclosed for each reportable segment.
30

LG Household & Health Care Ltd. and its subsidiaries Notes to the consolidated financial statements December 31, 2018 and 2017
31
2.4.2 KIFRS 1109 Financial Instruments KIFRS 1109 Financial Instruments replaces KIFRS 1039 Financial Instruments: Recognition and Measurement for annual periods beginning on or after January 1, 2018, bringing together all three aspects of the accounting for financial instruments: classification and measurement; impairment; and hedge accounting. Within KIFRS1109, retrospective application is required but providing comparative information of classification and measurement, impairment and hedge accounting of financial instruments is not compulsory. For hedge accounting, the requirements are generally applied prospectively, with some limited exceptions. According to the exceptions, the Group did not restate the financial statements of the prior year, preparing the current year’s financial statements. The change in carrying amount as of January 1, 2018 is adjusted to the opening balance of retained earnings. 1) Classification and measurement Under KIFRS 1109, debt instruments are subsequently measured at fair value through profit or loss, amortized cost, or fair value through OCI. The classification is based on two criteria: the Group’s business model for managing the assets; and whether the instruments’ contractual cash flows represent ‘solely payments of principal and interest’ on the principal amount outstanding. The assessment of the Group’s business model was made as of the date of initial application, January 1, 2018. The assessment of whether contractual cash flows on debt instruments are solely comprised of principal and interest was made based on the facts and circumstances as of the initial recognition of the assets. The classification and measurement requirements of KIFRS 1109 did not have a significant impact to the Group. The Group continued measuring at fair value all financial assets previously held at fair value under KIFRS 1039. The following are the changes in the classification of the Group’s financial assets: Trade receivables and other non-current financial assets classified as Loans and receivables as of
December 31, 2017 are held to collect contractual cash flows and give rise to cash flows representing solely payments of principal and interest. These are classified and measured as Debt instruments at amortized cost beginning January 1, 2018.
Some equity investments in listed and non-listed companies classified as AFS financial assets as of December 31, 2017 are classified and measured as Equity instruments designated at fair value through OCI beginning January 1, 2018. The Group elected to classify irrevocably its equity investments under this category at the date of initial application as it intends to hold these investments for the foreseeable future. There were no impairment losses recognized in profit or loss for these investments in prior periods.
Financial assets not quoted as Equity instruments designated at fair value through OCI as of December 31, 2017 are classified and measured as Financial assets at fair value through profit or loss beginning January 1, 2018. As a result of the change in classification of the Group’s listed equity investments, the AFS reserve of
\109 million related to those investments that were previously presented under accumulated OCI, was
reclassified to Retained earnings as of January 1, 2018. The remaining amount of AFS reserve was reclassified to Fair value reserve of financial assets at fair value through OCI.
The Group has not designated any financial liabilities as at fair value through profit or loss. There are no changes in classification and measurement for the Group’s financial liabilities. 2) Impairment The adoption of KIFRS 1109 has fundamentally changed the Group’s accounting for impairment losses for financial assets by replacing KIFRS 1039’s incurred loss approach with a forward-looking expected credit loss (ECL) approach. KIFRS 1109 requires the Group to recognize an allowance for ECLs for all debt instruments not held at fair value through profit or loss and contract assets.
31
LG Household & Health Care Ltd. and its subsidiaries Notes to the consolidated financial statements December 31, 2018 and 2017
32
2.4.2 KIFRS 1109 Financial Instruments (cont’d) 3) Other adjustments In addition to the adjustments described above, other items such as deferred taxes were adjusted to retained earnings as necessary upon adoption of KIFRS 1109 as of January 1, 2018. The effect of adopting KIFRS 1109 as of January 1, 2018 was, are as follows (Korean won in millions):
KIFRS1039 Reclassified Remeasurement KIFRS1109
(a) (b) (c) (a)+(b)+(c)
Assets:
Cash and cash equivalents \ 386,194 \ - \ - \ 386,194
Fair value through profit or loss
Listed equity securities - 582 - 582
Unlisted equity securities - 101 - 101
Debt securities - 1,800 - 1,800
Hybrid contracts - 10,120 - 10,120
Other non-current financial assets 9,066 (9,066) - (9,066)
9,066 3,537 - 12,603
Amortized cost
Short-term financial instruments 16,900 - - 16,900
Trade & other receivables 539,519 - 534 540,053
Other current financial assets 296 - - 296
Long-term financial instrument 26 - - 26
Other non-current financial assets 47 - - 47
Other long-term receivables 87,533 - (2,545) 84,988
644,321 - (2,011) 642,310
Fair value through OCI
Listed equity securities - 2,250 - 2,250
Unlisted equity securities - 40,822 (832) 39,990
Available-for-sale financial assets 46,609 (46,609) - -
46,609 (3,537) (832) 42,240
Total assets 1,086,190 - (2,843) 1,083,347
Liabilities:
Amortized cost
Trade payables 231,497 - - 231,497
Other payables 238,250 - - 238,250
Short-term borrowings 71,041 - - 71,041
Current portion of long-term borrowings
5,000
-
-
5,000
Current portion of long-term debentures
259,985
-
-
259,985
Other current financial liabilities 180,345 - - 180,345
Long-term borrowings 18,342 - - 18,342
Long-term debentures 249,659 - - 249,659
Deposit received 8,352 - - 8,352
Other non-current financial liabilities 11,681 - - 11,681
Total liabilities \ 1,274,152 \ - \ - \ 1,274,152
32

LG Household & Health Care Ltd. and its subsidiaries Notes to the consolidated financial statements December 31, 2018 and 2017
33
2.4.2 KIFRS 1109 Financial Instruments (cont’d) Impact on the statement of comprehensive income as of January 1, 2018 was, as follows (Korean won in millions):
Accumulated OCI Retained earnings Total equity
Transferred amount of the accumulated valuation gain (loss) recognized in AFS financial assets
\ (109) \ 109 \ - Changes for re-measurement as of January 1, 2018
Available-for-sale financial assets (832) - (832) Trade & other receivables - 534 534
Long-term other receivables - (2,545) (2,545)
Tax charges and credits 216 507 723
(616) (1,504) (2,120)
Total \ (725) \ (1,395) \ (2,120)
2.4.3 Amendments to KIFRS 2122 Foreign Currency Transactions and Advance Consideration The Interpretation clarifies that, in determining the spot exchange rate to use on initial recognition of the related asset, expense or income (or part of it) on the derecognition of a non-monetary asset or non-monetary liability relating to advance consideration, the date of the transaction is the date on which an entity initially recognizes the non-monetary asset or non-monetary liability arising from the advance consideration. If there are multiple payments or receipts in advance, then the entity must determine the transaction date for each payment or receipt of advance consideration. The amendments has no effect on the Group’s consolidated financial statements. 2.4.4 Amendments to KIFRS 1040 Investment Property — Transfers of Investment Property The amendments clarify when an entity should transfer property, including property under construction or development into, or out of investment property. The amendments state that a change in use occurs when the property meets, or ceases to meet, the definition of investment property and there is evidence of the change in use. A mere change in management’s intentions for the use of a property does not provide evidence of a change in use. The amendments has no effect on the Group’s consolidated financial statements. 2.4.5 Amendments to KIFRS 1102 Share-based Payment — Classification and Measurement of Share-based Payment Transactions The amendments to KIFRS 1102 Share-based Payment that address three main areas: the effects of vesting conditions on the measurement of a cash-settled share-based payment transaction; the classification of a share-based payment transaction with net settlement features for withholding tax obligations; and accounting where a modification to the terms and conditions of a share-based payment transaction changes its classification from cash settled to equity settled. On adoption, entities are required to apply the amendments without restating prior periods, but retrospective application is permitted if elected for all three amendments and other criteria are met. The Group has no share-based payment transaction with net settlement features for withholding tax obligations and had not made any modifications to the terms and conditions of its share-based payment transaction. Therefore, these amendments do not have any impact on the Group’s consolidated financial statements.
33

LG Household & Health Care Ltd. and its subsidiaries Notes to the consolidated financial statements December 31, 2018 and 2017
34
2.4 New and amended standards and interpretations (cont’d) 2.4.6 Amendments to KIFRS 1028 Investments in Associates and Joint Ventures - Clarification that measuring investees at fair value through profit or loss is an investment-by-investment choice The amendments clarify that: An entity that is a venture capital organization, or other qualifying entity, may elect, at initial recognition on
an investment-by-investment basis, to measure its investments in associates and joint ventures at fair value through profit or loss.
If an entity, that is not itself an investment entity, has an interest in an associate or joint venture that is an
investment entity, the entity may, when applying the equity method, elect to retain the fair value
measurement applied by that investment entity associate or joint venture to the investment entity
associate’s or joint venture’s interests in subsidiaries. This election is made separately for each investment
entity associate or joint venture, at the later of the date on which: (a) the investment entity associate or
joint venture is initially recognized; (b) the associate or joint venture becomes an investment entity; and (c)
the investment entity associate or joint venture first becomes a parent.
The amendments has no effect on the Group’s consolidated financial statements. 2.4.7 Amendments to KIFRS 1101 First-time Adoption of International Financial Reporting Standards - Deletion of short-term exemptions for first-time adopters Short-term exemptions in paragraphs E3–E7 of KIFRS 1101 were deleted because they have now served their intended purpose. This amendment is not applicable to the Group. 2.5 Authorization date The consolidated financial statements for the year ended December 31, 2018 were authorized for issue in accordance with a resolution of the Board of Directors on January 23, 2019.
3. Significant accounting judgments, estimates and assumptions The preparation of the Group’s consolidated financial statements requires management to make judgments, estimates and assumptions that affect the reported amounts of revenues, expenses, assets and liabilities, and the accompanying disclosures, and the disclosure of contingent liabilities. Uncertainty about these assumptions and estimates could result in outcomes that require a material adjustment to the carrying amount of assets or liabilities affected in future periods. Other disclosures relating to the Group’s exposure to risks and uncertainties includes: Financial instruments risk management and policies (Note 44). Sensitivity analyses disclosures (Notes 18, 26, 43 and 44). 3.1 Judgments In the process of applying the Group’s accounting policies, management has made the following judgments, which have the most significant effect on the amounts recognized in the consolidated financial statements: Revenue from contracts with customers The Group applied the following judgements that significantly affect the determination of the amount and timing of revenue from contracts with customers (Note 2.3.21 Revenue from contracts with customers).
34

LG Household & Health Care Ltd. and its subsidiaries Notes to the consolidated financial statements December 31, 2018 and 2017
35
3. Significant accounting judgments, estimates and assumptions (cont’d) 3.2 Estimates and assumptions The key assumptions concerning the future and other key sources of estimation uncertainty at the reporting date, that have a significant risk of causing a material adjustment to the carrying amounts of assets and liabilities within the next financial year, are described below. The Group based its assumptions and estimates on parameters available when the consolidated financial statements were prepared. Existing circumstances and assumptions about future developments, however, may change due to market changes or circumstances arising beyond the control of the Group. Such changes are reflected in the assumptions when they occur. 3.2.1 Impairment of non-financial assets The Group assesses, at each reporting date, whether there is an indication that non-financial assets may be impaired. The Group performs impairment tests for intangible assets with indefinite useful lives and goodwill every year or when there is an indication of impairment. The Group performs impairment tests for other non-financial assets if there is an indication that their book value is not recoverable. To calculate use value, management estimates expected future cash flows arising from cash generating units (CGU) or assets, and selects an appropriate discount rate to compute the present value of the expected future cash flows. 3.2.2 Provision for expected credit losses of trade receivables and contract assets The Group uses a provision matrix to calculate ECLs for trade receivables and contract assets. The provision rates are based on days past due for groupings of various customer segments that have similar loss patterns (i.e., by geography, product type, customer type and rating, and coverage by letters of credit and other forms of credit insurance). The provision matrix is initially based on the Group’s historical observed default rates. At every reporting date, the historical observed default rates are updated and changes in the forward-looking estimates are analyzed. The assessment of the correlation between historical observed default rates, forecast economic conditions and ECLs is a significant estimate. The amount of ECLs is sensitive to changes in circumstances and of forecast economic conditions. The Group’s historical credit loss experience and forecast of economic conditions may also not be representative of customer’s actual default in the future. The information about the ECLs on the Group’s trade receivables and contract assets is disclosed in Note 44. 3.2.3 Deferred tax assets Deferred tax assets are recognized for unused tax losses to the extent that it is probable that taxable profit will be available against which the losses can be utilized. Significant management judgment is required to determine the amount of deferred tax assets that can be recognized, based upon the likely timing and the level of future taxable profits together with future tax planning strategies. The Group has tax losses carried forward. These losses relate to subsidiaries that have a history of losses, do not expire and may not be used to offset taxable income elsewhere in the Group. The subsidiaries neither have any taxable temporary difference nor any tax planning opportunities available that could partly support the recognition of these losses as deferred tax assets. On this basis, the Group has determined that it cannot recognize deferred tax assets on the tax losses carried forward. Further details on taxes are disclosed in Note 37. 3.2.4 Defined benefit plans (pension benefits) The cost of the defined benefit pension plans and other post-employment medical benefits and the present value of the pension obligation are determined using actuarial valuations. An actuarial valuation involves making various assumptions that may differ from actual developments in the future. These include the determination of the discount rate, future salary increases, mortality rates and future pension increases. Due to the complexities involved in the valuation and its long-term nature, a defined benefit obligation is highly sensitive to changes in these assumptions. All assumptions are reviewed at each reporting date.
35

LG Household & Health Care Ltd. and its subsidiaries Notes to the consolidated financial statements December 31, 2018 and 2017
36
3.2.4 Defined benefit plans (pension benefits) (cont’d) In determining the appropriate discount rate, management considers market yields on high quality corporate bonds. The mortality rate is based on publicly available mortality tables for the specific countries. Future salary increases and pension increases are based on expected future inflation rates for the respective countries. Further details on taxes are disclosed in Note 26. 3.2.5 Fair value measurement of financial instruments When the fair values of financial assets and financial liabilities recorded in the consolidated statement of financial position cannot be measured based on quoted prices in active markets, their fair value is measured using valuation techniques including the DCF model. The inputs to these models are taken from observable markets where possible, but where this is not feasible, a degree of judgment is required in establishing fair values. Judgments include considerations of inputs such as liquidity risk, credit risk and volatility. Changes in assumptions about these factors could affect the reported fair value of financial instruments. 3.2.6 Provision for decommissioning The Group has recognized a provision for decommissioning obligations associated with leased buildings. In determining the fair value of the provision, assumptions and estimates are made in relation to discount rates, the expected cost to dismantle and remove the plant from the site and the expected timing of those costs. 3.2.7 Special taxation for investment and promoting win-win cooperation The Group shall pay additional corporate taxes calculated according to the method set forth in the Tax Act when a certain amount of taxable income is not used for investment, wage increase and win-win cooperation under the Tax Act in accordance with the ‘Special taxation for investment and promotion of win-win cooperation’. As a result, the Group reflects the tax consequences of the tax exemption for investment and promotion of win-win cooperation when measuring the income tax in the same period, and the income tax to be borne by the Group in the future may vary depending on the level of investment, wage increase and win-win cooperation in each year. 4. Standards issued but not yet effective The standards and interpretations that are issued, but not yet effective, up to the date of issuance of the Group’s consolidated financial statements are disclosed below. The Group intends to adopt these standards, if applicable, when they become effective. 4.1 KIFRS 1116 Leases KIFRS 1116 was issued in January 2016 and it replaces KIFRS 1017 Leases, KIFRS 2104 determining whether an Arrangement contains a Lease, KIFRS 2015 Operating Leases-Incentives and KIFRS 2027 Evaluating the Substance of Transactions Involving the Legal Form of a Lease. KIFRS 1116 sets out the principles for the recognition, measurement, presentation and disclosure of leases and requires lessees to account for all leases under a single on-balance sheet model similar to the accounting for finance leases under KIFRS 1017. The standard includes two recognition exemptions for lessees – leases of ’low-value’ assets (e.g., personal computers) and short-term leases (i.e., leases with a lease term of 12 months or less). At the commencement date of a lease, a lessee will recognize a liability to make lease payments (i.e., the lease liability) and an asset representing the right to use the underlying asset during the lease term (i.e., the right-of-use asset). Lessees will be required to separately recognize the interest expense on the lease liability and the depreciation expense on the right-of-use asset. Lessees will be also required to remeasure the lease liability upon the occurrence of certain events (e.g., a change in the lease term, a change in future lease payments resulting from a change in an index or rate used to determine those payments). The lessee will generally recognize the amount of the remeasurement of the lease liability as an adjustment to the right-of-use asset.
36

LG Household & Health Care Ltd. and its subsidiaries Notes to the consolidated financial statements December 31, 2018 and 2017
37
4.1 KIFRS 1116 Leases (cont’d) Lessor accounting under KIFRS 1116 is not significantly changed from today’s accounting under KIFRS 1017. Lessors will continue to classify all leases using the same classification principle as in KIFRS 1017 and distinguish between two types of leases: operating and finance leases. KIFRS 1116 is effective for annual periods beginning on or after January 1, 2019. KIFRS 1116 also requires lessees and lessors to make more extensive disclosures than under KIFRS 1017. For the purpose of adopting KIFRS 1116, the Group has formed a task force team in 2018. In conjunction with an assistance from an accounting firm, the Group analyzed the profit structure to update related internal control processes and implement a new accounting system. As of December 31, 2018, the Group is analyzing the potential impact of the adoption of the standard on the Group’s consolidated financial statements. 4.2 Amendments to KIFRS 1109: Prepayment Features with Negative Compensation Under KIFRS 1109, a debt instrument can be measured at amortized cost or at fair value through other comprehensive income, provided that the contractual cash flows are ‘solely payments of principal and interest on the principal amount outstanding’ (the SPPI criterion) and the instrument is held within the appropriate business model for that classification. The amendments to KIFRS 1109 clarify that a financial asset passes the SPPI criterion regardless of the event or circumstance that causes the early termination of the contract and irrespective of which party pays or receives reasonable compensation for the early termination of the contract. The amendments should be applied retrospectively and are effective from January 1, 2019, with earlier application permitted. These amendments have no impact on the consolidated financial statements of the Group. 4.3 Amendments to KIFRS 1110 and KIFRS 1028: Sale or Contribution of Assets between an Investor and its Associate or Joint Venture The amendments address the conflict between KIFRS 1110 and KIFRS 1028 in dealing with the loss of control of a subsidiary that is sold or contributed to an associate or joint venture. The amendments clarify that the gain or loss resulting from the sale or contribution of assets that constitute a business, as defined in KIFRS 1103, between an investor and its associate or joint venture, is recognized in full. Any gain or loss resulting from the sale or contribution of assets that do not constitute a business, however, is recognized only to the extent of unrelated investors’ interests in the associate or joint venture. The KASB has deferred the effective date of these amendments indefinitely, but an entity that early adopts the amendments must apply them prospectively. The Group will apply these amendments when they become effective. 4.4 Amendments to KIFRS 1019: Plan Amendment, Curtailment or Settlement The amendments to KIFRS 1019 address the accounting when a plan amendment, curtailment or settlement occurs during a reporting period. The amendments specify that when a plan amendment, curtailment or settlement occurs during the annual reporting period, an entity is required to: Determine current service cost for the remainder of the period after the plan amendment, curtailment or
settlement, using the actuarial assumptions used to remeasure the net defined benefit liability (asset) reflecting the benefits offered under the plan and the plan assets after that event
Determine net interest for the remainder of the period after the plan amendment, curtailment or settlement using: the net defined benefit liability (asset) reflecting the benefits offered under the plan and the plan assets after that event; and the discount rate used to remeasure that net defined benefit liability (asset).
The amendments also clarify that an entity first determines any past service cost, or a gain or loss on settlement, without considering the effect of the asset ceiling. This amount is recognized in profit or loss. An entity then determines the effect of the asset ceiling after the plan amendment, curtailment or settlement. Any change in that effect, excluding amounts included in the net interest, is recognized in other comprehensive income. The amendments apply to plan amendments, curtailments, or settlements occurring on or after the beginning of the first annual reporting period that begins on or after January 1, 2019, with early application permitted. These amendments will apply only to any future plan amendments, curtailments, or settlements of the Group.
37

LG Household & Health Care Ltd. and its subsidiaries Notes to the consolidated financial statements December 31, 2018 and 2017
38
4. Standards issued but not yet effective (cont’d) 4.5 Amendments to KIFRS 1028: Long-term interests in associates and joint ventures The amendments clarify that an entity applies KIFRS 1109 to long-term interests in an associate or joint venture to which the equity method is not applied but that, in substance, form part of the net investment in the associate or joint venture (long-term interests). This clarification is relevant because it implies that the expected credit loss model in KIFRS 1109 applies to such long-term interests. The amendments also clarified that, in applying KIFRS 1109, an entity does not take account of any losses of the associate or joint venture, or any impairment losses on the net investment, recognized as adjustments to the net investment in the associate or joint venture that arise from applying KIFRS 1028 Investments in Associates and Joint Ventures. The amendments should be applied retrospectively and are effective from January 1, 2019, with early application permitted. Since the Group does not have such long-term interests in its associate and joint venture, the amendments will not have an impact on its consolidated financial statements. 4.6 IFRIC Interpretation 2123 Uncertainty over Income Tax Treatment The Interpretation addresses the accounting for income taxes when tax treatments involve uncertainty that affects the application of KIFRS 1012 and does not apply to taxes or levies outside the scope of KIFRS 1012, nor does it specifically include requirements relating to interest and penalties associated with uncertain tax treatments. The Interpretation specifically addresses the following: Whether an entity considers uncertain tax treatments separately The assumptions an entity makes about the examination of tax treatments by taxation authorities How an entity determines taxable profit (tax loss), tax bases, unused tax losses, unused tax credits and
tax rates How an entity considers changes in facts and circumstances
The Group has to determine whether to consider each uncertain tax treatment separately or together with one or more other uncertain tax treatments. The approach that better predicts the resolution of the uncertainty should be followed. The interpretation is effective for annual reporting periods beginning on or after January 1, 2019, but certain transition reliefs are available. The Group will apply the interpretation from its effective date. 4.7 Annual Improvements 2015-2017 Cycle
KIFRS 1103 Business Combinations The amendments clarify that, when an entity obtains control of a business that is a joint operation, it applies the requirements for a business combination achieved in stages, including remeasuring previously held interests in the assets and liabilities of the joint operation at fair value. In doing so, the acquirer remeasures its entire previously held interest in the joint operation. An entity applies those amendments to business combinations for which the acquisition date is on or after the beginning of the first annual reporting period beginning on or after January 1, 2019, with early application permitted. These amendments will apply on future business combinations of the Group. KIFRS 1111 Joint Arrangements A party that participates in, but does not have joint control of, a joint operation might obtain joint control of the joint operation in which the activity of the joint operation constitutes a business as defined in KIFRS 1103. The amendments clarify that the previously held interests in that joint operation are not remeasured. An entity applies those amendments to transactions in which it obtains joint control on or after the beginning of the first annual reporting period beginning on or after January 1, 2019, with early application permitted. These amendments are currently not applicable to the Group but may apply to future transactions.
38
LG Household & Health Care Ltd. and its subsidiaries Notes to the consolidated financial statements December 31, 2018 and 2017
39
4.7 Annual Improvements 2015-2017 Cycle (cont’d)
KIFRS 1012 Income Taxes The amendments clarify that the income tax consequences of dividends are linked more directly to past transactions or events that generated distributable profits than to distributions to owners. Therefore, an entity recognizes the income tax consequences of dividends in profit or loss, other comprehensive income or equity according to where the entity originally recognized those past transactions or events. An entity applies those amendments for annual reporting periods beginning on or after January 1, 2019, with early application is permitted. When an entity first applies those amendments, it applies them to the income tax consequences of dividends recognized on or after the beginning of the earliest comparative period. Since the Group’s current practice is in line with these amendments, the Group does not expect any effect on its consolidated financial statements. KIFRS 1023 Borrowing Costs The amendments clarify that an entity treats as part of general borrowings any borrowing originally made to develop a qualifying asset when substantially all of the activities necessary to prepare that asset for its intended use or sale are complete. An entity applies those amendments to borrowing costs incurred on or after the beginning of the annual reporting period in which the entity first applies those amendments. An entity applies those amendments for annual reporting periods beginning on or after January 1, 2019, with early application permitted. Since the Group’s current practice is in line with these amendments, the Group does not expect any effect on its consolidated financial statements.
39

LG Household & Health Care Ltd. and its subsidiaries Notes to the consolidated financial statements December 31, 2018 and 2017
40
5. Subsidiaries The consolidated subsidiaries as of December 31, 2018 and 2017 are as follows:
(*1) The Company acquired an additional 40% of K&I Co., Ltd.’s share capital during the year ended December 31, 2018. (*2) On January 2, 2018, the group obtained control of Tai Guk Pharm Co., Ltd. 92.71% is the percentage of Tai Guk Pharm Co., Ltd.’s ordinary shares, while 91.84% is the percentage when redeemable convertible preference shares are included. (*3) The Company acquired an additional 18.29% of Hangzou LG Cosmetics Co., Ltd.’s share capital during the year ended December 31, 2018. (*4) On July 4, 2018, Ginza Stefany Inc., a subsidiary of the Company, acquired 100% equity interest and obtained control of Avon Products Co., Ltd. When acquired, Avon Products Co., Ltd. held a 100% equity interest of Live & Live Co., Ltd. and Fleuve Beaute Inc.
2018
Subsidiary Equity ownership (%) Country of domicile Year-end Principal business
Coca-Cola Beverage Co. (*1) 90.00 Korea Dec. 31 Production and sales of soft drink
TheFaceShop Co., Ltd. 100.00 Korea Dec. 31 Production and sales of cosmetics
HAITAI HTB CO., LTD. 100.00 Korea Dec. 31 Production and sales of soft drink
Hankook Beverage Co., Ltd. 100.00 Korea Dec. 31 Production and sales of food and beverage
CNP Cosmetics Co., Ltd. 100.00 Korea Dec. 31 Sales of cosmetics K&I Co., Ltd.(*1) 100.00 Korea Dec. 31 Import and sales of
household items FMG Co., Ltd. (formerly, Zenisce Co., Ltd.) 70.00 Korea Dec. 31 Production of cosmetics Balkeunnuri Co., Ltd. 100.00 Korea Dec. 31 Operation of stores and
management of service staff
Oriental Biomed lab. Ltd. 70.00 Korea Dec. 31 Production and sales of cosmetics
LG Farouk Co. 50.00 Korea Dec. 31 Import and sales of household items
Ulleung Mountain Chu Spring Water Development Co., Ltd. 100.00 Korea Dec. 31 Production and sales of mineral water
Tai Guk Pharm Co., Ltd.(*2) 92.71 Korea Dec. 31 Production and sales of Pharmaceutical products
JS Pharmaceutical Co., Ltd.(*2) 100.00 Korea Dec. 31 Production and sales of Pharmaceutical products
LG Household & Health Care International Trading (Shanghai) Co., Ltd.
100.00 China Dec. 31 Sales of household items and cosmetics
Beijing LG Household Chemical Co., Ltd. 78.00 China Dec. 31 Production and sales of household items
Hangzhou LG Cosmetics Co., Ltd.(*3) 100.00 China Dec. 31 Production and sales of cosmetic raw materials
LG HOUSEHOLD AND HEALTH CARE COSMETICS R AND D (SHANGHAI) CO.,LTD
100.00 China Dec. 31 Research and development of cosmetics
THEFACESHOP (Shanghai) Co., Ltd 100.00 China Dec. 31 Sales of cosmetics THEFACESHOP TRADE (Guangdong) Co., Ltd. 100.00 China Dec. 31 Sales of cosmetics
Ginza Stefany Inc. 100.00 Japan Dec. 31 Sales of cosmetics and household items
Everlife Co., Ltd. 100.00 Japan Dec. 31 Mail order sales of health food and others
Toiletry Japan Inc. 70.00 Japan Dec. 31 Sales of household items Avon Products co., Ltd.(*4) 100.00 Japan Dec. 31 Production and sales of
cosmetics and health food
Live & Live Co., Ltd.(*4) 100.00 Japan Dec. 31 Insurance brokerage business
Fleuve Beaute Inc.(*4) 100.00 Japan Dec. 31 Production and sales of cosmetics
Evermere Holdings Company(*5) 100.00 Japan Dec. 31 Sales of cosmetics Evermere Cosmetics Company(*5) 100.00 Japan Dec. 31 Production and sales of
cosmetics Everlifeagency Co., Ltd 100.00 Japan Dec. 31 Advertising agency
business LG Vina Cosmetics Company Limited 60.00 Vietnam Dec. 31 Production and sales of
household items and cosmetics
LG Household & Health Care America Inc. 100.00 USA Dec. 31 Sales of household items and cosmetics
LG Household & Health Care (Taiwan) Ltd. 100.00 Taiwan Dec. 31 Sales of household items and cosmetics
Everlife H&B Co., Ltd. 100.00 Taiwan Dec. 31 Sales of health food LG Household & Health Care (Thailand) Limited(*6) 100.00 Thailand Dec. 31 Sales of cosmetics LG H&H HK LIMITED 80.00 Hong Kong Dec. 31 Sales of cosmetics TFS Singapore Private Limited 100.00 Singapore Dec. 31 Sales of cosmetics FRUITS & PASSION BOUTIQUES INC. 100.00 Canada Dec. 31 Sales of cosmetics FRUITS & PASSION IMMOBILIER INC. 100.00 Canada Dec. 31 Real estate leases 3390306 CANADA INC. 100.00 Canada Dec. 31 Sales of cosmetics LG HOUSEHOLD & HEALTH CARE MALAYSIA SDN. BHD. (formerly, Questeam Sdn. Bhd.)
100.00 Malaysia Mar. 31 Sales of cosmetics
40

LG Household & Health Care Ltd. and its subsidiaries Notes to the consolidated financial statements December 31, 2018 and 2017
41
5. Subsidiaries (cont’d) (*5) On October 1, 2018, Ginza Stefany Inc., a subsidiary of the Company, acquired 100% equity interest and obtained control of Evermere Holdings Company. When acquired, Evermere Holdings Company held a 100% equity interest of Evermere Cosmetics Company. (*6) On July 11, 2018, the Group, and subsidiary companies, TheFaceShop Co., Ltd., and CNP Cosmetics Co., Ltd., established LG Household & Health Care(Thailand) Limited, investing 1 share, 1,999,998 shares, and 1 share respectively.
(*1) Liquidated during the years ended December 31, 2018.
2017
Subsidiary Equity ownership (%) Country of domicile Year-end Principal business
Coca-Cola Beverage Co. 90.00 Korea Dec. 31 Production and sales of soft drink
TheFaceShop Co., Ltd. 100.00 Korea Dec. 31 Production and sales of cosmetics
HAITAI HTB CO., LTD. 100.00 Korea Dec. 31 Production and sales of soft drink
Hankook Beverage Co., Ltd. 100.00 Korea Dec. 31 Production and sales of food and beverage
CNP Cosmetics Co., Ltd. 100.00 Korea Dec. 31 Sales of cosmetics K&I Co., Ltd. 60.00 Korea Dec. 31 Import and sales of
household items Zenisce Co., Ltd. 70.00 Korea Dec. 31 Production of cosmetics Balkeunnuri Co., Ltd. 100.00 Korea Dec. 31 Operation of stores and
management of service staff
Oriental Biomed lab. Ltd. 70.00 Korea Dec. 31 Production and sales of cosmetics
LG Farouk Co. 50.00 Korea Dec. 31 Import and sales of household items
Ulleung Mountain Chu Spring Water Development Co., Ltd. 100.00 Korea Dec. 31 Production and sales of mineral water
LG Household & Health Care International Trading (Shanghai) Co., Ltd.
100.00 China Dec. 31 Sales of household items and cosmetics
Beijing LG Household Chemical Co., Ltd. 78.00 China Dec. 31 Production and sales of household items
Hangzhou LG Cosmetics Co., Ltd. 81.71 China Dec. 31 Production and sales of cosmetic raw materials
LG HOUSEHOLD AND HEALTH CARE COSMETICS R AND D (SHANGHAI) CO.,LTD
100.00 China Dec. 31 Research and development of cosmetics
THEFACESHOP (Shanghai) Co., Ltd 100.00 China Dec. 31 Sales of cosmetics THEFACESHOP TRADE (Guangdong) Co., Ltd. 100.00 China Dec. 31 Sales of cosmetics
Ginza Stefany Inc. 100.00 Japan Dec. 31 Sales of cosmetics and household items
Everlife Co., Ltd. 100.00 Japan Dec. 31 Mail order sales of health food and others
Toiletry Japan Inc. 70.00 Japan Dec. 31 Sales of household items Everlifeagency Co., Ltd. 100.00 Japan Dec. 31 Advertising agency
business LG Vina Cosmetics Company Limited 60.00 Vietnam Dec. 31 Production and sales of
household items and cosmetics
LG Household & Health Care America Inc. 100.00 USA Dec. 31 Sales of household items and cosmetics
LG Household & Health Care (Taiwan) Ltd. 100.00 Taiwan Dec. 31 Sales of household items and cosmetics
Everlife H&B Co., Ltd. 100.00 Taiwan Dec. 31 Sales of health food LG-Sanita Limited (*1) 55.00 UAE Dec. 31 Holding company LG H&H HK LIMITED 80.00 Hong Kong Dec. 31 Sales of cosmetics TFS Singapore Private Limited 100.00 Singapore Dec. 31 Sales of cosmetics FRUITS & PASSION BOUTIQUES INC. 100.00 Canada Dec. 31 Sales of cosmetics FRUITS & PASSION IMMOBILIER INC. 100.00 Canada Dec. 31 Real estate leases 3390306 CANADA INC. 100.00 Canada Dec. 31 Sales of cosmetics Questeam Sdn. Bhd. 100.00 Malaysia Mar. 31 Sales of cosmetics
41

LG Household & Health Care Ltd. and its subsidiaries Notes to the consolidated financial statements December 31, 2018 and 2017
42
5. Subsidiaries (cont’d)
Financial information of the subsidiaries as of December 31, 2018 and 2017 are as follows (Korean won in millions): 2018
Subsidiary Total assets Total liabilities Total equity Sales
Profit (loss) for the year
Total comprehensive income (loss)
Coca-Cola Beverage Co. \ 712,941 \ 163,736 \ 549,205 \ 1,197,451 \ 89,560 \ 84,219 TheFaceShop Co., Ltd. 281,160 61,802 219,358 386,557 1,341 1,156 HAITAI HTB CO., LTD. 418,394 160,772 257,622 356,446 747 (145) Hankook Beverage Co., Ltd. 35,643 2,555 33,088 38,156 1,311 1,269 CNP Cosmetics Co., Ltd. 31,966 9,508 22,458 79,804 9,446 9,579 K&I Co., Ltd. 3,722 1,640 2,082 14,526 325 325 FMG Co., Ltd.(formerly, Zenisce Co., Ltd.) 31,371 15,330 16,041 53,101 1,652 1,417 Balkeunnuri Co., Ltd. 1,097 325 772 2,512 137 121 Oriental Biomed lab. Ltd. 3,874 328 3,546 3,279 1,019 1,019 LG Farouk Co. 1,896 19 1,877 237 (60) (60) Ulleung Mountain Chu Spring Water Development Co., Ltd. 1,202 1,200 2 - 1 1
Tai Guk Pharm Co., Ltd. 111,098 20,798 90,300 48,813 (2,123) (3,513) JS Pharmaceutical Co., Ltd. 2,127 3,098 (981) 5,286 91 6 LG Household & Health Care International Trading (Shanghai) Co., Ltd. 292,175 167,759 124,416 609,398 60,829 59,740
Beijing LG Household Chemical Co., Ltd. 39,359 3,045 36,314 27,987 1,355 1,134 Hangzhou LG Cosmetics Co., Ltd. 16,609 4,931 11,678 23,825 554 481 LG HOUSEHOLD AND HEALTH CARE COSMETICS R AND D (SHANGHAI) CO.,LTD 2,874 521 2,353 4,197 114 99
THEFACESHOP (Shanghai) Co., Ltd 17,607 44,344 (26,737) 42,947 (5,471) (5,235) THEFACESHOP TRADE (Guandong) Co., Ltd. - - - - - - Ginza Stefany Inc. 325,666 170,169 155,497 130,963 8,419 8,419 Everlife Co., Ltd. 205,309 26,586 178,723 113,889 10,242 10,242 Toiletry Japan Inc. 4,326 3,651 675 8,860 (271) (271) Avon Products co., Ltd 41,723 24,095 17,628 49,143 3,126 3,054 Live & Live Co., Ltd. 214 62 152 71 17 17 Fleuve Beaute Inc. 89 135 (46) 62 (58) (58) Evermere Holdings Company 13,419 14,236 (817) 421 157 157 Evermere Cosmetics Company 28,300 6,768 21,532 1,810 (242) (242) Everlifeagency Co., Ltd. 6,826 4,851 1,975 47,299 755 755 LG Vina Cosmetics Company Limited 15,307 5,608 9,699 32,836 367 623 LG Household & Health Care America Inc. 20,321 8,032 12,289 34,669 2,175 2,631 LG Household & Health Care (Taiwan) Ltd. 18,694 12,197 6,497 46,746 (820) (690) Everlife H&B Co., Ltd. 119 1 118 - (4) (10) LG Household & Health Care (Thailand) Limited 7,396 791 6,605 552 (263) (117) LG H&H HK LIMITED 35,395 22,118 13,277 75,269 6,213 6,213 TFS Singapore Private Limited 10,917 5,032 5,885 28,194 1,377 1,479 FRUITS & PASSION BOUTIQUES INC. 16,461 14,926 1,535 40,986 (441) (515) FRUITS & PASSION IMMOBILIER INC. 79 46 33 - - - 3390306 CANADA INC. 257 - 257 - - - LG household & health care Malaysia SDN. BHD.(formerly Questeam Sdn. Bhd.)
12,887
6,929
5,958
16,563
1,104
1,195
2017
Subsidiary Total assets Total liabilities Total equity Sales
Profit (loss) for the year
Total comprehensive income (loss)
Coca-Cola Beverage Co. \ 703,576 \ 138,638 \ 564,938 \ 1,122,275 \ 94,314 \ 103,393 TheFaceShop Co., Ltd. 283,271 63,747 219,524 453,031 1,510 3,261 HAITAI HTB CO., LTD. 388,572 130,827 257,745 325,531 (4,526) (3,125) Hankook Beverage Co., Ltd. 36,824 5,005 31,819 40,475 2,284 2,331 CNP Cosmetics Co., Ltd. 19,380 6,463 12,917 66,170 8,364 8,222 K&I Co., Ltd. 2,310 179 2,131 14,160 511 511 Zenisce Co., Ltd. 30,263 15,640 14,623 46,149 1,541 1,461 Balkeunnuri Co., Ltd. 883 232 651 2,310 133 126 Oriental Biomed lab. Ltd. 2,806 264 2,542 2,545 539 539 LG Farouk Co. 1,962 24 1,938 190 (54) (54) Ulleung Mountain Chu Spring Water Development Co., Ltd. 1,201 1,200 1 - - -
LG Household & Health Care International Trading (Shanghai) Co., Ltd. 224,975 159,702 65,273 418,365 38,608 35,087
Beijing LG Household Chemical Co., Ltd. 38,853 3,673 35,180 37,556 3,010 1,048 Hangzhou LG Cosmetics Co., Ltd. 15,544 4,348 11,196 21,010 (190) (892) LG HOUSEHOLD AND HEALTH CARE COSMETICS R AND D (SHANGHAI) CO.,LTD 3,013 760 2,253 4,786 (6) (128)
THEFACESHOP (Shanghai) Co., Ltd 17,873 39,375 (21,502) 51,775 (19,420) (18,610) THEFACESHOP TRADE (Guandong) Co., Ltd. - - - - - - Ginza Stefany Inc. 134,367 18,634 115,733 116,765 9,738 701 Everlife Co., Ltd. 207,154 36,818 170,336 84,976 14,198 16,003 Toiletry Japan Inc. 4,068 3,178 890 10,189 87 87 Everlifeagency Co., Ltd. 4,489 3,357 1,132 37,663 521 521 LG Vina Cosmetics Company Limited 17,848 7,033 10,815 43,291 2,485 1,159 LG Household & Health Care America Inc. 19,025 9,468 9,557 29,482 1,723 619 LG Household & Health Care (Taiwan) Ltd. 19,665 12,450 7,215 49,787 (121) (421) Everlife H&B Co., Ltd. 123 2 121 - (4) (4) LG-Sanita Limited - - - - (39) (160) LG H&H HK LIMITED 21,161 14,512 6,649 43,938 2,898 2,898 TFS Singapore Private Limited 8,843 4,359 4,484 19,530 (596) (797) FRUITS & PASSION BOUTIQUES INC. 13,597 11,595 2,002 37,246 88 (24) FRUITS & PASSION IMMOBILIER INC. 82 48 34 - - - 3390306 CANADA INC. 268 - 268 - - - Questeam Sdn. Bhd. 6,555 1,756 4,799 5,084 349 349
The financial information of the above subsidiaries as of December 31, 2018 and 2017 is based on their separate financial statements.
42

LG Household & Health Care Ltd. and its subsidiaries Notes to the consolidated financial statements December 31, 2018 and 2017
43
6. Acquisition of subsidiaries
6.1 General <2018> A. Acquisition of Tai Guk Pharm Co., Ltd. by the Company The Group has acquired control over Tai Guk Pham Co., Ltd. as of January 2, 2018, in accordance with an agreement with major existing shareholders representing clearance of factors that restrict control such as the restriction of exercising voting rights, restriction of ability to direct the business activities, and circumstances where the Group cannot participate in the Board of Directors. The Group expects to increase its market competitiveness by the acquisition of the Tai Guk Pharm Co., Ltd., which specializes in skin care products. The acquisition is accounted for using the acquisition method. The consolidated financial statements for the current reporting period include the financial performance of Tai Guk Pharm Co., Ltd. from the acquisition date to the end of the current reporting period.
B. Acquisition of Avon Products Co., Ltd. by Ginza Stefany Inc. On July 4, 2018, Ginza Stefany Inc., a subsidiary of the Company, obtained control of Avon Products Co., Ltd. through an acquisition of 100% equity interest in Avon Products Co., Ltd., which is primarily engaged in the sale of cosmetics, and the Group expects to increase its competitiveness in Japanese cosmetics market through the acquisition. The acquisition is accounted for using the acquisition method. The consolidated financial statements for the current reporting period include the financial performance of Avon Products Co., Ltd. from the acquisition date to the end of the current reporting period. C. Acquisition of ‘Whoo’ exclusive distribution business by LG Household & Health Care (Thailand) Limited On July 23, 2018, LG Household & Health Care (Thailand) Limited, a subsidiary of the Company, acquired the ‘Whoo’ exclusive distribution business of MILLE (THAILAND) COMPANY Ltd. The Group expects to increase its competitiveness in Thai cosmetics market through the acquisition. The acquisition is accounted for using the acquisition method. The consolidated financial statements for the current reporting period include the financial performance of ‘Whoo’ exclusive distribution business from the acquisition date to the end of the current reporting period.
D. Acquisition of Evermere Holdings Comapny by Ginza Stefany Inc. On October 1, 2018, Ginza Stefany Inc., a subsidiary of the Company, obtained control of Evermere Holdings Company through an acquisition of 100% equity interest in Evermere Holdings Comapany, which is primarily engaged in the sale of cosmetics, and the Group expects to increase its competitiveness in Japanese cosmetics market through the acquisition. The acquisition is accounted for using the acquisition method. The consolidated financial statements for the current reporting period include the financial performance of Evermere Holdings Company from the acquisition date to the end of the current reporting period. <2017> A. Acquisition of health food and beverage business of LG Chem, Ltd. by the Company On February 28, 2017, the Company acquired the health food and beverage business of LG Chem, Ltd. The Group expects to increase its market competitiveness by the acquisition. The acquisition is accounted for using the acquisition method. The consolidated financial statements for the current reporting period include the financial performance of the health food and beverage business from the acquisition date to the end of the current reporting period. B. Acquisition of Questeam Sdn. Bhd. by TheFaceShop Co., Ltd. On September 11, 2017, TheFaceShop Co., Ltd., a subsidiary of the Company, obtained control of Questeam Sdn. Bhd. through an acquisition of 100% equity interest in Questeam Sdn. Bhd., which is primarily engaged in the sale of cosmetics, and the Group expects to increase its competitiveness in Malaysian cosmetics market by the acquisition. The acquisition is accounted for using the acquisition method. The consolidated financial statements for the current reporting period include the financial performance of Questeam Sdn. Bhd. from the acquisition date to the end of the current reporting period.
43

LG Household & Health Care Ltd. and its subsidiaries Notes to the consolidated financial statements December 31, 2018 and 2017
44
6.2 Identifiable assets and liabilities Details of identifiable assets and liabilities acquired are as follows (Korean won in millions): <2018>
Tai Guk Pharm Co., Ltd.
Avon Products Co., Ltd.
‘Whoo’ eclusive distribution business
Evermere Holdings Company
Assets:
Cash and cash equivalents \ 7,846 \ 31,097 \ - \ 1,522
Trade receivables 26,982 7,322 - 448
Other receivables 495 2,972 - -
Inventories 9,318 12,346 312 1,451
Other current assets 632 - - -
Property, plant and equipment 31,360 2,644 250 13,942
Intangible assets 3,885 25,993 - 982
Deferred tax assets 7,227 7,964 - -
Other non-current assets 789 2,755 - 3,249
Total assets 88,534 93,093 562 21,594
Liabilities:
Trade payables 14,919 10,975 - 182
Other payables 10,119 9,534 - 1,392
Short-term borrowings 26,224 27,134 - 1,591
Long-term borrowings 12,750 1,065 - 9,955
Other current liabilities 13,640 - - -
Deferred tax liabilities - 8,514 - -
Other non-current liabilities 5,776 5,243 - 1,515
Total liabilities 83,428 62,465 - 14,635
(a)Fair value of net assets 5,106 30,628 590 6,959
(b)Goodwill arising from acquisition (*1) 38,304 75,878 1,747 7,677
(c)Non-controlling interests 446 - - -
Total consideration transferred[(a)+(b)+(c)] \ 43,856 \ 106,506 \ 2,309 \ 14,636
(*1) Goodwill consists of expected synergy effects arising from business combination.
<2017>
Health food and beverage business
Questeam Sdn. Bhd.
Assets:
Cash and cash equivalents \ - \ 2,137 Trade receivables - 220 Other receivables - 639 Inventories 325 3,049 Deferred tax assets - 1 Property, plant and equipment - 971 Other assets - 279
Total assets 325 7,296
Liabilities: Trade payables - 21 Other payables 448 369 Deferred revenue - 78 Other liabilities - 2,375
Total liabilities 448 2,843
(a)Fair value of net assets (123) 4,453
(b)Goodwill arising from acquisition (*1) 4,920 3,492
Total consideration transferred[(a)+(b)] \ 4,797 \ 7,945
(*1) Goodwill consists of expected synergy effects arising from business combination.
44

LG Household & Health Care Ltd. and its subsidiaries Notes to the consolidated financial statements December 31, 2018 and 2017
45
6.3 Net cash flows arising from acquisitions of subsidiaries and business transfers Net cash flows arising from acquisitions of subsidiaries and business transfers (Korean won in millions):
2018
Tai Guk Pharm Co., Ltd.
Avon Products Co., Ltd.
‘Whoo’ exclusive distribution business
Evermere Holdings Company
Total consideration transferred (*1) \ - \ 106,506 \ 2,309 \ 14,636
Less: Cash and cash equivalents of
subsidiary acquired
(7,846) (31,097) - (1,522)
Net cash and cash equivalents paid
(Received) to obtain control (*2)
\ (7,846) \ 75,409 \ 2,309 \ 13,114
(*1) Total consideration transferred of \43,856 million for the acquisition of Tai Guk Pharm Co., Ltd. was paid
during the year ended December 31, 2017.
(*2) Exchange differences of \925 million on translation of foreign operations have not been included. The
incidental costs incurred in the acquisition are recorded as selling and administrative expenses in the consolidated statements of income.
2017
Health food and beverage business
Questeam Sdn. Bhd.
Total consideration transferred \ 4,797 \ 7,945
Less: Cash and cash equivalents of
subsidiary acquired
- (2,137)
Net cash and cash equivalents paid
to obtain control (*1)
\ 4,797 \ 5,808
(*1) Incidental costs of \151 million incurred in the acquisition have not been included. The incidental costs
incurred in the acquisition are recorded as selling and administrative expenses in the consolidated statements of income. 6.4 Incurred costs attributable to business combinations Costs attributable to business combinations in 2018 and 2017 include legal fees and due diligence fees. The
Group paid \3,436 million and \151 million in 2018 and 2017, respectively, which are recorded as selling and
administrative expenses in the consolidated statements of income. 6.5 Contributed revenue from business combinations (Korean won in millions):
2018
Tai Guk Pharm
Co., Ltd. Avon Products
Co., Ltd. ‘Whoo’ exclusive distribution business
Evermere Holdings Company
Sales \ 49,938 \ 49,217 \ 552 \ 1,970
Profit for the year (2,444) 4,515 (263) 493
2017
Health food and beverage business
Questeam Sdn. Bhd.
Sales \ 5,860 \ 5,084
Profit for the year 371 349
45

LG Household & Health Care Ltd. and its subsidiaries Notes to the consolidated financial statements December 31, 2018 and 2017
46
7. Non-controlling interests The major financial information of the Group’s non-controlling interests in subsidiaries as of and for the years ended December 31, 2018 and 2017 are as follows (Korean won in millions): 2018
Coca-Cola Beverage Co.
Beijing LG Household
Chemical Co., Ltd.
LG Vina Cosmetics Company Limited Tai Guk Co., Ltd.
Other individually immaterial
subsidiaries
Intra-group eliminations Total
NCI percentage 10.00% 22.00% 40.00% 7.29%
Non-current assets \ 690,569 4,060 4,570 47,249 Current assets
202,864 35,299 10,737 60,956 Non-current liabilities (52,855) - (1,309) (8,049) Current liabilities (149,143) (3,045) (4,299) (13,617) Net assets 691,435 36,314 9,699 86,539 Carrying amount of NCI 69,139 7,989 3,892 6,309 \ 1,202 \ (6,577)) \ 81,954
Sales 1,202,355 27,987 32,836 49,938 Profit (loss) for the year 91,078 1,355 367 (2,535)
OCI (5,382) (221) 256 (1,476)
Total comprehensive income 85,696 1,134 623 (4,011)
Profit allocated to NCI 9,108 298 147 (185) (111) 279 9,536 OCI allocated to NCI 8,570 249 249 (292) (39) 336 9,073
Cash flows from operating activities 13,102 743 269 (1,053)
Cash flows from investment activities (7,552) (850) (335) (476) Cash flows from financing activities (10,000) - (667) 3,335 Net increase (decrease) in
cash and cash equivalents
\ (4,450) \ (107) \ (733) \ 1,806
2017
Coca-Cola
Beverage Co.
Beijing LG Household
Chemical Co., Ltd.
Hangzhou LG Cosmetics Co.,
Ltd.
LG Vina Cosmetics
Company Limited K&I Co., Ltd.
Other individually immaterial
subsidiaries
Intra-group eliminations Total
NCI percentage 10.00% 22.00% 18.29% 40.00% 40.00%
Non-current assets \ 647,971 \ 4,324 \ 1,954 \ 4,844 \ 370 Current assets
235,618 34,529 13,590 13,004 1,940 Non-current liabilities
(41,285) - (72) (1,914) (33) Current liabilities
(136,613) (3,673) (4,275) (5,119) (146) Net assets 705,691 35,180 11,197 10,815 2,131 Carrying amount of NCI 70,569 7,740 2,048 4,326 852 \ 1,242 \ (1,229)) \ 85,548
Sales 1,127,586 37,556 21,010 43,291 14,160 Profit (loss) for the year 96,790 3,010 (190) 2,485 511 OCI 9,126 (1,962) (702) (1,325) -
Total comprehensive income 105,916 1,048 (892) 1,160 511
Profit allocated to NCI 9,679 662 (35) 994 204 (19) 411 11,896 OCI allocated to NCI 10,592 231 (163) 464 204 (73) 347 11,602
Cash flows from operating activities 97,209 4,364 (1,447) 1,177 1,559 Cash flows from investment activities
(60,726) (4,110) 3,626 (544) (10) Cash flows from financing activities
(122,500) (47) (2,329) (2,153) (1,436) Net increase (decrease) in
cash and cash equivalents
\ (86,017) \ 207 \ (150) \ (1,520) \ 113
The financial information above reflects adjustments in fair value as at the business combination date. 8. Operating segment information For management purposes, the Group is organized into business units based on its products and services and has three operating segments, as follows:
Industry Products or services Major customers
Healthy Detergents, shampoos, toothpastes and others Department stores, wholesalers and others Beautiful Skin care, make-up and others Department stores, duty-free shop, cosmetic
stores, wholesalers and others Refreshing Coca Cola and other beverage drinks Wholesalers and others
46

LG Household & Health Care Ltd. and its subsidiaries Notes to the consolidated financial statements December 31, 2018 and 2017
47
8. Operating segment information (cont’d) Details of assets and liabilities of each operating segment as of December 31, 2017 and 2016 are as follows (Korean won in millions): 2018
Healthy Beautiful Refreshing Total
Assets:
Segment assets:
Investments in associates and joint ventures
\ 49,364 \ 3,029 \ - \ 52,393
Property, plant and equipment 256,133 238,422
837,087 1,331,642
Intangible assets 146,997 1,123,213
210,335 1,480,545
Other assets 448,865 785,851
261,348 1,496,064
901,359 2,150,515 1,308,770
4,360,644 Unallocated assets 915,230
Total assets \ 5,275,874
Liabilities: Segment liabilities 249,957
657,533 271,367
1,178,857 Unallocated liabilities 502,997
Total liabilities \ 1,681,854
2017
Healthy Beautiful Refreshing Total
Assets:
Segment assets:
Investments in associates and joint ventures
\ 52,792
\ 2,723
\ -
\ 55,515
Property, plant and equipment 211,567 212,634 770,963 1,195,164 Intangible assets 108,209 1,024,913 211,486 1,344,608 Other assets 401,814 638,836 304,472 1,345,122
774,382 1,879,106 1,286,921 3,940,409
Unallocated assets 838,111
Total assets \ 4,778,520
Liabilities: Segment liabilities 230,376 436,858 238,764 905,998 Unallocated liabilities 790,739
Total liabilities \ 1,696,737
47
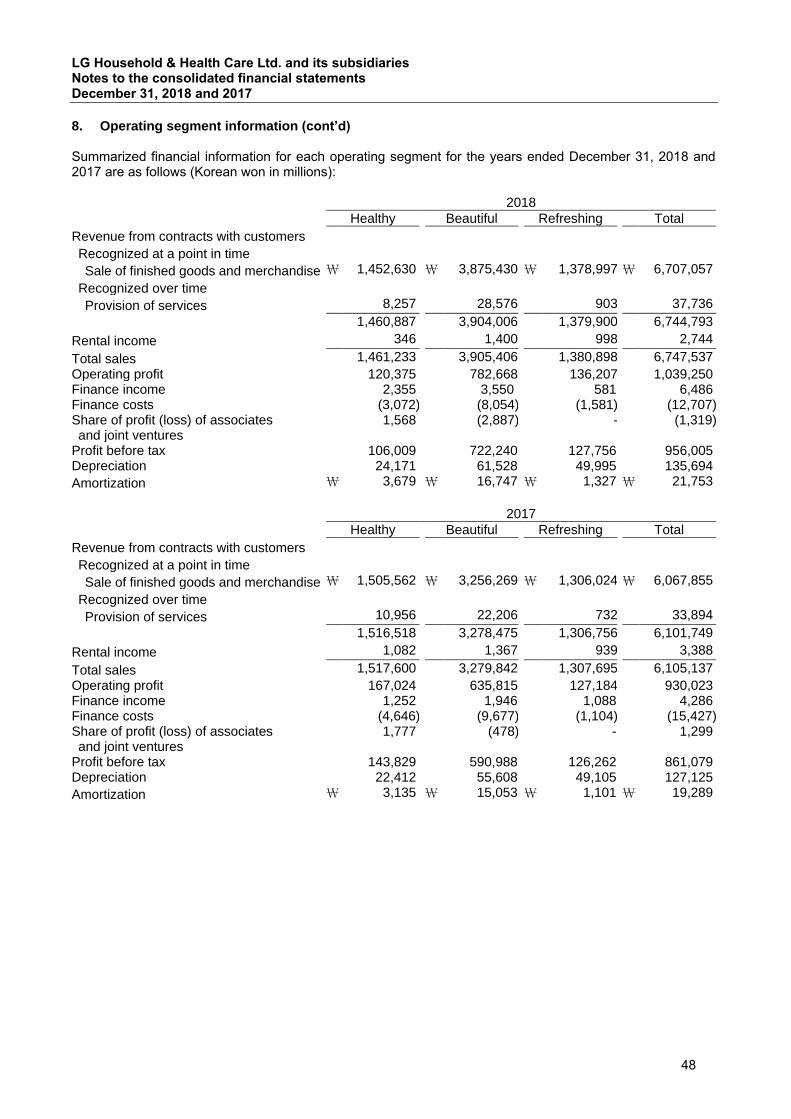
LG Household & Health Care Ltd. and its subsidiaries Notes to the consolidated financial statements December 31, 2018 and 2017
48
8. Operating segment information (cont’d) Summarized financial information for each operating segment for the years ended December 31, 2018 and 2017 are as follows (Korean won in millions): 2018
Healthy Beautiful Refreshing Total
Revenue from contracts with customers
Recognized at a point in time
Sale of finished goods and merchandise \ 1,452,630 \ 3,875,430 \ 1,378,997 \ 6,707,057
Recognized over time
Provision of services 8,257 28,576 903 37,736
1,460,887 3,904,006 1,379,900 6,744,793
Rental income 346 1,400 998 2,744
Total sales 1,461,233 3,905,406 1,380,898 6,747,537
Operating profit 120,375 782,668 136,207 1,039,250 Finance income 2,355 3,550 581 6,486 Finance costs (3,072) (8,054) (1,581) (12,707) Share of profit (loss) of associates and joint ventures
1,568
(2,887)
-
(1,319)
Profit before tax 106,009 722,240 127,756 956,005 Depreciation 24,171 61,528 49,995 135,694
Amortization \ 3,679 \ 16,747 \ 1,327 \ 21,753
2017
Healthy Beautiful Refreshing Total
Revenue from contracts with customers
Recognized at a point in time
Sale of finished goods and merchandise \ 1,505,562 \ 3,256,269 \ 1,306,024 \ 6,067,855
Recognized over time
Provision of services 10,956 22,206 732 33,894
1,516,518 3,278,475 1,306,756 6,101,749
Rental income 1,082 1,367 939 3,388
Total sales 1,517,600 3,279,842 1,307,695 6,105,137
Operating profit 167,024 635,815 127,184 930,023 Finance income 1,252 1,946 1,088 4,286 Finance costs (4,646) (9,677) (1,104) (15,427) Share of profit (loss) of associates and joint ventures
1,777
(478)
-
1,299
Profit before tax 143,829 590,988 126,262 861,079 Depreciation 22,412 55,608 49,105 127,125
Amortization \ 3,135 \ 15,053 \ 1,101 \ 19,289
48
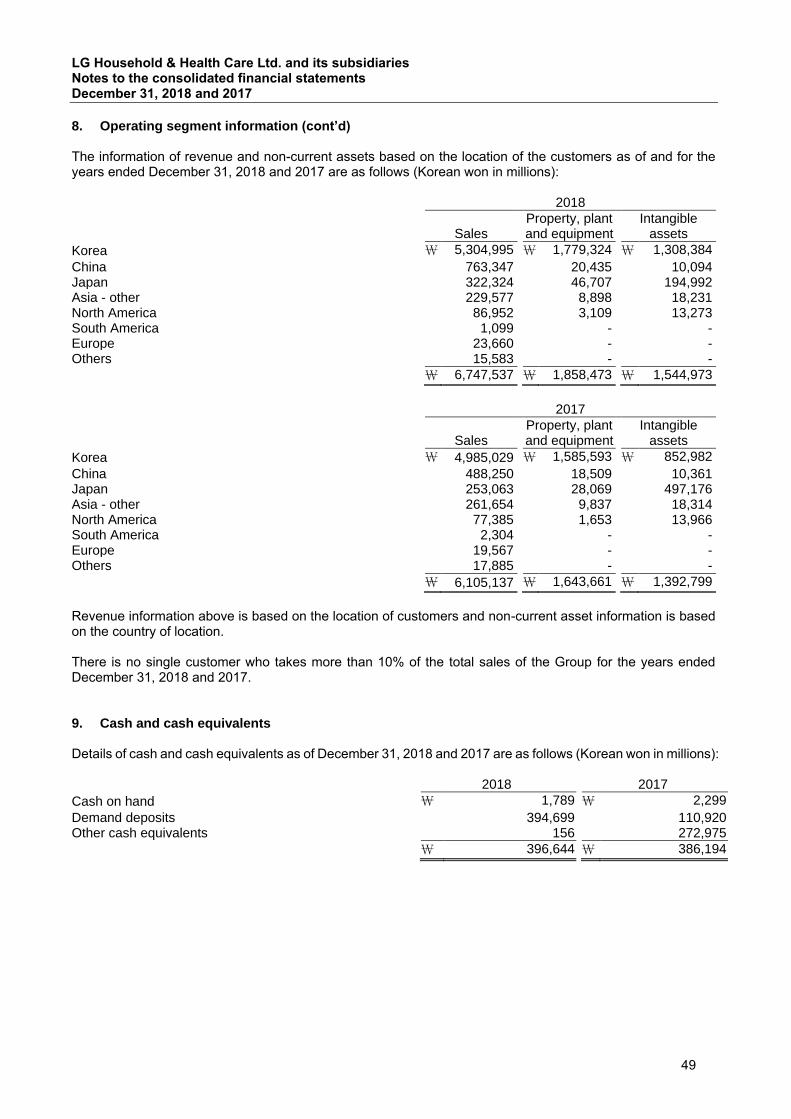
LG Household & Health Care Ltd. and its subsidiaries Notes to the consolidated financial statements December 31, 2018 and 2017
49
8. Operating segment information (cont’d) The information of revenue and non-current assets based on the location of the customers as of and for the years ended December 31, 2018 and 2017 are as follows (Korean won in millions): 2018
Sales
Property, plant and equipment
Intangible assets
Korea \ 5,304,995 \ 1,779,324 \ 1,308,384
China 763,347 20,435
10,094 Japan 322,324
46,707 194,992
Asia - other 229,577 8,898
18,231 North America 86,952
3,109 13,273
South America 1,099 -
- Europe 23,660
- -
Others 15,583 - - \ 6,747,537 \ 1,858,473 \ 1,544,973
2017
Sales
Property, plant and equipment
Intangible assets
Korea \ 4,985,029 \ 1,585,593 \ 852,982
China 488,250 18,509
10,361 Japan 253,063
28,069 497,176
Asia - other 261,654 9,837
18,314 North America 77,385
1,653 13,966
South America 2,304 -
- Europe 19,567
- -
Others 17,885 - - \ 6,105,137 \ 1,643,661 \ 1,392,799
Revenue information above is based on the location of customers and non-current asset information is based on the country of location. There is no single customer who takes more than 10% of the total sales of the Group for the years ended December 31, 2018 and 2017. 9. Cash and cash equivalents
Details of cash and cash equivalents as of December 31, 2018 and 2017 are as follows (Korean won in millions): 2018 2017
Cash on hand \ 1,789 \ 2,299
Demand deposits 394,699 110,920 Other cash equivalents 156 272,975 \ 396,644 \ 386,194
49

LG Household & Health Care Ltd. and its subsidiaries Notes to the consolidated financial statements December 31, 2018 and 2017
50
10. Trade and other receivables Trade and other receivables are presented net of allowance for doubtful accounts. The gross amounts of trade and other receivables as of December 31, 2018 and 2017 are summarized as follows (Korean won in millions): 2018 2017
Trade receivables \ 566,838 \ 529,223
Other receivables 21,533 12,379 Other loans and receivables 5,746 5,426 \ 594,117 \ 547,028
Changes in the allowance for doubtful accounts for the years ended December 31, 2018 and 2017 are as follows (Korean won in millions):
2018
Trade Receivable
Other Receivable
Other loans and receivable Total
Jan. 1, 2018 \ 6,423 \ 1,086 \ - \ 7,509 Effect of adoption of new accounting standards (730) 196 - (534)
Impairment (182) 83 141 42
Write-off (2,316) (10) - (2,326)
Increase from business combination 7,291 - - 7,291
Foreign exchange differences 262 2 (1) 263
Others 2 - 3 5
Dec. 31, 2018 \ 10,750 \ 1,357 \ 143 \ 12,250
2017
Trade receivables
Other receivables Total
Jan. 1, 2017 \ 5,840 \ 764 \ 6,604
Impairment 1,335 338 1,673
Write-off (481) (16) (497)
Foreign exchange differences (271) - (271)
Dec. 31, 2017 \ 6,423 \ 1,086 \ 7,509
Details of trade receivables transferred or discounted that do not meet the requirements for derecognition and continue to be recognized at their book value as of December 31, 2018 and 2017 are as follows (Korean won in millions): 2018 2017 Remark
Trade receivables \ 25,948 \ 24,855 With recourse
The Group recognizes the nominal value of trade receivables transferred or discounted as short-term borrowings.
50
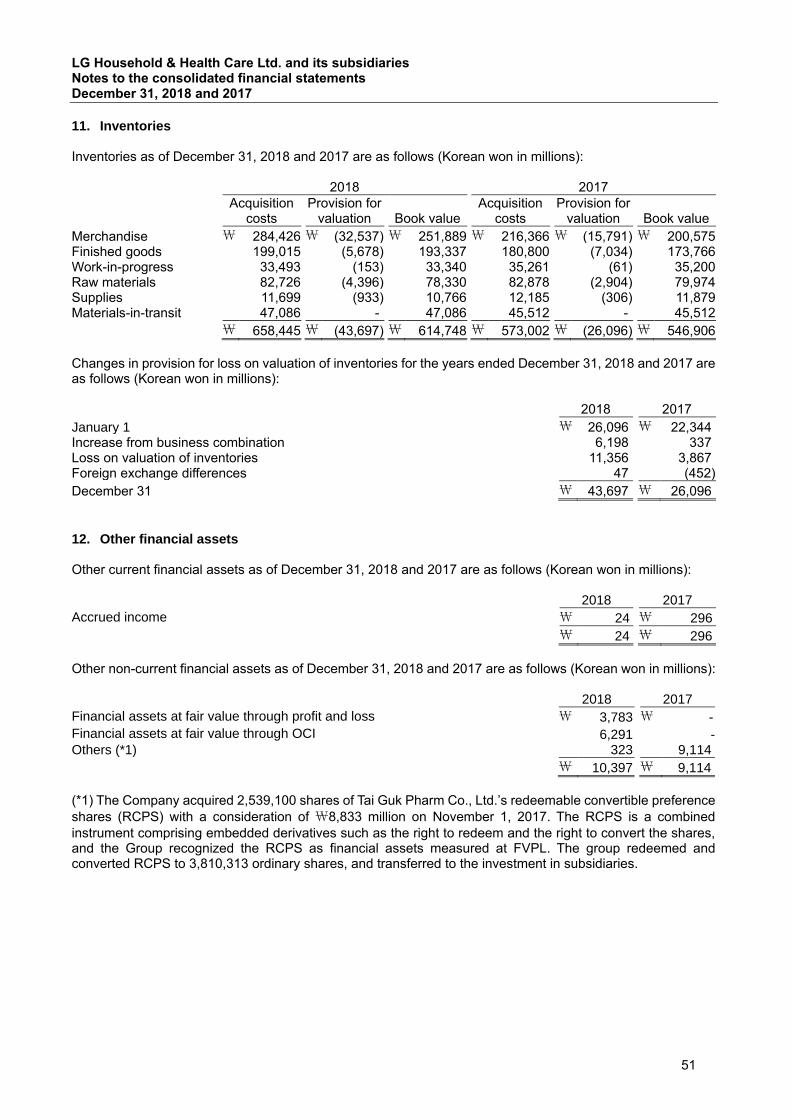
LG Household & Health Care Ltd. and its subsidiaries Notes to the consolidated financial statements December 31, 2018 and 2017
51
11. Inventories Inventories as of December 31, 2018 and 2017 are as follows (Korean won in millions): 2018 2017
Acquisition
costs Provision for
valuation
Book value Acquisition
costs Provision for
valuation
Book value
Merchandise \ 284,426 \ (32,537) \ 251,889 \ 216,366 \ (15,791) \ 200,575 Finished goods 199,015 (5,678) 193,337 180,800 (7,034) 173,766 Work-in-progress 33,493 (153) 33,340 35,261 (61) 35,200 Raw materials 82,726 (4,396) 78,330 82,878 (2,904) 79,974 Supplies 11,699 (933) 10,766 12,185 (306) 11,879 Materials-in-transit 47,086 - 47,086 45,512 - 45,512
\ 658,445 \ (43,697) \ 614,748 \ 573,002 \ (26,096) \ 546,906
Changes in provision for loss on valuation of inventories for the years ended December 31, 2018 and 2017 are as follows (Korean won in millions): 2018 2017
January 1 \ 26,096 \ 22,344 Increase from business combination 6,198 337 Loss on valuation of inventories 11,356 3,867 Foreign exchange differences 47 (452)
December 31 \ 43,697 \ 26,096
12. Other financial assets Other current financial assets as of December 31, 2018 and 2017 are as follows (Korean won in millions):
2018 2017
Accrued income \ 24 \ 296
\ 24 \ 296
Other non-current financial assets as of December 31, 2018 and 2017 are as follows (Korean won in millions):
2018 2017
Financial assets at fair value through profit and loss \ 3,783 \ -
Financial assets at fair value through OCI 6,291 - Others (*1) 323 9,114
\ 10,397 \ 9,114
(*1) The Company acquired 2,539,100 shares of Tai Guk Pharm Co., Ltd.’s redeemable convertible preference
shares (RCPS) with a consideration of \8,833 million on November 1, 2017. The RCPS is a combined
instrument comprising embedded derivatives such as the right to redeem and the right to convert the shares, and the Group recognized the RCPS as financial assets measured at FVPL. The group redeemed and converted RCPS to 3,810,313 ordinary shares, and transferred to the investment in subsidiaries.
51

LG Household & Health Care Ltd. and its subsidiaries Notes to the consolidated financial statements December 31, 2018 and 2017
52
12. Other financial assets (cont’d) Financial assets at fair value through profit and loss as of December 31, 2018 and 2017 are as follows (Korean won in millions):
Equity ownership (%) 2018 2017
Equity instruments:
Hana Financial Group Inc. 0.01 \ 424 \ 582 Maeil Business TV News 0.02 91 100 Inter fashion planning 0.14 1 1
516 683
Debt instruments:
Convertible bond of MiGenstory Co., Ltd. - - 1,054
Bio creative economy fund 9.89 1,000 1,000 Chungbuk Creative Economy Innovation Fund 3.23 1,000 800 Korea Pharmaceutical Ind. Coop. - 154 -
2,154 2,854
Derivatives Convertible rights of MiGenstory Co., Ltd. - - 234 Call options of Tai Guk Pharm Co., Ltd - 910 -
910 234
Hybrid contracts RCPS of Tai Guk Pharm Co., Ltd - - 8,833 Convertible bond of MiGenstory Co., Ltd. - 203 -
203 8,833
\ 3,783 \ 12,604
Those instruments were classified as AFS financial assets and other financial assets for the year ended December 31, 2017. For changes in accounting policies and descriptions about reclassification from AFS financial assets and other financial assets to financial assets at fair value through profit and loss, refer to Note 2. Changes in the financial assets at fair value through profit and loss for the years ended December 31, 2018 and 2017 are as follows (Korean won in millions): 2018 2017
January 1 \ 12,604 \ 2,860 Acquisition 200 9,433 Increase from business combination 154 - Interest income - 94
Transfers (*1) (8,833) -
Gain(loss) on valuation 28 217 Share of loss of associates and joint ventures
(370)
-
December 31 \ 3,783 \ 12,604
(*1) The group redeemed RCPS of Tai Guk Pharm Co., Ltd. and it converted it to 3,810,313 ordinary shares, and transferred to investment in subsidiaries for the year ended December 31, 2018.
52

LG Household & Health Care Ltd. and its subsidiaries Notes to the consolidated financial statements December 31, 2018 and 2017
53
12. Other financial assets (cont’d) Financial assets at fair value through OCI as of December 31, 2018 and 2017 are as follows (Korean won in millions):
Equity ownership (%) Dec. 31, 2018 Dec. 31, 2017
Equity instruments:
Daedong Korea Ginseng Co., Ltd. 5.06 \ 2,045 \ 2,250 TAI GUK Pharm Co., Ltd. - - 35,023 LYA NATURE CO.,LTD. 16.67 2,892 4,000
Stripes Co.,Ltd. 5.39 1,000 1,000
Haebong Co., Ltd. 19.71 - -
ELAND Retail., Ltd. 0.01 10 10
JINSUNG CONTRUCTION - 1 1
IGA Korea Co., Ltd. 18.37 343 787
\ 6,291 \ 43,071
Those instruments were classified as AFS financial assets and other financial assets for the year ended December 31, 2017. For changes in accounting policies and descriptions about reclassification from AFS financial assets and other financial assets to financial assets at fair value through profit and loss, refer to Note 2. The above equity instruments are not financial assets held for trading and contingent consideration recognized by the acquirer under KIFRS1103. The Group elect to classify its equity investments as equity instruments designated at fair value through OCI when they initial adopted KIFRS 1109. Changes in the financial assets at fair value through profit and loss for the years ended December 31, 2018 and 2017 are as follows (Korean won in millions): 2018 2017
January 1 \ 43,071 \ 3,164 Increase from business combination(Remeasurement) (832) - Acquisition - 40,023
Transfers (*1) (35,023) -
Loss on valuation (925) (116)
December 31 \ 6,291 \ 43,071
(*1) The group obtained control of Tai Guk Pharm Co., Ltd. and they were transferred to investment in subsidiaries for the year ended December 31, 2018. Accumulated OCI of the above equity instruments relating to changes in fair value valuation are not reclassified
to profit or loss on subsequent disposals.
53

LG Household & Health Care Ltd. and its subsidiaries Notes to the consolidated financial statements December 31, 2018 and 2017
54
13. Other assets Other current assets as of December 31, 2018 and 2017 are as follows (Korean won in millions):
2018 2017
Advance payments \ 60,780 \ 6,012
Prepaid expenses 17,592 15,724
Prepaid value added tax 1,110 722
Prepaid income tax 490 496
Others 1,047 836
\ 81,109 \ 23,790
Other non-current assets as of December 31, 2018 and 2017 are as follows (Korean won in millions):
2018 2017
Prepaid expenses \ 6,584 \ 2,675
Defined benefit plan asset (Note 26) 12,379 9,679
\ 18,963 \ 12,354
14. Other long-term receivables Other long-term receivables are presented net of allowance for doubtful accounts. The gross amounts of other long-term receivables as of December 31, 2018 and 2017 are summarized as follows (Korean won in millions): 2018 2017
Long-term loans \ 188 \ 53
Guarantee deposits 77,542 86,074 Others 5,766 5,245 \ 83,496 \ 91,372
Changes in the allowance for doubtful accounts for the years ended December 31, 2018 and 2017 are as follows (Korean won in millions):
2018
Long-term loans
Guarantee deposits Total
January 1 \ 53 \ 3,332 \ 3,385
Effect of adoption of new accounting standards - 2,545 2,545
Impairment - (1,183) (1,183)
Increase from business combination 13 23 36
Foreign exchange differences 97 61 158
December 31 \ 163 \ 4,778 \ 4,941
2017
Long-term loans
Guarantee deposits Total
January 1 \ 58 \ 3,468 \ 3,526
Impairment - 90 90
Write-off - (90) (90)
Foreign exchange differences (5) (136) (141)
December 31 \ 53 \ 3,332 \ 3,385
54

LG Household & Health Care Ltd. and its subsidiaries Notes to the consolidated financial statements December 31, 2018 and 2017
55
14. Other long-term receivables (cont’d) Changes in the present value discounts for the years ended December 31, 2018 and 2017 are as follows (Korean won in millions):
2018 2017
January 1 \ 454 \ 743
Accretion of discount (224) (268)
Write-off - (21)
December 31 \ 230 \ 454
15. Investment in associates and joint ventures Investment in associates as of December 31, 2018 and 2017 are as follows (Korean won in millions): 2018
Company
Country of domicile
Principal business Year-end
Number of shares held
Equity ownership (%) December 31
LG Uni-charm Co., Ltd.
Korea
Manufacture of paper based hygiene products
Dec. 31
1,470,000 49.00 \ 52,214 Coty Korea Ltd.
Korea
Import and wholesale trade of cosmetics and others
Dec. 31
62,172 49.50 -
\ 52,214
2017
Company
Country of domicile
Principal business Year-end
Number of shares held
Equity ownership (%) December 31
LG Uni-charm Co., Ltd.
Korea
Manufacture of paper based hygiene products
Dec. 31
1,470,000 49.00 \ 49,011 Coty Korea Ltd.
Korea
Import and wholesale trade of cosmetics and others
Dec. 31
62,172 49.50 -
\ 49,011
Changes in book values of investments in associates for the years ended December 31, 2018 and 2017 are as follows (Korean won in millions): 2018
Company January 1
Dividends received
Share of profit of associates December 31
LG Uni-charm Co., Ltd. \ 49,011 \ (2,205) \ 5,408 \ 52,214
Coty Korea Ltd. - - - -
\ 49,011 \ (2,205) \ 5,408 \ 52,214
2017
Company January 1
Dividends received
Share of profit of associates December 31
LG Uni-charm Co., Ltd. \ 47,812 \ (3,528) \ 4,727 \ 49,011 Coty Korea Ltd. - - - -
\ 47,812 \ (3,528) \ 4,727 \ 49,011
55

LG Household & Health Care Ltd. and its subsidiaries Notes to the consolidated financial statements December 31, 2018 and 2017
56
15. Investment in associates and joint ventures (cont’d) Summarized financial information of the associates as of December 31, 2018 and 2017 are as follows (Korean won in millions): 2018
Company
Current assets
Non-current assets
Current liabilities
Non-current liabilities Sales
Operating profit
Profit for the year
LG Uni-charm Co., Ltd.
\ 90,750 \ 49,636 \ 28,871 \ 2,285 \ 147,809 \ 14,010 \ 11,562 Coty Korea Ltd.
8,918 1,490 9,686 197 18,960 935 749
\ 99,668 \ 51,126 \ 38,557 \ 2,482 \ 166,769 \ 14,945 \ 12,311
2017
Company
Current assets
Non-current assets
Current liabilities
Non-current liabilities Sales
Operating profit
Profit for the year
LG Uni-charm Co., Ltd.
\ 77,601 \ 53,037 \ 26,337 \ 2,132 \ 147,321 \ 10,977 \ 9,006 Coty Korea Ltd.
6,920 595 7,626 113 15,350 1,821 1,690
\ 84,521 \ 53,632 \ 33,963 \ 2,245 \ 162,671 \ 12,798 \ 10,696
Summarized financial information of the associates, and reconciliation with the carrying amount of the investment in the consolidated financial statements as of December 31, 2018 and 2017 and the years then ended is set out below (Korean won in millions):
2018
Company Net assets
Equity of
net assets
Variance of
investment
Internal
transaction
Accumulated
loss Book value
LG Uni-charm Co., Ltd. \ 109,230 \ 53,523 \ 944 \ (2,253) \ - \ 52,214
Coty Korea Ltd. 525 260 56 (1,383) 1,067 -
\ 109,755 \ 53,783 \ 1,000 \ (3,636) \ 1,067 \ 52,214
2017
Company Net assets
Equity of
net assets
Variance of
investment
Internal
transaction
Accumulated
loss Book value
LG Uni-charm Co., Ltd. \ 102,169 \ 50,062 \ 944 \ (1,995) \ - \ 49,011
Coty Korea Ltd. (224) (111) 56 (367) 422 -
\ 101,945 \ 49,951 \ 1,000 \ (2,362) \ 422 \ 49,011
The Group entered into a joint arrangement with following entities: Emery Oleochemicals Rika (M) Sdn. Bhd., producing raw materials; Clean Soul Ltd., selling household goods; MiGenstory Co., Ltd., providing genetic analysis services. The Group has rights to the net assets of the entities. Accordingly, the Group classifies investments in Emery Oleochemicals Rika (M) Sdn. Bhd., Clean Soul Ltd. and MiGenstory Co., Ltd. as joint ventures.
56

LG Household & Health Care Ltd. and its subsidiaries Notes to the consolidated financial statements December 31, 2018 and 2017
57
15. Investment in associates and joint ventures (cont’d) Details of joint ventures as of December 31, 2018 and 2017 are as follows (Korean won in millions):
Company
Country of
domicile Principal business Year-end
Number of
shares held
Equity
ownership
(%)
Dec. 31,
2018
Emery Oleochemicals Rika (M)
Sdn. Bhd.
Malaysia
Manufacturing raw material
Dec. 31
21,875,000
20.00
\ -
Clean Soul Ltd.
Korea Household product sales Dec. 31 5,000 50.00
179
MiGenstory Co., Ltd. Korea Genetic analysis services Dec. 31 10,000 50.00 -
\ 179
Company
Country of
domicile Principal business Year-end
Number of
shares held
Equity
ownership
(%)
Dec. 31,
2017
Emery Oleochemicals Rika (M)
Sdn. Bhd.
Malaysia
Manufacturing raw material
Dec. 31
21,875,000
20.00
\ 3,853
Clean Soul Ltd.
Korea Household product sales Dec. 31 5,000 50.00
132
MiGenstory Co., Ltd.
Korea Genetic analysis services Dec. 31 10,000 50.00
2,519
\ 6,504
Changes in book values of investments in joint ventures for the years ended 2018 and 2017 are as follows (Korean won in millions):
2018
Company January 1
Share of profit (loss) of joint ventures
Dividends received
The Group’s share of profit(loss) Impairment
Share of other comprehensive
loss of a joint venture
Others December 31
Emery Oleochemicals Rika (M) Sdn. Bhd. \ 3,853
\ (259)
\ 113 \ (3,999) \ 292
\ - \ -
Clean Soul Ltd. 132 - 47 - - - 179
MiGenstory Co., Ltd. 2,519 - (2,888) - - 369 -
\ 6,504 \ (259) \ (2,728) \ (3,999) \ 292 \ 369 \ 179
2017
Company January 1
Share of profit (loss) of joint ventures
The Group’s share of profit(loss) Impairment
Share of other comprehensive loss of a joint
venture December 31
Emery Oleochemicals Rika (M) Sdn. Bhd. \ 6,865
\ (691) \ (2,168) \ (153) \ 3,853
Clean Soul Ltd. 224 (92) - - 132 MiGenstory Co., Ltd. 2,997 (478) - - 2,519
\ 10,086 \ (1,261) \ (2,168) \ (153) \ 6,504
57

LG Household & Health Care Ltd. and its subsidiaries Notes to the consolidated financial statements December 31, 2018 and 2017
58
15. Investment in associates and joint ventures (cont’d) Summarized financial information of the joint ventures as of December 31, 2018 and 2017 is as follows (Korean won in millions): 2018
Company Current assets
Non-current assets Current liabilities
Non-current liabilities Sales
Operating profit (loss)
Profit (loss) for the year
Emery Oleochemicals Rika (M) Sdn. Bhd.
\ 27,594 \ 6,763 \ 3,369 \ 958 \ 64,838 \ 182 \ 547 Clean Soul Ltd.
806 6 456 - 4,177 91 91 MiGenstory Co., Ltd.
1,449 90 564 1,171 - (5,741) (5,775)
\ 29,849 \ 6,859 \ 4,389 \ 2,129 \ 69,015 \ (5,468) \ (5,137)
2017
Company Current assets
Non-current assets Current liabilities
Non-current liabilities Sales
Operating profit (loss)
Profit (loss) for the year
Emery Oleochemicals Rika (M) Sdn. Bhd.
\ 25,901 \ 6,496 \ 1,300 \ 966 \ 81,621 \ 2,426 \ (3,453) Clean Soul Ltd.
739 6 480 - 3,707 (215) (192) MiGenstory Co., Ltd.
6,752 102 208 1,067 - (944) (957)
\ 33,392 \ 6,604 \ 1,988 \ 2,033 \ 85,328 \ 1,267 \ (4,602)
Adjusted book values of equity ownership from financial information of the joint ventures as of December 31, 2018 and 2017 are as follows (Korean won in millions): 2018
Company Net assets
Equity of Net assets
Internal Transaction Impairment
Accumulated non-reflected
loss Others(*1) Book value
Emery Oleochemicals Rika (M) Sdn. Bhd.
\ 30,030 \ 6,006 \ (1) \ (6,167) \ 162 \ - \ - Clean Soul Ltd.
356 179 - - - - 179 MiGenstory Co., Ltd.
(196) (98) (271) - - 369 -
\ 30,190 \ 3,919 \ (272) \ (3,999) \ 162 \ 369 \ 179
(*1) Due to the accumulated loss as of December 31, 2018, book values for the joint venture could not be measured, thus equity accounted earnings (loss) was applied to financial assets at fair value through profit or loss.
2017
Company Net assets
Equity of net assets
Internal Transaction Impairment Book value
Emery Oleochemicals Rika (M) Sdn. Bhd. \ 30,131 \ 6,026 \ (5) \ (2,168) \ 3,853 Clean Soul Ltd.
265 132 - - 132 MiGenstory Co., Ltd. 5,579 2,790 (271) - 2,519
\ 35,975 \ 8,948 \ (276) \ (2,168) \ 6,504
58

LG Household & Health Care Ltd. and its subsidiaries Notes to the consolidated financial statements December 31, 2018 and 2017
59
16. Property, plant and equipment Book values of property, plant and equipment as of December 31, 2018 and 2017 are as follows (Korean won in millions):
2018
Acquisition cost Accumulated depreciation
Accumulated impairment loss
Government grants
Book value
Land \ 618,355 \ - \ - \ - \ 618,355
Buildings 734,881 (148,829) - - 586,052 Structures 78,397 (29,645) (362) - 48,390 Machinery and equipment 746,206 (432,614) (3,731) - 309,861 Vehicles 57,860 (45,092) - (20) 12,748 Tools 148,924 (117,409) (168) - 31,347 Furniture and fixtures 436,204 (304,932) (12,190) (409) 118,673 Other PP&E 27,358 (23,848) - - 3,510 Construction-in-progress 84,352 - - - 84,352
\ 2,932,537 \ (1,102,369) \ (16,451) \ (429) \ 1,813,288
2017
Acquisition cost Accumulated depreciation
Accumulated impairment loss
Government grants
Book value
Land \ 570,756 \ - \ - \ - \ 570,756
Buildings 481,470 (126,315) - - 355,155 Structures 65,918 (25,499) (362) - 40,057 Machinery and equipment 674,836 (386,712) (1,132) - 286,992 Vehicles 57,225 (46,520) - (26) 10,679 Tools 145,654 (115,306) (23) - 30,325 Furniture and fixtures 442,669 (309,552) (10,016) (531) 122,570 Other PP&E 27,318 (23,176) - - 4,142 Construction-in-progress 195,918 - - - 195,918
\ 2,661,764 \ (1,033,080) \ (11,533) \ (557) \ 1,616,594
Changes in acquisition costs of property, plant and equipment for the years ended December 31, 2018 and 2017 are as follows (Korean won in millions): 2018
Acquisition cost as of
January 1 Acquisitions
Disposals
Increase from business
combination Others (*1)
Foreign exchange
differences
Acquisition cost as of
December 31
Land \ 570,756 \ - \ (158) \ 13,631 \ 32,884 \ 1,242 \ 618,355
Buildings 481,470 3,159 (8,330) 40,898 216,438 1,246 734,881
Structures 65,918 163 (1,306) 4,010 9,534 78 78,397
Machinery and equipment
674,836 3,108 (18,845) 23,700 63,267 140 746,206
Vehicles 57,225 908 (5,596) 115 5,197 11 57,860 Tools 145,654 4,639 (15,624) 912 13,083 260 148,924 Furniture and
fixtures
442,669 38,666 (67,128) 6,121 15,801 75 436,204 Other PP&E 27,318 - (982) - 1,022 - 27,358 Construction-
in-progress
195,918 279,254 - 73 (390,901) 8 84,352
\ 2,661,764 \ 329,897 \ (117,969) \ 89,460 \ (33,675) \ 3,060 \ 2,932,537
(*1) Others represent amounts transferred out from construction in progress to intangible assets of (-)\10,590
million, amounts transferred out from land and buildings to investment property of (-)\26,549 million and
amounts transferred in resulting from the capitalization of borrowing costs of \3,464 million (at the
capitalization rate of 2.76%).
59
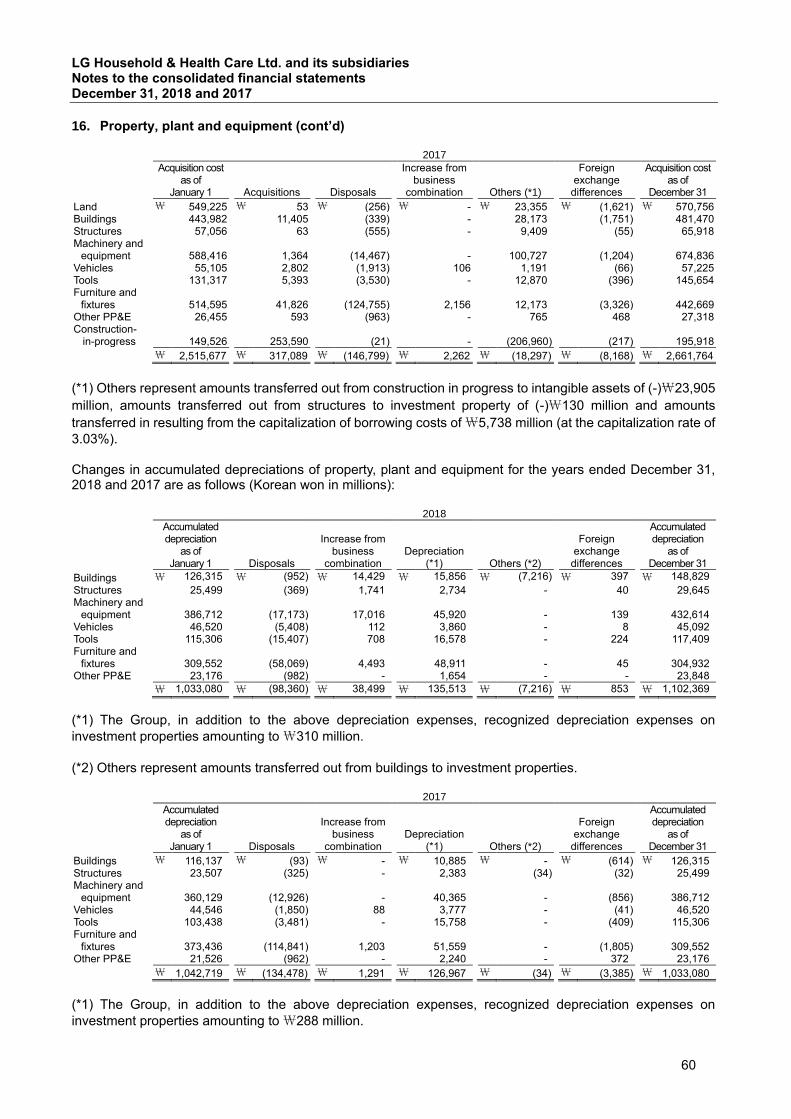
LG Household & Health Care Ltd. and its subsidiaries Notes to the consolidated financial statements December 31, 2018 and 2017
60
16. Property, plant and equipment (cont’d) 2017
Acquisition cost as of
January 1 Acquisitions
Disposals
Increase from business
combination Others (*1)
Foreign exchange
differences
Acquisition cost as of
December 31
Land \ 549,225 \ 53 \ (256) \ - \ 23,355 \ (1,621) \ 570,756 Buildings
443,982 11,405 (339) - 28,173 (1,751) 481,470 Structures
57,056 63 (555) - 9,409 (55) 65,918 Machinery and
equipment
588,416 1,364 (14,467) - 100,727 (1,204) 674,836 Vehicles 55,105 2,802 (1,913) 106 1,191 (66) 57,225 Tools 131,317 5,393 (3,530) - 12,870 (396) 145,654 Furniture and
fixtures
514,595 41,826 (124,755) 2,156 12,173 (3,326) 442,669 Other PP&E 26,455 593 (963) - 765 468 27,318 Construction-
in-progress
149,526 253,590 (21) - (206,960) (217) 195,918
\ 2,515,677 \ 317,089 \ (146,799) \ 2,262 \ (18,297) \ (8,168) \ 2,661,764
(*1) Others represent amounts transferred out from construction in progress to intangible assets of (-)\23,905
million, amounts transferred out from structures to investment property of (-)\130 million and amounts
transferred in resulting from the capitalization of borrowing costs of \5,738 million (at the capitalization rate of
3.03%). Changes in accumulated depreciations of property, plant and equipment for the years ended December 31, 2018 and 2017 are as follows (Korean won in millions): 2018
Accumulated depreciation
as of January 1 Disposals
Increase from
business combination
Depreciation (*1) Others (*2)
Foreign exchange
differences
Accumulated depreciation
as of December 31
Buildings \ 126,315 \ (952) \ 14,429 \ 15,856 \ (7,216) \ 397 \ 148,829
Structures 25,499 (369) 1,741 2,734 - 40 29,645
Machinery and equipment
386,712 (17,173) 17,016 45,920 - 139 432,614
Vehicles 46,520 (5,408) 112 3,860 - 8 45,092 Tools 115,306 (15,407) 708 16,578 - 224 117,409 Furniture and
fixtures
309,552 (58,069) 4,493 48,911 - 45 304,932 Other PP&E 23,176 (982) - 1,654 - - 23,848
\ 1,033,080 \ (98,360) \ 38,499 \ 135,513 \ (7,216) \ 853 \ 1,102,369
(*1) The Group, in addition to the above depreciation expenses, recognized depreciation expenses on
investment properties amounting to \310 million.
(*2) Others represent amounts transferred out from buildings to investment properties. 2017
Accumulated depreciation
as of January 1 Disposals
Increase from
business combination
Depreciation (*1) Others (*2)
Foreign exchange
differences
Accumulated depreciation
as of December 31
Buildings \ 116,137 \ (93) \ - \ 10,885 \ - \ (614) \ 126,315 Structures
23,507 (325) - 2,383 (34) (32) 25,499 Machinery and
equipment
360,129 (12,926) - 40,365 - (856) 386,712 Vehicles 44,546 (1,850) 88 3,777 - (41) 46,520 Tools 103,438 (3,481) - 15,758 - (409) 115,306 Furniture and
fixtures
373,436 (114,841) 1,203 51,559 - (1,805) 309,552 Other PP&E 21,526 (962) - 2,240 - 372 23,176
\ 1,042,719 \ (134,478) \ 1,291 \ 126,967 \ (34) \ (3,385) \ 1,033,080
(*1) The Group, in addition to the above depreciation expenses, recognized depreciation expenses on
investment properties amounting to \288 million.
60

LG Household & Health Care Ltd. and its subsidiaries Notes to the consolidated financial statements December 31, 2018 and 2017
61
16. Property, plant and equipment (cont’d) (*2) Others represent amounts transferred out from structures to investment properties. Changes in accumulated impairment losses of property, plant and equipment for the years ended December 31, 2018 and 2017 are as follows (Korean won in millions):
2018
Buildings
Structures
Machinery and
equipment
Tools
Furniture
and fixtures Total
January 1 \ - \ 362 \ 1,132 \ 23
\ 10,016 \ 11,533
Disposals (1,854) (666) (202) (6) (5,744) (8,472) Increase from business combination
1,854
666
- -
- 2,520
Impairment loss - - 2,801 151 7,896 10,848 Foreign exchange differences
-
-
- -
22 22
December 31 \ - \ 362 \ 3,731 \ 168 \ 12,190 \ 16,451
2017
Structures
Machinery
and equipment
Tools
Furniture
and fixtures Total
January 1 \ 254 \ 107 \ -
\ 8,132 \ 8,493
Disposals - - - (4,454) (4,454) Impairment loss 108 1,025 23 6,496 7,652 Foreign exchange differences - - - (158) (158)
December 31 \ 362 \ 1,132 \ 23 \ 10,016 \ 11,533
Changes in government grants of property, plant and equipment for the years ended December 31, 2018 and 2017 are as follows (Korean won in millions):
2018
Vehicles Tools Total
January 1 \ 26 \ 531 \ 557
Increase from business combination - 1 1 Depreciation (6) (123) (129)
December 31 \ 20 \ 409 \ 429
2017
Vehicles Tools Total
January 1 \ 33 \ 654 \ 687
Depreciation (7) (123) (130)
December 31 \ 26 \ 531 \ 557
61

LG Household & Health Care Ltd. and its subsidiaries Notes to the consolidated financial statements December 31, 2018 and 2017
62
17. Investment property
Book values of investment properties as of December 31, 2018 and 2017 are as follows (Korean won in millions):
2018
Land Buildings Structures Total
Acquisition cost \ 23,876 \ 35,157 \ 130
\ 59,163
Accumulated depreciation - (12,504) (40) (12,544)
Accumulated impairment losses (311) (1,062) (62) (1,435)
Net book value \ 23,565 \ 21,591 \ 28 \ 45,184
2017
Land Buildings Structures Total
Acquisition cost \ 18,643 \ 13,815 \ 130
\ 32,588
Accumulated depreciation - (4,980) (38) (5,018) Accumulated impairment losses (311) (130) (62) (503)
Net book value \ 18,332 \ 8,705 \ 30 \ 27,067
Changes in acquisition costs of investment properties for the years ended December 31, 2018 and 2017 are as follows (Korean won in millions):
2018
Land Buildings Structures Total
January 1 \ 18,643 \ 13,815 \ 130
\ 32,588
Disposals - - - -
Transfers (*1) 5,207 21,342 - 26,549
Foreign exchange differences 26 - - 26
December 31 \ 23,876 \ 35,157 \ 130 \ 59,163
(*1) Transfers represent amounts transferred out from property, plant and equipment to investment properties.
2017
Land Buildings Structures Total
January 1 \ 19,651 \ 14,041 \ -
\ 33,692
Disposals (971)d (226)d - (1,197) d
Transfers (*1) - - 130 130
Foreign exchange differences (37)d - - (37) d
December 31 \ 18,643 \ 13,815 \ 130 \ 32,588
(*1) Transfers represent amounts transferred out from property, plant and equipment to investment properties. Changes in accumulated depreciations of investment properties for the years ended December 31, 2018 and 2017 are as follows (Korean won in millions):
2018 2017
Buildings Structures Total Buildings Structures Total
January 1 \ 4,980 \ 38
\ 5,018
\ 4,792
\ -
\ 4,792
Disposals - - - (96) - (96)
Depreciation 308 2 310 284 4 288
Transfers (*1) 7,216 - 7,216 - 34 34
December 31 \ 12,504 \ 40 \ 12,544 \ 4,980 \ 38 \ 5,018
(*1) Transfers represent amounts transferred out from property, plant and equipment to investment properties.
62
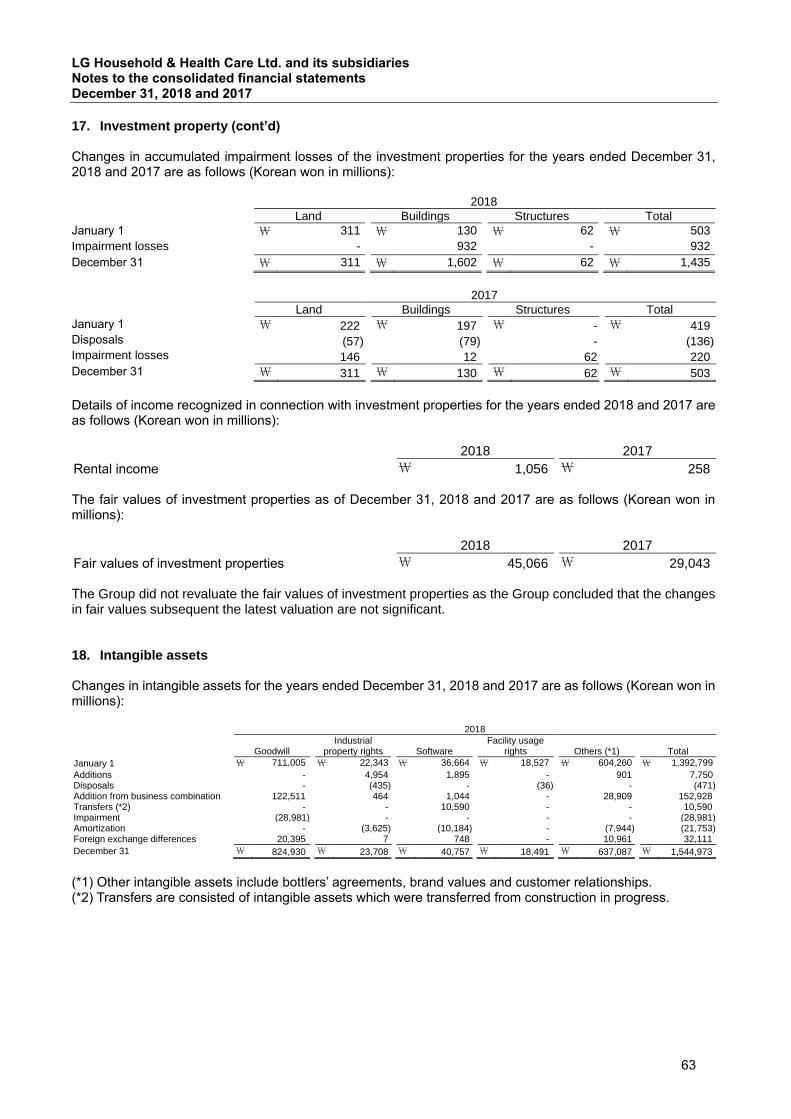
LG Household & Health Care Ltd. and its subsidiaries Notes to the consolidated financial statements December 31, 2018 and 2017
63
17. Investment property (cont’d) Changes in accumulated impairment losses of the investment properties for the years ended December 31, 2018 and 2017 are as follows (Korean won in millions):
2018
Land Buildings Structures Total
January 1 \ 311 \ 130 \ 62
\ 503
Impairment losses - 932 - 932
December 31 \ 311 \ 1,602 \ 62 \ 1,435
2017
Land Buildings Structures Total
January 1 \ 222 \ 197 \ -
\ 419
Disposals (57) (79) - (136) Impairment losses 146 12 62 220
December 31 \ 311 \ 130 \ 62 \ 503
Details of income recognized in connection with investment properties for the years ended 2018 and 2017 are as follows (Korean won in millions):
2018 2017
Rental income \ 1,056 \ 258
The fair values of investment properties as of December 31, 2018 and 2017 are as follows (Korean won in millions):
2018 2017
Fair values of investment properties \ 45,066 \ 29,043
The Group did not revaluate the fair values of investment properties as the Group concluded that the changes in fair values subsequent the latest valuation are not significant. 18. Intangible assets Changes in intangible assets for the years ended December 31, 2018 and 2017 are as follows (Korean won in millions):
2018
Goodwill Industrial
property rights Software Facility usage
rights Others (*1) Total
January 1 \ 711,005 \ 22,343 \ 36,664 \ 18,527 \ 604,260 \ 1,392,799
Additions - 4,954 1,895 - 901 7,750 Disposals - (435) - (36) - (471) Addition from business combination 122,511 464 1,044 - 28,909 152,928 Transfers (*2) - - 10,590 - - 10,590 Impairment (28,981) - - - - (28,981) Amortization - (3,625) (10,184) - (7,944) (21,753) Foreign exchange differences 20,395 7 748 - 10,961 32,111
December 31 \ 824,930 \ 23,708 \ 40,757 \ 18,491 \ 637,087 \ 1,544,973
(*1) Other intangible assets include bottlers’ agreements, brand values and customer relationships. (*2) Transfers are consisted of intangible assets which were transferred from construction in progress.
63

LG Household & Health Care Ltd. and its subsidiaries Notes to the consolidated financial statements December 31, 2018 and 2017
64
18. Intangible assets (cont’d)
2017
Goodwill Industrial
property rights Software Facility usage
rights Others (*1) Total
January 1 \ 729,867 \ 21,586 \ 20,130 \ 18,544 \ 629,784 \ 1,419,911 Additions - 4,597 1,624 8 48 6,277 Disposals - (438) (1,270) (25) (94) (1,827) Addition from business combination 8,412 - - - - 8,412 Transfers (*2) - - 23,849 - 56 23,905 Impairment - - (60) - (713) (773) Amortization - (3,402) (7,466) - (8,421) (19,289) Foreign exchange differences (27,274) - (143) - (16,400) (43,817)
December 31 \ 711,005 \ 22,343 \ 36,664 \ 18,527 \ 604,260 \ 1,392,799
(*1) Other intangible assets include bottlers’ agreements, brand values and customer relationships. (*2) Transfers are consisted of intangible assets which were transferred from construction in progress. Total research and development costs incurred for the years ended December 31, 2018 and 2017 are as follows (Korean won in millions):
2018 2017
Cost of sales \ 9,599 \ 8,888
Selling and administrative expenses 21,118 17,758
\ 30,717 \ 26,646
To perform impairment tests for goodwill, goodwill is allocated to units at the lowest level that can supervise information on goodwill for the purpose of internal control of the Group. The units are not higher than the operating segments of the Group described in Note 8. Goodwill allocated to the cash generating units as of December 31, 2018 and 2017 are as follows (Korean won in millions):
Cash generating units 2018 2017
Domestic beautiful (*1) \ 298,269 \ 327,156
Domestic healthy (*1) 73,501 37,955
Domestic refreshing 34,503 34,503
Everlife Co., Ltd. 220,194 206,269
Ginza Stefany Inc. 83,089 75,647
AVON Product Company 75,793 -
Evermere Holdings Company 7,971 -
TFS Singapore Private Limited. 12,843 12,566 LG HOUSE HOLD & HEALTH CARE MALAYSIA
SDN. BHD. (formerly, Questeam Sdn. Bhd.)
3,495
3,420
LG Household & Health Care (Thailand) Limited 1,773 -
FRUITS & PASSION BOUTIQUES INC. 6,662 6,925
LG H&H HK LIMITED 6,837 6,564
\ 824,930 \ 711,005
(*1) TheFaceShop Co., Ltd. and CNP Cosmetics Co., Ltd. cash generating units are included in Domestic beautiful, while Tai Guk Pharm Co., Ltd. is included in Domestic healthy. The value in use of the above cash generating units was assessed by discounting future cash flows to be generated as the cash generating units continue to operate. Unless stated otherwise, the value in use in 2018 was assessed similarly from the value in use assessed in 2017. The value in use was calculated based on the following key assumptions:
64

LG Household & Health Care Ltd. and its subsidiaries Notes to the consolidated financial statements December 31, 2018 and 2017
65
18. Intangible assets (cont’d) Cash flows were estimated based on past experiences, actual operating results and budget forecasts for
the next five years Sales growth rates for the next five years have been calculated based on the past trends of the average
growth rates, and the cash flows after the next five years were calculated based on a perpetual growth rate of 1%
To determine recoverable amounts per cash generating unit, the cash generating unit's weighted average cost of capital was used as a discount rate. The weighted average costs of capital of main cash generating units are as follows:
Cash generating units 2018 2017
Domestic beautiful 11.33% ~ 12.32%
12.00% ~ 12.93%
Domestic healthy 11.30% ~ 12.28% 13.05%
Domestic refreshing 6.10% 7.34%
Everlife Co., Ltd. 7.26% 7.29%
Ginza Stefany Inc. 7.24% 7.23%
AVON Product Company 6.12% -
Evermere Holdings Company 6.12% -
TFS Singapore Private Limited. 7.13% 6.81% LG HOUSE HOLD & HEALTH CARE MALAYSIA
SDN. BHD. (formerly, Questeam Sdn. Bhd.)
9.52%
9.60%
LG Household & Health Care (Thailand) Limited 12.34% -
FRUITS & PASSION BOUTIQUES INC. 5.97% 5.99%
LG H&H HK LIMITED 7.49% 7.44%
The value in use calculated based on major assumptions indicates estimates on the future trends of cosmetics, beverage and health food businesses and as a result of impairment tests based on internal and external data (historical data), the value in use of each cash generating unit exceeded the carrying amount, except for TheFaceShop Co., Ltd. cash generating unit. As of December 31, 2018, the recoverable amounts of the cash generating units, to which goodwill is allocated,
are \8,823 billion, which exceeds the book value of \3,648 billion by \5,174 billion.
However, the recoverable amounts of TheFaceShop Co., Ltd. cash generating unit are \373,317 million, which
does not exceed the book value of \402,298 million. Therefore, the Group recognized impairment loss of
\28,981 million, which is included in other non-operating expenses.
The excess can be offset if the sales growth rate decreases to less than 12.3% or the discount rate increases to more than 12.3% Details of intangible assets with indefinite useful lives, which are allocated to the cash generating units as of December 31, 2018 and 2017 are as follows (Korean won in millions):
Cash generating units 2018 2017 Details
Domestic beautiful \ 218,013 \ 218,013 Brand value
Domestic healthy 30,487 26,626 Brand value
Domestic refreshing
166,777
166,777 Bottler’s Agreement
of Coca-cola Beverage Co.
Everlife Co., Ltd. 82,898 77,656 Brand value Ginza Stefany Inc. 62,674 58,710 Brand value AVON Product Company 16,366 - Brand value FRUITS & PASSION BOUTIQUES INC. 5,669 5,892 Brand value
\ 582,884 \ 553,674
65

LG Household & Health Care Ltd. and its subsidiaries Notes to the consolidated financial statements December 31, 2018 and 2017
66
18. Intangible assets (cont’d) Key assumptions used in impairment tests for cash generating units inclusive of intangible assets with indefinite useful lives are the same as those used in goodwill impairment tests, and as a result of the impairment tests, the value in use exceeds the carrying amounts. 19. Trade and other payables Details of trade and other payables as of December 31, 2018 and 2017 are as follows (Korean won in millions):
2018 2017
Trade payables \ 215,581 \ 231,497
Other payables:
Non-trade payables 254,780 234,779
Container deposit liabilities 3,860 3,471
258,640 238,250
\ 474,221 \ 469,747
20. Short-term borrowings Details of short-term borrowings as of December 31, 2018 and 2017 are as follows (Korean won in millions):
Purpose of borrowing
Lender
Annual interest rate as of Dec. 31, 2018 (%) 2018 2017
Overdraft Kookmin Bank Co.,Ltd. - \ - \ 1,488
Commercial Paper Shinhan Bank Co., Ltd. 2.15 20,000 -
Mirae Asset Daewoo Co., Ltd
2.15 20,000
-
General loan Shinhan Bank Co.,Ltd. 2.81 ~ 3.11 11,356 137
WOORI BANK CO.,LTD - - 123
Bank Of China Seoul Branch Co.,Ltd.
2.68 4,000
5,000
Sumitomo Mitsui Banking Corp. Seoul Branch
2.60 5,000
3,000
Sumitomo Mitsui Banking Corp.
JPY TIBOR
1M + 0.5
1,520
-
Mitsubishi Tokyo UFJ Bank Seoul Branch CO.,LTD.
2.59 7,000
14,000
Mizuho Bank, Ltd.
JPY TIBOR 1M + 0.11
7,091
16,135
Citibank Canada Ltd. 3.35 4,102 2,558 Citibank Taiwan Ltd. 1.65 3,475 2,515 Citibank Singapore Ltd. - - 1,230
Citibank Japan Ltd. and others
JPY TIBOR 3M + 0.48
101,318
-
Receivable-backed loan (*1) Citibank Korea Inc. and others
2.85 ~ 3.87 25,948
24,855
\ 210,810 \ 71,041
(*1) The Group has entered into factoring arrangements with recourse on its export trade receivables discounted with recourse with Citibank Korea Inc. and other financial institutions. Outstanding amounts have been recorded as short-term borrowings.
66
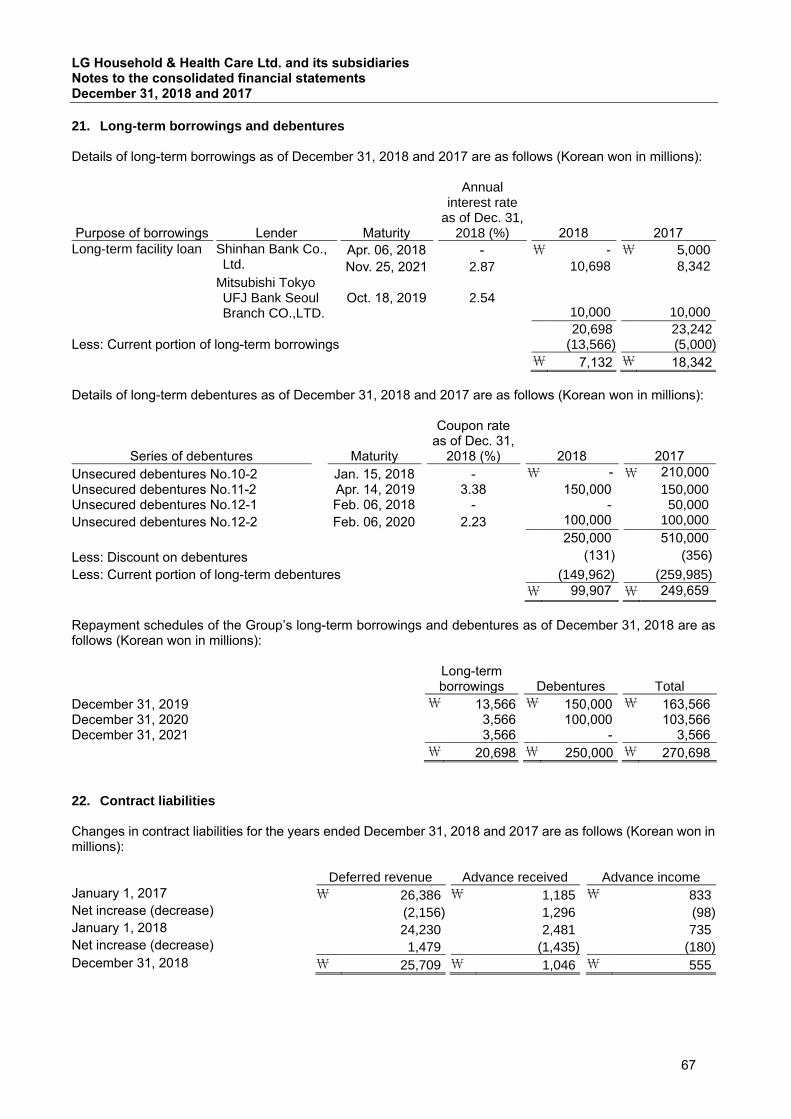
LG Household & Health Care Ltd. and its subsidiaries Notes to the consolidated financial statements December 31, 2018 and 2017
67
21. Long-term borrowings and debentures Details of long-term borrowings as of December 31, 2018 and 2017 are as follows (Korean won in millions):
Purpose of borrowings Lender Maturity
Annual
interest rate as of Dec. 31,
2018 (%) 2018 2017
Long-term facility loan Shinhan Bank Co., Ltd.
Apr. 06, 2018 - \ - \ 5,000
Nov. 25, 2021 2.87 10,698 8,342
Mitsubishi Tokyo UFJ Bank Seoul Branch CO.,LTD.
Oct. 18, 2019 2.54 10,000
10,000
20,698 23,242 Less: Current portion of long-term borrowings (13,566) (5,000)
\ 7,132 \ 18,342
Details of long-term debentures as of December 31, 2018 and 2017 are as follows (Korean won in millions):
Series of debentures Maturity
Coupon rate as of Dec. 31,
2018 (%) 2018 2017
Unsecured debentures No.10-2 Jan. 15, 2018 - \ - \ 210,000d
Unsecured debentures No.11-2 Apr. 14, 2019 3.38 150,000 150,000 Unsecured debentures No.12-1 Feb. 06, 2018 - - 50,000
Unsecured debentures No.12-2 Feb. 06, 2020 2.23 100,000 100,000
250,000 510,000
Less: Discount on debentures (131) (356)
Less: Current portion of long-term debentures (149,962) (259,985)
\ 99,907 \ 249,659
Repayment schedules of the Group’s long-term borrowings and debentures as of December 31, 2018 are as follows (Korean won in millions):
Long-term borrowings Debentures Total
December 31, 2019 \ 13,566 \ 150,000 \ 163,566 December 31, 2020 3,566 100,000 103,566 December 31, 2021 3,566 - 3,566
\ 20,698 \ 250,000 \ 270,698
22. Contract liabilities Changes in contract liabilities for the years ended December 31, 2018 and 2017 are as follows (Korean won in millions): Deferred revenue Advance received Advance income
January 1, 2017 \ 26,386 \ 1,185 \ 833
Net increase (decrease) (2,156)d 1,296 (98)d January 1, 2018 24,230 2,481 735 Net increase (decrease) 1,479 (1,435)d (180)d
December 31, 2018 \ 25,709 \ 1,046 \ 555
67

LG Household & Health Care Ltd. and its subsidiaries Notes to the consolidated financial statements December 31, 2018 and 2017
68
23. Other financial liabilities and other liabilities Details of other financial liabilities as of December 31, 2018 and 2017 are as follows (Korean won in millions):
2018 2017
Current Non-current Current Non-current
Accrued expenses \ 197,247 \ - \ 168,319 \ - Dividends payable 117 - 20 - Finance lease liabilities 17 29 7 34 Financial liabilities at fair value through profit and loss
- 1,900 - - Others (*1) 2,318 22,008 12,000 11,647
\ 199,699 \ 23,937 \ 180,346 \ 11,681
(*1) When the Group acquired FMG Co., Ltd.(formerly, Zenisce Co., Ltd.), Oriental Biomed Lab. Ltd., Tai Guk Pharm Co., Ltd. and LG H&H HK LIMITED(K&I Co., Ltd., FMG Co., Ltd.(formerly, Zenisce Co., Ltd.), Oriental Biomed Lab. Ltd. and LG H&H HK LIMITED as of December 31, 2017) agreements to purchase the residual interest have been entered into with the other shareholders, and therefore the reasonable estimation of the residual interest acquired has been recognized as financial liabilities. Details of other financial liabilities at fair value through profit and loss as of December 31, 2018 is as follows (Korean won in millions): 2018
Derivatives Put options of Tai Guk Pharm Co., Ltd. (*1)
\ 595
Hybrid contracts RCPS issued by Tai Guk Pharm Co., Ltd.
1,305
\ 1,900
(*1) Existing shareholders have the option contracts which could be exercised on RCPS issued by Tai Guk Pharm Co., Ltd. from November 30, 2019 to November 30, 2022. Changes in financial liabilities at fair value through profit and loss for the year ended December 31, 2018 is as follows (Korean won in millions): 2018
January 1 \ - Increase 1,030 Increase from business combination 1,397 Loss on valuation (527)d
December 31 \ 1,900
Details of other liabilities as of December 31, 2018 and 2017 are as follows (Korean won in millions):
2018 2017
Current Non-current Current Non-current
Advance received \ 17,798 \ - \ 16,040 \ -
Advance income 253 302 356 379 Withholdings of value added tax 36,570 - 31,545 - Withholdings 16,816 - 19,694 - Other long-term employee
benefits liabilities
- 27,287 - 19,196 Other provision 3,574 2,828 - 1,455 Others 576 - 632 -
\ 75,587 \ 30,417 \ 68,267 \ 21,030
68

LG Household & Health Care Ltd. and its subsidiaries Notes to the consolidated financial statements December 31, 2018 and 2017
69
23. Other financial liabilities and other liabilities (cont’d) Details of other provisions as of December 31, 2018 and 2017 are as follows (Korean won in millions):
2018 2017
Current Non-current Current Non-current
Decommission provision (*1) \ - \ 2,683 \ - \ 1,232 Production guarantee - - - 23 Cooperative firm support provision(*2) 3,574 - - -
Others - 145 - 200
\ 3,574 \ 2,828 \ - \ 1,455
(*1) The Group estimates the costs to remove or demolish leasehold improvements and to restore leased land to its original condition upon expiry of the lease, and recognizes provisions for the costs on an annual basis. (*2) The group estimates the costs to purchase and destruct raw materials that the cooperative firms possessed to produce the group’s finished goods, which would not be used because of certain discontinued plans, and recognizes provisions for the costs on an annual basis. 24. Deferred revenue Changes in deferred revenue for the years ended December 31, 2018 and 2017 are as follows (Korean won in millions):
2018 2017
January 1 \ 24,230d \ 26,386d
Additions 78,984d 61,866d Revenue recognized (77,367) (63,738) Increase from business combination -d 78d Foreign exchange differences (138) (362)
December 31 \ 25,709d \ 24,230d
25. Refund liabilities Changes in refund liabilities for the years ended December 31, 2018 and 2017 are as follows (Korean won in millions):
2018 2017
January 1 \ 10,249 \ 10,646 Additions 7,753 4,976 Utilization (15,066) (5,280) Increase from business combination 13,690 - Foreign exchange differences 74 (93)
December 31 \ 16,700 \ 10,249
The Group recognized right of returns when on the above refund liabilities, as the Group has the right to withdraw the products from customers. The amounts of right of return assets included in other current assets as of December 31, 2018 and 2017 are
\381 million and \259 million, respectively.
69

LG Household & Health Care Ltd. and its subsidiaries Notes to the consolidated financial statements December 31, 2018 and 2017
70
26. Employee benefits Details of the liabilities for severance and retirement benefit as of December 31, 2018 and 2017 are as follows (Korean won in millions):
2018 2017
Present value of defined benefit obligations (*1) \ 338,723 \ 295,919 Fair value of plan assets (316,845) (270,880) Less: Defined benefit assets (Note 13) (12,379) 9,679
\ 34,257 \ 34,718
(*1) The present value of defined benefit liabilities is the amount after deducting the national pension plan. The
national pension plan amount as of December 31, 2018 and 2017 are \249 million and \219 million,
respectively. Changes in the present value of the defined benefit obligation for the years ended December 31, 2018 and 2017 are as follows (Korean won in millions):
2018 2017
January 1 \ 295,919 \ 299,208 Current service costs 43,879 47,663 Past service costs (731) - Interest costs 9,059 8,062 Re-measurement gain(loss) in OCI:
Actuarial changes arising from changes in demographic assumptions
433 1,310
Actuarial changes arising from changes in financial assumptions
12,026 (37,880)
Gain from experience adjustments (1,188) (714) Benefit paid (27,798) (21,887) Transfer in 879 185 Increase from business combination 6,220 - Others - 11 Foreign exchange differences 25 (39)
December 31 \ 338,723 \ 295,919
Details of expenses recognized for the years ended December 31, 2018 and 2017 are as follows (Korean won in millions):
2018 2017
Defined benefit plans Service costs:
Current service costs \ 43,879 \ 47,663 Past service costs (731) -
Net interest on post-employment benefit liabilities:
Interest costs on defined benefit obligation 9,059 8,062 Interest income on plan assets (8,215) (7,268) Administrative expenses on plan assets 448 348
44,440 48,805 Defined contribution plans 2,034 2,123
Others 578 493
\ 47,052 \ 51,421
70

LG Household & Health Care Ltd. and its subsidiaries Notes to the consolidated financial statements December 31, 2018 and 2017
71
26. Employee benefits (cont’d)
Among total costs for the years ended December 31, 2018 and 2017, \10,579 million and \11,185 million
are included in cost of goods sold, and \36,473 million and \40,236 million are included in selling and
administrative expenses. The Group has no unpaid contribution to the defined contribution plans as of December 31, 2018. Changes in the fair value of plan assets for the years ended December 31, 2018 and 2017 are as follows (Korean won in millions): 2018 2017
January 1 \ 270,880 \ 268,072 Interest income (*1)
8,215 7,268
Re-measurement factors of defined benefits obligation (3,110) (2,436)
Employee contributions 64,758 18,179
Benefit paid from plan assets (23,360) (19,456)
Increase from business combination 669 - Others (*2)
(1,207) (747)
December 31 \ 316,845 \ 270,880
(*1) Interest income earned from plan assets for the years ended December 31, 2018 and 2017 amounted to
\5,105 million and \4,832 million, respectively.
(*2) Others include transfers of plan assets between affiliates of (-)\82 million and (-)\159 million, and
administration expenses of (-)\448 million and (-)\587 million for the years ended December 31, 2018 and
2017, respectively, and plan assets settlement of (-)\667 million for the year ended December 31, 2018.
Components of plan assets as of December 31, 2018 and 2017 are as follows (Korean won in millions): 2018 2017
Equity linked security \ 2,745 \ 106,509 Equity linked bond
213,130 81,570
Fixed income instrument 82,763 80,138
Others 18,207 2,663
\ 316,845 \ 270,880
Details of re-measurements to be included in comprehensive income (loss) for the years ended December 31, 2018 and 2017 are as follows (Korean won in millions): 2018 2017
Re-measurements before tax \ (14,381) \ 34,848 Tax effect
2,567 (9,313)
Re-measurements after tax \ (11,814) \ 25,535
71

LG Household & Health Care Ltd. and its subsidiaries Notes to the consolidated financial statements December 31, 2018 and 2017
72
26. Employee benefits (cont’d) The principal actuarial assumptions as of December 31, 2018 and 2017 are as follows: 2018 2017
Expected rate of increase in salaries 2.61% ~ 9.26% 2.61% ~ 8.95% Discount rate (*1) 1.45% ~ 3.45% 1.92% ~ 3.92% (*1) In determining the appropriate discount rate, management considers the interest rates of corporate bonds in currencies consistent with the currencies of the post-employment benefit obligation with at least an ‘AA’ rating or above, as set by an internationally acknowledged rating agency. The weighted average duration of the severance and retirement benefit obligations of the Group is 7.4 years ~ 11.4 years and 7.4 years ~ 12.24 years, respectively as of December 31, 2018 and 2017. Reasonably possible changes at the reporting date to one of the relevant actuarial assumptions, holding other assumptions constant, would have affected the defined benefit obligation by the amounts as below (Korean won in millions):
1% discount rate increase
1% discount rate decrease
Changes in expected rate of increase in salaries \ 38,104 \ (33,279) Changes in discount rate
(33,272) 38,891 Although the analysis does not take account of the full distribution of cash flows expected under the plan, it does provide an approximation of the sensitivity of the actuarial assumptions. Details of long-term employment benefit liabilities as of December 31, 2018 and 2017 are as follows (Korean won in millions): 2018 2017
Other long-term employee benefits liabilities \ 27,287 \ 19,196 27. Issued capital Details of issued capital as of December 31, 2018 are as follows (Korean won in millions except per share amount):
Number of shares issued Par value Issued capital
Ordinary share 15,618,197 \ 5,000 \ 78,091 Preferred share 2,099,697 5,000 10,498
17,717,894 \ 88,589
28. Share premium Details of share premium as of December 31, 2018 and 2017 are as follows (Korean won in millions): 2018 2017
Paid-in capital in excess of par value \ 54,794 \ 54,794 Other share premium 42,532 42,532
\ 97,326 \ 97,326
72

LG Household & Health Care Ltd. and its subsidiaries Notes to the consolidated financial statements December 31, 2018 and 2017
73
29. Retained earnings and dividends Details of retained earnings as of December 31, 2018 and 2017 are as follows (Korean won in millions): 2018 2017
Legal reserves (*1) \ 44,310 \ 44,310 Voluntary reserves (*2) 2,048,181 1,589,484 Unappropriated retained earnings 1,470,874 1,410,349
\ 3,563,365 \ 3,044,143
(*1) In accordance with the Korean Commercial Code, an amount equal to at least 10% of cash dividends is required to be appropriated as a legal reserve until the reserve equals 50% of paid-in capital. The legal reserve may not be utilized for cash dividends but may only be used to offset a deficit, if any, or be transferred to capital. (*2) In accordance with the Restriction of Special Taxaction Act, the amount appropriated as a research and human resource development reserve can be deducted in the calculation of excess retained earnings for corporate income tax reporting purposes, and the reversal of the reserve can be transferred to voluntary reserves and utilized for dividends. Changes in retained earnings for the years ended December 31, 2018 and 2017 are as follows (Korean won in millions):
2018 2017
January 1 \ 3,044,143 \ 2,538,883
Effect of adoption of new accounting standards (Note 2) (1,394)) - Profit attributable to equity holders of the parent 682,743 606,412 Remeasurement factor of defined benefit obligation (11,202) 24,623 Cash dividends (150,909) (125,775) Others (16) -
December 31 \ 3,563,365 \ 3,044,143
Details of dividends paid for the years ended December 31, 2018 and 2017 are as follows (Korean won in millions except per share amount):
2018
Total number of shares
issued Number of
treasury shares
Number of shares
Dividend per share Total dividends
Ordinary share 15,618,197 958,411 14,659,786 \ 9,000 \ 131,938 Preferred share 2,099,697 3,438 2,096,259 9,050 18,971
17,717,894 961,849 16,756,045 \ 150,909
2017
Total number of shares
issued Number of
treasury shares
Number of shares
Dividend per share Total dividends
Ordinary share 15,618,197 958,411 14,659,786 \ 7,500 \ 109,948 Preferred share 2,099,697 3,438 2,096,259 7,550 15,827
17,717,894 961,849 16,756,045 \ 125,775
73

LG Household & Health Care Ltd. and its subsidiaries Notes to the consolidated financial statements December 31, 2018 and 2017
74
30. Accumulated other comprehensive income (loss) Details of accumulated other comprehensive income (loss) as of December 31, 2018 and 2017 are as follows (Korean won in millions):
2018 2017
Loss on valuation of financial assets at fair value through OCI \ (400) \ -
Gain on valuation of available-for sale financial assets - 1,057 Share of other comprehensive loss from equity method investments (1,632) (1,848)
Exchange differences on translation of foreign operations (119,593) (131,992)
\ (121,625) \ (132,783)
Changes in gain or loss on valuation of financial assets at fair value through OCI for the years ended December 31, 2018 and 2017 are as follows (Korean won in millions):
2018 2017 (*1)
January 1 \ 1,057 \ 1,005
Effect of adoption of new accounting standards (Note 2) (725)d -
Changes for the year (732) 52
December 31 \ (400) \ 1,057
(*1) The Group classified gain or loss on valuation of financial assets at fair value through OCI as gain or loss on valuation of available-for-sale financial assets for the year ended December 31, 2017 (Refer to Note 2). Changes in the share of other comprehensive loss arising from equity method investments for the years ended December 31, 2018 and 2017 are as follows (Korean won in millions):
2018 2017
January 1 \ (1,848)3 \ (1,776)d
Changes for the year 216 (72)
December 31 \ (1,632)2 \ (1,848)
Changes in exchange differences on translation of foreign operations for the years ended December 31, 2018 and 2017 are as follows (Korean won in millions):
2018 2017
January 1 \ (131,992) \ (91,629) Changes due to exchange differences on translation of
foreign operations 12,383 (40,363)
Others 16 -d
December 31 \ (119,593) \ (131,992)
31. Other components of equity Details of other components of equity as of December 31, 2018 and 2017 are as follows (Korean won in millions):
2018 2017
Treasury shares \ (70,877) \ (70,877) Others (44,712) (30,162)
\ (115,589) \ (101,039)
74

LG Household & Health Care Ltd. and its subsidiaries Notes to the consolidated financial statements December 31, 2018 and 2017
75
32. Selling and administrative expenses Details of selling and administrative expenses for the years ended December 31, 2018 and 2017 are as follows (Korean won in millions):
2018 2017
Salaries \ 539,175 \ 467,540
Provision for severance and retirement benefits 38,145 40,372
Employee welfare benefits 91,828 82,917
Depreciation 68,641 66,707
Amortization 21,182 18,885
Taxes and dues 32,041 28,745
Advertising 367,207 303,321
Research 1,035 1,144
Development 20,136 20,506
Commissions 1,480,279 1,197,921
Training expenses 7,233 7,608
Insurance premium 3,018 2,925
Utilities 17,349 11,741
Freight 164,261 151,674
Sample 3,619 3,675
Travel 19,804 21,009
Communication 10,234 8,720
Supplies 16,637 14,101
Printing 3,878 4,004
Repairs 9,685 9,162
Vehicle maintenance 12,492 12,551
Outstanding service fee 436 561
Rents 72,508 76,052
Allowance for doubtful accounts (182) 1,335
Other selling and administrative expenses 11,232 12,261
\ 3,011,873 \ 2,565,437
75

LG Household & Health Care Ltd. and its subsidiaries Notes to the consolidated financial statements December 31, 2018 and 2017
76
33. Other non-operating income and expense Details of other non-operating income and expenses for the years ended December 31, 2018 and 2017 are as follows (Korean won in millions):
2018 2017
Other non-operating income:
Reversal of other allowance for doubtful accounts \ 958 \ -
Gain on foreign currencies transactions 7,198 6,852
Gain on foreign currencies translations 594 838
Gain on disposition of property, plant and equipment 2,007 1,101
Gain on disposition of investment properties - 322
Gain on disposition of intangible assets 60 1
Others 13,189 10,053
\ 24,006 \ 19,167
Other non-operating expenses:
Other allowance for doubtful accounts \ - \ 428
Loss on foreign currencies transactions 8,072 8,554
Loss on foreign currencies translations 772 2,987
Loss on disposition of property, plant and equipment 10,130 6,735
Loss on disposition of intangible assets 436 1,798
Impairment losses of property, plant and equipment 10,848 7,652
Impairment losses of investment properties 932 220
Impairment losses of intangible assets 28,981 773
Donations 27,559 29,380
Others 11,981 19,742
\ 99,711 \ 78,269
34. Expenses categorized by nature
Details of expenses categorized by nature for the years ended December 31, 2018 and 2017 are as follows (Korean won in millions):
2018 2017
Changes in inventories \ (67,564) \ (16,587)
Changes in consolidation scope 24,093 3,374
Purchase of raw materials and merchandise 2,089,749 1,734,188
Employee benefits 702,341 609,107
Depreciation and amortization 157,447 146,414
Commissions 1,512,204 1,224,319
Outsourcing service fee 395,792 376,785
Others 894,225 1,097,514
Total (*1) \ 5,708,287 \ 5,175,114
(*1) Equal to the sum of cost of sales and selling and administrative expenses.
76

LG Household & Health Care Ltd. and its subsidiaries Notes to the consolidated financial statements December 31, 2018 and 2017
77
35. Finance income and cost Details of finance income and finance cost for the years ended December 31, 2018 and 2017 are as follows (Korean won in millions):
2018 2017
Finance income:
Interest income \ 3,836 \ 3,480
Dividend income
20
22
Gain on foreign currency transactions 795 486
Gain on foreign currency translations 398 298
Gain on financial assets at fair value through profit or loss 910 -
Gain on financial liabilities at fair value through profit or loss 527 -
\ 6,486 \ 4,286
Finance costs:
Interest expenses \ 10,136 \ 13,954
Loss on foreign currency transactions 1,192 749
Loss on foreign currency translations 497 415
Loss from valuation of derivatives - 309
Loss on financial assets at fair value through profit or loss 882 -
\ 12,707 \ 15,427
77

LG Household & Health Care Ltd. and its subsidiaries Notes to the consolidated financial statements December 31, 2018 and 2017
78
36. Profit or loss of financial instruments by category For the years ended December 31, 2018 and 2017, gains or losses on financial instruments by criteria are as follows (Korean won in millions):
2018
Financial assets Financial liabilities
Cash and cash
equivalents
Financial
assets at fair
value through
profit or loss
Financial assets
at fair value
through OCI
Financial
assets at
amortized cost
Financial
liabilities at fair
value through
profit or loss
Financial
liabilities at
amortized cost Total
Interest income \ 3,564 \ - \ - \ 272 \ - \ - \ 3,836
Interest expenses -
-
-
-
-
(10,136))
(10,136))
Dividend income - 20 - - - - 20
Gain on foreign
currency
transactions
795 - - 6,366 - 832 7,993
Loss on foreign
currency
transactions
(1,192)) - - (6,060)) - (2,012)) (9,264))
Gain on foreign
currency
translations
340 - - 454 - 198 992
Loss on foreign
currency
translations
(113)) - - (596)) - (560)) (1,269))
Allowance for
doubtful accounts
- - - 182 - - 182
Other allowance
for doubtful
accounts
- - - 958 - - 958
Gain on financial assets at fair value
through profit or loss
- 910 - - - - 910
Loss on financial assets at fair value
through profit or loss
- (882)) - - - - (882))
Gain on financial liabilities at fair
value through profit or loss
- - - - 527 - 527
Loss on financial assets at fair value
through OCI (Before tax)
- - (925)) - - - (925))
Total \ 3,394 \ 48 \ (925)) \ 1,576 \ 527 \ (11,678)) \ (7,058))
2017
Financial assets Financial liabilities
Cash and cash
equivalents
Financial assets at fair
value through profit or
loss
Available-for-sale
financial assets Loans and receivables
Financial liabilities
measured at amortized
cost Total
Interest income \ 3,119 \ - \ 94 \ 267 \ - \ 3,480
Interest expenses - - - - (13,954) (13,954)
Dividend income - - 22 - - 22
Gain on foreign
currency
transactions
496
- - 4,232 2,610 7,338
Loss on foreign
currency
transactions
(790)
- - (6,862) (1,651) (9,303)
Gain on foreign
currency
translations
36
- - 473 627 1,136
Loss on foreign
currency
translations
(417)
- - (2,964) (21) (3,402)
Allowance for
doubtful accounts
-
- - (1,335) - (1,335)
Other allowance
for doubtful
accounts
-
- - (428) - (428)
Loss on valuation
of derivatives
-
(309) - - - (309)
Gain on valuation
of available-for
-sale financial
assets (Other
comprehensive gain before tax)
-
- 101 - - 101 \ 2,444 \ (309) \ 217 \ (6,617) \ (12,389) \ (16,654)
78

LG Household & Health Care Ltd. and its subsidiaries Notes to the consolidated financial statements December 31, 2018 and 2017
79
37. Income taxes Components of income tax expenses for the years ended December 31, 2018 and 2017 are as follows (Korean won in millions):
2018 2017
Current income tax \ 288,738 \ 244,043 Effect of adoption of new accounting standards 723 - Adjustments for prior year (24,641) 13,640 Increase (decrease) due to consolidated tax return
1,495
498
Tax effect of temporary differences 15,116 (20,210)
Income tax recognized directly to equity (17,705) 4,799
\ 263,726 \ 242,770
Income tax and deferred income tax recognized directly to equity for the years ended December 31, 2018 and 2017 are as follows (Korean won in millions):
2018 2017
Remeasurement factor of defined benefit obligation \ 2,567 \ (9,313)
Gain on financial assets at fair value through OCI 160 - Loss on valuation of available-for-sale financial assets - (49) Share of other comprehensive income from equity method investments
(76)
80
Exchange differences on translation of foreign operations
(20,356)
14,081
\ (17,705) \ 4,799
The relationship between income tax expenses and the operating income for the years ended December 31, 2018 and 2017 are as follows (Korean won in millions):
2018 2017
Profit before income tax \ 956,005 \ 861,079 Taxes at the statutory income tax rate 232,176 247,279 Adjustment:
Tax effect of non-taxable (income)/expenses (8,427) (7,547) Tax credits (1,832) (2,530) Adjustments for prior year (4,392) 9,365 Effect of consolidated tax reporting (*1) 1,495 498 Changes in unused tax loss carryforward 3,312 5,145 Tax effects on share of profit of subsidiaries and associates 11,661 (3,662) Tax effects on depreciation of tangible assets at fair value assessment
3,768
(3,876)
Surtax on investment and promoting win-win cooperation 3,603 8,062 Others 22,362 (9,964)
Income tax expense \ 263,726 \ 242,770
Effective tax rate 27.59% 28.19%
(*1) The Group files consolidated tax returns that regard the controlling company and its subsidiaries, which are economically combined, as one taxable entity and therefore the corporate income tax is imposed on the consolidated income. As a result, the income tax expense for the years ended December 31, 2018 and 2017
increased by \1,495 million, and increased by \498 million, respectively, as compared with the income tax
expense calculated separately. As of December 31, 2018, the tax effect of temporary differences has been calculated with the expected future tax rates of the fiscal years when the temporary differences are reversed.
79

LG Household & Health Care Ltd. and its subsidiaries Notes to the consolidated financial statements December 31, 2018 and 2017
80
37. Income taxes (cont’d) The Group offsets tax assets and liabilities if, and only if, it has a legally enforceable right to set off current tax assets and current tax liabilities and the deferred tax assets and deferred tax liabilities relate to income taxes levied by the same tax authority. Changes in deferred tax assets and liabilities for the years ended December 31, 2018 and 2017 are as follows (Korean won in millions): 2018
January 1
Effect of adoption of new
accounting standards
Business combinations
Credited to profit (charged
to loss)
Credited (charged) to other
comprehensive income
Foreign exchange difference December 31
Property, plant and equipment \ (9,259) \ - \ 1,892 \ 3,545 \ - \ 192 \ (3,630) Intangible assets (143,039) - (5,663) 13,866 - (84) (134,920) Provision for severance of retirement benefits
4,434 - 854 461 (2,567) (1) 3,181
Provision for sales return 2,182 - 2,596 (1,790) - 16 3,004 Inventories 15,035 - 1,777 (6,576) - (17) 10,219 Deferred revenue 4,364 - 455 87 - 10 4,916
Accrued payables 754 - 150 (297) - (3) 604 Other long-term employee
benefits liabilities
4,925 - - 1,775 - - 6,700
Accrued expenses 32,398 - 344 10,176 - (122) 42,796
Prepaid expenses 5,670 - - (1,451) - - 4,219 Reserve for research and human resource development
(1,970) - - 1,970 - - - Subsidiaries (31,318) - - (32,017) 20,356 (723) (43,702) Associates (5,715) - - 1,143 76 - (4,496) Others 15,919 507 661 (11,706) - 124 5,505 Gains (losses) on financial assets at fair value
(370) 216 - 330 (160) - 16
(105,990) 723 3,066 (20,484) 17,705 (608) (105,588) Tax loss carryforwards 15,782 - 3,867 (13,060) - 127 6,716 \ (90,208) \ 723 \ 6,933 \ (33,544) \ 17,705 \ (481) \ 98,872
2017
January 1 Credited to profit (charged to loss)
Credited (charged) to
other comprehensive
income
Foreign exchange difference December 31
Property, plant and equipment \ (9,098) \ 103 \ - \ (264) \ (9,259) Intangible assets (151,736) 8,697 - - (143,039) Provision for severance of retirement benefits 6,904 (11,776) 9,313 (7) 4,434
Provision for sales return 2,448 (252) - (14) 2,182 Inventories 14,983 152 - (100) 15,035 Deferred revenue 6,178 (1,758) - (56) 4,364 Accrued payables 465 289 - - 754 Other long-term employee
benefits liabilities 4,740 189 - (4) 4,925
Accrued expenses 27,057 5,694 - (353) 32,398
Prepaid expenses 5,494 176 - - 5,670 Reserve for research and human resource development (5,614) 3,644 - - (1,970)
Subsidiaries (35,751) 17,743 (14,081) 771 (31,318)
Associates (5,120) (515) (80) - (5,715)
Others 14,564 1,575 - (220) 15,919 Gains (losses) on valuation of available-for-sale financial assets (321) (98) 49 - (370)
(124,807) 23,863 (4,799) (247) (105,990)
Tax loss carryforwards 14,636 1,146 - - 15,782
\ (110,171) \ 25,009 \ (4,799) \ (247) \ (90,208)
80

LG Household & Health Care Ltd. and its subsidiaries Notes to the consolidated financial statements December 31, 2018 and 2017
81
37. Income taxes (cont’d) The amount of unused tax loss carryforwards and the expected years of their expiration (except for investments in subsidiaries) that are not recognized as deferred tax assets as of December 31, 2018 is as follows (Korean won in millions):
Amount Expected year of
expiration
Unused tax loss carryforwards:
2009 \ 2,011 2019
2010 15,910
2020
2011 12,128 2021
2012 10,959 2022
2013 11,968 2023
\ 52,976
The temporary differences associated with investments in the Group’s subsidiaries, associates and joint ventures, for which deferred tax assets and liabilities have not been recognized as of December 31, 2018 and 2017, are as follows (Korean won in millions):
2018 2017
Deductible temporary differences: Subsidiaries \ 299,139 \ 37,920 Associates 4,503
2,212
303,642 40,132 Taxable temporary differences:
Subsidiaries (*1) (555,823) (330,016)
\ (252,181) \ (289,884)
(*1) In respect of temporary differences associated with subsidiaries, the timing of the reversal of the temporary differences can be controlled. Further, deferred tax assets are not recognized, as it is probable that the temporary differences will not reverse in the foreseeable future. 38. Earnings per share Earnings per share are calculated by dividing the net income attributable to shareholders of ordinary shares of the Company by the weighted average number of ordinary shares outstanding. Because diluted securities do not exist as of December 31, 2018, diluted earnings per share have not been disclosed. Basic earnings per ordinary share for the years ended December 31, 2018 and 2017 are as follows (Korean won in millions except per share amount): 2018 2017
Profit attributable to owners of the parent \ 682,743 \ 606,412 Less: Profit for the year attributable to preference share (85,506) (75,957) Profit for the year attributable to ordinary shares 597,237 530,455 Weighted average number of ordinary shares outstanding 14,659,786 14,659,786
Basic earnings per ordinary share \ 40,740 \ 36,184
Basic earnings per preference share for the years ended December 31, 2018 and 2017 are as follows (Korean won in millions except per share amount): 2018 2017
Profit for the year attributable to preference shares \ 85,506 \ 75,957 Weighted average number of preference shares outstanding 2,096,259 2,096,259
Basic earnings per preference share \ 40,790 \ 36,234
81

LG Household & Health Care Ltd. and its subsidiaries Notes to the consolidated financial statements December 31, 2018 and 2017
82
39. Contingencies and commitments
As of December 31, 2018, the Group is accused as a defendant in 8 lawsuits (litigation value: \200 million,
NTS 13,000 thousand), and it has filed 6 lawsuits as a plaintiff (litigation value: \7,506 million, CNY 1,000
thousand, INR 10,000 thousand). The Group recognized \ 145 million, which is a reasonable estimation of the
outcomes of the litigations, as a provision for litigation. The Group’s significant commitments with financial institutions as of December 31, 2018 are as follows (Korean won in millions, foreign currencies in thousands):
Description of commitment Currency Limited amounts
Bank overdraft KRW 62,000 JPY 2,500,000
General loan KRW 162,000 JPY 10,000,000
Facility loan KRW 31,000 Import LC (letter of credit) KRW 11,270
USD 15,000 At-sight LC (letter of credit) USD 500 Guarantee of foreign currency payment USD 18,100 B2B contract, etc. KRW 214,800 Foreign currency purchased USD 14,900 Commercial paper KRW 30,000 Comprehensive credit limit, including at-sight LC and others:
At sight letter of credit, etc. USD 45,000 Export letter of credit, etc. USD 45,000
The Group has been provided with a payment guarantee of up to \12,605 million representing performance
bonds contracts by Seoul Guarantee Insurance Company as of December 31, 2018.
Restricted deposits as of December 31, 2018 are as follows (Korean won in millions):
Amount Subject to usage
limit
Short-term financial instruments
\ 16,900 Win-win
cooperation fund
Long-term financial instruments
24
Deposits for checking accounts
\ 16,924
The Company has entered into a trademark contract with LG Corp. for its business operations. The Group has entered into an office rent contract with LG Corp. for the head office and other spaces, and
deposited \4,261 million for the rent.
The Group has entered into an agreement with Sunkist Growers Inc. to manufacture certain products and pays 1.5% of net sales of the products (minimum value: USD 1,000,000) as an ordinary engineering fee. Coca-Cola Beverage Co., one of the Company’s subsidiaries, entered into a contract to purchase extracts from Coca-Cola Korea Company (the “CCKC”) on August 19, 2007. In accordance with the contract, the purchase
price of the extracts was determined, based on net sales. The purchases amounted to \212,833 million and
\215,810 million for the years ended December 31, 2018 and 2017, respectively.
82

LG Household & Health Care Ltd. and its subsidiaries Notes to the consolidated financial statements December 31, 2018 and 2017
83
39. Contingencies and commitments (cont’d) In connection with the purchase agreement, Coca-Cola Beverage Co., a subsidiary of the Company, has entered into an additional contract with CCKC to receive performance incentives based on the annual sales performance. As the sales requirements have been met during the year ended December 31, 2018, the Group
has recognized \2,500 million to be received from CCKC, in other receivables.
40. Related party transactions Details of related parties as of December 31, 2018 and 2017 are as follows:
Relationship 2018 2017
Entity with significant influence over the Group
LG Corp.
LG Corp.
Associates LG Uni-charm Co., Ltd. LG Uni-charm Co., Ltd.
Coty Korea Co., Ltd. Coty Korea Co., Ltd.
Joint ventures Emery Oleochemicals Rika (M) Sdn. Bhd.
Emery Oleochemicals Rika (M) Sdn. Bhd.
Clean Soul Ltd. Clean Soul Ltd.
MiGenstory Co., Ltd. MiGenstory Co., Ltd.
Others (*1) SERVEONE Co., Ltd. and others SERVEONE Co., Ltd. and others
Conglomerate affiliates (*2) LG Group affiliates including LG Electronics Inc., and others
LG Group affiliates including LG Electronics Inc., and others
(*1) Others consist of the subsidiaries of LG Corp. which is the Group's largest shareholder. (*2) Conglomerate affiliates exclude entities with significant influence over the Group, associates and joint ventures.
83

LG Household & Health Care Ltd. and its subsidiaries Notes to the consolidated financial statements December 31, 2018 and 2017
84
40. Related party transactions (cont’d) Transactions with related parties for the years ended December 31, 2018 and 2017 are as follows (Korean won in millions):
Relationship Related companies
2018
Sales and others
Purchases of inventories
Acquisitions of PP&E and
intangible assets Other expenses
Entity with significant influence over the Group
LG Corp.
\ - \ - \ - \ 16,348 Associates LG Uni-charm Co., Ltd
7,044 137,770 - -
Coty Korea Co., Ltd.
1,171 17,600 - 57
8,215 155,370 - 57
Joint ventures Emery Oleochemicals Rika (M) Sdn. Bhd.
308 13,804 - - Clean Soul Ltd. 10 4,177 - -
318 17,981 - -
Others SERVEONE Co., Ltd.
96 2,157 471 10,483 S&I Co., Ltd.
1,288 151,807 47,221 39,075
Serveone(Nanjing) Co., Ltd.
104 - - 15 LG CNS Co., Ltd. 4,232 - 35,130 16,298 LG N-Sys Inc. - - - 34 BizTechpartners.m Ltd.
2 - 677 2,083
LG Management Development Institute
100 - - 2,957 LG sports Ltd. - - - 810 MiraeM Ltd. 7 - - -
5,829 153,964 83,499 71,755
Conglomerate affiliates LG Chem, Ltd. 28,776 5,235 - 7,518
Ningbo LG Yongxing Chemical Co.,Ltd. 499 - - -
LG Chem (Tianjin) Engineering Plastics Co.,Ltd.
16 - - -
LG Hausys Ltd. 2,308 - 248 11,969
LG Electronics Inc. 504 - 5,176 2,846
LG Display Co., Ltd. - - - 1
LG INNOTEK CO.,LTD 50 - 21 -
Hiplaza CO.,LTD 136 - - -
Hi-M.Solutek Co.,Ltd 31 - - 18
LG ELECTRONICS SINGAPORE Pte. Ltd. 205 - - -
LG ELECTRONICS (HK) Ltd. 226 - - -
Taizhou LG Electronics Refrigeration Co.,
Ltd.
108 - - -
INSPUR LG DIGITAL MOBILE COMMUNICATIONS
5 - - -
Qingdao LG Guangzhou Co., Ltd. 2 - - -
LG Display Guangzhou Co., Ltd. 7 - - -
LG Display Yantai Co., Ltd. 93 - - -
LG Display (China) Co., Ltd. 18 - - -
LG-Hitachi water solution Co., Ltd. 4 - - -
LGI Corp, Ltd. 227 - - -
Pantos Logistics Co.,Ltd 6 1,752 - 24,561
Pantos Busan Newport Logistics Center Co., Ltd.
- - - 15
FNS (BEIJING) LOGISTICS Co., Ltd. - - - 939
PANTOS LOGISTICS (SHANGHAI) Co., Ltd.
- - - 13,646
PANTOS LOGISTICS (HK) Co., Ltd. - - - 8
PANTOS LOGISTICS VIETNAM Co., Ltd. - - - 131
PANTOS LOGISTICS (TAIWAN) Co., Ltd. - - - 113
PANTOS LOGISTICS SINGAPORE Pte. Ltd..
- - - 626
PANTOS LOGISTICS (THAILAND) Pte. Ltd.
- - - 35
HS Ad
- 5 501 14,326
Beijing Yuanzhimeng Advertising Co., Ltd. - - - 1,361
LBest Co., Ltd. - - - 60
GIIR Thailand Ltd. - - - 14
LG Uplus Corp. 1,029 - 506 5,109
CSLEADER Co., Ltd. 1 - - -
34,251 6,992 6,452 83,296
\ 48,613 \ 334,307 \ 89,951 \ 171,456
84

LG Household & Health Care Ltd. and its subsidiaries Notes to the consolidated financial statements December 31, 2018 and 2017
85
40. Related party transactions (cont’d)
Relationship Related companies
2017
Sales and others
Purchases of inventories
Acquisitions of PP&E and
intangible assets Other expenses
Entity with significant influence over the Group
LG Corp.
\ - \ - \ - \ 16,685 Associates LG Uni-charm Co., Ltd
12,240 136,715 - -
Coty Korea Co., Ltd.
1,237 15,362 - 50
13,477 152,077 - 50
Joint ventures Emery Oleochemicals Rika (M) Sdn. Bhd.
61 17,398 - - Clean Soul Ltd. - 3,707 - -
MiGenstory Co., Ltd. (formerly, Genstory Co. Ltd.)
1 - - -
62 21,105 - -
Others SERVEONE Co., Ltd.
2,230 211,458 80,923 27,189 Serveone(Nanjing) Co., Ltd.
265 - - 16
LG Siltron Incorporated
7 - - - LG CNS Co., Ltd. 10,982 230 9,609 20,768 LG N-Sys Inc. - 7 14 94 BizTechpartners.m Ltd.
2 - 6,900 2,049
LG sports Ltd.
36 - - 680 LG Management Development Institute
80 344 - 3,059
13,602 212,039 97,446 53,855 Conglomerate affiliates LG Chem, Ltd. (*1) 29,799 10,350 39 8,716
Ningbo LG Yongxing Chemical Co.,Ltd. 287 - - -
LG Chem (Tianjin)
Engineering Plastics Co.,Ltd.
26 - - -
LG Hausys Ltd. 1,558 - 76 12,828
LG Electronics Inc. 302 85 2,439 1,908
LG INNOTEK CO.,LTD 45 - - -
Hiplaza CO.,LTD 143 - 2 1
Hi-M.Solutek Co.,Ltd - - - 16
LG ELECTRONICS SINGAPORE Pte. Ltd. 293 - - -
Taizhou LG Electronics Refrigeration Co.,
Ltd.
44 - - -
LG Electronics HK Ltd. 47 - - -
INSPUR LG DIGITAL MOBILE COMMUNICATIONS
9 - - -
LG Display Co., Ltd. 116 - - -
LG Display Guangzhou Co., Ltd. 7 - - -
LG Display (China) Co., Ltd. 9 - - - ㅣ LGI Corp, Ltd. 167 - - -
LG International (Hong Kong) Ltd. 1 - - -
Pantos Logistics Co.,Ltd - 1,056 - 22,649
Pantos Busan Newport Logistics Center
Co., Ltd.
- 1 - 18
FNS (BEIJING) LOGISTICS Co., Ltd. - - - 848
PANTOS LOGISTICS (SHANGHAI) Co.,
Ltd.
1 - - 7,496
PANTOS LOGISTICS VIETNAM Co., Ltd. - - - 135
PANTOS LOGISTICS AUSTRALIA PTY
LTD.
- - - 2
PANTOS LOGISTICS JAPAN INC. - - - 63
PANTOS LOGISTICS (TAIWAN) Co., Ltd. 2 - - 128
PANTOS LOGISTICS SINGAPORE Pte.
Ltd.
- - - 671
HS Ad - 2,196 7,503 7,467
Beijing Yuanzhimeng Advertising Co., Ltd. - - - 2,535
GllR Communication India Private Limited - - - 21
GIIR Thailand Ltd. - - - 13
LG Uplus Corp. 1,527 269 - 5,375
34,383 13,957 10,059 70,890
\ 61,524 \ 399,178 \ 107,505 \ 141,480
(*1) The purchase amount of \10,350 million includes \4,797 million which was paid for the acquisition of the
health food and beverage business of LG Chem. Ltd.
85

LG Household & Health Care Ltd. and its subsidiaries Notes to the consolidated financial statements December 31, 2018 and 2017
86
40. Related party transactions (cont’d) As of December 31, 2018 and 2017, main outstanding balances related to transactions with related parties are as follows (Korean won in millions):
Relationship Related companies
2018
Receivables (*1) Payables
Trade receivables and others Loans
Trade payables and others Borrowings
Entity with significant influence over the Group
LG Corp.
\ 4,261 \ - \ 1,038 \ - Associates LG Uni-charm Co., Ltd
2,903 - 12,222 -
Coty Korea Co., Ltd.
173 - 2,245 -
3,076 - 14,467 - Joint ventures
Emery Oleochemicals Rika (M) Sdn. Bgd.
- - 321 -
Clean Soul Ltd. 1 - 321 -
1 - 642 - Others
SERVEONE Co., Ltd.
228 - 28,401 - S&I Co., Ltd. 11,807 - 3,271 - Serveone(Nanjing) Co., Ltd. 20 - 3 - LG CNS Co., Ltd. 559 - 4,180 - BizTechpartners.m Ltd. - - 12 - LG Management Development Institute
1,401 - 8 - KONJIAM YEWON Co.,Ltd.
540 - - -
14,555 - 35,875 - Conglomerate affiliates LG Chem, Ltd.
1,743 - 346 -
Ningbo LG Yongxing Chemical Co., Ltd.
61 - - -
LG Hausys Ltd. 207 - 2,063 -
LG Electronics Inc. 293 - 2,247 -
LG INNOTEK CO.,LTD 4 - 23 -
Hiplaza CO.,LTD. 42 - - -
LG Electronics HK Ltd. 111 - - -
LGI Corp, Ltd. 47 - - -
Pantos Logistics Co.,Ltd - - 2,662 -
PANTOS LOGISTICS
(SHANGHAI) Co., Ltd.
2 - 3,353 -
PANTOS LOGISTICS
VIETNAM Co., Ltd.
- - 22 -
PANTOS LOGISTICS
(TIWAN) Co., Ltd.
- - 3 -
PANTOS LOGISTICS
SINGAPORE Pte. Ltd.
- - 65 -
PANTOS LOGISTICS
(THAILAND) C0., Ltd.
- - 6 -
GIIR Thailand Ltd - - 9 -
HS Ad - - 17,498 -
Beijing Yuanzhimeng
Advertising Co., Ltd.
- - 81 -
LG Uplus Corp. 15 - 335 -
2,525 - 28,713 -
\ 24,418 \ - \ 80,735 \ -
(*1) The Group recognizes an allowance for doubtful accounts of \26 million as of December 31, 2018, and
recognized allowance for doubtful accounts of \11 million, during the year. In accordance with KIFRS 1109,
the Group recognized decrease of \15 million in retained earnings relating to the above receivables (Refer to
Note 2).
86
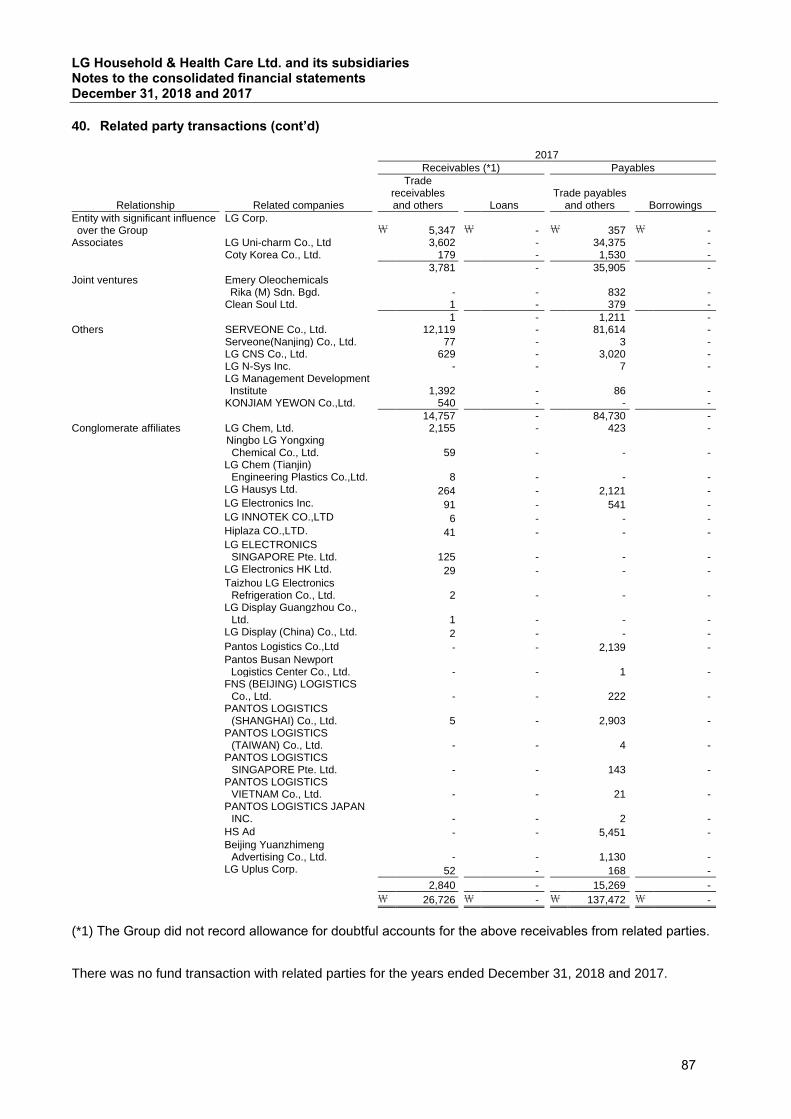
LG Household & Health Care Ltd. and its subsidiaries Notes to the consolidated financial statements December 31, 2018 and 2017
87
40. Related party transactions (cont’d)
Relationship Related companies
2017
Receivables (*1) Payables
Trade receivables and others Loans
Trade payables and others Borrowings
Entity with significant influence over the Group
LG Corp.
\ 5,347 \ - \ 357 \ - Associates LG Uni-charm Co., Ltd
3,602 - 34,375 -
Coty Korea Co., Ltd.
179 - 1,530 -
3,781 - 35,905 - Joint ventures
Emery Oleochemicals Rika (M) Sdn. Bgd.
- - 832 -
Clean Soul Ltd. 1 - 379 -
1 - 1,211 - Others
SERVEONE Co., Ltd.
12,119 - 81,614 - Serveone(Nanjing) Co., Ltd. 77 - 3 - LG CNS Co., Ltd. 629 - 3,020 - LG N-Sys Inc. - - 7 - LG Management Development Institute
1,392 - 86 - KONJIAM YEWON Co.,Ltd.
540 - - -
14,757 - 84,730 - Conglomerate affiliates LG Chem, Ltd.
2,155 - 423 -
Ningbo LG Yongxing Chemical Co., Ltd.
59 - - -
LG Chem (Tianjin)
Engineering Plastics Co.,Ltd.
8 - - -
LG Hausys Ltd. 264 - 2,121 -
LG Electronics Inc. 91 - 541 -
LG INNOTEK CO.,LTD 6 - - -
Hiplaza CO.,LTD. 41 - - -
LG ELECTRONICS
SINGAPORE Pte. Ltd.
125 - - -
LG Electronics HK Ltd. 29 - - -
Taizhou LG Electronics
Refrigeration Co., Ltd.
2 - - -
LG Display Guangzhou Co.,
Ltd.
1 - - -
LG Display (China) Co., Ltd. 2 - - -
Pantos Logistics Co.,Ltd - - 2,139 -
Pantos Busan Newport
Logistics Center Co., Ltd.
- - 1 -
FNS (BEIJING) LOGISTICS
Co., Ltd.
- - 222 -
PANTOS LOGISTICS
(SHANGHAI) Co., Ltd.
5 - 2,903 -
PANTOS LOGISTICS
(TAIWAN) Co., Ltd.
- - 4 -
PANTOS LOGISTICS
SINGAPORE Pte. Ltd.
- - 143 -
PANTOS LOGISTICS
VIETNAM Co., Ltd.
- - 21 -
PANTOS LOGISTICS JAPAN
INC.
- - 2 -
HS Ad - - 5,451 -
Beijing Yuanzhimeng
Advertising Co., Ltd.
- - 1,130 -
LG Uplus Corp. 52 - 168 -
2,840 - 15,269 -
\ 26,726 \ - \ 137,472 \ -
(*1) The Group did not record allowance for doubtful accounts for the above receivables from related parties.
There was no fund transaction with related parties for the years ended December 31, 2018 and 2017.
87

LG Household & Health Care Ltd. and its subsidiaries Notes to the consolidated financial statements December 31, 2018 and 2017
88
40. Related party transactions (cont’d) In accordance with the resolution made in the shareholders’ meeting held during the year, the Group paid
dividends amounting to \47,834 million, while dividends received by the Group from related parties amounted
to \2,464 million during the year ended December 31, 2018. (Refer to Note 15)
The Group has not provided any payment guarantee for related parties as of December 31, 2018. The Group has not received any collateral or payment guarantee from related parties as of December 31, 2018. Compensation of key management personnel of the Group for the years ended December 31, 2018 and 2017 are as follows (Korean won in millions): 2018 2017
Short-term employee benefits \ 25,405 \ 26,478
Post-employment benefits 2,997 3,280 Others 478 121
\ 28,880 \ 29,879
The above compensation is composed of classified benefits and total compensation for key management personnel [registered executives (including non-executives) and unregistered executives] who have crucial rights to and responsibilities for planning, operation and control of the business of the Group. 41. Operating leases
The Group has entered into operating leases for buildings, furniture and fixtures and vehicles. Future lease payments under the operating leases as of December 31, 2018 and 2017 are as follows (Korean won in millions):
2018
Within 1 year 1 ~ 5 years After 5 years Total
LG Corp. and others \ 63,853 \ 89,626 \ - \ 153,479
2017
Within 1 year 1 ~ 5 years After 5 years Total
LG Corp. and others \ 66,285 \ 89,555 \ - \ 155,840
Lease receivables recognized as revenue for the years ended December 31, 2018 and 2017 are \69,135
million and \67,522 million, respectively.
Future sublease payments expected to be received from subleases of the assets as of December 31, 2018 and 2017 are as follows (Korean won in millions):
2018
Future lease payments
Within 1 year 1 ~ 5 years After 5 years Total
GS Gangnam OHUI and others \ 334 \ 94 \ - \ 428
2017
Future lease payments
Within 1 year 1 ~ 5 years After 5 years Total
GS Gangnam OHUI and others \ 294 \ 55 \ - \ 349
Lease revenue received during the years ended December 31, 2018 and 2017 are \147 million and \185
million, respectively.
88

LG Household & Health Care Ltd. and its subsidiaries Notes to the consolidated financial statements December 31, 2018 and 2017
89
41. Operating leases (cont’d)
Contingent lease payments recognized for the years ended December 31, 2018 and 2017 are \151 million
and \134 million, respectively.
The Group has entered into operating leases for its equipment. Future lease payments receivable under the operating leases as of December 31, 2018 and 2017 are as follows (Korean won in millions):
2018
Within 1 year 1 ~ 5 years After 5 years Total
LG Chem, Ltd. and others \ 1,539 \ 176 \ - \ 1,715
2017
Within 1 year 1 ~ 5 years After 5 years Total
LG Chem, Ltd. and others \ 1,835 \ - \ - \ 1,835 In accordance with the operating lease contracts, the lease income that the Group recognized for the years
ended December 31, 2018 and 2017 are \3,809 million and \3,200 million, respectively.
42. Consolidated statements of cash flows Significant transactions not involving cash flows for the years ended December 31, 2018 and 2017 are as follows (Korean won in millions):
2018 2017
Transfers from construction in progress to tangible assets
\ 383,775 \ 188,793 Transfers from construction in progress to intangible assets
10,590 23,905
Transfers from tangible assets to investment properties
26,549 96 Acquisitions of tangible assets 22,957 38,621 Acquisitions of intangible assets 93 324 Disposals of tangible assets 282 44 Less: Current portion of long-term borrowings
12,315 5,000
Less: Current portion of long-term debentures 149,962 259,985
89

LG Household & Health Care Ltd. and its subsidiaries Notes to the consolidated financial statements December 31, 2018 and 2017
90
42. Consolidated statements of cash flows (cont’d) Changes in liabilities arising from financial activities for the years ended December 31, 2018 and 2017 are as follows (Korean won in millions): 2018
Jan. 1, 2018
Cash flows provided by
(used in) financing activities Non-cash changes
Increase Decrease
Dividends declared
Present value
discounts Current portions
Business combination
Changes in foreign
exchange rates
Others
Dec. 31, 2018
Short-term borrowings
\ 71,041
\ 323,463
\ (237,236)
\ -
\ -
\ - \ 48,048
\ 5,494
- \ 210,810
Current portion of long-term borrowings
5,000
-
(7,121)
-
-
12,315
3,351
21
-
13,566 Long-term borrowings
18,342
2,356
(17,943)
-
-
(12,315)
17,342
(650)
-
7,132
Current portion of long-term debentures
259,985
-
(261,718)
-
15
149,962
1,718
-
-
149,962 long-term debentures
249,659
-
(720)
-
210
(149,962)
720
-
-
99,907
Convertible bonds
-
-
(5,378)
-
68
-
5,300
-
10
- Current portion of finance lease liabilities
7 - (126) - (7) 7 136 -
-
17 Finance
lease liabilities
34 - (13) - - (7) 18 (3)
-
29 Dividends payable
20 - (161,724) 161,734 - - 126 -
(39)
117
\ 604,088 \ 325,819 \ (691,979) \ 161,734 \ 286 \ - \ 76,759 \ 4,862 \ (29) \ 481,540
2017
Jan. 1, 2017
Cash flows provided by
(used in) financing activities Non-cash changes
Dec. 31, 2017
Increase Decrease
Dividends declared
Present value
discounts Current portions
Changes in foreign
exchange rates Others
Short-term borrowings
\ 92,337
\ 77,617
\ (96,524)
\ -
\ -
\ - \ (2,389)
\ -
\ 71,041
Current portion of long-term borrowings
5,000
-
(5,000)
-
-
5,000
-
-
5,000 Long-term borrowings
7,760
15,582
-
-
-
(5,000)
-
-
18,342
Current portion of long-term debentures
179,928
-
(180,000)
-
72
259,985
-
-
259,985 long-term debentures
509,188
-
-
-
456
(259,985)
-
-
249,659
Current portion of finance lease liabilities
2 - (26) - - 28 3 - 7
Finance lease liabilities
41 - - - - (28) - 21 34 Dividends payable
27 - (133,964) 131,644 - - (47) 2,360 20
\ 794,283 \ 93,199 \ (415,514) \ 131,644 \ 528 \ - \ (2,433) \ 2,381 \ 604,088
90

LG Household & Health Care Ltd. and its subsidiaries Notes to the consolidated financial statements December 31, 2018 and 2017
91
43. Fair value of financial instruments Book values and fair values of financial instruments as of December 31, 2018 and 2017 are as follows (Korean won in millions):
2018 2017
Book value Fair value Book value Fair value
Financial assets at fair value through profit or loss (*1)
Listed equity securities \ 424 \ 424 \ - \ -
Unlisted equity securities 92 92 - -
Debt securities 2,154 2,154 - -
Derivatives 910 910 - -
Hybrid contracts 203 203 9,066 9,066
3,783 3,783 9,066 9,066 Financial assets at fair value through OCI (*1)(*3)
Listed equity securities 2,045 2,045 2,832 2,832
Unlisted equity securities 4,246 4,246 42,723 42,723
Debt securities - - 1,054 1,054
6,291 6,291 46,609 46,609 Cash and cash Equivalents (*2)
Cash and cash Equivalents
396,644
396,644
386,194 386,194
Debt instruments at amortized cost (*2)(*4)
Short-term financial instruments
16,900
16,900
16,900 16,900
Trade receivables 556,088 556,088 522,800 522,800
Other receivables 25,780 25,780 16,719 16,719
Accrued income 24 24 296 296
Long-term financial Instruments
24
24
26 26
Other long-term receivables 78,325 78,325 87,533 87,533
Other non-current financial assets
323
323
47 47
677,464 677,464 644,321 644,321
\ 1,084,182 \ 1,084,182 \ 1,086,190 \ 1,086,190
Financial liabilities at fair value through profit or loss (*1)
Derivatives \ 595 \ 595
\ - \ -
Hybrid contracts 1,305 1,305
- -
1,900 1,900 - - Financial liabilities at amortized cost (*2)
Trade payables 215,581 215,581 231,497 231,497
Other payables 258,640 258,640 238,250 238,250
Accrued expenses 197,247 197,247 168,319 168,319
Dividends payables 117 117 20 20
Short-term borrowings 210,810 210,810 71,041 71,041
Current portion of long-term borrowings 13,566
13,566
5,000 5,000
Current portion of long-term debentures 149,962
149,962
259,985 259,985
Current portion of finance lease liabilities 17
17
7 7
Other non-current financial liabilities 2,318
2,318
12,000 12,000
Long-term borrowings 7,132 7,132 18,342 18,342
Long-term debentures 99,907 99,907 249,659 249,659
Finance lease liabilities 29 29 34 34 Deposit received 7,325 7,325 8,352 8,352 Other non-current financial
liabilities 22,008 22,008
11,647 11,647
1,184,659 1,184,659 1,274,153 1,274,153
\ 1,186,559 \ 1,186,559 \ 1,274,153 \ 1,274,153
91

LG Household & Health Care Ltd. and its subsidiaries Notes to the consolidated financial statements December 31, 2018 and 2017
92
43. Fair value of financial instruments (cont’d) (*1) Fair values are measured using valuation methods. The assessment of fair value requires management to assume unobservable input variables used in the fair value appraisal. Management regularly evaluates reasonably possible alternatives for the significant, unobservable input variables and judges impacts on overall fair value. The probabilities of the various estimates within the range can be reasonably assessed and are used in management’s estimate of fair value. (*2) As the carrying amounts are considered to be a reasonable approximation of the fair values, the carrying amounts have been stated as the fair values. (*3) It was classified as Available-for-sale financial assets in the prior reporting period. (*4) It was classified as Loans and receivables in the prior reporting period. (*5) The fair values of listed equity securities are derived from quoted market prices in active markets. All assets and liabilities for which fair value is measured or disclosed in the financial statements are categorized within the fair value hierarchy, described as follows, based on the lowest level input that is significant to the fair value measurement as a whole: Level 1 — Quoted (unadjusted) market prices in active markets for identical assets or liabilities Level 2 — Valuation techniques for which the lowest level input that is significant to the fair value
measurement is directly or indirectly observable Level 3 — Valuation techniques for which the lowest level input that is significant to the fair value
measurement is unobservable
For assets and liabilities that are recognized in the financial statements at fair value on a recurring basis, the Group determines whether transfers have occurred between levels in the hierarchy by re-assessing categorization (based on the lowest level input that is significant to the fair value measurement as a whole) at the end of each reporting period.
92
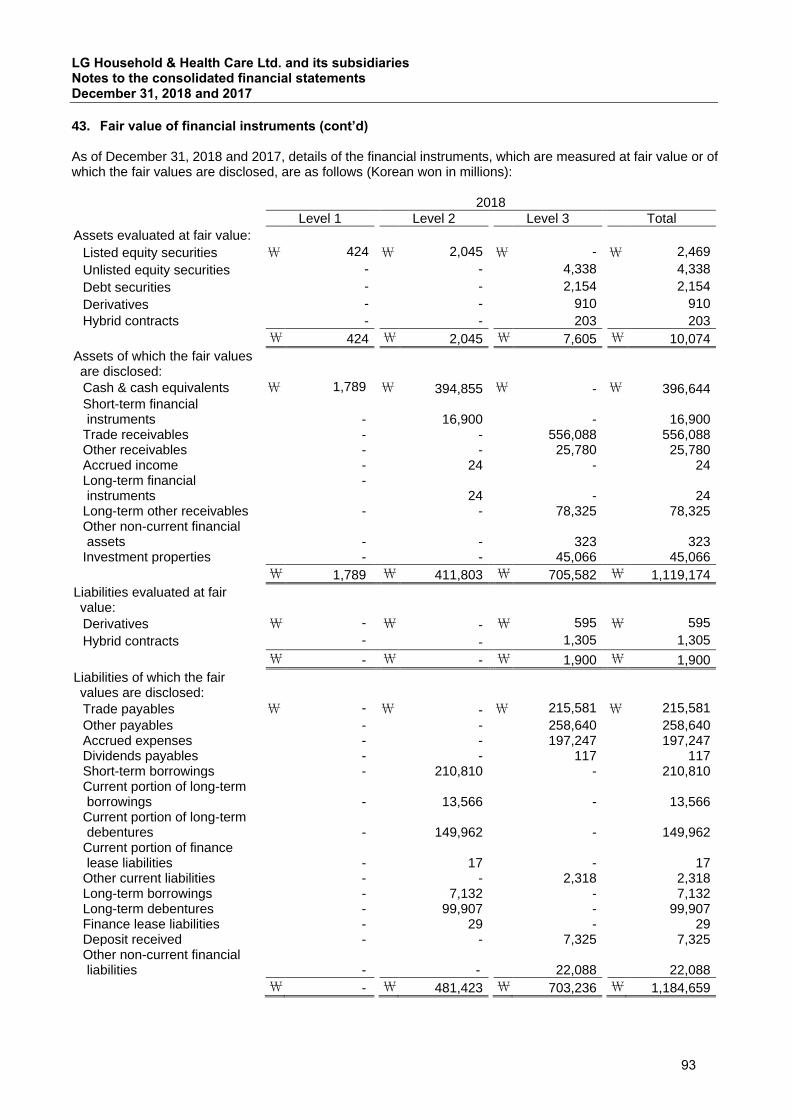
LG Household & Health Care Ltd. and its subsidiaries Notes to the consolidated financial statements December 31, 2018 and 2017
93
43. Fair value of financial instruments (cont’d) As of December 31, 2018 and 2017, details of the financial instruments, which are measured at fair value or of which the fair values are disclosed, are as follows (Korean won in millions):
2018
Level 1 Level 2 Level 3 Total
Assets evaluated at fair value:
Listed equity securities \ 424 \ 2,045 \ - \ 2,469
Unlisted equity securities - - 4,338 4,338
Debt securities - - 2,154 2,154
Derivatives - - 910 910
Hybrid contracts - - 203 203
\ 424 \ 2,045 \ 7,605 \ 10,074
Assets of which the fair values are disclosed:
Cash & cash equivalents \ 1,789 \ 394,855 \ - \ 396,644 Short-term financial instruments
-
16,900
-
16,900
Trade receivables - - 556,088 556,088 Other receivables - - 25,780 25,780 Accrued income - 24 - 24 Long-term financial instruments
- 24
-
24
Long-term other receivables - - 78,325 78,325 Other non-current financial assets
-
-
323
323
Investment properties - - 45,066 45,066
\ 1,789 \ 411,803 \ 705,582 \ 1,119,174
Liabilities evaluated at fair value:
Derivatives \ - \ - \ 595 \ 595
Hybrid contracts - - 1,305 1,305
\ - \ - \ 1,900 \ 1,900
Liabilities of which the fair values are disclosed:
Trade payables \ - \ - \ 215,581 \ 215,581
Other payables - - 258,640 258,640 Accrued expenses - - 197,247 197,247 Dividends payables - - 117 117 Short-term borrowings - 210,810 - 210,810 Current portion of long-term borrowings
-
13,566
-
13,566
Current portion of long-term debentures
-
149,962
-
149,962
Current portion of finance lease liabilities
-
17
-
17
Other current liabilities - - 2,318 2,318 Long-term borrowings - 7,132 - 7,132 Long-term debentures - 99,907 - 99,907 Finance lease liabilities - 29 - 29 Deposit received - - 7,325 7,325 Other non-current financial liabilities
-
-
22,088
22,088
\ - \ 481,423 \ 703,236 \ 1,184,659
93
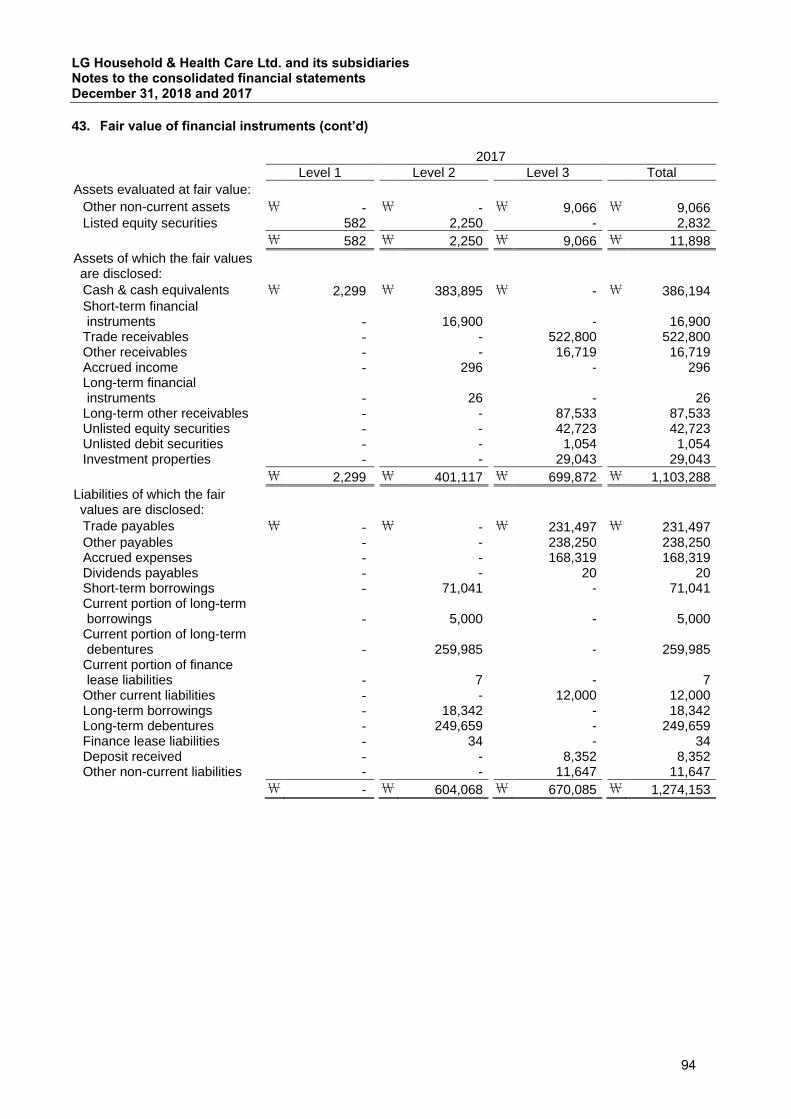
LG Household & Health Care Ltd. and its subsidiaries Notes to the consolidated financial statements December 31, 2018 and 2017
94
43. Fair value of financial instruments (cont’d)
2017
Level 1 Level 2 Level 3 Total
Assets evaluated at fair value:
Other non-current assets \ - \ - \ 9,066 \ 9,066 Listed equity securities 582 2,250 - 2,832
\ 582 \ 2,250 \ 9,066 \ 11,898
Assets of which the fair values are disclosed:
Cash & cash equivalents \ 2,299 \ 383,895 \ - \ 386,194 Short-term financial instruments
-
16,900
-
16,900
Trade receivables - - 522,800 522,800 Other receivables - - 16,719 16,719 Accrued income - 296 - 296 Long-term financial instruments
-
26
-
26
Long-term other receivables - - 87,533 87,533 Unlisted equity securities - - 42,723 42,723 Unlisted debit securities - - 1,054 1,054 Investment properties - - 29,043 29,043
\ 2,299 \ 401,117 \ 699,872 \ 1,103,288
Liabilities of which the fair values are disclosed:
Trade payables \ - \ - \ 231,497 \ 231,497 Other payables - - 238,250 238,250 Accrued expenses - - 168,319 168,319 Dividends payables - - 20 20 Short-term borrowings - 71,041 - 71,041 Current portion of long-term borrowings
-
5,000
-
5,000
Current portion of long-term debentures
-
259,985
-
259,985
Current portion of finance lease liabilities
-
7
-
7
Other current liabilities - - 12,000 12,000 Long-term borrowings - 18,342 - 18,342 Long-term debentures - 249,659 - 249,659 Finance lease liabilities - 34 - 34 Deposit received - - 8,352 8,352 Other non-current liabilities - - 11,647 11,647
\ - \ 604,068 \ 670,085 \ 1,274,153
94

LG Household & Health Care Ltd. and its subsidiaries Notes to the consolidated financial statements December 31, 2018 and 2017
95
43. Fair value of financial instruments (cont’d) As of December 31, 2018, the sensitivity analysis of significant unobservable input variables used in measuring the fair value of assets and liabilities classified as Level 3 of the fair value hierarchy as follows (Korean won in millions):
Fair value Object Valuation method
Significant unobservable input variables
Input variables as of
December 31, 2018
Sensitivity
Changes in input variables Increase Decrease
Financial assets at fair value through profit or loss
MiGenstory Co., Ltd 203
Convertible
bond
Binomial
option pricing model
Variance
23.96% 5.00%
11
(9) Tai Guk Pharm Co., Ltd
910
Underlying asset
Discounted cash flow
Discount rate for non-
performance risk 1.00% 1.00%
494 (278)
Weighted average cost
of capital 11.30% 1.00%
(278) 494
Option
Monte-Carlo Simulation Variance 29.48% 5.00%
288 (269)
Financial assets at fair value through OCI
LYA NATURE CO.,LTD.
2,892
Ordinary share
Discounted cash flow
Discount rate for non-
performance risk 0.00% 1.00%
117 (103)
Weighted average cost
of capital 15.08% 1.00%
(131) 153
Financial liabilities at fair value through profit or loss
Tai Guk Pharm Co., Ltd
595
Underlying asset
Discounted cash flow
Discount rate for non-
performance risk 1.00% 1.00%
(50) 50
Weighted average cost
of capital 11.30% 1.00%
50 (50)
Option
Monte-Carlo Simulation
Discount rate 22.73% 5.00%
34 (28) Tai Guk Pharm Co., Ltd
1,305
Underlying asset
Discounted cash flow
Discount rate for non-
performance risk 1.00% 1.00%
110 (91)
Weighted average cost
of capital 11.30% 1.00%
(91) 110
Redeemable convertible preference
shares
Binomial option pricing
model
Variance
29.48% 5.00%
- -
95

LG Household & Health Care Ltd. and its subsidiaries Notes to the consolidated financial statements December 31, 2018 and 2017
96
44. Financial instruments risk management and policy The financial instruments of the Group are exposed to various financial risks such as market risk (foreign currency exchange rate risk and interest rate risk), credit risk and liquidity risk. The purpose of managing a risk is to identify the potential risk that may influence the Group's financial performance and to reduce the risk to an allowable level or to eliminate or avoid the risk. The management of the Group continuously reviews whether a risk management process by risk type complies with the Group's risk management policy. Since December 31, 2017, there has been no material change in the risk management team and risk management policy. Market risk is the risk that the fair value of future cash flows of a financial instrument will fluctuate because of changes in market prices. Market prices comprise three types of risk: interest rate risk, foreign currency risk, commodity price risk and other price risk, such as equity risk. Foreign currency risk is the risk that the fair value or future cash flows of an exposure will fluctuate because of changes in foreign exchange rates. The Group’s exposure to the risk of changes in foreign exchange rates relates primarily to the Group’s operating activities (when revenue or expense is denominated in a foreign currency) and the Group’s net investments in foreign subsidiaries. The book values of the financial assets and liabilities denominated in foreign currencies other than its functional currencies as of December 31, 2018 and 2017 are as follows (Korean won in millions):
2018 2017 Assets Liabilities Assets Liabilities
USD \ 28,631 \ 29,395 \ 17,891 \ 13,366
EUR 1,573 415 750 260 JPY 3,969 1,790 431 847 SGD - 461 - 878
CNY 541 922 571 2,862
CAD 161 702 5 46
AUD - 37 30 4
CHF - 48 - -
GBP - 6 - -
THB - 33 - -
\ 34,875 \ 33,809 \ 19,678 \ 18,263
The following table demonstrates the sensitivity analysis of a reasonably possible change in the Group’s functional currency against the foreign currency, with all other variables held constant, on the Group’s profit before tax and equity as of December 31, 2018 and 2017 (Korean won in millions):
2018 2017 10% increase 10% decrease 10% increase 10% decrease
USD \ (76) \ 76 \ 453 \ (453) EUR 116 (116) 49 (49) JPY 218 (218) (42) 42 SGD (46) 46 (88) 88
CNY (38) 38 (229) 229
CAD (54) 54 (4) 4
AUD (4) 4 3 (3)
CHF (5) 5 - -
GBP (1) 1 - -
THB (3) 3 - -
\ 107 \ (107) \ 142 \ (142)
The sensitivity analyses were conducted on monetary assets and liabilities which are presented in foreign currency other than the functional currency as of the reporting date.
96
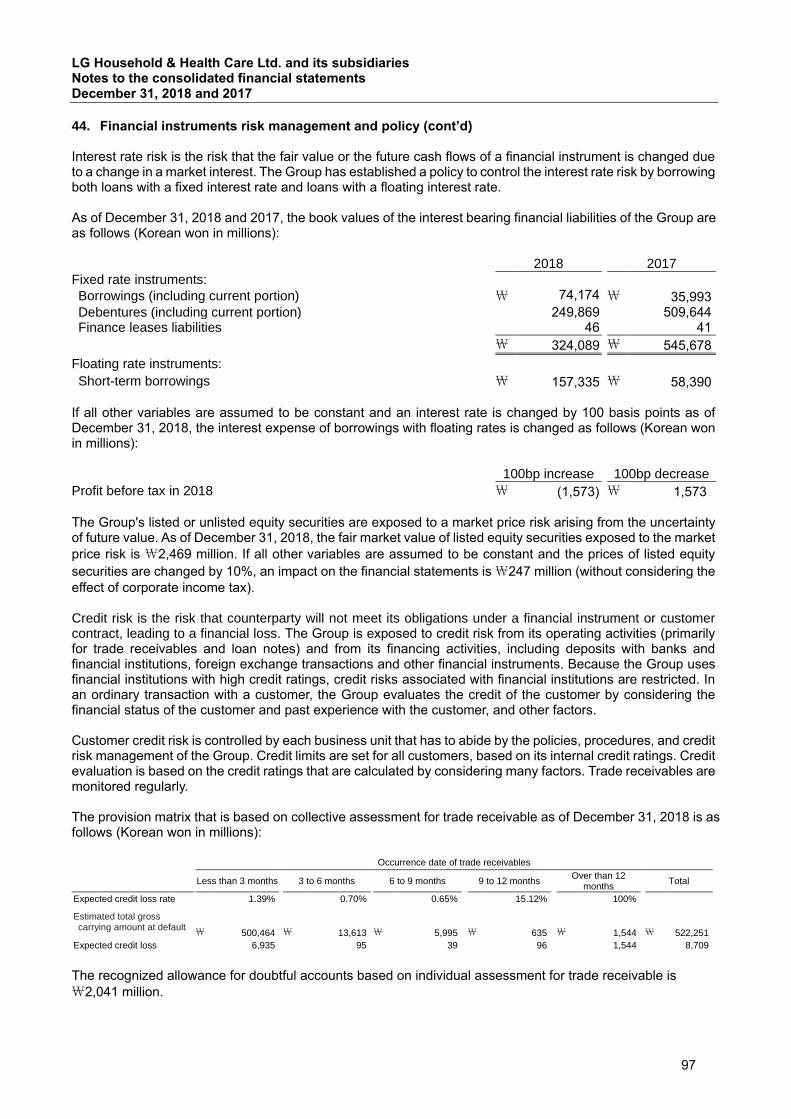
LG Household & Health Care Ltd. and its subsidiaries Notes to the consolidated financial statements December 31, 2018 and 2017
97
44. Financial instruments risk management and policy (cont’d) Interest rate risk is the risk that the fair value or the future cash flows of a financial instrument is changed due to a change in a market interest. The Group has established a policy to control the interest rate risk by borrowing both loans with a fixed interest rate and loans with a floating interest rate. As of December 31, 2018 and 2017, the book values of the interest bearing financial liabilities of the Group are as follows (Korean won in millions):
2018 2017
Fixed rate instruments:
Borrowings (including current portion) \ 74,174 \ 35,993 Debentures (including current portion) 249,869 509,644 Finance leases liabilities 46 41
\ 324,089 \ 545,678
Floating rate instruments:
Short-term borrowings \ 157,335 \ 58,390 If all other variables are assumed to be constant and an interest rate is changed by 100 basis points as of December 31, 2018, the interest expense of borrowings with floating rates is changed as follows (Korean won in millions):
100bp increase 100bp decrease
Profit before tax in 2018 \ (1,573) \ 1,573 The Group's listed or unlisted equity securities are exposed to a market price risk arising from the uncertainty of future value. As of December 31, 2018, the fair market value of listed equity securities exposed to the market
price risk is \2,469 million. If all other variables are assumed to be constant and the prices of listed equity
securities are changed by 10%, an impact on the financial statements is \247 million (without considering the
effect of corporate income tax). Credit risk is the risk that counterparty will not meet its obligations under a financial instrument or customer contract, leading to a financial loss. The Group is exposed to credit risk from its operating activities (primarily for trade receivables and loan notes) and from its financing activities, including deposits with banks and financial institutions, foreign exchange transactions and other financial instruments. Because the Group uses financial institutions with high credit ratings, credit risks associated with financial institutions are restricted. In an ordinary transaction with a customer, the Group evaluates the credit of the customer by considering the financial status of the customer and past experience with the customer, and other factors. Customer credit risk is controlled by each business unit that has to abide by the policies, procedures, and credit risk management of the Group. Credit limits are set for all customers, based on its internal credit ratings. Credit evaluation is based on the credit ratings that are calculated by considering many factors. Trade receivables are monitored regularly. The provision matrix that is based on collective assessment for trade receivable as of December 31, 2018 is as follows (Korean won in millions):
Occurrence date of trade receivables
Less than 3 months 3 to 6 months 6 to 9 months 9 to 12 months
Over than 12 months
Total
Expected credit loss rate 1.39% 0.70% 0.65% 15.12% 100%
Estimated total gross carrying amount at default
\ 500,464
\ 13,613
\ 5,995
\ 635
\ 1,544
\ 522,251
Expected credit loss 6,935 95 39 96 1,544 8,709
The recognized allowance for doubtful accounts based on individual assessment for trade receivable is
\2,041 million.
97

LG Household & Health Care Ltd. and its subsidiaries Notes to the consolidated financial statements December 31, 2018 and 2017
98
44. Financial instruments risk management and policy (cont’d)
The Group assesses the concentration of risk associated with trade receivables as low, because customers
are distributed across countries and industries and operate in independent markets.
The exposure to credit risk as of December 31, 2018 and 2017 is as follows (Korean won in millions):
2018 2017
Cash and cash equivalents \ 394,855 \ 383,895 Short-term financial deposits 16,900 16,900 Trade receivables before deducting allowance for doubtful accounts
566,838 529,223
Other receivables before deducting allowance for doubtful accounts
27,279 17,805
Accrued income 24 296 Long-term financial deposits 24 26 Other long-term receivables before deducting present value discount account and allowance for doubtful account
83,496 91,372
Financial assets at fair value through profit or loss(Convertible bond)
203 -
Available-for-sale debt instrument - 1,054 Liquidity risk refers to the risk that the Group may default on the contractual obligations that become due. The
Group manages its risk to a shortage of funds using a recurring liquidity planning tool. The Group’s objective
for managing its exposure to liquidity risk is to maintain a balance between continuity of funding and flexibility
through the use of bank overdrafts, bank loans, debentures, finance leases and hire purchase contracts. The
Group assessed the concentration of risk with respect to refinancing its debt and concluded it to be low. Access
to sources of funding is sufficiently available and debt maturing within 12 months can be rolled over with existing
lenders.
Maturities of financial liabilities based on undiscounted cash flows as of December 31, 2018 and 2017 are as follows (Korean won in millions):
2018
Book value Within 1 year 1 ~ 5 years After 5 years Total
Trade payables \ 215,581 \ 215,581 \ - \ - \ 215,581
Other payables 258,640 258,640 - - 258,640
Accrued expenses 197,247 197,247 - - 197,247
Dividends payables 117 117 - - 117
Borrowings 231,508 225,635 7,288 - 232,923
Debentures 249,869 154,758 100,557 - 255,315
Finance lease liabilities 46 17 29 - 46
Deposit received 7,325 - 7,325 - 7,325
Other financial liabilities 24,326 2,332 14,113 11,806 28,251
\ 1,184,659 \ 1,054,327 \ 129,312 \ 11,806 \ 1,195,445
98

LG Household & Health Care Ltd. and its subsidiaries Notes to the consolidated financial statements December 31, 2018 and 2017
99
44. Financial instruments risk management and policy (cont’d)
2017
Book value Within 1 year 1 ~ 5 years After 5 years Total
Trade payables \ 231,497 \ 231,497 \ - \ - \ 231,497
Other payables 238,250 238,250 - - 238,250
Accrued expenses 169,319 168,319 - - 168,319
Dividends payables 20 20 - - 20
Borrowings 94,383 76,772 18,786 - 95,558
Debentures 509,644 269,227 255,315 - 524,542
Finance lease liabilities 41 7 34 - 41
Deposit received 8,352 - 8,352 - 8,352
Other financial liabilities 23,647 12,000 2,266 11,750 26,016
\ 1,274,153 \ 996,092 \ 284,753 \ 11,750 \ 1,292,595
The main objective of the Group’s capital management is to maintain a high credit rating and a well-balanced capital ratio in order to fund its operating activities and to maximize shareholder’s value. To maintain or adjust its capital structure, the Group adjusts the dividend payout or returns capital to shareholders. To reduce liabilities, it issues new stocks or sells assets. The capital structure of the Group is consisted of net liabilities that cash & cashable assets are subtracted from borrowings, and equity. The Group's general capital risk management policy is the same as in 2018. The capital items that the Group managed as of December 31, 2018 and 2017 are as follows (Korean won in millions):
2018 2017
Total borrowings and debentures \ 481,378 \ 604,027 Deduction: Cash and cash equivalents (396,644) (386,194) Net borrowings 84,734 217,833
Total stockholders’ equity \ 3,594,020 \ 3,081,783
Adjusted debt to equity ratio 2.36% 7.07%
As of December 31, 2018 and 2017, the factored financial assets that were not entirely derecognized are as follows (Korean won in millions):
2018 2017
For those liabilities that have recourse only to the transferred assets:
Fair value of assets \ 25,948 \ 24,855
Fair value of associated liabilities (25,948) (24,855)
Net position \ - \ -
45. Subsequent Event
On November 29, 2018, the Group paid capital amounting to \50,000 million to establish Ulleung Mountain
Chu Spring Water Co., Ltd., a joint ventures, with Ulleung County, and recognized it as advance payments. On January 15, 2019, the Group transferred the advance payment to a decision to investment in subsidiaries of to court approval was completed. TheFaceShop Co., Ltd., a subsidiary company, is planning to purchase all of the shares of Avon Manufacturing (Guangzhou), Ltd. at USD 71,000 thousands on January 8, 2019 with the Board of Directors’ approval. Board of Directors approval was given to issue and finance debentures to fund the acquisition.
On January 30, 2019, the Group acquired 76% equity interest of Rucipello Korea Co., Ltd. for \2,637 million
and expects to increase its market competitiveness in oral care business through the acquisition.
99