LG HOUSEHOLD & HEALTH CARE, LTD. AND SUBSIDIARIES ...
116
LG HOUSEHOLD & HEALTH CARE, LTD. AND SUBSIDIARIES Consolidated Financial Statements December 31, 2013 and 2012 (With Independent Auditors’ Report Thereon)
Transcript of LG HOUSEHOLD & HEALTH CARE, LTD. AND SUBSIDIARIES ...

LG HOUSEHOLD & HEALTH CARE, LTD. AND SUBSIDIARIES
Consolidated Financial Statements
December 31, 2013 and 2012 (With Independent Auditors’ Report Thereon)
Contents Page Independent Auditors’ Report 1 Consolidated Statements of Financial Position 3 Consolidated Statements of Income 5 Consolidated Statements of Comprehensive Income 6 Consolidated Statements of Changes in Equity 7 Consolidated Statements of Cash Flows 9 Notes to the Consolidated Financial Statements 11
Independent Auditors’ Report Based on a report originally issued in Korean The Board of Directors and Shareholders LG Household & Health Care, Ltd.: We have audited the accompanying consolidated statements of financial position of LG Household & Health Care, Ltd. and its subsidiaries (the “Group”) as of December 31, 2013 and 2012, and the related consolidated statements of income, comprehensive income, changes in equity and cash flows for the years then ended. Management is responsible for the preparation and fair presentation of these consolidated financial statements in accordance with Korea International Financial Standards. Our responsibility is to express an opinion on these consolidated financial statements based on our audits. We did not audit the financial statements of certain subsidiaries, whose financial statements represent 2.81% and 3.44% of consolidated total assets as of December 31, 2013 and 2012 respectively and 4.36% and 4.19% of consolidated sales for the years then ended respectively. Other auditors audited those financial statements and our report, insofar as it relates to the subsidiaries, is based solely on the reports of other auditors. We conducted our audits in accordance with auditing standards generally accepted in the Republic of Korea. Those standards require that we plan and perform the audit to obtain reasonable assurance about whether the consolidated financial statements are free of material misstatement. An audit includes examining, on a test basis, evidence supporting the amounts and disclosures in the consolidated financial statements. An audit also includes assessing the accounting principles used and significant estimates made by management, as well as evaluating the overall financial statement presentation. We believe that the audit evidence we have obtained is sufficient and appropriate to provide a basis for our opinion. In our opinion, based on our audits and the reports of other auditors, the accompanying consolidated financial statements present fairly, in all material respects, the financial position of the Group as of December 31, 2013 and 2012 and its financial performance and its cash flows for the years then ended in accordance with Korean International Financial Reporting Standards. Without qualifying our opinion, we draw attention to the following: The procedures and practices utilized in the Republic of Korea to audit such consolidated financial statements may differ from those generally accepted and applied in other countries. Accordingly, this report is for use by those knowledgeable about Korean auditing standards and their application in practice.

LG HOUSEHOLD & HEALTH CARE, LTD. AND SUBSIDIARIES Consolidated Statements of Financial Position As of December 31, 2013 and 2012
3
In millions of won Notes 2013 2012 Assets Cash and cash equivalents 10,11,47,50 W 143,045 65,204 Short-term financial deposits 10,50 12,500 12,000 Trade receivables 10,12,45,46,50 410,540 370,286 Other receivables 10,12,45,46,47,50,51 13,013 16,099 Inventories 13 375,625 316,733 Non-current assets held for sale 14,20,51 6,749 - Other current assets 15 19,603 11,545 Total current assets 981,075 791,867 Long-term financial deposits 10,47,50 1,027 27 Other long-term receivables 10,16,45,46,50 71,030 55,297 Available-for-sale financial assets 9,10,17,50 1,635 1,416 Investments in associates 9,18 37,323 25,941 Investments in joint ventures 9,19 8,111 8,886 Deferred tax assets 43 780 898 Property, plant and equipment 9,20,45,46,51 1,022,142 1,007,101 Investment property 20,21 23,605 24,125 Goodwill 9,22 669,395 355,961 Intangible assets 9,20,22,51 616,496 484,682 Other non-current assets 15 2,485 7,935 Total non-current assets 2,454,029 1,972,269 Total assets W 3,435,104 2,764,136
See accompanying notes to the consolidated financial statements.
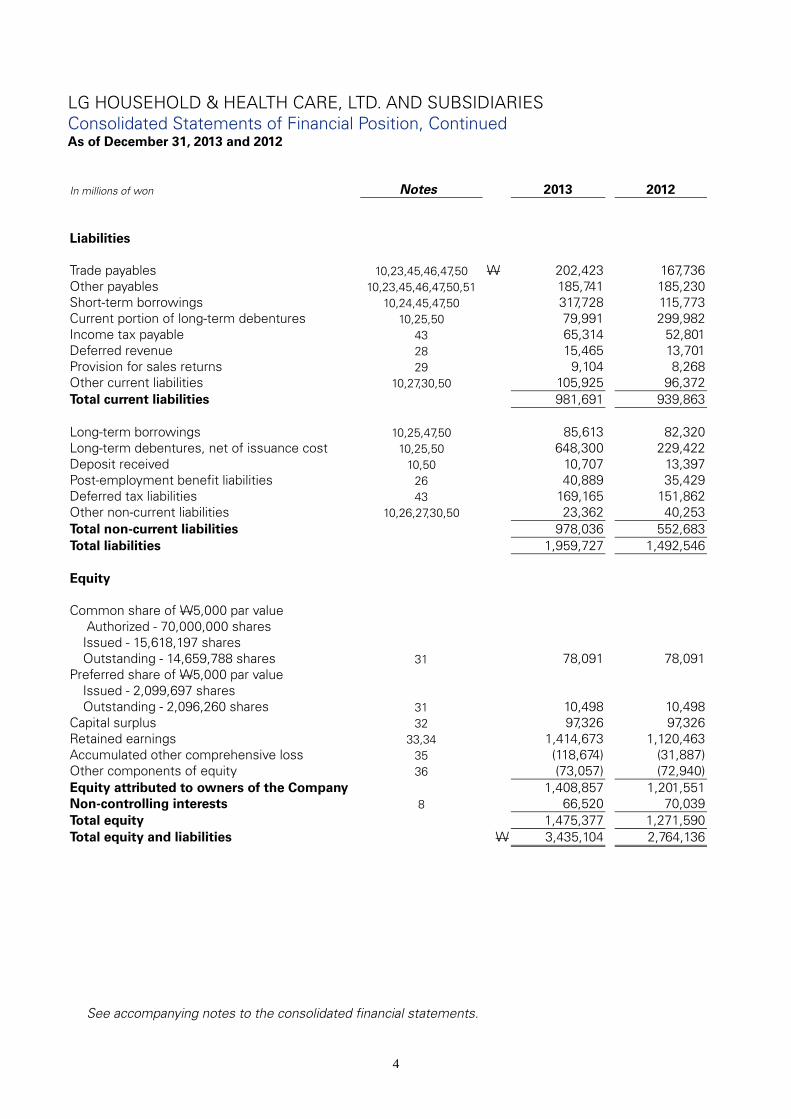
LG HOUSEHOLD & HEALTH CARE, LTD. AND SUBSIDIARIES Consolidated Statements of Financial Position, Continued As of December 31, 2013 and 2012
4
In millions of won Notes 2013 2012 Liabilities Trade payables 10,23,45,46,47,50 W 202,423 167,736 Other payables 10,23,45,46,47,50,51 185,741 185,230 Short-term borrowings 10,24,45,47,50 317,728 115,773 Current portion of long-term debentures 10,25,50 79,991 299,982 Income tax payable 43 65,314 52,801 Deferred revenue 28 15,465 13,701 Provision for sales returns 29 9,104 8,268 Other current liabilities 10,27,30,50 105,925 96,372 Total current liabilities 981,691 939,863 Long-term borrowings 10,25,47,50 85,613 82,320 Long-term debentures, net of issuance cost 10,25,50 648,300 229,422 Deposit received 10,50 10,707 13,397 Post-employment benefit liabilities 26 40,889 35,429 Deferred tax liabilities 43 169,165 151,862 Other non-current liabilities 10,26,27,30,50 23,362 40,253 Total non-current liabilities 978,036 552,683 Total liabilities 1,959,727 1,492,546 Equity Common share of W5,000 par value
Authorized - 70,000,000 shares Issued - 15,618,197 shares
Outstanding - 14,659,788 shares 31 78,091 78,091 Preferred share of W5,000 par value Issued - 2,099,697 shares
Outstanding - 2,096,260 shares 31 10,498 10,498 Capital surplus 32 97,326 97,326 Retained earnings 33,34 1,414,673 1,120,463 Accumulated other comprehensive loss 35 (118,674) (31,887) Other components of equity 36 (73,057) (72,940) Equity attributed to owners of the Company 1,408,857 1,201,551 Non-controlling interests 8 66,520 70,039 Total equity 1,475,377 1,271,590 Total equity and liabilities W 3,435,104 2,764,136
See accompanying notes to the consolidated financial statements.
LG HOUSEHOLD & HEALTH CARE, LTD. AND SUBSIDIARIES Consolidated Statements of Income For the years ended December 31, 2013 and 2012
5
See accompanying notes to the consolidated financial statements
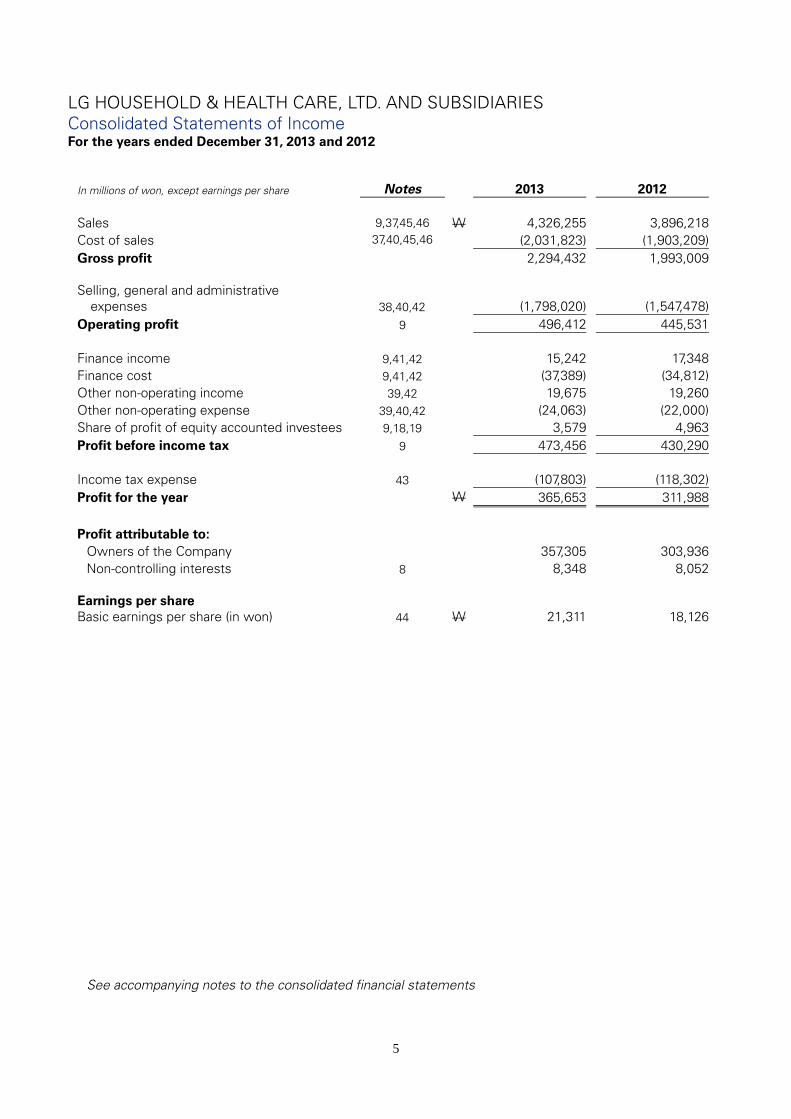
In millions of won, except earnings per share Notes 2013 2012 Sales 9,37,45,46 W 4,326,255 3,896,218Cost of sales 37,40,45,46 (2,031,823) (1,903,209)Gross profit 2,294,432 1,993,009 Selling, general and administrative expenses
38,40,42 (1,798,020) (1,547,478)
Operating profit 9 496,412 445,531 Finance income 9,41,42 15,242 17,348Finance cost 9,41,42 (37,389) (34,812)Other non-operating income 39,42 19,675 19,260Other non-operating expense 39,40,42 (24,063) (22,000)Share of profit of equity accounted investees 9,18,19 3,579 4,963Profit before income tax 9 473,456 430,290 Income tax expense 43 (107,803) (118,302)Profit for the year W 365,653 311,988 Profit attributable to:
Owners of the Company 357,305 303,936Non-controlling interests 8 8,348 8,052
Earnings per share Basic earnings per share (in won) 44 W 21,311 18,126
LG HOUSEHOLD & HEALTH CARE, LTD. AND SUBSIDIARIES Consolidated Statements of Comprehensive Income For the years ended December 31, 2013 and 2012
6
See accompanying notes to the consolidated financial statements.
In millions of won
Notes 2013
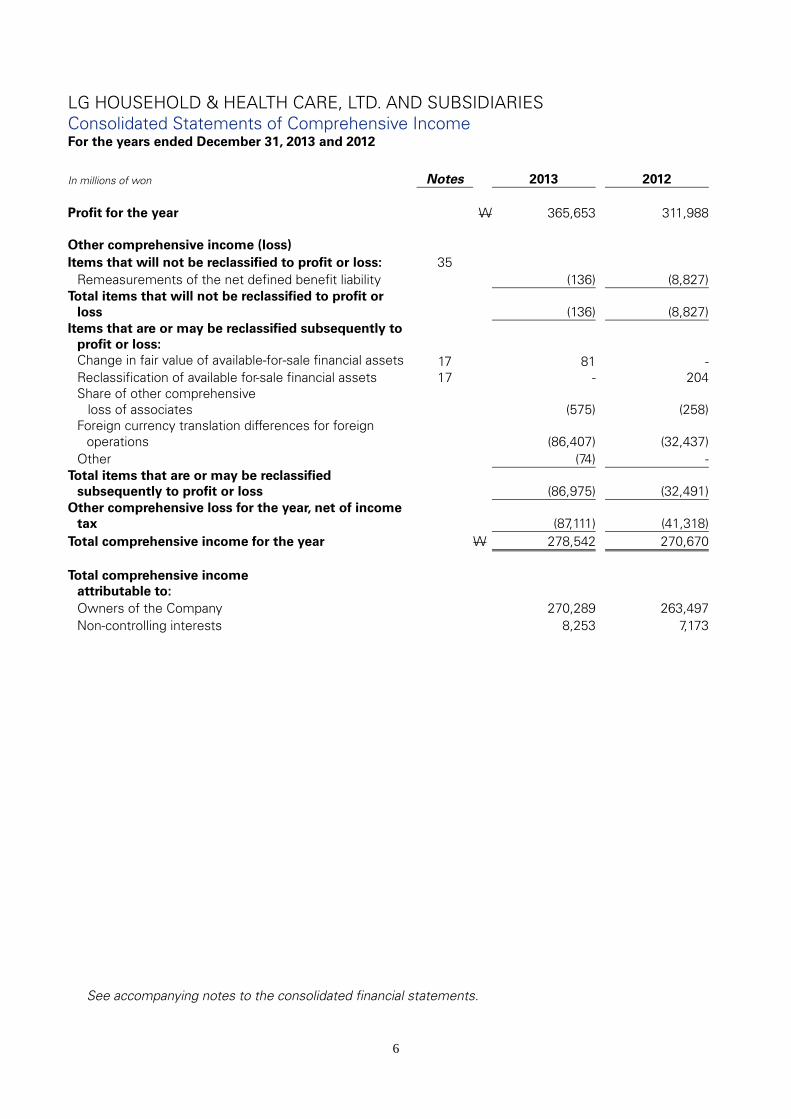
2012 Profit for the year W 365,653 311,988 Other comprehensive income (loss) Items that will not be reclassified to profit or loss: 35
Remeasurements of the net defined benefit liability (136) (8,827) Total items that will not be reclassified to profit or
loss
(136) (8,827) Items that are or may be reclassified subsequently to
profit or loss:
Change in fair value of available-for-sale financial assets 17 81 - Reclassification of available for-sale financial assets 17 - 204 Share of other comprehensive
loss of associates
(575) (258) Foreign currency translation differences for foreign
operations
(86,407) (32,437) Other (74) -
Total items that are or may be reclassified subsequently to profit or loss
(86,975) (32,491)
Other comprehensive loss for the year, net of income tax
(87,111) (41,318)
Total comprehensive income for the year W 278,542 270,670 Total comprehensive income
attributable to:
Owners of the Company 270,289 263,497 Non-controlling interests 8,253 7,173

LG HOUSEHOLD & HEALTH CARE, LTD. AND SUBSIDIARIES Consolidated Statements of Changes in Equity For the years ended December 31, 2013 and 2012
7
See accompanying notes to the consolidated financial statements.
In millions of won Attributed to owners of the Company
Share capital
Capital surplus
Retained earnings
Accumulated other comprehensive income (loss)
Other components of
equity Total Non-controlling
interest Total
equity
Balance at January 1, 2012 W 88,589 97,326 883,845 (15) (72,314) 997,431 63,146 1,060,577 Comprehensive income for the year Profit for the year - - 303,936 - - 303,936 8,052 311,988 Other comprehensive income (loss) for the year Remeasurements of the net defined benefit liability - - (8,567) - - (8,567) (260) (8,827)
Reclassification of available-for-sale financial assets - - - 204 - 204 - 204
Share of other comprehensive loss of associates - - - (258) - (258) - (258)
Foreign currency translation differences for foreign operations - - - (31,818) - (31,818) (619) (32,437)
Subtotal other comprehensive loss for the year - - (8,567) (31,872) - (40,439) (879) (41,318)
Total comprehensive income (loss) for the year - - 295,369 (31,872) - 263,497 7,173 270,670
Transactions with owners of the Company, recognized directly in equity Dividends to owners of the Company(Note 33) - - (58,751) - - (58,751) - (58,751) Acquisition of NCI - - - - (621) (621) (280) (901) Others - - - - (5) (5) - (5)
Balance at December 31, 2012 W 88,589 97,326 1,120,463 (31,887) (72,940) 1,201,551 70,039 1,271,590
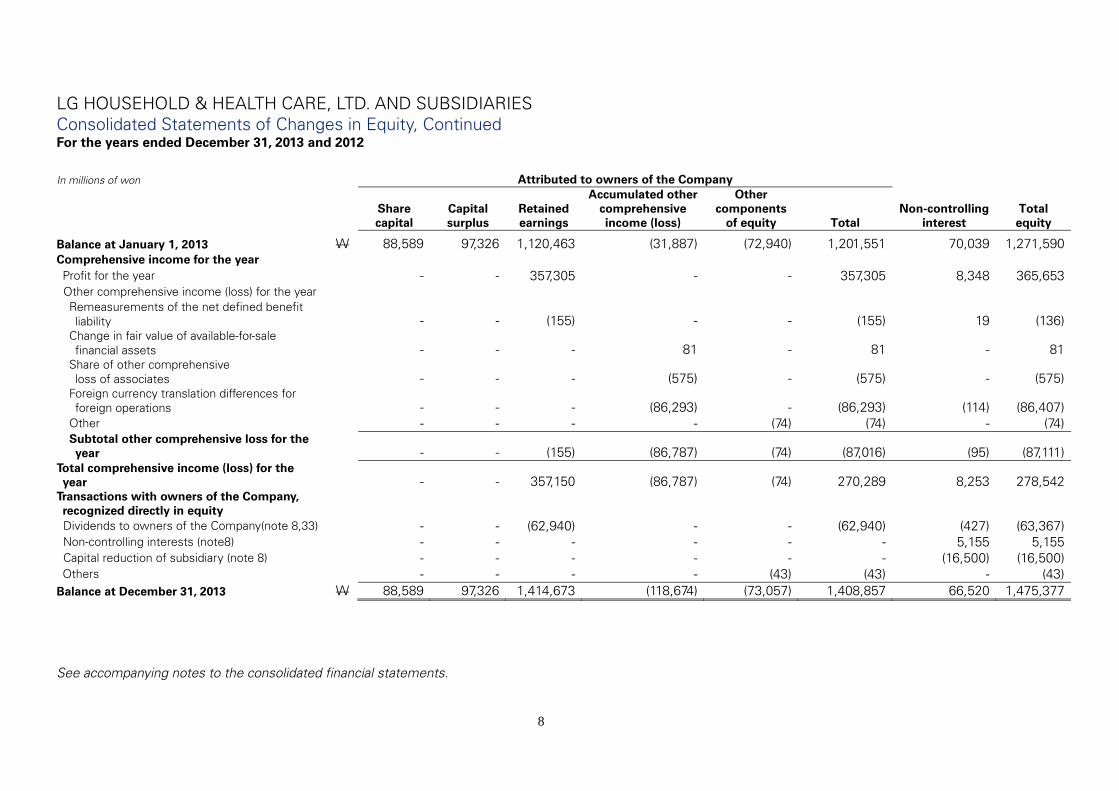
LG HOUSEHOLD & HEALTH CARE, LTD. AND SUBSIDIARIES Consolidated Statements of Changes in Equity, Continued For the years ended December 31, 2013 and 2012
8
See accompanying notes to the consolidated financial statements.
In millions of won Attributed to owners of the Company
Share capital
Capital surplus
Retained earnings
Accumulated other comprehensive income (loss)
Other components
of equity Total Non-controlling
interest Total equity
Balance at January 1, 2013 W 88,589 97,326 1,120,463 (31,887) (72,940) 1,201,551 70,039 1,271,590 Comprehensive income for the year Profit for the year - - 357,305 - - 357,305 8,348 365,653 Other comprehensive income (loss) for the year Remeasurements of the net defined benefit liability - - (155) - - (155) 19 (136)
Change in fair value of available-for-sale financial assets - - - 81 - 81 - 81
Share of other comprehensive loss of associates - - - (575) - (575) - (575)
Foreign currency translation differences for foreign operations - - - (86,293) - (86,293) (114) (86,407)
Other - - - - (74) (74) - (74) Subtotal other comprehensive loss for the year - - (155) (86,787) (74) (87,016) (95) (87,111)
Total comprehensive income (loss) for the year - - 357,150 (86,787) (74) 270,289 8,253 278,542
Transactions with owners of the Company, recognized directly in equity Dividends to owners of the Company(note 8,33) - - (62,940) - - (62,940) (427) (63,367) Non-controlling interests (note8) - - - - - - 5,155 5,155 Capital reduction of subsidiary (note 8) - - - - - - (16,500) (16,500) Others - - - - (43) (43) - (43)
Balance at December 31, 2013 W 88,589 97,326 1,414,673 (118,674) (73,057) 1,408,857 66,520 1,475,377
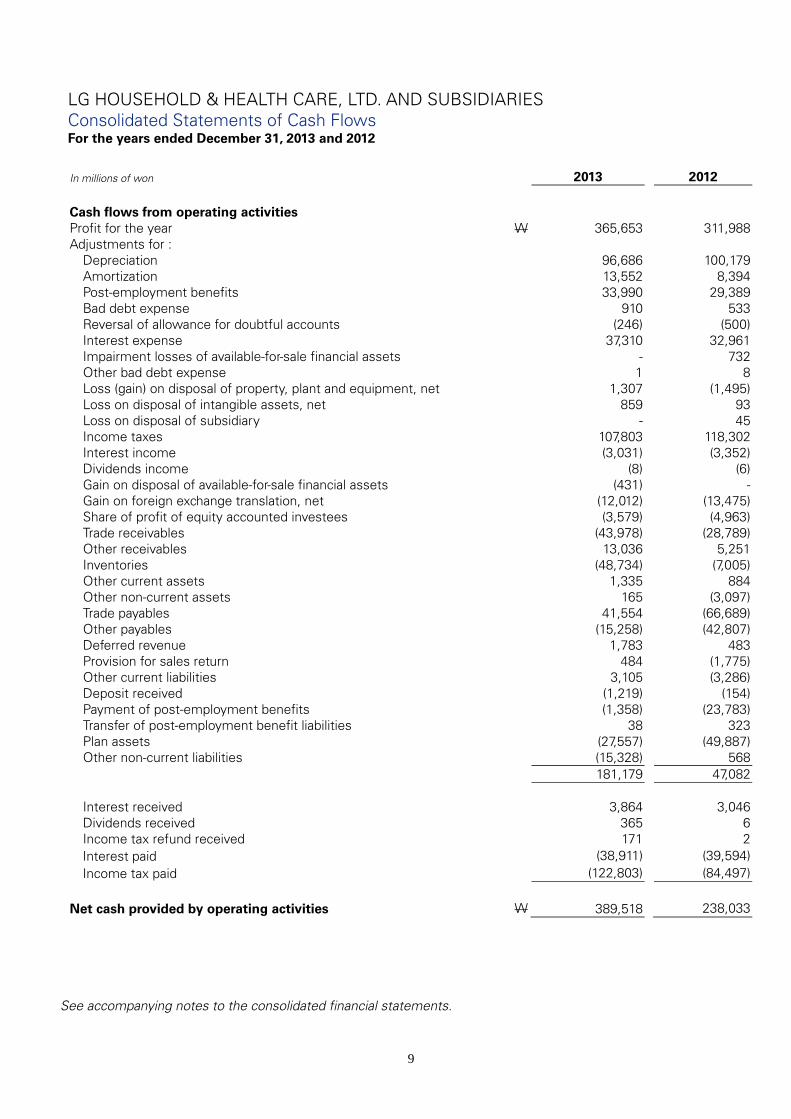
LG HOUSEHOLD & HEALTH CARE, LTD. AND SUBSIDIARIES Consolidated Statements of Cash Flows For the years ended December 31, 2013 and 2012
9
See accompanying notes to the consolidated financial statements.
In millions of won 2013 2012 Cash flows from operating activities Profit for the year W 365,653 311,988 Adjustments for :
Depreciation 96,686 100,179 Amortization 13,552 8,394 Post-employment benefits 33,990 29,389 Bad debt expense 910 533 Reversal of allowance for doubtful accounts (246) (500) Interest expense 37,310 32,961 Impairment losses of available-for-sale financial assets - 732 Other bad debt expense 1 8 Loss (gain) on disposal of property, plant and equipment, net 1,307 (1,495) Loss on disposal of intangible assets, net 859 93 Loss on disposal of subsidiary - 45 Income taxes 107,803 118,302 Interest income (3,031) (3,352) Dividends income (8) (6) Gain on disposal of available-for-sale financial assets (431) - Gain on foreign exchange translation, net (12,012) (13,475) Share of profit of equity accounted investees (3,579) (4,963) Trade receivables (43,978) (28,789) Other receivables 13,036 5,251 Inventories (48,734) (7,005) Other current assets 1,335 884 Other non-current assets 165 (3,097) Trade payables 41,554 (66,689) Other payables (15,258) (42,807) Deferred revenue 1,783 483 Provision for sales return 484 (1,775) Other current liabilities 3,105 (3,286) Deposit received (1,219) (154) Payment of post-employment benefits (1,358) (23,783) Transfer of post-employment benefit liabilities 38 323 Plan assets (27,557) (49,887) Other non-current liabilities (15,328) 568
181,179 47,082
Interest received 3,864 3,046 Dividends received 365 6 Income tax refund received 171 2 Interest paid (38,911) (39,594) Income tax paid (122,803) (84,497)
Net cash provided by operating activities W 389,518 238,033
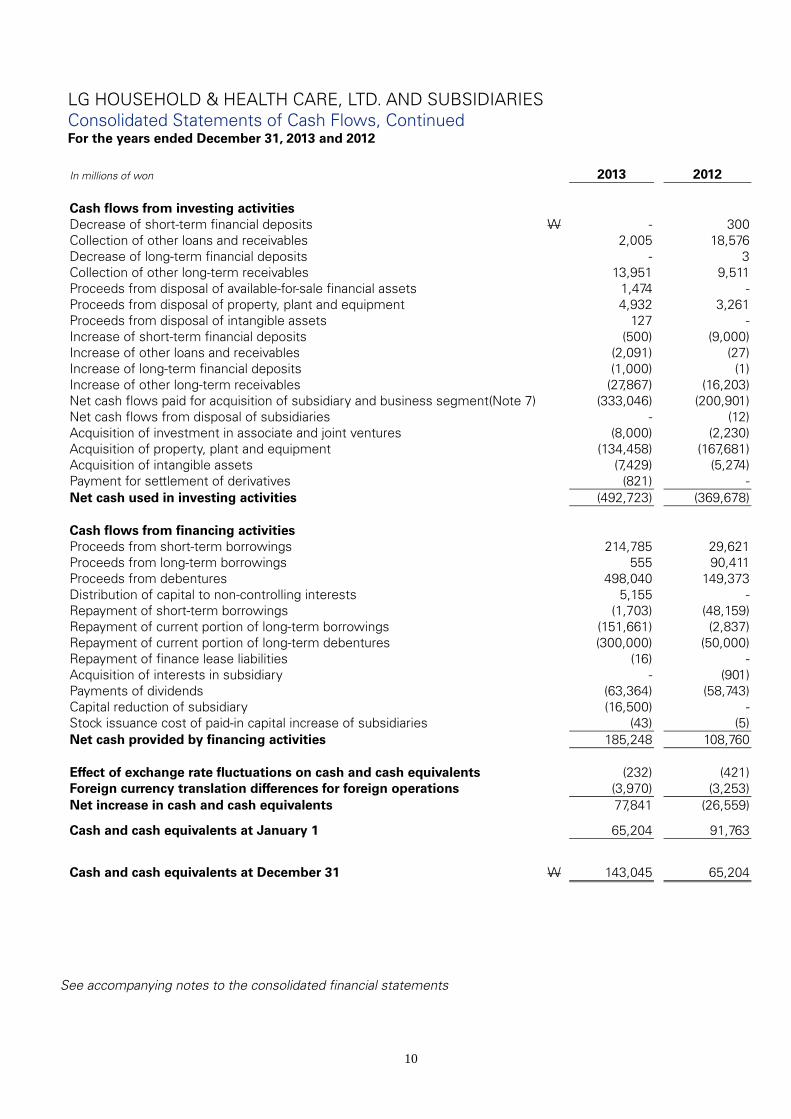
LG HOUSEHOLD & HEALTH CARE, LTD. AND SUBSIDIARIES Consolidated Statements of Cash Flows, Continued For the years ended December 31, 2013 and 2012
10
See accompanying notes to the consolidated financial statements
In millions of won 2013 2012 Cash flows from investing activities Decrease of short-term financial deposits W - 300 Collection of other loans and receivables 2,005 18,576 Decrease of long-term financial deposits - 3 Collection of other long-term receivables 13,951 9,511 Proceeds from disposal of available-for-sale financial assets 1,474 - Proceeds from disposal of property, plant and equipment 4,932 3,261 Proceeds from disposal of intangible assets 127 - Increase of short-term financial deposits (500) (9,000) Increase of other loans and receivables (2,091) (27) Increase of long-term financial deposits (1,000) (1) Increase of other long-term receivables (27,867) (16,203) Net cash flows paid for acquisition of subsidiary and business segment(Note 7) (333,046) (200,901) Net cash flows from disposal of subsidiaries - (12) Acquisition of investment in associate and joint ventures (8,000) (2,230) Acquisition of property, plant and equipment (134,458) (167,681) Acquisition of intangible assets (7,429) (5,274) Payment for settlement of derivatives (821) - Net cash used in investing activities (492,723) (369,678) Cash flows from financing activities Proceeds from short-term borrowings 214,785 29,621 Proceeds from long-term borrowings 555 90,411 Proceeds from debentures 498,040 149,373 Distribution of capital to non-controlling interests 5,155 - Repayment of short-term borrowings (1,703) (48,159) Repayment of current portion of long-term borrowings (151,661) (2,837) Repayment of current portion of long-term debentures (300,000) (50,000) Repayment of finance lease liabilities (16) - Acquisition of interests in subsidiary - (901) Payments of dividends (63,364) (58,743) Capital reduction of subsidiary (16,500) - Stock issuance cost of paid-in capital increase of subsidiaries (43) (5) Net cash provided by financing activities 185,248 108,760 Effect of exchange rate fluctuations on cash and cash equivalents (232) (421) Foreign currency translation differences for foreign operations (3,970) (3,253) Net increase in cash and cash equivalents 77,841 (26,559)
Cash and cash equivalents at January 1 65,204 91,763
Cash and cash equivalents at December 31 W 143,045 65,204
LG HOUSEHOLD & HEALTH CARE, LTD. AND SUBSIDIARIES Notes to the Consolidated Financial Statements For the years ended December 31, 2013 and 2012
11
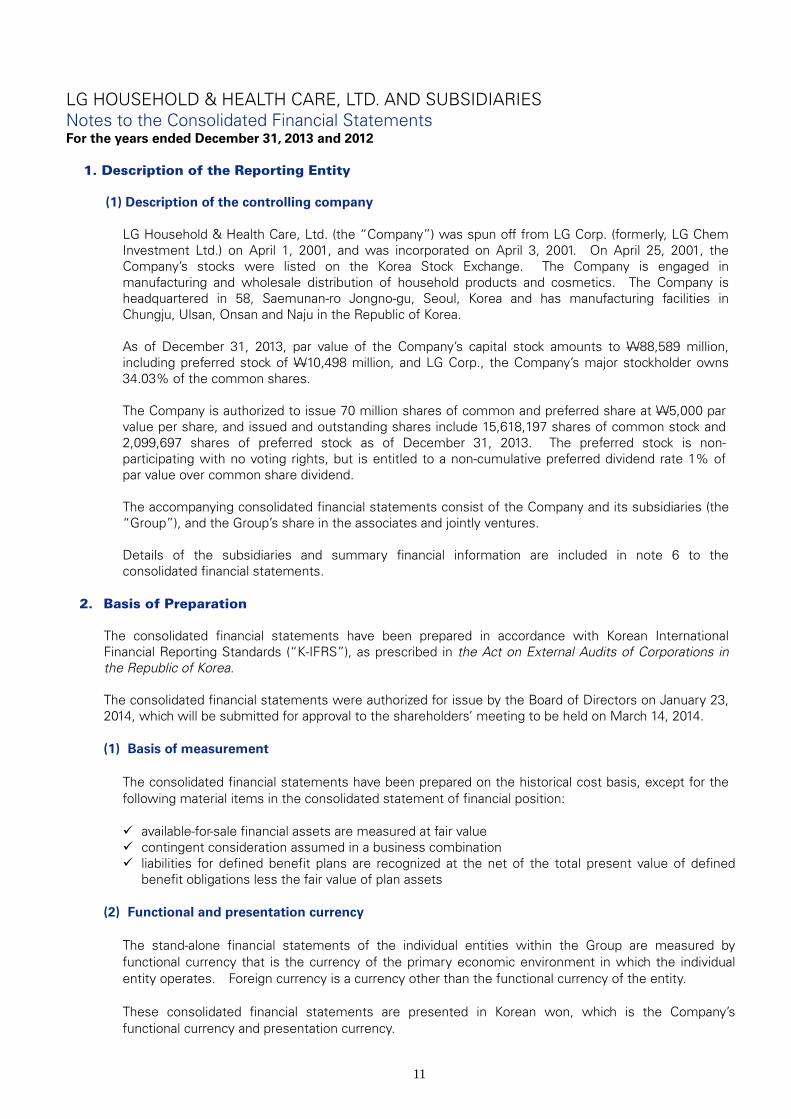
1. Description of the Reporting Entity
(1) Description of the controlling company
LG Household & Health Care, Ltd. (the “Company”) was spun off from LG Corp. (formerly, LG Chem Investment Ltd.) on April 1, 2001, and was incorporated on April 3, 2001. On April 25, 2001, the Company’s stocks were listed on the Korea Stock Exchange. The Company is engaged in manufacturing and wholesale distribution of household products and cosmetics. The Company is headquartered in 58, Saemunan-ro Jongno-gu, Seoul, Korea and has manufacturing facilities in Chungju, Ulsan, Onsan and Naju in the Republic of Korea.
As of December 31, 2013, par value of the Company’s capital stock amounts to W88,589 million, including preferred stock of W10,498 million, and LG Corp., the Company’s major stockholder owns 34.03% of the common shares.
The Company is authorized to issue 70 million shares of common and preferred share at W5,000 par value per share, and issued and outstanding shares include 15,618,197 shares of common stock and 2,099,697 shares of preferred stock as of December 31, 2013. The preferred stock is non-participating with no voting rights, but is entitled to a non-cumulative preferred dividend rate 1% of par value over common share dividend.
The accompanying consolidated financial statements consist of the Company and its subsidiaries (the “Group”), and the Group’s share in the associates and jointly ventures.
Details of the subsidiaries and summary financial information are included in note 6 to the consolidated financial statements.
2. Basis of Preparation
The consolidated financial statements have been prepared in accordance with Korean International Financial Reporting Standards (“K-IFRS”), as prescribed in the Act on External Audits of Corporations in the Republic of Korea.
The consolidated financial statements were authorized for issue by the Board of Directors on January 23, 2014, which will be submitted for approval to the shareholders’ meeting to be held on March 14, 2014. (1) Basis of measurement
The consolidated financial statements have been prepared on the historical cost basis, except for the following material items in the consolidated statement of financial position:
available-for-sale financial assets are measured at fair value contingent consideration assumed in a business combination liabilities for defined benefit plans are recognized at the net of the total present value of defined
benefit obligations less the fair value of plan assets (2) Functional and presentation currency
The stand-alone financial statements of the individual entities within the Group are measured by functional currency that is the currency of the primary economic environment in which the individual entity operates. Foreign currency is a currency other than the functional currency of the entity.
These consolidated financial statements are presented in Korean won, which is the Company’s functional currency and presentation currency.
LG HOUSEHOLD & HEALTH CARE, LTD. AND SUBSIDIARIES Notes to the Consolidated Financial Statements For the years ended December 31, 2013 and 2012
12
2. Basis of Preparation, Continued (3) Use of estimates and judgments
The preparation of the consolidated financial statements in conformity with K-IFRS requires management to make judgments, estimates and assumptions that affect the application of accounting policies and the reported amounts of assets, liabilities, income and expenses. Actual results may differ from these estimates.
Estimates and underlying assumptions are reviewed on an ongoing basis. Revisions to accounting estimates are recognized in the period in which the estimates are revised and in any future periods affected. (a) Judgments
Information about judgments made in accounting policies that have the most significant effects on the amounts recognized in the consolidated statements is included in the following notes:
Note 22 - the possibility of impairment of goodwill and intangible assets with indefinite useful lives
(b) Assumptions and estimation uncertainties Information about assumptions and estimation uncertainties that have a significant risk of resulting in a material adjustment within the next financial year are included in the following notes:
Note 7 - acquisition of business : measurement of fair value Note 22 - impairment test : the possibility of impairment of goodwill and intangible assets with
indefinite useful lives Note 26 - measurement of defined benefit obligations : key actuarial assumptions Note 28 - deferred revenues - key assumptions about the likelihood and magnitude of use of points Note 29, 30 and 49 - provision and contingencies : key assumptions about the likelihood and
magnitude of an outflow of resources Note 43 - deferred tax assets : use of unused tax losses
(c) Measurement of fair values A number of the Group’s accounting policies and disclosures require the measurement of fair values, for both financial and non-financial assets and liabilities. The Group has an established control framework with respect to the measurement of fair values. This includes a valuation team that has overall responsibility for overseeing all significant fair value measurements, including Level 3 fair values, and report directly to the CFO. The valuation team regularly reviews significant unobservable inputs and valuation adjustments. If third party information, such as broker quotes or pricing services, in used to measure fair values, then the valuation assesses the evidence obtained from the third parties to support the conclusion that such valuations meet the requirement of K-IFRS, including the level in the fair value hierarchy in which such valuations should be classified. Significant valuation issues are reported to the Audit Committee. When measuring the fair value of an asset of a liability, the Group uses market observable data as far as possible. Fair values are categorized into different levels in a fair value hierarchy based on the inputs used in the valuation techniques as follows. Level 1 : quoted prices (unadjusted) in active markets for identical assets or liabilities Level 2 : inputs other than quoted prices included in Level 1 that are observable for the assets or
liability, either directly (i.e. as prices) or indirectly (i.e. derived from prices) Level 3 : inputs for the assets or liability that are not based on observable market data
(unobservable inputs)

LG HOUSEHOLD & HEALTH CARE, LTD. AND SUBSIDIARIES Notes to the Consolidated Financial Statements For the years ended December 31, 2013 and 2012
13
2. Basis of Preparation, Continued
(3) Use of estimates and judgments, continued
(c) Measurement of fair values, continued If the inputs used to measure the fair value of an asset or a liability might be categorized in different levels of the fair value hierarchy, then the fair value measurement is categorized in its entirety in the same level of the fair value hierarchy as the lowest level input that is significant to the entire measurement. The Group recognizes transfers between levels of the fair value hierarchy at the end of the reporting period during which the change has occurred. Further information about the assumptions made in measuring fair values is included in the following note: Note 10, 12 and 50 - financial instruments
3. Changes in accounting policies
Except as described below, the accounting policies applied by the Group in these consolidated financial statements are same as those applied by the Group in its consolidated financial statements as of and for the year ended December 31, 2012.
K-IFRS No. 1110, ‘Consolidated Financial Statements’ K-IFRS No. 1111, ‘Joint Arrangements’ K-IFRS No. 1112, ‘Disclosure of Interests in Other Entities’ K-IFRS No. 1113, ‘Fair Value Measurement’ K-IFRS No. 1019, ‘Employee Benefits’ Amendments to K-IFRS No. 1001, Presentation of items of other comprehensive income Amendments to K-IFRS No. 1107, Disclosures of offsetting financial assets and financial liabilities The nature and effects of these changes are explained below.
(i) Subsidiaries The Group adopted K-IFRS No. 1110, ‘Consolidated Financial Statements’, since January 1, 2013. As a result, the Group has changed its accounting policy with respect to determining whether it has control over and consequently whether it consolidates its investees. K-IFRS No. 1110 introduces a new control model that focuses on whether the Group has power over an investee, exposure or right to variable returns from its involvement with the investee and ability to use its power to affect those returns.
In accordance with the adoption of K-IFRS No. 1110, the Group reassessed the control of its investees at January 1, 2013. As a result of reassessment of the control, there is no change in subsidiaries.
LG HOUSEHOLD & HEALTH CARE, LTD. AND SUBSIDIARIES Notes to the Consolidated Financial Statements For the years ended December 31, 2013 and 2012
14
3. Changes in accounting policies, Continued
(ii) Joint Arrangements Under K-IFRS No. 1111, the standard classifies joint arrangements into two types - joint operation and joint ventures. When making this assessment in accordance with this standard, the Group considered the structure of the arrangements, the legal form of any separate vehicles, the contractual terms of the arrangements and other facts and circumstances. Previously, the structure of the arrangement was the sole focus of classification. The Group has re-evaluated its involvement in its only joint arrangement and has reclassified the investment from a jointly controlled entity to a joint venture. Notwithstanding the reclassification, the investment continues to be recognized by applying the equity method and there has been no impact on the recognized assets, liabilities and comprehensive income of the Group.
(iii) Disclosure of Interests in Other Entities As a result of K-IFRS No. 1112, the Group has expanded its disclosures about its interests in subsidiaries (see note 6) and equity-accounted investees (see notes 18 and 19).
(iv) Fair value Measurement K-IFRS No. 1113 establishes a single framework for measuring fair value and making disclosures about fair value measurements when such measurements are required for permitted by other K-IFRSs. It unifies the definition of fair values as the price that would be received to sell an asset or paid to transfer a liability in an orderly transaction between market participants at the measurement date. It replaces and expands the disclosure requirements abut fair value measurements in other K-IFRSs, including K-IFRS No. 1107. As a result the Group has included additional disclosure in this regard (see notes 10 and 50). In accordance with the transitional provisions of K-IFRS No. 1113, the Group has applied the new fair value measurement guidance prospectively and has not provided any comparative information for new disclosures. Notwithstanding the above, the change had no significant impact on the measurements of the Group’s assets and liabilities.
(v) Post-employment Defined Benefit Plans As a result of K-IFRS No. 1019, the Group has changed its accounting policy with respect to the basis for determining the income or expense related to its post-employment defined benefit plans. Under K-IFRS No. 1019, the Group determines the net interest expense (income) on the net defined benefit liability (assets) for the period by applying the discount rate used to measure the defined benefit obligation at the beginning of the annual period to the then-net defined benefit liability (assets), taking into account any changes in the net defined benefit liability (asset) during the period as a result of contributions and benefit payments. Consequently, the net interest on the net defined benefit liability (asset) now comprises: interest cost on the defined benefit obligation, interest income on plan assets, and interest on the effect on the asset ceiling. Previously, the Group determined interest income on plan assets based on their long-term rate of expected return. The change in accounting policy did not have any significant impact on the Group’s financial statements.
(vi) Presentation of Items of OCI As a result of K-IFRS No. 1001, the Group has modified the presentation of items of OCI in its statement of comprehensive income, to present separately items that would be reclassified to profit or loss from those that would never be. Comparative information has been re-presented accordingly.
(vii) Offsetting of Financial Assets and Financial Liabilities There is no significant impact on the disclosures about the offsetting of financial assets and financial liabilities that are required as a result of the amendment to K-IFRS No. 1107.
LG HOUSEHOLD & HEALTH CARE, LTD. AND SUBSIDIARIES Notes to the Consolidated Financial Statements For the years ended December 31, 2013 and 2012
15
4. Significant Accounting Policies
The significant accounting policies applied by the Group in preparation of its consolidated financial statements are included below. The accounting policies set below have been applied consistently to all periods presented in these consolidated financial statements except for the change in accounting policies as explained in Note 3.
The Group reclassified certain comparative amounts in the consolidated statement of comprehensive income as a result in amendments to the standard regarding the presentation of items of OCI (note 3 (ⅵ).
(1) Operating segments
A segment is a distinguishable component of the Group that engages in business activities from which it any earn revenues and incur expenditures, whose operating results are regularly reviewed by the Group’s chief operating decision maker to make decisions about resources to be allocated to the segment and assess its performance. The Group has three operating segments which consist of Healthy, Beautiful and Refreshing as described in note 9. Segment results that are reported to the chief operating decision maker include items directly attributable to a segment as well as those that can be allocated on a reasonable basis.
(2) Basis of consolidation
(i) Business combination A business combination is accounted for by applying the acquisition method, unless it is a combination involving entities or business under common control. The consideration transferred in the acquisition is generally measured at fair value, as are identifiable net assets acquired. Any goodwill that arises is tested annually for impairment. Any gain on a bargain purchases is recognized in profit or loss immediately. Transaction costs are expensed as incurred, except if related to the issue of debt or equity securities. The consideration transferred does not include amounts related to the settlement of pre-existing relationships. Such amounts are generally recognized in profit or loss. Any contingent consideration payable is measured at fair value at the acquisition date. If the contingent consideration is classified as equity, then it is not remeasured and settlement is accounted for within equity. Otherwise, subsequent changes in the fair value of the contingent consideration are recognized in profit or loss. If share-based payment awards (replacement awards) are required to be exchanged for awards held by the acquiree’s employees (acquiree’s awards), then all or a portion of the amount of the acquirer’s replacement awards is included in measuring the consideration transferred in the business combination. This determination is based on the market-based measure of the replacement awards compared with the market-based measure of the acquiree’s awards and the extent to which the replacement awards relate to pre-combination service.
(ii) Non-controlling Interests(“NCI”) NCI are measured at their proportionate share of the acquiree’s identifiable net assets ant the acquisition date. Changes in the Group’s interest in subsidiary that do not result in loss of control are accounted for as equity transaction.

LG HOUSEHOLD & HEALTH CARE, LTD. AND SUBSIDIARIES Notes to the Consolidated Financial Statements For the years ended December 31, 2013 and 2012
16
4. Significant Accounting Policies, Continued
(2) Basis of consolidation, continued
(iii) Subsidiaries Subsidiaries are entities controlled by the Group. The Group controls entity when it is exposed to, or has rights to, variable returns from its involvement with the entity and has ability to affect those returns through its power over the entity. The financial statements of subsidiaries are include in the consolidated financial statements from the date on which control commences until the date on which control ceases.
(iv) Loss of control When the Group losses control over a subsidiary, it derecognizes the assets and liabilities of the subsidiary, and any related NCI and other components of equity. Any resulting gain or loss is recognized in profit or loss. Any interest retained in the former subsidiary is measured at fair value when control is lost.
(v) Interests in equity-accounted Investees The Group’s interests in equity-accounted investees comprise interest in associates and a joint venture. Associates are those entities in which the Group has significant influence, but not control or joint control, over the financial and operating policies. A joint venture is an arrangement in which the Group has joint control, whereby the Group has rights to the net assets of the arrangement, rather than rights its assets and obligations for its liabilities. Interests in associates and the joint venture are accounted for using the equity method. They are recognized initially at cost, which includes transaction costs. Subsequent to initial recognition, the consolidated financial statements include the Group’s share of the profit or loss and OCI of equity-accounted investees, until the date on which significant influence or joint control ceases.
(vi) Transactions eliminated on consolidation Intra-group balances and transactions, and any unrealized income and expenses arising from intra-group transactions, are eliminated. Unrealized gains arising from transactions with equity-accounted investees are eliminated against the investment to the extent of the Group’s interest in the investee. Unrealized losses are eliminated in the same way unrealized gains, but only to the extent that there is no evidence of impairment.
(vii) Business combination under common control For business combination under common control, the Group recognized assets and liabilities acquired using carrying amount in the consolidated financial statement of the ultimate parent.
(3) Cash and cash equivalents
Cash and cash equivalents comprise cash balances and call deposit with maturities of three months or less from the acquisition date that are subject to an insignificant risk of changes in their fair value, and are used by the Group in the management of its short-term commitments.

LG HOUSEHOLD & HEALTH CARE, LTD. AND SUBSIDIARIES Notes to the Consolidated Financial Statements For the years ended December 31, 2013 and 2012
17
4. Significant Accounting Policies, Continued
(4) Inventories
The cost of inventories is based on the specification method for goods-in-transit and on the total-average method and moving average method for all other inventories, and includes expenditures for acquiring the inventories, production or conversion costs and other costs incurred in bringing them to their existing location and condition.
When inventories are sold, the carrying amount of those inventories is recognized as cost of sales in the period in which the related revenue is recognized. Inventories are measured at the lower of cost and net realizable value. Net realizable value is the estimated selling price in the ordinary course of business, less the estimated costs of completion and selling expenses. The amount of any write-down of inventories to net realizable value and all losses of inventories are recognized as an expense in the period the write-down or loss occurs. The amount of any reversal of any write-down of inventories, arising from an increase in net realizable value, are recognized as a reduction in the amount of inventories recognized as an expense in the period in which the reversal occurs.
(5) Non-derivative financial assets
The Group recognizes and measures non-derivative financial assets by the following four categories: financial assets at fair value through profit or loss, held-to-maturity investments, loans and receivables and available-for-sale financial assets. The Group recognizes financial assets in the consolidated statement of financial position when the Group becomes a party to the contractual provisions of the instrument.
Upon initial recognition, non-derivative financial assets are measured at their fair value plus, in the case of a financial asset not at fair value through profit or loss, transaction costs that are directly attributable to the asset’s acquisition or issuance.
(i) Financial assets at fair value through profit or loss
A financial asset is classified as financial assets at fair value through profit or loss if it is held for trading or is designated as such upon initial recognition. Subsequent to initial recognition, financial assets at fair value through profit or loss are measured at fair value, and changes therein are recognized in profit or loss. Upon initial recognition, transaction costs are recognized in profit or loss when incurred.
(ii) Held-to-maturity investments
A non-derivative financial asset with a fixed or determinable payment and fixed maturity, for which the Group has the positive intention and ability to hold to maturity, are classified as held-to-maturity investments. Subsequent to initial recognition, held-to-maturity investments are measured at amortized cost using the effective interest method.
(iii) Loans and receivables
Loans and receivables are financial assets with fixed or determinable payments that are not quoted in an active market. Subsequent to initial recognition, loans and receivables are measured at amortized cost using the effective interest method except for loans and receivables of which the effect of discounting is immaterial.

LG HOUSEHOLD & HEALTH CARE, LTD. AND SUBSIDIARIES Notes to the Consolidated Financial Statements For the years ended December 31, 2013 and 2012
18
4. Significant Accounting Policies, Continued (5) Non-derivative financial assets, continued
(iv) Available-for-sale financial assets Available-for-sale financial assets are those non-derivative financial assets that are designated as available-for-sale or are not classified as financial assets at fair value through profit or loss, held-to-maturity investments or loans and receivables. Subsequent to initial recognition, they are measured at fair value, which changes in fair value, net of any tax effect, recorded in other comprehensive income in equity. Investments in equity instruments that do not have a quoted market price in an active market and whose fair value cannot be reliably measured and derivatives that are linked to such unquoted equity instruments and must be settled by delivery of such unquoted equity instruments are measured at cost. When a financial asset is derecognized or impairment losses are recognized, the cumulative gain or loss previously recognized in other comprehensive income is reclassified from equity to profit or loss. Dividends on an available-for-sale equity instrument are recognized in profit or loss when the Group’s right to receive payment is established.
(v) De-recognition of financial assets The Group derecognizes a financial asset when the contractual rights to the cash flows from the asset expire, or the Group transfers the rights to receive the contractual cash flows on the financial asset in a transaction in which substantially all the risks and rewards of ownership of the financial asset are transferred. Any interest in transferred financial assets that is created or retained by the Group is recognized as a separate asset or liability. If the Group retains substantially all the risks and rewards of ownership of the transferred financial assets, the Group continues to recognize the transferred financial assets and recognizes financial liabilities for the consideration received.
(vi) Offsetting between financial assets and financial liabilities
Financial assets and financial liabilities are offset and the net amount is presented in the consolidated statement of financial position only when the Group currently has a legally enforceable right to offset the recognized amounts, and there is the intention to settle on a net basis or to realize the asset and settle the liability simultaneously.
(6) Derivative financial assets
Derivatives are initially recognized at fair value. Subsequent to initial recognition, derivatives are measured at fair value except derivative asset that is linked to and must be settled by delivery of an equity instrument that does not have a quoted price in an active market for an identical instrument whose fair value cannot otherwise be reliably measured, which shall be measured at cost.
Embedded derivatives are separated from the host contract and accounted for separately only if the following criteria have been met: - the economic characteristics and risks of the embedded derivative are not closely related to those of
the host contract; - a separate instrument with the same terms as the embedded derivative would meet the definition of a
derivative; and - the hybrid instrument is not measured at fair value with changes in fair value recognized in profit or
loss.
Changes in the fair value of separable embedded derivatives are recognized immediately in profit or loss.
LG HOUSEHOLD & HEALTH CARE, LTD. AND SUBSIDIARIES Notes to the Consolidated Financial Statements For the years ended December 31, 2013 and 2012
19
4. Significant Accounting Policies, Continued
(7) Impairment of financial assets
A financial asset not carried at fair value through profit or loss is assessed at each reporting date to determine whether there is objective evidence that it is impaired. A financial asset is impaired if objective evidence indicates that a loss event has occurred after the initial recognition of the asset, and that the loss event had a negative effect on the estimated future cash flows of that asset that can be estimated reliably. However, losses expected as a result of future events, regardless of likelihood, are not recognized.
In addition, for an investment in an equity security, a significant or prolonged decline in its fair value below its cost is objective evidence of impairment. If financial assets have objective evidence that they are impaired, impairment losses should be measured and recognized.
(i) Financial assets measured at amortized cost
An impairment loss in respect of a financial asset measured at amortized cost is calculated as the difference between its carrying amount and the present value of its estimated future cash flows discounted at the asset’s original effective interest rate. If it is not practicable to obtain the instrument’s estimated future cash flows, impairment losses would be measured by using prices from any observable current market transactions. The Group can recognize impairment losses directly or establish a provision to cover impairment losses. If, in a subsequent period, the amount of the impairment loss decreases and the decrease can be related objectively to an event occurring after the impairment was recognized, the previously recognized impairment loss shall be reversed either directly or by adjusting an allowance account.
(ii) Financial assets carried at cost The amount of the impairment loss in respect of a financial assets carried at cost is measured as the difference between the carrying amount of the financial asset and the present value of estimated future cash flows discounted at the current market rate of return for a similar financial asset. Such impairment loss is not reversed.
(iii) Available-for-sale financial assets
When a decline in the fair value of an available-for-sale financial asset has been recognized in other comprehensive income and there is objective evidence that the asset is impaired, the cumulative loss that had been recognized in other comprehensive income shall be reclassified from equity to profit or loss as a reclassification adjustment even though the financial asset has not been derecognized. Impairment losses recognized in profit or loss for an investment in an equity instrument classified as available-for-sale shall not be reversed through profit or loss. If, in a subsequent period, the fair value of a debt instrument classified as available-for-sale increases and the increase can be objectively related to an event occurring after the impairment loss was recognized in profit or loss, the impairment loss shall be reversed, with the amount of the reversal recognized in profit or loss.
LG HOUSEHOLD & HEALTH CARE, LTD. AND SUBSIDIARIES Notes to the Consolidated Financial Statements For the years ended December 31, 2013 and 2012
20
4. Significant Accounting Policies, Continued
(8) Property, plant and equipment
Property, plant and equipment are initially measured at cost. The cost of property, plant and equipment includes expenditures arising directly from the construction or acquisition of the asset, any costs directly attributable to bringing the asset to the location and condition necessary for it to be capable of operating in the manner intended by management and the initial estimate of the costs of dismantling and removing the item and restoring the site on which it is located.
Subsequent to initial recognition, an item of property, plant and equipment shall be carried at its cost less any accumulated depreciation and any accumulated impairment losses.
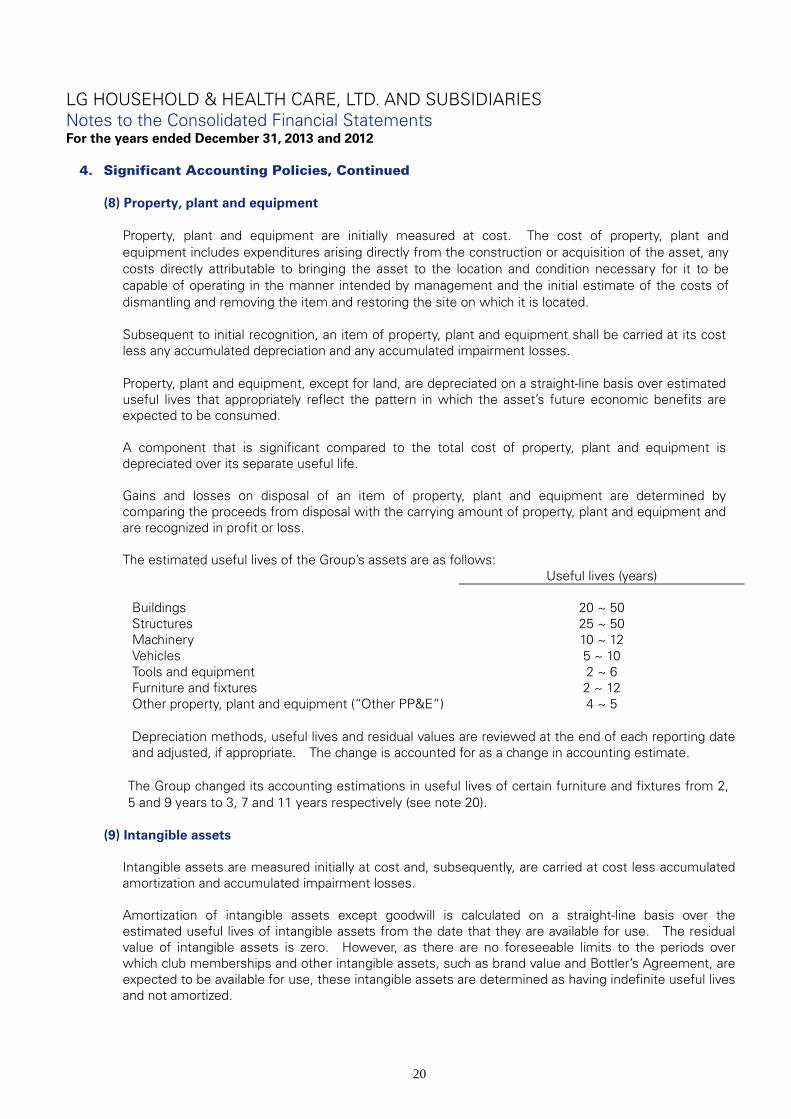
Property, plant and equipment, except for land, are depreciated on a straight-line basis over estimated useful lives that appropriately reflect the pattern in which the asset’s future economic benefits are expected to be consumed. A component that is significant compared to the total cost of property, plant and equipment is depreciated over its separate useful life. Gains and losses on disposal of an item of property, plant and equipment are determined by comparing the proceeds from disposal with the carrying amount of property, plant and equipment and are recognized in profit or loss. The estimated useful lives of the Group’s assets are as follows:
Useful lives (years)
Buildings 20 ~ 50 Structures 25 ~ 50 Machinery 10 ~ 12 Vehicles 5 ~ 10 Tools and equipment 2 ~ 6 Furniture and fixtures 2 ~ 12 Other property, plant and equipment (“Other PP&E”) 4 ~ 5
Depreciation methods, useful lives and residual values are reviewed at the end of each reporting date and adjusted, if appropriate. The change is accounted for as a change in accounting estimate.
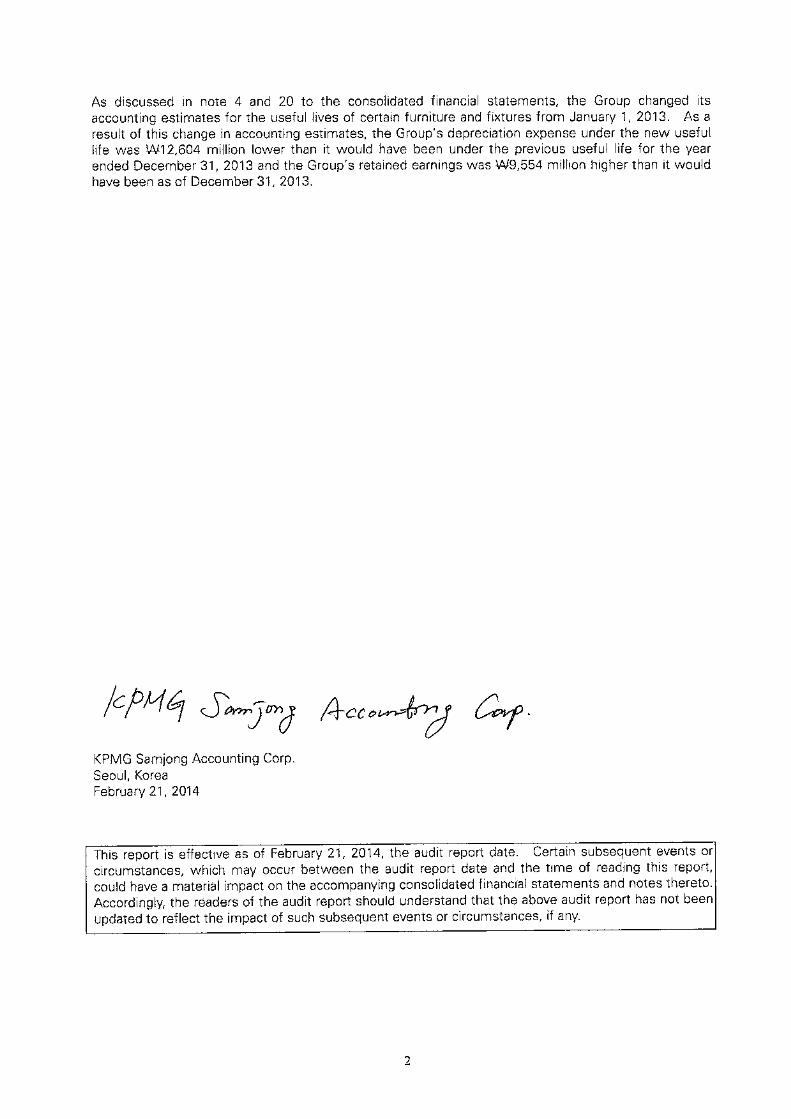
The Group changed its accounting estimations in useful lives of certain furniture and fixtures from 2, 5 and 9 years to 3, 7 and 11 years respectively (see note 20).
(9) Intangible assets
Intangible assets are measured initially at cost and, subsequently, are carried at cost less accumulated amortization and accumulated impairment losses.
Amortization of intangible assets except goodwill is calculated on a straight-line basis over the estimated useful lives of intangible assets from the date that they are available for use. The residual value of intangible assets is zero. However, as there are no foreseeable limits to the periods over which club memberships and other intangible assets, such as brand value and Bottler’s Agreement, are expected to be available for use, these intangible assets are determined as having indefinite useful lives and not amortized.

LG HOUSEHOLD & HEALTH CARE, LTD. AND SUBSIDIARIES Notes to the Consolidated Financial Statements For the years ended December 31, 2013 and 2012
21
4. Significant Accounting Policies, Continued (9) Intangible assets, continued
The estimated useful lives of the Group’s intangible assets are as follows:
Useful lives (years)
Industrial property rights 5 ~ 10 Software 3 ~ 6 Other intangible assets 5 ~ 15
Amortization periods and the amortization methods for intangible assets with finite useful lives are reviewed at the end of each reporting period. The useful lives of intangible assets that are not being amortized are reviewed at the end of each reporting period to determine whether events and circumstances continue to support indefinite useful life assessments for those assets. Changes are accounted for as changes in accounting estimates.
(i) Research and development Expenditures on research activities, undertaken with the prospect of gaining new scientific or technical knowledge and understanding, are recognized in profit or loss as incurred. Development expenditures are capitalized only if development costs can be measured reliably, the product or process is technically and commercially feasible, future economic benefits are probable, and the Group intends to and has sufficient resources to complete development and to use or sell the asset. Other development expenditures are recognized in profit or loss as incurred.
(ii) Subsequent expenditures
Subsequent expenditures are capitalized only when they increase the future economic benefits embodied in the specific asset to which it relates. All other expenditures, including expenditures on internally generated goodwill and brands, are recognized in profit or loss as incurred.
(10) Borrowing costs
The Group capitalizes borrowing costs directly attributable to the acquisition, construction or production of a qualifying asset as part of the cost of that asset. Other borrowing costs are recognized in expense as incurred. A qualifying asset is an asset that requires a substantial period of time to get ready for its intended use or sale. Financial assets and inventories that are manufactured or otherwise produced over a short period of time are not qualifying assets. Assets that are ready for their intended use or sale when acquired are not qualifying assets.
To the extent that the Group borrows funds specifically for the purpose of obtaining a qualifying asset, the Group determines the amount of borrowing costs eligible for capitalization as the actual borrowing costs incurred on that borrowing during the period less any investment income on the temporary investment of those borrowings. To the extent that the Group borrows funds generally and uses them for the purpose of obtaining a qualifying asset, the Group shall determine the amount of borrowing costs eligible for capitalization by applying a capitalization rate to the expenditures on that asset. The capitalization rate shall be the weighted average of the borrowing costs applicable to the borrowings of the Group that are outstanding during the period, other than borrowings made specifically for the purpose of obtaining a qualifying asset. The amount of borrowing costs that the Group capitalizes during a period shall not exceed the amount of borrowing costs incurred during that period.
LG HOUSEHOLD & HEALTH CARE, LTD. AND SUBSIDIARIES Notes to the Consolidated Financial Statements For the years ended December 31, 2013 and 2012
22
4. Significant Accounting Policies, Continued
(11) Government grants
Government grants are not recognized unless there is reasonable assurance that the Group will comply with the grant’s conditions and that the grant will be received.
Government grants which are intended to compensate the Group for expenses incurred are recognized as deduction to related expenses in profit or loss over the periods in which the Group recognizes the related costs as expenses.
(12) Investment property
Property held for the purpose of earning rentals or benefiting from capital appreciation is classified as investment property. Investment property is initially measured at its cost. Transaction costs are included in the initial measurement. Subsequently, investment property is carried at depreciated cost less any accumulated impairment losses.
Subsequent costs are recognized in the carrying amount of investment property at cost or, if appropriate, as separate items if it is probable that future economic benefits associated with the item will flow to the Group and the cost of the item can be measured reliably. The carrying amount of the replaced part is derecognized. The costs of the day-to-day servicing are recognized in profit or loss as incurred. Investment properties, except for land, are depreciated on a straight-line basis over estimated useful lives of 25 ~ 50 years. Depreciation methods, useful lives and residual values are reviewed at each reporting date and adjusted if appropriate. The change is accounted for as a change in an accounting estimate.
(13) Impairment of non-financial assets
The carrying amounts of the Group’s non-financial assets, other than assets arising from employee benefits, inventories, deferred tax assets and non-current assets held for sale, are reviewed at the end of the reporting period to determine whether there is any indication of impairment. If any such indication exists, then the asset’s recoverable amount is estimated. Goodwill and intangible assets that have indefinite useful lives or that are not yet available for use, irrespective of whether there is any indication of impairment, are tested for impairment annually by comparing their recoverable amount to their carrying amount.
The Group estimates the recoverable amount of an individual asset, if it is impossible to measure the individual recoverable amount of an asset, then the Group estimates the recoverable amount of cash-generating unit (“CGU”). The recoverable amount of an asset or CGU is the greater of its value in use and its fair value less costs to sell. The value in use is estimated by applying a post-tax discount rate that reflect current market assessments of the time value of money and the risks specific to the asset or CGU for which estimated future cash flows have not been adjusted, to the estimated future cash flows expected to be generated by the asset or CGU.
An impairment loss is recognized in profit or loss if the carrying amount of an asset or a CGU exceeds its recoverable amount.
LG HOUSEHOLD & HEALTH CARE, LTD. AND SUBSIDIARIES Notes to the Consolidated Financial Statements For the years ended December 31, 2013 and 2012
23
4. Significant Accounting Policies, Continued (13) Impairment of non-financial assets, continued
Goodwill acquired in a business combination is allocated to each CGU that is expected to benefit from the synergies arising from the goodwill acquired. Any impairment identified at the CGU level will first reduce the carrying value of goodwill and then be used to reduce the carrying amount of the other assets in the CGU on a pro rata basis. Except for impairment losses in respect of goodwill which are never reversed, an impairment loss is reversed if there has been a change in the estimates used to determine the recoverable amount. An impairment loss is reversed only to the extent that the asset’s carrying amount does not exceed the carrying amount that would have been determined, net of depreciation or amortization, if no impairment loss had been recognized.
(14) Leases
The Group classifies and accounts for leases as either a finance or operating lease, depending on the terms. Leases where the Group assumes substantially all of the risks and rewards of ownership are classified as finance leases. All other leases are classified as operating leases.
(i) Finance leases
At the commencement of the lease term, the Group recognizes as finance assets and finance liabilities in its consolidated statements of financial position, the lower amount of the fair value of the leased property and the present value of the minimum lease payments, each determined at the inception of the lease. Any initial direct costs are added to the amount recognized as finance assets. Minimum lease payments are apportioned between the finance charge and the reduction of the outstanding liability. The finance charge is allocated to each period during the lease term so as to produce a constant periodic rate of interest on the remaining balance of the liability. Contingent rents are charged as expenses in the periods in which they are incurred.
The depreciable amount of a leased asset is allocated to each accounting period during the period of expected use on a systematic basis consistent with the depreciation policy the lessee adopts for depreciable assets that are owned. If there is no reasonable certainty that the lessee will obtain ownership by the end of the lease term, the asset is fully depreciated over the shorter of the lease term and its useful life. The Group reviews to determine whether the leased asset may be impaired.
(ii) Operating leases
Leases where the lessor retains a significant portion of the risks and rewards of ownership are classified as operating leases. Payments made under operating leases (net of any incentives received from the lessor) are recognized in profit or loss on a straight-line basis over the period of the lease.
(iii) Determining whether an arrangement contains a lease
Determining whether an arrangement is, or contains, a lease shall be based on the substance of the arrangement and requires an assessment of whether fulfillment of the arrangement is dependent on the use of a specific asset or assets (the asset) and the arrangement conveys a right to use the asset.
At inception or reassessment of the arrangement, the Group separates payments and other consideration required by such an arrangement into those for the lease and those for other elements on the basis of their relative fair values. If the Group concludes for a financial lease that it is impracticable to separate the payments reliably, the Group recognizes an asset and a liability at an amount equal to the fair value of the underlying asset that was identified as the subject of the lease. Subsequently, the liability shall be reduced as payments are made and an imputed finance charge on the liability recognized using the purchaser's incremental borrowing rate.

LG HOUSEHOLD & HEALTH CARE, LTD. AND SUBSIDIARIES Notes to the Consolidated Financial Statements For the years ended December 31, 2013 and 2012
24
4. Significant Accounting Policies, Continued
(15) Non-current assets held for sale Non-current assets, or disposal groups comprising assets and liabilities, that are expected to be recovered primarily through sale rather than through continuing use, are classified as held for sale. In order to be classified as held for sale, the asset (or disposal group) must be available for immediate sale in its present condition and its sale must be highly probable. The assets or disposal group that are classified as non-current assets held for sale are measured at the lower of their carrying amount and fair value less cost to sell.
The Group recognizes an impairment loss for any initial or subsequent write-down of an asset (or disposal group) to fair value less costs to sell, and a gain for any subsequent increase in fair value less costs to sell, up to the cumulative impairment loss previously recognized in accordance with K-IFRS No. 1036, ‘Impairment of Assets’.
A non-current asset that is classified as held for sale or part of a disposal group classified as held for sale is not depreciated (or amortized).
(16) Non-derivative financial liabilities
The Group classifies non-derivative financial liabilities into financial liabilities at fair value through profit or loss or other financial liabilities in accordance with the substance of the contractual arrangement and the definitions of financial liabilities. The Group recognizes financial liabilities in the consolidated statement of financial position when the Group becomes a party to the contractual provisions of the financial liability.
(i) Financial liabilities at fair value through profit or loss
Financial liabilities at fair value through profit or loss include financial liabilities held for trading or designated as such upon initial recognition. Subsequent to initial recognition, financial liabilities at fair value through profit or loss are measured at fair value, and changes therein are recognized in profit or loss. Upon initial recognition, transaction costs that are directly attributable to the acquisition are recognized in profit or loss as incurred.
(ii) Other financial liabilities
Non-derivative financial liabilities other than financial liabilities at fair value through profit or loss are classified as other financial liabilities. At the date of initial recognition, other financial liabilities are measured at fair value minus transaction costs that are directly attributable to the acquisition. Subsequent to initial recognition, other financial liabilities are measured at amortized cost using the effective interest method.
The Group derecognizes a financial liability from the consolidated statement of financial position when it is extinguished (i.e. when the obligation specified in the contract is discharged, cancelled or expires).
(17) Employee benefits
(i) Short-term employee benefits Short-term employee benefits are employee benefits that are due to be settled within 12 months after the end of the period in which the employees render the related service. When an employee has rendered service to the Group during an accounting period, the Group recognizes the undiscounted amount of short-term employee benefits expected to be paid in exchange for that service.

LG HOUSEHOLD & HEALTH CARE, LTD. AND SUBSIDIARIES Notes to the Consolidated Financial Statements For the years ended December 31, 2013 and 2012
25
4. Significant Accounting Policies, Continued
(17) Employee benefits, continued (ii) Other long-term employee benefits
Other long-term employee benefits include employee benefits that are settled beyond 12 months after the end of the period in which the employees render the related service, and are calculated at the present value of the amount of future benefit that employees have earned in return for their service in the current and prior periods. Remeasurements are recognized in profit or loss in the period in which they arise.
(iii) Retirement benefits: defined contribution plans
When an employee has rendered service to the Group during a period, the Group recognizes the contribution payable to a defined contribution plan in exchange for that service as a liability (accrued expense), after deducting any contribution already paid. If the contribution already paid exceeds the contribution due for service before the end of the reporting period, the Group recognizes that excess as an asset (prepaid expense) to the extent that the prepayment will lead to a reduction in future payments or a cash refund.
(iv) Retirement benefits: defined benefit plans A defined benefit plan is a post-employment benefit plan other than a defined contribution plan. The Group’s net obligation in respect of defined benefit plans is calculated by estimating the amount of future benefit that employees have earned in return for their service in the current and prior periods, discounting that amount and deducting the fair value of plan assets. The calculation of defined benefit liability is performed annually by a qualified actuary using the projected unit credit method. When the calculation results in a potential asset for the Group, the recognized asset is limited to the present value of economic benefits available in the form of any future refunds from the plan or reductions in future contributions to the plan. To calculate the present value of economic benefits, consideration is given to any applicable minimum funding requirements. Remeasurements of the net defined benefit liability, which comprise actuarial gains and losses, the return on plan assets (excluding interest) and the effect of the assets ceiling (if any, excluding interest), are recognized immediately in OCI. The Group determines the net interest expense (income) on the net defined benefit liability (assets) for the period by applying the discount rate used to measure the defined benefit obligation at the beginning of the annual period to the then-net defined benefit liability (assets), taking into account any change in the net defined benefit liability (assets) during the period as a result of contributions and benefit payments. Net interest expense and other expenses related to defined benefit plans are recognized in profit or loss. When the benefits of plans are changed or when a plan is curtailed, the resulting change in benefit that relates to past service or the gain or loss on curtailments is recognized immediately in profit or loss. The Group recognized gains and losses on the settlement of a defined benefit plan when the settlement occurs.
LG HOUSEHOLD & HEALTH CARE, LTD. AND SUBSIDIARIES Notes to the Consolidated Financial Statements For the years ended December 31, 2013 and 2012
26
4. Significant Accounting Policies, Continued (18) Provisions
Provisions are recognized when the Group has a present legal or constructive obligation as a result of a past event, it is probable that an outflow of resources embodying economic benefits will be required to settle the obligation and a reliable estimate can be made of the amount of the obligation. The risks and uncertainties that inevitably surround many events and circumstances are taken into account in reaching the best estimate of a provision. Where the effect of the time value of money is material, provisions are determined at the present value of the expected future cash flows.
Provisions are reviewed at the end of each reporting period and adjusted to reflect the current best estimates. If it is no longer probable that an outflow of resources embodying economic benefits will be required to settle the obligation, the provision is reversed. A provision shall be used only for expenditures for which the provision was originally recognized.
(19) Foreign currencies
(i) Foreign currency transactions Transactions in foreign currencies are translated to the respective functional currencies of Group entities at exchange rates at the dates of the transactions. Monetary assets and liabilities denominated in foreign currencies are retranslated to the functional currency using the reporting date’s exchange rate. Non-monetary assets and liabilities denominated in foreign currencies that are measured at fair value are retranslated to the functional currency at the exchange rate at the date that the fair value was determined. Non--monetary items that are measured in terms of historical cost in a foreign currency are translated using the exchange rate at the date of the transaction.
Foreign exchange differences arising on the settlement of monetary items and foreign currency differences arising on retranslation of monetary items, except for differences arising on a financial liability designated as a cash flow hedge or a net investment in a foreign operation, are recognized in profit or loss. When gains or losses on non-monetary items are recognized in other comprehensive income, foreign exchange differences included in such gains or losses are recognized in other comprehensive income. When gains or losses on non-monetary items are recognized in profit or loss, exchange differences in such gains or losses are recognized in profit or loss.
(ii) Foreign operations
If the presentation currency of the Group is different from a foreign operation’s functional currency, the financial statements of the foreign operation are translated into the presentation currency using the following methods. The assets and liabilities of foreign operations, whose functional currency is not the currency of a hyperinflationary economy, are translated to presentation currency at exchange rates at the reporting date. The income and expenses of foreign operations are translated to functional currency at exchange rates at the dates of the transactions. Foreign currency differences are recognized in other comprehensive income. Any goodwill arising on the acquisition of a foreign operation and any fair value adjustments to the carrying amounts of assets and liabilities arising on the acquisition of that foreign operation is treated as assets and liabilities of the foreign operation. Thus they are expressed in the functional currency of the foreign operation and translated at the closing rate.
LG HOUSEHOLD & HEALTH CARE, LTD. AND SUBSIDIARIES Notes to the Consolidated Financial Statements For the years ended December 31, 2013 and 2012
27
4. Significant Accounting Policies, Continued
(19) Foreign currencies, continued
(ii) Foreign operations, continued When a foreign operation is disposed of, the relevant amount in the translation is transferred to profit or loss as part of the profit or loss on disposal. On the partial disposal of a subsidiary that includes a foreign operation, the relevant proportion of such cumulative amount is reattributed to non-controlling interest. In any other partial disposal of a foreign operation, the relevant proportion is reclassified to profit or loss.
(iii) Translation of net investment in a foreign operation If the settlement of a monetary item receivable from or payable to a foreign operation is neither planned nor likely to occur in the foreseeable future, then foreign currency difference arising from such item form part of the net investment in the foreign operation. Accordingly, such differences are recognized in OCI and reclassified from equity or profit or loss on disposal of the net investment.
(20) Equity capital
Common shares are classified as equity. Incremental costs directly attributable to the issuance of common shares and share options are recognized as a deduction from equity, net of any tax effects. Preference share capital is classified as equity if it is non-redeemable, or redeemable only at the Company’s option, and any dividends are discretionary. Dividends thereon are recognized as distributions within equity upon approval by the Company’s shareholders. When the Group repurchases its share capital, the amount of the consideration paid is recognized as a deduction from equity and classified as treasury shares. The profits or losses from the purchase, disposal, reissue, or retirement of treasury shares are not recognized as current profit or loss. If the Group acquires and retains treasury shares, the consideration paid or received is directly recognized in equity.
(21) Revenue
Revenue from sale of goods, rendering of services or use of the Group assets is measured at the fair value of the consideration received or receivable, and net of returns, trade discounts and volume rebates and are recognized as a reduction of revenue.
(i) Goods sold
Revenue is recognized when the significant risks and rewards of ownership have been transferred to the buyer, there is no continuing management involvement with the goods, and the amount of revenue can be measured reliably, the future economic benefit is probable to flow to the Group, the associated costs and possible return of goods can be estimated reliably, and the amount of revenue can be measured reliably.
(ii) Customer loyalty program
For customer loyalty programs, the fair value of the consideration received or receivable from the initial sale is allocated between the award credits (“points”) and the other components of the sale. The Group supplies all of the awards with its products. The amount allocated to the points is estimated by reference to the fair value of its products for which they could be redeemed, since the fair value of the points themselves is not directly measurable. The fair value of its products is estimated taking into account the expected redemption rate and the timing of such expected redemptions. Such amount is deferred and revenue is recognized only when the points are redeemed and the Group has fulfilled its obligations to supply its products.

LG HOUSEHOLD & HEALTH CARE, LTD. AND SUBSIDIARIES Notes to the Consolidated Financial Statements For the years ended December 31, 2013 and 2012
28
4. Significant Accounting Policies, Continued (21) Revenue, continued
(iii) Services Revenue from services rendered is recognized in profit or loss in proportion to the stage of completion of the transaction at the end of the reporting date.
(iv) Commissions
When the Group acts in the capacity of an agent rather than as the principal in a transaction, the revenue recognized is the net amount of commission made by the Group.
(v) Rental income Rental income from investment property is recognized in profit or loss on a straight-line basis over the term of the lease. Lease incentives granted are recognized as an integral part of the total rental income, over the term of the lease.
(22) Finance income and finance costs
Finance income comprises interest income on funds invested (including available-for-sale financial assets), dividend income, gains on the disposal of available-for-sale financial assets, changes in the fair value of financial assets at fair value through profit or loss, and gains on hedging instruments that are recognized in profit or loss. Interest income is recognized as it accrues in profit or loss, using the effective interest method. Dividend income is recognized in profit or loss on the date that the Group’s right to receive payment is established, which in the case of quoted securities is the ex-dividend date.
Finance costs comprise interest expense on borrowings, dividends on preference shares classified as liabilities, changes in the fair value of financial assets at fair value through profit or loss, impairment losses recognized on financial assets, and losses on hedging instruments that are recognized in profit or loss. Borrowing costs that are not directly attributable to the acquisition, construction or production of a qualifying asset are recognized in profit or loss using the effective interest method.
(23) Income taxes
Income tax expense comprises current and deferred tax. Current tax and deferred tax are recognized in profit or loss except to the extent that it relates to a business combination, or items recognized directly in equity or in other comprehensive income.
(i) Current tax
Current tax is the expected tax payable or receivable on the taxable profit or loss for the year, using tax rates enacted or substantively enacted at the end of the reporting period and any adjustment to tax payable in respect of previous years. The taxable profit is different from the accounting profit for the period since the taxable profit is calculated excluding the temporary differences, which will be taxable or deductible in determining taxable profit (tax loss) of future periods, and non-taxable or non-deductible items from the accounting profit.

LG HOUSEHOLD & HEALTH CARE, LTD. AND SUBSIDIARIES Notes to the Consolidated Financial Statements For the years ended December 31, 2013 and 2012
29
4. Significant Accounting Policies, Continued
(23) Income taxes, continued (ii) Deferred tax
The measurement of deferred tax liabilities and deferred tax assets reflects the tax consequences that would follow from the manner in which the Group expects, at the end of the reporting period, to recover or settle the carrying amount of its assets and liabilities. The Group recognizes a deferred tax liability for all taxable temporary differences associated with investments in subsidiaries, associates and joint ventures except to the extent that the Group is able to control the timing of the reversal of the temporary difference and it is probable that the temporary difference will not reverse in the foreseeable future. Deferred tax assets are recognized for deductible temporary differences to the extent that it is probable that future taxable profits will be available against which they can be used. The carrying amount of a deferred tax asset is reviewed at the end of each reporting period. And the group reduces the carrying amount to the extent that it is no longer probable that sufficient taxable profit will be available to allow the benefit of part or all of deferred tax asset to be utilized.
Deferred tax assets and liabilities are measured at the tax rates that are expected to apply to the period when the asset is realized or the liability is settled, based on tax rates (and tax laws) that have been enacted or substantively enacted by the end of the reporting period. The measurement of deferred tax liabilities and deferred tax assets reflects the tax consequences that would follow from the manner in which the Group expects, at the end of the reporting period to recover or settle the carrying amount of its assets and liabilities.
Deferred tax assets and liabilities are offset only if there is a legally enforceable right to offset the related current tax liabilities and assets, and they relate to income taxes levied by the same tax authority and they intend to settle current tax liabilities and assets on a net basis.
(24) Earnings per share
The Group presents basic earnings per share (EPS) data for its common shares. Basic EPS is calculated by dividing the profit or loss attributable to common shareholders of the Company by the weighted average number of common shares outstanding during the period, adjusted for owned shared held.
(25) New standards and interpretations not yet adopted
The following new standards, interpretations and amendments to existing standards have been published and are mandatory for the Group for annual periods beginning after January 1, 2013, and the Group has not early adopted them. The Group believes the impact of the amendments on the Group’s consolidated financial statements is not significant. Amendments to K-IFRS No. 1032, ‘Financial Instruments: Presentation’ The amendments clarified the application guidance related to ‘offsetting a financial asset and a financial liability’. The amendment is mandatorily effective for periods beginning on or after January 1, 2014 with earlier application permitted.
LG HOUSEHOLD & HEALTH CARE, LTD. AND SUBSIDIARIES Notes to the Consolidated Financial Statements For the years ended December 31, 2013 and 2012
30
5. Risk Management Policies
The Group has exposure to the following risks from its use of financial instruments: credit risk liquidity risk market risk
This note presents information about the Group’s exposure to each of the above risks, the Group’s objectives, policies and processes for measuring and managing risk, and the Group’s management of capital. Further quantitative disclosures are included throughout these consolidated financial statements.
(1) Financial risk management
1) Risk management framework Principal financial liabilities of the Group comprise debenture, commercial paper, trade payables and other payables and these financial liabilities arise from financing and purchasing activities for operating activities. The Group has a wide variety of financial assets, such as trade receivables, other receivables, loans, cash and cash equivalents generated from operating activities and available-for-sale financial assets. The purpose of managing financial risk is to identify the potential risk factors that may affect the Group’s financial performance, and minimize, eliminate and avoid them in order for them to be within an acceptable limit. Finance department of the Group manages the financial risk and identifies, evaluates and avoids risk by cooperating closely with the operating department. 2) Credit risk Credit risk is the risk of financial loss to incur to the Group when a customer or a financial instrument fails to perform its contractual obligations, and arises principally from the Group’s cash and cash equivalents and financial deposits as well as receivables from customers. The Group has deposits in several financial institutions with good credit ratings, thus the credit risks from those financial institutions are very limited.
(i) Trade receivables The Group’s exposure to credit risk is influenced mainly by the individual characteristics of each customer. However, management also considers the demographics of the Group’s customer base, including the default risk of the industry and country in which customers operate, as these factors may have an influence on credit risk, particularly in the currently deteriorating economic circumstances.
The Group’s major types of customers are agents and distributors. In principle, the Group trades with agents in collateral transaction, and establishes purchase limit only for each customer, that complies collection contract, according the policy with requiring approval. The Group grants purchase limit for a month only to distributor that complies collection contract. The Group reviews purchase limit monthly or quarterly. The customer, that does not meet the criteria of the Group’s credit, is available only upon payment of advance payment. In monitoring customer credit risk, customers are grouped according to their credit characteristics, including whether they are an individual or legal entity, whether they are a wholesale, retail or end-user customer, existence of previous financial difficulties. Trade and other receivables relate mainly to the Group’s agents and distributors. Customers that are graded as “high risk” are placed on a restricted customer list and future sales are made on a prepayment basis. The Group could require the collateral in respective of trade and other receivables and has a secured claim.

LG HOUSEHOLD & HEALTH CARE, LTD. AND SUBSIDIARIES Notes to the Consolidated Financial Statements For the years ended December 31, 2013 and 2012
31
5. Financial Risk Management Policies, Continued
(1) Financial risk management, continued
2) Credit risk, continued
(i) Trade receivables, continued The Group establishes an allowance for impairment that represents its estimate of incurred losses in respect of trade and other receivables. The main components of this allowance are a specific loss component that relates to individually significant exposures, and a collective loss component established for groups of similar assets in respect of losses that have been incurred but not yet identified. The collective loss allowance is determined based on historical data of payment statistics for similar financial assets.
(ii) Guarantees As described in note 45 (4), guarantees were only provided among Group entities as of December 31, 2013.
3) Liquidity risk Liquidity risk is the risk that the Group will encounter difficulty in meeting the obligations associated with its financial liabilities that are settled by delivering cash or another financial asset. The Group established short-term and long-term financial management plans to manage the liquidity risk, and continued to analyze cash outflows occurred with cash outflows budgeted, so as to match the maturity structure of financial assets with that of financial liabilities. The Group’s management determines that it will be possible to settle with the financial liabilities by its operating cash flows and cash inflows from financial assets. 4) Market risk (currency risk) Market risk is the risk that changes in market prices, such as foreign exchange rates, interest rates and equity prices will affect the Group’s income or the value of its holdings of financial instruments. The objective of market risk management is to manage and control market risk exposures within acceptable parameters, while optimizing the return. (i) Currency risk
The Group is exposed to currency risk on sales, purchases and borrowings that are denominated in a currency other than the functional currencies of Group entities. The currencies in which these transactions primarily are denominated are USD and JPY. Approximately 3.78% and 5.50% of sales for the years ended December 31, 2013 and 2012 respectively were denominated in a currency other that the functional currencies of the Group entities.
Management of the Group establishes the policy in order to manage the currency risk. The finance department reviews regularly net expected cash flows arising from recurring transactions and financing and currency risk arising from identified assets and liabilities. The finance department mitigates the currency risk by foreign currency borrowings or derivative financial instruments such as forward contract when it is necessary based on business plan.
With regard to other monetary assets and liabilities denominated in foreign currencies, the Group ensures that its net exposure is kept to an acceptable level by buying or selling foreign currencies at spot rates when necessary to address short-term imbalances.
(ii) Interest rate risk
The Group is exposed to interest rate risk of cash flow arising from floating rate borrowings. The Group has monitored interest rate risk arising from the interest rate fluctuation regularly and has maintained the balance of borrowings at floating rates and fixed rates to manage interest rate risk.
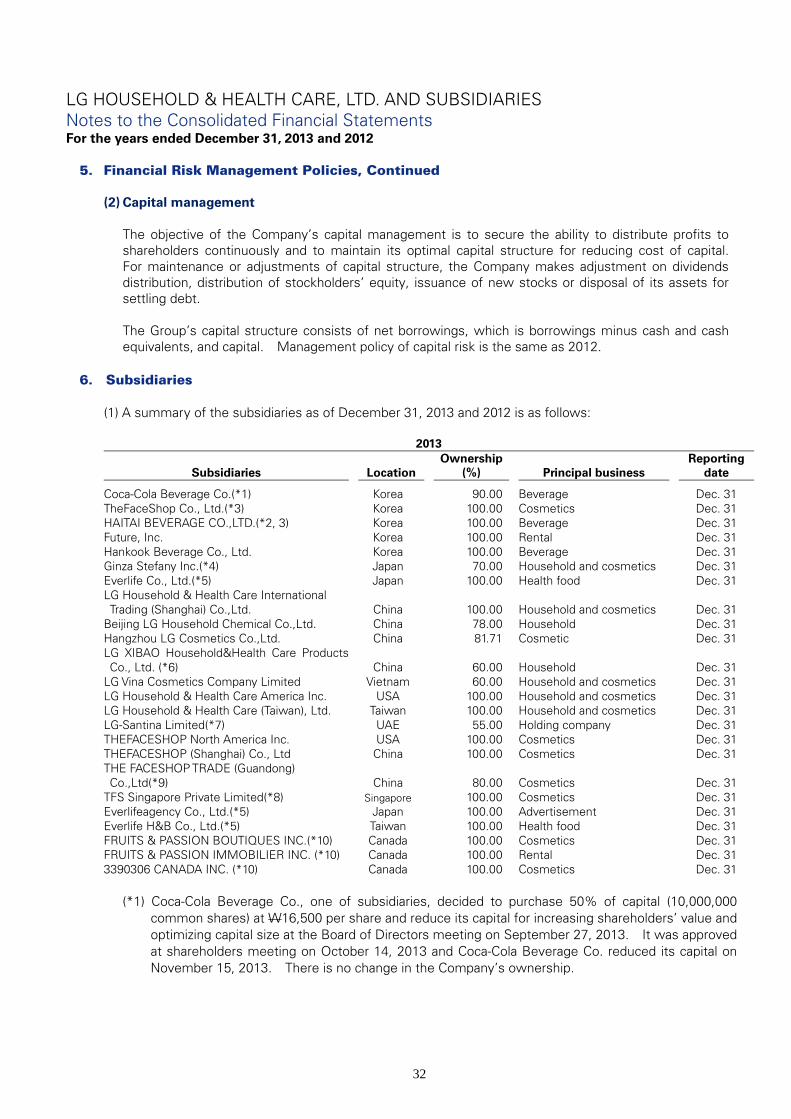
LG HOUSEHOLD & HEALTH CARE, LTD. AND SUBSIDIARIES Notes to the Consolidated Financial Statements For the years ended December 31, 2013 and 2012
32
5. Financial Risk Management Policies, Continued
(2) Capital management The objective of the Company’s capital management is to secure the ability to distribute profits to shareholders continuously and to maintain its optimal capital structure for reducing cost of capital. For maintenance or adjustments of capital structure, the Company makes adjustment on dividends distribution, distribution of stockholders’ equity, issuance of new stocks or disposal of its assets for settling debt. The Group’s capital structure consists of net borrowings, which is borrowings minus cash and cash equivalents, and capital. Management policy of capital risk is the same as 2012.
6. Subsidiaries
(1) A summary of the subsidiaries as of December 31, 2013 and 2012 is as follows:
2013
Subsidiaries
Location Ownership
(%)
Principal business Reporting
date
Coca-Cola Beverage Co.(*1) Korea 90.00 Beverage Dec. 31 TheFaceShop Co., Ltd.(*3) Korea 100.00 Cosmetics Dec. 31 HAITAI BEVERAGE CO.,LTD.(*2, 3) Korea 100.00 Beverage Dec. 31 Future, Inc. Korea 100.00 Rental Dec. 31 Hankook Beverage Co., Ltd. Korea 100.00 Beverage Dec. 31 Ginza Stefany Inc.(*4) Japan 70.00 Household and cosmetics Dec. 31 Everlife Co., Ltd.(*5) Japan 100.00 Health food Dec. 31 LG Household & Health Care International Trading (Shanghai) Co.,Ltd.
China
100.00 Household and cosmetics
Dec. 31
Beijing LG Household Chemical Co.,Ltd. China 78.00 Household Dec. 31 Hangzhou LG Cosmetics Co.,Ltd. China 81.71 Cosmetic Dec. 31 LG XIBAO Household&Health Care ProductsCo., Ltd. (*6)
China
60.00 Household
Dec. 31
LG Vina Cosmetics Company Limited Vietnam 60.00 Household and cosmetics Dec. 31 LG Household & Health Care America Inc. USA 100.00 Household and cosmetics Dec. 31 LG Household & Health Care (Taiwan), Ltd. Taiwan 100.00 Household and cosmetics Dec. 31 LG-Santina Limited(*7) UAE 55.00 Holding company Dec. 31 THEFACESHOP North America Inc. USA 100.00 Cosmetics Dec. 31 THEFACESHOP (Shanghai) Co., Ltd China 100.00 Cosmetics Dec. 31 THE FACESHOP TRADE (Guandong) Co.,Ltd(*9) China
80.00 Cosmetics
Dec. 31
TFS Singapore Private Limited(*8) Singapore 100.00 Cosmetics Dec. 31 Everlifeagency Co., Ltd.(*5) Japan 100.00 Advertisement Dec. 31 Everlife H&B Co., Ltd.(*5) Taiwan 100.00 Health food Dec. 31 FRUITS & PASSION BOUTIQUES INC.(*10) Canada 100.00 Cosmetics Dec. 31 FRUITS & PASSION IMMOBILIER INC. (*10) Canada 100.00 Rental Dec. 31 3390306 CANADA INC. (*10) Canada 100.00 Cosmetics Dec. 31
(*1) Coca-Cola Beverage Co., one of subsidiaries, decided to purchase 50% of capital (10,000,000 common shares) at W16,500 per share and reduce its capital for increasing shareholders’ value and optimizing capital size at the Board of Directors meeting on September 27, 2013. It was approved at shareholders meeting on October 14, 2013 and Coca-Cola Beverage Co. reduced its capital on November 15, 2013. There is no change in the Company’s ownership.
LG HOUSEHOLD & HEALTH CARE, LTD. AND SUBSIDIARIES Notes to the Consolidated Financial Statements For the years ended December 31, 2013 and 2012
33
6. Subsidiaries, Continued (1) A summary of the subsidiaries as of December 31, 2013 and 2012 is as follows, continued:
(*2) HAITAI BEVERAGE CO., LTD, one of subsidiaries, decided to reduce 54% of capital for financial
structure improvement through disposing accumulated deficit at the Board of Directors meeting on February 20, 2013, and completed the reduction on March 20, 2013. After capital reduction, the total number of shares issued and capital stock are 16,025,480 shares and W80,127 million respectively and there is no change in the Company’s ownership.
(*3) At the Board of Directors meeting on February 21, 2013, TheFaceShop Co., Ltd. and HAITAI
BEVERAGE CO., LTD, subsidiaries, decided to merge with Violet Dream Inc. and Diamond Pure Water co., Ltd., which were also subsidiaries, respectively to actively respond to the changes in management environment and optimize efficiency, and the mergers were completed on March 28, 2013. TheFaceShop Co., Ltd. and HAITAI BEVERAGE CO., LTD issued 256,459 common shares (merge ratio 1 : 6.0770892) and 1,502,846 common shares (merge ratio 1 : 751.4231105) respectively and there is no change in the Company’s ownership.
(*4) The Company obtained control of Ginza Stefany Inc. by acquiring 70% shares on February 8, 2012
and granted a put option of remaining 30% share to non-controlling interest holder pursuant to the share purchase agreement. As non-controlling shareholder had the right to sell the remaining 30% shares, on acquisition date, the Company accounted for Ginza Stefany Inc. as a 100% owned subsidiary in accordance with K-IFRS No 1103, ‘Business Combination’ and K-IFRS No. 1032, ‘Financial Instruments: Presentation’ and recognized the liability payable to the shareholder of the remaining 30% shares as financial liability in the consolidated statements of financial position.
(*5) The Company obtained control of Everlife Co., Ltd. by acquiring 100% shares on January 25, 2013.
As a result of this acquisition, Everlifeagency Co., Ltd. and Everlife H&B Co., Ltd. were newly included as consolidated subsidiaries.
(*6) The Company established LG XIBAO Household&Health Care Products Co., Ltd. and obtained 60%
shares on May 20, 2013.
(*7) The Company established LG SANTINA, LTD., which is located in United Arab Emirates, to expand its business in Middle East and obtained 55% shares on April 10, 2013.
(*8) TheFaceShop Co., Ltd., one of the subsidiaries, obtained control of TFS Singapore Private Limited
by acquiring 100% shares on March 28, 2013. (*9) TheFaceShop Co., Ltd., one of the subsidiaries, established THE FACESHOP TRADE (Guandong)
Co.,Ltd. and obtained 80% shares on September 5, 2013.
(*10) TheFaceShop Co., Ltd., one of the subsidiaries, obtained of FRUITS & PASSION BOUTIQUES INC., FRUITS & PASSION IMMOBILIER INC. and 3390306 CANANA INC., which are located in Canada, to retain customer base for North American market by acquiring 100% shares on July 19, 2013.
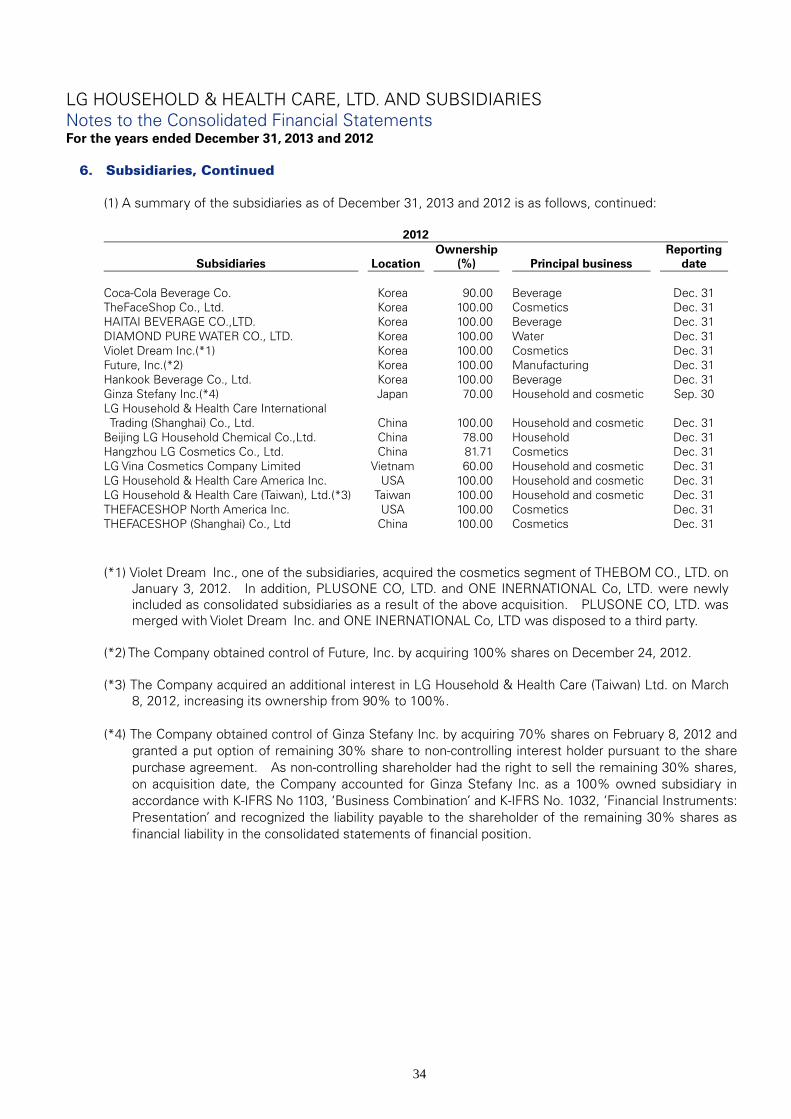
LG HOUSEHOLD & HEALTH CARE, LTD. AND SUBSIDIARIES Notes to the Consolidated Financial Statements For the years ended December 31, 2013 and 2012
34
6. Subsidiaries, Continued
(1) A summary of the subsidiaries as of December 31, 2013 and 2012 is as follows, continued:
2012
Subsidiaries
Location Ownership
(%)
Principal business Reporting
date
Coca-Cola Beverage Co. Korea 90.00 Beverage Dec. 31 TheFaceShop Co., Ltd. Korea 100.00 Cosmetics Dec. 31 HAITAI BEVERAGE CO.,LTD. Korea 100.00 Beverage Dec. 31 DIAMOND PURE WATER CO., LTD. Korea 100.00 Water Dec. 31 Violet Dream Inc.(*1) Korea 100.00 Cosmetics Dec. 31 Future, Inc.(*2) Korea 100.00 Manufacturing Dec. 31 Hankook Beverage Co., Ltd. Korea 100.00 Beverage Dec. 31 Ginza Stefany Inc.(*4) Japan 70.00 Household and cosmetic Sep. 30 LG Household & Health Care International Trading (Shanghai) Co., Ltd.
China
100.00 Household and cosmetic
Dec. 31
Beijing LG Household Chemical Co.,Ltd. China 78.00 Household Dec. 31 Hangzhou LG Cosmetics Co., Ltd. China 81.71 Cosmetics Dec. 31 LG Vina Cosmetics Company Limited Vietnam 60.00 Household and cosmetic Dec. 31 LG Household & Health Care America Inc. USA 100.00 Household and cosmetic Dec. 31 LG Household & Health Care (Taiwan), Ltd.(*3) Taiwan 100.00 Household and cosmetic Dec. 31 THEFACESHOP North America Inc. USA 100.00 Cosmetics Dec. 31 THEFACESHOP (Shanghai) Co., Ltd China 100.00 Cosmetics Dec. 31 (*1) Violet Dream Inc., one of the subsidiaries, acquired the cosmetics segment of THEBOM CO., LTD. on
January 3, 2012. In addition, PLUSONE CO, LTD. and ONE INERNATIONAL Co, LTD. were newly included as consolidated subsidiaries as a result of the above acquisition. PLUSONE CO, LTD. was merged with Violet Dream Inc. and ONE INERNATIONAL Co, LTD was disposed to a third party.
(*2) The Company obtained control of Future, Inc. by acquiring 100% shares on December 24, 2012. (*3) The Company acquired an additional interest in LG Household & Health Care (Taiwan) Ltd. on March
8, 2012, increasing its ownership from 90% to 100%. (*4) The Company obtained control of Ginza Stefany Inc. by acquiring 70% shares on February 8, 2012 and
granted a put option of remaining 30% share to non-controlling interest holder pursuant to the share purchase agreement. As non-controlling shareholder had the right to sell the remaining 30% shares, on acquisition date, the Company accounted for Ginza Stefany Inc. as a 100% owned subsidiary in accordance with K-IFRS No 1103, ‘Business Combination’ and K-IFRS No. 1032, ‘Financial Instruments: Presentation’ and recognized the liability payable to the shareholder of the remaining 30% shares as financial liability in the consolidated statements of financial position.
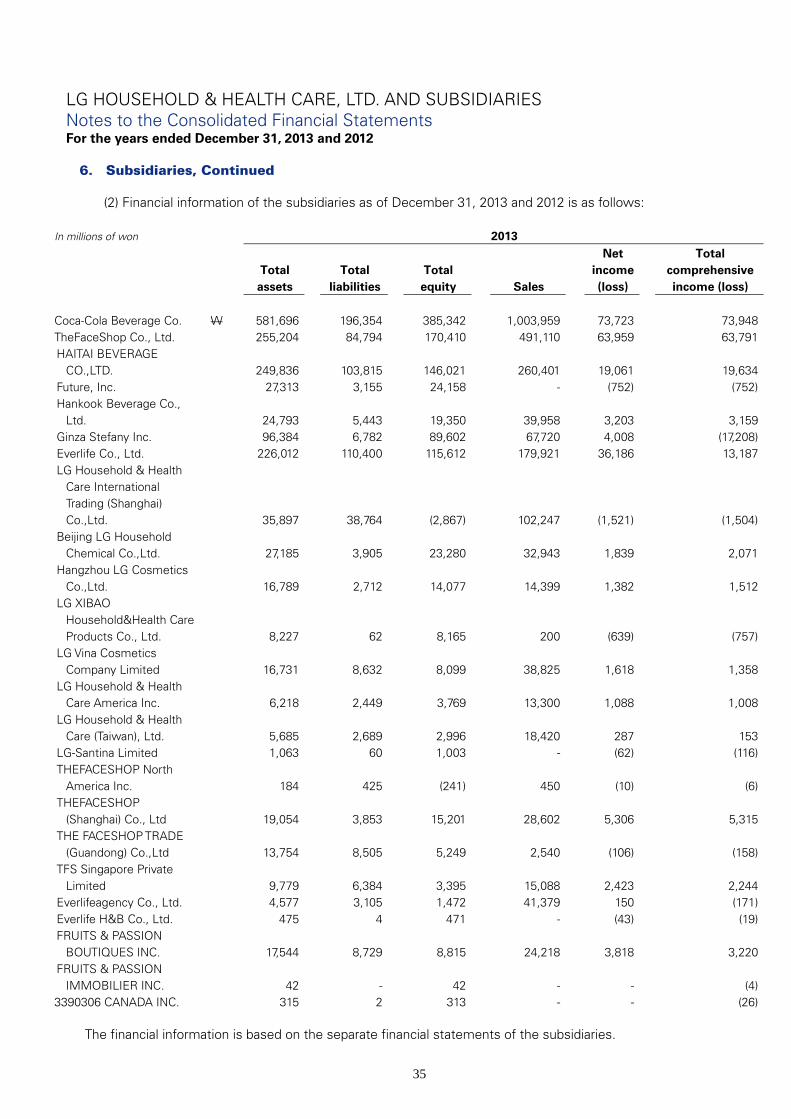
LG HOUSEHOLD & HEALTH CARE, LTD. AND SUBSIDIARIES Notes to the Consolidated Financial Statements For the years ended December 31, 2013 and 2012
35
6. Subsidiaries, Continued
(2) Financial information of the subsidiaries as of December 31, 2013 and 2012 is as follows:
In millions of won 2013
Total assets
Total liabilities
Total equity Sales
Net income (loss)
Total comprehensive income (loss)
Coca-Cola Beverage Co. W 581,696 196,354 385,342 1,003,959 73,723 73,948 TheFaceShop Co., Ltd. 255,204 84,794 170,410 491,110 63,959 63,791 HAITAI BEVERAGE
CO.,LTD.
249,836 103,815 146,021 260,401 19,061 19,634 Future, Inc. 27,313 3,155 24,158 - (752) (752) Hankook Beverage Co.,
Ltd.
24,793 5,443 19,350 39,958 3,203 3,159 Ginza Stefany Inc. 96,384 6,782 89,602 67,720 4,008 (17,208) Everlife Co., Ltd. 226,012 110,400 115,612 179,921 36,186 13,187 LG Household & Health
Care International Trading (Shanghai) Co.,Ltd.
35,897 38,764 (2,867) 102,247 (1,521) (1,504) Beijing LG Household
Chemical Co.,Ltd.
27,185 3,905 23,280 32,943 1,839 2,071 Hangzhou LG Cosmetics
Co.,Ltd.
16,789 2,712 14,077 14,399 1,382 1,512 LG XIBAO
Household&Health Care Products Co., Ltd.
8,227 62 8,165 200 (639) (757) LG Vina Cosmetics
Company Limited
16,731 8,632 8,099 38,825 1,618 1,358 LG Household & Health
Care America Inc.
6,218 2,449 3,769 13,300 1,088 1,008 LG Household & Health
Care (Taiwan), Ltd.
5,685 2,689 2,996 18,420 287 153 LG-Santina Limited 1,063 60 1,003 - (62) (116) THEFACESHOP North
America Inc.
184 425 (241) 450 (10) (6) THEFACESHOP
(Shanghai) Co., Ltd
19,054 3,853 15,201 28,602 5,306 5,315 THE FACESHOP TRADE
(Guandong) Co.,Ltd
13,754 8,505 5,249 2,540 (106) (158) TFS Singapore Private
Limited
9,779 6,384 3,395 15,088 2,423 2,244 Everlifeagency Co., Ltd. 4,577 3,105 1,472 41,379 150 (171) Everlife H&B Co., Ltd. 475 4 471 - (43) (19) FRUITS & PASSION
BOUTIQUES INC.
17,544 8,729 8,815 24,218 3,818 3,220 FRUITS & PASSION
IMMOBILIER INC.
42 - 42 - - (4) 3390306 CANADA INC. 315 2 313 - - (26)
The financial information is based on the separate financial statements of the subsidiaries.
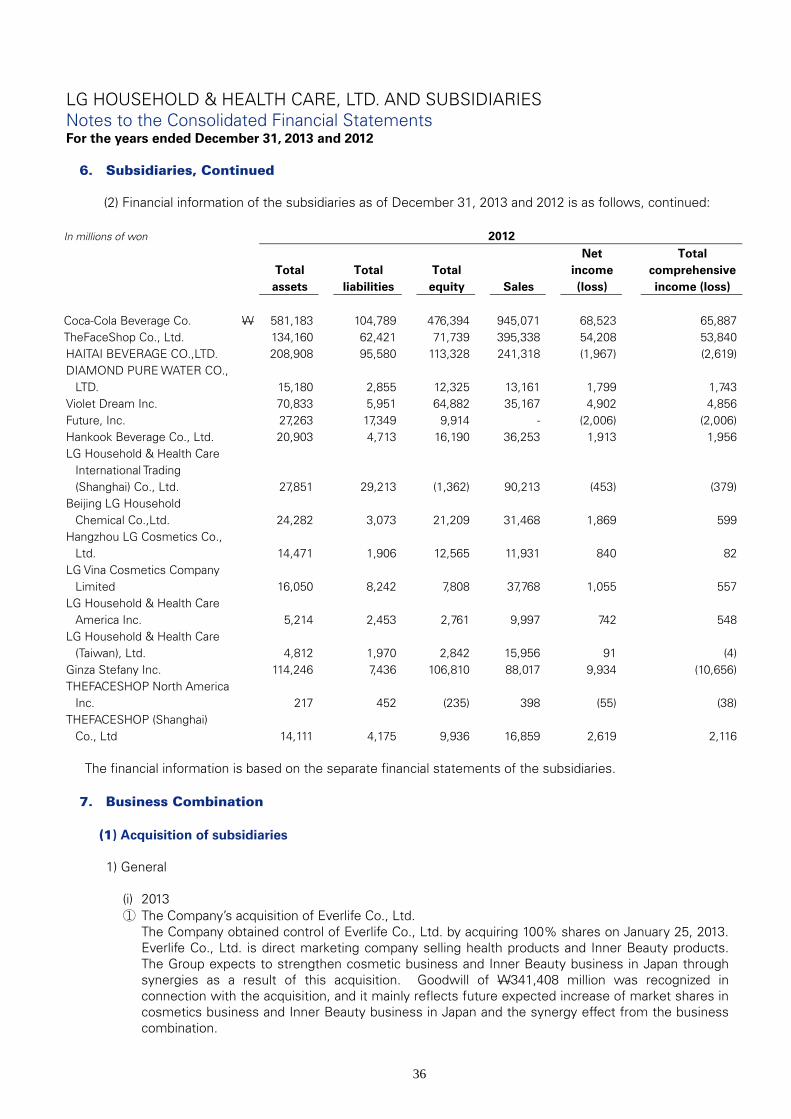
LG HOUSEHOLD & HEALTH CARE, LTD. AND SUBSIDIARIES Notes to the Consolidated Financial Statements For the years ended December 31, 2013 and 2012
36
6. Subsidiaries, Continued
(2) Financial information of the subsidiaries as of December 31, 2013 and 2012 is as follows, continued:
In millions of won 2012
Total assets
Total liabilities
Total equity Sales
Net income (loss)
Total comprehensive income (loss)
Coca-Cola Beverage Co. W 581,183 104,789 476,394 945,071 68,523 65,887 TheFaceShop Co., Ltd. 134,160 62,421 71,739 395,338 54,208 53,840 HAITAI BEVERAGE CO.,LTD. 208,908 95,580 113,328 241,318 (1,967) (2,619) DIAMOND PURE WATER CO.,
LTD.
15,180 2,855 12,325 13,161 1,799 1,743 Violet Dream Inc. 70,833 5,951 64,882 35,167 4,902 4,856 Future, Inc. 27,263 17,349 9,914 - (2,006) (2,006) Hankook Beverage Co., Ltd. 20,903 4,713 16,190 36,253 1,913 1,956 LG Household & Health Care
International Trading (Shanghai) Co., Ltd.
27,851 29,213 (1,362) 90,213 (453) (379) Beijing LG Household
Chemical Co.,Ltd.
24,282 3,073 21,209 31,468 1,869 599 Hangzhou LG Cosmetics Co.,
Ltd.
14,471 1,906 12,565 11,931 840 82 LG Vina Cosmetics Company
Limited
16,050 8,242 7,808 37,768 1,055 557 LG Household & Health Care
America Inc.
5,214 2,453 2,761 9,997 742 548 LG Household & Health Care
(Taiwan), Ltd.
4,812 1,970 2,842 15,956 91 (4) Ginza Stefany Inc. 114,246 7,436 106,810 88,017 9,934 (10,656) THEFACESHOP North America
Inc.
217 452 (235) 398 (55) (38) THEFACESHOP (Shanghai)
Co., Ltd
14,111 4,175 9,936 16,859 2,619 2,116
The financial information is based on the separate financial statements of the subsidiaries.
7. Business Combination (1) Acquisition of subsidiaries
1) General
(i) 2013 ① The Company’s acquisition of Everlife Co., Ltd.
The Company obtained control of Everlife Co., Ltd. by acquiring 100% shares on January 25, 2013. Everlife Co., Ltd. is direct marketing company selling health products and Inner Beauty products. The Group expects to strengthen cosmetic business and Inner Beauty business in Japan through synergies as a result of this acquisition. Goodwill of W341,408 million was recognized in connection with the acquisition, and it mainly reflects future expected increase of market shares in cosmetics business and Inner Beauty business in Japan and the synergy effect from the business combination.

LG HOUSEHOLD & HEALTH CARE, LTD. AND SUBSIDIARIES Notes to the Consolidated Financial Statements For the years ended December 31, 2013 and 2012
37
7. Business Combination, Continued (1) Acquisition of subsidiaries, continued
1) General, continued
(i) 2013, continued
② TheFaceShop Co., Ltd.’s acquisition of TFS Singapore Private Limited TheFaceShop Co., Ltd., one of the subsidiaries, obtained control of TFS Singapore Private Limited by acquiring 100% shares on March 28, 2013. TFS Singapore Private Limited is managing twenty stores in Singapore. The Group plans to expand cosmetics business in Association of South East Asian Nations and India market through this business combination. Goodwill of W13,925 million was recognized in connection with the acquisition, and it represents increase of market shares in ASEAN and India market and the synergy effect from the business combination.
③ TheFaceShop Co., Ltd.’s acquisition of FRUITS & PASSION BOUTIQUES INC.
TheFaceShop Co., Ltd., one of the subsidiaries, obtained control of FRUITS & PASSIONBOUTIQUES INC., FRUITS & PASSION IMMOBILIER INC. and 3390306 CANADA INC., which are located in Canada, by acquiring 100% shares on July 19, 2013. Above mentioned companies are managing 87 stores in Canada and 22 stores in other countries. The Group expects to retain customer base for North American market. TheFaceShop Co., Ltd. acquired exclusive distribution rights and remaining assets from SL Life Co., which was exclusive distributor related with products of FRUITS & PASSIONBOUTIQUES INC. in Korea.
Goodwill of W12,253 million was recognized in connection with the acquisition, and it represents increase of market shares in North American market and the synergy effect from the business combination.
④ The Company and HAITAI BEVERAGE CO.,LTD.’ acquisition of drink segment
The Company and HAITAI BEVERAGE CO., LTD., one of subsidiaries, entered into a contract to acquire drink segment of YUNGJIN PHARM CO., LTD (third party) on the October 16, 2013 and completed acquisition on December 5, 2013. Goodwill of W1,580 million was recognized in connection with the acquisition, and it is expected to enhance the Group’s competitiveness in healthy and functional drink market and to create synergy effect.
(ii) 2012
① The Company’s acquisition of Ginza Stefany Inc.
The Company obtained the control of Ginza Stefany Inc. by acquiring 70% shares on February 8, 2012. The Company granted a put option to the holder of the remaining 30% shares according to the share purchase agreement. As non-controlling shareholder had the right to sell the remaining 30% shares, on acquisition date, the Company accounted for Ginza Stefany Inc. as a 100% owned subsidiary in accordance with K-IFRS No 1103, ‘Business Combination’ and K-IFRS No. 1032, ‘Financial Instruments: Presentation’ and recognized the liability payable to the shareholder of the remaining 30% shares as financial liability in the consolidated statements of financial position. With the business combination, the Group expects to expand business of cosmetics and household products in Japan. Goodwill of W 55,657 million was recognized in connection with the acquisition, and it is expected to increase the Group’s market shares in cosmetics and household products in Japan and create synergy effect.

LG HOUSEHOLD & HEALTH CARE, LTD. AND SUBSIDIARIES Notes to the Consolidated Financial Statements For the years ended December 31, 2013 and 2012
38
7. Business Combination, Continued (1) Acquisition of subsidiaries, continued
1) General, continued
(ii) 2012, continued ② Violet Dream Inc.’s acquisition of cosmetic segment of THEBOM CO,. LTD
Violet Dream Inc., one of the subsidiaries, acquired the cosmetics segment of THEBOM CO., LTD. on January 3, 2012. In addition, PLUSONE CO, LTD. and ONE INERNATIONAL Co, LTD. were newly included as consolidated subsidiaries as a result of the above acquisition. Goodwill of W 20,265 million was recognized in connection with the acquisition, and it is expected to enhance the Group’s competitiveness through introduction of external special artist and brands and created synergy effect. As described on note 7. (3) and 7. (4), PLUSONE CO, LTD. was merged with Violet Dream Inc. and ONE INTERNATIONAL Co., LTD. was disposed to the third party respectively.
③ The Company’s acquisition of Future, Inc.
The Company obtained the control of Future, Inc. by acquiring 100% shares on December 24, 2012 to establish future growth base such as institute, logistics center and production bases. Goodwill of W10,846 million was recognized in connection with the acquisition, which is expected to provide future growth synergy.
2) Identifiable assets and liabilities acquired
(i) 2013
① Everlife Co., Ltd.
In millions of won Amount Cash and cash equivalents W 25,789 Trade receivables(*1) 10,246 Inventories 9,306 Property, plant and equipment 3,336 Intangible assets(*2) 157,227 Other assets(*3) 4,775 Trade payables (3,806) Other payables (10,804) Current portion of long-term liabilities (37,082) Long-term borrowings (129,785) Deferred tax liabilities (53,014) Other liabilities (11,209) Net liabilities W (35,021) (*1) The gross contractual amounts of trade receivables are W10,321 million and allowance for
doubtful account amounting W75 million are recognized for receivables not probable to be collected.
(*2) Fair value of intangible assets is based on the valuation report of an independent external
appraiser as of acquisition date. (*3) The gross contractual amounts of other receivables and long-term other receivables of other
assets are W839 million and allowance for doubtful account amounting W69 million are recognized for other receivables not probable to be collected.
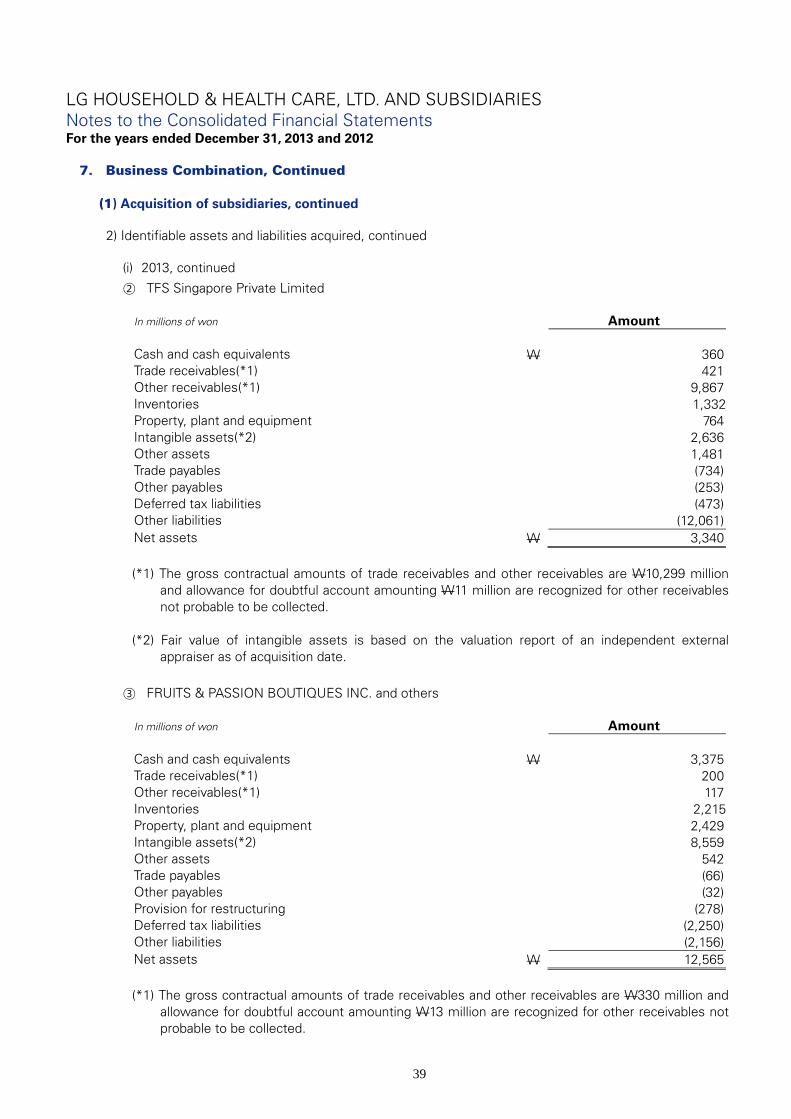
LG HOUSEHOLD & HEALTH CARE, LTD. AND SUBSIDIARIES Notes to the Consolidated Financial Statements For the years ended December 31, 2013 and 2012
39
7. Business Combination, Continued (1) Acquisition of subsidiaries, continued
2) Identifiable assets and liabilities acquired, continued
(i) 2013, continued
② TFS Singapore Private Limited
In millions of won Amount Cash and cash equivalents W 360 Trade receivables(*1) 421 Other receivables(*1) 9,867 Inventories 1,332Property, plant and equipment 764 Intangible assets(*2) 2,636 Other assets 1,481 Trade payables (734) Other payables (253) Deferred tax liabilities (473) Other liabilities (12,061) Net assets W 3,340 (*1) The gross contractual amounts of trade receivables and other receivables are W10,299 million
and allowance for doubtful account amounting W11 million are recognized for other receivables not probable to be collected.
(*2) Fair value of intangible assets is based on the valuation report of an independent external
appraiser as of acquisition date.
③ FRUITS & PASSION BOUTIQUES INC. and others
In millions of won Amount Cash and cash equivalents W 3,375 Trade receivables(*1) 200 Other receivables(*1) 117 Inventories 2,215Property, plant and equipment 2,429 Intangible assets(*2) 8,559 Other assets 542 Trade payables (66) Other payables (32) Provision for restructuring (278) Deferred tax liabilities (2,250) Other liabilities (2,156) Net assets W 12,565 (*1) The gross contractual amounts of trade receivables and other receivables are W330 million and
allowance for doubtful account amounting W13 million are recognized for other receivables not probable to be collected.
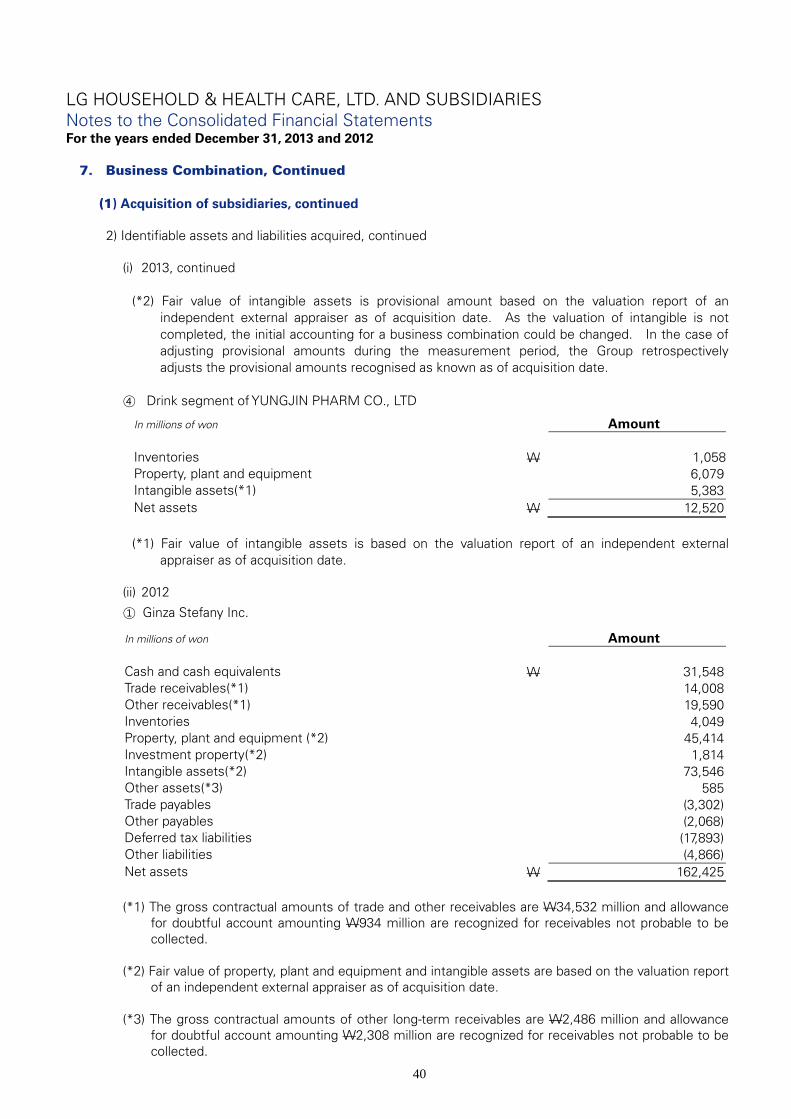
LG HOUSEHOLD & HEALTH CARE, LTD. AND SUBSIDIARIES Notes to the Consolidated Financial Statements For the years ended December 31, 2013 and 2012
40
7. Business Combination, Continued (1) Acquisition of subsidiaries, continued
2) Identifiable assets and liabilities acquired, continued
(i) 2013, continued
(*2) Fair value of intangible assets is provisional amount based on the valuation report of an
independent external appraiser as of acquisition date. As the valuation of intangible is not completed, the initial accounting for a business combination could be changed. In the case of adjusting provisional amounts during the measurement period, the Group retrospectively adjusts the provisional amounts recognised as known as of acquisition date.
④ Drink segment of YUNGJIN PHARM CO., LTD
In millions of won Amount
Inventories W 1,058Property, plant and equipment 6,079 Intangible assets(*1) 5,383 Net assets W 12,520 (*1) Fair value of intangible assets is based on the valuation report of an independent external
appraiser as of acquisition date. (ii) 2012
① Ginza Stefany Inc.
In millions of won Amount
Cash and cash equivalents W 31,548 Trade receivables(*1) 14,008 Other receivables(*1) 19,590 Inventories 4,049 Property, plant and equipment (*2) 45,414 Investment property(*2) 1,814 Intangible assets(*2) 73,546 Other assets(*3) 585 Trade payables (3,302) Other payables (2,068) Deferred tax liabilities (17,893) Other liabilities (4,866) Net assets W 162,425
(*1) The gross contractual amounts of trade and other receivables are W34,532 million and allowance for doubtful account amounting W934 million are recognized for receivables not probable to be collected.
(*2) Fair value of property, plant and equipment and intangible assets are based on the valuation report
of an independent external appraiser as of acquisition date. (*3) The gross contractual amounts of other long-term receivables are W2,486 million and allowance
for doubtful account amounting W2,308 million are recognized for receivables not probable to be collected.

LG HOUSEHOLD & HEALTH CARE, LTD. AND SUBSIDIARIES Notes to the Consolidated Financial Statements For the years ended December 31, 2013 and 2012
41
7. Business Combination, Continued (1) Acquisition of subsidiaries, continued
2) Identifiable assets and liabilities acquired, continued
(ii) 2012, continued
② THEBOM Co., Ltd.
In millions of won Amount Cash and cash equivalents W 293 Trade receivables(*1) 5,628 Other receivables(*1) 33 Inventories 2,530 Property, plant and equipment(*2) 298 Intangible assets(*2) 33,181 Other assets 218 Trade payables (3,010) Other payables (1,236) Short-term borrowings (1,100) Post-employment benefit liabilities (91) Other liabilities (2,294) Net assets W 34,450
(*1) The gross contractual amounts of trade and other receivables are W6,427 million and allowance
for doubtful account amounting W766 million are recognized for receivables not probable to be collected.
(*2) Fair value of property, plant and equipment and intangible assets are based on the valuation
report of an independent external appraiser as of acquisition date.
③ Future, Inc. In millions of won Amount Cash and cash equivalents W 4 Property, plant and equipment(*1,3) 78,323 Other assets 2 Short-term borrowings (334) Provision for other losses (13,907) Contingent liability(*2,3) (11,345) Deferred tax liability(*3) (14,035) Other liability (304) Net assets(*3) W 38,404
(*1) Fair value of property, plant and equipment are based on the valuation report of an independent external appraiser as of acquisition date.
(*2) The Group recognized a provision of W11,345 million related to contingent liability for damage suit,
which occurred before acquiring the shares of Future, Inc., as of acquisition date.
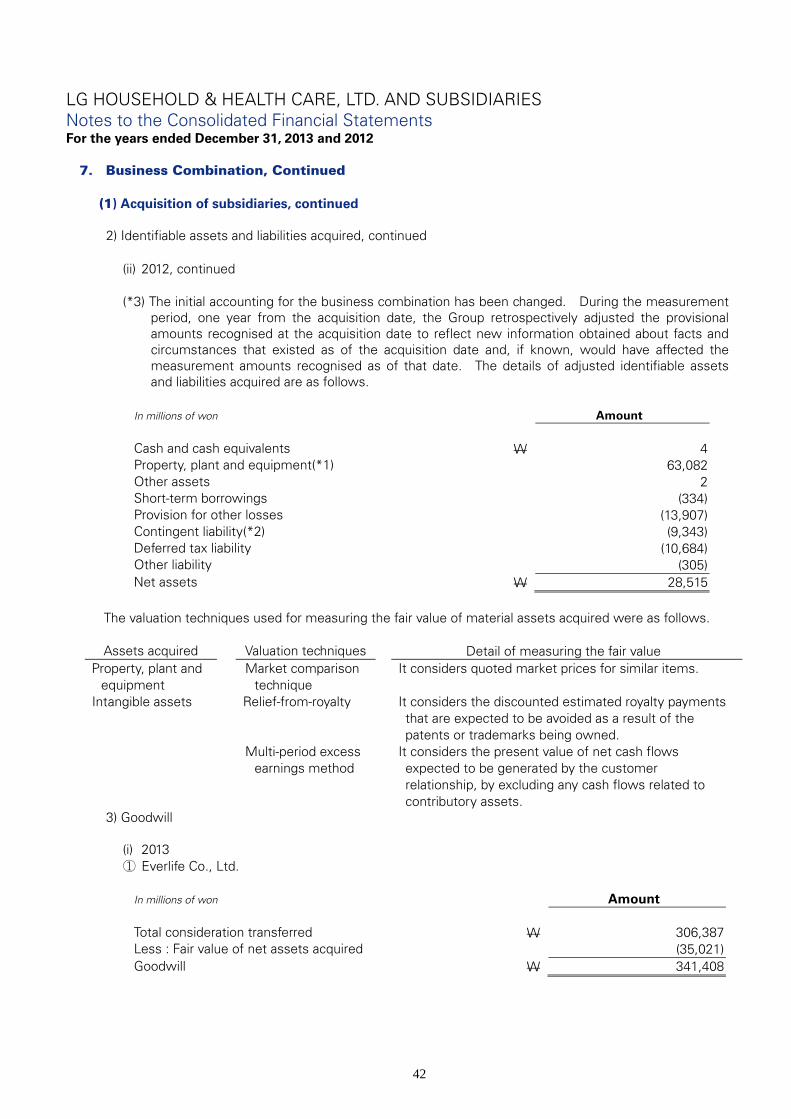
LG HOUSEHOLD & HEALTH CARE, LTD. AND SUBSIDIARIES Notes to the Consolidated Financial Statements For the years ended December 31, 2013 and 2012
42
7. Business Combination, Continued (1) Acquisition of subsidiaries, continued
2) Identifiable assets and liabilities acquired, continued
(ii) 2012, continued
(*3) The initial accounting for the business combination has been changed. During the measurement period, one year from the acquisition date, the Group retrospectively adjusted the provisional amounts recognised at the acquisition date to reflect new information obtained about facts and circumstances that existed as of the acquisition date and, if known, would have affected the measurement amounts recognised as of that date. The details of adjusted identifiable assets and liabilities acquired are as follows.
In millions of won Amount Cash and cash equivalents W 4 Property, plant and equipment(*1) 63,082 Other assets 2 Short-term borrowings (334) Provision for other losses (13,907) Contingent liability(*2) (9,343) Deferred tax liability (10,684) Other liability (305) Net assets W 28,515
The valuation techniques used for measuring the fair value of material assets acquired were as follows.
Assets acquired Valuation techniques Detail of measuring the fair value Property, plant and
equipment Market comparison
technique It considers quoted market prices for similar items.
Intangible assets Relief-from-royalty It considers the discounted estimated royalty payments that are expected to be avoided as a result of the patents or trademarks being owned.
Multi-period excess earnings method
It considers the present value of net cash flows expected to be generated by the customer relationship, by excluding any cash flows related to contributory assets.
3) Goodwill
(i) 2013 ① Everlife Co., Ltd.
In millions of won Amount Total consideration transferred W 306,387 Less : Fair value of net assets acquired (35,021) Goodwill W 341,408

LG HOUSEHOLD & HEALTH CARE, LTD. AND SUBSIDIARIES Notes to the Consolidated Financial Statements For the years ended December 31, 2013 and 2012
43
7. Business Combination, Continued (1) Acquisition of subsidiaries, continued
3) Goodwill, continued
(i) 2013, continued
② TFS Singapore Private Limited
In millions of won Amount Total consideration transferred W 17,265 Less : Fair value of net assets 3,340 Goodwill W 13,925
③ FRUITS & PASSION BOUTIQUES INC. and others
In millions of won Amount Total consideration transferred W 24,818 Less : Fair value of net assets 12,565 Goodwill W 12,253
④ Segment of YUNGJIN PHARM CO., LTD
In millions of won Amount Total consideration transferred W 14,100 Less : Fair value of net assets 12,520 Goodwill W 1,580
(ii) 2012
① Ginza Stefany Inc.
In millions of won Amount Total consideration transferred W 218,082 Less : Fair value of identifiable net assets (162,425) Goodwill W 55,657
② THEBOM CO,. LTD
In millions of won Amount Total consideration transferred W 54,715 Less : Fair value of identifiable net assets (34,450) Goodwill W 20,265

LG HOUSEHOLD & HEALTH CARE, LTD. AND SUBSIDIARIES Notes to the Consolidated Financial Statements For the years ended December 31, 2013 and 2012
44
7. Business Combination, Continued (1) Acquisition of subsidiaries, continued
3) Goodwill, continued
(ii) 2012, continued
③ Future, Inc. In millions of won Amount Total consideration transferred W 49,250 Fair value of identifiable net assets (38,404) Goodwill(*1) W 10,846
(*1) As a result of adjusting identifiable assets and liabilities acquired during measurement period, goodwill increased from W10,846 to W20,735.
4) Net cash flows from acquisitions of subsidiary
(i) 2013 ① Everlife Co., Ltd.
In millions of won Amount Total consideration transferred W 306,387 Less : Cash and cash equivalents of subsidiary acquired 25,789 Net cash and cash equivalents paid to obtain control W 280,598
② TFS Singapore Private Limited
In millions of won Amount Total consideration transferred W 17,265 Less : Cash and cash equivalents of subsidiary acquired 360 Net cash and cash equivalents paid to obtain control W 16,905
③ FRUITS & PASSION BOUTIQUES INC. and others
In millions of won Amount Total consideration transferred W 24,818 Less : Cash and cash equivalents of subsidiary acquired 3,375 Net cash and cash equivalents paid to obtain control W 21,443
④ Segment of YUNGJIN PHARM CO., LTD
In millions of won Amount Total consideration transferred W 14,100 Less : Cash and cash equivalents of segment acquired - Net cash and cash equivalents paid to obtain control W 14,100

LG HOUSEHOLD & HEALTH CARE, LTD. AND SUBSIDIARIES Notes to the Consolidated Financial Statements For the years ended December 31, 2013 and 2012
45
7. Business Combination, Continued (1) Acquisition of subsidiaries, continued
4) Net cash flows from acquisitions of subsidiary, continued
(ii) 2012
① Ginza Stefany Inc. In millions of won Amount Total consideration transferred W 218,082 Less : Other-payables for remaining shares (84,301) Less : Cash and cash equivalents of subsidiary acquired (31,548) Net cash and cash equivalents paid to obtain control W 102,233
② THEBOM ,. LTD In millions of won Amount Total consideration transferred W 54,715 Less : Amount paid in previous year (5,000) Less : Cash and cash equivalents of subsidiary acquired (293) Net cash and cash equivalents paid to obtain control W 49,422
③ Future, Inc In millions of won Amount Total consideration transferred W 49,250 Less : Cash and cash equivalents of subsidiary acquired (4) Net cash and cash equivalents paid to obtain control W 49,246
5) Expense for business combinations
The Group incurred W1,482 million and W186 million as legal and due diligence fees in 2013 and 2012, respectively which were recognized as selling, general and administrative expenses in the consolidated statements of income.
6) Contributed revenue from business combinations
Had TFS Singapore Private Limited and FRUITS & PASSION BOUTIQUES INC. and others been consolidated from January 1, 2013, sales and profit for the year in the consolidated statements of income would have increased by W75,510 and W11,026 million, respectively. This estimated amount is based on assumption that adjustment of fair values as of acquisition date is the same on January 1, 2013.

LG HOUSEHOLD & HEALTH CARE, LTD. AND SUBSIDIARIES Notes to the Consolidated Financial Statements For the years ended December 31, 2013 and 2012
46
7. Business Combination, Continued (2) Acquisition of non-controlling interests The Company acquired additional interests in LG Household & Health Care (Taiwan) Ltd. on March 8, 2012 for W901 million, increasing its ownership from 90% to 100%. The Group recognized a decrease in non-controlling interest of W280 million.
The effect of change in the Group’s ownership in LG Household & Health Care (Taiwan) Ltd. is as follows:
In millions of won Amount Parent’s ownership interest at the beginning of the period W 2,562 Effect of increase in parent’s ownership interest 280 Parent’s ownership interest at the end of the period W 2,842
(3) Business combinations among Group entities
(i) 2013 At the Board of Directors meeting on February 21, 2013, TheFaceShop Co., Ltd. and HAITAI BEVERAGE CO., LTD, subsidiaries, decided to merge with Violet Dream Inc. and Diamond Pure Water co., Ltd respectively to actively respond to the changes in management environment and optimize efficiency, and merger was completed on March 28, 2013. TheFaceShop Co., Ltd. and HAITAI BEVERAGE CO., LTD issued 256,459 common shares (merge ratio 1 : 6.0770892) and 1,502,846 common shares (merge ratio 1 : 751.4231105) respectively and there is no change in the Company’s ownership.
(ii) 2012 At the Board of Directors meeting on February 27, 2012, Violet Dream Inc., one of subsidiaries, decided to merge with PLUSONE CO, LTD. to actively respond to the change of management environment and optimize management efficiency. The merger was completed on May 1, 2012. The merge ratio is 1: 0 as Violet Dream Inc. owned 100% shares of PLUSONE CO, LTD. and decided not to issue new shares.
(4) Disposal of subsidiary (i) General
At the Board of Directors meeting on April 3, 2012, Violet Dream Inc., one of subsidiaries, decided to sell ONE INTERNATIONAL Co., LTD. On April 5, 2012, the sale of ONE INTERNATIONAL Co., LTD. was completed.
(ii) Assets and liabilities of sold subsidiary
In millions of won Amount Cash and cash equivalents W 36 Inventories 574 Other assets 87 Trade payables (518) Other payables (110) Net assets W 69

LG HOUSEHOLD & HEALTH CARE, LTD. AND SUBSIDIARIES Notes to the Consolidated Financial Statements For the years ended December 31, 2013 and 2012
47
7. Business Combination, Continued (4) Disposal of subsidiary, continued
(iii) Net cash flows from sale of subsidiary
In millions of won Amount Total consideration W 24 Cash and cash equivalents of subsidiary disposed (36) Net cash and cash equivalents paid from losing control W (12)
The Group recognized loss on disposal of subsidiary amounting to W 45 million related with above disposal of subsidiary.
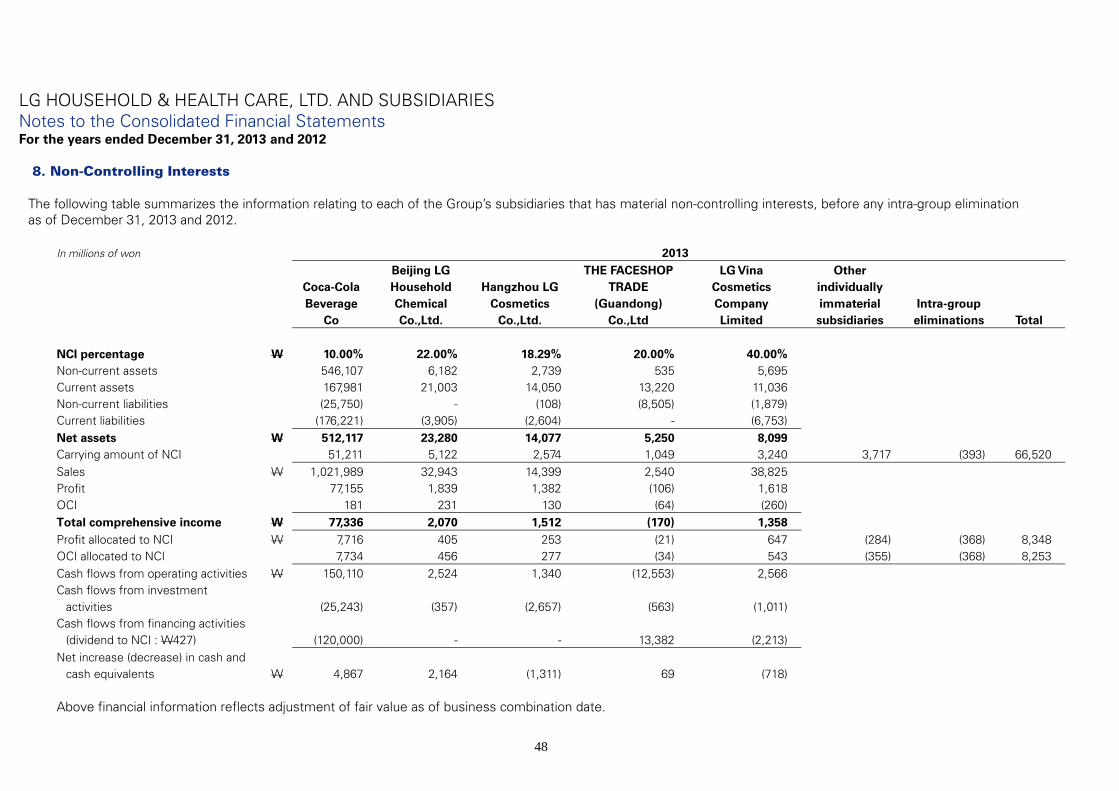
LG HOUSEHOLD & HEALTH CARE, LTD. AND SUBSIDIARIES Notes to the Consolidated Financial Statements For the years ended December 31, 2013 and 2012
48
8. Non-Controlling Interests
The following table summarizes the information relating to each of the Group’s subsidiaries that has material non-controlling interests, before any intra-group elimination as of December 31, 2013 and 2012.
In millions of won 2013
Coca-Cola Beverage
Co
Beijing LG Household Chemical Co.,Ltd.
Hangzhou LG Cosmetics
Co.,Ltd.
THE FACESHOP TRADE
(Guandong) Co.,Ltd
LG Vina Cosmetics Company Limited
Other individually immaterial subsidiaries
Intra-group eliminations Total
NCI percentage W 10.00% 22.00% 18.29% 20.00% 40.00% Non-current assets 546,107 6,182 2,739 535 5,695 Current assets 167,981 21,003 14,050 13,220 11,036 Non-current liabilities (25,750) - (108) (8,505) (1,879) Current liabilities (176,221) (3,905) (2,604) - (6,753) Net assets W 512,117 23,280 14,077 5,250 8,099 Carrying amount of NCI 51,211 5,122 2,574 1,049 3,240 3,717 (393) 66,520 Sales W 1,021,989 32,943 14,399 2,540 38,825 Profit 77,155 1,839 1,382 (106) 1,618 OCI 181 231 130 (64) (260) Total comprehensive income W 77,336 2,070 1,512 (170) 1,358 Profit allocated to NCI W 7,716 405 253 (21) 647 (284) (368) 8,348 OCI allocated to NCI 7,734 456 277 (34) 543 (355) (368) 8,253 Cash flows from operating activities W 150,110 2,524 1,340 (12,553) 2,566 Cash flows from investment
activities
(25,243) (357) (2,657) (563) (1,011) Cash flows from financing activities
(dividend to NCI : W427)
(120,000) - - 13,382 (2,213) Net increase (decrease) in cash and
cash equivalents W 4,867 2,164 (1,311) 69 (718)
Above financial information reflects adjustment of fair value as of business combination date.
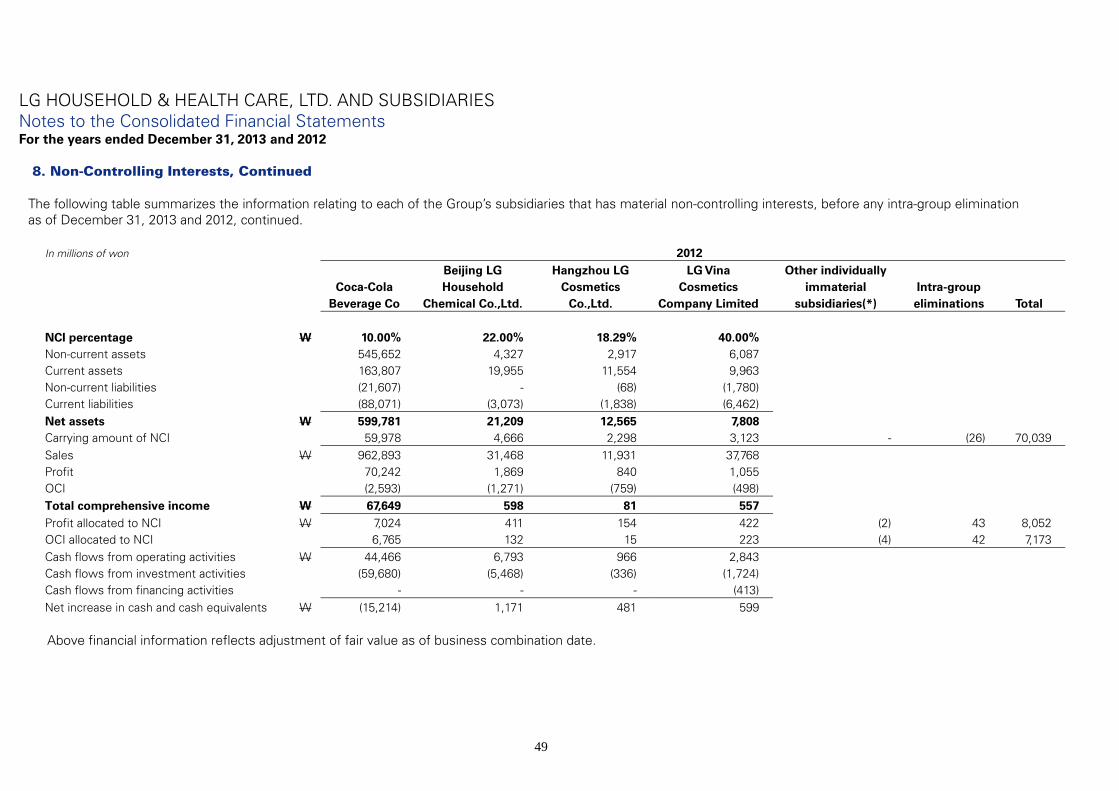
LG HOUSEHOLD & HEALTH CARE, LTD. AND SUBSIDIARIES Notes to the Consolidated Financial Statements For the years ended December 31, 2013 and 2012
49
8. Non-Controlling Interests, Continued
The following table summarizes the information relating to each of the Group’s subsidiaries that has material non-controlling interests, before any intra-group elimination as of December 31, 2013 and 2012, continued.
In millions of won 2012
Coca-Cola Beverage Co
Beijing LG Household
Chemical Co.,Ltd.
Hangzhou LG Cosmetics
Co.,Ltd.
LG Vina Cosmetics
Company Limited
Other individually immaterial
subsidiaries(*) Intra-group eliminations Total
NCI percentage W 10.00% 22.00% 18.29% 40.00% Non-current assets 545,652 4,327 2,917 6,087 Current assets 163,807 19,955 11,554 9,963 Non-current liabilities (21,607) - (68) (1,780) Current liabilities (88,071) (3,073) (1,838) (6,462) Net assets W 599,781 21,209 12,565 7,808 Carrying amount of NCI 59,978 4,666 2,298 3,123 - (26) 70,039 Sales W 962,893 31,468 11,931 37,768 Profit 70,242 1,869 840 1,055 OCI (2,593) (1,271) (759) (498) Total comprehensive income W 67,649 598 81 557 Profit allocated to NCI W 7,024 411 154 422 (2) 43 8,052 OCI allocated to NCI 6,765 132 15 223 (4) 42 7,173 Cash flows from operating activities W 44,466 6,793 966 2,843 Cash flows from investment activities (59,680) (5,468) (336) (1,724) Cash flows from financing activities - - - (413) Net increase in cash and cash equivalents W (15,214) 1,171 481 599
Above financial information reflects adjustment of fair value as of business combination date.
LG HOUSEHOLD & HEALTH CARE, LTD. AND SUBSIDIARIES Notes to the Consolidated Financial Statements For the years ended December 31, 2013 and 2012
50
9. Operating Segments
(1) The Group has three operating segments, as described below, whose discrete financial information is regularly provided to the Group’s chief operating decision maker:
Industry Products or Services Major Customers
Healthy Detergents, shampoos,
toothpastes and others Department stores, super markets and
others Beautiful Skin care, make-up and
others Department stores, super markets,
cosmetic stores and others Refreshing Coca Cola and other
beverage drinks Super markets and others
(2) The information for each operating segment for the years ended December 31, 2013 and 2012 are as
follows:
In millions of won 2013 Healthy Beautiful Refreshing Total Segment sales W 1,461,367 1,673,544 1,223,832 4,358,743 Inter-segment sales (18,934) (11,909) (1,645) (32,488) External sales 1,442,433 1,661,635 1,222,187 4,326,255 Operating profit 158,226 233,130 105,056 496,412 Finance income 6,080 7,512 1,650 15,242 Finance cost 16,737 19,597 1,055 37,389 Share of profit of equity accounted investees 5,035 (1,456) - 3,579
Profit before income tax 152,016 215,771 105,669 473,456 Depreciation 17,599 42,255 36,832 96,686 Amortization 4,272 8,914 366 13,552
In millions of won 2012 Healthy Beautiful Refreshing Total Segment sales W 1,279,645 1,486,828 1,153,496 3,919,969 Inter-segment sales (13,579) (7,860) (2,312) (23,751) External sales 1,266,066 1,478,968 1,151,184 3,896,218 Operating profit 144,202 212,208 89,121 445,531 Finance income 7,647 8,415 1,286 17,348 Finance cost 9,136 24,054 1,622 34,812 Share of profit of equity accounted investees 5,487 (524) - 4,963
Profit before income tax 146,111 194,114 90,065 430,290 Depreciation 16,813 45,096 38,270 100,179 Amortization 1,883 6,181 330 8,394
LG HOUSEHOLD & HEALTH CARE, LTD. AND SUBSIDIARIES Notes to the Consolidated Financial Statements For the years ended December 31, 2013 and 2012
51
9. Operating Segments, Continued (3) The details of assets and liabilities of segments as of December 31, 2013 and 2012 are as follows:
In millions of won 2013
Healthy Beautiful Refreshing Total
Assets: Segment assets W 917,591 1,341,227 1,019,022 3,277,840 Investments in associates and
joint ventures 45,434 - - 45,434 Available-for-sale financial assets - - 1,000 1,000 Property, plant and equipment 198,166 175,568 599,568 973,302 Goodwill and intangible assets 281,912 755,461 203,294 1,240,667 Other assets 392,079 410,198 215,160 1,017,437 Unallocated assets 157,264 Total assets W 3,435,104 Liabilities: Segment liabilities W 228,986 197,432 338,367 764,785 Unallocated liabilities 1,194,942 Total liabilities W 1,959,727
In millions of won 2012
Healthy Beautiful Refreshing Total
Assets:
Segment assets W 534,842 1,139,008 991,708 2,665,558 Investments in associates and joint ventures 33,371 1,456 - 34,827
Available-for-sale financial assets - - 1,000 1,000 Property, plant and equipment 181,569 147,155 583,879 912,603 Goodwill and intangible assets 6,913 598,346 201,678 806,937 Other assets 312,989 392,051 205,151 910,191 Unallocated assets 98,578 Total assets W 2,764,136 Liabilities: Segment liabilities W 129,948 434,520 255,831 820,299 Unallocated liabilities 672,247 Total liabilities W 1,492,546
LG HOUSEHOLD & HEALTH CARE, LTD. AND SUBSIDIARIES Notes to the Consolidated Financial Statements For the years ended December 31, 2013 and 2012
52
9. Operating Segments, Continued (4) The geographical sales and non-current assets information as of and for the years ended December 31,
2013 and 2012 are as follows:
In millions of won Sales
Property, plant and equipment
Goodwill and intangible assets
2013 2012 2013 2012 2013 2012
Korea W 3,678,924 3,465,025 964,869 951,104 756,012 731,355 China 156,059 142,492 13,754 10,880 714 690 Japan 269,733 108,249 33,751 39,163 496,960 107,996 Asia - other 124,268 108,218 7,390 5,879 32,038 602 North America 47,330 17,472 2,378 75 167 - South America 1,616 1,138 - - - - Europe 25,280 20,283 - - - - Others 23,045 33,341 - - - - Total W 4,326,255 3,896,218 1,022,142 1,007,101 1,285,891 840,643
The geographical sales information is based on the location of customers and non-current assets information is based on the country that the assets are located.
(5) There is no customer that accounts for more than 10 percent of sales of the Group for the years ended
December 31, 2013 and 2012.
10. Fair Value of Financial Instruments
(1) Book value and fair value of financial assets as of December 31, 2013 and 2012 are as follows:
In millions of won 2013 2012 Book value Fair value Book value Fair value
Cash and cash equivalents
Cash and cash Equivalents(*1) W 143,045 143,045 65,204 65,204
Loans and receivables
Short-term financial deposits(*1)
12,500 12,500 12,000 12,000
Trade receivables(*1) 410,540 410,540 370,286 370,286 Other receivables(*1) 13,013 13,013 16,099 16,099
Long-term financial
deposits(*1)
1,027 1,027 27 27
Other long-term
receivables(*1)
71,030 71,030 55,297 55,297 Sub-total 508,110 508,110 453,709 453,709 Available-for-sale financial assets
Listed equity securities (*2)
513 513 406 406
Unlisted equity and
debt securities (*3)
1,122 1,122 1,010 1,010 Sub-total 1,635 1,635 1,416 1,416 Total W 652,790 652,790 520,329 520,329
(*1) The Group regards book value as fair value.
LG HOUSEHOLD & HEALTH CARE, LTD. AND SUBSIDIARIES Notes to the Consolidated Financial Statements For the years ended December 31, 2013 and 2012
53
10. Fair Value of Financial Instruments, Continued
(1) Book value and fair value of financial assets as of December 31, 2013 and 2012 are as follows, continued:
(*2) Listed equity securities are measured at fair value based on the market prices in active markets. The Group recognized impairment losses on these available-for-sale financial assets of W279 million (2013 : nil) in 2012 as there is significant or prolonged decline in the fair value of the market equity securities below its cost.
(*3) Unlisted equity securities and debt securities that do not have a quoted market price in an active
market are recorded based on acquisition cost because fair value cannot be reliably measured. The Group recognized impairment losses on available-for-sale financial assets of W453 million (2013 : nil) related to Haebong Co., Ltd. in 2012.
(2) Book value and fair value of financial liabilities as of December 31, 2013 and 2012 are as follows:
In millions of won 2013 2012
Book value Fair value Book value Fair value
Financial liabilities measured at amortized cost
Trade payables(*1) W 202,423 202,423 167,736 167,736 Other payables(*1) 185,741 185,741 185,230 185,230 Short-term
borrowings(*1) 317,728 317,728 115,773 115,773 Current portion of
long-term debentures(*1) 79,991 79,991 299,982 299,982
Current portion of finance lease liabilities(*1) 11 11 - -
Long-term borrowings(*1) 85,613 85,613 82,320 82,320
Long-term debentures(*1) 648,300 648,300 229,422 229,422
Deposit received(*1) 10,707 10,707 13,397 13,397 Finance lease
liabilities(*1) 86 86 34 34 Total W 1,530,600 1,530,600 1,093,894 1,093,894
(*1) The Group regards book value as fair value.
11. Cash and Cash Equivalents
Cash and cash equivalents as of December 31, 2013 and 2012 are summarized as follows: In millions of won 2013 2012
Cash on hand W 13,907 3,390 Demand deposits 64,912 39,748 Other cash equivalents 64,226 22,066 W 143,045 65,204
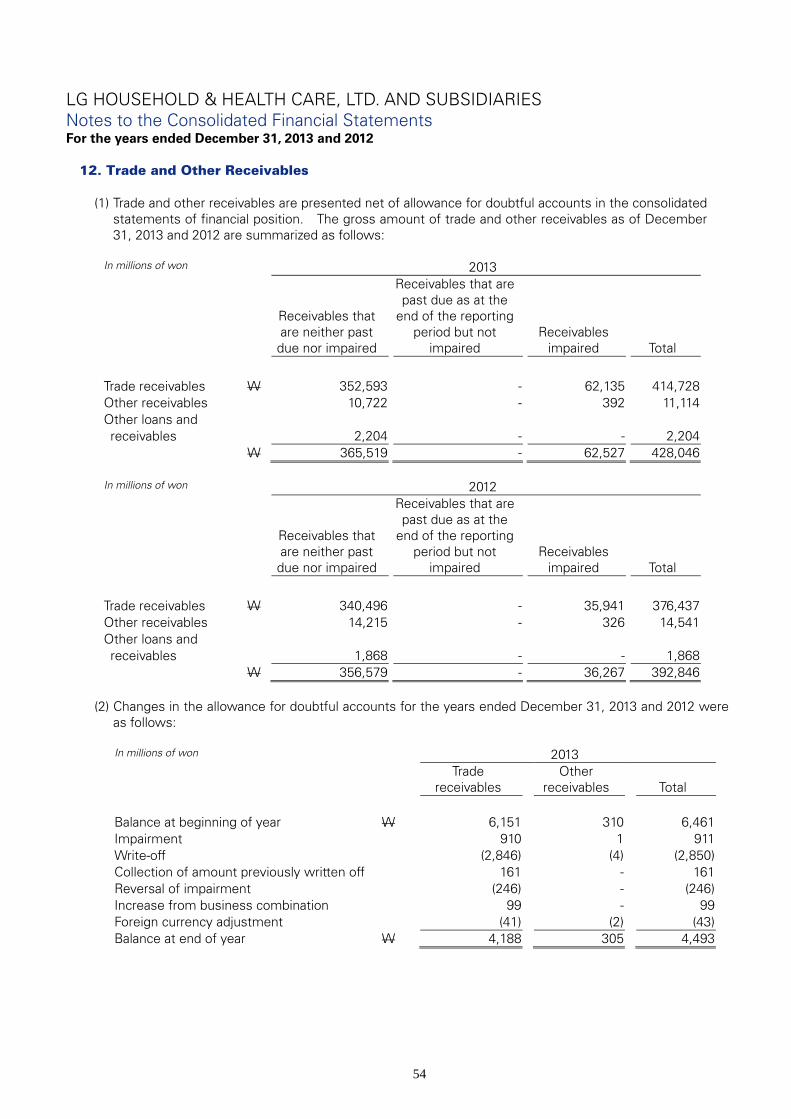
LG HOUSEHOLD & HEALTH CARE, LTD. AND SUBSIDIARIES Notes to the Consolidated Financial Statements For the years ended December 31, 2013 and 2012
54
12. Trade and Other Receivables
(1) Trade and other receivables are presented net of allowance for doubtful accounts in the consolidated statements of financial position. The gross amount of trade and other receivables as of December 31, 2013 and 2012 are summarized as follows:
In millions of won 2013
Receivables that are neither past due nor impaired
Receivables that are past due as at the
end of the reporting period but not
impaired Receivables
impaired Total
Trade receivables W 352,593 - 62,135
414,728 Other receivables 10,722 - 392 11,114 Other loans and receivables 2,204 - -
2,204
W 365,519 - 62,527 428,046
In millions of won 2012
Receivables that are neither past due nor impaired
Receivables that are past due as at the
end of the reporting period but not
impaired Receivables
impaired Total
Trade receivables W 340,496 - 35,941
376,437 Other receivables 14,215 - 326 14,541 Other loans and receivables 1,868 - -
1,868
W 356,579 - 36,267 392,846
(2) Changes in the allowance for doubtful accounts for the years ended December 31, 2013 and 2012 were as follows:
In millions of won 2013 Trade
receivables Other
receivables Total Balance at beginning of year W 6,151 310 6,461 Impairment 910 1 911 Write-off (2,846) (4) (2,850) Collection of amount previously written off 161 - 161 Reversal of impairment (246) - (246) Increase from business combination 99 - 99 Foreign currency adjustment (41) (2) (43) Balance at end of year W 4,188 305 4,493
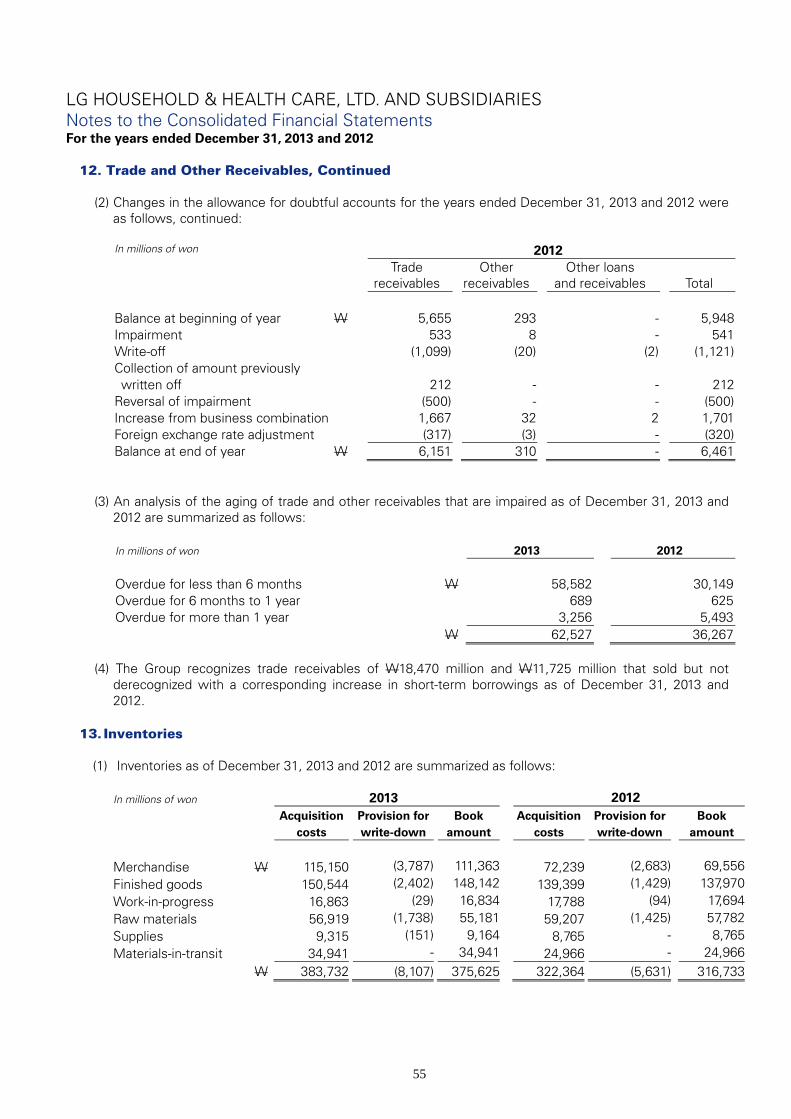
LG HOUSEHOLD & HEALTH CARE, LTD. AND SUBSIDIARIES Notes to the Consolidated Financial Statements For the years ended December 31, 2013 and 2012
55
12. Trade and Other Receivables, Continued
(2) Changes in the allowance for doubtful accounts for the years ended December 31, 2013 and 2012 were as follows, continued:
In millions of won 2012 Trade
receivables Other
receivables Other loans
and receivables Total Balance at beginning of year W 5,655 293 - 5,948 Impairment 533 8 - 541 Write-off (1,099) (20) (2) (1,121) Collection of amount previously written off 212 - -
212
Reversal of impairment (500) - - (500) Increase from business combination 1,667 32 2 1,701 Foreign exchange rate adjustment (317) (3) - (320) Balance at end of year W 6,151 310 - 6,461
(3) An analysis of the aging of trade and other receivables that are impaired as of December 31, 2013 and 2012 are summarized as follows:
In millions of won 2013 2012 Overdue for less than 6 months W 58,582 30,149 Overdue for 6 months to 1 year 689 625 Overdue for more than 1 year 3,256 5,493 W 62,527 36,267
(4) The Group recognizes trade receivables of W18,470 million and W11,725 million that sold but not
derecognized with a corresponding increase in short-term borrowings as of December 31, 2013 and 2012.
13. Inventories
(1) Inventories as of December 31, 2013 and 2012 are summarized as follows:
In millions of won 2013 2012
Acquisition
costs Provision for
write-down Book
amount Acquisition
costs Provision for
write-down Book
amount
Merchandise W 115,150 (3,787) 111,363 72,239 (2,683) 69,556Finished goods 150,544 (2,402) 148,142 139,399 (1,429) 137,970Work-in-progress 16,863 (29) 16,834 17,788 (94) 17,694Raw materials 56,919 (1,738) 55,181 59,207 (1,425) 57,782Supplies 9,315 (151) 9,164 8,765 - 8,765Materials-in-transit 34,941 - 34,941 24,966 - 24,966 W 383,732 (8,107) 375,625 322,364 (5,631) 316,733

LG HOUSEHOLD & HEALTH CARE, LTD. AND SUBSIDIARIES Notes to the Consolidated Financial Statements For the years ended December 31, 2013 and 2012
56
13. Inventories, Continued
(2) Change in the amount of inventories recognized as a write-down (reversal) for the years ended December 31, 2013 and 2012 were as follows:
In millions of won 2013 2012 Balance at beginning of year W 5,631 5,516Increase from business combination 2,572 1,145Write-off (146) -Write-down (reversal) of inventories 457 (764)Adjustment of foreign exchange translation (407) (266)Balance at end of year W 8,107 5,631
14. Non-current assets held for sale
The Group decided to dispose some of its land, buildings and structure and entered into an agreement in August 2013. According to the agreement, the ownership of the related assets shall be transferred on March 7, 2014 when the remaining amount is paid. As of December 31, 2013, the carrying amount the lower of the fair value of assets and carrying amount are reclassified to non-current assets held for sale. The contract amount is regarded as fair value. Detail of non-current assets held for sale is as follows: In millions of won 2013
Property, Plant and Equipment Land W 5,374Buildings 1,363Structures 12
Non-current assets for sale W 6,749
15. Other Assets
(1) Other current assets as of December 31, 2013 and 2012 are summarized as follows:
In millions of won 2013 2012
Accrued income W 189 138Advance payments 2,630 2,347Prepaid expenses 14,386 8,707Prepaid income tax 231 9Prepaid value added tax 1,777 2Others 390 342 W 19,603 11,545
(2) Other non-current assets as of December 31, 2013 and 2012 are summarized as follows:
In millions of won 2013 2012
Long-term prepaid expenses W 2,417 7,866Others 68 69 W 2,485 7,935
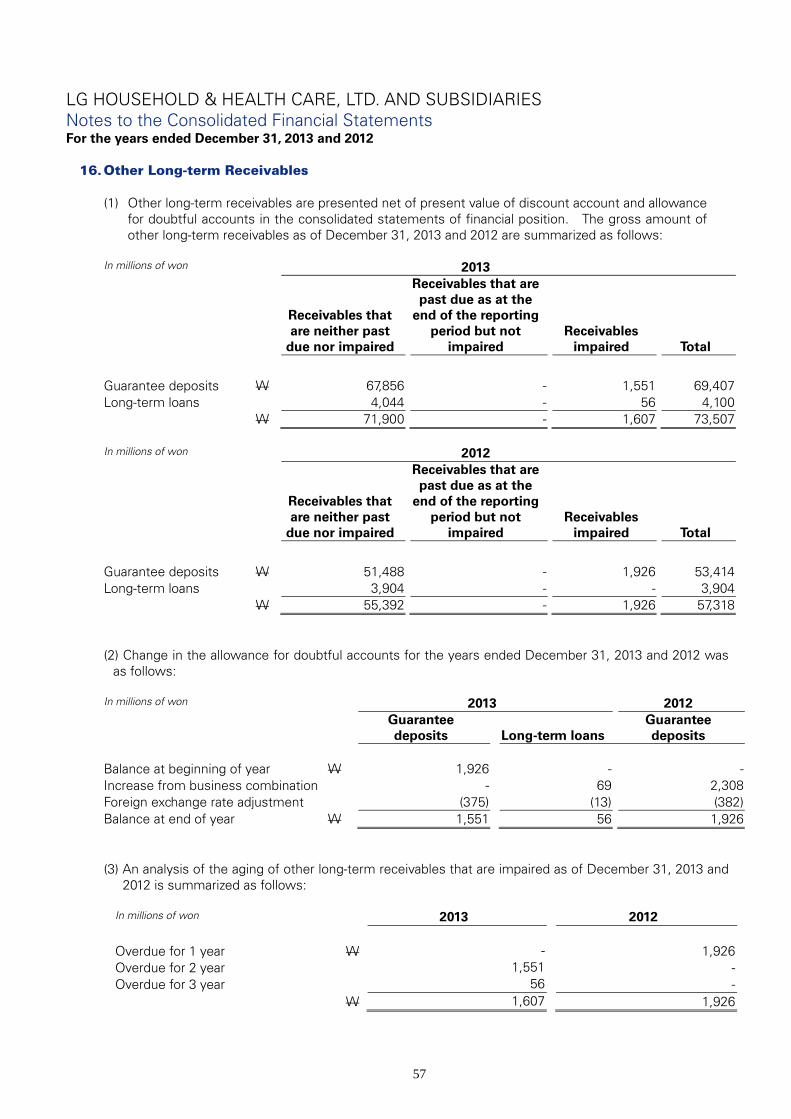
LG HOUSEHOLD & HEALTH CARE, LTD. AND SUBSIDIARIES Notes to the Consolidated Financial Statements For the years ended December 31, 2013 and 2012
57
16. Other Long-term Receivables
(1) Other long-term receivables are presented net of present value of discount account and allowance for doubtful accounts in the consolidated statements of financial position. The gross amount of other long-term receivables as of December 31, 2013 and 2012 are summarized as follows:
In millions of won 2013
Receivables that are neither past
due nor impaired
Receivables that are past due as at the
end of the reporting period but not
impaired Receivables
impaired Total
Guarantee deposits W 67,856 - 1,551
69,407 Long-term loans 4,044 - 56 4,100
W 71,900 - 1,607 73,507
In millions of won 2012
Receivables that are neither past
due nor impaired
Receivables that are past due as at the
end of the reporting period but not
impaired Receivables
impaired Total
Guarantee deposits W 51,488 - 1,926
53,414 Long-term loans 3,904 - - 3,904
W 55,392 - 1,926 57,318
(2) Change in the allowance for doubtful accounts for the years ended December 31, 2013 and 2012 was as follows:
In millions of won 2013 2012 Guarantee
deposits Long-term loans Guarantee deposits
Balance at beginning of year W 1,926 - - Increase from business combination - 69 2,308 Foreign exchange rate adjustment (375) (13) (382) Balance at end of year W 1,551 56 1,926 (3) An analysis of the aging of other long-term receivables that are impaired as of December 31, 2013 and
2012 is summarized as follows:
In millions of won 2013 2012 Overdue for 1 year W - 1,926 Overdue for 2 year 1,551 - Overdue for 3 year 56 - W 1,607 1,926
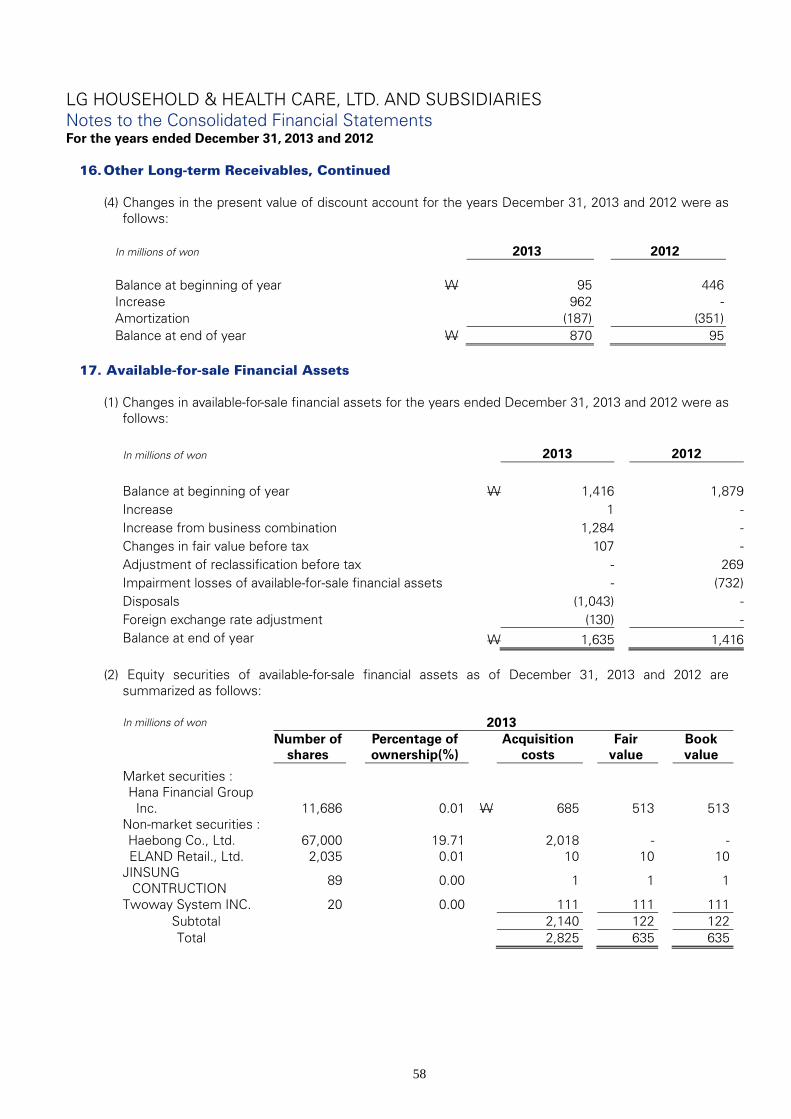
LG HOUSEHOLD & HEALTH CARE, LTD. AND SUBSIDIARIES Notes to the Consolidated Financial Statements For the years ended December 31, 2013 and 2012
58
16. Other Long-term Receivables, Continued (4) Changes in the present value of discount account for the years December 31, 2013 and 2012 were as
follows:
In millions of won 2013 2012 Balance at beginning of year W 95 446 Increase 962 - Amortization (187) (351) Balance at end of year W 870 95
17. Available-for-sale Financial Assets
(1) Changes in available-for-sale financial assets for the years ended December 31, 2013 and 2012 were as
follows:
In millions of won 2013 2012 Balance at beginning of year W 1,416 1,879 Increase 1 - Increase from business combination 1,284 - Changes in fair value before tax 107 - Adjustment of reclassification before tax - 269 Impairment losses of available-for-sale financial assets - (732) Disposals (1,043) - Foreign exchange rate adjustment (130) - Balance at end of year W 1,635 1,416
(2) Equity securities of available-for-sale financial assets as of December 31, 2013 and 2012 are
summarized as follows:
In millions of won
2013
Number of
shares Percentage of ownership(%)
Acquisition costs
Fair value
Book value
Market securities : Hana Financial Group
Inc. 11,686 0.01 W 685 513 513 Non-market securities : Haebong Co., Ltd. 67,000 19.71 2,018 - -
ELAND Retail., Ltd. 2,035 0.01 10 10 10 JINSUNG
CONTRUCTION 89
0.00
1
1
1
Twoway System INC. 20 0.00 111 111 111 Subtotal
2,140
122
122
Total
2,825
635
635

LG HOUSEHOLD & HEALTH CARE, LTD. AND SUBSIDIARIES Notes to the Consolidated Financial Statements For the years ended December 31, 2013 and 2012
59
17. Available-for-sale Financial Assets, Continued
(2) Equity securities of available-for-sale financial assets as of December 31, 2013 and 2012 are summarized as follows, continued:
In millions of won
2012
Number of
shares Percentage of ownership(%)
Acquisition costs
Fair value
Book value
Market securities :
Hana Financial Group Inc.(*1) 11,686 0.01 W 685 406 406
Non-market securities : Haebong Co., Ltd.(*2) 67,000
19.71
2,018
-
- ELAND Retail., Ltd. 2,035
0.01
10
10
10
Subtotal
2,028
10
10 Total 2,713 416 416
(*1) The Group recognized impairment losses on available-for-sale financial assets of W279 million as
there is significant or prolonged decline in the fair value of the market equity securities below its cost.
(*2) The Group recognized impairment losses on available-for-sale financial assets of W454 million
related to Haebong Co., Ltd.
(3) Debt securities of available-for-sale financial assets as of December 31, 2013 and 2012 are summarized as follows:
In millions of won 2013 2012
Debt securities
Convertible bonds W 1,000 1,000
Non-marketable debt securities that do not have a quoted market price in an active market are recorded based on acquisition cost because fair value cannot be reliably measured.
18. Investments in Associates
(1) The details of investments in associates as of December 31, 2013 and 2012 are summarized as follows:
In millions of won, except number of shares and percentage of ownership 2013
Company
Location
Principal business
Year end Number of shares held
Percentage of ownership(%)
Balance at Dec. 31, 2013
LG Uni-charm Co., Ltd.
Korea
Manufacturing hygiene paper product
Dec. 31 1,470,000 49.00 W 29,785
Coty Korea Ltd.
Korea Cosmetics
product sales
Dec. 31 62,172 49.50 -
K&I Co., Ltd.(*1)
Korea Household
product sales
Dec. 31 95,200 40.00 7,538 W 37,323
(*1) The Company obtained 40% of shares of K&I Co., Ltd. on March 18, 2013.
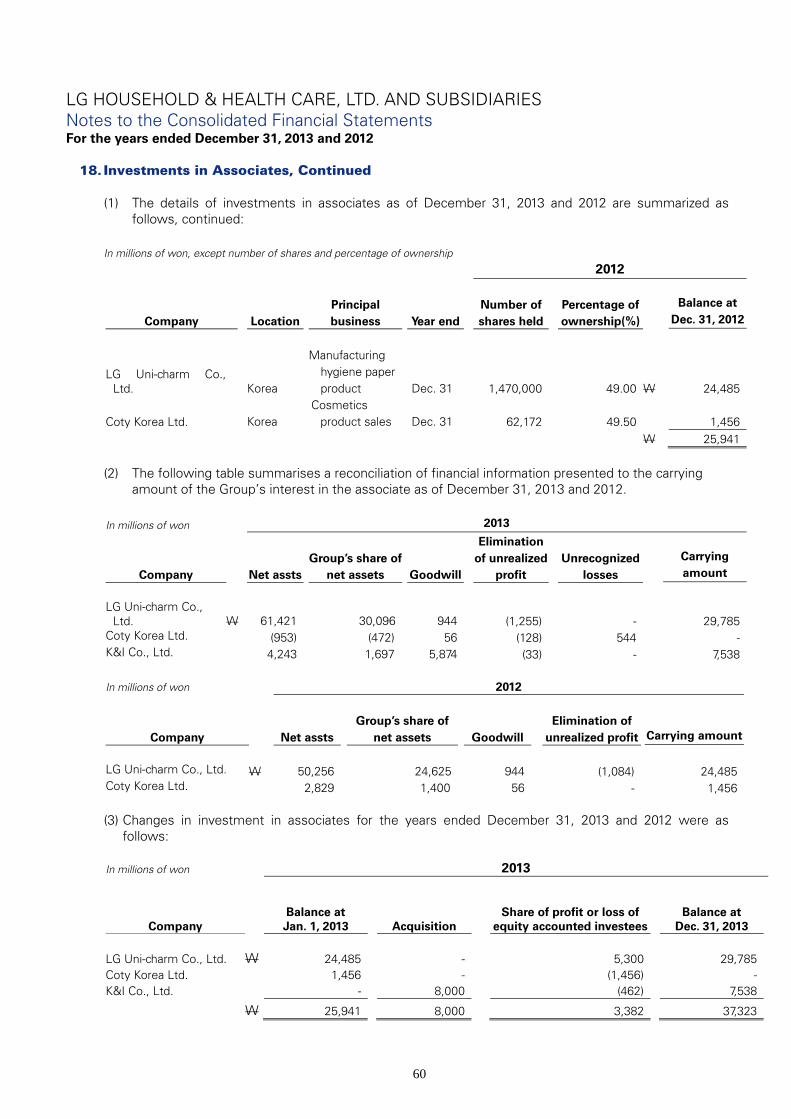
LG HOUSEHOLD & HEALTH CARE, LTD. AND SUBSIDIARIES Notes to the Consolidated Financial Statements For the years ended December 31, 2013 and 2012
60
18. Investments in Associates, Continued
(1) The details of investments in associates as of December 31, 2013 and 2012 are summarized as follows, continued:
In millions of won, except number of shares and percentage of ownership
2012
Company
Location
Principal business
Year end Number of shares held
Percentage of ownership(%)
Balance at Dec. 31, 2012
LG Uni-charm Co., Ltd.
Korea
Manufacturing hygiene paper product
Dec. 31 1,470,000 49.00 W 24,485
Coty Korea Ltd.
Korea Cosmetics
product sales
Dec. 31 62,172 49.50 1,456 W 25,941
(2) The following table summarises a reconciliation of financial information presented to the carrying
amount of the Group’s interest in the associate as of December 31, 2013 and 2012. In millions of won 2013
Company
Net assts
Group’s share of
net assets
Goodwill
Elimination of unrealized
profit Unrecognized
losses
Carrying amount
LG Uni-charm Co.,
Ltd. W 61,421 30,096 944 (1,255) - 29,785 Coty Korea Ltd. (953) (472) 56 (128) 544 - K&I Co., Ltd. 4,243 1,697 5,874 (33) - 7,538
In millions of won 2012
Company
Net assts Group’s share of
net assets Goodwill Elimination of
unrealized profit
Carrying amount
LG Uni-charm Co., Ltd. W 50,256 24,625 944 (1,084) 24,485 Coty Korea Ltd. 2,829 1,400 56 - 1,456 (3) Changes in investment in associates for the years ended December 31, 2013 and 2012 were as
follows: In millions of won 2013
Company Balance at Jan. 1, 2013
Acquisition
Share of profit or loss of equity accounted investees
Balance at
Dec. 31, 2013 LG Uni-charm Co., Ltd. W 24,485 - 5,300 29,785 Coty Korea Ltd. 1,456 - (1,456) - K&I Co., Ltd. - 8,000 (462) 7,538
W 25,941 8,000 3,382 37,323

LG HOUSEHOLD & HEALTH CARE, LTD. AND SUBSIDIARIES Notes to the Consolidated Financial Statements For the years ended December 31, 2013 and 2012
61
18. Investments in Associates, Continued (3) Changes in investment in associates for the years ended December 31, 2013 and 2012 were as
follows, continued: In millions of won 2012
Company Balance at Jan. 1, 2012
Acquisition
Share of profit or loss of equity accounted investees
Balance at
Dec. 31, 2012 LG Uni-charm Co., Ltd. W 19,404 - 5,081 24,485 Coty Korea Ltd. - 1,980 (524) 1,456
W 19,404 1,980 4,557 25,941
(4) Financial information of associates as of and for years ended December 31, 2013 and 2012 is
summarized as follows: In millions of won 2013
Company Current assets
Non-current Assets
Current
liabilities
Non-current
liabilities Sales Operating
profit Profit for the year
LG Uni-charm Co., Ltd. W 49,437 38,215 25,024 1,207 129,483 13,749 11,164
Coty Korea Ltd. 3,214 1,268 5,324 111 5,109 (3,704) (3,782) K&I Co., Ltd.(*) 7,701 1,123 2,921 1,660 16,160 (985) (1,072) W 60,352 40,606 33,269 2,978 150,752 9,060 6,310
(*1) The financial information of K&I Co., Ltd. is for the period from acquisition date to December 31, 2013. In millions of won 2012
Company Current assets
Non-current Assets
Current
liabilities
Non-current
liabilities Sales Operating
profit Profit for the year
LG Uni-charm Co., Ltd. W 32,845 39,602
19,373 2,819 118,413 13,656 10,992
Coty Korea Ltd. 2,321 888 380 - 241 (1,183) (1,171) W 35,166 40,490 19,753 2,819 118,654 12,473 9,821
19. Investments in Joint Ventures
(1) Emery Oleochemicals Rika (M) Sdn. Bhd. and Clean Soul Ltd., the joint arrangements in which the Group participates, are principally engaged in manufacturing raw materials and selling household products, respectively. Emery Oleochemicals Rika (M) Sdn. Bhd. and Clean Soul Ltd. are the strategic suppliers of the Group. The Group has rights to the net assets of the entities. Accordingly, the Group has classified the investment in Emery Oleochemicals Rika (M) Sdn. Bhd. and Clean Soul Ltd. as joint ventures.
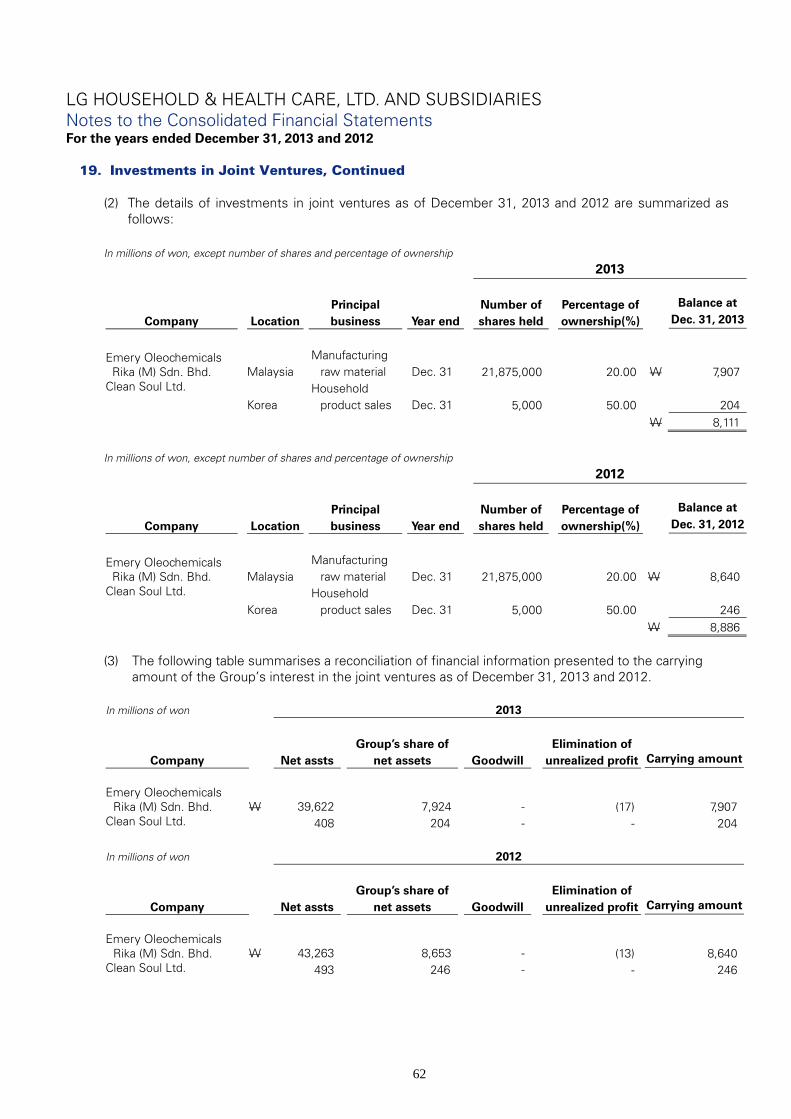
LG HOUSEHOLD & HEALTH CARE, LTD. AND SUBSIDIARIES Notes to the Consolidated Financial Statements For the years ended December 31, 2013 and 2012
62
19. Investments in Joint Ventures, Continued (2) The details of investments in joint ventures as of December 31, 2013 and 2012 are summarized as
follows:
In millions of won, except number of shares and percentage of ownership
2013
Company
Location
Principal business
Year end Number of shares held
Percentage of ownership(%)
Balance at Dec. 31, 2013
Emery Oleochemicals Rika (M) Sdn. Bhd.
Malaysia
Manufacturing raw material
Dec. 31 21,875,000 20.00 W 7,907
Clean Soul Ltd. Korea
Household product sales
Dec. 31 5,000 50.00 204
W 8,111
In millions of won, except number of shares and percentage of ownership
2012
Company
Location
Principal business
Year end Number of shares held
Percentage of ownership(%)
Balance at Dec. 31, 2012
Emery Oleochemicals Rika (M) Sdn. Bhd.
Malaysia
Manufacturing raw material
Dec. 31 21,875,000 20.00 W 8,640
Clean Soul Ltd. Korea
Household product sales
Dec. 31 5,000 50.00 246
W 8,886 (3) The following table summarises a reconciliation of financial information presented to the carrying
amount of the Group’s interest in the joint ventures as of December 31, 2013 and 2012.
In millions of won 2013
Company
Net assts Group’s share of
net assets Goodwill Elimination of
unrealized profit
Carrying amount
Emery Oleochemicals
Rika (M) Sdn. Bhd. W 39,622 7,924 - (17) 7,907 Clean Soul Ltd. 408 204 - - 204 In millions of won 2012
Company
Net assts Group’s share of
net assets Goodwill Elimination of
unrealized profit
Carrying amount
Emery Oleochemicals
Rika (M) Sdn. Bhd. W 43,263 8,653 - (13) 8,640 Clean Soul Ltd. 493 246 - - 246
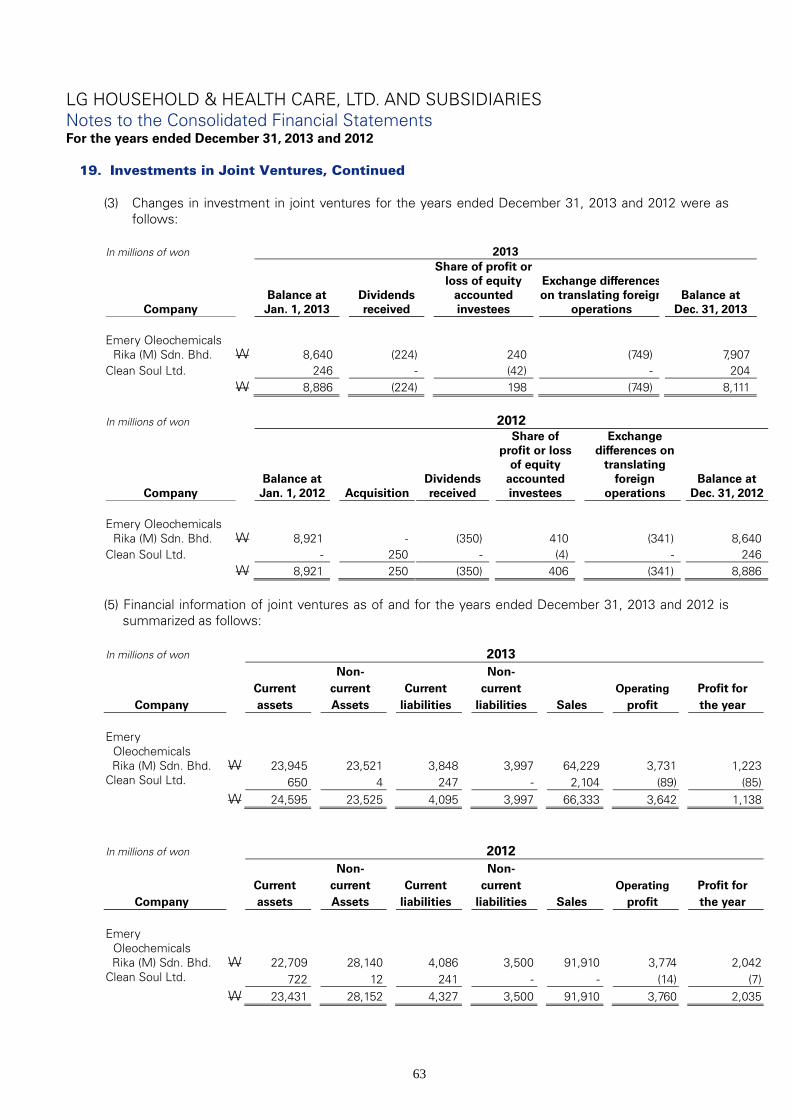
LG HOUSEHOLD & HEALTH CARE, LTD. AND SUBSIDIARIES Notes to the Consolidated Financial Statements For the years ended December 31, 2013 and 2012
63
19. Investments in Joint Ventures, Continued (3) Changes in investment in joint ventures for the years ended December 31, 2013 and 2012 were as
follows: In millions of won 2013
Company Balance at Jan. 1, 2013
Dividends
received
Share of profit or loss of equity
accounted investees
Exchange differenceson translating foreign
operations Balance at
Dec. 31, 2013 Emery Oleochemicals
Rika (M) Sdn. Bhd. W 8,640 (224) 240 (749) 7,907 Clean Soul Ltd. 246 - (42) - 204
W 8,886 (224) 198 (749) 8,111 In millions of won 2012
Company Balance at Jan. 1, 2012
Acquisition
Dividends
received
Share of profit or loss
of equity accounted investees
Exchange differences on
translating foreign
operations Balance at
Dec. 31, 2012 Emery Oleochemicals
Rika (M) Sdn. Bhd. W 8,921 - (350) 410 (341) 8,640 Clean Soul Ltd. - 250 - (4) - 246
W 8,921 250 (350) 406 (341) 8,886 (5) Financial information of joint ventures as of and for the years ended December 31, 2013 and 2012 is
summarized as follows: In millions of won 2013
Company Current assets
Non-current Assets
Current
liabilities
Non-current
liabilities Sales Operating
profit Profit for the year
Emery
Oleochemicals Rika (M) Sdn. Bhd. W 23,945 23,521
3,848 3,997 64,229 3,731 1,223 Clean Soul Ltd. 650 4 247 - 2,104 (89) (85) W 24,595 23,525 4,095 3,997 66,333 3,642 1,138
In millions of won 2012
Company Current assets
Non-current Assets
Current
liabilities
Non-current
liabilities Sales Operating
profit Profit for the year
Emery
Oleochemicals Rika (M) Sdn. Bhd. W 22,709 28,140
4,086 3,500 91,910 3,774 2,042 Clean Soul Ltd. 722 12 241 - - (14) (7) W 23,431 28,152 4,327 3,500 91,910 3,760 2,035
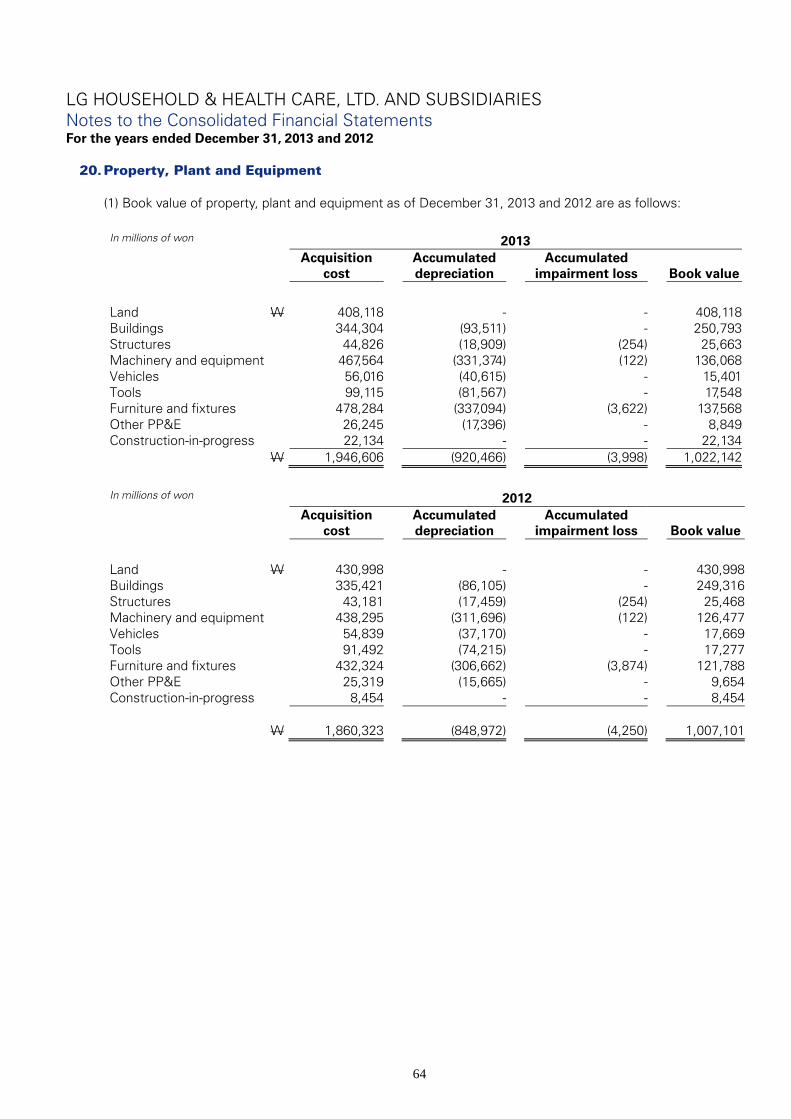
LG HOUSEHOLD & HEALTH CARE, LTD. AND SUBSIDIARIES Notes to the Consolidated Financial Statements For the years ended December 31, 2013 and 2012
64
20. Property, Plant and Equipment
(1) Book value of property, plant and equipment as of December 31, 2013 and 2012 are as follows:
In millions of won 2013 Acquisition
cost Accumulated depreciation
Accumulated impairment loss Book value
Land W 408,118 - - 408,118Buildings 344,304 (93,511) - 250,793Structures 44,826 (18,909) (254) 25,663Machinery and equipment 467,564 (331,374) (122) 136,068Vehicles 56,016 (40,615) - 15,401Tools 99,115 (81,567) - 17,548Furniture and fixtures 478,284 (337,094) (3,622) 137,568Other PP&E 26,245 (17,396) - 8,849Construction-in-progress 22,134 - - 22,134
W 1,946,606 (920,466) (3,998) 1,022,142
In millions of won 2012 Acquisition
cost Accumulated depreciation
Accumulated impairment loss Book value
Land W 430,998 - - 430,998Buildings 335,421 (86,105) - 249,316Structures 43,181 (17,459) (254) 25,468Machinery and equipment 438,295 (311,696) (122) 126,477Vehicles 54,839 (37,170) - 17,669Tools 91,492 (74,215) - 17,277Furniture and fixtures 432,324 (306,662) (3,874) 121,788Other PP&E 25,319 (15,665) - 9,654Construction-in-progress 8,454 - - 8,454
W 1,860,323 (848,972) (4,250) 1,007,101

LG HOUSEHOLD & HEALTH CARE, LTD. AND SUBSIDIARIES Notes to the Consolidated Financial Statements For the years ended December 31, 2013 and 2012
65
20. Property, Plant and Equipment, Continued (2) Changes in acquisition cost of property, plant and equipment for the years ended December 31, 2013
and 2012 were as follows:
In millions of won 2013
Acquisition cost as of
Jan. 1, 2013 Acquisitions
Disposals
Increase from business
combination Others (*1,2)
Exchange differences on
translating foreign
operations
Acquisition cost as of
Dec. 31, 2013 Land W 430,998 3,291 (2,474) 1,405 (20,616) (4,486) 408,118Buildings 335,421 1,777 (736) 5,863 5,420 (3,441) 344,304Structures 43,181 371 (28) 302 1,100 (100) 44,826Machinery and
equipment 438,295 2,241 (3,002) 1,091 28,937 2 467,564Vehicles 54,839 4,213 (3,269) 143 98 (8) 56,016Tools 91,492 2,179 (3,637) 1,801 7,844 (564) 99,115Furniture and
fixtures 432,324 56,419 (23,028) 10,587 2,741 (759) 478,284Other
PP&E(*1,2) 25,319 2,602 (1,654) 30 - (52) 26,245Construction-
in-progress 8,454 68,903 (58) 176 (55,279) (62) 22,134 W 1,860,323 141,996 (37,886) 21,398 (29,755) (9,470) 1,946,606
(*1) Others include reclassifications of land, buildings and structures to non-current assets held for sale (W 7,846 million), construction-in-progress to intangible assets (W6,438 million), adjustment of fair value related to acquired assets in previous year (W15,241 million), other (W279 million) and capitalization of borrowing costs (W49 million).
(*2) The Group has paid W8,820 million to purchase some of land to construct research complex on that land.
The Group capitalized borrowing costs related to construction of the research amounted to W49 million, calculated using a capitalization rate of 3.36%
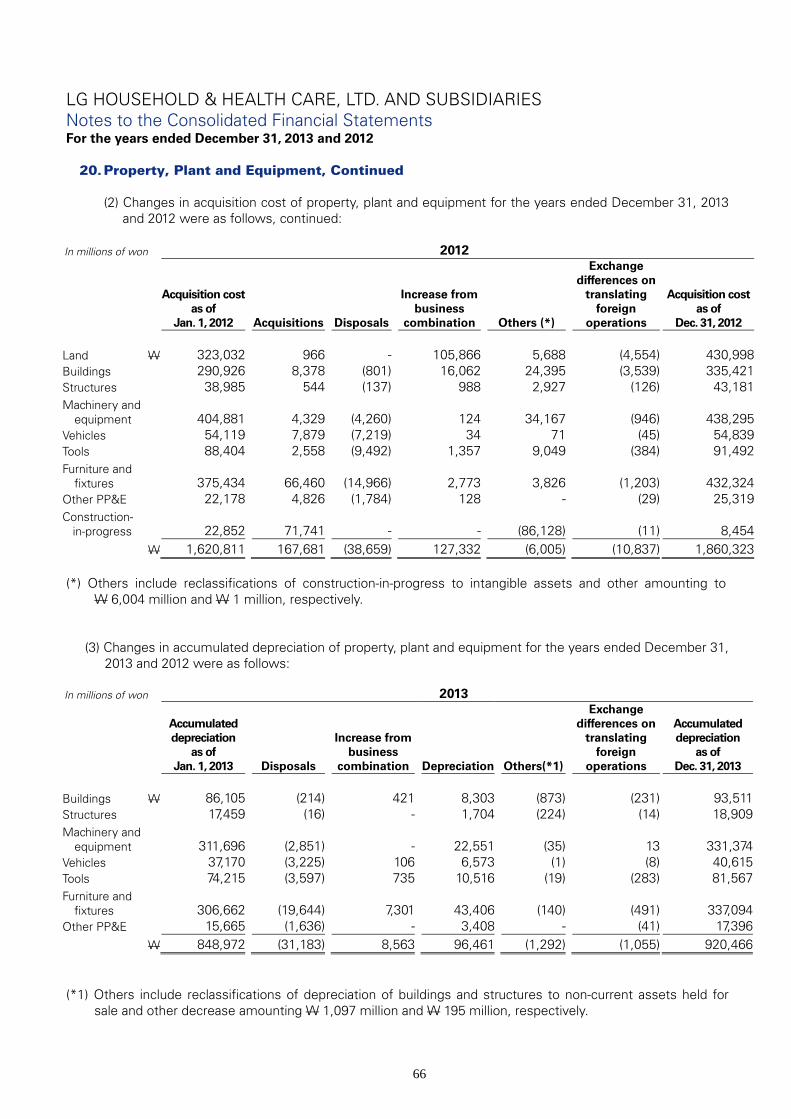
LG HOUSEHOLD & HEALTH CARE, LTD. AND SUBSIDIARIES Notes to the Consolidated Financial Statements For the years ended December 31, 2013 and 2012
66
20. Property, Plant and Equipment, Continued (2) Changes in acquisition cost of property, plant and equipment for the years ended December 31, 2013
and 2012 were as follows, continued:
In millions of won 2012
Acquisition cost as of
Jan. 1, 2012 Acquisitions
Disposals
Increase from business
combination Others (*)
Exchange differences on
translating foreign
operations
Acquisition cost as of
Dec. 31, 2012 Land W 323,032 966 - 105,866 5,688 (4,554) 430,998Buildings 290,926 8,378 (801) 16,062 24,395 (3,539) 335,421Structures 38,985 544 (137) 988 2,927 (126) 43,181Machinery and
equipment 404,881 4,329 (4,260) 124 34,167 (946) 438,295Vehicles 54,119 7,879 (7,219) 34 71 (45) 54,839Tools 88,404 2,558 (9,492) 1,357 9,049 (384) 91,492Furniture and
fixtures 375,434 66,460 (14,966) 2,773 3,826 (1,203) 432,324Other PP&E 22,178 4,826 (1,784) 128 - (29) 25,319Construction-
in-progress 22,852 71,741 - - (86,128) (11) 8,454 W 1,620,811 167,681 (38,659) 127,332 (6,005) (10,837) 1,860,323
(*) Others include reclassifications of construction-in-progress to intangible assets and other amounting to
W 6,004 million and W 1 million, respectively.
(3) Changes in accumulated depreciation of property, plant and equipment for the years ended December 31,
2013 and 2012 were as follows:
In millions of won 2013
Accumulated depreciation
as of Jan. 1, 2013 Disposals
Increase from
business combination Depreciation Others(*1)
Exchange differences on
translating foreign
operations
Accumulated depreciation
as of Dec. 31, 2013
Buildings W 86,105 (214) 421 8,303 (873) (231) 93,511Structures 17,459 (16) - 1,704 (224) (14) 18,909Machinery and
equipment 311,696 (2,851) - 22,551 (35) 13 331,374Vehicles 37,170 (3,225) 106 6,573 (1) (8) 40,615Tools 74,215 (3,597) 735 10,516 (19) (283) 81,567Furniture and
fixtures 306,662 (19,644) 7,301 43,406 (140) (491) 337,094Other PP&E 15,665 (1,636) - 3,408 - (41) 17,396 W 848,972 (31,183) 8,563 96,461 (1,292) (1,055) 920,466
(*1) Others include reclassifications of depreciation of buildings and structures to non-current assets held for
sale and other decrease amounting W 1,097 million and W 195 million, respectively.
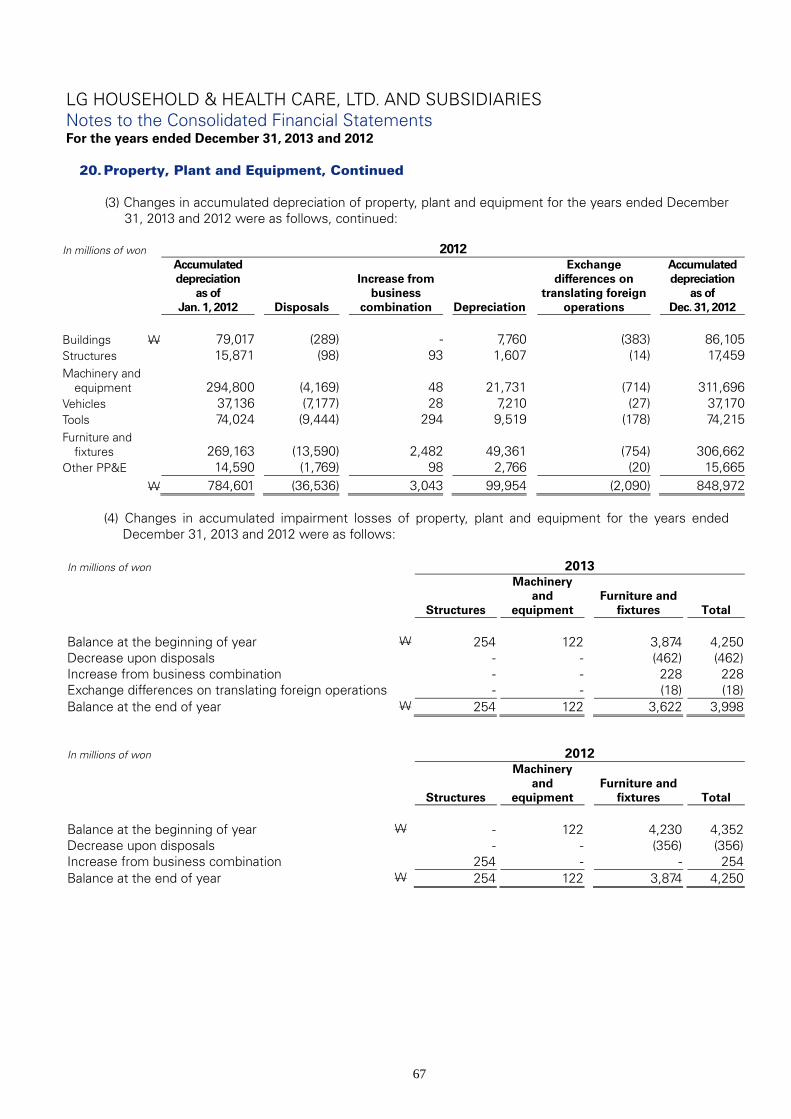
LG HOUSEHOLD & HEALTH CARE, LTD. AND SUBSIDIARIES Notes to the Consolidated Financial Statements For the years ended December 31, 2013 and 2012
67
20. Property, Plant and Equipment, Continued
(3) Changes in accumulated depreciation of property, plant and equipment for the years ended December 31, 2013 and 2012 were as follows, continued:
In millions of won 2012
Accumulated depreciation
as of Jan. 1, 2012 Disposals
Increase from
business combination Depreciation
Exchange differences on
translating foreign operations
Accumulated depreciation
as of Dec. 31, 2012
Buildings W 79,017 (289) - 7,760 (383) 86,105Structures 15,871 (98) 93 1,607 (14) 17,459Machinery and
equipment 294,800 (4,169) 48 21,731 (714) 311,696Vehicles 37,136 (7,177) 28 7,210 (27) 37,170Tools 74,024 (9,444) 294 9,519 (178) 74,215Furniture and
fixtures 269,163 (13,590) 2,482 49,361 (754) 306,662Other PP&E 14,590 (1,769) 98 2,766 (20) 15,665 W 784,601 (36,536) 3,043 99,954 (2,090) 848,972
(4) Changes in accumulated impairment losses of property, plant and equipment for the years ended
December 31, 2013 and 2012 were as follows:
In millions of won 2013
Structures
Machinery and
equipment
Furniture and
fixtures Total
Balance at the beginning of year W 254 122 3,874 4,250 Decrease upon disposals - - (462) (462) Increase from business combination - - 228 228 Exchange differences on translating foreign operations - - (18) (18) Balance at the end of year W 254 122 3,622 3,998
In millions of won 2012
Structures
Machinery and
equipment
Furniture and
fixtures Total
Balance at the beginning of year W - 122 4,230 4,352 Decrease upon disposals - - (356) (356) Increase from business combination 254 - - 254 Balance at the end of year W 254 122 3,874 4,250

LG HOUSEHOLD & HEALTH CARE, LTD. AND SUBSIDIARIES Notes to the Consolidated Financial Statements For the years ended December 31, 2013 and 2012
68
20. Property, Plant and Equipment, Continued
(4) Change in accounting estimates The Group changed its accounting estimates on useful lives of certain furniture and fixtures from 2, 5 and 9 years to 3, 7 and 11 years to reflect economic substance from January 1, 2013. As result of this change in accounting estimates, the Group’s depreciation expense under new useful life was W12,604 million lower than it would have been under the previous useful life for the year ended December 31, 2013. The Group’s property, plant and equipment, income tax payable and retained earnings increased W12,604 million, W868 million and W9,554 million respectively, and the Group’s deferred tax assets decreased W2,182 million as of December 31, 2013. The effect of these changes on actual and expected depreciation expense, included in selling, general and administrative expenses in the consolidated statement of income, was as follows.
In millions of won 2013 2014 Later
Increase (decrease) in depreciation expense W (12,604) (786) 13,390
(6) As of December 31, 2013, property, plant and equipment pledged by HAITAI BEVERAGE CO. and LG
Vina Cosmetics Company Limited., which are subsidiaries of the Group, as collateral are as follows:
(7) As of December 31, 2013, the land of Future, Inc., one of subsidiaries, has been released from the
foreign investment zone and general industrial complex, and an injunction has been granted by a competent court on the land relating to the lawsuits on the transfer of ownership and compensation for damages.
(8) LG Household & Health Care International Trading (Shanghai) Co., Ltd. and THEFACESHOP (Shanghai)
Co., Ltd. have finance leases for furniture and fixtures and other PP&E. Acquisition cost and accumulated depreciation of the leased assets as of December 31, 2013 and 2012 are as follows:
In millions of won 2013 2012
Acquisition cost W 175 36 Accumulated depreciation (101) (1) Book value W 74 35
In millions of won
Book value
Pledged amount
Purpose of
pledge Debt
amount
Secured party
Land, buildings, machineries and others W 61,405 26,000
General loans
13,980
Kookmin Bank Land, buildings
and others 20,303 13,000 General
loans
-
Hana Bank Land, buildings
machineries and others 166,726 17,880
General loans
-
INDUSTRIAL
BANK OF KOREA Buildings and
machineries 1,481 3,208 Working
capital loans
- Shinhan Vina
Bank
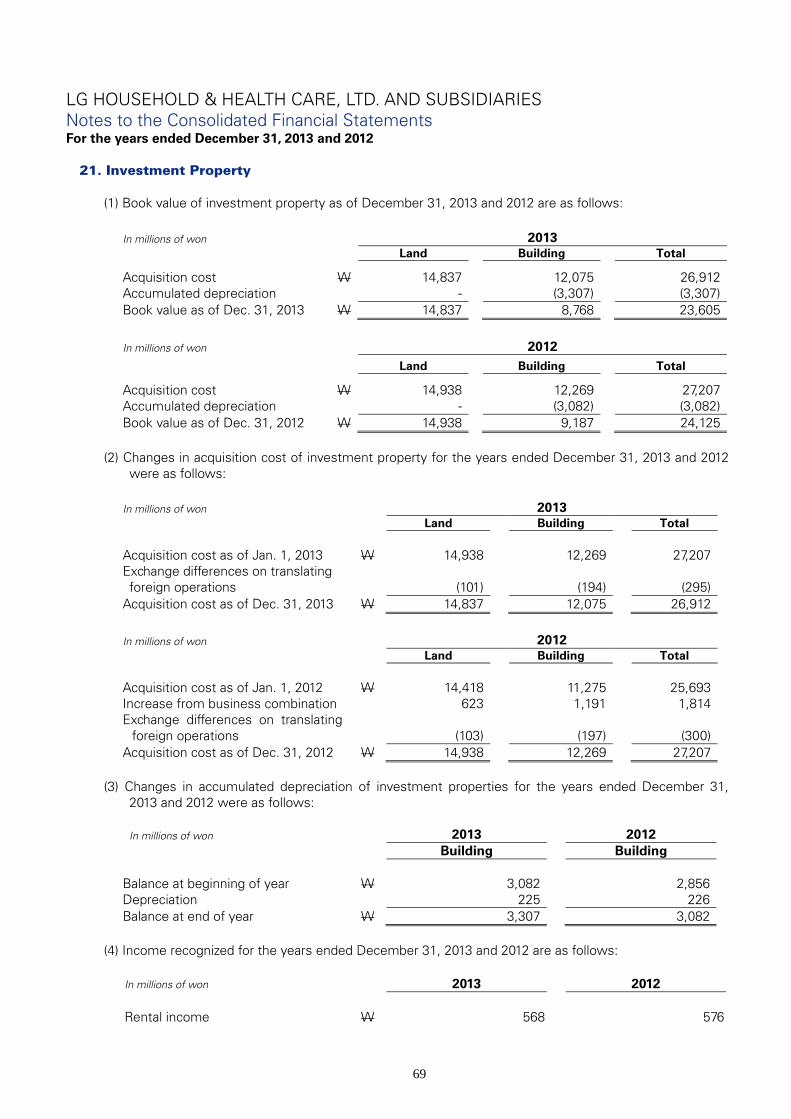
LG HOUSEHOLD & HEALTH CARE, LTD. AND SUBSIDIARIES Notes to the Consolidated Financial Statements For the years ended December 31, 2013 and 2012
69
21. Investment Property
(1) Book value of investment property as of December 31, 2013 and 2012 are as follows:
In millions of won 2013 Land Building Total
Acquisition cost W 14,837 12,075 26,912 Accumulated depreciation - (3,307) (3,307) Book value as of Dec. 31, 2013 W 14,837 8,768 23,605
In millions of won 2012
Land Building Total
Acquisition cost W 14,938 12,269 27,207 Accumulated depreciation - (3,082) (3,082) Book value as of Dec. 31, 2012 W 14,938 9,187 24,125
(2) Changes in acquisition cost of investment property for the years ended December 31, 2013 and 2012
were as follows:
In millions of won 2013 Land Building Total
Acquisition cost as of Jan. 1, 2013 W 14,938 12,269 27,207 Exchange differences on translating foreign operations (101) (194) (295)
Acquisition cost as of Dec. 31, 2013 W 14,837 12,075 26,912
In millions of won 2012 Land Building Total
Acquisition cost as of Jan. 1, 2012 W 14,418 11,275 25,693 Increase from business combination 623 1,191 1,814 Exchange differences on translating
foreign operations (103) (197) (300) Acquisition cost as of Dec. 31, 2012 W 14,938 12,269 27,207
(3) Changes in accumulated depreciation of investment properties for the years ended December 31,
2013 and 2012 were as follows:
In millions of won 2013 2012 Building Building
Balance at beginning of year W 3,082 2,856 Depreciation 225 226 Balance at end of year W 3,307 3,082
(4) Income recognized for the years ended December 31, 2013 and 2012 are as follows:
In millions of won 2013 2012 Rental income W 568 576

LG HOUSEHOLD & HEALTH CARE, LTD. AND SUBSIDIARIES Notes to the Consolidated Financial Statements For the years ended December 31, 2013 and 2012
70
21. Investment Property, Continued (5) Detail of fair value of investment property as of December 31, 2013 is as follows:
In millions of won 2013
Categories Location Book value Fair value
Land Geumwang-eup, Eumseong-gun, Chungbuk(*1) W 14,418 13,548 Bakken Tommysatoshi Nanaage 525-289, Japan(*3) 419 419
Building Daedeok-gu, Daejeon(*2) 7,968 9,488 Bakken Tommysatoshi Nanaage 525-289, Japan(*3) 800 800
(*1) Fair value is based on the sales price that was applied when certain of land in the Kumwang
Industrial Complex was sold in 2010.
(*2) Fair value is based on the valuation report of an independent appraiser as of December 31, 2011. (*3) Fair value is based on the valuation report of an independent external appraiser as of acquisition
date of Ginza Stefany Inc.
The Group does not revaluate the fair value of investment property because the change in fair value is not significant.
22. Goodwill and Intangible Assets
(1) Changes in goodwill and intangible assets for the years ended December 31, 2013 and 2012 were as follows:
In millions of won 2013
Goodwill
Industrial property
rights
Software
Facility usage rights (*3)
Others (*1)
Total
Balance at beginning of year W 355,961 10,826 11,386 19,224 443,246 840,643 Additions - 3,760 619 - 3,050 7,429 Disposals - (938) (1) - (47) (986) Increase from business combination 369,166 5,389 1,522 - 166,894 542,971
Other changes(*2) 9,889 - 6,438 - - 16,327 Amortization - (1,584) (4,594) - (7,374) (13,552) Exchange differences on translating foreign operations (65,621) - (495) - (40,825) (106,941)
Balance at end of year W 669,395 17,453 14,875 19,224 564,944 1,285,891
(*1) Others include Bottler’s Agreement, brand value, customer relationship and others. (*2) Other changes include adjustment of fair value related to acquired assets previous year amounting
W9,889 million and reclassifications of construction-in-progress to intangible assets amounting to W6,348 million.
(*3) The Group tested the facility usage right with an indefinite useful life for impairment. Base on the
results of the impairment test, no impairment of intangible assets was recognized for the year ended December 31, 2013.

LG HOUSEHOLD & HEALTH CARE, LTD. AND SUBSIDIARIES Notes to the Consolidated Financial Statements For the years ended December 31, 2013 and 2012
71
22. Goodwill and Intangible Assets, Continued
(1) Changes in goodwill and intangible assets for the years ended December 31, 2013 and 2012 were as follows, continued:
In millions of won 2012
Goodwill
Industrial property
rights
Software
Facility usage rights (*3)
Others (*1)
Total
Balance at beginning of year W 276,450 9,563 4,949 18,881 353,804 663,647 Additions - 2,570 491 343 1,870 5,274 Disposals - (90) (3) - - (93) Increase from business combination 86,768 114 4,041 - 102,571 193,494
Other changes(*2) - (11) 6,004 - - 5,993 Amortization - (1,320) (3,655) - (3,419) (8,394) Exchange differences on translating foreign operations (7,257) - (441) - (11,580) (19,278)
Balance at end of year 355,961 10,826 11,386 19,224 443,246 840,643
(*1) Others include Bottler’s Agreement, brand value, customer relationship and others. (*2) Other changes include reclassifications of construction-in-progress to intangible assets amounting
to W 6,004 million and other amounting to W 11 million. (*3) The Group tested the facility usage right with an indefinite useful life for impairment. Base on the
results of the impairment test, no impairment of intangible assets was recognized for the year ended December 31, 2012.
(2) The aggregate of research and development expenditure as expense for the years ended December 31,
2013 and 2012 were as follows:
In millions of won 2013 2012 Cost of sales W 7,395 6,416 Selling, general and administrative expenses 11,175 10,651 W 18,570 17,067
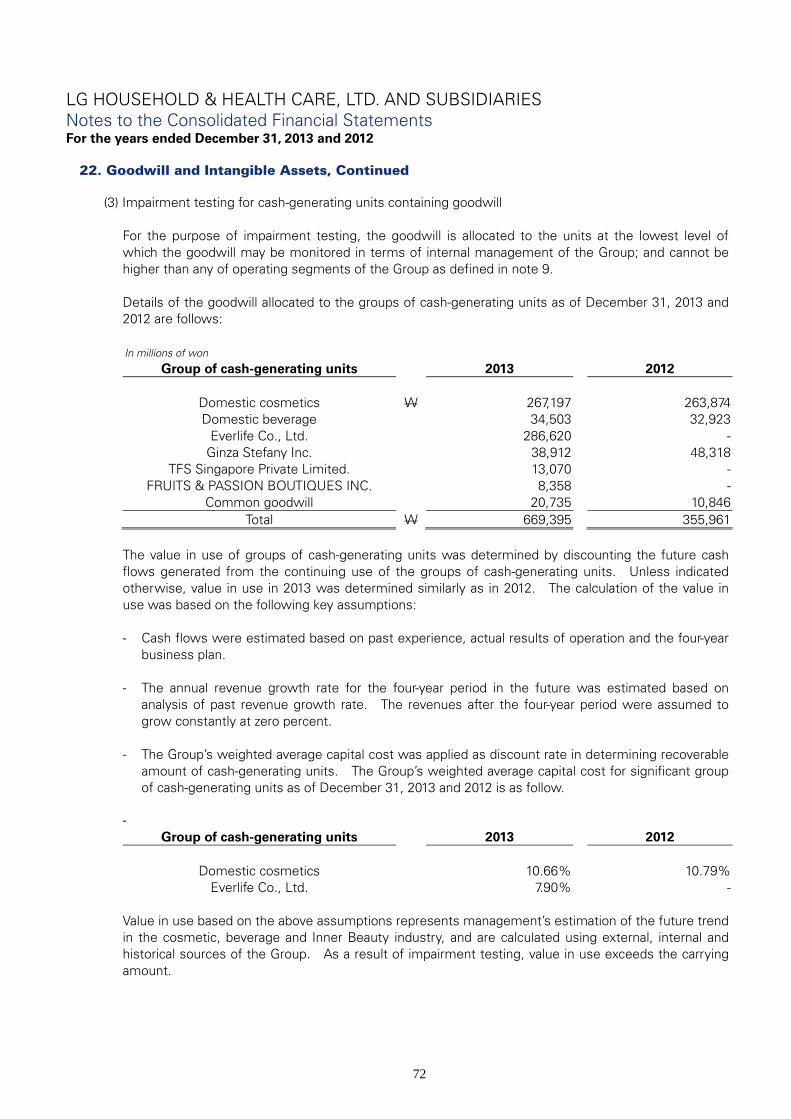
LG HOUSEHOLD & HEALTH CARE, LTD. AND SUBSIDIARIES Notes to the Consolidated Financial Statements For the years ended December 31, 2013 and 2012
72
22. Goodwill and Intangible Assets, Continued (3) Impairment testing for cash-generating units containing goodwill
For the purpose of impairment testing, the goodwill is allocated to the units at the lowest level of which the goodwill may be monitored in terms of internal management of the Group; and cannot be higher than any of operating segments of the Group as defined in note 9.
Details of the goodwill allocated to the groups of cash-generating units as of December 31, 2013 and 2012 are follows:
In millions of won
Group of cash-generating units 2013 2012
Domestic cosmetics W 267,197 263,874 Domestic beverage 34,503 32,923
Everlife Co., Ltd. 286,620 - Ginza Stefany Inc. 38,912 48,318
TFS Singapore Private Limited. 13,070 - FRUITS & PASSION BOUTIQUES INC. 8,358 -
Common goodwill 20,735 10,846 Total W 669,395 355,961
The value in use of groups of cash-generating units was determined by discounting the future cash flows generated from the continuing use of the groups of cash-generating units. Unless indicated otherwise, value in use in 2013 was determined similarly as in 2012. The calculation of the value in use was based on the following key assumptions:
- Cash flows were estimated based on past experience, actual results of operation and the four-year
business plan.
- The annual revenue growth rate for the four-year period in the future was estimated based on analysis of past revenue growth rate. The revenues after the four-year period were assumed to grow constantly at zero percent.
- The Group’s weighted average capital cost was applied as discount rate in determining recoverable amount of cash-generating units. The Group’s weighted average capital cost for significant group of cash-generating units as of December 31, 2013 and 2012 is as follow.
-
Group of cash-generating units 2013 2012
Domestic cosmetics 10.66% 10.79% Everlife Co., Ltd. 7.90% -
Value in use based on the above assumptions represents management’s estimation of the future trend in the cosmetic, beverage and Inner Beauty industry, and are calculated using external, internal and historical sources of the Group. As a result of impairment testing, value in use exceeds the carrying amount.
LG HOUSEHOLD & HEALTH CARE, LTD. AND SUBSIDIARIES Notes to the Consolidated Financial Statements For the years ended December 31, 2013 and 2012
73
22. Goodwill and Intangible Assets, Continued
(4) Impairment testing for cash-generating units containing intangible assets with indefinite useful lives
Details of the intangible assets with indefinite useful lives allocated to the cash-generating units as of December 31, 2013 and 2012 are as follows:
In millions of won
Cash-generating units 2013 2012 Details
TheFaceShop Co., Ltd. W 198,803 169,003 Brand value Coca-Cola Beverage Co. 166,777 166,777 Bottler’s Agreement
Violet Dream Inc. - 29,800 Brand value Everlife Co., Ltd. 82,201 - Brand value
Ginza Stefany lnc., 40,838 50,709 Brand value FRUITS & PASSION BOUTIQUES INC. 6,896 - Brand value
Total W 495,515 416,289
Key assumption applying to test cash-generating units containing intangible assets with indefinite useful lives for impairment is same with the key assumption for impairment testing for cash-generating units containing goodwill. As a result of impairment testing, value in use exceeds the carrying amount.
23. Trade and Other Payables
Trade and other payables as of December 31, 2013 and 2012 are summarized as follows: In millions of won 2013 2012
Trade payables W 202,423 167,736Other payables 180,795 180,069Container deposit liability 4,946 5,083Short-term deposits received - 78 W 388,164 352,966

LG HOUSEHOLD & HEALTH CARE, LTD. AND SUBSIDIARIES Notes to the Consolidated Financial Statements For the years ended December 31, 2013 and 2012
74
24. Short-term Borrowings Short-term borrowings as of December 31, 2013 and 2012 are summarized as follows: In millions of won
Lender
Purpose of borrowing
Annual interest rate(%) 2013
2012
Shinhan Bank and others Commercial paper
2.70 ~ 2.83 W 172,000 84,000 Kookmin Bank and others Overdraft
3.75 13,980 17,889 Industrial and Commercial
Bank
Working capital
- - 692 China Bank Seoul General capital
3.85 15,000 - Shinhan Bank General capital
3M Libor + 2.00 1,258 - Hana Bank General capital
6.90 170 - Citi Vina Bank General capital
- - 1,133 Mizuho Bank, Ltd. General capital
TIBOR + 0.50 92,429 - CITI CANADA BANK General capital
Libor + 1.20 3,101 - Citibank Korea Inc. and others Secured loan
- 18,470 11,725 Shinhan Bank T/R loan
6M Libor + 2.00 1,320 - Others Other
- - 334
W 317,728 115,773
The Group has made agreements with Citibank Korea Inc. and others to discount export trade receivables. Export trade receivables containing right of recourse, discounted to financial institution but not yet maturity, are recognized as short-term borrowings as of December 31, 2013.
25. Long-term Borrowings and Debentures
(1) Long-term borrowings and long-term debentures as of December 31, 2013 and 2012 are summarized as follows:
(i) Local long-term borrowings
In millions of won
Lender Purpose of borrowings Maturity
Annual interest rate
(%) 2013 2012
Standard Chartered Securities Korea Limited
Commercial paper Aug.03, 2015 3.15 W 10,000 10,000 Aug.03, 2015 3.18 10,000 10,000 Sep.01, 2015 3.14 10,000 10,000 Sep.01, 2015 3.08 10,000 10,000
IBK Securities Co., Ltd.
Commercial paper Oct.15, 2015 3.10 10,000 10,000 Oct.20, 2015 3.10 10,000 10,000 Oct.20, 2015 3.10 10,000 10,000 Oct.30, 2015 3.10 10,000 10,000 Oct.30, 2015 3.10 10,000 10,000
Hana Bank Energy facilities capital Mar.15, 2021 3.20 555 - Total 90,555 90,000
Present value account (4,942) (7,680) W 85,613 82,320
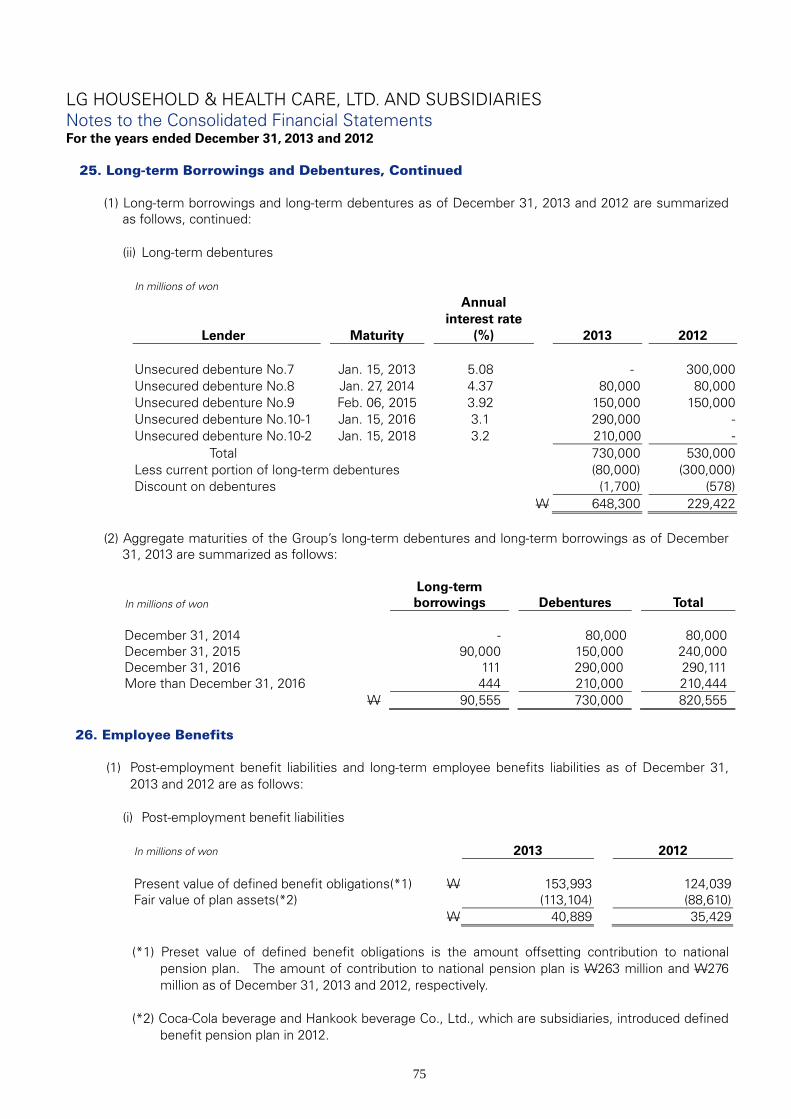
LG HOUSEHOLD & HEALTH CARE, LTD. AND SUBSIDIARIES Notes to the Consolidated Financial Statements For the years ended December 31, 2013 and 2012
75
25. Long-term Borrowings and Debentures, Continued
(1) Long-term borrowings and long-term debentures as of December 31, 2013 and 2012 are summarized as follows, continued:
(ii) Long-term debentures
In millions of won
Lender Maturity
Annual interest rate
(%) 2013 2012 Unsecured debenture No.7 Jan. 15, 2013 5.08 - 300,000 Unsecured debenture No.8 Jan. 27, 2014 4.37 80,000 80,000 Unsecured debenture No.9 Feb. 06, 2015 3.92 150,000 150,000 Unsecured debenture No.10-1 Jan. 15, 2016 3.1 290,000 - Unsecured debenture No.10-2 Jan. 15, 2018 3.2 210,000 -
Total 730,000 530,000 Less current portion of long-term debentures (80,000) (300,000) Discount on debentures (1,700) (578) W 648,300 229,422
(2) Aggregate maturities of the Group’s long-term debentures and long-term borrowings as of December
31, 2013 are summarized as follows:
In millions of won Long-term borrowings
Debentures
Total
December 31, 2014 - 80,000 80,000 December 31, 2015 90,000 150,000 240,000 December 31, 2016 111 290,000 290,111 More than December 31, 2016 444 210,000 210,444 W 90,555 730,000 820,555
26. Employee Benefits
(1) Post-employment benefit liabilities and long-term employee benefits liabilities as of December 31,
2013 and 2012 are as follows:
(i) Post-employment benefit liabilities
In millions of won 2013 2012 Present value of defined benefit obligations(*1) W 153,993 124,039 Fair value of plan assets(*2) (113,104) (88,610) W 40,889 35,429
(*1) Preset value of defined benefit obligations is the amount offsetting contribution to national
pension plan. The amount of contribution to national pension plan is W263 million and W276 million as of December 31, 2013 and 2012, respectively.
(*2) Coca-Cola beverage and Hankook beverage Co., Ltd., which are subsidiaries, introduced defined
benefit pension plan in 2012.
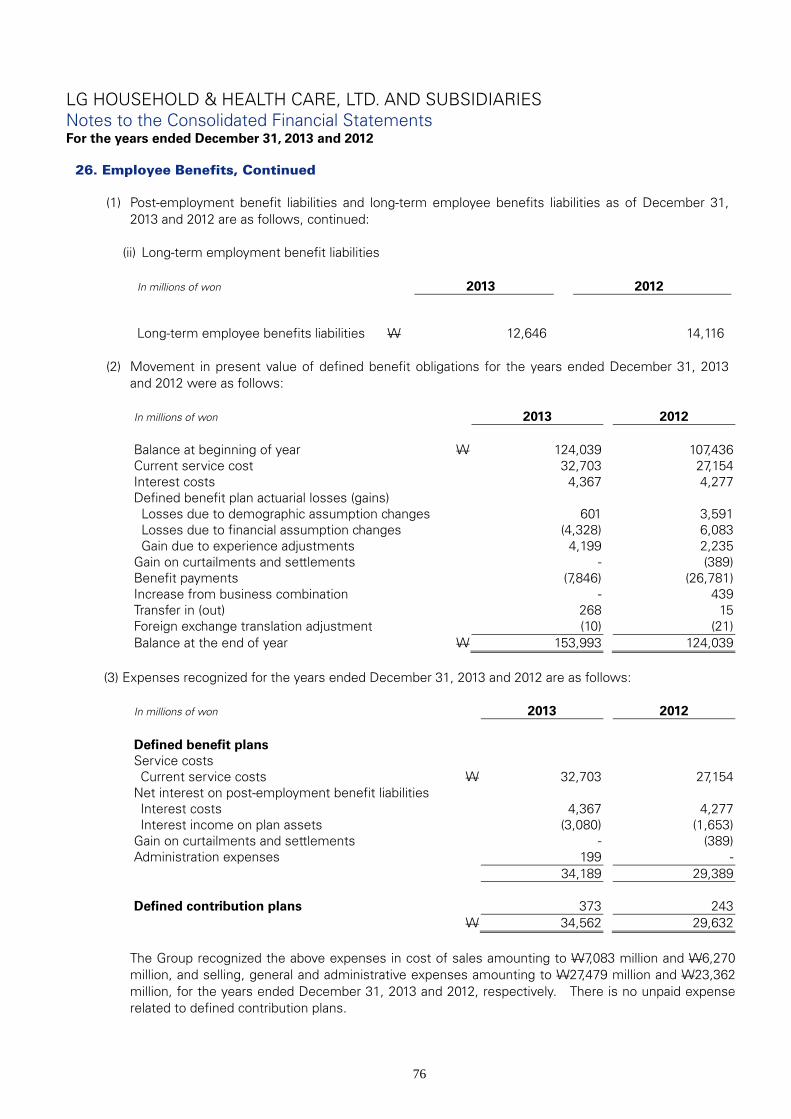
LG HOUSEHOLD & HEALTH CARE, LTD. AND SUBSIDIARIES Notes to the Consolidated Financial Statements For the years ended December 31, 2013 and 2012
76
26. Employee Benefits, Continued (1) Post-employment benefit liabilities and long-term employee benefits liabilities as of December 31,
2013 and 2012 are as follows, continued:
(ii) Long-term employment benefit liabilities
(2) Movement in present value of defined benefit obligations for the years ended December 31, 2013
and 2012 were as follows:
In millions of won 2013 2012 Balance at beginning of year W 124,039 107,436 Current service cost 32,703 27,154 Interest costs 4,367 4,277 Defined benefit plan actuarial losses (gains)
Losses due to demographic assumption changes 601 3,591 Losses due to financial assumption changes (4,328) 6,083 Gain due to experience adjustments 4,199 2,235
Gain on curtailments and settlements - (389) Benefit payments (7,846) (26,781) Increase from business combination - 439 Transfer in (out) 268 15 Foreign exchange translation adjustment (10) (21) Balance at the end of year W 153,993 124,039
(3) Expenses recognized for the years ended December 31, 2013 and 2012 are as follows:
In millions of won 2013 2012 Defined benefit plans Service costs Current service costs W 32,703 27,154
Net interest on post-employment benefit liabilities Interest costs 4,367 4,277 Interest income on plan assets (3,080) (1,653)
Gain on curtailments and settlements - (389) Administration expenses 199 - 34,189 29,389 Defined contribution plans 373 243 W 34,562 29,632
The Group recognized the above expenses in cost of sales amounting to W7,083 million and W6,270 million, and selling, general and administrative expenses amounting to W27,479 million and W23,362 million, for the years ended December 31, 2013 and 2012, respectively. There is no unpaid expense related to defined contribution plans.
In millions of won 2013 2012
Long-term employee benefits liabilities W 12,646 14,116

LG HOUSEHOLD & HEALTH CARE, LTD. AND SUBSIDIARIES Notes to the Consolidated Financial Statements For the years ended December 31, 2013 and 2012
77
26. Employee Benefits, Continued
(4) Changes in fair value of plan assets for the years ended December 31, 2013 and 2012 were as follows:
In millions of won 2013 2012 Balance at beginning of year W 88,610 40,001 Interest income on plan assets 3,080 1,653 Return on plan assets excluding amounts included in interest income 114 27
Employer contribution to plan asset 27,756 49,887 Benefit payment from plan assets (6,488) (2,998) Increase from business combination - 348 Others 32 (308) Balance at the end of year W 113,104 88,610
The actual interest income from plan assets is W3,194 million and W1,680 million for the years ended December 31, 2013 and 2012, respectively. The Group expects to pay W28,311 million in contribution to its defined benefit plans in 2014.
(5) The component of plan assets as of December 31, 2013 and 2012 are as follows:
In millions of won 2013 2012
Government bonds W - 463Corporate bonds - 2,094ELS 33,290 43,347ELB 26,720 -Guaranteed income fund 52,682 41,629Others 412 1,077
W 113,104 88,610 (6) The amount of remeasurements of the net defined benefit liability for the years ended December 31,
2013 and 2012, which are included in comprehensive income (loss) are as follows:
In millions of won 2013 2012 Remeasurements before tax W (358) (11,882) Tax effect 222 3,055 Remeasurements after tax W (136) (8,827)

LG HOUSEHOLD & HEALTH CARE, LTD. AND SUBSIDIARIES Notes to the Consolidated Financial Statements For the years ended December 31, 2013 and 2012
78
26. Employee Benefits, Continued (7) The principal actuarial assumptions as of December 31, 2013 and 2012 are as follows:
2013 2012 Expected rate of increase in salaries 5.00%~6.68% 3.71%~5.11% Discount rate(*1) 3.53%~4.38% 3.50%~3.99%
(*1) For the purpose of calculating present value of defined benefit obligation, the Group used the
discount rate determined based on the yield rate of bonds with high-quality which are in line with defined benefit obligations in terms of currency and maturity.
As of December 31, 2013 and 2012, the weighted-average duration of the defined benefit obligation was from 8.5 years to 12.7 years and 8.3 years to 10.6 years, respectively.
(8) Reasonably possible changes at the reporting date to one of the relevant actuarial assumptions, holding
other assumptions constant, would have affected the defined benefit obligation by the amounts shown below.
In millions of won
1% discount rate
increase 1% discount rate
decrease
Change in discount rate W (28,609) 34,517 Change in expected rate of increase in salaries 34,266 (28,623)
Although the analysis does not take account of the full distribution of cash flows expected under the plan, it does provide an approximation of the sensitivity of the assumptions shown.
27. Other Liabilities
Other liabilities as of December 31, 2013 and 2012 are summarized as follows: In millions of won 2013 2012 Current Non-current Current Non-current
Advances received W 6,417 - 3,566 - Advance income 192 - 286 - Withholdings of value added tax 20,177 - 16,837 - Withholdings 10,977 - 12,128 - Accrued expenses 67,655 - 63,437 - Dividends payable 14 - 12 - Other current liabilities 201 - 106 - Finance lease liabilities(*) 11 86 - 34 Long-term employee benefits liabilities - 12,646 - 14,116 Other provision (note 30) 281 10,630 - 26,103 W 105,925 23,362 96,372 40,253 (*) Details of finance lease liabilities as of December 31, 2013 are summarized as follows:
In millions of won 2013
Future lease payment Within 1 year 1 ~ 5 years Total
Minimum lease payments W 11 94 105 Present value 11 87 98
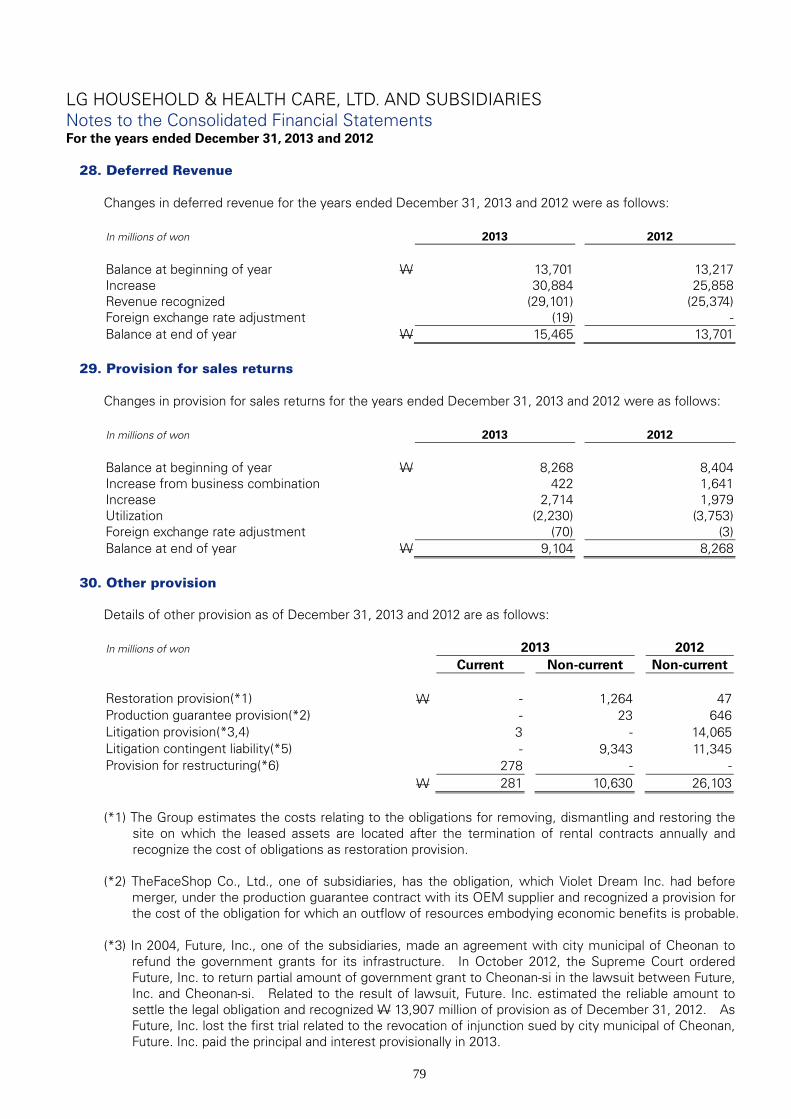
LG HOUSEHOLD & HEALTH CARE, LTD. AND SUBSIDIARIES Notes to the Consolidated Financial Statements For the years ended December 31, 2013 and 2012
79
28. Deferred Revenue Changes in deferred revenue for the years ended December 31, 2013 and 2012 were as follows: In millions of won 2013 2012 Balance at beginning of year W 13,701 13,217 Increase 30,884 25,858 Revenue recognized (29,101) (25,374) Foreign exchange rate adjustment (19) - Balance at end of year W 15,465 13,701
29. Provision for sales returns Changes in provision for sales returns for the years ended December 31, 2013 and 2012 were as follows: In millions of won 2013 2012 Balance at beginning of year W 8,268 8,404 Increase from business combination 422 1,641 Increase 2,714 1,979 Utilization (2,230) (3,753) Foreign exchange rate adjustment (70) (3) Balance at end of year W 9,104 8,268
30. Other provision Details of other provision as of December 31, 2013 and 2012 are as follows: In millions of won 2013 2012 Current Non-current Non-current Restoration provision(*1) W - 1,264 47 Production guarantee provision(*2) - 23 646 Litigation provision(*3,4) 3 - 14,065 Litigation contingent liability(*5) - 9,343 11,345 Provision for restructuring(*6) 278 - - W 281 10,630 26,103 (*1) The Group estimates the costs relating to the obligations for removing, dismantling and restoring the
site on which the leased assets are located after the termination of rental contracts annually and recognize the cost of obligations as restoration provision.
(*2) TheFaceShop Co., Ltd., one of subsidiaries, has the obligation, which Violet Dream Inc. had before
merger, under the production guarantee contract with its OEM supplier and recognized a provision for the cost of the obligation for which an outflow of resources embodying economic benefits is probable.
(*3) In 2004, Future, Inc., one of the subsidiaries, made an agreement with city municipal of Cheonan to
refund the government grants for its infrastructure. In October 2012, the Supreme Court ordered Future, Inc. to return partial amount of government grant to Cheonan-si in the lawsuit between Future, Inc. and Cheonan-si. Related to the result of lawsuit, Future. Inc. estimated the reliable amount to settle the legal obligation and recognized W 13,907 million of provision as of December 31, 2012. As Future, Inc. lost the first trial related to the revocation of injunction sued by city municipal of Cheonan, Future. Inc. paid the principal and interest provisionally in 2013.

LG HOUSEHOLD & HEALTH CARE, LTD. AND SUBSIDIARIES Notes to the Consolidated Financial Statements For the years ended December 31, 2013 and 2012
80
30. Other non-current provision, Continued
(*4) TheFaceShop Co., Ltd., one of the subsidiaries, recognized W158 million of provision for the estimated cost related to a lawsuit filed. As TheFaceShop Co., Ltd. lost at above lawsuit, TheFaceShop Co., Ltd. paid the principal and interest.
(*5) In November 1999, Future, Inc. obtained approval for and initiated the development project of the
entertainment complex on the land designated as foreign investment zone and general industrial complex in Cheonan. In July 2010, however, the land has been released from the designated foreign investment zone and general industrial complex by the governor of South Chungcheong Province as it did not meet the requirements for the designation. Against this measure of South Chungcheong Province, Future, Inc. had consistently claimed the re-designation of the foreign investment zone and general industrial complex, however, the Supreme Court ruled against Future, Inc. at the final trial in November 2012. Consequent to the Supreme Court’s decision, multiple lawsuits have filed against Future, Inc. by the former land owners claiming the ownership and compensation for their expropriated of land.
The Group had recognized a provision of W11,345 million related to contingent liability for damage suit, which occurred before acquiring the shares of Future, Inc., as of acquisition date. But during the measurement period, the Group retrospectively adjusted the provisional amounts and recognized at the acquisition date, to W9,343 million to reflect new information obtained about facts and circumstances that existed as of the acquisition date and, if known, would have affected the measurement amounts recognized as of that date.
(*6) The Group established restructuring plan after TheFaceShop Co., Ltd., one of the subsidiaries,
acquired 100% shares of FRUITS & PASSION BOUTIQUES INC and has performed the restructuring as of December 31, 2013. The restructuring plan includes change of management, unification of business duplication and close of stores.
31. Capital Stock
Details of the Company’s share capital as of December 31, 2013 are as follows: In millions of won, except number of shares and par value
Type of shares
Total number of shares
issued
Number of shares owned by
related parties Number of
treasury shares Par value Capital stock
Common share 15,618,197 5,337,500 958,409 W 5,000 78,091 Preferred share 2,099,697 10,000 3,437 5,000 10,498 17,717,894 5,347,500 961,846 W 88,589
32. Capital Surplus
Details of capital surplus as of December 31, 2013 and 2012 are as follows:
In millions of won 2013 2012 Paid-in capital in excess of par value W 54,794 54,794 Other capital surplus 42,532 42,532
W 97,326 97,326
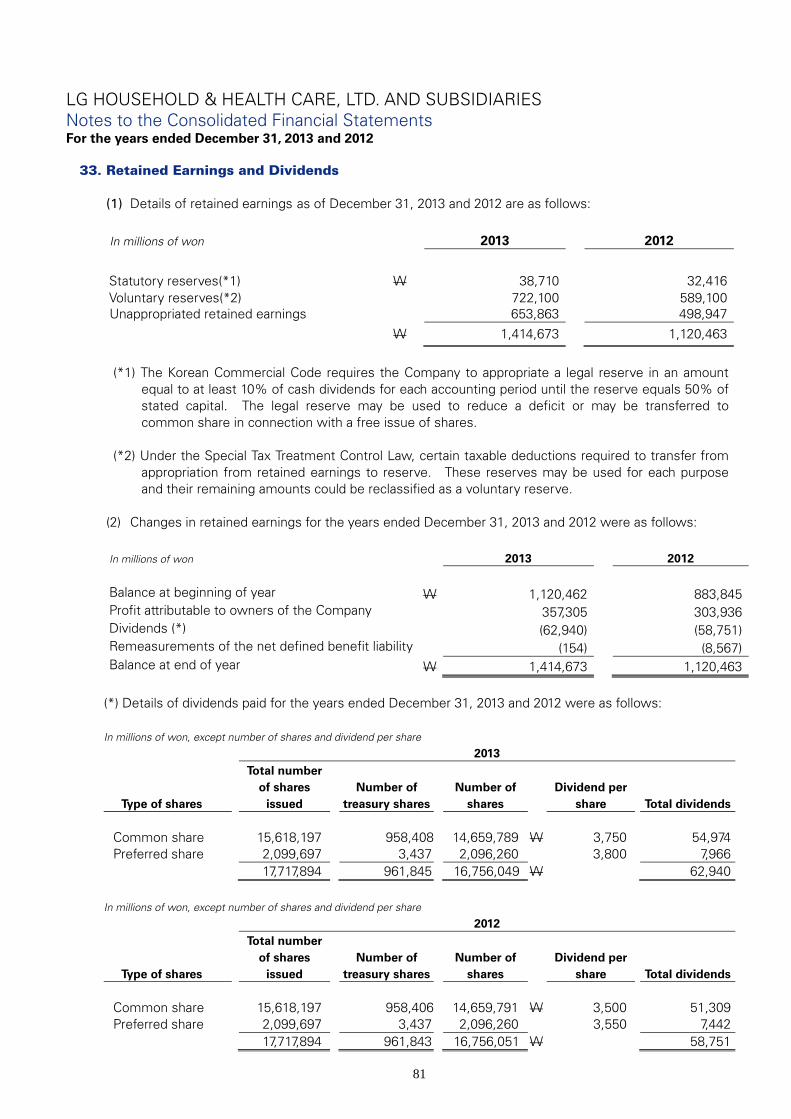
LG HOUSEHOLD & HEALTH CARE, LTD. AND SUBSIDIARIES Notes to the Consolidated Financial Statements For the years ended December 31, 2013 and 2012
81
33. Retained Earnings and Dividends
(1) Details of retained earnings as of December 31, 2013 and 2012 are as follows:
In millions of won
2013 2012
Statutory reserves(*1) W 38,710 32,416 Voluntary reserves(*2) 722,100 589,100 Unappropriated retained earnings 653,863 498,947
W 1,414,673 1,120,463
(*1) The Korean Commercial Code requires the Company to appropriate a legal reserve in an amount
equal to at least 10% of cash dividends for each accounting period until the reserve equals 50% of stated capital. The legal reserve may be used to reduce a deficit or may be transferred to common share in connection with a free issue of shares.
(*2) Under the Special Tax Treatment Control Law, certain taxable deductions required to transfer from
appropriation from retained earnings to reserve. These reserves may be used for each purpose and their remaining amounts could be reclassified as a voluntary reserve.
(2) Changes in retained earnings for the years ended December 31, 2013 and 2012 were as follows: In millions of won 2013 2012
Balance at beginning of year W 1,120,462 883,845 Profit attributable to owners of the Company 357,305 303,936 Dividends (*) (62,940) (58,751) Remeasurements of the net defined benefit liability (154) (8,567) Balance at end of year W 1,414,673 1,120,463
(*) Details of dividends paid for the years ended December 31, 2013 and 2012 were as follows: In millions of won, except number of shares and dividend per share
2013
Type of shares
Total number of shares
issued Number of
treasury shares Number of
shares Dividend per
share
Total dividends
Common share 15,618,197 958,408 14,659,789 W 3,750 54,974 Preferred share 2,099,697 3,437 2,096,260 3,800 7,966 17,717,894 961,845 16,756,049 W 62,940
In millions of won, except number of shares and dividend per share
2012
Type of shares
Total number of shares
issued Number of
treasury shares Number of
shares Dividend per
share
Total dividends
Common share 15,618,197 958,406 14,659,791 W 3,500 51,309 Preferred share 2,099,697 3,437 2,096,260 3,550 7,442 17,717,894 961,843 16,756,051 W 58,751
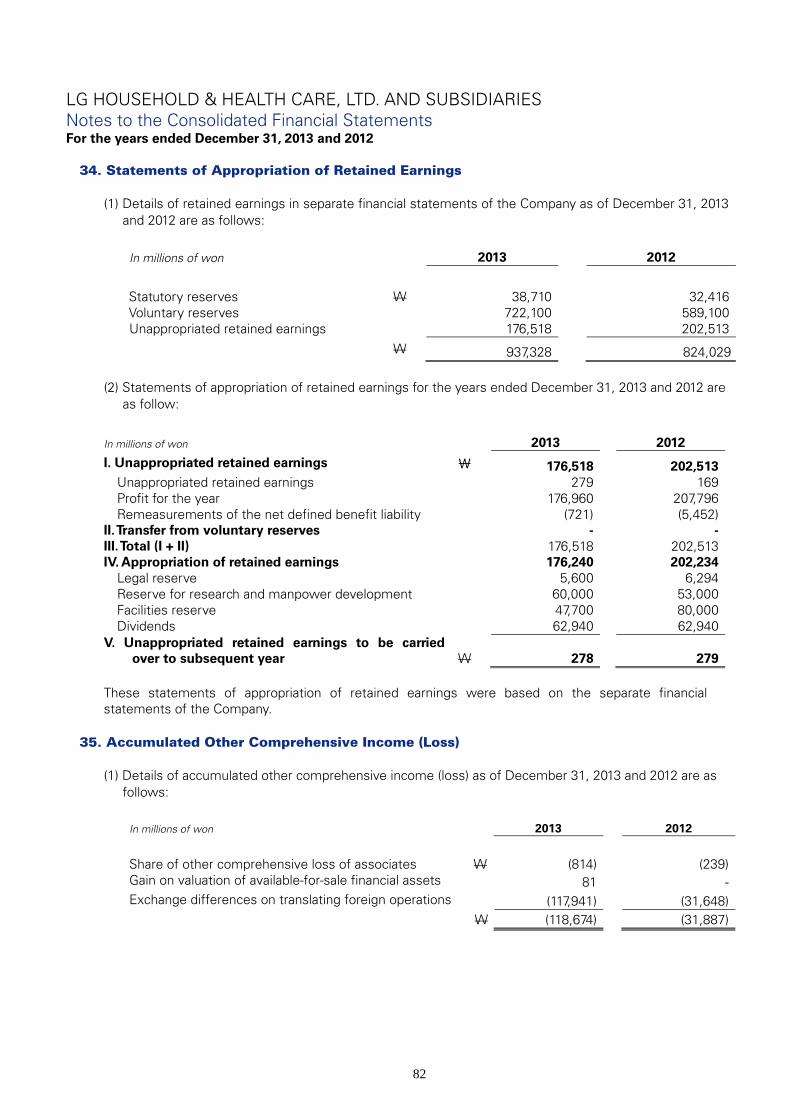
LG HOUSEHOLD & HEALTH CARE, LTD. AND SUBSIDIARIES Notes to the Consolidated Financial Statements For the years ended December 31, 2013 and 2012
82
34. Statements of Appropriation of Retained Earnings
(1) Details of retained earnings in separate financial statements of the Company as of December 31, 2013 and 2012 are as follows:
In millions of won
2013 2012
Statutory reserves W 38,710 32,416 Voluntary reserves 722,100 589,100 Unappropriated retained earnings 176,518 202,513
W 937,328 824,029
(2) Statements of appropriation of retained earnings for the years ended December 31, 2013 and 2012 are
as follow:
In millions of won 2013 2012
I. Unappropriated retained earnings ₩ 176,518 202,513 Unappropriated retained earnings 279 169 Profit for the year 176,960 207,796 Remeasurements of the net defined benefit liability (721) (5,452)
II. Transfer from voluntary reserves
- - III. Total (I + II)
176,518 202,513 IV. Appropriation of retained earnings
176,240 202,234
Legal reserve
5,600 6,294 Reserve for research and manpower development
60,000 53,000
Facilities reserve
47,700 80,000 Dividends
62,940 62,940
V. Unappropriated retained earnings to be carried over to subsequent year W 278 279
These statements of appropriation of retained earnings were based on the separate financial statements of the Company.
35. Accumulated Other Comprehensive Income (Loss)
(1) Details of accumulated other comprehensive income (loss) as of December 31, 2013 and 2012 are as follows:
In millions of won 2013 2012
Share of other comprehensive loss of associates W (814) (239) Gain on valuation of available-for-sale financial assets 81 - Exchange differences on translating foreign operations (117,941) (31,648) W (118,674) (31,887)
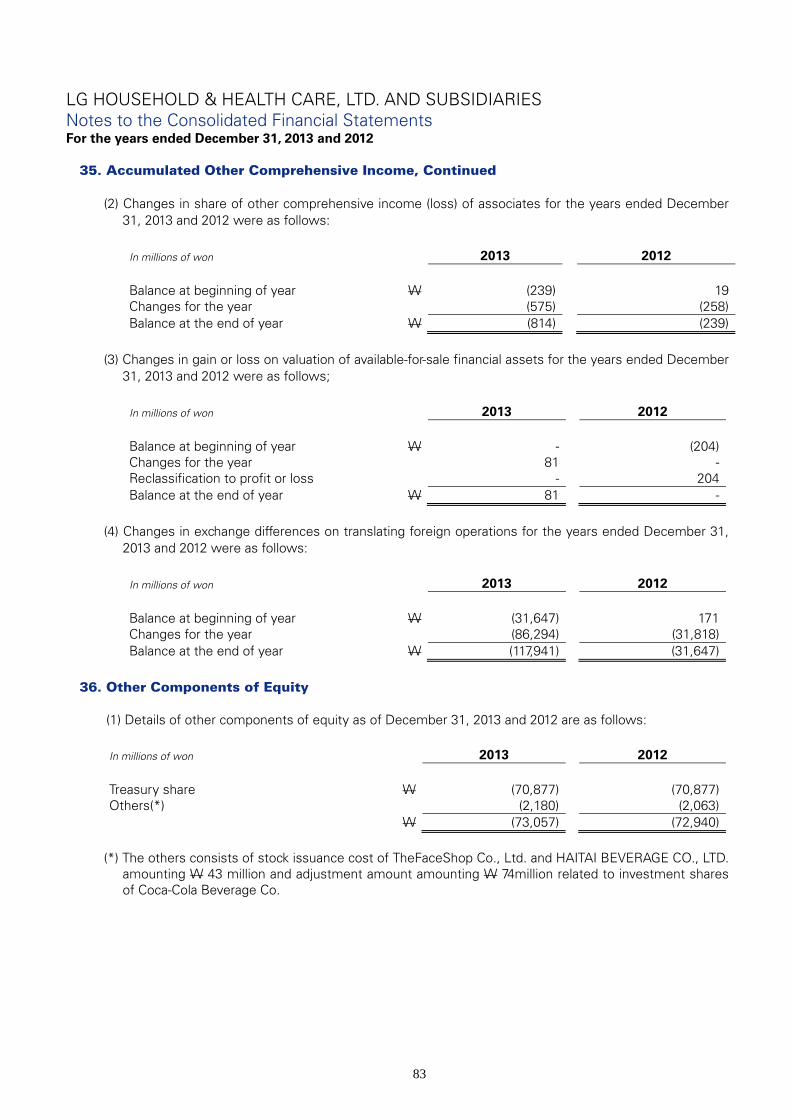
LG HOUSEHOLD & HEALTH CARE, LTD. AND SUBSIDIARIES Notes to the Consolidated Financial Statements For the years ended December 31, 2013 and 2012
83
35. Accumulated Other Comprehensive Income, Continued
(2) Changes in share of other comprehensive income (loss) of associates for the years ended December 31, 2013 and 2012 were as follows:
In millions of won 2013 2012 Balance at beginning of year W (239) 19 Changes for the year (575) (258) Balance at the end of year W (814) (239)
(3) Changes in gain or loss on valuation of available-for-sale financial assets for the years ended December
31, 2013 and 2012 were as follows;
In millions of won 2013 2012 Balance at beginning of year W - (204) Changes for the year 81 - Reclassification to profit or loss - 204 Balance at the end of year W 81 -
(4) Changes in exchange differences on translating foreign operations for the years ended December 31,
2013 and 2012 were as follows:
In millions of won 2013 2012 Balance at beginning of year W (31,647) 171 Changes for the year (86,294) (31,818) Balance at the end of year W (117,941) (31,647)
36. Other Components of Equity
(1) Details of other components of equity as of December 31, 2013 and 2012 are as follows: In millions of won 2013 2012 Treasury share W (70,877) (70,877) Others(*) (2,180) (2,063) W (73,057) (72,940)
(*) The others consists of stock issuance cost of TheFaceShop Co., Ltd. and HAITAI BEVERAGE CO., LTD.
amounting W 43 million and adjustment amount amounting W 74million related to investment shares of Coca-Cola Beverage Co.
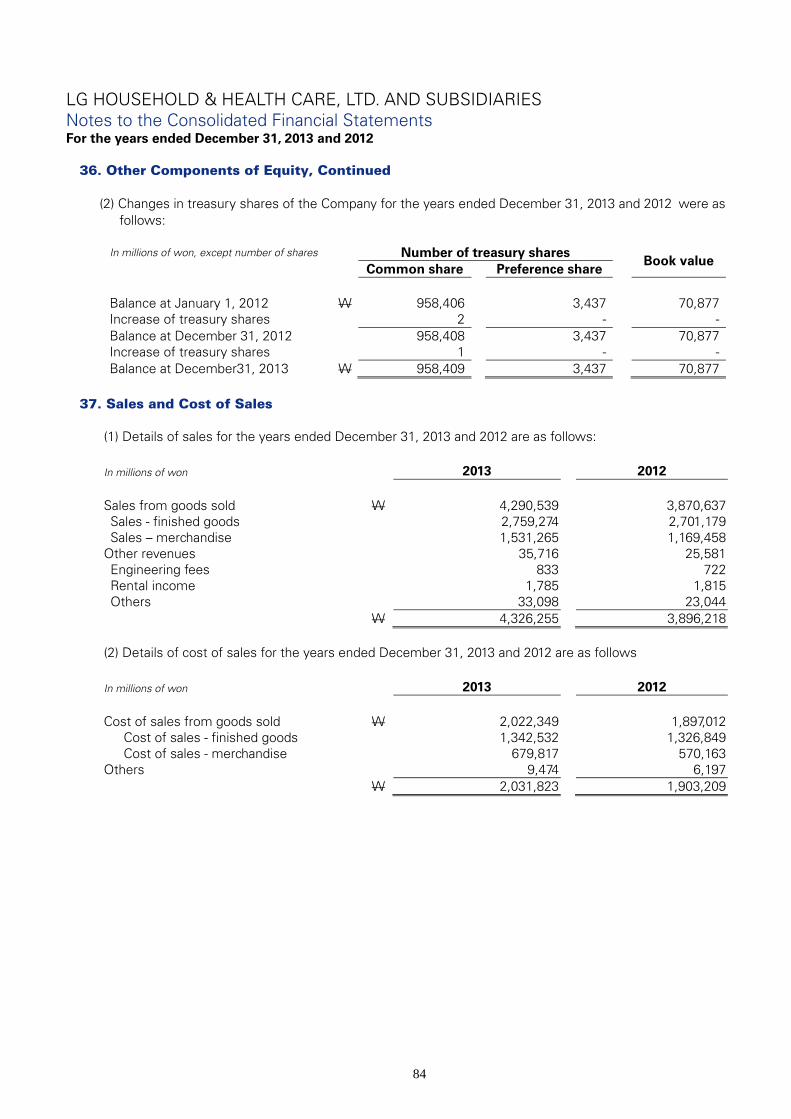
LG HOUSEHOLD & HEALTH CARE, LTD. AND SUBSIDIARIES Notes to the Consolidated Financial Statements For the years ended December 31, 2013 and 2012
84
36. Other Components of Equity, Continued
(2) Changes in treasury shares of the Company for the years ended December 31, 2013 and 2012 were as follows:
In millions of won, except number of shares Number of treasury shares
Book value
Common share Preference share
Balance at January 1, 2012 W 958,406 3,437 70,877 Increase of treasury shares 2 - - Balance at December 31, 2012 958,408 3,437 70,877 Increase of treasury shares 1 - - Balance at December31, 2013 W 958,409 3,437 70,877
37. Sales and Cost of Sales
(1) Details of sales for the years ended December 31, 2013 and 2012 are as follows: In millions of won 2013 2012 Sales from goods sold W 4,290,539 3,870,637 Sales - finished goods 2,759,274 2,701,179 Sales – merchandise 1,531,265 1,169,458 Other revenues 35,716 25,581 Engineering fees 833 722 Rental income 1,785 1,815 Others 33,098 23,044 W 4,326,255 3,896,218 (2) Details of cost of sales for the years ended December 31, 2013 and 2012 are as follows In millions of won 2013 2012 Cost of sales from goods sold W 2,022,349 1,897,012 Cost of sales - finished goods 1,342,532 1,326,849 Cost of sales - merchandise 679,817 570,163 Others 9,474 6,197 W 2,031,823 1,903,209

LG HOUSEHOLD & HEALTH CARE, LTD. AND SUBSIDIARIES Notes to the Consolidated Financial Statements For the years ended December 31, 2013 and 2012
85
38. Selling, General and Administrative Expenses Details of selling, general and administrative expenses for the years ended December 31, 2013 and 2012 are as follows:
In millions of won 2013 2012 Selling, general and administrative expenses: Salaries W 343,423 306,102 Post-employment benefit 27,293 23,362 Other employee benefits 61,808 59,417 Travel 17,685 15,288 Communications 8,312 6,850 Utilities 9,857 8,383 Supplies 8,298 8,130 Taxes and dues 16,696 10,915 Rent 54,062 40,568 Commissions 579,561 505,964 Depreciation 58,746 64,340 Repairs 7,284 7,006 Vehicle maintenance 17,029 17,769 Insurance 3,385 3,270 Advertising 347,288 272,395 Samples 10,371 12,214 Bad debt expense 910 533 Reversal of allowance for doubtful accounts (246) (500) Transportation 105,280 87,083 Publications 3,408 3,656 Education & training 5,717 5,941 Development expenses 10,205 9,703 Amortization 13,307 8,221 Research expenses 969 961 Service fees 76,200 59,230 Miscellaneous 11,172 10,677 W 1,798,020 1,547,478
39. Other non-operating income and expense Details of other non-operating income and expenses for the years ended December 31, 2013 and 2012 are as follows: In millions of won 2013 2012
Other non-operating income:
Foreign currency transaction gain W 2,460 1,605 Foreign currency translation gain 814 163 Gain on disposal of property, plant and equipment 1,688 3,020 Loss on disposal of intangible assets 12 - Others 14,701 14,472 W 19,675 19,260

LG HOUSEHOLD & HEALTH CARE, LTD. AND SUBSIDIARIES Notes to the Consolidated Financial Statements For the years ended December 31, 2013 and 2012
86
39. Other non-operating income and expense, Continued Details of other non-operating income and expenses for the years ended December 31, 2013 and 2012 are as follows, continued: In millions of won 2013 2012
Other non-operating expenses: Other bad debt expense W 1 8 Foreign currency transaction loss 3,014 2,185 Foreign currency translation loss 562 595 Loss on disposal of subsidiary - 45 Loss on disposal of property, plant and equipment 2,995 1,525 Loss on disposal of intangible assets 872 93 Donations 9,627 13,204 Others 6,992 4,345 W 24,063 22,000
40. Nature of Expenses
Details of nature of expenses for the years ended December 31, 2013 and 2012 are as follows:
In millions of won 2013 2012
Changes in inventories W (48,734) (7,005) Purchase of raw materials and merchandise 1,445,728 1,696,907 Employee benefits expense 457,328 409,366 Depreciation and amortization 110,238 108,573 Commissions 626,114 517,004 Outsourcing service fee 361,177 332,272 Others 902,055 415,571 Total(*) W 3,853,906 3,472,688 (*) The amount of nature of expenses is the sum of cost of sales, selling, general and administrative
expense, impairment of assets and other non-operating expense in the statement of income. 41. Finance Income and Finance Cost
Details of finance income and finance cost for the years ended December 31, 2013 and 2012 are as follows: In millions of won 2013 2012
Finance income: Interest income W 3,031 3,352 Dividend income 8 6 Foreign currency transaction gain 13 44 Foreign currency translation gain 11,759 13,946 Gain on disposal of available-for-sale financial assets 431 - W 15,242 17,348
Finance cost: Interest expense W 37,310 32,961 Foreign currency transaction loss 79 1,078 Foreign currency translation loss - 41 Impairment losses of available-for-sale financial assets - 732 W 37,389 34,812

LG HOUSEHOLD & HEALTH CARE, LTD. AND SUBSIDIARIES Notes to the Consolidated Financial Statements For the years ended December 31, 2013 and 2012
87
42. Income and Expense by Categories of Financial Instruments (1) Details of income and expense by categories of financial instruments for the years ended December 31, 2013 and 2012 were as follows:
In millions of won 2013 Financial assets Financial liabilities
Cash and cash
equivalents
Loans and receivables Available-for-sale
financial assets
Financial liabilities measured at amortized cost
Total
Short-term financial deposits
Trade receivables
Other receivables
Other long-term
receivables
Trade
payables
Other
payables
Borrowings
Debentures
Other non-current
liabilities
Interest income W 2,842 1 - 169 19 - - - - - - 3,031Interest expense - - - - - - - - (11,431) (25,877) (2) (37,310)Dividend income - - - - - 8 - - - - - 8Gain on disposal of available-for-sale financial assets
- - - - - 431 - - - - - 431Foreign currency transaction gain (loss)
(101) - (472) 199 - - (62) (184) - - - (620)
Foreign currency translation gain (loss)
(232) - (2) (8) - - 582 11,670 - - 1 12,011
Bad debt expense - - (664) - - - - - - - - (664)Other bad debt expense
- - - (1) - - - - - - - (1)
W 2,509 1 (1,138) 359 19 439 520 11,486 (11,431) (25,877) (1) (23,114)

LG HOUSEHOLD & HEALTH CARE, LTD. AND SUBSIDIARIES Notes to the Consolidated Financial Statements For the years ended December 31, 2013 and 2012
88
42. Income and Expense by Categories of Financial Instruments, Continued (1) Details of income and expense by categories of financial instruments for the years ended December 31, 2013 and 2012 were as follows, continued:
In millions of won 2012 Financial assets Financial liabilities
Cash and cash
equivalents
Loans and receivables Available-for-sale
financial assets
Financial liabilities measured at amortized cost
Total
Short-term financial deposits
Trade receivables
Other receivables
Other long-term
receivables
Trade
payables
Other
payables
Borrowings
Debentures
Other non-current
liabilities
Interest income W 2,919 1 - 56 376 - - - - - - 3,352Interest expense - - - - - - - - (5,970) (26,991) - (32,961)Dividend income - - - - - 6 - - - - - 6Impairment losses of available-for-sale financial assets
- - - - - (732) - - - - - (732)Foreign currency transaction gain (loss)
(1,320) - (595) 81 - - 204 16 - - - (1,614)
Foreign currency translation gain (loss)
(421) - (26) (64) (11) - (3) 13,996 - - 2 13,473
Bad debt expense - - (33) - - - - - - - - (33)Other bad debt expense
- - - (8) - - - - - - - (8)
W 1,178 1 (654) 65 365 (726) 201 14,012 (5,970) (26,991) 2 (18,517)
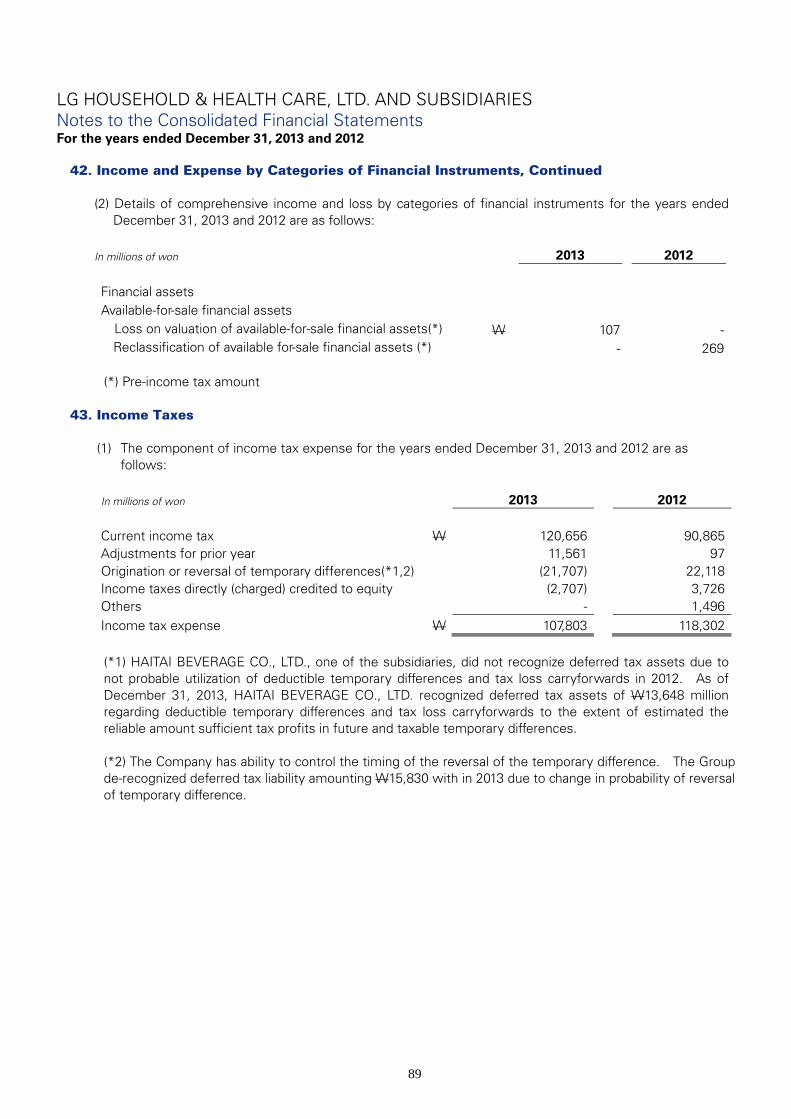
LG HOUSEHOLD & HEALTH CARE, LTD. AND SUBSIDIARIES Notes to the Consolidated Financial Statements For the years ended December 31, 2013 and 2012
89
42. Income and Expense by Categories of Financial Instruments, Continued (2) Details of comprehensive income and loss by categories of financial instruments for the years ended
December 31, 2013 and 2012 are as follows:
In millions of won 2013 2012 Financial assets Available-for-sale financial assets
Loss on valuation of available-for-sale financial assets(*) W 107 - Reclassification of available for-sale financial assets (*) - 269
(*) Pre-income tax amount
43. Income Taxes
(1) The component of income tax expense for the years ended December 31, 2013 and 2012 are as
follows:
In millions of won 2013 2012 Current income tax W 120,656 90,865 Adjustments for prior year 11,561 97 Origination or reversal of temporary differences(*1,2) (21,707) 22,118 Income taxes directly (charged) credited to equity (2,707) 3,726 Others - 1,496 Income tax expense W 107,803 118,302
(*1) HAITAI BEVERAGE CO., LTD., one of the subsidiaries, did not recognize deferred tax assets due to not probable utilization of deductible temporary differences and tax loss carryforwards in 2012. As of December 31, 2013, HAITAI BEVERAGE CO., LTD. recognized deferred tax assets of W13,648 million regarding deductible temporary differences and tax loss carryforwards to the extent of estimated the reliable amount sufficient tax profits in future and taxable temporary differences.
(*2) The Company has ability to control the timing of the reversal of the temporary difference. The Group de-recognized deferred tax liability amounting W15,830 with in 2013 due to change in probability of reversal of temporary difference.

LG HOUSEHOLD & HEALTH CARE, LTD. AND SUBSIDIARIES Notes to the Consolidated Financial Statements For the years ended December 31, 2013 and 2012
90
43. Income Taxes
(2) Income tax and deferred income tax recognized directly to equity for the years ended December 31, 2013 and 2012 are as follows:
In millions of won 2013 2012
Income tax Defined benefit plan actuarial losses W (222) (2,716) Exchange differences on translating foreign operations 3,452 - 3,230 (2,716)
Deferred tax Valuation of available-for-sale financial asset 26 65 Share of other comprehensive loss of associates 189 (82) Exchange differences on translating foreign operations (812) (654) Defined benefit plan actuarial losses - (339) Others 74
(523) (1,010) Income taxes recognized directly in equity W 2,707 (3,726)
(3) Reconciliation of effective tax rate:
In millions of won 2013 2012
Profit before income tax W 473,456 430,290 Income tax using statutory rate 128,848 115,495 Adjustment:
Non-taxable income (3,450) (5,272) Tax credit (2,996) (3,384) Adjustments for prior year 11,462 667 Unused tax losses and others (13,931) 463 Tax effects on share of net income of subsidiaries, associates and joint ventures (9,497) 11,075
Tax effects on depreciation of tangible assets at fair value assessment (1,871) (796) Others (762) 54
Income tax expense W 107,803 118,302 Effective tax rate 22.77% 27.49%
(4) Deferred tax expenses by origination and reversal of deferred assets and liabilities and temporary
differences for the years ended December 31, 2013 and 2012 are as follows:
In millions of won 2013 2012
Deferred liabilities as at the end of the year W (168,385) (150,965)Changes in foreign exchange translation 13,259 3,037 Others(*1) 3,351 -Changes in business combination (55,737) (31,928)Deferred liabilities as at the beginning of the year (150,965) (99,956)Deferred tax expenses by origination and reversal oftemporary differences W (21,707) 22,118
(*1) Others included adjustments of deferred tax liabilities as adjustments of net assets acquired.

LG HOUSEHOLD & HEALTH CARE, LTD. AND SUBSIDIARIES Notes to the Consolidated Financial Statements For the years ended December 31, 2013 and 2012
91
43. Income Taxes, Continued (5) As of December 31, 2013, the tax effects of temporary difference were calculated using expected tax
rate of the fiscal period when the temporary differences are expected to be reversed.
(6) The Group set off a deferred tax asset against a deferred tax liability of the same taxable entity if, and only if, they relate to income taxes levied by the same taxation authority and the entity has a legally enforceable right to set off current tax assets against current tax liabilities.
(7) Change in deferred tax assets and liabilities for the years ended December 31, 2013 and 2012 were as follows:
(i) 2013
In millions of won 2013
Beginning balance
Increase from
business combination
Credited to profit
(charged to loss)
Credited(charged) to other
comprehensive income Others
Foreign exchange
rate adjustment
Ending balance
Temporary differences: PP&E W (27,074) 764 255 - 3,351 (895) (23,599)Intangible assets (104,956) (57,725) 1,952 - - 14,368 (146,361)Post-employment benefit
liabilities 3,370 - 644 - - (2) 4,012Provision for sales return 1,916 97 195 - - (21) 2,187Inventories 8,335 516 2,192 - - (136) 10,907Deferred revenue 3,316 - 223 - - - 3,539Other accounts payable 63 250 (157) - - (34) 122Long-term employee benefits
liabilities
3,447 - (305) - - - 3,142Long-term borrowings (1,859) - 1,859 - - - -Accrued expenses 9,325 1,343 94 - - (299) 10,463Prepaid expenses 8,668 - (799) - - 12 7,881Reserve for research and
manpower development
(20,570) - (2,662) - - - (23,232)Investment in subsidiaries (27,302) - (39,428) 22,519 - - (44,211)Investment in associates (2,863) - 929 (181) - - (2,115)Others 15,624 (355) (13,454) - - 223 2,038Gains (losses) on valuation of
available-for-sale financial assets
- - - (26) - - (26)
(130,560) (55,110) (48,462) 22,312 3,351 13,216 (195,253)
Tax loss carryforwards 29,708 - (9,213) - - - 20,495Tax credit 188 - (188) - - - -Unrecognized deferred tax
assets due to not probable realizability
(50,301) (627) 79,047 (21,789) - 43 6,373
W (150,965) (55,737) 21,184 523 3,351 13,259 (168,385)

LG HOUSEHOLD & HEALTH CARE, LTD. AND SUBSIDIARIES Notes to the Consolidated Financial Statements For the years ended December 31, 2013 and 2012
92
43. Income Taxes, Continued (7) Change in deferred tax assets and liabilities for the years ended December 31, 2013 and 2012 were
as follows, continued: (ii) 2012 In millions of won 2012
Beginning balance
Increase from business
combination
Credited to profit (charged
to loss)
Credited(charged) to other
comprehensive income
Effect of change in tax rate
Ending balance
Temporary differences: PP&E W (18,323) (8,535) 652 - (868) (27,074)Intangible assets (85,287) (25,012) 1,234 - 4,109 (104,956)Post-employment benefit
liabilities
11,382 - (8,008) - (4) 3,370Provision for sales return 1,958 8 (49) - (1) 1,916Inventories 6,861 435 1,109 - (70) 8,335Deferred revenue 3,197 - 119 - - 3,316Other accounts payable 160 - (97) - - 63Long-term employee benefits
liabilities 3,052 - 395 - - 3,447Long-term borrowings - - (1,859) - - (1,859)Accrued expenses 13,106 202 (3,953) - (30) 9,325Prepaid expenses 8,044 (89) 692 - 21 8,668Reserve for research and
manpower development (20,327) - (243) - - (20,570)Investment in subsidiaries (20,038) - (15,554) 8,290 - (27,302)Investment in associates (2,138) - (807) 82 - (2,863)Others 8,370 6,676 698 - (120) 15,624Gains (losses) on valuation of
available-for-sale financial assets
66 - (1) (65) - -
(89,917) (26,315) (25,672) 8,307 3,037 (130,560) Tax loss carryforwards 29,805 383 (480) - - 29,708Tax credit 135 - 53 - - 188Unrecognized deferred tax
assets due to not probable realizability
(39,979) (5,996) 2,972 (7,298) - (50,301)
W
(99,956) (31,928) (23,127) 1,009 3,037 (150,965)

LG HOUSEHOLD & HEALTH CARE, LTD. AND SUBSIDIARIES Notes to the Consolidated Financial Statements For the years ended December 31, 2013 and 2012
93
43. Income Taxes, Continued (8) The aggregate amounts of deferred tax assets and liabilities, and current tax assets and liabilities
before offsetting are as follows:
In millions of won 2013 2012
Deferred tax:
Deferred tax assets W 74,311 105,294 Deferred income tax liabilities (249,069) (205,958) Unrecognized deferred tax liabilities (assets) 6,373 (50,301) Deferred tax assets (liabilities), net (168,385) (150,965)
Income tax payable: Income tax payable W (94,615) (83,480) Prepaid income tax 29,532 30,687 Income tax payable, net (65,083) (52,793)
(9) The amount of deductible temporary differences and unused tax losses (except investments in
subsidiaries) for which no deferred tax assets are recognized as follows:
In millions of won Amount Expected year of
expiration Unused tax losses 2009 W 16,079 2019 2010 22,962 2020 2011 19,229 2021 2012 3,025 2022 2013 752 2023 62,047 Deductible temporary differences 636
Total(*1) W 62,683 (*1) The Group recognized deferred tax assets related with tax loss carryforwards amounting to W31,472
million and tax loss carryforwards amounting W4,980 million was used and W37,292 was reversed, respectively, in 2013. As of December 31, 2013, the Group does not recognize deferred tax assets related with tax loss carryforwards amounting to W 62,047 million. When there are sufficient tax profits, tax loss could be recognized as deferred tax assets.
(10) Temporary differences not recognized as deferred tax assets (liabilities) related to investments in
associates and subsidiaries for the years ended December 31, 2013 and 2012 are as follows:
In millions of won
2013 2012
Deductible temporary differences
Investment in subsidiaries W 99,971 40,340 Investment in associates 2,327 -
Subtotal 102,298 40,340 Taxable temporary differences Investment in subsidiaries(*) (185,736) (2,242)
W (83,438) 38,098
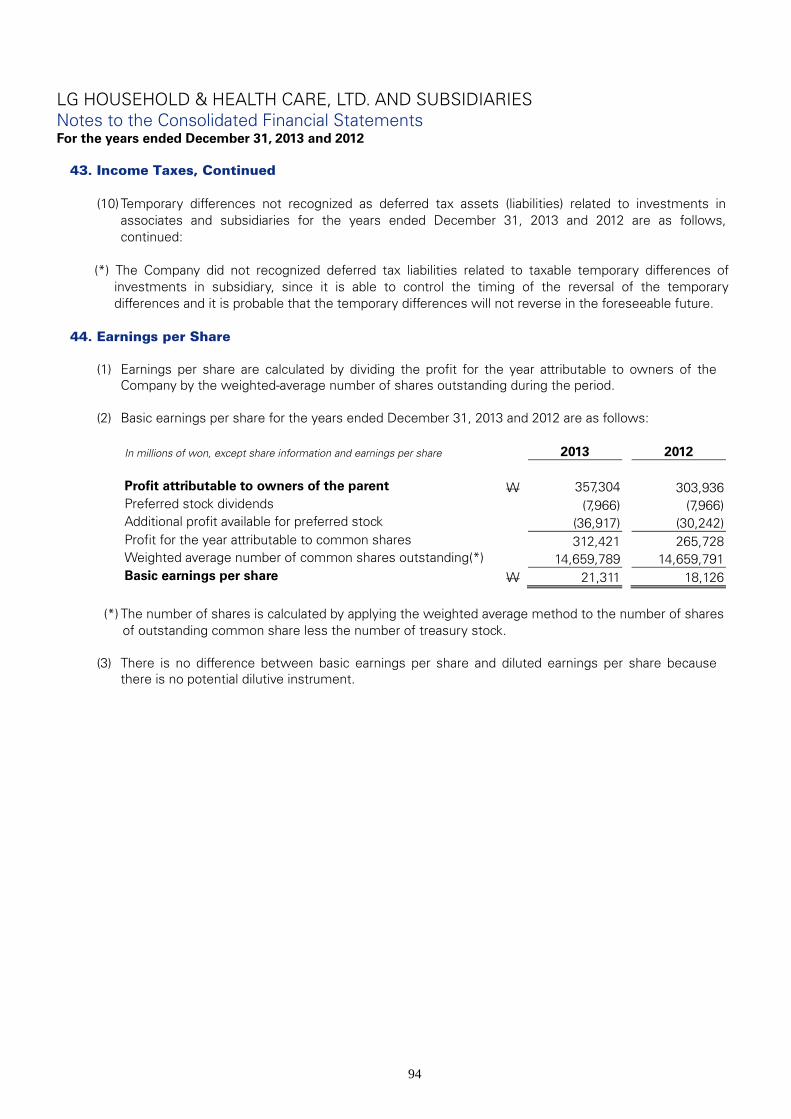
LG HOUSEHOLD & HEALTH CARE, LTD. AND SUBSIDIARIES Notes to the Consolidated Financial Statements For the years ended December 31, 2013 and 2012
94
43. Income Taxes, Continued (10) Temporary differences not recognized as deferred tax assets (liabilities) related to investments in
associates and subsidiaries for the years ended December 31, 2013 and 2012 are as follows, continued:
(*) The Company did not recognized deferred tax liabilities related to taxable temporary differences of
investments in subsidiary, since it is able to control the timing of the reversal of the temporary differences and it is probable that the temporary differences will not reverse in the foreseeable future.
44. Earnings per Share
(1) Earnings per share are calculated by dividing the profit for the year attributable to owners of the
Company by the weighted-average number of shares outstanding during the period. (2) Basic earnings per share for the years ended December 31, 2013 and 2012 are as follows:
In millions of won, except share information and earnings per share 2013 2012 Profit attributable to owners of the parent W 357,304 303,936 Preferred stock dividends (7,966) (7,966) Additional profit available for preferred stock (36,917) (30,242) Profit for the year attributable to common shares 312,421 265,728 Weighted average number of common shares outstanding(*) 14,659,789 14,659,791 Basic earnings per share W 21,311 18,126
(*) The number of shares is calculated by applying the weighted average method to the number of shares
of outstanding common share less the number of treasury stock. (3) There is no difference between basic earnings per share and diluted earnings per share because
there is no potential dilutive instrument.
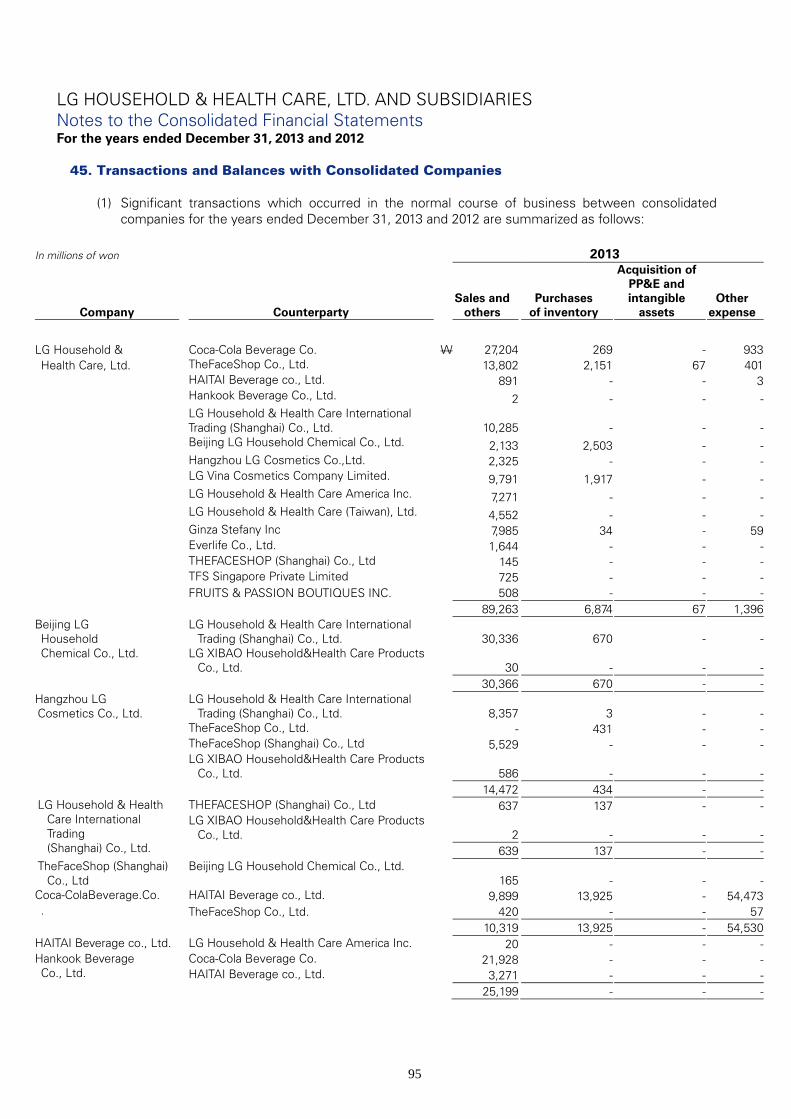
LG HOUSEHOLD & HEALTH CARE, LTD. AND SUBSIDIARIES Notes to the Consolidated Financial Statements For the years ended December 31, 2013 and 2012
95
45. Transactions and Balances with Consolidated Companies
(1) Significant transactions which occurred in the normal course of business between consolidated companies for the years ended December 31, 2013 and 2012 are summarized as follows:
In millions of won 2013
Company Counterparty Sales and
others
Purchases
of inventory
Acquisition of PP&E and intangible
assets
Other expense
LG Household & Coca-Cola Beverage Co. W 27,204 269 - 933Health Care, Ltd. TheFaceShop Co., Ltd. 13,802 2,151 67 401 HAITAI Beverage co., Ltd. 891 - - 3
Hankook Beverage Co., Ltd. 2 - - -
LG Household & Health Care International Trading (Shanghai) Co., Ltd. 10,285 - - -
Beijing LG Household Chemical Co., Ltd. 2,133 2,503 - - Hangzhou LG Cosmetics Co.,Ltd. 2,325 - - - LG Vina Cosmetics Company Limited. 9,791 1,917 - - LG Household & Health Care America Inc. 7,271 - - - LG Household & Health Care (Taiwan), Ltd. 4,552 - - - Ginza Stefany Inc 7,985 34 - 59 Everlife Co., Ltd. 1,644 - - - THEFACESHOP (Shanghai) Co., Ltd 145 - - - TFS Singapore Private Limited 725 - - - FRUITS & PASSION BOUTIQUES INC. 508 - - - 89,263 6,874 67 1,396Beijing LG Household Chemical Co., Ltd.
LG Household & Health Care International Trading (Shanghai) Co., Ltd. 30,336 670 - -
LG XIBAO Household&Health Care Products Co., Ltd. 30 - - -
30,366 670 - -Hangzhou LG Cosmetics Co., Ltd.
LG Household & Health Care International Trading (Shanghai) Co., Ltd. 8,357 3 - -
TheFaceShop Co., Ltd. - 431 - - TheFaceShop (Shanghai) Co., Ltd 5,529 - - - LG XIBAO Household&Health Care Products
Co., Ltd. 586 - - - 14,472 434 - -LG Household & Health
Care International Trading (Shanghai) Co., Ltd.
THEFACESHOP (Shanghai) Co., Ltd 637 137 - -LG XIBAO Household&Health Care Products
Co., Ltd. 2 - - - 639 137 - -
TheFaceShop (Shanghai) Co., Ltd
Beijing LG Household Chemical Co., Ltd. 165 - - -
Coca-ColaBeverage.Co. HAITAI Beverage co., Ltd. 9,899 13,925 - 54,473. TheFaceShop Co., Ltd. 420 - - 57
10,319 13,925 - 54,530HAITAI Beverage co., Ltd. LG Household & Health Care America Inc. 20 - - -Hankook Beverage Co., Ltd.
Coca-Cola Beverage Co. 21,928 - - -HAITAI Beverage co., Ltd. 3,271 - - -
25,199 - - -

LG HOUSEHOLD & HEALTH CARE, LTD. AND SUBSIDIARIES Notes to the Consolidated Financial Statements For the years ended December 31, 2013 and 2012
96
45. Transactions and Balances with Consolidated Companies, Continued
(1) Significant transactions which occurred in the normal course of business between consolidated companies for the years ended December 31, 2013 and 2012 are summarized as follows, continued:
In millions of won 2013
Company Counterparty Sales and
others
Purchases
of inventory
Acquisition of PP&E and intangible
assets
Other expense
TheFaceShop Co., Ltd. LG Vina Cosmetics Company Limited W 270 - - - LG Household & Health Care America Inc. 153 - - - LG Household & Health Care (Taiwan), Ltd. 3,594 - - -
Ginza Stefany Inc 960 - - - THEFACESHOP North America Inc. 121 - - - THEFACESHOP (Shanghai) Co., Ltd 7,825 - - - TFS Singapore Private Limited 5,912 - - - FRUITS & PASSION BOUTIQUES INC. 900 - - - 19,735 - - -THE FACESHOP TRADE
(Guandong) Co.,Ltd(*9) THEFACESHOP (Shanghai) Co., Ltd 15 - - -Ginza Stefany Inc Everlife Co., Ltd. 388 818 - 576Everlife Co., Ltd. LG Household & HealthCare(Taiwan), Ltd. 80 - - - Everlifeagency Co., Ltd. 67 - - 40,650 147 - - 40,650 W 190,728 22,858 67 97,152
In millions of won 2012
Company Counterparty Sales and
others
Purchases
of inventory
Acquisition of PP&E and intangible
assets
Other expense
LG Household & Coca-Cola Beverage Co. W 20,511 1,393 - 526Health Care, Ltd. TheFaceShop Co., Ltd. 4,055 2,734 - 253 HAITAI Beverage co., Ltd. 199 - - - Violet Dream Inc. 6,523 1,984 - 3 DIAMOND PURE WATER CO., LTD. 1 - - -
Hankook Beverage Co., Ltd. - - - 10
LG Household & Health Care International Trading (Shanghai) Co., Ltd. 7,581 - - -
Beijing LG Household Chemical Co., Ltd. 2,170 - - - Hangzhou LG Cosmetics Co.,Ltd. 2,023 - - - LG Vina Cosmetics Company Limited. 8,036 2,378 - - LG Household & Health Care America Inc. 4,443 - - - LG Household & Health Care (Taiwan), Ltd. 3,488 - - - Ginza Stefany Inc 13,367 - - - 72,397 8,489 - 792Beijing LG Household Chemical Co., Ltd.
LG Household & Health Care International Trading (Shanghai) Co., Ltd. 29,160 420 - -
Hangzhou LG Cosmetics Co.,Ltd.
LG Household & Health Care International Trading (Shanghai) Co., Ltd. 8,391 95 - -
TheFaceShop Co., Ltd. - 299 - - THEFACESHOP (Shanghai) Co., Ltd 3,850 - - - 12,241 394 - -

LG HOUSEHOLD & HEALTH CARE, LTD. AND SUBSIDIARIES Notes to the Consolidated Financial Statements For the years ended December 31, 2013 and 2012
97
45. Transactions and Balances with Consolidated Companies, Continued
(1) Significant transactions which occurred in the normal course of business between consolidated companies for the years ended December 31, 2013 and 2012 are summarized as follows, continued:
In millions of won 2012
Company Counterparty Sales and
others
Purchases
of inventory
Acquisition of PP&E and intangible
assets
Other expense
LG Household & Health Care International Trading (Shanghai) Co., Ltd. THEFACESHOP (Shanghai) Co., Ltd W 686 - - -
Coca-Cola Beverage Co. HAITAI Beverage co., Ltd. 9,049 8,493 - 31,555 TheFaceShop Co., Ltd. 19 - - 21 Violet Dream Inc. 372 - - -
DIAMOND PURE WATER CO., LTD. 31 876 - 11,493 9,471 9,369 - 43,069HAITAI Beverage co., Ltd. DIAMOND PURE WATER CO., LTD. 82 - - -Hankook Beverage Co., Ltd.
Coca-Cola Beverage Co. 18,446 - - -HAITAI Beverage co., Ltd. 2,297 1 - -
20,743 1 - -TheFaceShop Co., Ltd. HAITAI Beverage co., Ltd. 60 1 - - Violet Dream Inc. 45 3,634 - - LG Household & HealthCare(Taiwan), Ltd. 3,572 - - - THEFACESHOP North America Inc. 109 - - - THEFACESHOP (Shanghai) Co., Ltd 5,821 - - - 9,607 3,635 - -Violet Dream Inc. LG Vina Cosmetics Company Limited 735 - - - PLUSONE CO, Ltd 11 - - - ONE INERNATIONAL CO, Ltd 512 - - - 1,258 - - - W 155,645 22,308 - 43,861

LG HOUSEHOLD & HEALTH CARE, LTD. AND SUBSIDIARIES Notes to the Consolidated Financial Statements For the years ended December 31, 2013 and 2012
98
45. Transactions and Balances with Consolidated Companies, Continued
(2) Finance transactions which occurred between consolidated companies for the years ended December 31, 2013 and 2012 are summarized as follows:
In millions of won 2013 Loan transaction Borrowing transaction
Capital increase
Capital
reduction Company
Counterparty Loans
Collection Borrowing
(*1)
Repayment
LG Household & Health Care, Ltd. Ginza Stefany Inc W - - 166 - - -
Future, Inc. - - - - 15,000 - LG XIBAO Household&Health Care Products Co., Ltd. - - - - 5,353 - LG-Santina Limited - - - - 616 -
- - 166 - 20,969 -Coca-Cola Beverage Co.(*2) LG Household & Health Care, Ltd. - - - - - 148,500TheFaceShop Co., Ltd. THE FACESHOP TRADE (Guandong) Co.,Ltd - - - - 4,337 -LG Household & Health Care International Trading (Shanghai) Co.,Ltd.
Beijing LG Household Chemical Co.,Ltd. - - - 1,668 - - Hangzhou LG Cosmetics Co.,Ltd. - - 2,391 - - - THEFACESHOP (Shanghai) Co., Ltd - - 4,650 - - - THE FACESHOP TRADE (Guandong) Co.,Ltd 8,027 - - - - -
8,027 - 7,041 1,668 - - W 8,027 - 7,207 1,668 25,306 148,500
(*1) It includes interest cost incurred on the borrowing. (*2) Total paid amount for capital reduction of Coca-Cola Beverage Co. is W165,000 million. W148,500 million is the amount allocated to the Company for capital reduction.
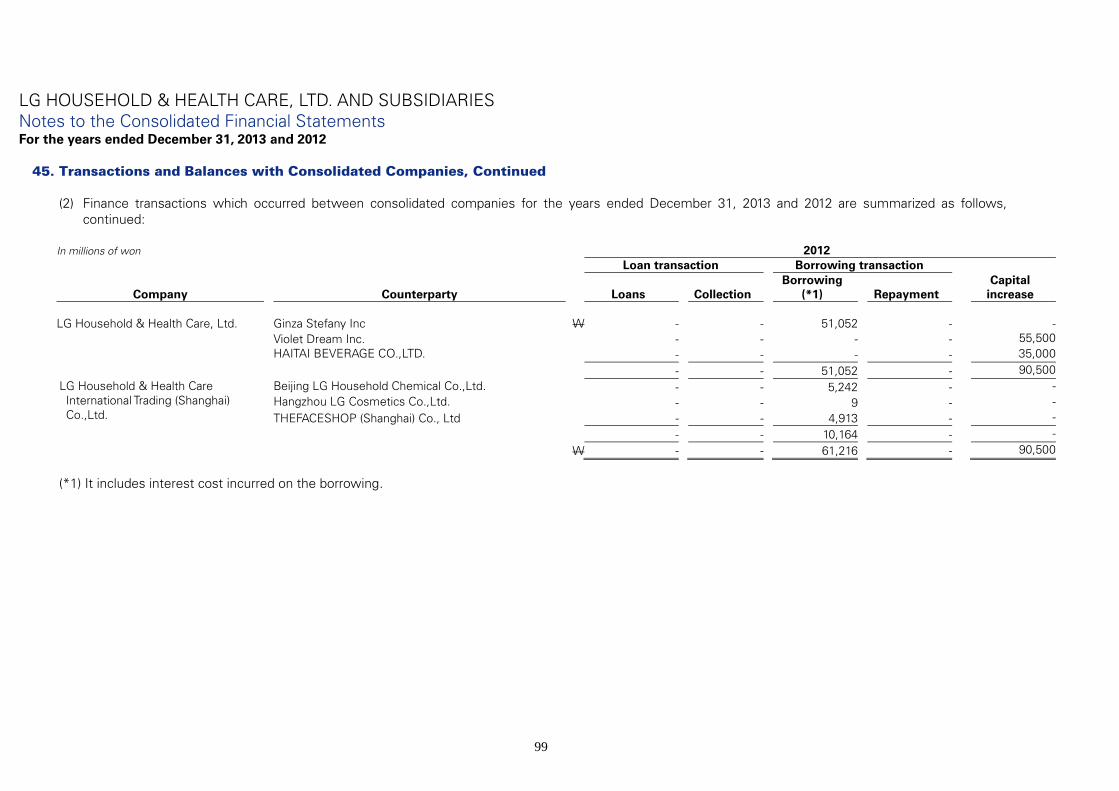
LG HOUSEHOLD & HEALTH CARE, LTD. AND SUBSIDIARIES Notes to the Consolidated Financial Statements For the years ended December 31, 2013 and 2012
99
45. Transactions and Balances with Consolidated Companies, Continued
(2) Finance transactions which occurred between consolidated companies for the years ended December 31, 2013 and 2012 are summarized as follows, continued:
In millions of won 2012 Loan transaction Borrowing transaction
Capital increase Company
Counterparty Loans
Collection
Borrowing (*1)
Repayment
LG Household & Health Care, Ltd. Ginza Stefany Inc W - - 51,052 - -
Violet Dream Inc. - - - - 55,500 HAITAI BEVERAGE CO.,LTD. - - - - 35,000
- - 51,052 - 90,500 LG Household & Health Care International Trading (Shanghai) Co.,Ltd.
Beijing LG Household Chemical Co.,Ltd. - - 5,242 - - Hangzhou LG Cosmetics Co.,Ltd. - - 9 - - THEFACESHOP (Shanghai) Co., Ltd - - 4,913 - -
- - 10,164 - - W - - 61,216 - 90,500
(*1) It includes interest cost incurred on the borrowing.

LG HOUSEHOLD & HEALTH CARE, LTD. AND SUBSIDIARIES Notes to the Consolidated Financial Statements For the years ended December 31, 2013 and 2012
100
45. Transactions and Balances with Consolidated Companies, Continued (3) Balances between consolidated companies as of December 31, 2013 and December 31, 2012 are as
follows
2013 In millions of won Receivables Payables
Company Counterparty
Trade receivables and others Loans
Trade payable
and others Borrowing LG Household & Health Care, Ltd.
Coca-Cola Beverage Co. W 11,462 - 541 - TheFaceShop Co., Ltd. 5,003 - 3,138 - HAITAI BEVERAGE CO.,LTD. 2,924 - 90 -
LG Household & Health Care International
Trading (Shanghai) Co.,Ltd.
2,590 - - - Beijing LG Household Chemical Co.,Ltd. 807 - 133 - Hangzhou LG Cosmetics Co.,Ltd. 527 - - - LG Vina Cosmetics Company Limited 2,599 - 583 - LG Household & Health Care America Inc. 2,142 - - - LG Household & Health Care (Taiwan), Ltd. 1,079 - - - Ginza Stefany Inc. 153 - 436 36,284 Everlife Co., Ltd. 832 - - - THEFACESHOP (Shanghai) Co., Ltd 138 - - - TFS Singapore Private Limited 250 - - - FRUITS & PASSION BOUTIQUES INC. 531 - - -
31,037 - 4,921 36,284 Beijing LG Household Chemical Co., Ltd.
LG Household & Health Care International Trading (Shanghai) Co., Ltd.
7,643 3,307 - -
Hangzhou LG Cosmetics Co., Ltd.
LG Household & Health Care International Trading (Shanghai) Co., Ltd.
2,231 2,302 - -
TheFaceShop Co., Ltd. - - 52 - The Faceshop (Shanghai) Co., Ltd. 854 - - - 3,085 2,302 52 - LG Household & Health Care International Trading (Shanghai) Co., Ltd.
THEFACESHOP (Shanghai) Co., Ltd - - - 9,173 THE FACESHOP TRADE (Guandong) Co.,Ltd - 7,846 - - - 7,846 - 9,173
THEFACESHOP (Shanghai) Co., Ltd Beijing LG Household Chemical Co., Ltd.
4 - - - Coca-Cola Beverage Co. HAITAI Beverage co., Ltd. 11,120 - 9,102 - TheFaceShop Co., Ltd. 4 - - - Hankook Beverage Co., Ltd. 148 - 1,837 - 11,272 - 10,939 - TheFaceShop Co., Ltd. Ginza Stefany Inc. 12 - - - THEFACESHOP North America Inc. 55 - - - THEFACESHOP (Shanghai) Co., Ltd 1,595 - - - TFS Singapore Private Limited 2,060 - - -
FRUITS & PASSION BOUTIQUES INC. 751 5 - - 4,473 5 - - Hankook Beverage Co., Ltd. HAITAI Beverage co., Ltd. 553 - 3 - Ginza Stefany Inc. Everlife Co., Ltd. 28 - 334 - Everlife Co., Ltd. LG Household & HealthCare(Taiwan), Ltd. 29 - - - Everlifeagency Co., Ltd. 80 - 2,844 - . 109 - 2,844 -
W 58,204 13,460 19,093 45,457

LG HOUSEHOLD & HEALTH CARE, LTD. AND SUBSIDIARIES Notes to the Consolidated Financial Statements For the years ended December 31, 2013 and 2012
101
45. Transactions and Balances with Consolidated Companies, Continued (3) Balances between consolidated companies as of December 31, 2013 and December 31, 2012 are as
follows, continued: 2012 In millions of won Receivables Payables
Company Counterparty
Trade receivables and others Loans
Trade payable
and others Borrowing
LG Household & Health Care, Ltd.
Coca-Cola Beverage Co. W 3,752 - 520 - TheFaceShop Co., Ltd. 1,036 - 3,044 - HAITAI BEVERAGE CO.,LTD. 468 - 90 - Violet Dream Inc. 769 - 535 -
LG Household & Health Care International Trading (Shanghai) Co.,Ltd.
1,410 - - -
Beijing LG Household Chemical Co.,Ltd. 689 - - - Hangzhou LG Cosmetics Co.,Ltd. 409 - - - LG Vina Cosmetics Company Limited 1,536 - 336 - LG Household & Health Care America Inc. 1,780 - - - LG Household & Health Care (Taiwan), Ltd. 524 - - - Ginza Stefany Inc. 352 - - 45,068
12,725 - 4,525 45,068 Beijing LG Household Chemical Co., Ltd.
LG Household & Health Care International Trading (Shanghai) Co., Ltd.
7,598 5,011 - -
Hangzhou LG Cosmetics Co., Ltd.
LG Household & Health Care International Trading (Shanghai) Co., Ltd.
2,136 2 - -
TheFaceShop Co., Ltd. - - 137 - The Faceshop (Shanghai) Co., Ltd. 1,490 - - - 3,626 2 137 - LG Household & Health Care International Trading (Shanghai) Co., Ltd. THEFACESHOP (Shanghai) Co., Ltd
- - - 4,665 Coca-Cola Beverage Co. HAITAI Beverage co., Ltd. 12,224 - 1,314 - TheFaceShop Co., Ltd. 3 - - - DIAMOND PURE WATER CO., LTD. 164 - 12 - Hankook Beverage Co., Ltd. 231 - 1,621 - 12,622 - 2,947 - HAITAI BEVERAGE CO.,LTD. DIAMOND PURE WATER CO., LTD. 6 - - -
Hankook Beverage Co., Ltd. HAITAI Beverage co., Ltd. 597 - - - TheFaceShop Co., Ltd. Violet Dream Inc. 46 - 9,675 - THEFACESHOP North America Inc. 81 - - - THEFACESHOP (Shanghai) Co., Ltd 2,364 - - - . 2,491 - 9,675 -
W 39,665 5,013 17,284 49,733
(4) Details of guarantees provided between the Group as of December 31, 2013 are as follows:
In thousands of JPY and USD
Provided by Counterparty Guarantee recipient Amount of guarantee
Amount of borrowings
Period of guarantee Remarks
LG Household & Health Care, Ltd.
Everlife Co., Ltd. Mizuho Bank, Ltd. JPY 13,500,000 JPY 9,200,000 2013.01.25~ 2014.01.24
Guarantee with in credit limit
TheFaceShop Co., Ltd. FRUITS & PASSIONBOUTIQUES INC.
Citibank, N.A Canadian Branch
USD 5,000,000 USD 3,000,000 2013.09.13~ 2014.09.12
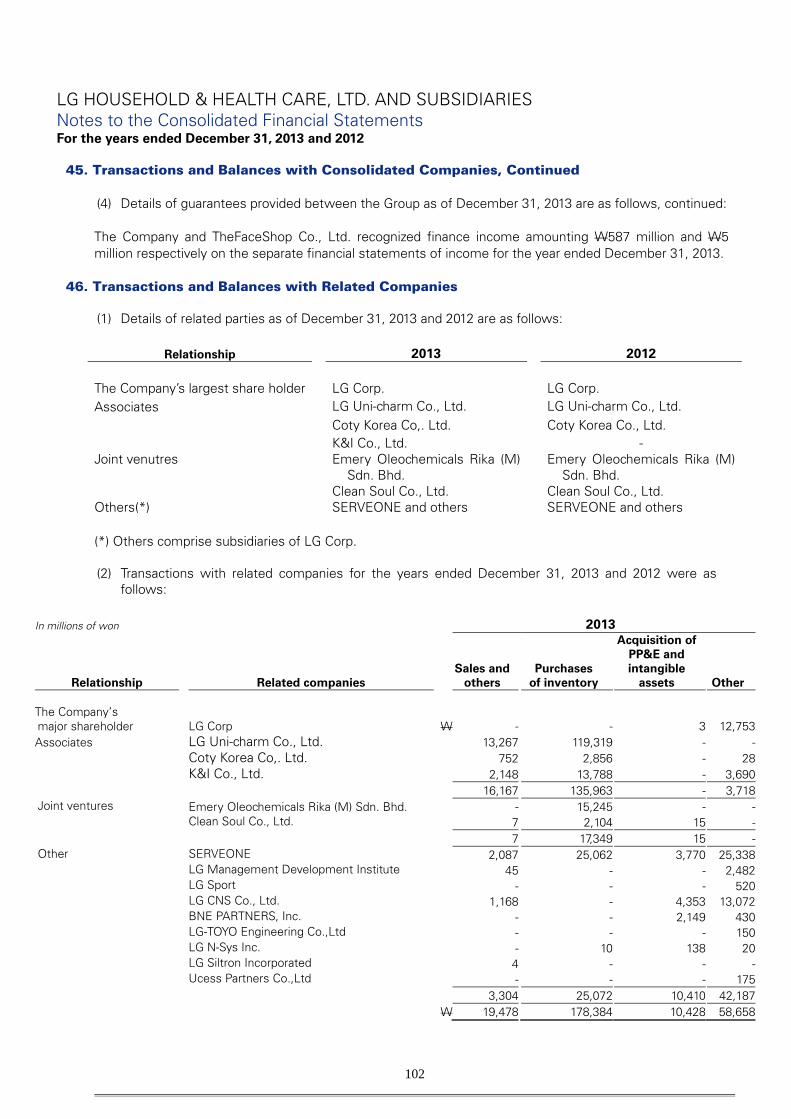
LG HOUSEHOLD & HEALTH CARE, LTD. AND SUBSIDIARIES Notes to the Consolidated Financial Statements For the years ended December 31, 2013 and 2012
102
45. Transactions and Balances with Consolidated Companies, Continued
(4) Details of guarantees provided between the Group as of December 31, 2013 are as follows, continued: The Company and TheFaceShop Co., Ltd. recognized finance income amounting W587 million and W5 million respectively on the separate financial statements of income for the year ended December 31, 2013.
46. Transactions and Balances with Related Companies
(1) Details of related parties as of December 31, 2013 and 2012 are as follows:
Relationship 2013 2012 The Company’s largest share holder LG Corp. LG Corp. Associates LG Uni-charm Co., Ltd. LG Uni-charm Co., Ltd. Coty Korea Co,. Ltd. Coty Korea Co., Ltd. K&I Co., Ltd. - Joint venutres
Emery Oleochemicals Rika (M)
Sdn. Bhd. Emery Oleochemicals Rika (M)
Sdn. Bhd. Clean Soul Co., Ltd. Clean Soul Co., Ltd. Others(*) SERVEONE and others SERVEONE and others (*) Others comprise subsidiaries of LG Corp. (2) Transactions with related companies for the years ended December 31, 2013 and 2012 were as
follows:
In millions of won 2013
Relationship Related companies Sales and
others
Purchases
of inventory
Acquisition of PP&E and intangible
assets
Other
The Company’s major shareholder LG Corp W - - 3 12,753Associates LG Uni-charm Co., Ltd. 13,267 119,319 - - Coty Korea Co,. Ltd. 752 2,856 - 28
K&I Co., Ltd. 2,148 13,788 - 3,690 16,167 135,963 - 3,718Joint ventures Emery Oleochemicals Rika (M) Sdn. Bhd. - 15,245 - - Clean Soul Co., Ltd. 7 2,104 15 - 7 17,349 15 -Other SERVEONE 2,087 25,062 3,770 25,338 LG Management Development Institute 45 - - 2,482 LG Sport - - - 520 LG CNS Co., Ltd. 1,168 - 4,353 13,072 BNE PARTNERS, Inc. - - 2,149 430 LG-TOYO Engineering Co.,Ltd - - - 150 LG N-Sys Inc. - 10 138 20 LG Siltron Incorporated 4 - - - Ucess Partners Co.,Ltd - - - 175 3,304 25,072 10,410 42,187 W 19,478 178,384 10,428 58,658

LG HOUSEHOLD & HEALTH CARE, LTD. AND SUBSIDIARIES Notes to the Consolidated Financial Statements For the years ended December 31, 2013 and 2012
103
46. Transactions and Balances with Related Companies, Continued (2) Transactions with related companies for the years ended December 31, 2013 and 2012 were as
follows, continued:
In millions of won 2012
Relationship Related companies Sales and
others
Purchases
of inventory
Acquisition of PP&E and intangible
assets
Other
The Company’s major shareholder LG Corp W 5 - - 12,409
Associates LG Uni-charm Co., Ltd. 10,547 110,428 - -Joint ventures Emery Oleochemicals Rika (M) Sdn. Bhd. - 19,542 - -Other SERVEONE 2,088 25,927 12,164 24,689 LG Management Development Institute 66 - - 2,511 LG Sport - - - 500 LG CNS Co., Ltd. 95 - 4,646 11,298 LG N-Sys Inc. 20 - 115 1 LG Siltron Incorporated 543 - - - V-ENS CO.,LTD. 26 - - - Ucess Partners Co.,Ltd - - - 198 2,838 25,927 16,925 39,197 W 13,390 155,897 16,925 51,606
(3) Finance transactions which occurred between related companies for the years ended December 31,
2012 are summarized as follows:
In millions of won 2012 Loan transaction Borrowing transaction
Capital increase Company Counterparty Loans
Collection
Borrowing
Repayment
Associate Coty Korea Co,. Ltd W - - - - 1,980Joint ventures Clean Soul Co., Ltd. - - - - 250 W - - - - 2,230
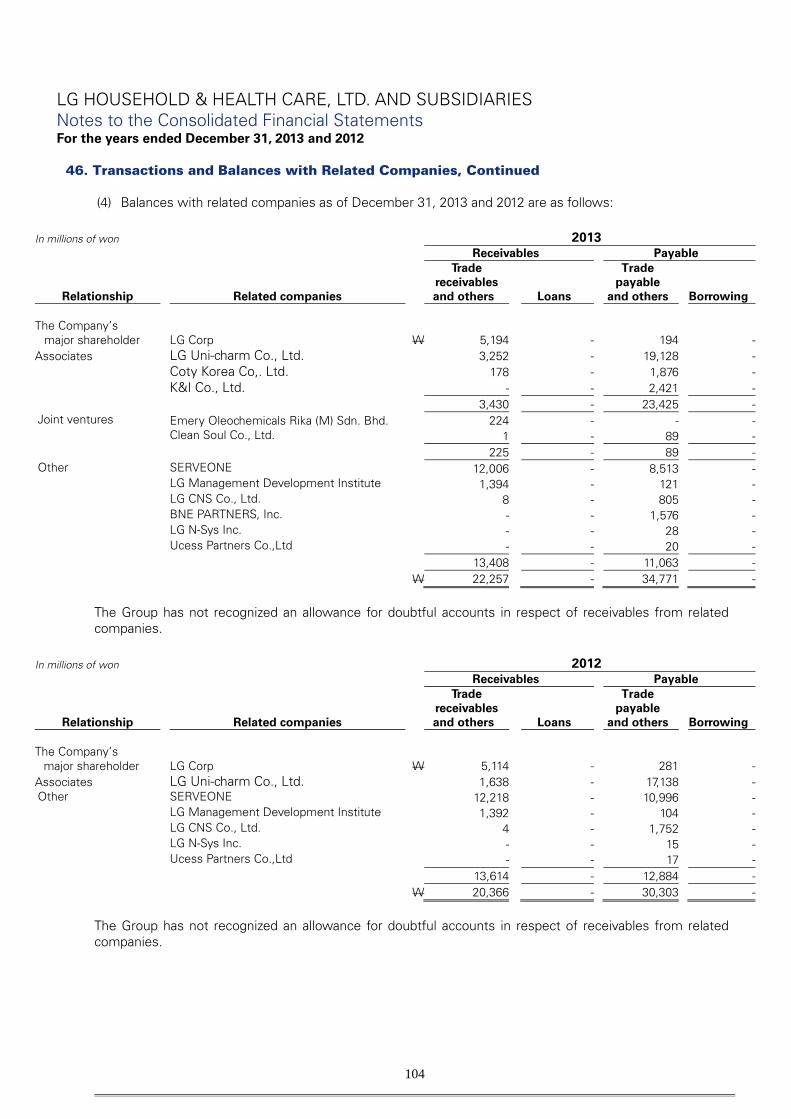
LG HOUSEHOLD & HEALTH CARE, LTD. AND SUBSIDIARIES Notes to the Consolidated Financial Statements For the years ended December 31, 2013 and 2012
104
46. Transactions and Balances with Related Companies, Continued (4) Balances with related companies as of December 31, 2013 and 2012 are as follows:
In millions of won 2013 Receivables Payable
Relationship Related companies
Trade receivables and others
Loans
Trade payable
and others
Borrowing
The Company’s major shareholder LG Corp W 5,194 - 194 -
Associates LG Uni-charm Co., Ltd. 3,252 - 19,128 - Coty Korea Co,. Ltd. 178 - 1,876 -
K&I Co., Ltd. - - 2,421 - 3,430 - 23,425 -Joint ventures Emery Oleochemicals Rika (M) Sdn. Bhd. 224 - - - Clean Soul Co., Ltd. 1 - 89 - 225 - 89 -Other SERVEONE 12,006 - 8,513 - LG Management Development Institute 1,394 - 121 - LG CNS Co., Ltd. 8 - 805 - BNE PARTNERS, Inc. - - 1,576 - LG N-Sys Inc. - - 28 - Ucess Partners Co.,Ltd - - 20 - 13,408 - 11,063 - W 22,257 - 34,771 -
The Group has not recognized an allowance for doubtful accounts in respect of receivables from related companies.
In millions of won 2012 Receivables Payable
Relationship Related companies
Trade receivables and others
Loans
Trade payable
and others
Borrowing
The Company’s major shareholder LG Corp W 5,114 - 281 -
Associates LG Uni-charm Co., Ltd. 1,638 - 17,138 -Other SERVEONE 12,218 - 10,996 - LG Management Development Institute 1,392 - 104 - LG CNS Co., Ltd. 4 - 1,752 - LG N-Sys Inc. - - 15 - Ucess Partners Co.,Ltd - - 17 - 13,614 - 12,884 - W 20,366 - 30,303 -
The Group has not recognized an allowance for doubtful accounts in respect of receivables from related companies.

LG HOUSEHOLD & HEALTH CARE, LTD. AND SUBSIDIARIES Notes to the Consolidated Financial Statements For the years ended December 31, 2013 and 2012
105
46. Transactions and Balances with Related Companies, Continued (5) Key management personnel compensation for the years ended December 31, 2013 and 2012 are as
follows:
In millions of won
Compensation details 2013 2012 Short-term employee benefits W 8,889 8,781 Post-employment benefits 1,438 813 Other 40 -
W 10,367 9,594 (6) The Group does not have any guarantees provided to or by related companies.
47. Commitments (1) The Group’s significant commitments with financial institutions as of December 31, 2013 are
summarized as follows: In millions of won, in thousands of foreign currency Limited amounts Used amounts Bank overdraft
KRW 59,200 13,980 JPY 500,000 -
General loans KRW 62,000 15,000 USD 8,000 4,200
General facility loans KRW 555 555 Letter of credit agreements KRW 7,000 4,750
USD 10,000 634 Loans for import USD 2,000 1,250 Draft at sight USD 500 - Other guarantees in local currency provided USD 10,000 - Other guarantees in foreign currency provided USD 8,100 3,000 B2B contracts and others KRW 309,000 29,687 Trade bills bought USD 20,200 4,721 JPY 84,063 Integration limits
Bank overdraft and others KRW 45,000 - Draft at sight and others USD 20,000 3,012 CHF 1 Export letters of credit USD 7,000 10,936 JPY 111,920
Other guarantees KRW 400 356 (2) The Group has been provided with a guarantee in the amount of W 36,961 million related with the
implementation of the contract from Seoul Guarantee Insurance Company at the end of the reporting period.

LG HOUSEHOLD & HEALTH CARE, LTD. AND SUBSIDIARIES Notes to the Consolidated Financial Statements For the years ended December 31, 2013 and 2012
106
47. Commitments, Continued (3) Deposits which are restricted in use as of December 31, 2013 are as follows:
In millions of won Amount
Long-term financial deposits W 27 Maintenance of checking accounts 1,000 Establishment of a pledge right
(4) The Company entered into various multi-year technical assistances and licensing agreements with
several foreign companies for the manufacture of certain product lines. According to these agreements, the Company is obligated to pay fees and royalties.
(5) The Company made an arrangement with LG Corp to use brand of LG Corp. related with operating
business of the Company. (6) The Company made an operating lease arrangement with LG Corp. for headquarter office and others
and deposits W 5,176 million for lease. (7) As of August 19, 2007, Coca-Cola Beverage Co., one of the subsidiaries, made an arrangement to
purchase extraction from Coca-Cola Korea Company (the “CCKC”). Pursuant to the agreement, the purchase price is determined based on the amount of net sales subsequent to the purchase. Purchase amounts are W 169,003 million and W 156,250 million in 2013 and 2012, respectively.
In relation to the above contract, Coca-Cola Beverage Co. made an agreement additionally to receive performance incentives from CCKC according to net sales for one year when Coca-Cola Beverage Co. fulfills certain conditions. In connection with that agreement, the Company recorded W7,500 million and W10,000 million as other receivables as of December 31, 2013 and 2012, respectively.
In relation to the above contract, Coca-Cola Beverage Co. made a new contract on October 31, 2012, and the new contract is effective from 2013.
(8) Haitai Beverage Company, one of the subsidiaries, made an agreement with Sunkist Growers Inc. for
the manufacture of certain product lines and to pay the fees related amounting 1.5% of net sales. Minimum amount of fees is USD 1,000,000.
48. Operating Leases
(1) Lessee
(i) The Group has entered into operating leases for buildings, furniture and fixtures and vehicles. Future lease payments under operating leases as of December 31, 2013 and 2012 are as follows:
In millions of won 2013
Future lease payment Counterparties Within 1 year 1 ~ 5 years Thereafter Total
LG Corp. and others W 18,389 930 - 19,319 RedcapTour Co., Ltd. and others
6,360 3,863 - 10,223
Seoul Metropolitan Rapid Transit Corp. and others
17,898 354 - 18,252
Others 2,190 388 - 2,578 44,837 5,535 - 50,372

LG HOUSEHOLD & HEALTH CARE, LTD. AND SUBSIDIARIES Notes to the Consolidated Financial Statements For the years ended December 31, 2013 and 2012
107
48. Operating Leases, Continued
(1) Lessee, continued
(i) The Group has entered into operating leases for buildings, furniture and fixtures and vehicles. Future lease payments under operating leases as of December 31, 2013 and 2012 are as follows, continued:
In millions of won 2012
Future lease payment Counterparties Within 1 year 1 ~ 5 years Thereafter Total
LG Corp. and others W 18,232 1,888 - 20,120 IBM Korea and others 6,048 5,488 - 11,536 RedcapTour Co., Ltd. and others
7,001 519 - 7,520
Others 2,828 1,456 - 4,284 34,109 9,351 - 43,460
(ii) Lease payments recognized as expenses for the years ended December 31, 2013 and 2012 were
W42,500 million and W39,425 million, respectively. (iii) Future sublease payments expected to be received from subleases of the assets as of December
31, 2013 are as follows:
In millions of won 2013 Future lease payment
Counterparties Within 1 year 1 ~ 5 years Thereafter Total GS Gangnam OHUI W 88 - - 88
(ⅳ) Sublease payments received for the year ended December 31, 2013 were W60 million.
(2) Lessor
(i) The Group has entered into the operating leases for its equipment. Future lease payments receivable under operation leases as of December 31, 2013 and 2012 are as follows:
In millions of won 2013
Future lease payment receivable Counterparties Within 1 year 1 ~ 5 years Thereafter Total
LG Chem LTD and others W 1,454 36 - 1,490
In millions of won 2012
Future lease payment receivable Counterparties Within 1 year 1 ~ 5 years Thereafter Total
LG Chem LTD and others W 1,463 80 - 1,543
(ii) Lease receivable recognized as revenue for the years ended December 31, 2013 and 2012 were
W1,513 million and W1,609 million respectively.
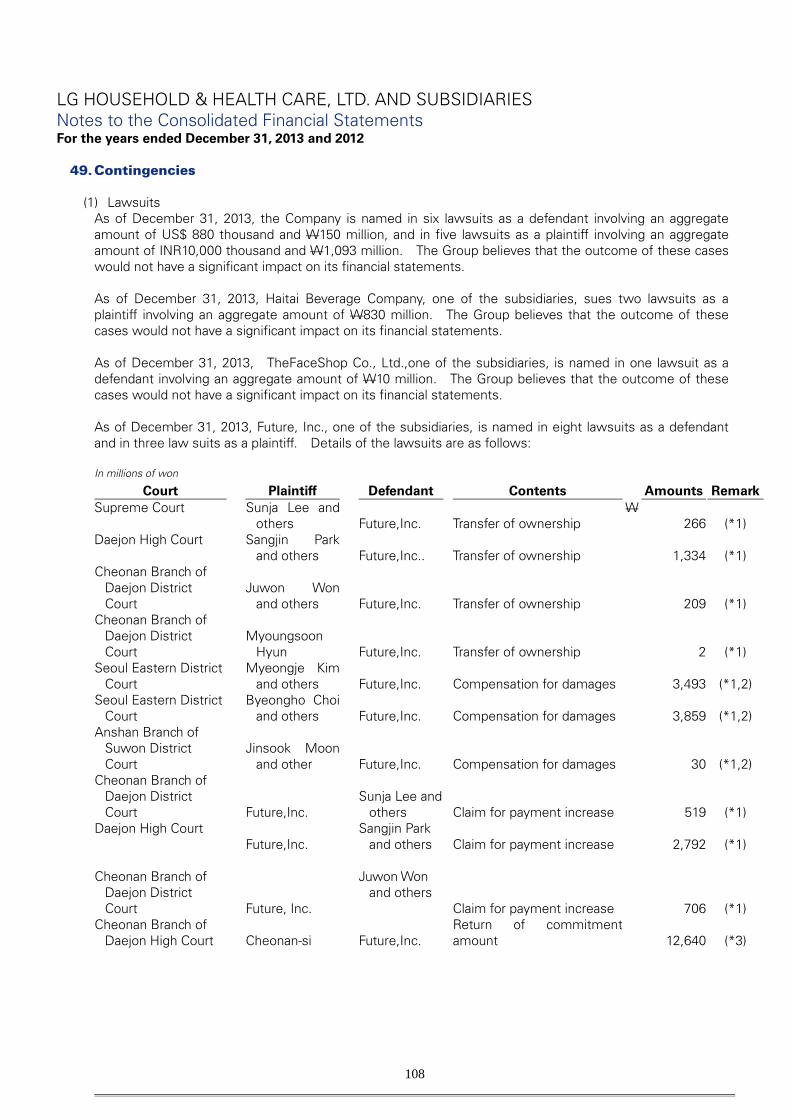
LG HOUSEHOLD & HEALTH CARE, LTD. AND SUBSIDIARIES Notes to the Consolidated Financial Statements For the years ended December 31, 2013 and 2012
108
49. Contingencies
(1) Lawsuits As of December 31, 2013, the Company is named in six lawsuits as a defendant involving an aggregate amount of US$ 880 thousand and W150 million, and in five lawsuits as a plaintiff involving an aggregate amount of INR10,000 thousand and W1,093 million. The Group believes that the outcome of these cases would not have a significant impact on its financial statements. As of December 31, 2013, Haitai Beverage Company, one of the subsidiaries, sues two lawsuits as a plaintiff involving an aggregate amount of W830 million. The Group believes that the outcome of these cases would not have a significant impact on its financial statements. As of December 31, 2013, TheFaceShop Co., Ltd.,one of the subsidiaries, is named in one lawsuit as a defendant involving an aggregate amount of W10 million. The Group believes that the outcome of these cases would not have a significant impact on its financial statements. As of December 31, 2013, Future, Inc., one of the subsidiaries, is named in eight lawsuits as a defendant and in three law suits as a plaintiff. Details of the lawsuits are as follows: In millions of won
Court Plaintiff Defendant Contents Amounts Remark Supreme Court Sunja Lee and
others
Future,Inc. Transfer of ownership W
266 (*1) Daejon High Court Sangjin Park
and others
Future,Inc.. Transfer of ownership
1,334 (*1) Cheonan Branch of
Daejon District Court
Juwon Won
and others
Future,Inc. Transfer of ownership
209 (*1) Cheonan Branch of
Daejon District Court
Myoungsoon
Hyun
Future,Inc. Transfer of ownership
2 (*1) Seoul Eastern District
Court Myeongje Kim
and others
Future,Inc. Compensation for damages
3,493 (*1,2) Seoul Eastern District
Court Byeongho Choi
and others
Future,Inc. Compensation for damages
3,859 (*1,2) Anshan Branch of
Suwon District Court
Jinsook Moon
and other
Future,Inc. Compensation for damages
30 (*1,2) Cheonan Branch of
Daejon District Court
Future,Inc.
Sunja Lee and
others Claim for payment increase
519 (*1) Daejon High Court
Future,Inc. Sangjin Park
and others Claim for payment increase
2,792 (*1) Cheonan Branch of
Daejon District Court
Future, Inc.
Juwon Won and others
Claim for payment increase
706
(*1) Cheonan Branch of
Daejon High Court
Cheonan-si Future,Inc. Return of commitment amount 12,640 (*3)
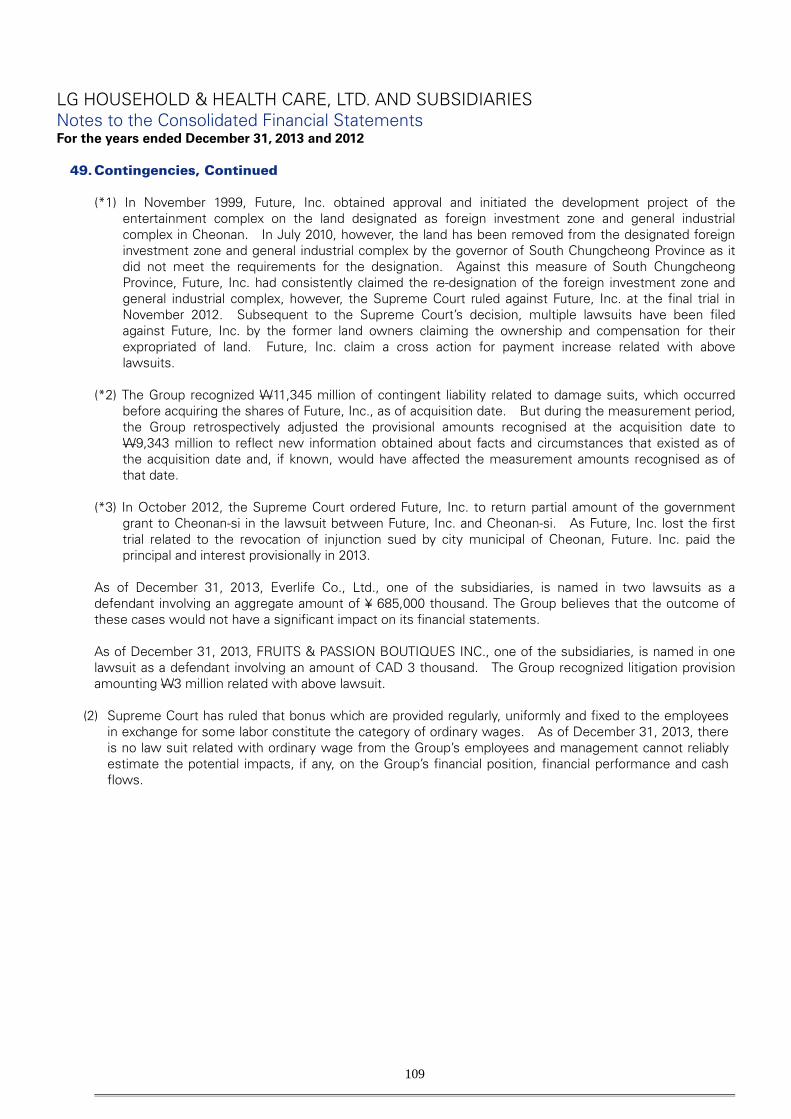
LG HOUSEHOLD & HEALTH CARE, LTD. AND SUBSIDIARIES Notes to the Consolidated Financial Statements For the years ended December 31, 2013 and 2012
109
49. Contingencies, Continued (*1) In November 1999, Future, Inc. obtained approval and initiated the development project of the
entertainment complex on the land designated as foreign investment zone and general industrial complex in Cheonan. In July 2010, however, the land has been removed from the designated foreign investment zone and general industrial complex by the governor of South Chungcheong Province as it did not meet the requirements for the designation. Against this measure of South Chungcheong Province, Future, Inc. had consistently claimed the re-designation of the foreign investment zone and general industrial complex, however, the Supreme Court ruled against Future, Inc. at the final trial in November 2012. Subsequent to the Supreme Court’s decision, multiple lawsuits have been filed against Future, Inc. by the former land owners claiming the ownership and compensation for their expropriated of land. Future, Inc. claim a cross action for payment increase related with above lawsuits.
(*2) The Group recognized W11,345 million of contingent liability related to damage suits, which occurred
before acquiring the shares of Future, Inc., as of acquisition date. But during the measurement period, the Group retrospectively adjusted the provisional amounts recognised at the acquisition date to W9,343 million to reflect new information obtained about facts and circumstances that existed as of the acquisition date and, if known, would have affected the measurement amounts recognised as of that date.
(*3) In October 2012, the Supreme Court ordered Future, Inc. to return partial amount of the government
grant to Cheonan-si in the lawsuit between Future, Inc. and Cheonan-si. As Future, Inc. lost the first trial related to the revocation of injunction sued by city municipal of Cheonan, Future. Inc. paid the principal and interest provisionally in 2013.
As of December 31, 2013, Everlife Co., Ltd., one of the subsidiaries, is named in two lawsuits as a defendant involving an aggregate amount of ¥ 685,000 thousand. The Group believes that the outcome of these cases would not have a significant impact on its financial statements. As of December 31, 2013, FRUITS & PASSION BOUTIQUES INC., one of the subsidiaries, is named in one lawsuit as a defendant involving an amount of CAD 3 thousand. The Group recognized litigation provision amounting W3 million related with above lawsuit.
(2) Supreme Court has ruled that bonus which are provided regularly, uniformly and fixed to the employees in exchange for some labor constitute the category of ordinary wages. As of December 31, 2013, there is no law suit related with ordinary wage from the Group’s employees and management cannot reliably estimate the potential impacts, if any, on the Group’s financial position, financial performance and cash flows.
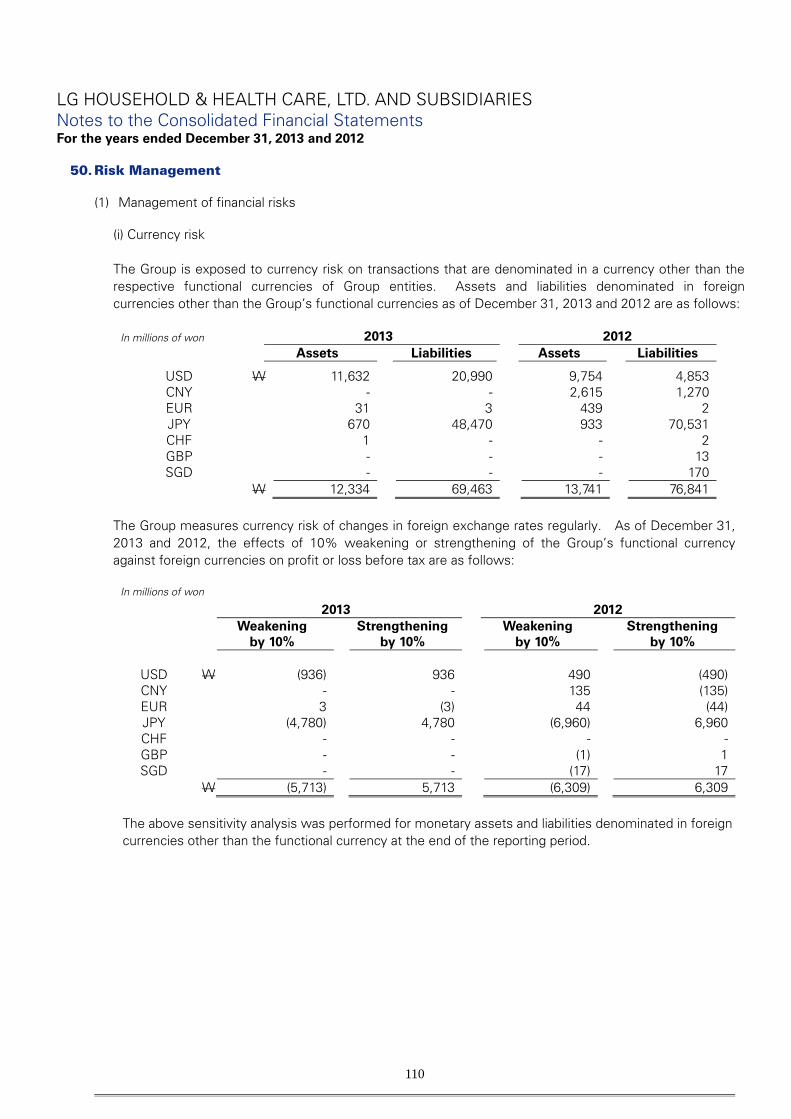
LG HOUSEHOLD & HEALTH CARE, LTD. AND SUBSIDIARIES Notes to the Consolidated Financial Statements For the years ended December 31, 2013 and 2012
110
50. Risk Management
(1) Management of financial risks
(i) Currency risk The Group is exposed to currency risk on transactions that are denominated in a currency other than the respective functional currencies of Group entities. Assets and liabilities denominated in foreign currencies other than the Group’s functional currencies as of December 31, 2013 and 2012 are as follows:
In millions of won 2013 2012
Assets Liabilities Assets Liabilities
USD W 11,632 20,990 9,754 4,853 CNY - - 2,615 1,270 EUR 31 3 439 2 JPY 670 48,470 933 70,531 CHF 1 - - 2 GBP - - - 13 SGD - - - 170
W 12,334 69,463 13,741 76,841 The Group measures currency risk of changes in foreign exchange rates regularly. As of December 31, 2013 and 2012, the effects of 10% weakening or strengthening of the Group’s functional currency against foreign currencies on profit or loss before tax are as follows:
In millions of won
2013 2012
Weakening
by 10% Strengthening
by 10% Weakening
by 10% Strengthening
by 10%
USD W (936) 936 490 (490) CNY - - 135 (135) EUR 3 (3) 44 (44) JPY (4,780) 4,780 (6,960) 6,960 CHF - - - - GBP - - (1) 1 SGD - - (17) 17
W (5,713) 5,713 (6,309) 6,309
The above sensitivity analysis was performed for monetary assets and liabilities denominated in foreign currencies other than the functional currency at the end of the reporting period.
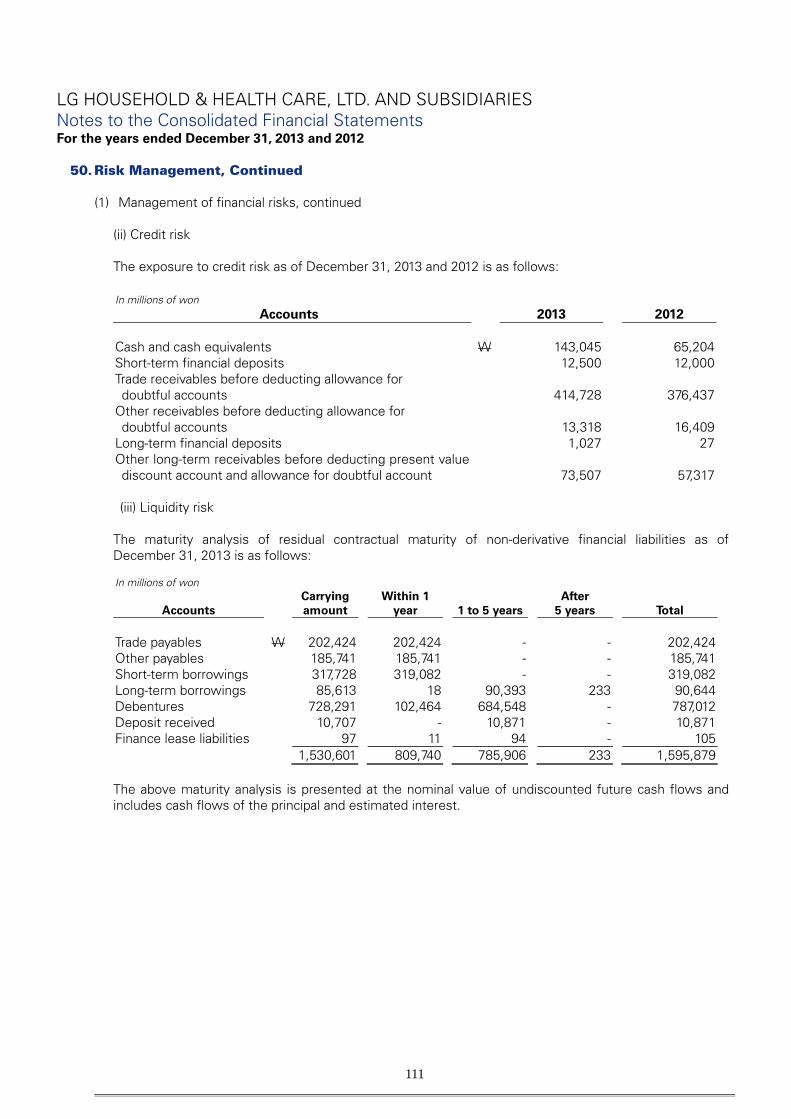
LG HOUSEHOLD & HEALTH CARE, LTD. AND SUBSIDIARIES Notes to the Consolidated Financial Statements For the years ended December 31, 2013 and 2012
111
50. Risk Management, Continued
(1) Management of financial risks, continued (ii) Credit risk The exposure to credit risk as of December 31, 2013 and 2012 is as follows: In millions of won
Accounts 2013 2012 Cash and cash equivalents W 143,045 65,204 Short-term financial deposits 12,500 12,000 Trade receivables before deducting allowance for doubtful accounts 414,728 376,437 Other receivables before deducting allowance for doubtful accounts 13,318 16,409 Long-term financial deposits 1,027 27 Other long-term receivables before deducting present value discount account and allowance for doubtful account 73,507 57,317
(iii) Liquidity risk The maturity analysis of residual contractual maturity of non-derivative financial liabilities as of December 31, 2013 is as follows: In millions of won
Accounts Carrying
amount Within 1
year 1 to 5 years After
5 years
Total Trade payables W 202,424 202,424 - - 202,424 Other payables 185,741 185,741 - - 185,741 Short-term borrowings 317,728 319,082 - - 319,082 Long-term borrowings 85,613 18 90,393 233 90,644 Debentures 728,291 102,464 684,548 - 787,012 Deposit received 10,707 - 10,871 - 10,871 Finance lease liabilities 97 11 94 - 105 1,530,601 809,740 785,906 233 1,595,879 The above maturity analysis is presented at the nominal value of undiscounted future cash flows and includes cash flows of the principal and estimated interest.

LG HOUSEHOLD & HEALTH CARE, LTD. AND SUBSIDIARIES Notes to the Consolidated Financial Statements For the years ended December 31, 2013 and 2012
112
50. Risk Management, Continued
(1) Management of financial risks, continued (iv) Interest rate risk
① Interest rate profile of the Group’s interest-bearing financial instruments as of December 31, 2103 and
2012 was as follows:
Carrying amount In millions of won 2013 2012
Fixed rate instruments
Short-term borrowings W 219,620 115,773 Long-term borrowings 85,613 82,320 Debentures 728,291 529,404 Finance leases liabilities 97 34 Total W 1,033,621
727,531
Variable rate instruments Short-term borrowings W 98,108 -
② Fair value sensitivity analysis for fixed rate instruments
The Group does not account for any fixed rate financial assets and liabilities at fair value through profit or loss. Therefore a change in interest rates at the reporting date would not affect profit or loss.
③ Cash flow sensitivity analysis for variable rate instruments A change of 100 basis points in interest rates at the reporting date would have increased (decreased) equity and profit or loss by the amounts shown below. This analysis assumes that all other variables, in particular foreign currency rates, remain constant.
2013
2012
100 bp
100 bp
100 bp
100 bp
In millions of won increase
decrease
increase
decrease Variable rate instruments W (981) 981 - -
(v) Price risk The Group is exposed to price risk of available-for-sale financial assets. Book value of available-for-sale, measured at fair value based on the market prices, is W513 million as of December 31, 2013. The effect of 10% change in equity instrument is W51 million before tax and this analysis assumes that all other variables remain constant.

LG HOUSEHOLD & HEALTH CARE, LTD. AND SUBSIDIARIES Notes to the Consolidated Financial Statements For the years ended December 31, 2013 and 2012
113
50. Risk Management, Continued
(2) Management of capital risk
The Group’s adjusted debt to equity ratio as of December 31, 2013 and December 31, 2012 are as follows:
In millions of won
Categories 2013 2012 Total borrowings and debentures W 1,131,632 727,497 Deduction: Cash and cash equivalents (143,045) (65,204) Net borrowings 988,587 662,293 Total stockholders’ equity 1,475,377 1,271,590 Adjusted debt to equity ratio 67.01% 52.08%
(3) The fair value hierarchy
The fair value measurements classified by the fair value hierarchy as of December 31, 2013 and 2012 are as follows: In millions of won 2013
Level 1 Level 2 Level 3 Total Available-for-sale financial assets W 513 - - 513
In millions of won
2012
Level 1 Level 2 Level 3 Total Available-for-sale financial assets W 406 - - 406
(4) Transfer of Financial assets
Transferred financial assets that are not derecognized in their entirety as of December 31, 2013 and 2012 are as follows:
Categories 2013 2012 For those liabilities that have recourse only to the
transferred assets:
Fair value of assets W 18,470 11,725 Fair value of associated liabilities (18,470) (11,725) Net position W - -

LG HOUSEHOLD & HEALTH CARE, LTD. AND SUBSIDIARIES Notes to the Consolidated Financial Statements For the years ended December 31, 2013 and 2012
114
51. Statements of Cash Flows Non-cash transactions for years ended December 31 2013 and 2012 were as follows:
In millions of won
Non-cash transactions 2013 2012 Reclassification from construction in progress to
property, plant and equipment
48,612 80,118 Reclassification from construction in progress to
intangible assets
6,348 6,004 Reclassification from property, plant and equipment
to non-current assets held for sale
6,749 - Acquisition of property, plant and equipment and
intangible assets
7,538 - Disposal of property, plant and equipment 2 -
52. Subsequent Event
(1) Guarantee On January 23, 2014, the Company decided to renew guarantee for credit limit of Everlife Co., Ltd. at the Board of Directors meeting. Details of debt guarantee are as follows. In thousands of JPY
Debtor Creditor Amount of guarantee Period of guarantee Remarks
Everlife Co., Ltd. Mizuho Bank, Ltd. JPY 9,200,000 2014.01.25~2015.01.25 Guarantee with in credit limit (2) Business combination Ginza Stefany Inc., one of the subsidiaries, decided to purchase 100% shares of R&Y Corporation and completed acquisition of shares on February 7, 2014. The amount of consideration is ¥ 4,577,479 thousand. R&Y Corporation is direct marketing company selling Inner Beauty products. The Group expects to strengthen Inner Beauty business in Japan by synergies with the Group. As of the approval date of the financial statements, the financial information of the acquired company is not disclosed because the external audit of the acquired company has not been completed.