
LFC Case Study
70
Emma Fisher (11050499) Charlotte Ellis (11016377) Alasdair Joe Hymers (11055728) David Atkinson
-
Upload
alasdair-joe-hymers -
Category
Documents
-
view
1.584 -
download
9
Transcript of LFC Case Study
Emma Fisher (11050499)Charlotte Ellis (11016377)
Alasdair Joe Hymers (11055728)
David Atkinson
Strategic Marketing Management26 th January 2015
Introduction
This report is being conducted as a strategic marketing consulting team, working on a contract for Liverpool Football Club (LFC) to devise a 5 year strategic marketing plan.
Research conducted by LFC in 2014 highlighted: “The mission, vision and value proposition of the business is at worst, non-existent and at best, difficult to decipher.” (MMU, 2014: p.23) Therefore, the overarching goal of this report is to formulate a 5 year strategic marketing plan in order to give the club strategic direction in order to help gain strategic competitive advantage.
2
Table of ContentsIntroduction.............................................................................................................................................2
1.0 - Situational Analysis...........................................................................................................................41.1 - PESTLE analysis.................................................................................................................................................................................... 4
1.2.1 Industry Forecast.................................................................................................................................................................................. 51.2.2 Porters 5 Forces................................................................................................................................................................................... 6
1.3 - Market analysis........................................................................................................................................................................................ 61.3.1 Domestic market analysis............................................................................................................................................................... 61.3.2 Global market analysis...................................................................................................................................................................... 7
1.4 Competitor analysis............................................................................................................................................................................... 101.4.1 Strategic Group Analysis............................................................................................................................................................... 101.4.2 Market positioning............................................................................................................................................................................. 111.4.3 Porter’s Generic Strategies.......................................................................................................................................................... 11
1.5 - Financial analysis................................................................................................................................................................................. 121.5.1 Total revenue by revenue streams.......................................................................................................................................... 121.5.2 Average league position over total revenue....................................................................................................................... 131.5.3 Total revenue over 5 years.......................................................................................................................................................... 131.5.4 Key factors and strategies that affect club revenues....................................................................................................141.5.5 Total wages as a percentage of revenue over 5 years................................................................................................141.5.6 Revenue per ticket sold (RPTS).............................................................................................................................................. 151.5.7 Financial data....................................................................................................................................................................................... 16
1.6 Customer and consumer analysis..................................................................................................................................................171.6.1.Domestic Market................................................................................................................................................................................ 171.6.2 International Markets....................................................................................................................................................................... 19
1.7 - Internal analysis....................................................................................................................................................................................211.7.1 Dynamic Capabilities Value chain: Brand Heritage and Community of Fans.................................................211.7.2 BCG Product portfolio..................................................................................................................................................................... 221.7.3 Sounders wheel.................................................................................................................................................................................. 221.7.4 Prioritised SWOT Analysis.......................................................................................................................................................... 22
1.8 - Critical issues......................................................................................................................................................................................... 23
2.0 - Objectives and Strategy..................................................................................................................242.1 - Mission Statement, Corporate and Marketing Objectives..............................................................................................24
2.1.1 LFC Mission Statement 2015..................................................................................................................................................... 242.1.2 Corporate Objectives....................................................................................................................................................................... 242.1.3 Marketing Objectives....................................................................................................................................................................... 24
2.2 - Strategic options................................................................................................................................................................................... 252.3 - Strategic evaluation............................................................................................................................................................................ 262.4 - Justification of chosen strategies.................................................................................................................................................27
2.5 Evaluation and selection of Market segments...................................................................................................................... 28
3.0 Tactics, Action and Control................................................................................................................303.1 Tactics.......................................................................................................................................................................................................... 303.2 Tactic Selection....................................................................................................................................................................................... 333.2 Action – Gantt Chart............................................................................................................................................................................. 343.3 Control Statements............................................................................................................................................................................... 35
4.0 References........................................................................................................................................36
5.0 Appendices.......................................................................................................................................47Appendix 1: Competitor data................................................................................................................................................................... 47Appendix 2: Club accessibility................................................................................................................................................................ 54Appendix 3: TripAdvisor ratings (stadium visits)- accessed 8th January 2015..........................................................55
1.0 - Situational Analysis
3
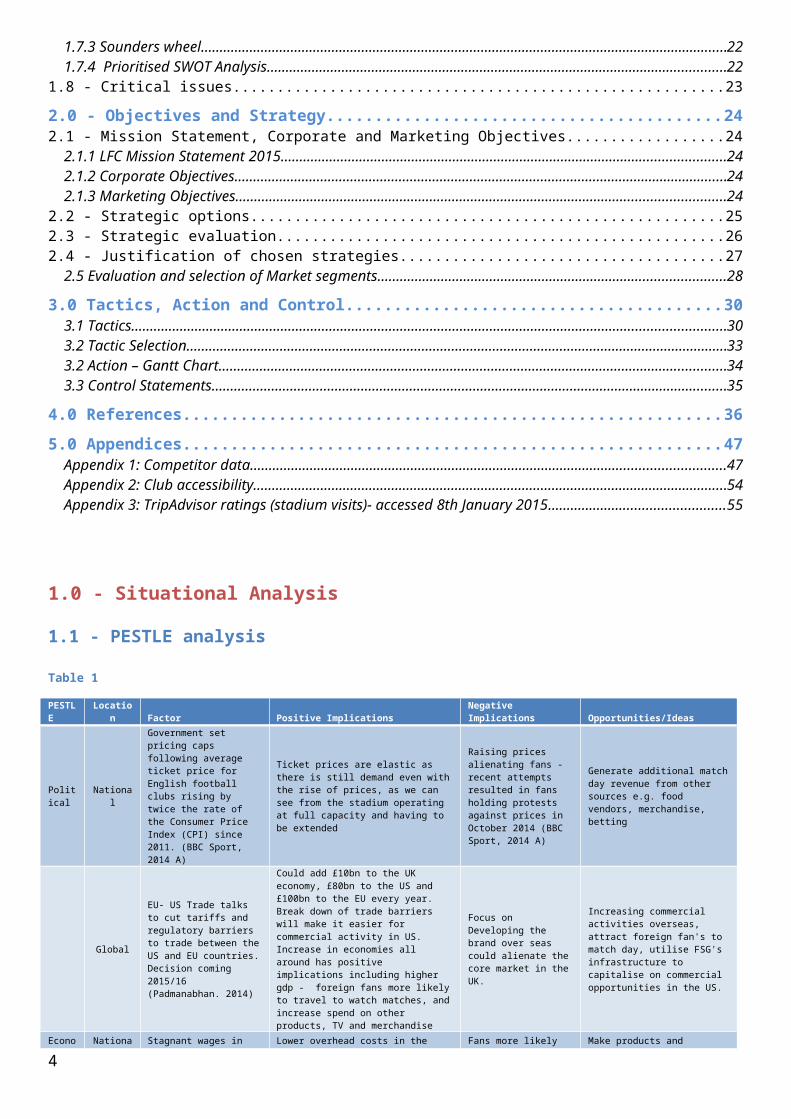
1.1 - PESTLE analysis
Table 1
PESTLE Location Factor Positive Implications Negative Implications Opportunities/Ideas
Political National
Government set pricing caps following average ticket price for English football clubs rising by twice the rate of the Consumer Price Index (CPI) since 2011. (BBC Sport, 2014 A)
Ticket prices are elastic as there is still demand even with the rise of prices, as we can see from the stadium operating at full capacity and having to be extended
Raising prices alienating fans -recent attempts resulted in fans holding protests against prices in October 2014 (BBC Sport, 2014 A)
Generate additional match day revenue from other sources e.g. food vendors, merchandise, betting
Global
EU- US Trade talks to cut tariffs and regulatory barriers to trade between the US and EU countries. Decision coming 2015/16 (Padmanabhan. 2014)
Could add £10bn to the UK economy, £80bn to the US and £100bn to the EU every year. Break down of trade barriers will make it easier for commercial activity in US. Increase in economies all around has positive implications including higher gdp - foreign fans more likely to travel to watch matches, and increase spend on other products, TV and merchandise
Focus on Developing the brand over seas could alienate the core market in the UK.
Increasing commercial activities overseas, attract foreign fan's to match day, utilise FSG's infrastructure to capitalise on commercial opportunities in the US.
Economic National Stagnant wages in the UK
(Inman, 2014)Lower overhead costs in the running & maintenance of Anfield
Fans more likely to: 'cut back spend on merchandise and trading down from tickets to TV' (MMU, 2014: P.16)
Make products and services more accessible on multiple levels of income. E.g. Tiered ticket pricing scheme, pricing promotions on LFC TV, improve match day experience
NationalInterest rates set to stay at a record low of 0.5% (Stewart, 2015)
Sales of LFC Credit Cards are likely to benefit due to the higher spending over saving. Exchange rate is likely to depreciate, making the UK more attractive to global audience.
Fans that rely on savings to live off e.g. 'Thermos in row D' may result in lower disposable income
Increase match day attractiveness, insensitise foreign visitors, promote LFC Credit card
National Inflation rates at a 12 year low (BBC, 2015a)
Operating costs for LFC less likely to rise as fast. Fans weekly household disposable income will also benefit
Difficult to raise prices of tickets
Increase Match day revenue per ticket sold by encouraging time spent at stadium and more opportunities to spend e.g. Subsidised transport that arrives early, increase refreshment outlets, fan zones
NationalUK retail sales rose by 0.8% in October as prices fell (BBC, 2014a)
Elasticity of demand shows that reduction in prices can increase sales
Risk of reduced margins and sales.
While this isn't necessary for ticket prices, the model could be applied to subscription services and merchandise. Pricing promotions on LFC TV subscription and merchandise during recruitment strategies
Global Emerging markets: China and India (IMF, 2014)
High level of existing fans in both countries (Section: 1.6.2) with good air transport connections to both.
Distance from the UK means there is low opportunity for ticket sales
Merchandise online and offline, subscriptions for LFC TV, Official Partnerships e.g. official noodle sponsors, tourism
GlobalCurrency rates: Pound is weak against the dollar (Financial Times, 2014)
Encourages foreign investment from the US in the UK
Increases cost of investment/activity in the US
Encourage tourism from the US with travel incentives, LFC hotel packages, raise awareness via pre-season tours and social media activity.
Social Global
As the economy improves, so will consumers demand for greater engagement (MMU, 2014: P.16)
Potential to build closer relationship with fans, increasing lifetime value. Potentially higher revenue with fans: 'willing to pay' (MMU, 2014: P.16) for higher engagement.
Cost of implementing and maintaining fan engagement. Risk of alienating fans and causing strategic drift through abnormal engagement methods.
Fan Zones, sponsorship activities in stadium, global branded partnerships
Global
Visit Britain reported 750,000 visitors to Britain in 2010 for a premier league match, spending around £600m. (MMU, 2014: P.11)
Foreign visitors are likely to stay longer and have higher consumption on LFC products including merchandise and stadium tours
Top 5 countries reported are: Norway, UAE, Japan, China, Aus (MMU, 2014: P.11) Targeting activities include travel incencitives and place marketing of Liverpool
Technology National
Improved internet infrastructure: Three aim to cover 98% of the UK with 4G by the end of 2015(Hopping, 2014)
This will increase mobile usage amongst consumers, beneficial for LFC apps, social networking, and m-commerce and make it overall easier to touch fans.
It is unlikely that it will have a significant impact in the stadium due to the physical barriers of concrete and metal
Increase Wi-Fi coverage in Anfield. Increase digital presence and user experience
National Digital viewing of matches increasing (Davies, 2014)
"Die-hard sports fans are unlikely to ditch TV subscriptions anytime soon" (Davies, 2014)
"Others may well be tempted to (ditch TV subscriptions) as subscription-free services improve, smart TVs enter more homes and more people use paid video streaming services.”(Davies, 2014)
Enrich offering of subscription TV, offer incentives to join subscription, explore alternative routes of broadcasting, make matches more accessible via subsidised transport and tickets.
4
GlobalSpend on mobile overtaken desktop (The Guardian, 2014a)
With "over half of e-tail traffic coming from mobile" (The Guardian, 2014a) consumers are spending increasing amounts of time on mobile, and confidence is growing in their devices
It is more difficult to trace fraudulent activity when payment has been made via a mobile device
Increase user experience of website and enhance social media efforts to reach wider global audience
Legal Regional
Data collection regulations: Privacy and Electronic Communications Policy 2003 & Data Protection Act 1998
Limitations to the collection and usage of date from Wi-Fi and other electronic communications. Threat from hackers.
National
If new Labour law on club ownership goes ahead (Clubs to have supporters on every board) Football Trusts would need to become 'Industrial and Provident Societies' and would be required to meet certain governance standards.
Better engagement and communications with fans
Could create barriers that act as a disincentive to the next generation of owners and directors as fans on the boards could be more likely to access sensitive information
Global UEFA Financial Fair Play (FFP) Rules
Stops 'Financial Doping' of competitors (Platini, 2014) Stadiums, training facilities, youth development and community projects are exempt.
Restricts spending, threat of ban from UEFA Champions League, fines, loss of prize money, point deductions, ban on registration of new players for UEFA competitions
Capitalise on alternative revenue streams to counter balance potential lack of broadcasting revenue. Youth development opportunities to reduce long-term player costs.
Global"Video streaming leads way in paid online media" (Davies, 2014)
"People are happy to pay to watch online through a service and avoid ads." (Davies, 2014)
There is potential for a service provider e.g. Sky/ BT to aggregate all club games online following a similar business model to Spotify
Make LFC TV more attractive to subscribers e.g. Increasing coverage of ladies & youth matches. Loyalty scheme points linking to subscriptions. Potential to invest/acquire a subsidiary that aggregates all club games and streams them online.
Environmental
Global Climate change ever rising Interests raising in environmental issues amongst consumers (Zolfagharifard. 2015)
More pressure on firms to act environmentally, by expanding the stadium, the C02 footprint is larger and uneconomical
Offset C02 footprint with activities to improve efficiency e.g. increase recycling, install solar panels
Regional Local planning permission
Lack of development space and planning restrictions limit further physical expansion of stadium
Activities such as LFC Hotel may need to be developed further away from Anfield
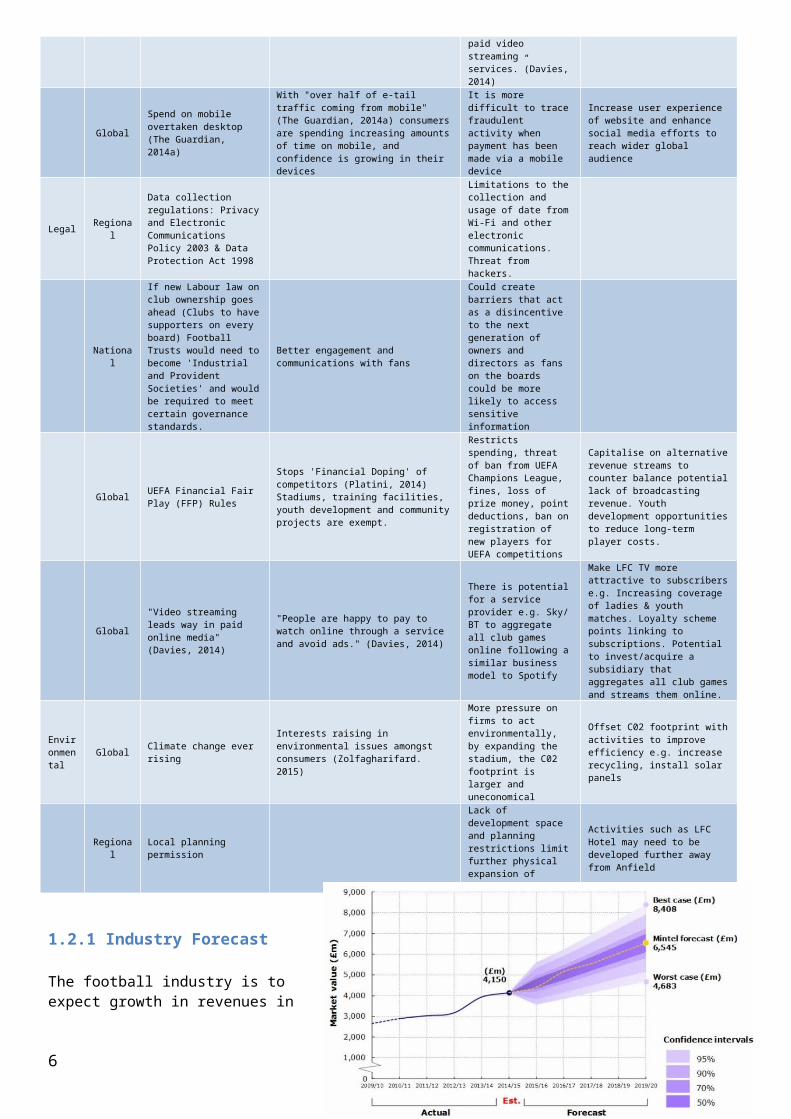
1.2.1 Industry Forecast
The football industry is to expect growth in revenues in the next 5 years, from £4,250m (2014/15) to £6,545 (2019/20). Figure 1 (Mintel, 2014a)
There are five key trends influencing the industry at present:
1. Premier League Broadcasting rights remain: “the primary influence on English football club revenues.” (Mintel, 2014a) Deloitte anticipates a jump in Premier League revenues expected in 2016/17 as competition increases between BT and BSkyB (Mintel, 2014a). When that deal runs out in 2019; there is the possibility that all Premier League games will be broadcast in: ‘the biggest broadcast revolution since 1992’ (Mullock, 2015)
2. The introduction of UEFA’s financial fair play regulations mean that: “most clubs appear to be adopting a more financially robust and balanced approach” (Deloitte, 2014c) as previous seasons have seen average wage prices higher than club revenues. (Mintel, 2014)
3. Match day attendances are forecast growth, with 2013/14 witnessing the highest attendances in 64 years and: “the expansion of stadiums creating potential for further volume amongst Premier League Clubs.” (Mintel, 2014)
5
Figure 1
4. The ‘big five’ European Leagues represent half (€9.8bn) of the overall size of the European football market (€19.9bn) with revenue growth driven primarily by the commercial sources of a few eminent clubs. (Deloitte, 2014c) In the Premier League, Manchester United, Manchester City and Liverpool FC established 60% of revenue growth 2012/13. (Deloitte, 2014c)
5. Digital viewing is a major influence on how fans watch the sport, with examples including BskyB’s Sky Go mobile TV service: “experiencing growth in users from 2.1 million to 3.3 million over the two years to Q2 2013/14.” (Mintel, Online: 2014) And 14% of 20-24-year-olds who watched the 2014 FIFA World watched highlights online, compared to 21% who did so on television (Mintel, Online: 2014)
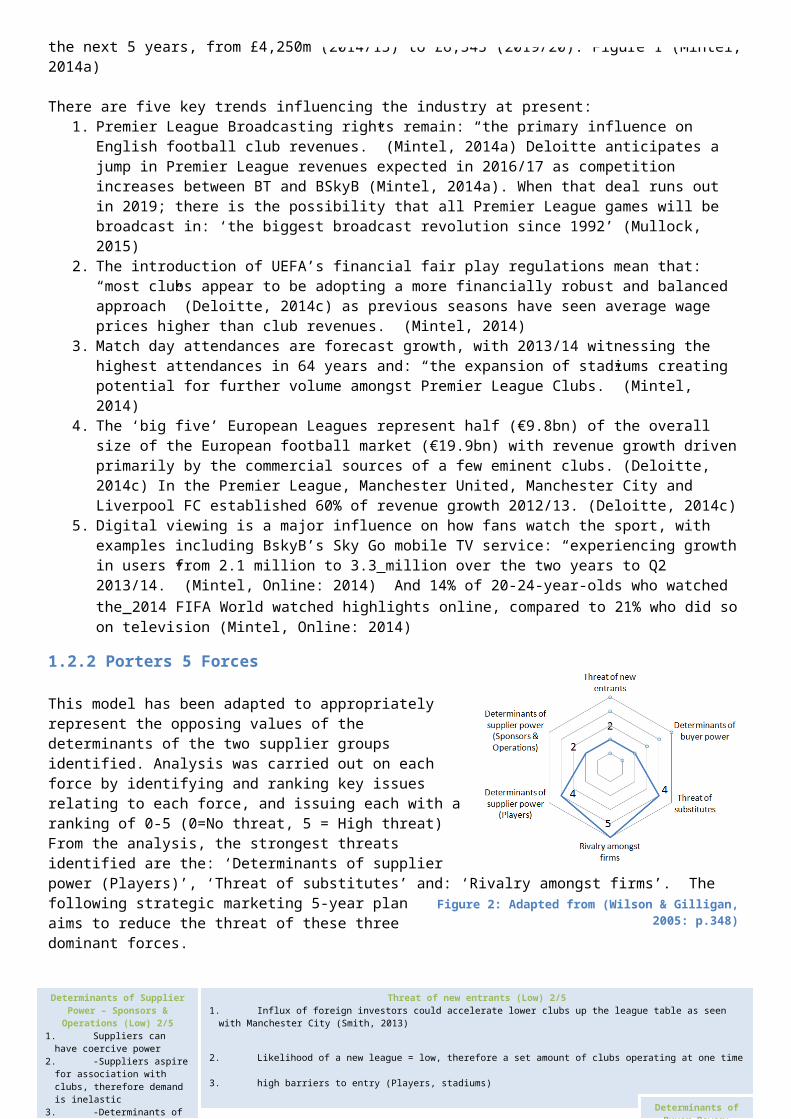
1.2.2 Porters 5 Forces
This model has been adapted to appropriately represent the opposing values of the determinants of the two supplier groups identified. Analysis was carried out on each force by identifying and ranking key issues relating to each force, and issuing each with a ranking of 0-5 (0=No threat, 5 = High threat) From the analysis, the strongest threats identified are the: ‘Determinants of supplier power (Players)’, ‘Threat of substitutes’ and: ‘Rivalry amongst firms’. The following strategic marketing 5-year plan aims to reduce the threat of these three dominant forces.
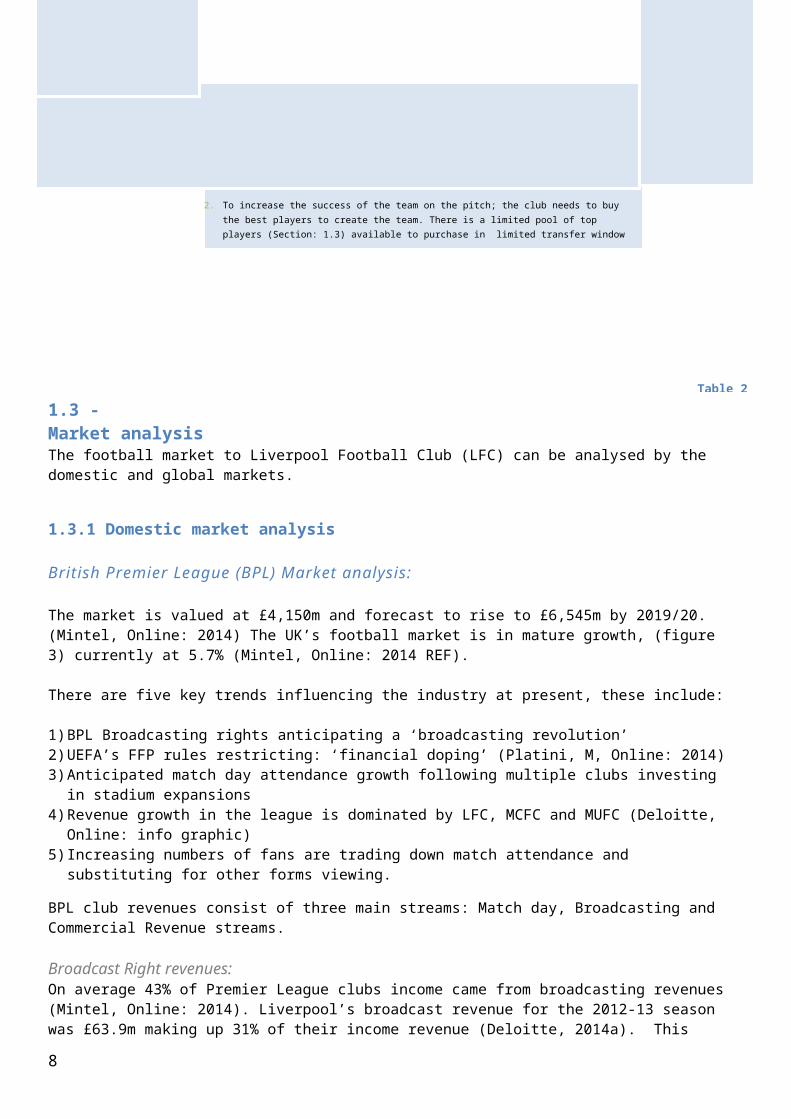
1.3 - Market analysisThe football market to Liverpool Football Club (LFC) can be analysed by the domestic and global markets.
1.3.1 Domestic market analysis
British Premier League (BPL) Market analysis:
The market is valued at £4,150m and forecast to rise to £6,545m by 2019/20. (Mintel, Online: 2014) The UK’s football market is in mature growth, (figure 3) currently at 5.7% (Mintel, Online: 2014 REF).
There are five key trends influencing the industry at present, these include:
1) BPL Broadcasting rights anticipating a ‘broadcasting revolution’
6
Rivalry amongst existing firms (High) 5/51. One of the main sources of revenue for a club comes from broadcasting rights (MMU, 2014) this is the most
competitive revenue stream , which relies on the success of the team on the pitch.
2. To increase the success of the team on the pitch; the club needs to buy the best players to create the team. There is a limited pool of top players (Section: 1.3) available to purchase in limited transfer window periods. This equation creates a market pressure that inflates players wages as club’s bid against each other.
3. The Football industry is an oligopoly, with much of the revenue growth coming from a few eminent clubs, in the Premier League, this is MU, MC & LFC (Deloitte, 2014)Threat of substitutes (High) 4/5
1. ‘Evaluation of alternatives’ are split 50:50 between the 6 consumer segment types in the UK, with those that consider alternatives to be activities such as ‘other club’s matches’ and ‘non –football priorities’ (Section 1.6.1)
2. Growing trend of fan’s trading down match attendances to watching on television’ (MMU, 2014) 3. ‘Growing numbers of supporters taking advantage of illegal streams via overseas providers.’ (Mullock. S, 2015)4. Viewing on mobile catching up with TV, during the world cup; Traditional tv viewing more fragmented: 14% of 20-24 year olds watched online
compared to 21% that watched on TV (Davies, 2014) 55% of households now have access to a tablet (Davies, 2014)5. Risk of cannibalisation from paid subscription TV
Threat of new entrants (Low) 2/51. Influx of foreign investors could accelerate lower clubs up the league table as seen with Manchester City (Smith, 2013)
2. Likelihood of a new league = low, therefore a set amount of clubs operating at one time
3. high barriers to entry (Players, stadiums)
Determinants of Supplier Power – Sponsors & Operations (Low) 2/5
1. Suppliers can have coercive power 2. -Suppliers aspire for association
with clubs, therefore demand is inelastic
3. -Determinants of power are low due to supplier demand outstripping club supply.
Determinants of Supplier Power- Players (High) 4/5
1. Players personal lives off pitch heavily followed by mainstream media
2. -Determinants of power are high as agents control players commercial and marketing activities (Neville, 2013)
Determinants of Buyer Power: (Low) 2/5
When buyers are fans: 1. Determinants could
rise if individual fans become a collective e.g. Spirit of Shanky Group (BBC Sport, 2014a)
2. Low switching costs counterbalanced by emotional loyalty
3. Limited stadium capacity < Fan base, equating to price inelasticity
Figure 2: Adapted from (Wilson & Gilligan, 2005: p.348)
Table 2
2) UEFA’s FFP rules restricting: ‘financial doping’ (Platini, M, Online: 2014)3) Anticipated match day attendance growth following multiple clubs investing in stadium expansions4) Revenue growth in the league is dominated by LFC, MCFC and MUFC (Deloitte, Online: info graphic)5) Increasing numbers of fans are trading down match attendance and substituting for other forms
viewing.
BPL club revenues consist of three main streams: Match day, Broadcasting and Commercial Revenue streams.
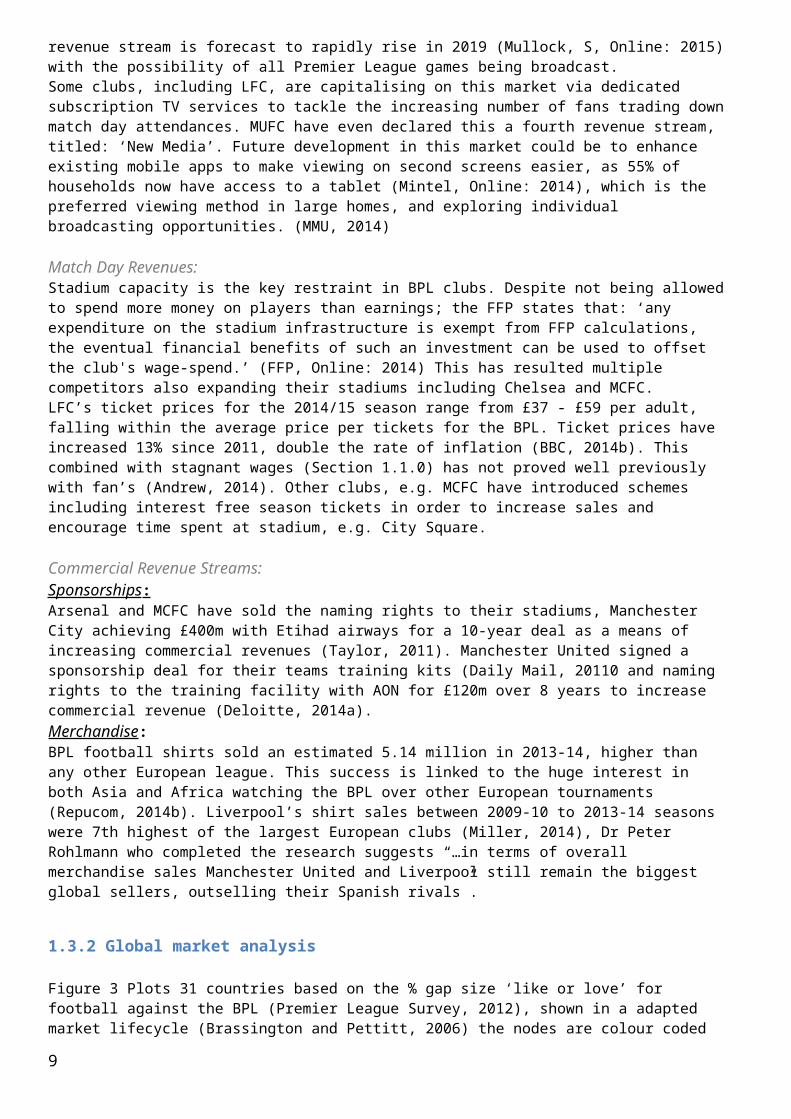
Broadcast Right revenues: On average 43% of Premier League clubs income came from broadcasting revenues (Mintel, Online: 2014). Liverpool’s broadcast revenue for the 2012-13 season was £63.9m making up 31% of their income revenue (Deloitte, 2014a). This revenue stream is forecast to rapidly rise in 2019 (Mullock, S, Online: 2015) with the possibility of all Premier League games being broadcast. Some clubs, including LFC, are capitalising on this market via dedicated subscription TV services to tackle the increasing number of fans trading down match day attendances. MUFC have even declared this a fourth revenue stream, titled: ‘New Media’. Future development in this market could be to enhance existing mobile apps to make viewing on second screens easier, as 55% of households now have access to a tablet (Mintel, Online: 2014), which is the preferred viewing method in large homes, and exploring individual broadcasting opportunities. (MMU, 2014)
Match Day Revenues: Stadium capacity is the key restraint in BPL clubs. Despite not being allowed to spend more money on players than earnings; the FFP states that: ‘any expenditure on the stadium infrastructure is exempt from FFP calculations, the eventual financial benefits of such an investment can be used to offset the club's wage-spend.’ (FFP, Online: 2014) This has resulted multiple competitors also expanding their stadiums including Chelsea and MCFC.LFC’s ticket prices for the 2014/15 season range from £37 - £59 per adult, falling within the average price per tickets for the BPL. Ticket prices have increased 13% since 2011, double the rate of inflation (BBC, 2014b). This combined with stagnant wages (Section 1.1.0) has not proved well previously with fan’s (Andrew, 2014). Other clubs, e.g. MCFC have introduced schemes including interest free season tickets in order to increase sales and encourage time spent at stadium, e.g. City Square.
Commercial Revenue Streams:Sponsorships : Arsenal and MCFC have sold the naming rights to their stadiums, Manchester City achieving £400m with Etihad airways for a 10-year deal as a means of increasing commercial revenues (Taylor, 2011). Manchester United signed a sponsorship deal for their teams training kits (Daily Mail, 20110 and naming rights to the training facility with AON for £120m over 8 years to increase commercial revenue (Deloitte, 2014a).Merchandise:BPL football shirts sold an estimated 5.14 million in 2013-14, higher than any other European league. This success is linked to the huge interest in both Asia and Africa watching the BPL over other European tournaments (Repucom, 2014b). Liverpool’s shirt sales between 2009-10 to 2013-14 seasons were 7th highest of the largest European clubs (Miller, 2014), Dr Peter Rohlmann who completed the research suggests “…in terms of overall merchandise sales Manchester United and Liverpool still remain the biggest global sellers, outselling their Spanish rivals”.
1.3.2 Global market analysis
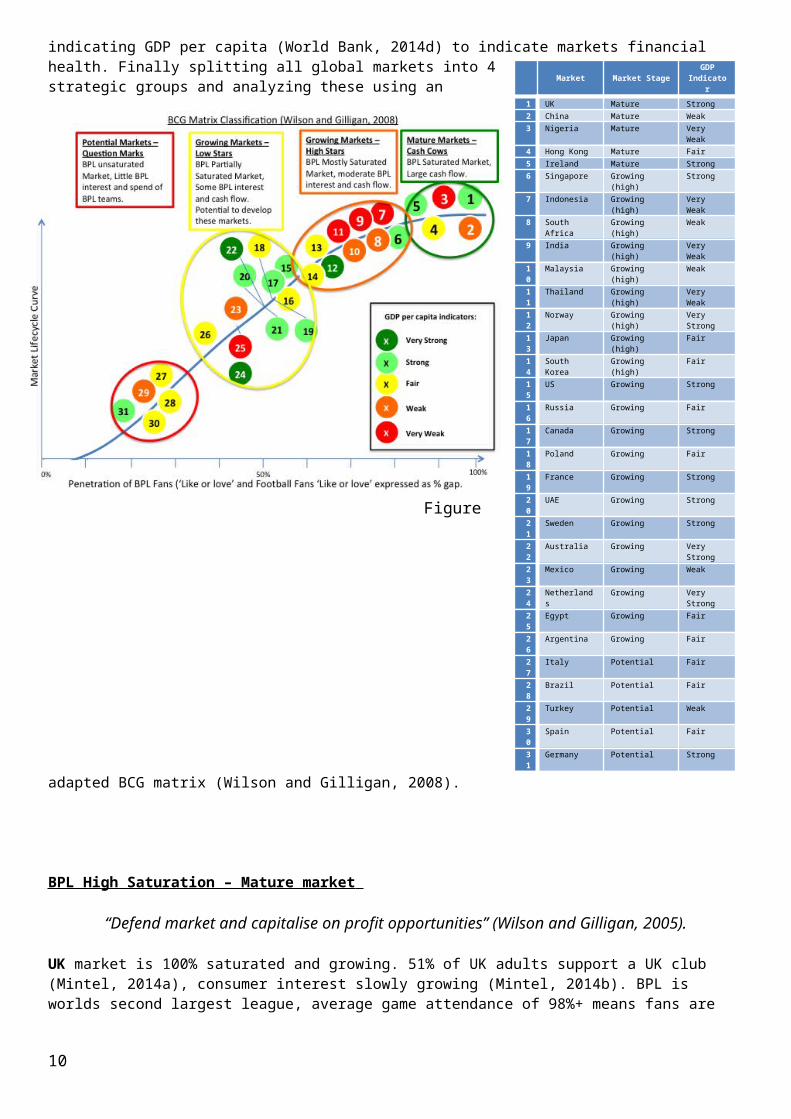
Figure 3 Plots 31 countries based on the % gap size ‘like or love’ for football against the BPL (Premier League Survey, 2012), shown in a adapted market lifecycle (Brassington and Pettitt, 2006) the nodes are colour coded indicating GDP per capita (World Bank, 2014d) to indicate markets financial health. Finally splitting all global markets into 4 strategic groups and analyzing these using an adapted BCG matrix (Wilson and Gilligan, 2008).
7
BPL High Saturation – Mature market
“Defend market and capitalise on profit opportunities” (Wilson and Gilligan, 2005).
UK market is 100% saturated and growing. 51% of UK adults support a UK club (Mintel, 2014a), consumer interest slowly growing (Mintel, 2014b). BPL is worlds second largest league, average game attendance of 98%+ means fans are looking for new ways to follow football (MMU,2014), increasingly turing to new media and tablet devices.
China is 100% BPL saturation with continued growth. Stagnenet GDP growth(World bank, 2014b) but 8.1% rise in income (World Bank, 2014c). Low interest in Chinese domestic leagues (The Economist, 2011), and Inovation of the Barclays Asia Cup has increase BPL awareness (Premier League, 2013). Large fanbases for UK clubs, 60 million LFC fans in china, with VisitBritain finding Chinese fans are likely to visit UK for BPL matches.
Nigeria 95% BPL saturation. Worlds most engaged football nation 83% of population (Repucom, 2014a), strong ecconomic growth up 11.27% (World Bank, 2014b). Possibilites of instablity in market due to current political issues (Section 1.1.0) However current barclays CSR inititiatives further increase British awareness.
Hong Kong BPL saturation of 89%, with dwindling interest in domestic league (The Economist, 2011). Hong Kong shows stong ecconomic growth (World Bank, 2014b). Features in BPL Asia tour and strong alliances with UK BPL clubs.
Ireland have 87% BPL market penetration, with increased BPL interest over Irish league football, most probably linked to higher football standard and accessability to games, media and merchandice. VisitBritain found Irish fans are likely to travel attend BPL matches (MMU, 2014). Recent decline in GDP growth could be as effect of eurozone crash(World Bank, 2014b), However GDP cost per Capata remains strong.
BPL Medium Saturation – Growth markets
“These markets show potential gaps for market development” (Wilson and Gilligan, 2006).
Singapore BPL market penetration of 80%, and indicates a good GDP per capita (World Bank, 2014d). 52% of population is interested in football (Repucom, 2014).
Indonesia has 76% BPL penetration, with 77% of the population interested in football (Repucom, 2014), Indonesian fans currently follow BPL teams, as a result of corruption in their domestic league (Durden, 2012). BPL team interest has also developed substantially following pre season tours (Bland, 2013). Making this a key audience to BPL football despite GDP per capita indicators (World bank, 2014d) and offer potential for future development and acquisition.
South Africa and India both 74% and 73% penetration respectively, India’s affluent middle classes have growing interests in BPL football and UK clubs (Wilson, 2009). Interest in South Africa have grown following pre season tours and show potential as a future market despite current GDP per capita as this is in growth (World Bank, 2014d).
Malaysia and Thailand have BPL penetration of 70% and 67% respectively, continue to be exciting markets and growing interest in BPL (Banyan, 2010). BPL clubs investing in these territories to acquire international fans, despite poor GDP per capita (World Bank, 2014d). Additionally the Scandinavian nations offer affluent markets (World Bank, 2014d),
8
Market Market Stage GDP Indicator
1 UK Mature Strong2 China Mature Weak3 Nigeria Mature Very Weak4 Hong Kong Mature Fair5 Ireland Mature Strong6 Singapore Growing (high) Strong7 Indonesia Growing (high) Very Weak8 South Africa Growing (high) Weak9 India Growing (high) Very Weak
10 Malaysia Growing (high) Weak11 Thailand Growing (high) Very Weak12 Norway Growing (high) Very Strong13 Japan Growing (high) Fair14 South Korea Growing (high) Fair15 US Growing Strong16 Russia Growing Fair17 Canada Growing Strong18 Poland Growing Fair19 France Growing Strong20 UAE Growing Strong21 Sweden Growing Strong22 Australia Growing Very Strong23 Mexico Growing Weak24 Netherlands Growing Very Strong25 Egypt Growing Fair26 Argentina Growing Fair27 Italy Potential Fair28 Brazil Potential Fair29 Turkey Potential Weak30 Spain Potential Fair31 Germany Potential Strong
Norway and Sweden have BPL saturation of saturation is at 63% and 50% respectively, their proximity allowing fans to visit to watch live games offers commercial potential for BPL clubs (MMU, 2014).
Japan and South Korea offer the BPL to Asian markets, with smaller penetration numbers of 62% and 61% respectively. They offer fairly mature domestic football markets, with fans interest split between domestic and BPL games, GDP per capita makes South Korea unattractive whilst Japan is attractive (World Bank, 2014d).
USA and Canada have penetration of 58% and 57%, and both countries having good financial health make these attractive markets, key issues here are opportunities of alternatives with both countries having strong sports industries. USA’s BPL Interest has substantially recently following pre-season tours, key players transfers and American investment or acquisition of many UK clubs.
BPL Medium/Low Saturation – Potential Growth markets
Russia (54%), Poland (52%) and France (51%) again show lower interest levels in BPL, Russia and Poland have unattractive GDP per capita (World Bank, 2014d), France fairing better. All demonstrate poor BPL interest favouring local competitions. UAE (50%) and Australia (50%) share strong GDP per capita, demonstrating lucrative potential markets. However opportunities to alternatives are key implications here, investment in fan acquisition and engagement would be beneficial.
Mexico (45%), Netherlands (43%), Egypt (43%) and Argentina (39%) all demonstrate dwindling interest in BPL football, with increased opportunities to alternatives being a major negative factor. Egypt despite their low GDP per capita (World Bank, 2014d) offer some resolution offering a LFC youth player academy in Cairo (Pearce, 2012) building brand awareness amongst younger fans. Despite lower saturation figures, potential of leading investment in goring markets still in their infancy can lead to competitive advantage.
‘BPL Low saturation – Introduction markets’
These markets demonstrate little interest in the BPL. Italy (28%), Brazil (27%), Turkey (26), Spain (22) and Germany (20%) all demonstrate markets with low interest in the BPL. This can be linked to a number of factors including; interest in domestic leagues, opportunity for alternatives, language barriers and time differences. Currently ruling these markets not commercially viable for this 5 year Plan.
Continued analysis and development of potential global markets is essential to the sustained success. The BCG matric could be adapted to demonstrate this with ‘High Saturation’ being Cash cows, ‘Med Saturation’ being stars and ‘Low Saturation’ being question marks.
1.4 Competitor analysis
As mentioned in section 1.2.2 – barriers to entry in the industry are very high, therefore it is unlikely that there will be new entrants to the market.
Football is the most popular sport in the world, with 1.556 billion followers globally (Manchester United, 2014) therefore, the competitors of LFC are most likely to be currently within the same industry. However, in markets where the football industry is less established, it is important to recognise that other sports would compete directly with the football industry, for example American Football in America.
As the UK market is saturated (section 1.3.0) and brand loyalty in the industry is so high (section 1.6.0) – competitors of LFC are likely to be the most successful football clubs in the industry – as these clubs will gain more exposure in markets where the popularity of the industry is growing, such as America and Australia. LFC will need to compete with these clubs to build fan-bases in these markets, which are in the introductory and growth stages of the industry lifecycle. Therefore, the competitors that have been chosen are the most successful clubs in the world based on total revenue.
Eight competitors were selected from the Deloitte Football Money League (Deloitte, 2014) that showed the following; a sustained/stable high position, an increase in revenue growth over time/a move up in the money league or a decrease in revenue growth over time/a move down in the money league. These
9
competitors should show insight into both successful and unsuccessful strategies. Some clubs were discounted on the basis that they have not competed in the money league consecutively over 2008/09 to 2012/13, and Italian clubs were excluded as no club owned their own stadium until 2011, when the new Juventus Stadium opened (Hall, 2014). All six English clubs in the money league were included, regardless of movement, as the Premier League teams are arguably LFC’s main competitors due to it being the biggest league in the world (Manchester United, 2014), attracting an estimated 70 per cent of the world’s football fans (Premier League, no date).
1.4.1 Strategic Group Analysis
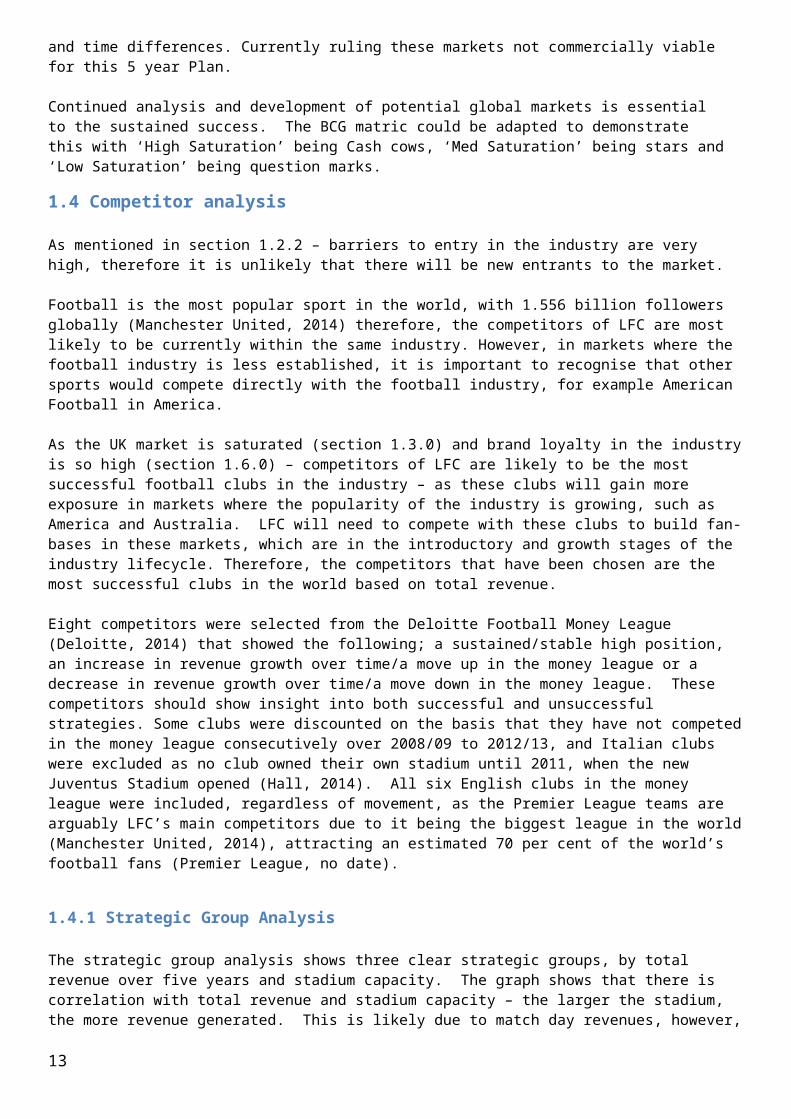
The strategic group analysis shows three clear strategic groups, by total revenue over five years and stadium capacity. The graph shows that there is correlation with total revenue and stadium capacity – the larger the stadium, the more revenue generated. This is likely due to match day revenues, however, also indicates for example, that on pitch success, leads to increased revenue and popularity, and therefore a demand for a larger stadium.
LFC’s closest competitors, that hold similar resources to them, are Manchester City, Tottenham Hotspur and Chelsea. These four clubs fall within the strategic group with the lowest revenue and stadium capacities, although it is worth noting that Liverpool, Manchester City and Tottenham Hotspur have secured plans to increase their stadium capacities within the next few years (Mintel, 2014; Deloitte, 2014), with a bid to increase match day revenues. Chelsea is also looking to increase their stadium capacity (Mintel, 2014).
1.4.2 Market positioning
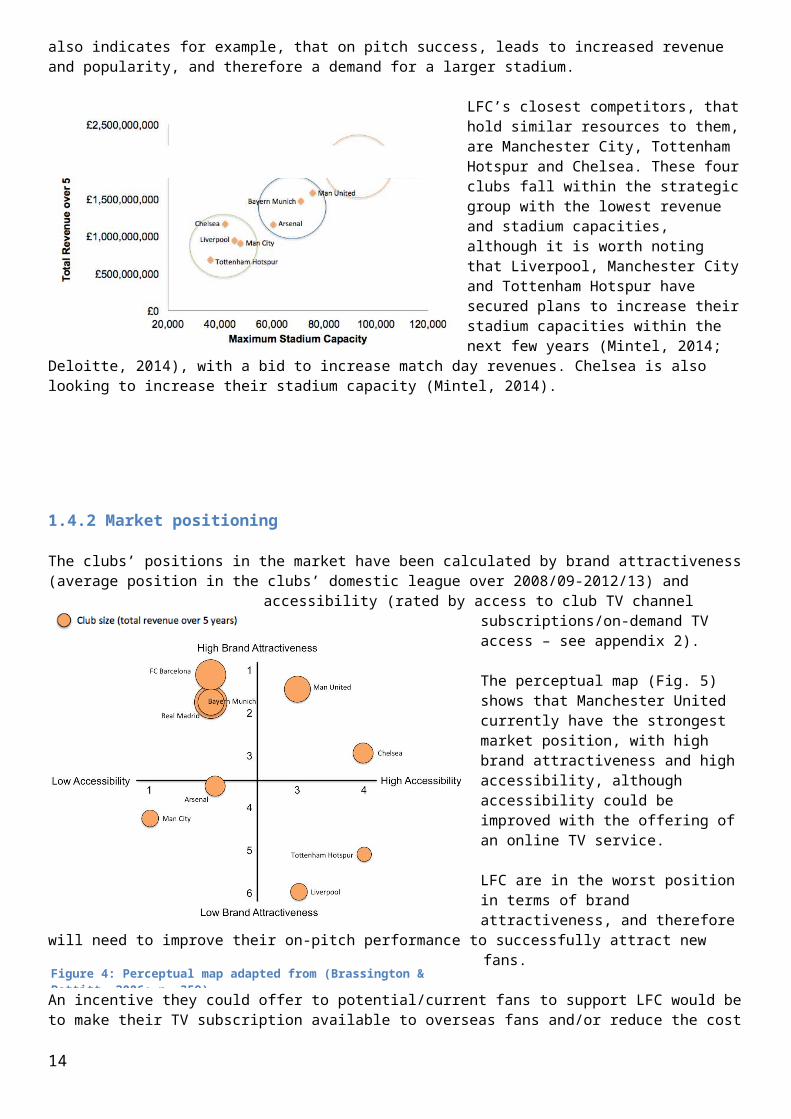
The clubs’ positions in the market have been calculated by brand attractiveness (average position in the clubs’ domestic league over 2008/09-2012/13) and accessibility (rated by access to club TV channel subscriptions/on-demand TV access – see appendix 2).
The perceptual map (Fig. 5) shows that Manchester United currently have the strongest market position, with high brand attractiveness and high accessibility, although accessibility could be improved with the offering of an online TV service.
LFC are in the worst position in terms of brand attractiveness, and therefore will need to improve their on-pitch performance to successfully attract new fans.
An incentive they could offer to potential/current fans to support LFC would be to make their TV subscription
10
Figure 4: Model adapted from (Wilson & Gilligan 2005: p.243)
Figure 5: Perceptual map adapted from (Brassington & Pettitt, 2006: p. 359)
available to overseas fans and/or reduce the cost of their online TV subscription – LFCTV Go. This would bring them closer to Tottenham Hotspur who offers their online TV for free.
Chelsea are in a good position and could move away from competing with LFC by improving their on-pitch performance. At present, LFC have an advantage over Real Madrid, FC Barcelona, Bayern Munich, Arsenal and Manchester City, with regards to accessibility. However, these clubs could improve this through strategic tactics.
1.4.3 Porter’s Generic Strategies
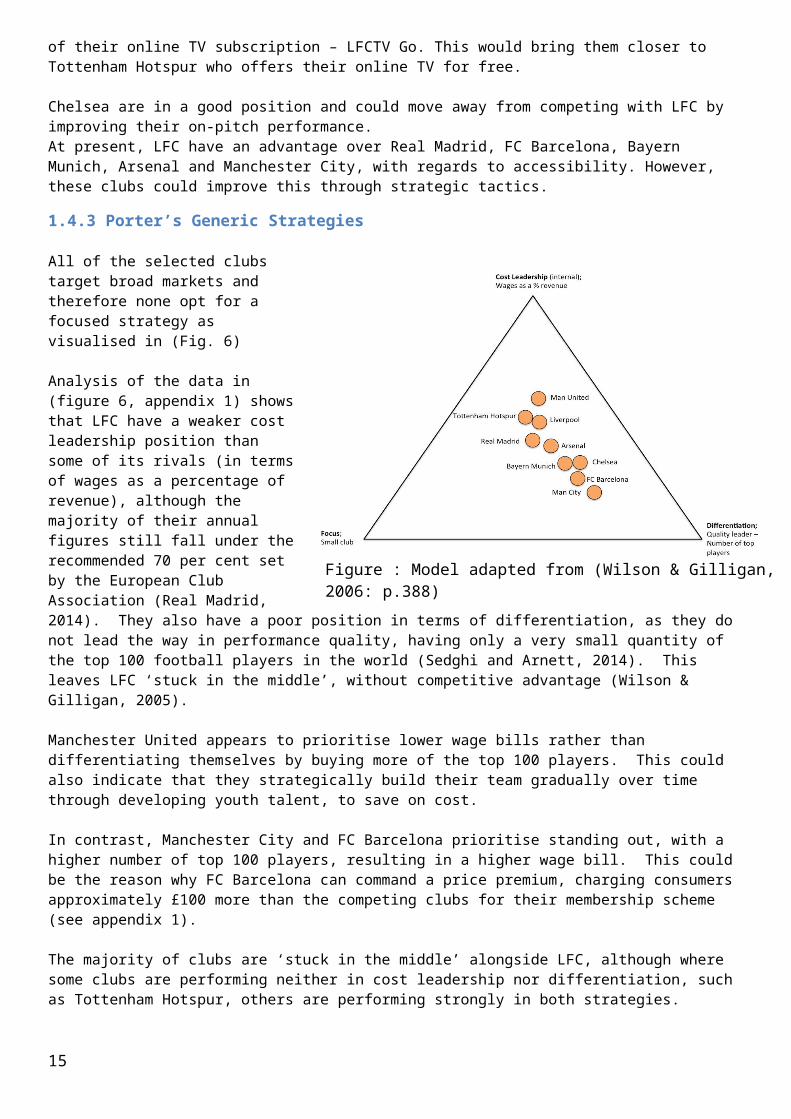
All of the selected clubs target broad markets and therefore none opt for a focused strategy as visualised in (Fig. 6)
Analysis of the data in (figure 6, appendix 1) shows that LFC have a weaker cost leadership position than some of its rivals (in terms of wages as a percentage of revenue), although the majority of their annual figures still fall under the recommended 70 per cent set by the European Club Association (Real Madrid, 2014). They also have a poor position in terms of differentiation, as they do not lead the way in performance quality, having only a very small quantity of the top 100 football players in the world (Sedghi and Arnett, 2014). This leaves LFC ‘stuck in the middle’, without competitive advantage (Wilson & Gilligan, 2005).
Manchester United appears to prioritise lower wage bills rather than differentiating themselves by buying more of the top 100 players. This could also indicate that they strategically build their team gradually over time through developing youth talent, to save on cost.
In contrast, Manchester City and FC Barcelona prioritise standing out, with a higher number of top 100 players, resulting in a higher wage bill. This could be the reason why FC Barcelona can command a price premium, charging consumers approximately £100 more than the competing clubs for their membership scheme (see appendix 1).
The majority of clubs are ‘stuck in the middle’ alongside LFC, although where some clubs are performing neither in cost leadership nor differentiation, such as Tottenham Hotspur, others are performing strongly in both strategies.
Although Porter (1980) world argue that this leaves the clubs with no competitive advantage (Wilson & Gilligan, 2005), Hill (1988) disagrees, suggesting that a company performing well in cost leadership and differentiation gives them a higher chance of sustained competitive advantage.
This could be the case in the football industry, for example, Real Madrid have achieved the lowest wage bill, yet strongly differentiate themselves with having 9 of the top 100 players, effectively leaving them in the middle.
Similarly, Bayern Munich has the highest number of top players; yet manage to have one of the lowest wage bills. This can be linked to higher total revenue figures as a result of successful on-pitch performance - due to a high quantity of top players.
11
Figure 6: Model adapted from (Wilson & Gilligan, 2006: p.388)
1.5 - Financial analysis
1.5.1 Total revenue by revenue streams
The three main streams of revenue in the football industry are from match day, broadcasting and commercial (section 1.3.0). It is clear from figure 7 that LFC need to increase total revenue to compete with their rivals.
Due to the economic climate there is no scope to increase ticket prices (MMU, 2014), so other strategies must be investigated to improve match day revenue.
To increase broadcasting revenue, LFC need to improve on-pitch performance, or look to develop independent broadcasting opportunities (MMU, 2014).
Commercial revenue is LFC’s strongest revenue stream, accountable for 47% of total revenue in 2012/13 (see figure 10).
New financial fair play regulations (FFP) came into play in 2013, which prevents clubs from spending more than they earn annually (MMU, 2014). LFC are currently under investigation for a possible breach of the break-even rule, with reported losses of £49.8m in 2012/13 and £40.5m in 2011/12 (The Guardian, 2014).
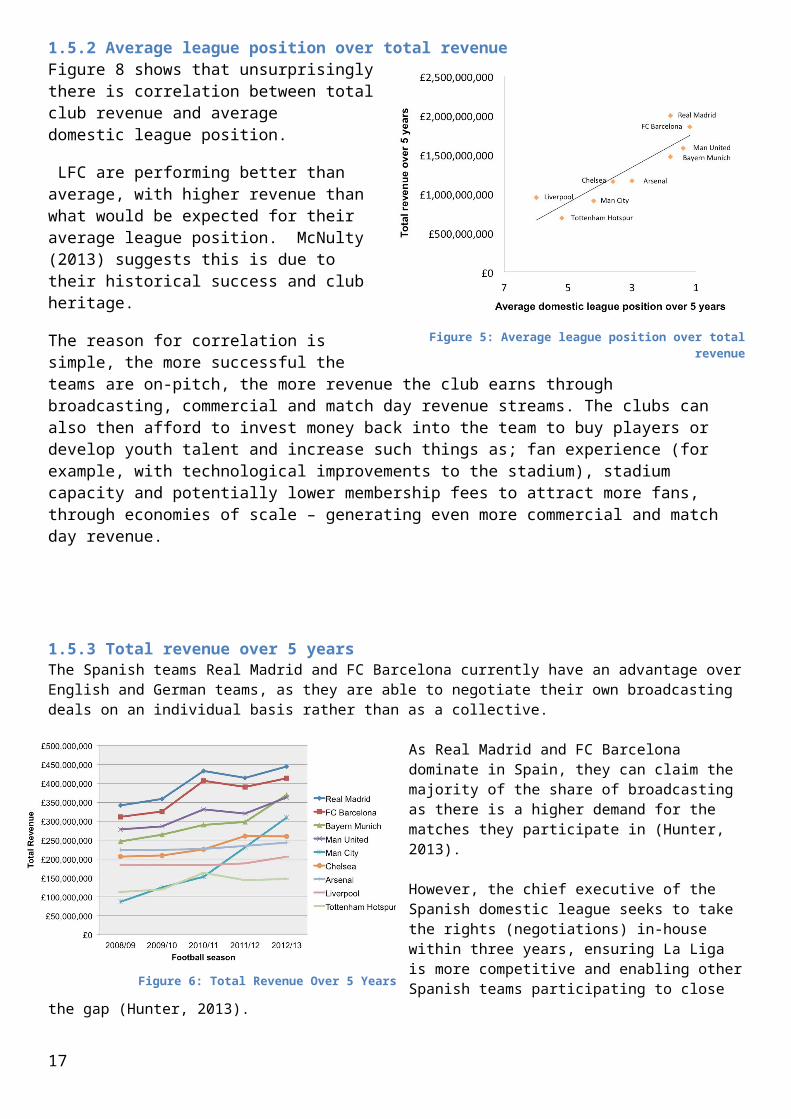
1.5.2 Average league position over total revenueFigure 8 shows that unsurprisingly there is correlation between total club revenue and average domestic league position.
LFC are performing better than average, with higher revenue than what would be expected for their average league position. McNulty (2013) suggests this is due to their historical success and club heritage.
The reason for correlation is simple, the more successful the teams are on-pitch, the more revenue the club earns through broadcasting, commercial and match day revenue streams. The clubs can also then afford to invest money back into the team to buy players or develop youth talent and increase such things as; fan experience (for example, with technological improvements to the stadium), stadium capacity and potentially lower membership fees to attract more fans, through economies of scale – generating even more commercial and match day revenue.
12
Figure 7: Total revenue by revenue streams
Figure 8: Average league position over total revenue
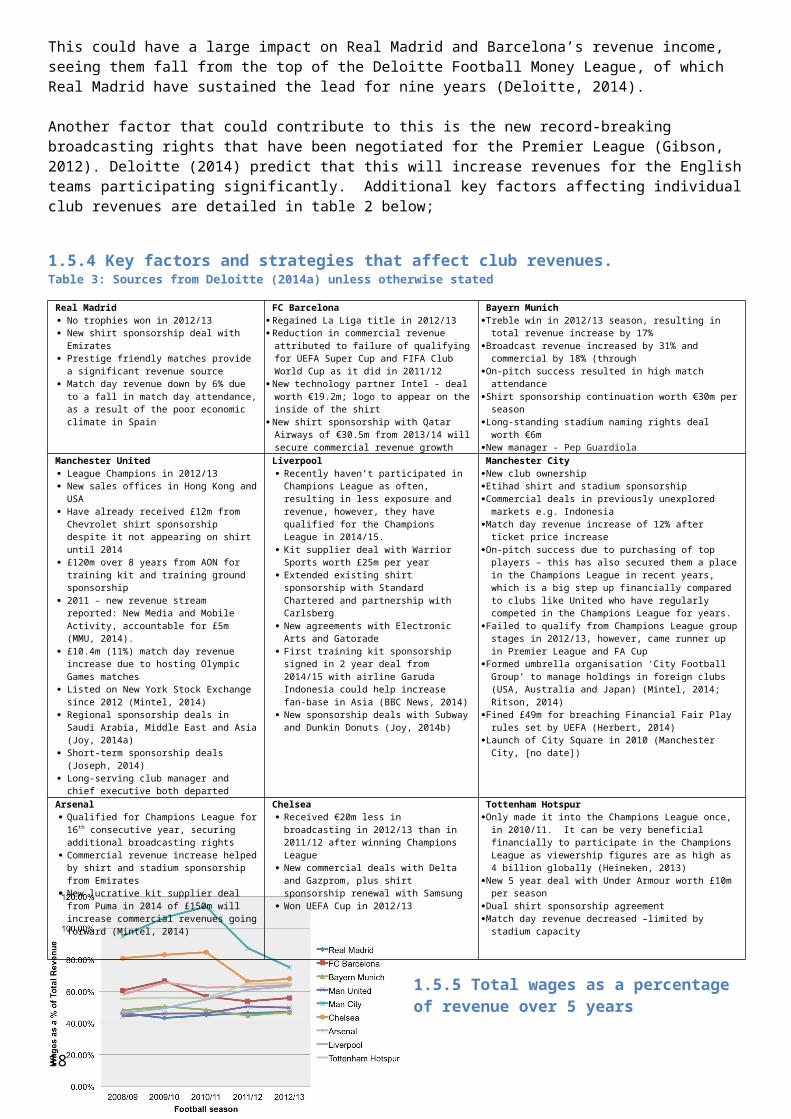
1.5.3 Total revenue over 5 years The Spanish teams Real Madrid and FC Barcelona currently have an advantage over English and German teams, as they are able to negotiate their own broadcasting deals on an individual basis rather than as a collective.
As Real Madrid and FC Barcelona dominate in Spain, they can claim the majority of the share of broadcasting as there is a higher demand for the matches they participate in (Hunter, 2013).
However, the chief executive of the Spanish domestic league seeks to take the rights (negotiations) in-house within three years, ensuring La Liga is more competitive and enabling other Spanish teams participating to close the gap (Hunter, 2013).
This could have a large impact on Real Madrid and Barcelona’s revenue income, seeing them fall from the top of the Deloitte Football Money League, of
which Real Madrid have sustained the lead for nine years (Deloitte, 2014).
Another factor that could contribute to this is the new record-breaking broadcasting rights that have been negotiated for the Premier League (Gibson, 2012). Deloitte (2014) predict that this will increase revenues for the English teams participating significantly. Additional key factors affecting individual club revenues are detailed in table 2 below;
1.5.4 Key factors and strategies that affect club revenues.Table 3: Sources from Deloitte (2014a) unless otherwise stated
Real Madrid No trophies won in 2012/13 New shirt sponsorship deal with Emirates Prestige friendly matches provide a significant
revenue source Match day revenue down by 6% due to a fall
in match day attendance, as a result of the poor economic climate in Spain
FC Barcelona Regained La Liga title in 2012/13 Reduction in commercial revenue attributed to
failure of qualifying for UEFA Super Cup and FIFA Club World Cup as it did in 2011/12
New technology partner Intel - deal worth €19.2m; logo to appear on the inside of the shirt
New shirt sponsorship with Qatar Airways of €30.5m from 2013/14 will secure commercial revenue growth
Bayern MunichTreble win in 2012/13 season, resulting in total revenue
increase by 17%Broadcast revenue increased by 31% and commercial by
18% (throughOn-pitch success resulted in high match attendanceShirt sponsorship continuation worth €30m per seasonLong-standing stadium naming rights deal worth €6mNew manager - Pep Guardiola
Manchester United League Champions in 2012/13 New sales offices in Hong Kong and USA Have already received £12m from Chevrolet
shirt sponsorship despite it not appearing on shirt until 2014
£120m over 8 years from AON for training kit and training ground sponsorship
2011 – new revenue stream reported: New Media and Mobile Activity, accountable for £5m (MMU, 2014).
£10.4m (11%) match day revenue increase due to hosting Olympic Games matches
Listed on New York Stock Exchange since 2012 (Mintel, 2014)
Regional sponsorship deals in Saudi Arabia, Middle East and Asia (Joy, 2014a)
Short-term sponsorship deals (Joseph, 2014) Long-serving club manager and chief
executive both departed
Liverpool Recently haven’t participated in Champions
League as often, resulting in less exposure and revenue, however, they have qualified for the Champions League in 2014/15.
Kit supplier deal with Warrior Sports worth £25m per year
Extended existing shirt sponsorship with Standard Chartered and partnership with Carlsberg
New agreements with Electronic Arts and Gatorade
First training kit sponsorship signed in 2 year deal from 2014/15 with airline Garuda Indonesia could help increase fan-base in Asia (BBC News, 2014)
New sponsorship deals with Subway and Dunkin Donuts (Joy, 2014b)
Manchester CityNew club ownershipEtihad shirt and stadium sponsorshipCommercial deals in previously unexplored markets e.g.
IndonesiaMatch day revenue increase of 12% after ticket price
increaseOn-pitch success due to purchasing of top players – this has
also secured them a place in the Champions League in recent years, which is a big step up financially compared to clubs like United who have regularly competed in the Champions League for years.
Failed to qualify from Champions League group stages in 2012/13, however, came runner up in Premier League and FA Cup
Formed umbrella organisation ‘City Football Group’ to manage holdings in foreign clubs (USA, Australia and Japan) (Mintel, 2014; Ritson, 2014)
Fined £49m for breaching Financial Fair Play rules set by UEFA (Herbert, 2014)
Launch of City Square in 2010 (Manchester City, [no date])Arsenal Qualified for Champions League for 16th
consecutive year, securing additional broadcasting rights
Commercial revenue increase helped by shirt and stadium sponsorship from Emirates
New lucrative kit supplier deal from Puma in 2014 of £150m will increase commercial revenues going forward (Mintel, 2014)
Chelsea Received €20m less in broadcasting in
2012/13 than in 2011/12 after winning Champions League
New commercial deals with Delta and Gazprom, plus shirt sponsorship renewal with Samsung
Won UEFA Cup in 2012/13
Tottenham HotspurOnly made it into the Champions League once, in 2010/11.
It can be very beneficial financially to participate in the Champions League as viewership figures are as high as 4 billion globally (Heineken, 2013)
New 5 year deal with Under Armour worth £10m per seasonDual shirt sponsorship agreementMatch day revenue decreased –limited by stadium capacity
13
Figure 9: Total Revenue Over 5 Years
1.5.5 Total wages as a percentage of revenue over 5 years
Real Madrid, Bayern Munich and Manchester United benefit from economies of scale, enabling them to sustain financially healthy low wage bills. (Fig. 10)
Manchester City has invested, on average, 95% of their total revenue on wages over the past 5 years (Fig.12). Although they have since been penalised by UEFA for breaching FFP rules (Herbert, 2014), the investment in players contributed to doubling their broadcasting revenue and increasing their commercial revenue by 800% over a 5 year period, resulting in lower wage bills effective from 2011/12.
Investment in the team manager and players is core to the success of the team and the overall business success (MMU, 2014). According to Deloitte (2014b), six of the seven clubs that finished at the top of the Premier League in 2012/13 had above average wage bills at £89m.
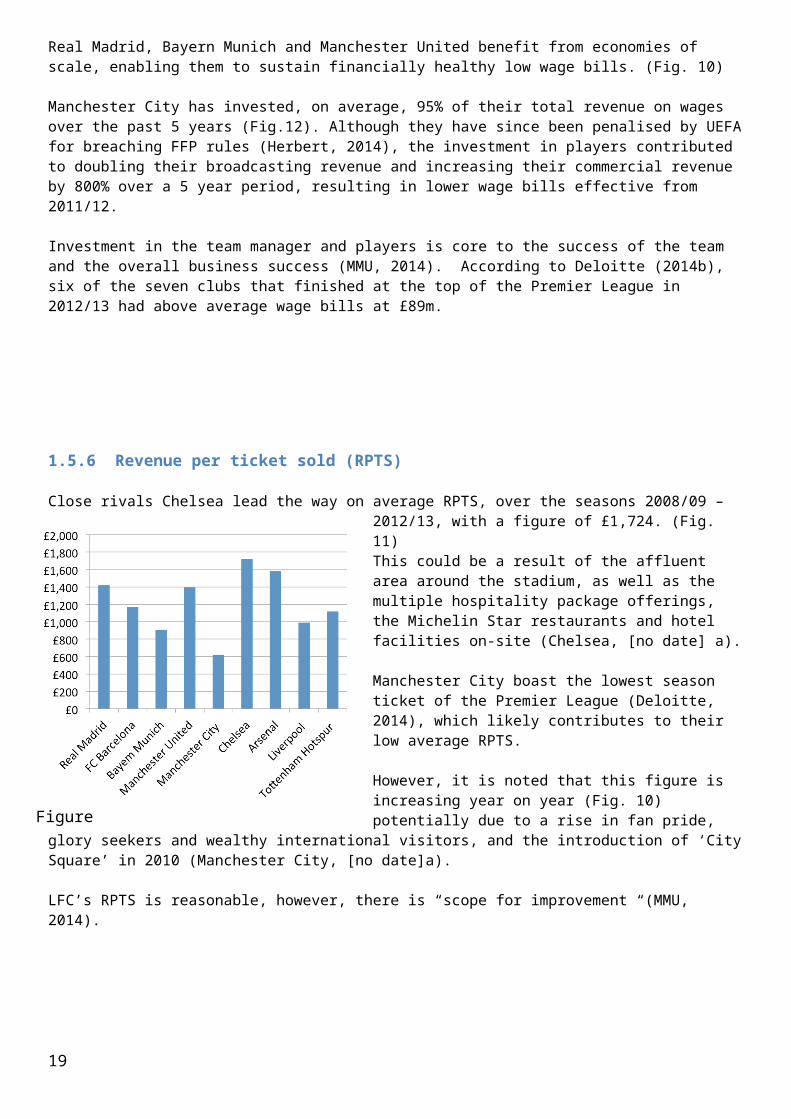
1.5.6 Revenue per ticket sold (RPTS)
Close rivals Chelsea lead the way on average RPTS, over the seasons 2008/09 – 2012/13, with a figure of £1,724. (Fig. 11)
This could be a result of the affluent area around the stadium, as well as the multiple hospitality package offerings, the Michelin Star restaurants and hotel facilities on-site (Chelsea, [no date] a).
Manchester City boast the lowest season ticket of the Premier League (Deloitte, 2014), which likely contributes to their low average RPTS.
However, it is noted that this figure is increasing year on year (Fig. 10) potentially due to a rise in fan pride, glory seekers and wealthy international visitors, and the introduction of ‘City Square’ in 2010 (Manchester City, [no date]a).
LFC’s RPTS is reasonable, however, there is “scope for improvement “(MMU, 2014).
14
Figure 10
Figure 11
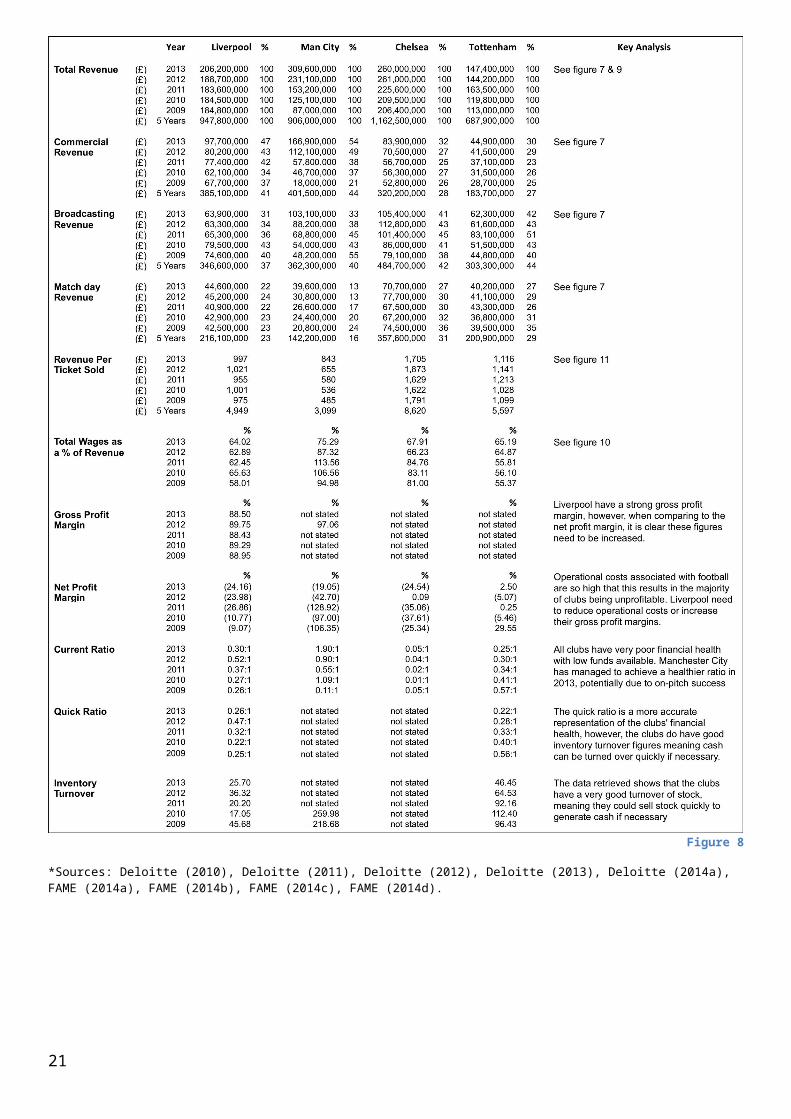
1.5.7 Financial data
15
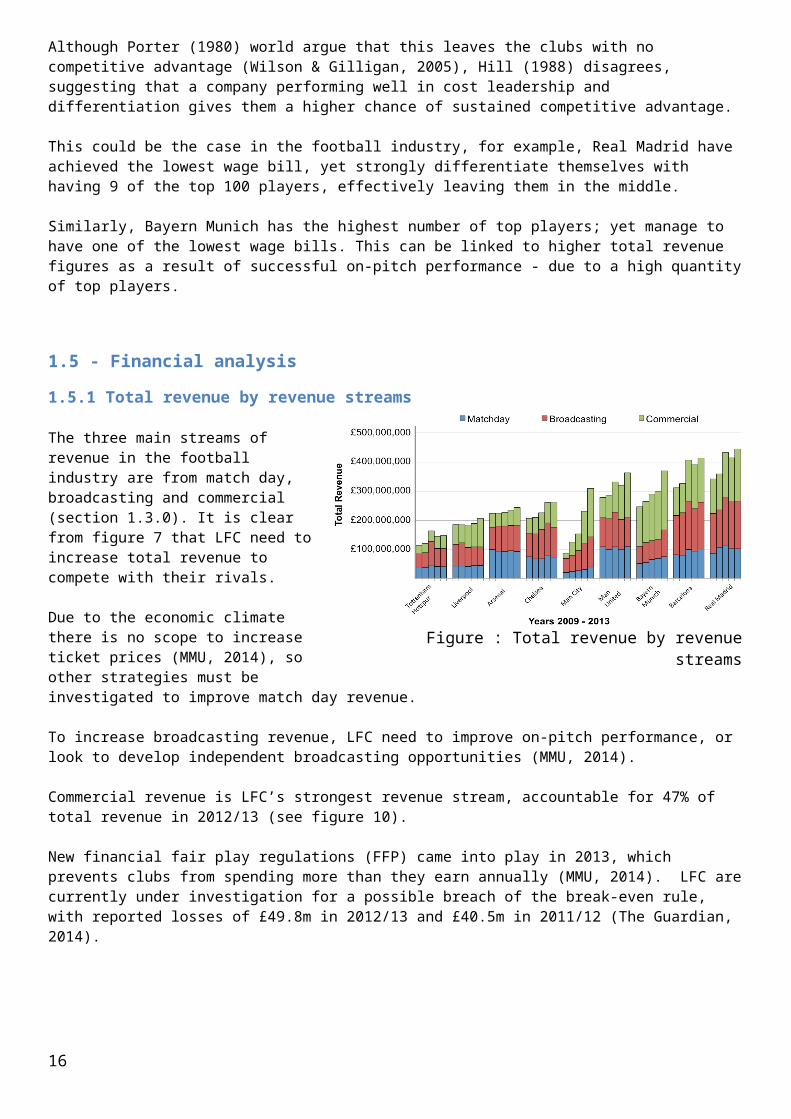
Figure 12
*Sources: Deloitte (2010), Deloitte (2011), Deloitte (2012), Deloitte (2013), Deloitte (2014a), FAME (2014a), FAME (2014b), FAME (2014c), FAME (2014d).
1.6 Customer and consumer analysis
16
The football industry is a ‘specialist sector’ with ‘unique characteristics.’ Loyalty levels within football are assumed to be higher than consumer characteristics within conventional industries. (Adamson et al, 2005) Loyalty to support a team generally derives from following family loyalty or success of the team. (O’Donnell, 2013)
Segmenting allows a better understanding of customer needs and characteristics, which allows for more accurate marketing approaches to be made (Frank et al., 1972). (Tapp & Clowes,2002) created a model based on UK football that highlights three generic types of football fan: ‘Casuals,’ ‘Regulars’ and ‘Fanatics.’ A full break down of these fan types can be found in appendix 4.
LFC’s fan base has two primary segments, a) the Domestic market and b) the Global market.
1.6.1.Domestic MarketBPL physical attendance to games hit 13.7 million for the 2012/13 season. (Davies, 2014). LFC have 24,500 season ticket holders in total and another 28,000 fans are on the season ticket waiting list. The club also has around 100,000 members accessing tickets over the course of a season. (Pearce, 2014)
Segment Profile
Likelihood to spend ranking
(X)
Avg. weekly household disposable
income
Avg. Weekly household
disposable income index (Y)
X+YAttractive
ness to LFC rank
Mine’s a pint
These are fans that like a drink or two either side of the game. These fans will arrive early, “to park”, will often meet casual acquaintances at the bar or maybe read the programme.
3 £625 3 6 3
Juggling the kids
Families trying to fit in two or three events in the day. They may arrive at the ground at the last minute, but be high half time spenders on snacks and so on. Families are also high spenders on merchandise.
2 £625 3 5 2
Thermos at row D
These are creatures of habit that get into the ground quite late, they were not interested in talking to anyone and may not spend much money at the ground on programmes or food. These are likely to be season ticket holders, of which LFC currently have 24,500. (Liverpool, 2014)
6 £500 6 12 6
Season ticket
friendly’s
These people enjoy the social event of meeting fellow supporters by virtue of always having the same seat. These are likely to be season ticket holders, of which LFC currently have 24,500. (Liverpool, 2014)
5 £500 6 11 5
Loyal cash and
chanters
They buy tickets with cash when they get paid and have a good shout at the game. May be “regular” fans, which have a low evaluation of alternatives, high commitment to the club/football, prefer entertainment over winning, favour non-football over football priorities and average 10-18 matches per season.
4 £500 6 10 4
Dads and sons
These are loyal, “club” rather than “football” oriented, with a low evaluation of alternatives and a high commitment to the club/football. They favour a winning over entertaining match and favour non-football priorities over football. They have a high priority on service/physical environment rather than building relationships. Income is not an issue, they value variety and choice. Considered as lifetime fans, however 26% attend other team’s matches.
1 £700 1 2 1
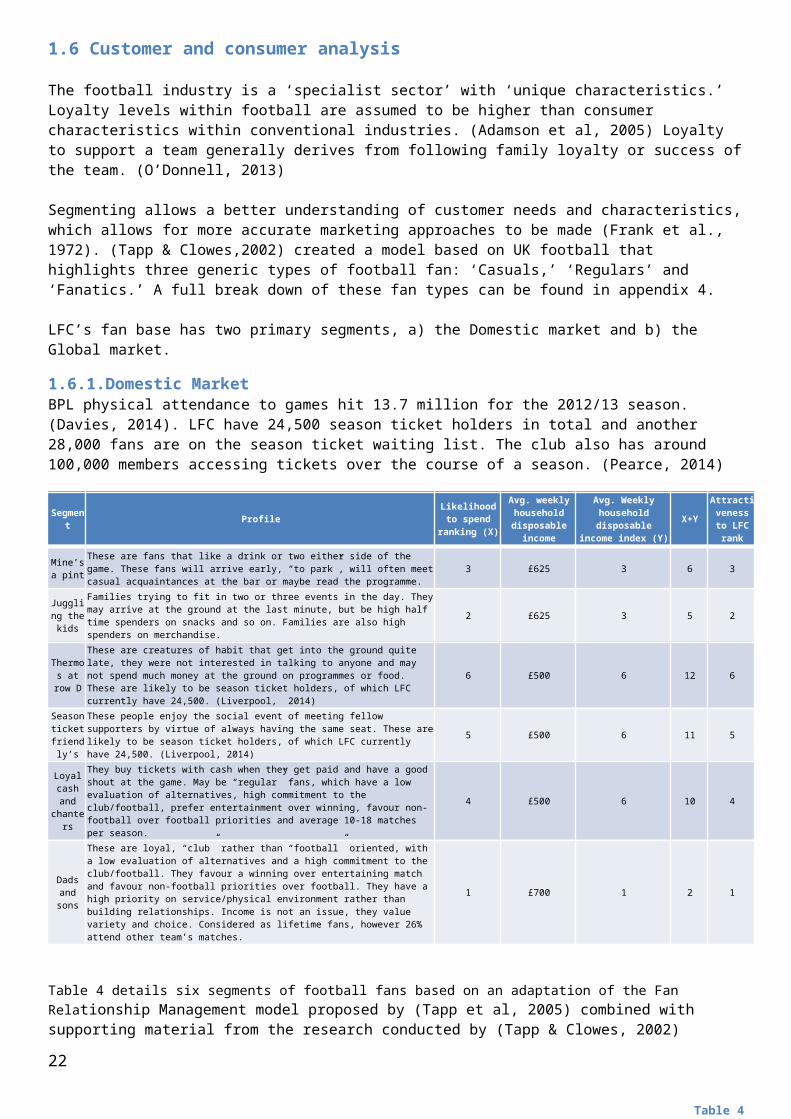
Table 4 details six segments of football fans based on an adaptation of the Fan Relationship Management model proposed by (Tapp et al, 2005) combined with supporting material from the research conducted by (Tapp & Clowes, 2002) Segmenting football followers.
Table 4, column 3, shows each segment ranked by their ‘likelihood to spend’ based on the behaviours identified in each profile and the indicated amount of people involved in each segment.
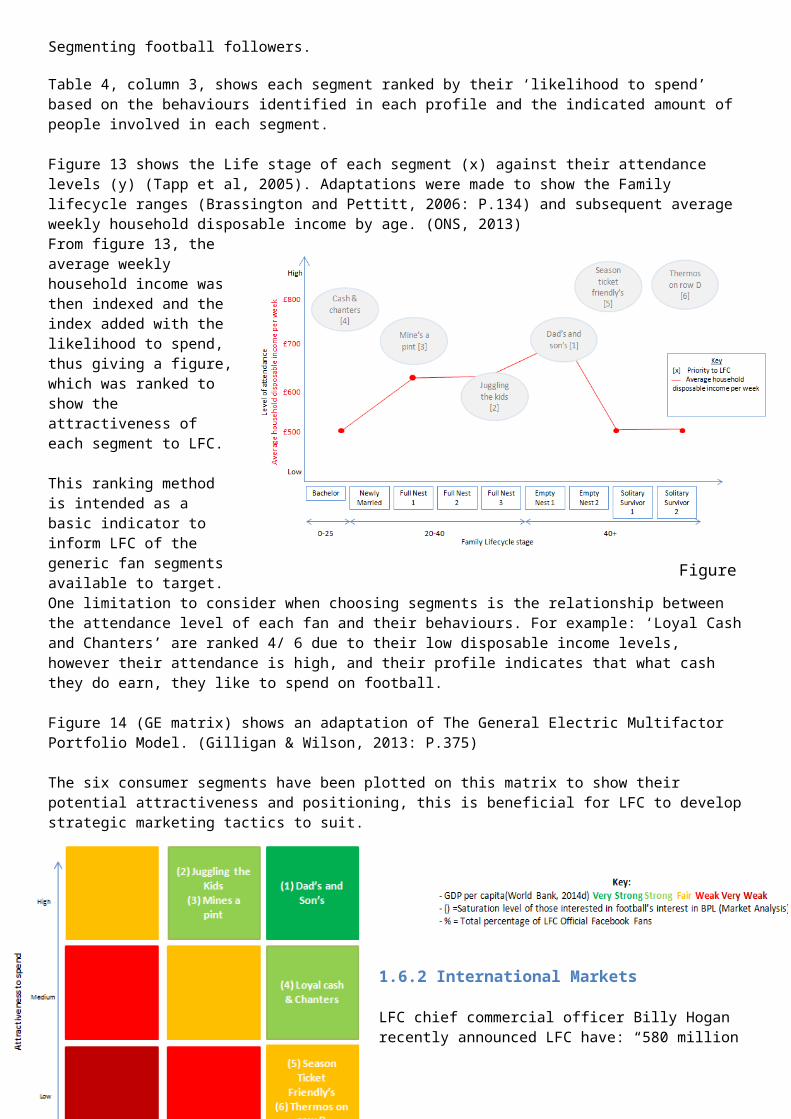
Figure 13 shows the Life stage of each segment (x) against their attendance levels (y) (Tapp et al, 2005). Adaptations were made to show the Family lifecycle ranges (Brassington and Pettitt, 2006: P.134) and subsequent average weekly household disposable income by age. (ONS, 2013)From figure 13, the average weekly household income was then indexed and the index added with the likelihood to spend, thus giving a figure, which was ranked to show the attractiveness of each segment to LFC.
17
Table 4
This ranking method is intended as a basic indicator to inform LFC of the generic fan segments available to target. One limitation to consider when choosing segments is the relationship between the attendance level of each fan and their behaviours. For example: ‘Loyal Cash and Chanters’ are ranked 4/ 6 due to their low disposable income levels, however their attendance is high, and their profile indicates that what cash they do earn, they like to spend on football.
Figure 14 (GE matrix) shows an adaptation of The General Electric Multifactor Portfolio Model. (Gilligan & Wilson, 2013: P.375)
The six consumer segments have been plotted on this matrix to show their potential attractiveness and positioning, this is beneficial for LFC to develop strategic marketing tactics to suit.
18
Figure 14
1.6.2 International Markets
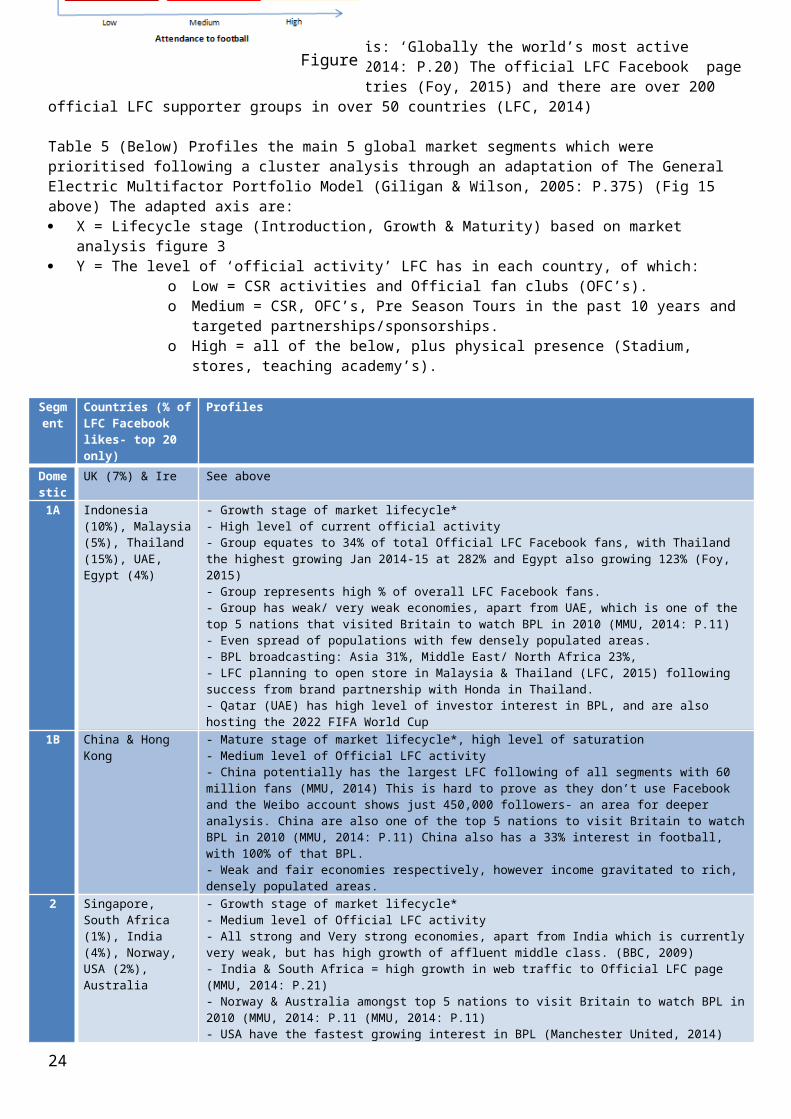
LFC chief commercial officer Billy Hogan recently announced LFC have: “580 million fans globally,” (Pearce, 2014). LFC is: ‘Globally the world’s most active sports brand on social media’ (MMU, 2014: P.20) The official LFC Facebook page has 24,619,000 fan’s in over 90 countries (Foy, 2015) and there are over 200 official LFC supporter groups in over 50 countries (LFC, 2014)
Table 5 (Below) Profiles the main 5 global market segments which were prioritised following a cluster analysis through an adaptation of The General Electric Multifactor Portfolio Model (Giligan & Wilson, 2005: P.375) (Fig 15 above) The adapted axis are: X = Lifecycle stage (Introduction, Growth & Maturity) based on market analysis figure 3 Y = The level of ‘official activity’ LFC has in each country, of which:
o Low = CSR activities and Official fan clubs (OFC’s). o Medium = CSR, OFC’s, Pre Season Tours in the past 10 years and targeted
partnerships/sponsorships. o High = all of the below, plus physical presence (Stadium, stores, teaching
academy’s).
Segment
Countries (% of LFC Facebook likes- top 20 only)
Profiles
Domestic
UK (7%) & Ire See above
1A Indonesia (10%), Malaysia (5%), Thailand (15%), UAE, Egypt (4%)
- Growth stage of market lifecycle*- High level of current official activity- Group equates to 34% of total Official LFC Facebook fans, with Thailand the highest growing Jan 2014-15 at 282% and Egypt also growing 123% (Foy, 2015)- Group represents high % of overall LFC Facebook fans.- Group has weak/ very weak economies, apart from UAE, which is one of the top 5 nations that visited Britain to watch BPL in 2010 (MMU, 2014: P.11)- Even spread of populations with few densely populated areas.- BPL broadcasting: Asia 31%, Middle East/ North Africa 23%,- LFC planning to open store in Malaysia & Thailand (LFC, 2015) following success from brand partnership with Honda in Thailand.- Qatar (UAE) has high level of investor interest in BPL, and are also hosting the 2022 FIFA World Cup
1B China & Hong Kong - Mature stage of market lifecycle*, high level of saturation- Medium level of Official LFC activity- China potentially has the largest LFC following of all segments with 60 million fans (MMU, 2014) This is hard to prove as they don’t use Facebook and the Weibo account shows just 450,000 followers- an area for deeper analysis. China are also one of the top 5 nations to visit Britain to watch BPL in 2010 (MMU, 2014: P.11) China also has a 33% interest in football, with 100% of that BPL.- Weak and fair economies respectively, however income gravitated to rich, densely populated areas.
2 Singapore, South Africa (1%), India (4%), Norway, USA (2%), Australia
- Growth stage of market lifecycle*- Medium level of Official LFC activity- All strong and Very strong economies, apart from India which is currently very weak, but has high growth of affluent middle class. (BBC, 2009)- India & South Africa = high growth in web traffic to Official LFC page (MMU, 2014: P.21)- Norway & Australia amongst top 5 nations to visit Britain to watch BPL in 2010 (MMU, 2014: P.11 (MMU, 2014: P.11)- USA have the fastest growing interest in BPL (Manchester United, 2014)- Australia account for the highest online spend on Official LFC website. LFC also have first team Australian GK Brad Jones
3 Japan, South Korea, Russia, Canada, Poland, France (2%), Sweden, Mexico (3%), Netherlands, Argentina (1%)
- Growth stage of the market lifecycle*- Low level of Official LFC activity- Primarily fair, strong and very strong economies respectively, with the exception of weak Mexico.- France could have interest in 1st team player Mamadou Sakho- Japan was one of the top 5 nations to visit Britain to watch BPL in 2010 (MMU, 2014: P.11)
4A Nigeria (1%) - Mature stage of the market lifecycle,* high saturation
19
Figure 15

- Low level of Official LFC Activity- Very weak economy and suffering political instability due to Boko Haram activity.
4B Turkey (3%) & Germany (1%)
- Introduction stage of market lifecycle*- Medium level of Official LFC activity-Strong & weak economies respectively- Both countries have own established leagues: Soccerway and Bundesliga, fans may have strong loyalty with own domestic football.- Germany could have interest in 1st team player Emre Can
5 Italy (1%), Brazil (3%) & Spain
- Introduction stage of market lifecycle*- Low level of Official LFC activity- All have fair economies- 1st team player nationalities = Italian 2, Brazil 2, Spain 3- All countries have own established leagues: Serie A, Campeonato & La Liga. Fans may have strong loyalty with own domestic football, however Facebook likes from Brazil grew 141% Jan 2014-15 (Foy, 2015) possibly a result of RIO World Cup 2014.
*Position on Lifecycle based on affiliation to BPL
Table 5
20
1.7 - Internal analysis
1.7.1 Dynamic Capabilities Value chain: Brand Heritage and Community of Fans
Supporting ActivitiesOwner: Fenway Sports Group (FSG) took over the club in October 2010 and have ‘…a proven track record in sports marketing, asset maximization, stadium regeneration, contra branding fertilization, strategic management and investment, and international business development’ (MMU, 2014:23). The takeover helped LFC negotiate higher valued sponsorships, however, on-pitch performance has not been as successful (MMU, 2014). FSG is based in North America and also owns Major League Baseball team Boston Red Sox, Fenway Sports Management (FSM) and New England Sports Network (NESN), amongst other companies (MMU, 2014). This could provide additional exposure and sponsorship opportunities for LFC.HQ & Management: Managing Director Ian Ayre brought all commercial aspects of the organisation in-house to enable LFC to have more control over its profitability. LFC saw commercial revenue up 85% over 2007-2012 after this change was implemented (MMU, 2014). A new office has been opened in London ‘to realise commercial potential’ (Joy, 2014), and Billy Hogan was hired as the Chief Commercial Director in 2012 to boost the value of the brand (Joseph, 2012).Newly appointed Chief Media Officer, Matthew Baxter, has been employed in an effort to boost reach of digital content to overseas fans (Joseph, 2013a).Management and support (Football Team): Brendan Rodgers manages the first team, along with 19 other staff who support the team, comprising of assistant coaches, analysts, physiotherapists and consultants to name a few (Liverpool FC, [no date]a). Brendan Rogers joined the club in 2012, and has since signed 24 players for LFC – many of those signed have been young players invested in for the future, however, Savage (2014) believes that 20 of the signings don’t meet the mark. LFC also have over 40 players signed to their Under 21s and Under 18s squads through the ‘Academy’, which current captain Gerrard joined when he was nine years old (BBC Sport, 2015), proving the Academy has a history of success. They also have a successful women’s team – Liverpool Ladies FC (ITV News, 2014).Corporate Social Responsibility: LFC were awarded the ‘CommunityMark’ in 2009 for their investment in local and overseas communities, with a focus on ‘…education, health, social inclusion, physical activity and charity support…’ (MMU, 2014:20). Although their community work benefits everyone, most initiatives aid younger people in the community by partnering with local schools.Brand and Marketing: LFC has a strong brand, rich with heritage (Rogers, 2013), with the brand being valued at £279m in 2014 and ranked 8 th highest football brand in the world (Brand Finance, 2014). The LFC brand is reportedly the 5th most influential sports brand in licensing (Crookes, 2013). Brand Finance CEO, believes that brand value can be leveraged to grow revenue (Brand Finance, 2014). The LFC brand is ‘…about inclusiveness, society, community and respect’ (MMU, 2014:22), resonating with fans internationally. LFC works with its partners to create ‘…innovative and measurable marketing programmes that consistently meet and surpass their business objectives’ (Liverpool FC, [no date]b).
Primary ActivitiesPlayers & Team: LFC currently employ 3 of the top 100 football players in the world (Sedghi and Arnett, 2014), this could result in increased brand attractiveness and improve on-pitch performance, leading to revenue growth. However, long-serving captain Steven Gerrard is due to depart the club at the end of the (Smith, 2015) and the team will need to be strengthened (Brand Finance, 2014). Wage bills are also very high considering lack of top players (Savage, 2014). The first team tour international markets ahead of the football season (MMU, 2014) to grow interest.
Stadium & Facilities: Stadium capacity is currently 45,522 with plans to expand to 58,000 (Menezes, 2014), as stadium capacity utilisation rate is so high. As well as offering various hospitality packages, conference facilities, stadium and museum tours (MMU, 2014), and providing additional facilities for families (Family Park & Family Zone), LFC are committed to improving fan experience by making changes based on fan feedback (Liverpool FC, [no date]c). It is also used for hosting events like tribute acts and Christmas parties. (Liverpool FC, [no date]d). The Anfield Stadium has received the highest percentage of ‘excellent’ ratings on TripAdvisor, compared to competitors (see appendix 3). LFC offer free Wi-Fi access to the fans in the 12,000-seater Centenary Stand, however, they have no plans to roll this out to the rest of the stadium (Reynolds, 2013). LFC can collect data on the fans who use the Wi-Fi (Joseph, 2013b)
Stores & Merchandise:LFC have a wide range of branded and licensed merchandise (MMU, 2014). Branded merchandise can be purchased at 8 official club stores throughout the UK, Northern Ireland, Republic of Ireland and Malaysia, with concessions in Indonesia (Liverpool FC Store, [no date]), online, and through other partnered retailers. Replica kits and football accessories, such as football boots, make up the bulk of the sales (MMU, 2014). LFC also plan to open official stores in Thailand and Indonesia (Liverpool FC, 2014).
Subscriptions (Membership & TV/Web/Mobile): LFC offer competitively priced junior, light, full and international membership (MMU, 2014; see appendix 1 for price comparison with competitors). They are also very accessible, having a TV channel available on pay-TV packages in the UK, and LFC TV Go (an on-demand service available digitally) for both UK and international fans, which generate over £5m annually (MMU, 2014). LFC are the most active sports brand on social media (MMU, 2014), creating localised pages to increase engagement and loyalty overseas (Joseph, 2013c; Joseph, 2013a) and also have a dedicated online fan area on their website – ‘theKOP’, increasing fans opportunities to interact further (Liverpool FC, [no date]e). There are also multiple mobile apps available to download (Liverpool FC, [no date]f), adding to fan experience.
On-pitch Performance: Broadcasting revenue increases with on-pitch success (MMU, 2014). In the 2012/13 season, broadcasting revenues accounted for 31% of total revenue at £63.9m, approximately £40m less than close rivals Chelsea and Manchester City (Deloitte, 2014), On-pitch success can also be linked to an increase in sales of merchandise, subscriptions and match day tickets, whilst enabling LFC to negotiate bigger sponsorship deals.
Sponsorship, Partnerships & Franchises: LFC have 3 main sponsors, 14 global partners and 4 regional marketing partners (in Thailand, Malaysia, Singapore and India). The partnerships are committed to putting fan rewards and engagement first (Liverpool FC, [no date]b).LFC offer a co-branded rewards credit card (MBNA, [no date]), which allows LFC to collect data on fans. LFC offer coaching to players all over the world through their Soccer School and International Football Academy programmes (MMU, 2014). This drives fan recruitment and engagement through brand exposure internationally.
Figure 16: Porter's (1980) Value Chain adapted by Atkinson (2010)
21
Competitive Advantage
1.7.2 BCG Product portfolio (Dibb, Simkin, Pride & Ferrell,2006: 45)
LFC currently operate a balanced product portfolio with an equal amount of revenue streams coming from stable cash cow sources, and unstable question mark sources.
Considerations should be made to fund developments of Question marks by decreasing capital investment of some Cash Cow activities and deleting Dog activities.
1.7.3 Sounders wheel
Sounders wheel analysis to identify the brand personality of LFC, survey conducted from speaking to fan's of LFC, and findings through research on the club.
Liverpool have a strong club culture, and fan following globally.
They are most recognised for their club colour Red, their home ground and city - Liverpool and Anfield.
The success of global fan clubs (section 1.6.2) demonstrate how the strong culture of LFC can be transported across multiple markets.
1.7.4 Prioritised SWOT Analysis
Strengths Opportunities1. Club heritage and UK Brand – established in 1892, LFC has a rich football
history and heritage, UK’s 4th largest club, with iconic stadium and loyal fans going back generations (MMU, 2014). Historic English football brand with global appeal, providing value for potential sponsors and partnerships.
2. Global Appeal (Fans) – global club 580+ million fans globally (Kent, 2014), officially worlds most attractive football brand on social networks currently with 24,462,000 Facebook fans in 90+ countries, and 200+ international supporter groups (Section 1.6.2). Liverpool website available in 22 languages with country specific sites (McLaren, 2013).
3. Fenway Sports Group Ownership – competent, experienced and financially stable, previous experience and success in; sports marketing, asset maximisation, stadium regeneration, contra branding fertilisation, strategic management and investment, international business development (MMU, 2014). FSG offer fantastic commercial and broadcasting links in US markets amongst others, via their affiliated businesses.
4. Stadium – Anfeild stadium is a key part to LFC history and heritage. Planning permission for 13,500-seat stadium expansion finally granted. Final match day capacity of 59,000, potentially contributing an additional £31.7m in match day revenues (Bascombe, 2014). Utilaise FSG experience of historic ground into modern digital stadium, FSG development of Fenway park increased revenues.
1. Players & Strategic Investment – Invest and develop first team to improve on pitch performance, win competitions and gain prize money. Possibility of additional revenue streams through player sponsorship and licensing rights for headline players. Long term strategy to develop youth team academy / player scouts, insight of discovering and developing youth talent. To then play for the team or sell.
2. Global Fans and Markets – explore and realise cashable international markets / fans using FSG connections and experience (MMU, 2014). Explore possibilities of international, sponsorship, partnerships and cobranding. Develop LFC international merchandise business. Facilitate international fans to drive engagement and accessibility, both physically and digitally.
3. Commercial Opportunities – Create/develop commercial ventures including regional and international sponsorships and partnerships, international markets, co branding. Consider additional commercial revenue streams (eg, Regional Sponsorship / Partnerships etc.).
4. Broadcasting Opportunities – Develop LFC TV service globally. Investigate independent broadcasting or invest in new programming. Improve accessibility to this service in global markets.
5. Fan Experience / Increase Revenue per ticket sold– Develop match day experience encouraging time spend at stadium and fan engagement to increase spend of attending fans. Increase indicatives to encourage fans to stay longer and use the stadium facilities (WIFI, fan square, fan zone, accessibility to concession and betting stalls, and providing entertainment to engage fans.
Weaknesses Threats
22
Figure 17
1. First Team success – diminishing on-pitch performance, as results of injuries, selling key players and lack of strategic investment. No success in recent years (BPL never won, FA Cup winners 05-06, UEFA winners 04-05) resulting in poor club attractiveness for potential players (MMU, 2014). No competitive advantage of Low cost leadership or low quality players (figure 6).
2. Finances – poor financial health, lack of money coming through commercial, match day and broadcast business (Markham, 2014). Issues include wages as a % of profit against competitors (Figure 10). The football market is highly volatile dependent on team performance and brand (Section 1.3.0). Poor financial health has resulted in the development of threats (e.g. FFP investigation) (BBC Sport, 2014c).
3. Lack of Vision/ Strategy – Lacking strategic clarity, with no apparent mission or vision for the business. Missing strategic opportunities of leveraging CRM data, building engagement and improved value for fans (MMU, 2013).
4. Disgruntled fans – Anfeild’s capacity/utilization rate makes ticket difficult to acquire, fans are also protesting over rising ticket prices (Oct 2014) (Andrew, 2014). Further floundering team performance is resulting in fan disenchantment.
1. Financial Fair Play – UEFA have confirmed they are investigating LFC (BBC Sport, 2014c), for losses in excess of £35.4m over two seasons. Implications include; fines, point deductions, withholding winnings, and player transfer restrictions (UEFA, 2010). This could also cause reputation damage.
2. Competition/other clubs – Financial volatility, BPL is worlds 2nd most competitive league, with prize money and competition qualification reliant on success (DiBella, 2013). Treats of more attractive/ successful teams headhunting player talent.
3. Implications of Poor Performance - Top player want to play for winning teams, difficulty of acquiring/retaining top talent. Losing fan interest with continuous mediocre performance (section 1.6.0). Financial volatility of the league favor’s top clubs, 2nd most competitive league in world, difficult to break though.
4. Threat of substitutes – Fans trading down or becoming disengaged with LFC (MMU, 2014), trading down to follow LFC on TV, digital, and online coverage of LFC rather then at the stadium. Threat can be limited by improved on pitch performance, access channels.
1.8 - Critical issues Below is a prioritised set of critical issues that have derived from the SWOT analysis.
1. Poor on pitch performance:a) Caused by the loss of key players (Suarez) and ongoing injuries (Sturridge)b) Lack of performance and title wins reduces potential to claim Broadcasting rightsc) Financial instability, lack of money to buy new players following FFP rules reduces potential to
maximise revenue streams.d) Makes LFC unattractive to new commercial investors e) Makes LFC unattractive to new top players
2. Poor financial healtha) FFP rules have capped the amount clubs can spend on players to their income. This results in inability
to purchase top players, which in turn reduces the likelihood of success rate on the pitch, which increases the threat of relegation
b) The FFP time limit has made this a critical factor due to rules stating that club’s must reduce their losses to spend more than they earn annually. LFC is currently under investigation for breaching this rule (Guardian, 2014) they therefore face further threat of taxation, or transfer embargo. (Financial Fair Play, 2014)
3. Not exploiting global markets to their full potentiala) Despite LFC’s achievement of (Crookes, 2014) There are still missed audiences that are potentially
viable as they have high interest in the football industry, and also opportunities to capitalise on the existing global audiences they currently have stakes in.
4. Threat of substitutesa) (Section 1.2) details the threat of substitutes, which includes domestic markets evaluating other
alternatives on match days, increasing numbers of fans trading down to watching football on TV, either via LFC TV or mainstream coverage. There is also an increase in illegal streaming from overseas providers.
2.0 - Objectives and Strategy
23
A market-orientated approach identifies market trends and consumer wants and needs before implementing strategies to target them (Kohli and Jaworski, 1990).
Sections 1.0 - 1.8 identify up-to-date, in-depth micro and macro situational analysis. Sections 2.0 – 3.3 build strategies on the findings, to achieve sustained competitive advantage (Wilson and Gilligan, 2005).
2.1 - Mission Statement, Corporate and Marketing Objectives
2.1.1 LFC Mission Statement 2015
To be the most globally attractive football team, leading the field both on and off the pitch in unity and innovation.
2.1.2 Corporate Objectives
1. To increase overall revenue by 5% year on year. Over the periods 2008/09 – 2012/13, LFC’s overall revenue increased marginally, by approximately 11% over the 5 years (Figure 12). In comparison to Premier League rivals previously identified, this figure is very low. With the opportunities available to leverage their rich heritage by exploiting existing and emerging markets, 5% has been recognised as a realistic year on year increase for LFC to achieve.
2. To reduce operational costs by 5% by financial year end 2018.Operational costs associated with the football industry are incredibly high, with LFC spending 64% of its total revenue on wages for the 2012/13 season (Section1.5). This needs to be addressed with a review of the current team and wages. Profit margins on product need to be increased and overhead costs reduced where possible.
3. To become a sustainable and profitable business by 2020.Currently, LFC as a business is largely unprofitable (see figure 12 for net profit margins). The business needs to comply with both current and future FFP regulations to avoid the risk of relegation of European competitions and reduce risk of further debt.
2.1.3 Marketing Objectives1. Develop brand awareness by 30% amongst football fans, in 2 emerging markets per year, over 3 years.(Section 2.6) Highlights the strategy to be followed when targeting and positioning global market segments.
This objective will be completed by targeting markets in phases 2, 3 and 4B. For the year 2015-16 priorities will be focusing on building on existing work in phase 2 markets in the aim to increase brand awareness and help to push the market in to Phase 1 stage. Strategic review is to be done Jan 2016 to reassess market segments and initiate strategies appropriately.
2. Increase overall sales of merchandise, LFCTV and new media by 7% annually.Although LFC have a strong commercial revenue stream (Figure 12), there is opportunity to exploit markets further. LFC need to push sales of commercial items to safeguard them from any poor performance on-pitch.
3. Increase annual average revenue per ticket sold by 11% within 5 years.Over the periods 2008/09 – 2012/13, LFC had an average RPTS of £989.73 (see figure 11). With opportunities available to enhance the match day experience (Section 1.7.4), RPTS can potentially be increased by approximately 11%, on average, to £1100. This would result in an approximate increase of £6 per person per match (calculated by average number of matches attended in one season (19) divided by the approximate surplus figure (£110)).
4. Increase overall engagement of existing fans, online and offline, by 15% over 3 years.
24
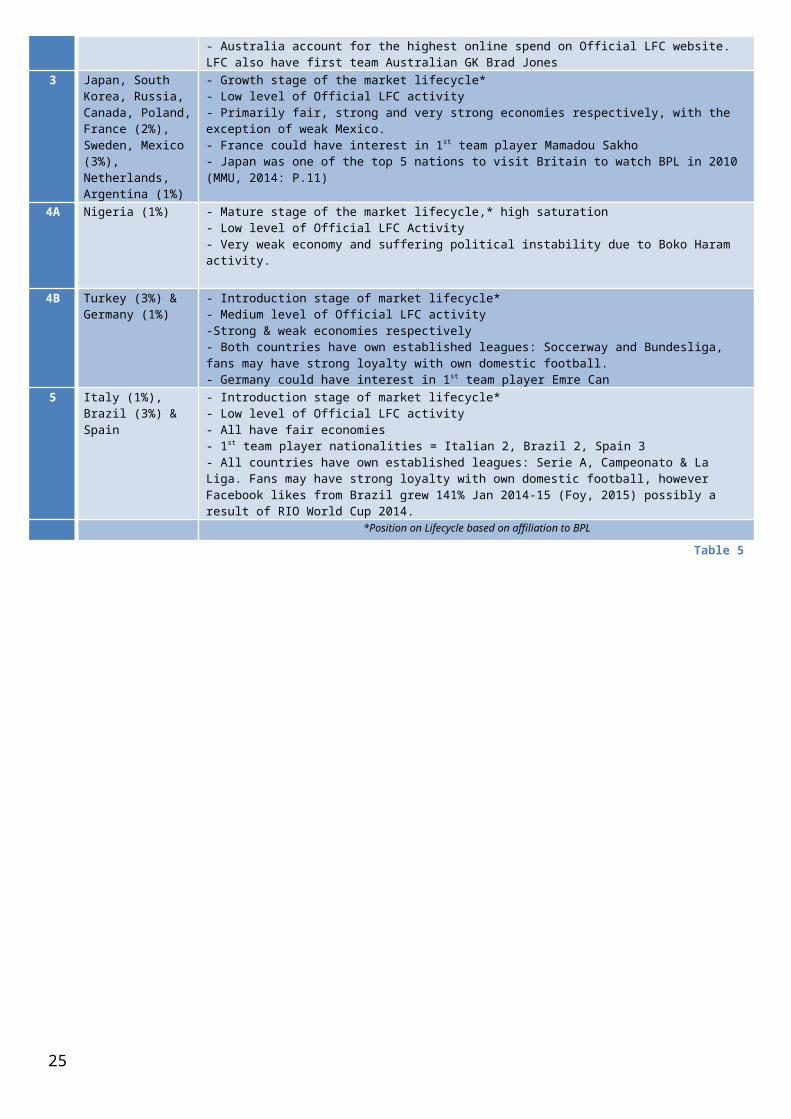
‘Engagement is highly correlated with revenue and profits’ (Bingham, 2014). Online fan engagement can be measured through interaction on social media and via the LFC website, and offline through match attendance, sales of merchandise and reviews left on websites such as TripAdvisor.
2.2 - Strategic optionsAnsoff’s growth vector matrix (cited in Wilson and Gilligan, 2005), has been used as a framework to underpin the strategic ideas open to LFC to consider.
Strategic options
Criti-cal
issues
Corpo-rate
Object-ives
Marke-ting
Object-ives
Pros Cons
Market Penetration1 Invest in domestic fan
retention (UK) 2, 3 1, 3 2, 4Cheaper to retain consumers than to acquire (Brassington & Pettitt, 2006). Requires minimal effort and resources as loyalty is very high.
Potential wasted resource if activities are unnecessary due to exceptionally high fan loyalty.
2 Invest in international fan retention (Phase 1A and 1B)
2, 3 1, 3 2, 4Cheaper to retain consumers than to acquire (Brassington & Pettitt, 2006). Increased engagement and message relevance overseas could increase average customer spend.
Lack of expertise in these markets.
3 Develop a comprehensive CRM database
2, 3 1, 3 2, 3, 4Encourages fans to attend on match days and to buy merchandise so that they can collect rewards and use discounts/offers. Enables LFC to capture rich data on fans to aid the understanding of their fans behaviour and use this to enhance the fan experience.
Could reduce profit margin potential.
4 Expand commercial revenue opportunities 2 1, 3 2
Increases opportunities to generate commercial revenue and spreads financial risk across this revenue stream.
Risk of over-commercialising the club. Commercial revenue already equates to 47% of total revenue (Figure 12)
Market Development5 Invest in international
fan acquirement (Phase 2, 3, 4A, 4B)
2, 3 1, 3 2, 4Targets and exploits missed audiences (See 2.6) Brand presence in these countries will enable LFC to gain market share.
Costs associated with customer acquisition are high (Brassington & Pettitt, 2006). Lack of control: loyalty usually derives from a family member or success of the club (O'Donnell, 2014:online). Lack of expertise in these markets.
6 Invest in domestic fan acquirement (UK) 2 1, 3 2
If successful in acquiring fans they could become fans of the club for life.
The UK market is saturated (see market analysis). Lack of control: loyalty usually derives from a family member or success of the club (O'Donnell, 2014:online).
7 Exploit independent broadcasting revenue opportunities
2 1, 3 1, 2, 4Offers additional broadcasting revenue not intrinsically linked to first team position in major leagues and cups.
Potential lack of demand and barriers to entry.
8 Develop global retail and licensing businesses (Phases 1A, 1B, 2)
2, 3 1, 3 1, 2, 3Increases brand presence and engagement with UK and overseas fans. Opportunities to generate revenue from untapped markets where there is a strong LFC following.
Little experience managing retail outlets overseas. Risk of failure if there is a lack of demand.
9 Attract more international visitors for match days
2, 3 1, 3 3, 4Increases match day and commercial revenues; data from VisitBritain shows that the 750,000 international visitors who came to the UK in 2010 to attend a Premier League match spent approximately £600m during their stay (MMU, 2014).
Could require large investment to encourage international fans to attend matches e.g. ‘Red hotel’.
10 Expand portfolio of regional sponsorships and partnerships (Phases 1A, 1B, 2)
2, 3 1, 3 1, 2, 4Creates relevancy and increases brand awareness and engagement in emerging markets. Increases commercial revenue stream.
Risk of over-commercialising the brand.
11 Commercialise youth and women's teams 2, 3 1, 3 2, 3, 4
Increases engagement with LFC as a brand and could result in the acquisition of new fans.
Lack of demand.
Product Development
25
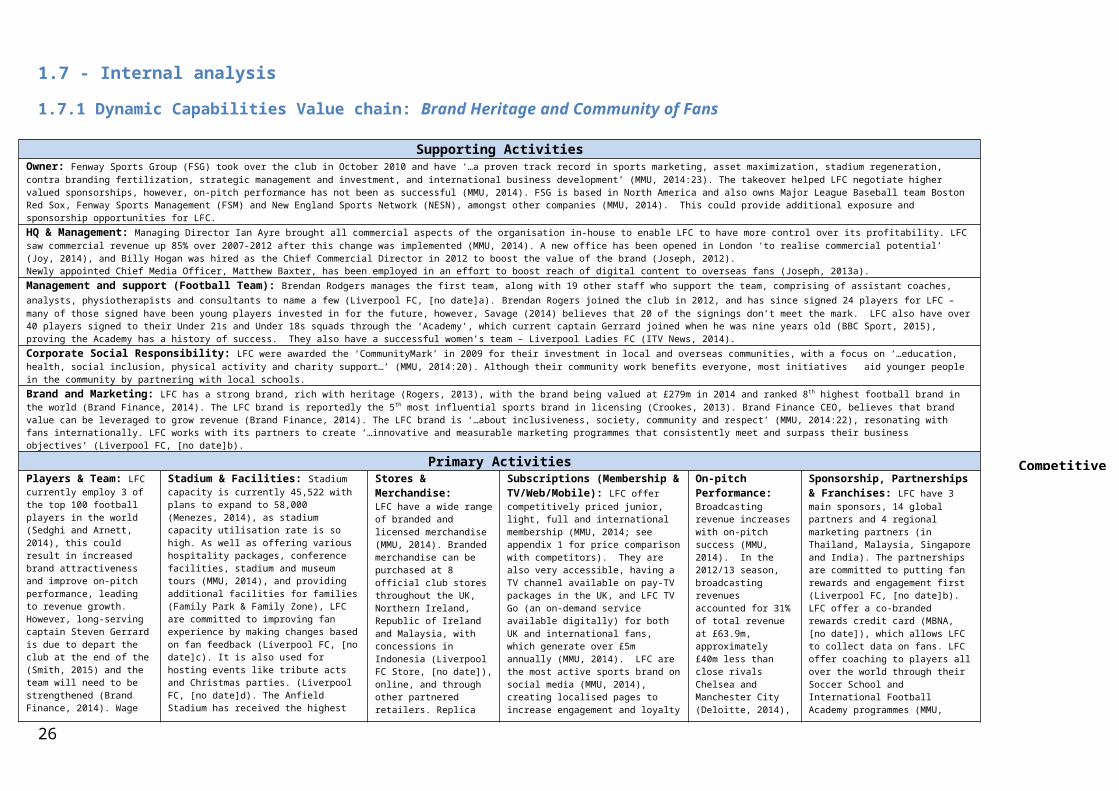
12 Enhance the match day experience and encourage time spent at stadium
2, 4 1, 3 3Increases fan engagement and could encourage fans to spend more on match days, with limited branded produce and entertainment on offer. Enables LFC to remain competitive and increases attractiveness to new fans, rivaling fan zones like City Square.
Risk of alienating traditional fans. Space available for fan zones at LFC is limited. Increases overhead costs of running stadium.
13 Continuous development of online digital strategy
2, 3, 4 1, 3 1, 2, 3, 4Increases attractiveness of brand and enables LFC to remain competitive. Increases interaction and engagement opportunities for fans.
Time consuming; content needs to be created for a number of local markets.
14 Invest in, develop and restructure first team 1, 2, 4 1, 2, 3 1, 2, 3, 4
Club revenues are intrinsically linked to on-pitch performance (Figure 8) - investment and development of the first team could improve on-pitch success and therefore increase all revenue streams.
Requires substantial investment. Success on-pitch not guaranteed.
15 Consolidate and enhance the LFC brand image
2, 3 1, 3 1, 2, 4Unifies communications with 'one voice'. Improves professional appearance and brand attractiveness.
Existing fans may dislike changes made to brand.
16 Expand match day revenue opportunities 2, 3 1, 2, 3 3
Ideal time to develop opportunities due to planned stadium expansion. Incorporated changes, such as making the stadium ‘digital’, could encourage spending and increase average revenue per ticket sold. Additional opportunities have a strong fit with social trend of the ‘family day out’ (Section 1.1). Can charge rent on concession stands and cut down on paid match day staff to reduce operational match day costs.
Potentially high capital investments with risk of alienation to or rejection from existing fans.
17 Invest in self-sustainable energy resources
2 2, 3 1, 4Reduces operational costs and enables LFC to become a sustainable brand. Expands CSR portfolio, potentially resulting in increased brand attractiveness.
Return on investment not present for a number of years.
18 Streamline in-house operations (restructure)
2 2, 3 0The '…current business structure and model are not sustainable' (MMU, 2014:23). This would reduce corporate staffing costs and increase efficiency of processes.
May lose capabilities (skills). May result in low staff morale.
Diversification19 Diversify business
revenue streams (e.g. acquire new business)
2 1, 3 0Income not reliant on on-pitch performance or attractiveness of LFC brand.
Large financial risk involved and may lack capabilities in-house.
Table 6: Ansoffs Matrix (1957) Adapted from Wilson & Gilligan (2006)
2.3 - Strategic evaluationAbell and Hammond’s 3 x 3 chart has been used to identify investment opportunities (Wilson and Gilligan, 2005).
Strategic options 2, 4, 5, 14 and 16 have been calculated as the best investments in terms of LFC’s competitive business strengths and strategic choice attractiveness.
Although strategies 17 and 19 are not currently viable due to LFC’s financial position – it is recommended to explore these options in future when the club is in a stronger position financially. These strategies will ensure future sustainability and profitability for the company without reliance on the clubs on-pitch performance.
The chosen strategies will also incorporate strategies 3, 8, 10 and 12, as these will help achieve the strategies 2, 4, 5, 14 and 16.
2.4 - Justification of chosen strategies
Strategic Choice 1 (ST1): Option 2; Invest in international fan retention (Segment 1A and 1B)
26
Figure 18: Abell & Hammond’s (1979) 3x3 Investment opportunity matrix. Adapted from Wildon & Gilligan (2005)
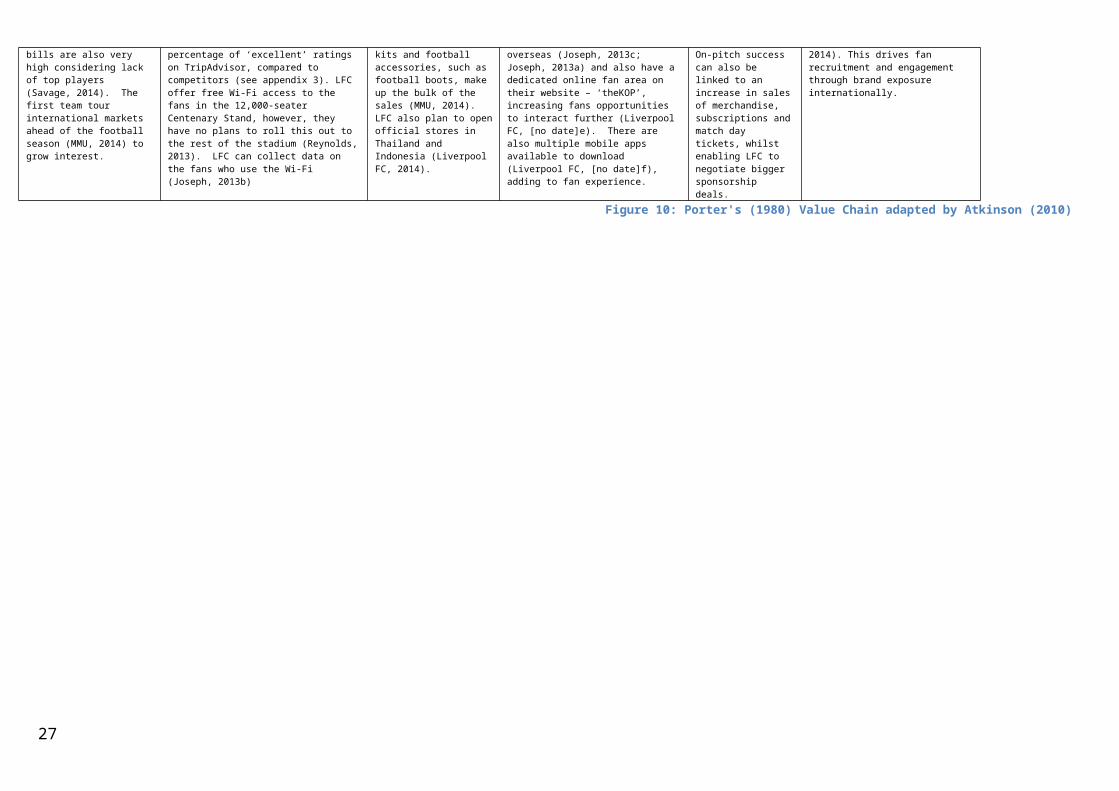
LFC have a strong online fan following in Indonesia, Malaysia, Thailand, Egypt (Segment 1A), China (Segment 1B)(Section 1.6.2) that can be capitalised on, yet there is a lack of activity and presence in segment 1B - where demand is high.
It is recommended that LFC increase engagement and interaction opportunities in these countries by growing physical store presence, supporting international fan zones and continuation of overseas pre-season tours, introduction of loyalty rewards and localised partnerships.
LFC may not currently have the capabilities in-house to exploit these markets to their full potential and should look to recruit people or out-source local agencies with experience dealing in these markets in order to meet fans wants and needs.
Strategic Choice 2 (ST2): Option 4; Expand commercial revenue income opportunities
LFC are in a poor position financially (Section 1.8) yet there are a significant number of opportunities available to them to expand their commercial revenue stream, both in emerging and existing markets, where fans exist in their millions (1.6). LFC can implement activities to increase brand loyalty and preferability by building a stronger presence internationally, for example through regional sponsorships. However, there is a risk of over-commercialising the brand. Strategic Choice 3 (ST5): Invest in international fan acquirement (Phase 2, 3, 4A, 4B)
There are opportunities to attract potential fans in emerging markets that have an increasing interest in the Premier League, specifically, the USA, Australia and South Africa, where LFC fan bases are growing (Section 1.3).
There are also opportunities to acquire fans in countries that have shown high interest in football generally. The four key market segments identified as the best targets for LFC are segments 2, 3, 4A and 4B (Section 2.6) with a primary focus year one on USA and Australia.
It will be beneficial for LFC to build further brand awareness in these markets to meet this demand. However, as these markets are still in their infancy, high acquisition rates cannot be guaranteed.
Strategic Choice 4 (ST4): Option 14; Invest in, develop and restructure first team
Figure 7 shows the correlation between on-pitch success and club revenues. As the two are intrinsically linked, LFC should place a strong focus on improving the first team through player investment, team restructure and youth development.
LFC’s long-serving history of success means the club has the capabilities to support the strategy, however, due to their poor financial status, there must be extreme care and consideration in terms of player investment - taking into account wages as a percentage of revenue to ensure FFP guidelines are met.
It is recommended to also consider investing in players who are successful both on-pitch and off, in order to strengthen commercial marketing messages through leveraging popular players’ personalities.
This strategy will also raise the likelihood of securing places in the European competitions, increasing brand awareness and generating more broadcasting revenue.
Strategic Choice 5 (ST5): Option 16; Expand match day revenue income opportunities
Match day revenues currently account for the lowest proportion of LFC’s income (Section 1.5). As the stadium expansion is now underway, it is the perfect time to instigate changes to the stadium that will increase average revenue per ticket sold.
Close competitors Manchester City increased their match day revenues by nearly 60% from 2010 (Section 1.5). Contributing to this was the introduction of ‘City Square’ where fans are encouraged to attend pre and post-match entertainment, as well as a bar and café (Manchester City, [no date]).
27
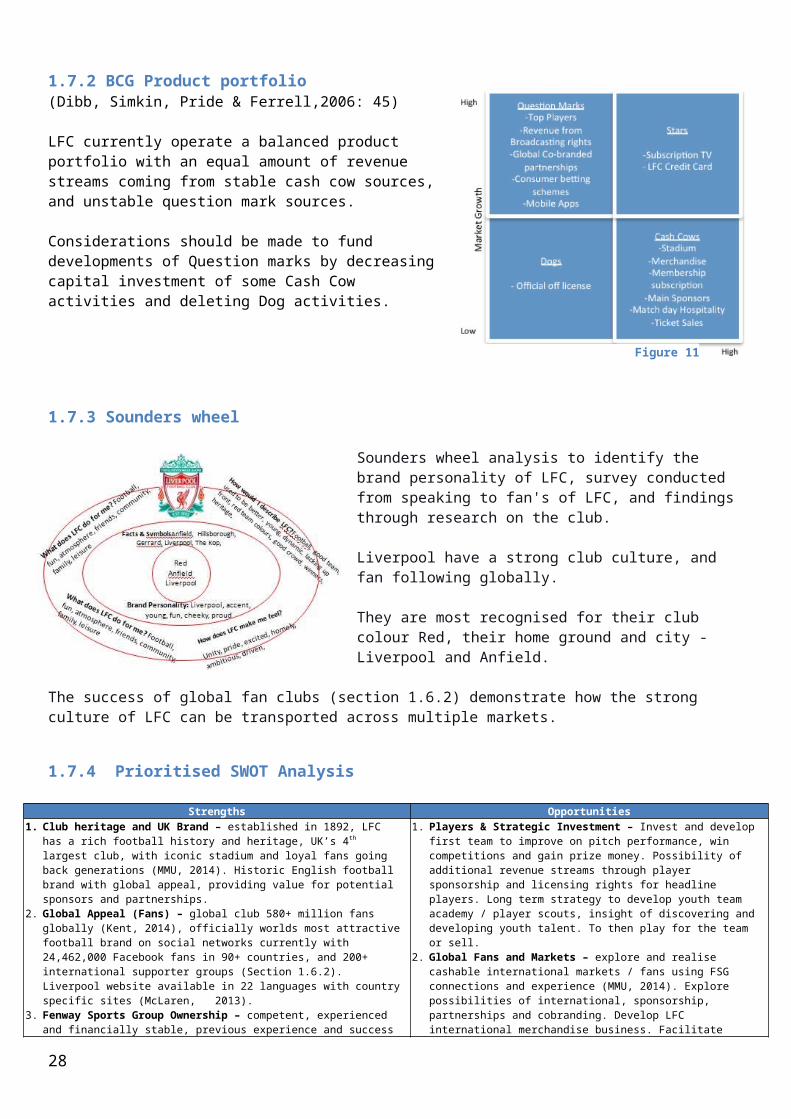
Although LFC may not have the land to replicate this, they can make changes within the stadium to increase match day experience, such as trendy street food vendors (which reduces paid staff costs and enables LFC to charge rent for the hiring of concession stalls), introduction of new technology to the stadium and entertainment, encouraging fan attendance and engagement. There is a risk of alienating traditional fans with this strategy.
Porters 5 Forces
From the industry analysis (Section 1.2.2) the strongest threats identified to LFC were the: ‘Determinants of supplier power (Players)’, ‘Threat of substitutes’ and: ‘Rivalry amongst fans’.
The strategic marketing 5 year plan proposed aims to reduce the threat of these three dominant forces as figure 20 demonstrates.
2.5 Evaluation and selection of Market segments
Domestic Market:From the consumer analysis, three primary market segments have been identified:
Segment Justification
Dom
estic
1) Dad’s & Son’s:- Low evaluation of alternatives- High commitment to the club/football- Favour winning > entertainment- High priority on service/physical environment
over building relationships- Income not an issue. Avg. weekly disposable
income £700- Value variety & choice- Lifetime fans- 26% attend other teams matches
- The profile of this segment suggests they have the potential to have the greatest weekly disposable income and ‘income not an issue’ hints that they could be high spenders on merchandise and other match day items e.g. programmes and food. Additionally, this segment is purchasing for a minimum of two people, therefore likely to spend more than individuals.
- Behaviours such as ‘low evaluation of alternative activities’, ‘high commitment to the club’ and ‘lifetime fans’ indicate these are easy to access fans, and will cost less to retain them and gain repeat purchases than to acquire new or more casual fans.
- Their quality of valuing: ‘variety and choice’ would suggest that this segment could be best targeted with regularly changing, in stadium activities, and extended lines of merchandise
(2) Juggling the kids:- High evaluation of alternatives- Likely to arrive at the ground late, but spend
high at half time on snacks etc.- Spend high on merchandise- Avg. weekly disposable income £625
- Despite their: ‘high evaluation of alternatives’ and likelihood to: ‘arrive late at the stadium,’ this segment is highly lucrative as the parent is facilitating purchases for potentially multiple children and they have a relatively high avg. weekly household disposable income.
- This segment could be best targeted with a loyalty scheme points based rewards system, targeted at both parents and children to encourage collection of points and lifetime value. Extended merchandise lines could also be attractive to this audience.
(3) Mine’s a pint:- Enjoy a drink or two either side of the game- Arrive early to ‘park’- Often meet acquaintances at the bar, or read
the programme- Average weekly disposable income £ 625
- The profile suggests this segment is highly sociable; therefore enhancements to match day food and drink services may be of interest.
- They may also show a strong interest in social media. Engagement activities, from both LFC and sponsors could maintain a voice outside of match days.
- Average earners, this group could be a lucrative primary segment to target with betting activities
Table 7
Global Market:In the consumer analysis, 7 segments were identified and profiled. Here is how each segment will be targeted, by switching ‘Segment’ for ‘Phase’ from Figure 15
Website, apps and ecommerce updates, with 6 monthly reviews, will act as the vehicle for global communications. Support will come from LFC’s 200 official fan groups and brand ambassadors who have a strong online and physical presence in each market.
28
Figure 19: Framework adapted from (Wilson & Gillign, 2005: P.348)
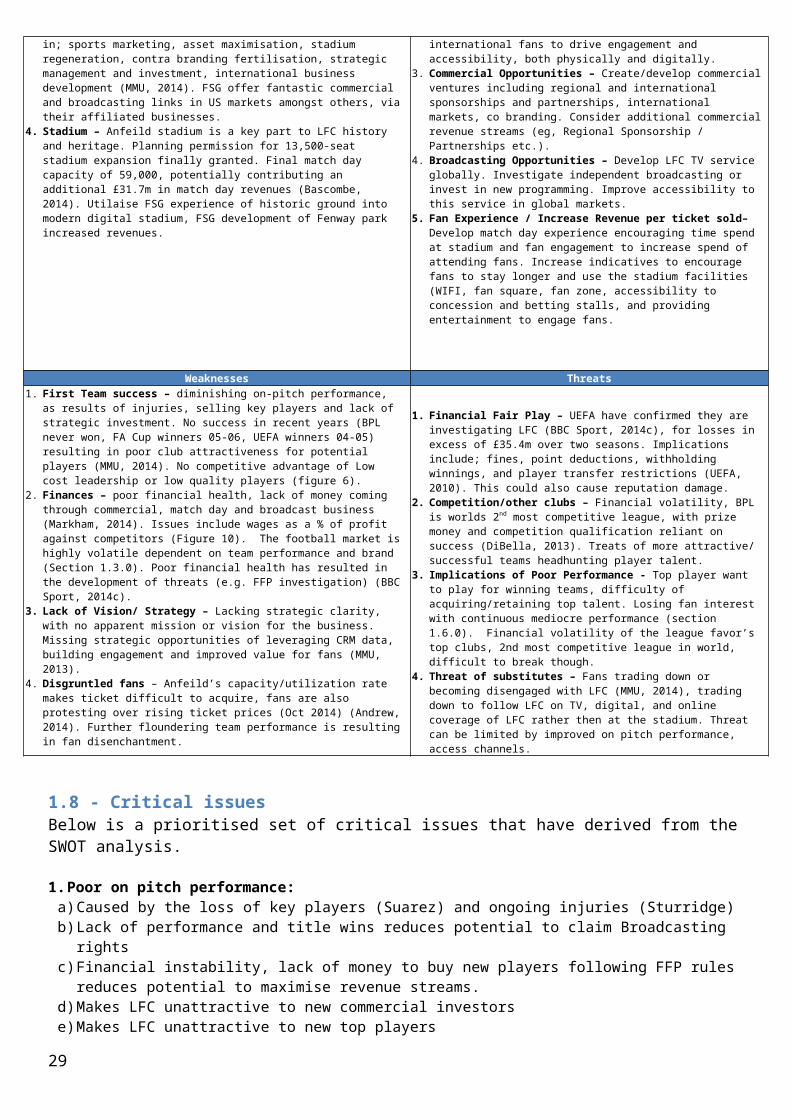
Phase 1 A: Indonesia, Malaysia, Thailand, UAE and Egypt. This segment has a high rate of growth and current levels of LFC strategic activity including brand partnerships (Honda) and Football academies (Egypt & UAE). For the next 5 years, the primary strategic activities will be focused on retention.
Phase 1 B: Hong Kong and China are mature markets with a medium level of current LFC activity. For the next 5 years, retention strategies will be the primary strategic activity with a focus on opening a store in China and encouraging travel to Liverpool.
Phase 2: Singapore, South Africa, India, USA, Norway, Australia. This segment is in the growth stage of interest to BPL, they have a medium level of LFC activity. Acquisition strategies will be applied to this segment in order to benefit from building on existing activity. Targeting will aggressively focus on two markets per year over the next 3 years with the aim of pushing each market in to the phase 1 stage. Year 1 will focus on USA and Australia due to their fast growth and current high spend online. (Section 1.6. A strategic review will highlight the next markets to target in Jan 2016.
Phase 3: South Korea, Japan, Netherlands, Russia, Poland, Argentina, Canada, France, Argentina, Sweden, Mexico. This segment is in the growth stage but have a low level of LFC activity. It will be more expensive to apply acquisition strategies to this group, however collectively they constitute approximately 9% of LFC official Facebook fans. Building engagement online, with a focus on targeting Japan for travel will be applied in the coming 5 years.
Phase 4A: Nigeria, due to the high interest in BPL and low level of current LFC activity; this market will be retained by current, successful, online social media activity and ecommerce sales. Due to low economy and political instability, it will not be targeted directly with any physical commerce attempts, however CSR activities, including player visits to Global Premier League Communities in Nigeria (Premier League, 2013a) to build on the ‘Unity’ and ‘Community’ nature of LFC (Section 1.7)and adhere to maintain positive communications with BPL in light of FFP breach investigations.
Phase 4B: Turkey and Germany, this segment has medium current LFC activity and low interest in BPL. Interests in their own domestic football leagues mean efforts to convert fans in these markets could be expensive to implement. They currently make up 4% of official LFC Facebook fans, low costing acquisition and retention tactics will be applied to these markets to maintain support over the next 5 years.
Phase 5: Italy, Spain and Brazil. Both low in activity and interest to BPL, this segment will be targeted over the next 5 years with existing online engagement methods including promotion of the 7 national players. Interest in own domestic leagues indicates a low ROI due to high conversion costs.
29
3.0 Tactics, Action and Control
3.1 Tactics
31
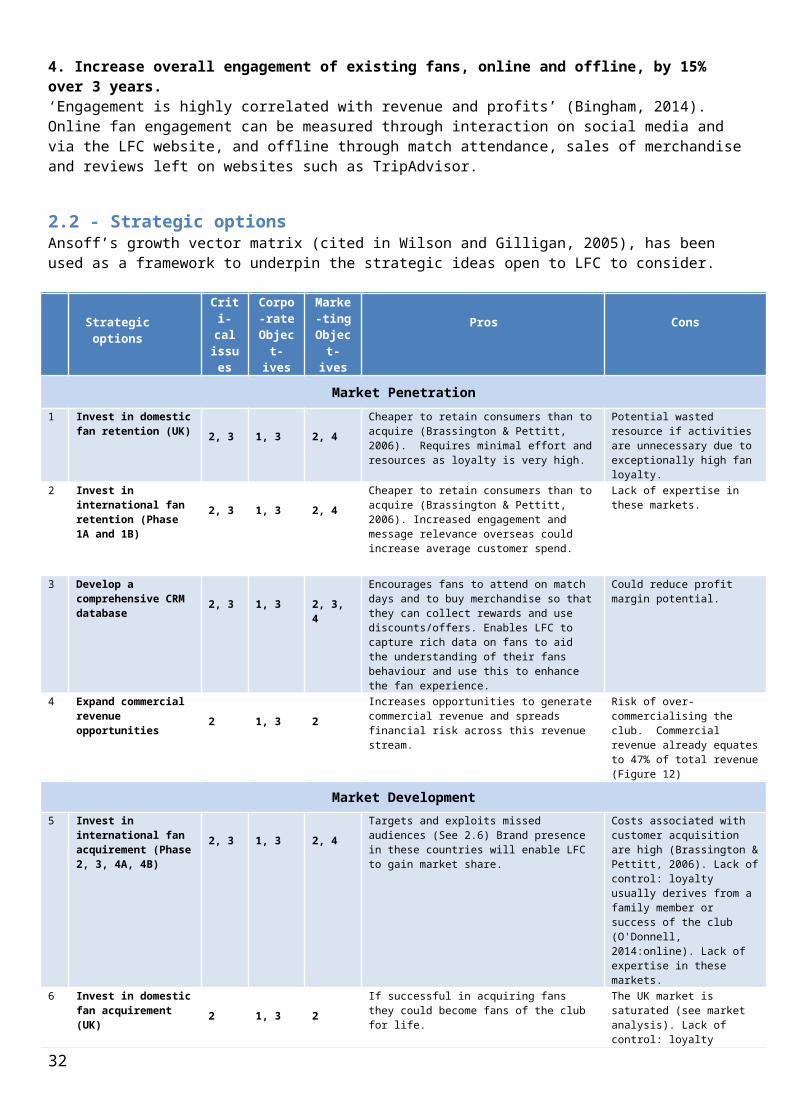
32
Tactic Product Place Price Promotion Physical Evidence
People Processes Partnerships
TC 1: Open international stores and increase number of concessions overseas.
Development of international retail business, full line retail stores and selected line concessions selling official LFC merchandise globally.
July 2016 – Cairo, Egypt – storeJuly 2017 – Beijing - China
Develop Concessions in Scandinavian nations, India, USA and Australia.
Vary price accordingly to country GDP. Price to remain premium compared to licensed goods.
Coincide store openings with pre-season tours/exhibition matches, including team visit and signings. Promotional incentives and local marketing campaign ahead of opening. Discounts for LFC members.
Ensure synergy and standardisation to UK operations. All stores to follow international look and feel. Unique installations in-store to encourage visits.
Locally sourced staff with interest in football, ideally LFC fans. All trained in accordance with local and LFC practices.
Building refurbishment to start 6 months before opening.Store set-up started 1 month prior to opening.
Explore concession partnership opportunities in retail sports outlets in identified markets, leveraging FSGs connections.
TC2: Create international fan zones for major matches.
Large international fan zones for LFC fans set-up in squares and parks.
Creation in territories identified in (ST3) and development in (ST1) cities.
Free to join, with added benefits using LFC membership.
LFC membership discounts offered to new supporter group fans.
LFC branded giveaways supplied.
Run by international fan ‘brand ambassadors’, with support from LFC HQ.
Members find clubs through LFC website, fan sites or local press.
Possibilities of partnership with bars, pubs, parks etc. to facilitate meetings.
TC3: Improve digital presence and content.
Website redesign, digital fanzine and continued development of global and localised online presence, building fan engagement and interaction online, and building brand value.
Use global website and local social network site (SNS) preferences already identified (e.g. Weibo in China) to distribute content.
Free to follow.
Engagement and interaction encouraged amongst fans through competitions and giveaways.
Professional appearance; content and website developed in line with LFC brand guidelines - ‘one voice’.
Monitored and managed by UK HQ social media team.
Reply to fan comments / complaints in a timely fashion.
Look to create interesting content in partnership with LFC sponsors.
TC4: Launch LFC TV globally
LFC TV (pay TV channel)
Make available in identified regions (ST3) & (ST1).
Small monthly subscription charge applies using price penetration strategy.
Advertisements on local SNS and TV channels.
Standardised UK TV programme
UK HQ broadcasting team to manage negotiations
Fans subscribe to channel through local pay TV services
Explore partnership with NESN group for coverage in USA.
TC5: Develop portfolio of mobile apps and games
Create mobile apps (i.e. team sheets, match stats etc.) and games to engage fans.
Apps and games available on Apple, Google and Blackberry stores.
Free, with paid upgrade options to encourage trial.
Promoted online, through direct marketing and at stadium.
Use up-to-date technology and develop alongside brand guidelines.
UK HQ digital team to work with full-service digital agency to develop products.
Download directly from stores or website onto digital device.
Possibilities of linked apps with other key domestic and international partners.
TC6: Implement CRM system linked with LFC membership card.
Implement global CRM system using current membership accounts identifying buying behaviours and trends to target existing fans with direct marketing.
Membership card should be scanned in every interaction with the club, in store, at stadium or inputted online.
Retain LFC membership price model. Create new free membership band with only basic benefits.
Introductory offers, giveaways and promotions on creation of new account. Scanning contributes fan points to enter additional competitions and rewards.
All direct marketing to be designed with LFC brand guidelines in mind.
Creation of new centralised team to analyse and fulfil CRM analysis and lead development.
Automate CRM system to target promotions and offers to audiences.
Partner with sponsors to offer giveaways and promotional deals.
TC7: Invest in international player talent, developing international interest.
Invest in top international player talent, developing on-pitch performance and international reach.
Focus on player over place, however players from identified emerging markets (ST1) should be considered
Purchase players in line with wages bill budgets.
Use international signings in marketing material, promoted to relevant local and global markets.
N/A Use current scouts and management to identify and source only the best talent globally.
Investment in players during January and summer transfer windows.
Possibilities of loaning / swapping players can be mutually beneficial to clubs.
TC8: Pre season tours and exhibition
Ensure emerging markets are visited
Territories identified in (ST3) and developmen
Vary ticket prices accordingly to country
Localised traditional / digital campaign to
N/A – away stadiums.
Utilise local expertise, use clubs and FSG
Tours and matches team to plan.
Opportunities in Fenway park (Boston
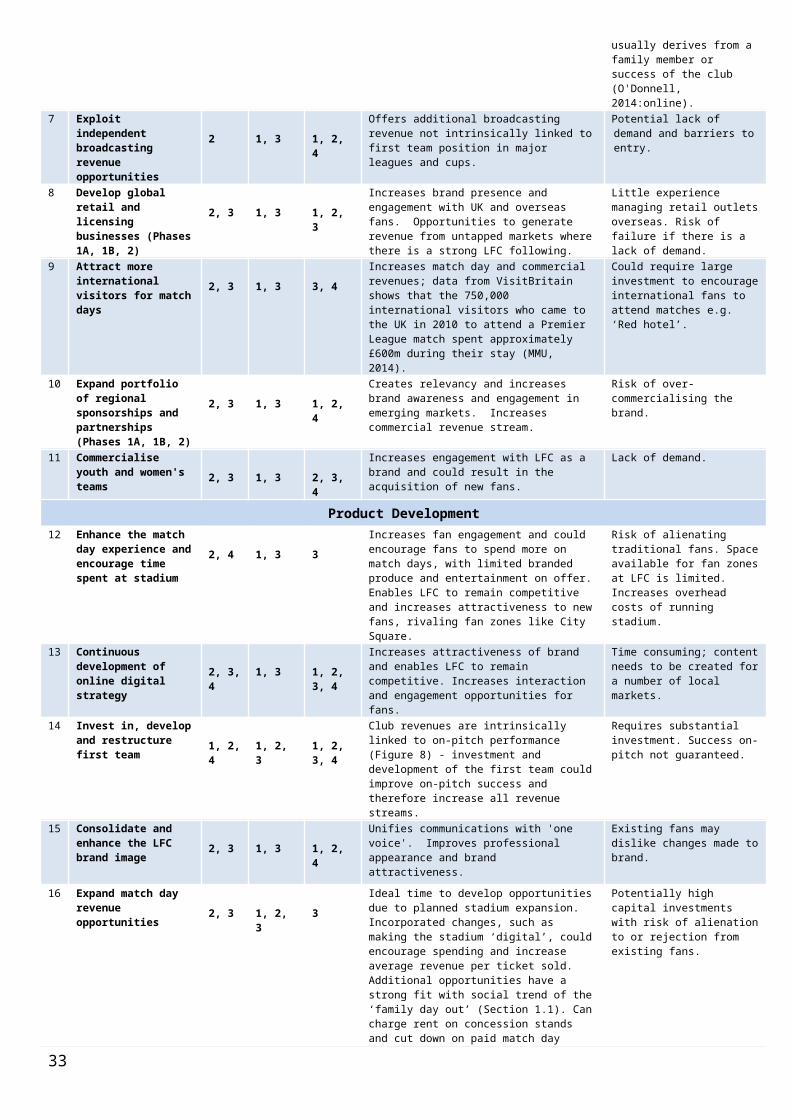
3.2 Tactic Selection
33
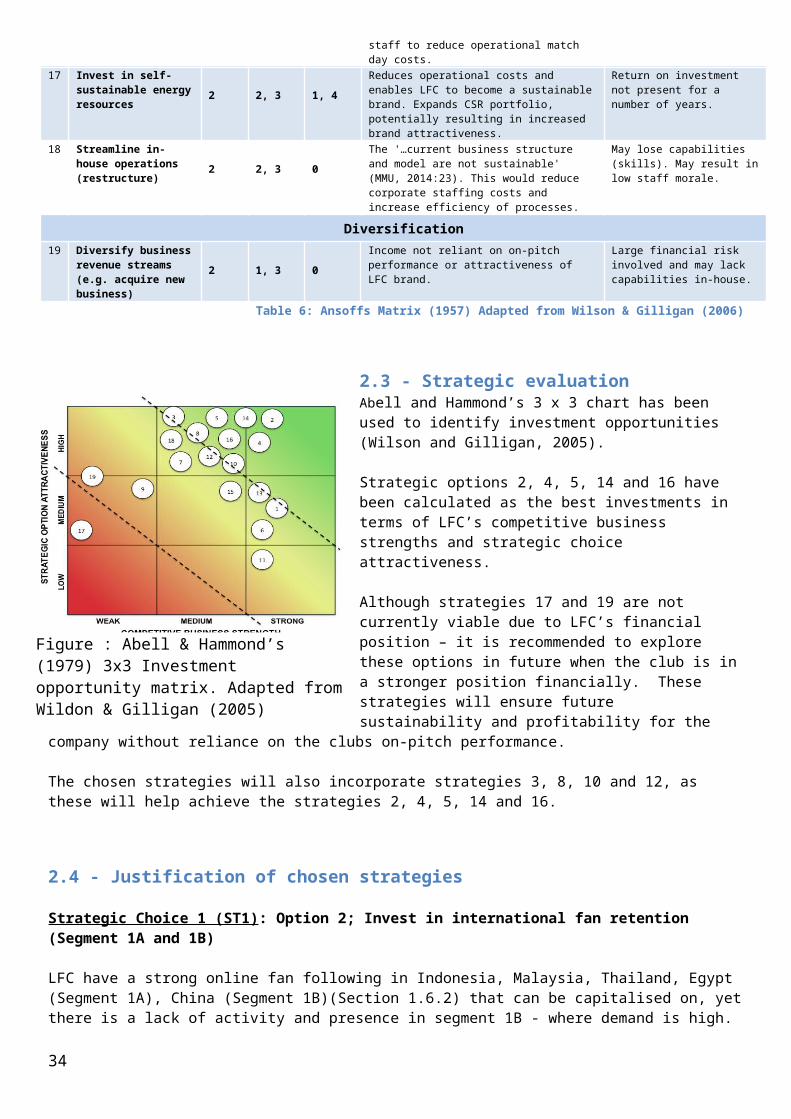
3.2 Action – Gantt Chart
34
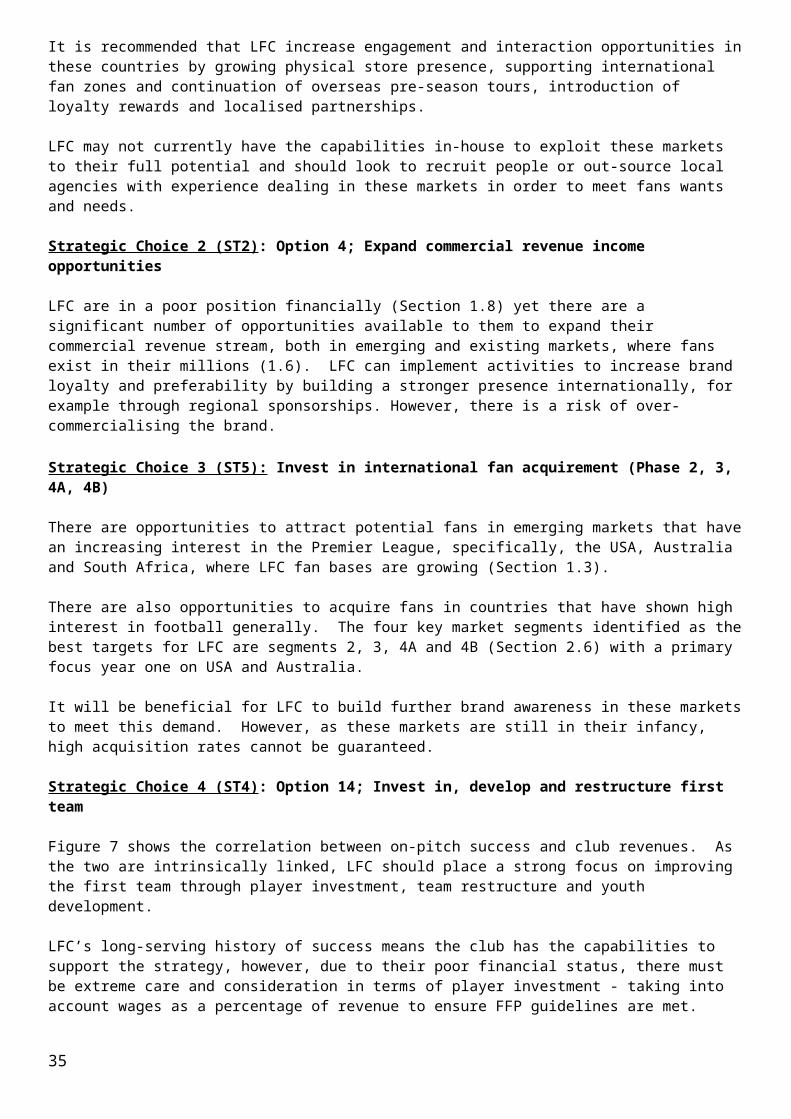
3.3 Control Statements
4.0 References 35
Objectives Control statements
Corporate Objectives:
1. To increase overall revenue by 5% year on year
Monitor revenue intake quarterly – quarterly target increase= +1.25%.
2. To reduce operational costs by 5% by financial year end 2018.
Monitor operational costs quarterly – quarterly target reduction = -1.25%
3. To become a sustainable and profitable business by 2020.
Monitor net profit margin quarterly.
Marketing Objectives:
1. Develop brand awareness by 30% amongst football fans, in 2 emerging markets per year, over 3 years.
Conduct football fan surveys in targeted emerging markets half-yearly, after brand awareness activities initiated.
2. Increase overall sales of merchandise, LFCTV and new media by 7% annually.
Monitor global sales of merchandise, LFCTV and new media quarterly – quarterly target increase = +1.75%
3. Increase annual average revenue per ticket sold by 11% within 3 years.
Measure increase of average revenue per ticket sold annually - annual target increase = £36 (+3.66%)
4. Increase overall engagement of existing fans, online and offline, by 15% over 3 years.
Online: monitor social media post popularity (likes/shares) every 2 weeks and adjust content as required.
Offline: conduct annual LFC fan survey.
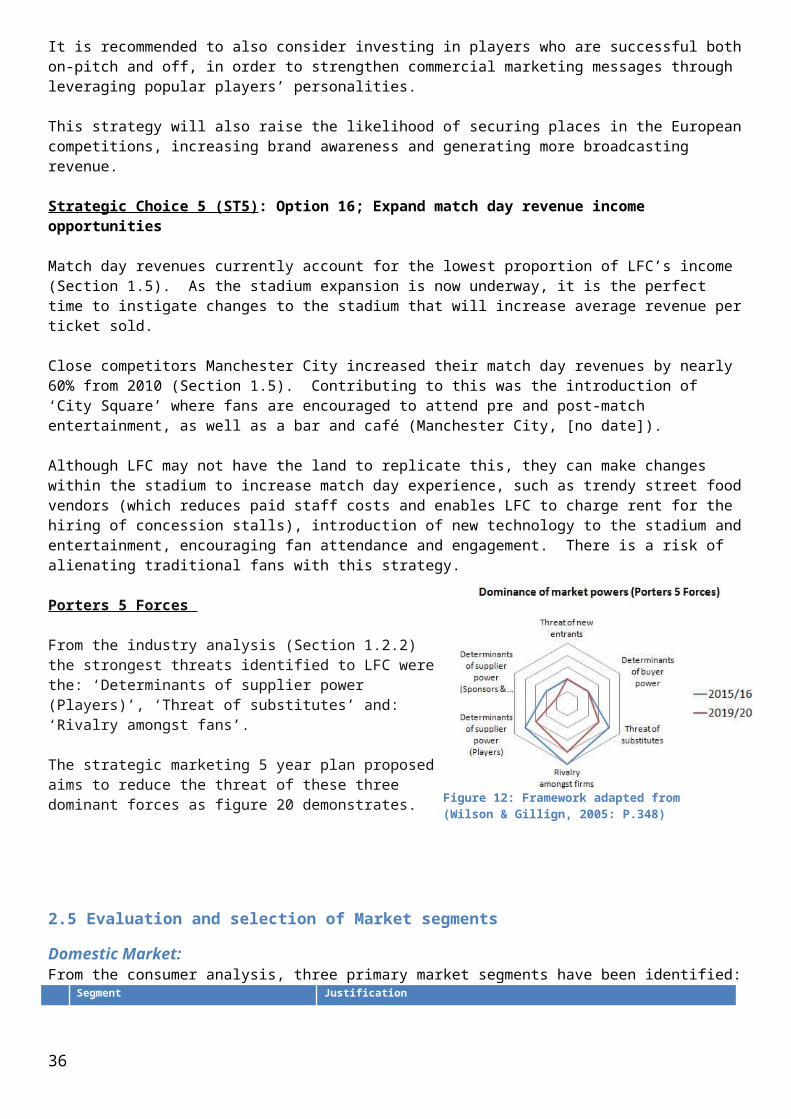
Abell, D. F. and Hammond J.S. (1979) Strategic Marketing Planning: Problems and Analytical approaches. Englewood Cliffs, NJ: Prentice-Hall. Cited by: Wilson, R.M.S and Gilligan, C. (2005) Strategic Marketing Management: Planning, Implementation & Control. 3rd Ed., Oxford: Butterworth-Heinemann
Adamson. G., Jones. W. & Tapp. A (2005) ‘From CRM to FRM: Applying CRM in the football industry.’ Journal of Database Marketing & Customer Strategy Management. Vol. 13, no. 2, pp.156-172
Allianz Arena (no date) General information about the Allianz Arena [Online] [Accessed on 6th January 2015] https://www.allianz-arena.de/en/fakten/allgemeine-informationen/
Andrew, J. (2014). ‘Liverpool fans to continue protest over high ticket prices despite owner John Henry making contact’ The Daily Mail [Online] [Accessed 15 December 2014]http://www.dailymail.co.uk/sport/football/article-2859189/Liverpool-fans-continue-protest-high-ticket-prices-despite-owner-John-Henry-making-contact.html.
Arsenal ([no date]a) The real capacity of Emirates stadium [Online] [Accessed on 6th January 2015] http://www.arsenal.com/155/unhoused-import-pages/latest-stadium-news/the-real-capacity-of-emirates-stadium
Arsenal ([no date]b) Arsenal memberships 2014/15 [Online] [Accessed on 6th January 2015] https://www.eticketing.co.uk/arsenal/memberships.aspx?findmembership=1
Arsenal (2011) Info for members and TV Online subscribers [Online] [Accessed on 6th January 2015] http://www.arsenal.com/news/news-archive/info-for-members-and-tv-online-subscribers
Atkinson, D. (2010) Dynamic Capabilities Lecture. Manchester; Manchester Metropolitan University
Banyan. A (2010). Kick-off Frenzy: Asia and English Premier League. Available: http://www.economist.com/blogs/banyan/2010/08/asia_and_english_premier_league . [online] [Accessed 22nd January 2015].
Barca TV (no date) Barca TV [Online] [Accessed on 6th January 2015] http://barcatv.fcbarcelona.com/shows
Bascombe, C. (2014). ‘Liverpool FC news: Anfield stadium construction begins with £115m interest-free loan from FSG.’ The Telegraph [Online] [Accessed on 11th January 2015] http://www.telegraph.co.uk/sport/football/teams/liverpool/11273448/Liverpool-FC-news-Anfield-stadium-construction-begins-with-115m-interest-free-loan-from-FSG.html. [Online] [Accessed 11th Dec 2014].
BBC (2009) Premier League giants target India. [Online] [Accessed 18th January 2015] http://news.bbc.co.uk/1/hi/business/8083210.stm
BBC (2014a) UK retail sales rose by 0.8% in October as prices fell. [Accessed on 10th January 2015] http://www.bbc.co.uk/news/business-30125972
BBC (2015a) UK interest rates held at 0.5% by Bank of England [Online] [Accessed on 10th January 2015] http://www.bbc.co.uk/news/business-30726535
BBC (2012a). Premier League rights sold to BT and BSkyB for £3bn. Available: http://www.bbc.co.uk/news/business-18430036. [online] [Accessed 12th December 2014].
BBC (2014b). Price of Football: Tickers increases outstrips cost of living. Available: http://www.bbc.co.uk/sport/0/football/29614980. [online] [Accessed 28th November 2014].
BBC News (2014b) ‘Liverpool signs airline Garuda as training kit partner.’ BBC News. [Online] 27th January. [Accessed on 5th January 2015] http://www.bbc.co.uk/news/25909401
36
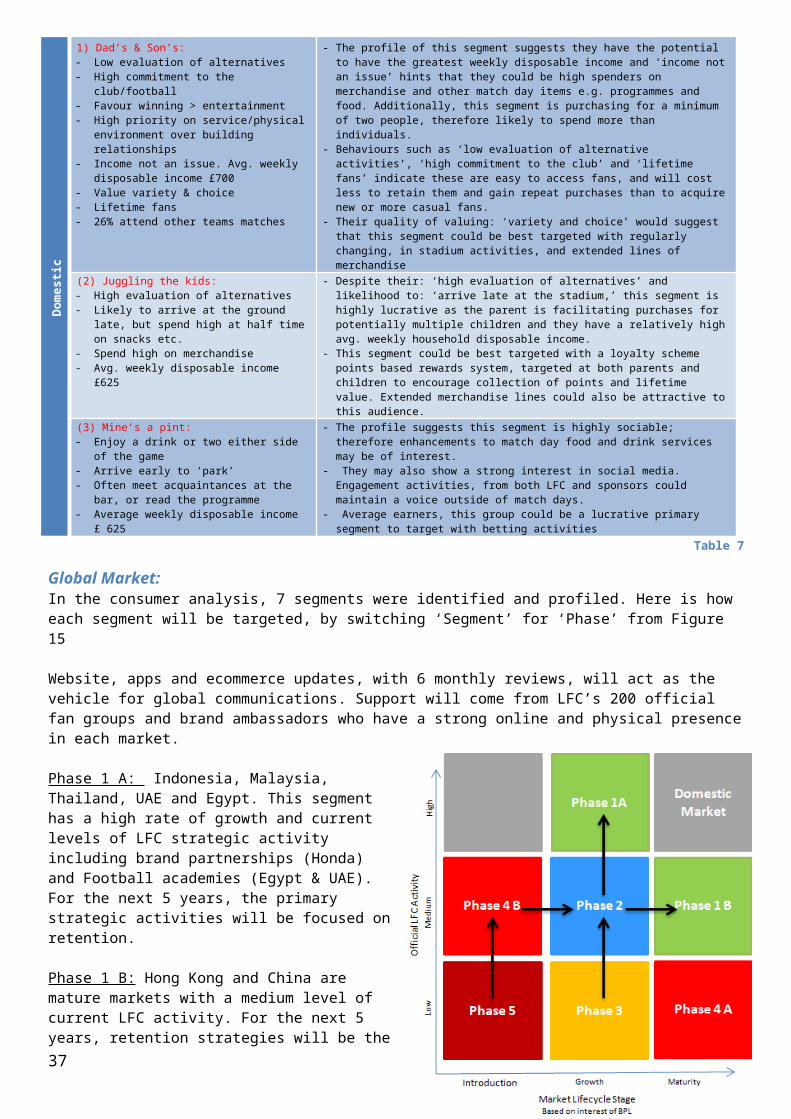
BBC Sport (2014b) Real Madrid reveal £330m design for new Bernabeu stadium. [Online] [Accessed on 6th January 2015] http://www.bbc.co.uk/sport/0/football/25978150
BBC Sport (2015) Steven Gerrard: Liverpool captain to leave at end of season. [Online] [Accessed on 20h January 2015] http://www.bbc.co.uk/sport/0/football/30653547
BBC Sport. (2014c). ‘Liverpool under UEFA Financial Fair Play investigation.’ BBC News [Online] [Accessed 15 December 2014] http://www.bbc.co.uk/sport/0/football/29356406.
BBC Sport. (2014a). Liverpool: Anfield protest against prices during Hull City game. [Online] [Accessed on 7th January 2015] http://www.bbc.co.uk/sport/0/football/29775393
Bingham, C. (2014) Customer Loyalty Is Dead. Long Live Engagement! Forbes [Online] [Accessed on 20h January 2015] http://www.forbes.com/sites/oracle/2014/03/28/customer-loyalty-is-dead-long-live-engagement/
Bland, B. (2013). Indonesia Football: English clubs pitch for fans as local league falls apart | Beyondbrics. Available: http://blogs.ft.com/beyond-brics/2013/01/29/indonesia-bad-for-local-football-teams-lucrative-for-uk-ones/ [online] [Accessed 18th November 2014].
Brand Finance (2014) BrandFinance® Football 50 2014 [Online] [Accessed on 10th November 2014]http://www.brandfinance.com/knowledge_centre/reports/brandfinance-football-50-2014
Brassington, F. and Petitt, S. (2006), Principles of Marketing. 4th Ed., Harlow: Financial Times Prentice Hall.
Campbell, P. (2014). Manchester City top global pay table with average salaries of £5.3m a year. [Online] [Accessed 22nd Jan 2015] http://www.theguardian.com/football/blog/2014/apr/15/manchester-city-global-pay-table-chelsea-barcelona-real-madrid
Chelsea FC ([no date]a) On-site facilities. [Online] [Accessed 6th January 2015] http://events.chelseafc.com/on-site-facilities/
Chelsea FC ([no date]b) True Blue membership 2014/15 [Online] [Accessed on 6th January 2015] http://kr.chelseafc.com/membership
Chelsea FC ([no date]c) Videos [Online] [Accessed on 6th January 2015] http://www.chelseafc.com/videos/chelsea-tv-on-demand.html
Crookes, D (2014) Manchester United beat Liverpool to be names the most influential football club brand in the world [Online] [Accessed 14th January 2015] http://www.independent.co.uk/sport/football/news-and-comment/manchester-united-beat-liverpool-to-be-named-the-most-influential-football-club-brand-in-the-world-8932011.htmlCrookes, D. (2013) ‘Manchester United beat Liverpool to be named the most influential football club brand in the world.’ The Independent [Online] 11th November [Accessed 19th January 2015] http://www.independent.co.uk/sport/football/news-and-comment/manchester-united-beat-liverpool-to-be-named-the-most-influential-football-club-brand-in-the-world-8932011.html
Daily Mail. (2011). Manchester United tie up £40m shirt sponsor deal... for their training kit!. Available: http://www.dailymail.co.uk/sport/football/article-2028801/DHL-spend-10m-year-sponsor-Manchester-Uniteds-training-kit.html. [online] [Accessed 23rd December 2014].
Davies, P (2014) Spectator Sports – UK – April 2014 [Online] [Accessed December 20th 2014] http://store.mintel.com/spectator-sports-uk-april-2014
Davies, P. (2014). Digital Trends Winter - UK - December 2014 – Executive Summary. [Accessed on 1st January 2015] http://store.mintel.com/digital-trends-winter-uk-december-2014
37
Deloitte (2010) Spanish masters: Football Money League [Online] [Accessed 16th November 2014] https://www.deloitte.com/assets/Dcom-Ecuador/Local%20Assets/Documents/Estudios/100412-ec_DeloitteFML2010.pdf
Deloitte (2011) The untouchables: Football Money League [Online] [Accessed 16th November 2014] http://www.deloitte.com/assets/Dcom-Chile/Local%20Assets/Documents/Nuevos/cl(es)_FML2011_140211.pdf
Deloitte (2012) Fan power: Football Money League [Online] [Accessed 16th November 2014] http://www.deloitte.com/assets/Dcom-Sweden/Local%20Assets/Documents/FootballMoneyLeague%202012-uk-sbg-dfml-2012-final120209.pdf
Deloitte (2013) Captains of industry: Football Money League [Online] [Accessed 16th November 2014] http://www.deloitte.com/assets/Dcom-Azerbaijan/Local%20Assets/Documents/footballmoneyleague2013.pdf
Deloitte (2014a) All to play for: Football Money League [Online] [Accessed 16th November 2014] http://www2.deloitte.com/content/dam/Deloitte/uk/Documents/sports-business-group/deloitte-uk-deloitte-football-money-league-2014.pdf
Deloitte (2014b) Annual Review of Football Finance 2014 infographic [Online] [Accessed 16th December 2014] http://www.deloitte.co.uk/aem/arff-2014-infographic.cfm Deloitte. (2014). Annual Review of Football Finance 2014. [Online] [Accessed: 13th Jan 2015.] http://www2.deloitte.com/uk/en/pages/sports-business-group/articles/annual-review-of-football-finance.html
Dibb, S. Simkin, L. Pride, W. Ferrell, OC (2006) Marketing Concepts and strategies. 5th edition. Boston: Charles Hartford
DiBella M.F. (2013). Statistically Ranking the World's Top 20 Football Leagues. [Online] [Accessed 24th December 2014] http://bleacherreport.com/articles/1458287-ranking-the-top-20-world-football-leagues-statistically.
ESPN (no date) Football points table. [Online] [Accessed on 20th December 2014] http://www.espn.co.uk/football/sport/tournament/points.html?event=28;season=2011%2F12
ESPN FC ([no date]a) Real Madrid statistics. [Online] [Accessed on 20th December 2014] http://www.espnfc.com/club/real-madrid/86/statistics/performance
ESPN FC ([no date]b) Barcelona statistics. [Online] [Accessed on 20th December 2014] http://www.espnfc.com/club/barcelona/83/statistics/performance
ESPN FC ([no date]c) Bayern Munich statistics. [Online] [Accessed on 20th December 2014] http://www.espnfc.com/club/bayern-munich/132/statistics/performance
ESPN FC ([no date]d) Manchester United statistics. [Online] [Accessed on 20th December 2014] http://www.espnfc.com/club/manchester-united/360/statistics/performance
ESPN FC ([no date]e) Manchester City statistics. [Online] [Accessed on 20th December 2014] http://www.espnfc.com/club/manchester-city/382/statistics/performance
ESPN FC ([no date]f) Chelsea statistics. [Online] [Accessed on 20th December 2014] http://www.espnfc.com/club/chelsea/363/statistics/performance
ESPN FC ([no date]g) Arsenal statistics. [Online] [Accessed on 20th December 2014] http://www.espnfc.com/club/arsenal/359/statistics/performance
ESPN FC ([no date]h) Liverpool statistics. [Online] [Accessed on 20th December 2014] http://www.espnfc.com/club/liverpool/364/index
38

ESPN FC ([no date]i) Tottenham Hotspur statistics. [Online] [Accessed on 20th December 2014] http://www.espnfc.com/club/tottenham-hotspur/367/statistics/performance
FAME (2014a) 10 year financial data (2004 – 2013), Chelsea Football Club Limited (01965149). [Online] [Accessed on 7th November 2014] https://fame-bvdinfo-com.ezproxy.mmu.ac.uk/version-2015115/Report.serv?_CID=130&context=1G7M9GN4BXWOQV3
FAME (2014b) 10 year financial data (2004 – 2013), Manchester City Limited (02989498). [Online] [Accessed on 7th November 2014] https://fame-bvdinfo-com.ezproxy.mmu.ac.uk/version-2015115/Report.serv?_CID=437&context=1G7M9GN4BXWOQV3
FAME (2014c) 10 year financial data (2004 – 2013), The Liverpool Football Club And Athletic Grounds Limited (00035668). [Online] [Accessed on 7th November 2014] https://fame-bvdinfo-com.ezproxy.mmu.ac.uk/version-2015115/Report.serv?_CID=287&context=1G7M9GN4BXWOQV3
FAME (2014d) 10 year financial data (2004 – 2013), Tottenham Hotspur Limited (01706358). [Online] [Accessed on 7th November 2014] https://fame-bvdinfo-com.ezproxy.mmu.ac.uk/version-2015115/Report.serv?_CID=512&context=1G7M9GN4BXWOQV3
FC Barcelona ([no date]a) Camp Nou. [Online] [Accessed on 6th January 2015] http://www.fcbarcelona.com/club/facilites-and-services/camp_nou
FC Barcelona ([no date]b) 2015 membership card renewal [Online] [Accessed on 6th January 2015] http://www.fcbarcelona.com/members/detail/card/2015-membership-card-renewal
FC Barcelona ([no date]c) Memòria Anual del FC Barcelona [Online] [Accessed 20th December 2014] http://www.fcbarcelona.cat/club/premsa/detall/fitxa/memoria-anual-del-fc-barcelona?_ga=1.126307976.402642577.1419427072
FC Bayern (2013) Bayern post landmark €400m plus turnover [Online] [Accessed 20th December 2014] http://www.fcbayern.de/en/news/news/2013/agm-2013-new-record-figures-400-million.php
FC Bayern (no date) My FCB.TV subscription [Online] [Accessed on 6th January 2015] https://www.fcbayern.de/en/registration/?service=FCBTV&returnUrl=http%3A///en
FC Bayern Forum (no date) How do I become a member of the club? [Online] [Accessed on 6th January 2015] http://www.bayernforum.com/general-bayern-f13/how-do-i-become-a-member-of-the-club-t6987.html
Financial Fair Play (2014) Financial Fair Play Explained [Online] [Accessed: 24th January 2015] http://www.financialfairplay.co.uk/financial-fair-play-explained.php
Financial Times. (2014).Currencies. [Online] [Accessed on 6h December 2014] http://markets.ft.com/research/Markets/Currencies
Foy, T., (2015) Building a global social network: A Case study on LFC. Southampton FC: Melbourne
Gibson, O. (2012) ‘Premier League TV rights set to top £5bn for first time.’ The Guardian [Online] 12th November [Accessed 10th December 2014] http://www.theguardian.com/football/2012/nov/12/premier-league-tv-rights-5-bn
Gilligan. C. and Wilson, R. (2013) Strategic Marketing Management: Planning, implementation and control. 3rd Ed. New York: Routledge
Hall, R. (2014) ‘Juventus: Serie A alternative club guide’ The Guardian. [Online] 22nd July [Accessed 10th December 2014] http://www.theguardian.com/football/the-gentleman-ultra/2014/jul/22/juventus-serie-a-alternative-club-guide-fans-trezeguet
39

Heineken (2013) HEINEKEN renews UEFA Champions League sponsorship. [Online] [Accessed 16th December 2014] http://www.heineken.co.uk/article.php?article=1234567880
Herbert, I. (2014) ‘Manchester City fined £49m for breaching Uefa's financial fair play rules - and will see their Champions League squad reduced.’ The Independent. [Online] 16th May [Accessed on 5th January 2015] http://www.independent.co.uk/sport/football/premier-league/manchester-city-fined-49m-for-breaching-uefas-financial-fair-play-rules-9388532.html
Hill, C. W. L. (1988), ‘Differentiation Versus Low Cost or Differentiation and Low Cost: A Contingency Framework.’ Academy of Management Review, Vol. 13, no. 3, pp. 401-412.
Hunter, A. (2013) ‘La Liga seeks collective TV rights deal to close gap on Premier League.’ The Guardian [Online] 11th April [Accessed 20th December 2014] http://www.theguardian.com/football/2013/apr/11/la-liga-television-rights-premier-league
IMF -International Monetary Fund (2014). WORLD ECONOMIC OUTLOOK (WEO) UPDATE An Uneven Global Recovery Continues. [Online] [Accessed on 20h January 2015] http://www.imf.org/external/pubs/ft/weo/2014/update/02/
Inman, P (2014) Starting Salaries stagnant across the UK and wages may fall. [Online] [Accessed on 10th January 2015] http://www.theguardian.com/money/2014/aug/11/salaries-stagnent-cipd-survey-uk-inflation-wages
ITV News (2014) ‘Liverpool ladies hoping success will continue’. ITV News [Online] 16th October [Accessed on 10th January 2015] http://www.itv.com/news/granada/update/2014-10-16/liverpool-ladies-look-for-success-in-europe/
Joseph, S. (2012) Liverpool names chief commercial director. Marketing Week [Online] [Accessed on 15th January 2015] http://www.marketingweek.com/2012/05/25/liverpool-names-chief-commercial-director/
Joseph, S. (2013a) Liverpool FC names digital media chief. Marketing Week [Online] [Accessed on 15th January 2015] http://www.marketingweek.com/2013/02/05/liverpool-fc-names-digital-media-chief/
Joseph, S. (2013b) Football clubs offset match-day revenues dip with real-time marketing. Marketing Week [Online] [Accessed on 15th January 2015] http://www.marketingweek.com/2013/07/05/football-clubs-offset-match-day-revenues-dip-with-real-time-marketing/
Joseph, S. (2013c) Liverpool eyes fan boost through social content push. Marketing Week [Online] [Accessed on 5th January 2015] http://www.marketingweek.com/2013/01/25/liverpool-eyes-fan-boost-through-social-content-push/
Joseph, S. (2014) Man Utd leads rush from football clubs for regional sponsorships. Marketing Week [Online] [Accessed on 16th November 2014] http://www.marketingweek.com/2014/08/21/man-utd-leads-rush-from-football-clubs-for-regional-sponsorships/
Joy, S. (2014a) Appeal of Man U brand grows with sponsors despite on-pitch woes. Marketing Week [Online] [Accessed on 16th November 2014] http://www.marketingweek.com/2014/09/10/appeal-of-man-u-brand-grows-with-sponsors-despite-on-pitch-woes/
Joy, S. (2014b) Liverpool FC moves to London to ‘realise commercial potential’. Marketing Week [Online] [Accessed on 16th November 2014] http://www.marketingweek.com/2014/10/10/liverpool-fc-moves-to-london-to-realise-commercial-potential/
Kent, D. (2014). ‘Liverpool claim they have a worldwide fan base 580m people... just as well they are looking to increase Anfield's capacity.’ The Daily Mail. [Online] [Accessed on 11th January 2015] http://www.dailymail.co.uk/sport/football/article-2792400/liverpool-claim-worldwide-fan-base-580m-people-just-looking-increase-anfield-s-capacity.html. [Online] [Accessed 12th January 2015].
40
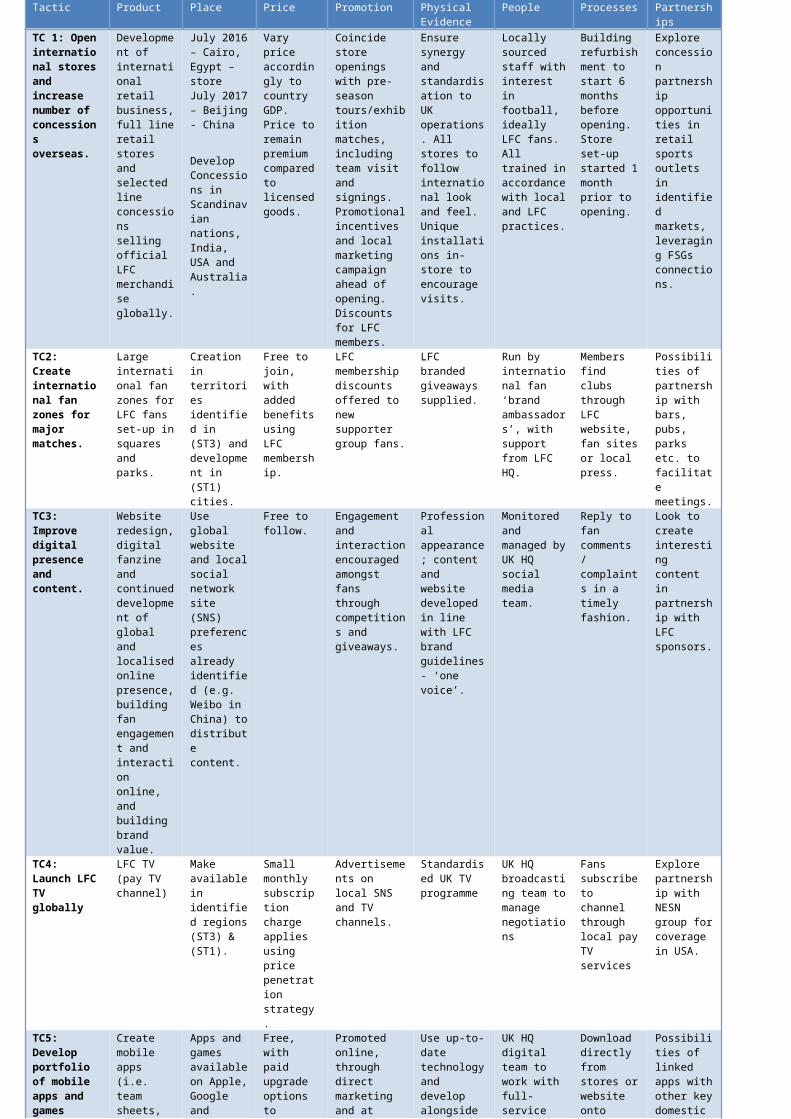
Kohli A.K., Jaworski B.J. (1990) “ Market Orientation: The Construct, Research Propositions, and Managerial Implications”, Journal or Marketing, 54 (April, 1990) pp.1-18.
Liverpool FC ([no date]a) Team. [Online] [Accessed on 15th January 2015] http://www.liverpoolfc.com/team
Liverpool FC ([no date]b) Corporate Charter. [Online] [Accessed on 15th January 2015] http://www.liverpoolfc.com/corporate/charter
Liverpool FC ([no date]c) Fan experience. [Online] [Accessed on 15th January 2015] http://www.liverpoolfc.com/fans/fan-experience
Liverpool FC ([no date]d) Events at Anfield. [Online] [Accessed on 15th January 2015] http://events.liverpoolfc.com/events-at-anfield
Liverpool FC ([no date]e) The Kop. [Online] [Accessed on 15th January 2015] http://www.liverpoolfc.com/fans/thekop/how-it-works
Liverpool FC ([no date]f) Apps and Games. [Online] [Accessed on 15th January 2015] http://www.liverpoolfc.com/fans/apps-and-games/uk
Liverpool FC ([no date]g) Benefits [Online] [Accessed on 6th January 2015] http://www.liverpoolfc.com/membership/benefits-prices
Liverpool FC ([no date]h) LFCTV Go [Online] [Accessed on 6th January 2015] http://www.liverpoolfc.com/video
Liverpool FC (2014) Reds open new store in Malaysia. [Online] [Accessed on 15th January 2015] http://www.liverpoolfc.com/news/latest-news/171572-reds-open-new-store-in-malaysia
Liverpool FC Store ([no date]) Store finder. [Online] [Accessed on 15th January 2015] http://store.liverpoolfc.com/stores/finder/
Manchester City ([no date]a) About City Square. [Online] [Accessed on 5th January 2015] http://www.mcfc.co.uk/Fans/City-Square/About-City-Square/About-City-Square
Manchester City ([no date]b) Be a Cityzen [Online] [Accessed on 6th January 2015] http://beacityzen.mcfc.co.uk
Manchester City ([no date]c) CityTV [Online] [Accessed on 6th January 2015] http://www.mcfc.co.uk/citytv
Manchester United ([no date]a) Company information [Online] [Accessed on 6th January 2015] http://ir.manutd.com/company-information/history.aspx
Manchester United ([no date]b) Official membership [Online] [Accessed n 6th January 2015] http://www.manutd.com/en/Official-Membership/New-Prices.aspx
Manchester United ([no date]c) MUTV HD [Online] [Accessed on 6th January 2015] http://www.manutd.com/en/MUTV-New/MUTV-FaqsNew.aspx
Manchester United (2014) Manchester United. [Online] [Accessed 10th December 2014] http://ir.manutd.com/~/media/Files/M/Manutd-IR/About%20Manchester%20United/manu_presentation.pdf
Markham, C. (2014). ‘Liverpool financial results: Reds post £50m loss, but insist club is moving in right direction.’ [Online] [Accessed 15 December 2014] http://www.independent.co.uk/sport/football/premier-league/liverpool-financial-results-reds-post-50m-loss-but-insist-club-is-moving-in-right-direction-9167721.html.
41
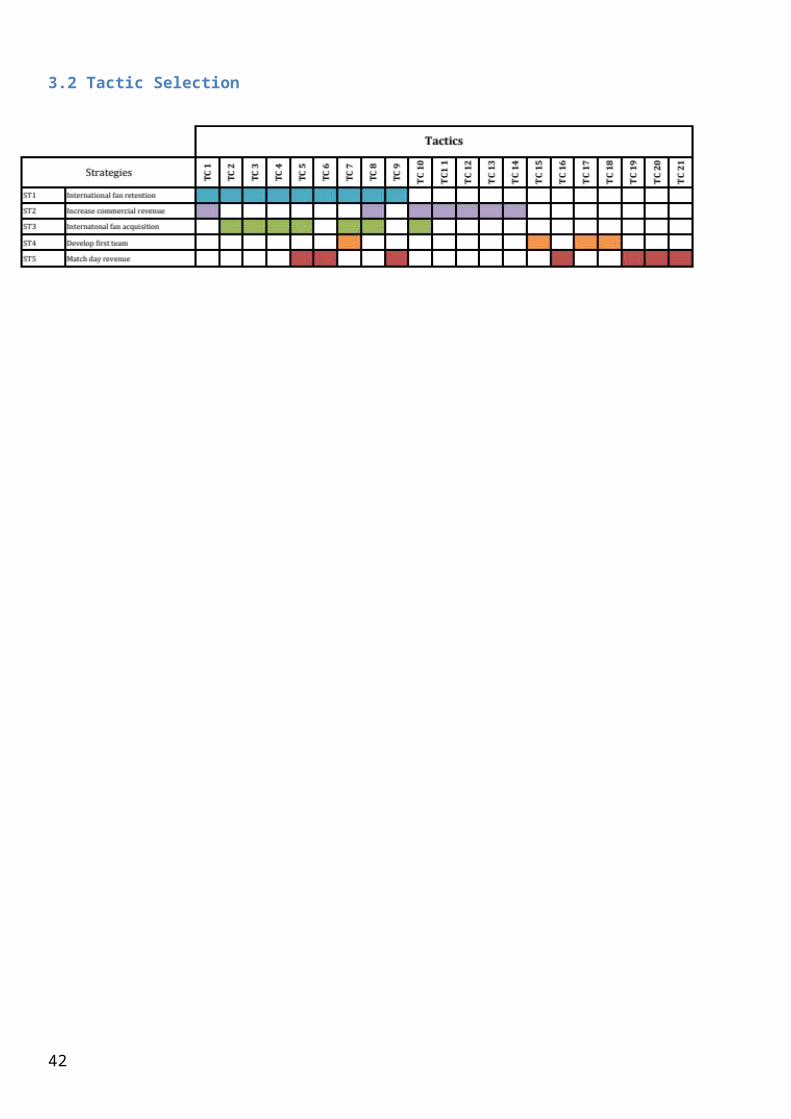
MBNA (no date) The official Liverpool FC rewards credit card. [Online] [Accessed on 5th January 2015] https://apply.mbna.co.uk/UKNeoCCapp/entry?sc=1OASLFCIGC0041L&mc=OAGLFC005DP
McLaren D., (2013). ‘Liverpool FC’s Winning online presence’ The UK Sports Network [Online] [Accessed 15th December 2014] http://www.theuksportsnetwork.com/liverpool-fcs-winning-online-presence. [Online] [Accessed 22nd December 2014].
McNulty, P. (2013) Which is the Premier League's biggest club? BBC Sport [Online] [Accessed on 5th January 2015] http://www.bbc.co.uk/sport/0/football/20974695
Menezes, J.D. (2014) ‘Liverpool's stadium development plans approved as Anfield expansion gets the green light.’ The Independent. [Online] 23rd September http://www.independent.co.uk/sport/football/news-and-comment/liverpools-anfield-development-plans-approved-as-anfield-expansion-gets-the-green-light-9750977.html
Miller, A. (2014). Manchester United and Real Madrid continue to top replica shirt sales charts by selling an average of 1.5 million each year. Available: http://www.dailymail.co.uk/sport/football/article-2738568/Manchester-United-Real-Madrid-continue-replica-shirt-sales-charts-selling-average-1-5m-year.html. [online] [Accessed 18th November 2014].
Mintel (2014) Football – UK – November 2014 [Online] [Accessed: 25th Jan 2015] http://reports.mintel.com/display/679670/
MMU (2014) ‘Liverpool Football Club Level 6 Strategic Marketing Case Study’ MMU Business School
Mullock, S. (2015). Premier League set for TV revolution with EVERY GAME available for streaming under £4billion new deal. [Online] [Accessed: 13th Jan 2015] http://www.mirror.co.uk/sport/football/news/premier-league-set-tv-revolution-4956046
Neville, G., (2013) Football needs to act now. The game is sleepwalking towards a crisis over agents[Online] [Accessed 25th January 2015] http://www.dailymail.co.uk/sport/football/article-2279744/Football-sleepwalking-crisis-agents-It-act-Gary-Neville.html
O’donell. K (2013) My football club made me miserable, so I started supporting another team. [Online] [Accessed 6th January 2015] http://www.theguardian.com/football/when-saturday-comes-blog/2013/mar/14/football-club-miserable-support-another-team
Oanda (no date) Currency converter [Online] [Accessed on 5th January 2015] http://www.oanda.com/currency/converter/
ON S (2013). Table A38 - Income and source of income by age of household reference person, 2013 (Excel sheet 46Kb). [Online] [Accessed: 22nd Jan 2015.] http://www.google.co.uk/url?sa=t&rct=j&q=&esrc=s&source=web&cd=1&ved=0CCMQFjAA&url=http%3A%2F%2Fwww.ons.gov.uk%2Fons%2Frel%2Ffamily-spending%2Ffamily-spending%2F2014-edition%2Frft-a38-final-2013.xls&ei=2qDGVIT5BoaW7AaavoG4Bw&usg=AFQjCNGDbyfzO5uUY1TqlDLKwNs6E5rOfQ&sig2=7rWLZge1aNxFl6V1fqgKWA&bvm=bv.84349003,d.ZGU
Padmanabhan, L (2014) TTIP: The EU-US trade deal explained [Online] [Accessed on 10th January 2015] http://www.bbc.co.uk/news/uk-politics-30493297
Pearce, J (2014) Exclusive – 580 million reasons why Liverpool FC Chief Bill Hogan is excited about Red’s future. [Online] [Accessed 19th January 2015] http://www.liverpoolecho.co.uk/sport/football/football-news/exclusive---580-million-reasons-7922473
Platini, M (2014) Financial Fair Play: All you need to know about how it works [Accessed on 1st January 2015] http://www.bbc.co.uk/sport/0/football/29361839
42
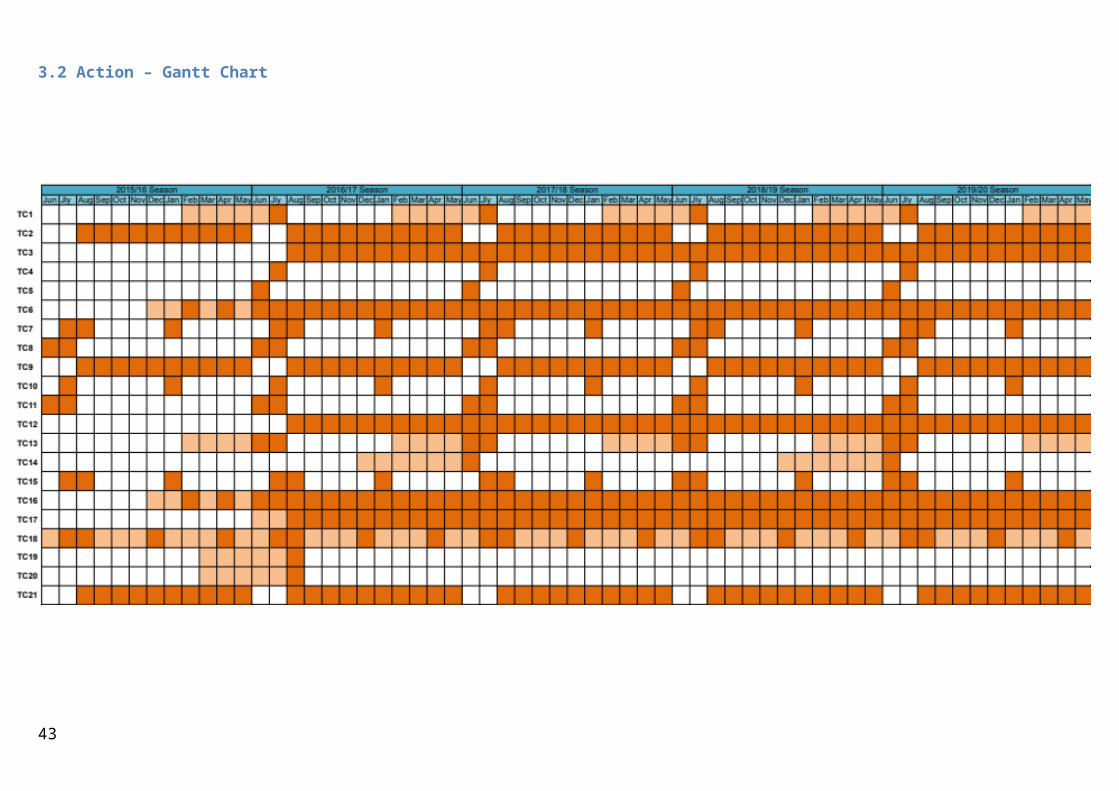
Porter, M.E. (1980) Competitive Strategy. Free Press; New York. Cited by: Wilson, R.M.S and Gilligan, C. (2005) Strategic Marketing Management: Planning, Implementation & Control. 3rd Ed., Oxford: Butterworth-Heinemann
Powell, M (2012) Marketing planning Manchester Metropolotan University, 15, 22/10/12 Lecture 5 Brand Management
Premier League (no date) About the Premier League. [Online] [Accessed 16th December 2014] http://www.premierleague.com/en-gb/about/the-worlds-most-watched-league.html
Premier League Survey. (2012) Premier League Fan Survey – Research and Insight Season 2011/12. . [Online] [Accessed on 14th October 2014] http://fansurvey.premierleague.com
Premier League. (2013x). 2013 Asia Cup Trophy Line Up Announced. Available: http://www.premierleague.com/en-gb/news/news/2012-13/mar/2013-barclays-asia-trophy-announced.html. [online] [Accessed 22nd January 2015].
Real Madrid ([no date]a) International Madridistas [Online] [Accessed on 6th January 2015] http://www.realmadrid.com/en/fans/madridistas/international
Real Madrid ([no date]b) Realmadrid TV [Online] [Accessed on 6th January 2015] http://www.realmadrid.com/en/fans/real-madrid-tv
Real Madrid (2014) Real Madrid 2013-14 Annual Report. [Online] [Accessed on 15th December 2014] http://www.realmadrid.com/cs/Satellite?blobcol=urldata&blobheader=application%2Fpdf&blobkey=id&blobtable=MungoBlobs&blobwhere=1203349468675&ssbinary=true
Repucom (2014a) World Football - full report [Online] [Accessed on 17th October 2014] http://repucom.net/media/world-football
Repucom. (2014b). European Football Kit Supplier Report Online. Available: http://repucom.net/reports/european-football-kit-supplier-report-2014. [online] [Accessed 19th November 2014].
Reynolds, C. (2014) ‘Chelsea announce plans that could lead to Stamford Bridge expansion.’ The Independent [Online] 18th June [Accessed on 6th January 2015] http://www.independent.co.uk/sport/football/premier-league/chelsea-announce-plans-that-could-lead-to-stamford-bridge-expansion-9545508.html
Reynolds, J. (2013) Liverpool FC's Wi-Fi woes show football clubs are still struggling with unproven technology. The Drum [Online] [Accessed on 6th January 2015] http://www.thedrum.com/opinion/2013/10/18/liverpool-fcs-wi-fi-woes-show-football-clubs-are-still-struggling-unproven
Ritson, M. (2014) There’s only one Man Utd but several Manchester Cities. Marketing Week [Online] [Accessed on 10th January 2015] http://www.marketingweek.com/2014/08/20/theres-only-one-man-utd-but-several-manchester-cities/
Rogers, P. (2013) England's greatest club – Infographic. Liverpool Football Club [Online] [Accessed on 15th January 2015] http://www.liverpoolfc.com/news/latest-news/151404-england-s-greatest-club-infographic
Savage, R. (2013). Robbie Savage reveals footballers' tricks to engineer a transfer. [Online] [Accessed 16th Jan 2015] http://www.bbc.co.uk/sport/0/football/23703265
Savage, R. (2014) Liverpool signings by Brendan Rodgers - hits or misses? BBC Sport [Online] [Accessed on 15th January 2015] http://www.bbc.co.uk/sport/0/football/30516598
Sedghi, A. and Arnett, G. (2014) ‘The world's best footballers in 2014: by nationality, leagues and clubs.’ The Guardian. [Online] 24th December [Accessed on 10th January 2015]
43
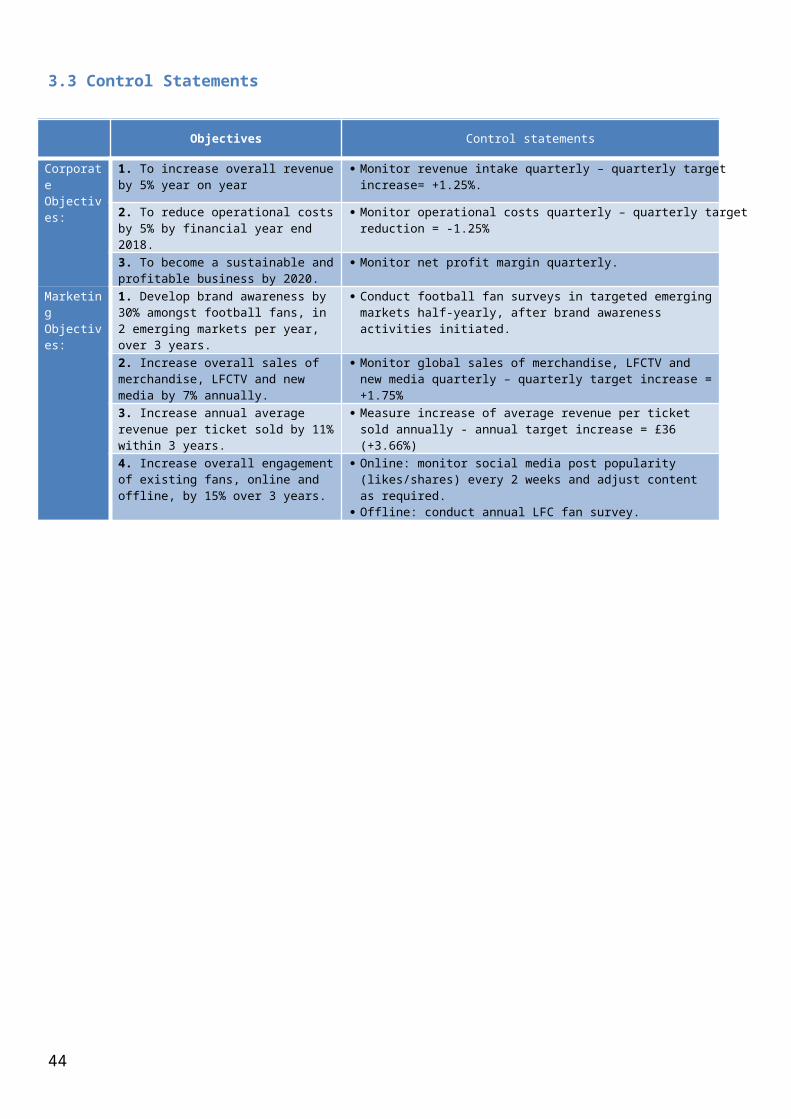
http://www.theguardian.com/football/datablog/2014/dec/24/the-worlds-best-footballers-in-2014-by-nationality-leagues-and-clubs
Smith, A (2013) Wealthy foreign investors in Premier League Clubs want more value for their buck [Online] [Accessed 7th January 2015] http://www.telegraph.co.uk/sport/football/teams/cardiff-city/10540074/Wealthy-foreign-investors-in-Premier-League-clubs-want-more-value-for-their-buck.html
Smith, B. (2013) Steven Gerrard: Liverpool captain set for LA Galaxy move. BBC Sport [Online] [Accessed on 15th January 2015] http://www.bbc.co.uk/sport/0/football/30700069
Stewart, H (2015) Interest rate delay and living standard rise good news for George Osborne. [Online] [Accessed on 20h January 2015] http://www.theguardian.com/business/2015/jan/21/interest-rate-living-standard-george-osborne-economics
Tapp. A. & Clowes., J (2002) ‘From “Carefree Casuals” to “Proffessional Wanderers”: Segmentation possibilities for football supporters.’ European Journal of Marketing. Vol. 36. Issue 11/12
Taylor, D. (2011). Manchester City bank record £400m sponsorship deal with Etihad Airways. Available: http://www.theguardian.com/football/2011/jul/08/manchester-city-deal-etihad-airways. [online] [Accessed 28th November 2014].
The Economist. (2011). Little Red Card: China and Hong Kong football industries. Available: http://www.economist.com/node/21541716. [online] [Accessed 22nd January 2015].
The Guardian (2014) ‘Liverpool to be investigated by Uefa over alleged breach of FFP rules.’ The Guardian. [Online] 25th September [Accessed on 10th January 2015] http://www.theguardian.com/football/2014/sep/25/liverpool-investigated-ffp-uefa-monaco
The Guardian (2014a) Online shopping on mobiles overtakes desktop for first time. [Accessed on 10th December 2014] http://www.theguardian.com/business/2014/sep/02/online-shopping-mobiles-overtakes-desktop
Tottenham Hotspur ([no date]a) History of White Hart Lane [Online] [Accessed on 6th January 2015] http://www.tottenhamhotspur.com/the-stadium/history/
Tottenham Hotspur ([no date]b) Join the club [Online] [Accessed on 6th January 2015] http://www.tottenhamhotspur.com/uploadedFiles/Shared_Assets/Documents/Membership/Adult-Membership-Graphic.pdf
Tottenham Hotspur ([no date]c) Spurs TV. [Online] [Accessed on 6th January 2015] http://www.tottenhamhotspur.com/spurs-tv/ipb-broadcasters/
TripAdvisor ([no date]a) Bernabeu stadium (Estadio Santiago Bernabeu). [Online] [Accessed on 8th January 2015] http://www.tripadvisor.co.uk/Attraction_Review-g187514-d796251-Reviews-Bernabeu_Stadium_Estadio_Santiago_Bernabeu-Madrid.html
TripAdvisor ([no date]b) Camp Nou. [Online] [Accessed on 8th January 2015] http://www.tripadvisor.co.uk/Attraction_Review-g187497-d271009-Reviews-Camp_Nou-Barcelona_Catalonia.html
TripAdvisor ([no date]c) Allianz Arena. [Online] [Accessed on 8th January 2015] http://www.tripadvisor.co.uk/Attraction_Review-g187309-d594437-Reviews-Allianz_Arena-Munich_Upper_Bavaria_Bavaria.html
TripAdvisor ([no date]d) Old Trafford. [Online] [Accessed on 8th January 2015] http://www.tripadvisor.co.uk/Attraction_Review-g1020874-d2263052-Reviews-Old_Trafford-Trafford_Greater_Manchester_England.html
44
TripAdvisor ([no date]e) Etihad stadium. [Online] [Accessed on 8th January 2015] http://www.tripadvisor.co.uk/Attraction_Review-g187069-d4302956-Reviews-Etihad_Stadium-Manchester_Greater_Manchester_England.html
TripAdvisor ([no date]f) Stamford Bridge stadium. [Online] [Accessed on 8th January 2015] http://www.tripadvisor.co.uk/Attraction_Review-g186338-d6426418-Reviews-Stamford_Bridge_Stadium-London_England.html
TripAdvisor ([no date]g) Emirates stadium. [Online] [Accessed on 8th January 2015] http://www.tripadvisor.co.uk/Attraction_Review-g186338-d1056442-Reviews-Emirates_Stadium-London_England.html
TripAdvisor ([no date]h) Anfield stadium. [Online] [Accessed on 8th January 2015] http://www.tripadvisor.co.uk/Attraction_Review-g186337-d999329-Reviews-Anfield_Stadium-Liverpool_Merseyside_England.html
TripAdvisor ([no date]i) White Hart Lane. [Online] [Accessed on 8th January 2015] http://www.tripadvisor.co.uk/Attraction_Review-g186338-d6426421-Reviews-White_Hart_Lane-London_England.html
UEFA. (2010). FFP Regulations. [Online] [Accessed 13th January 2015] http://www.uefa.com/MultimediaFiles/Download/Tech/uefaorg/General/01/50/09/12/1500912_DOWNLOAD.pdf.
Walmsley, D (2014) Football – UK – November 2014 [Online] [Accessed: 25th Jan 2015] http://reports.mintel.com/display/679670/
White, D. (2011) ‘Manchester City plan for bigger stadium.’ The Telegraph [Online] 22nd October [Accessed on 6th January 2015] http://www.telegraph.co.uk/sport/football/teams/manchester-city/8843970/Manchester-City-plan-for-bigger-stadium.html
Wilson, B. (2009). Premier League Giants Target India. Available: http://news.bbc.co.uk/1/hi/business/8083210.stm. [online] [Accessed 22nd January 2015].
Wilson, R.M.S and Gilligan, C. (2005) Strategic Marketing Management: Planning, Implementation & Control. 3rd Ed., Oxford: Butterworth-Heinemann
World Bank. (2014a). World Population Figures. Available: http://data.worldbank.org/indicator/SP.POP.TOTL. [online] [Accessed 15th December 2014].
World Bank. (2014b). 5 Year GDP Figures. Available: http://data.worldbank.org/indicator/NY.GDP.MKTP.CD. [online] [Accessed 15th December 2014].
World Bank. (2014c). UK Data Analysis. Available: http://data.worldbank.org/country/united-kingdom. [online] [Accessed 15th December 2014].
World Bank. (2014d). Worldwide GDP per Capita. Available: http://data.worldbank.org/indicator/NY.GDP.PCAP.CD. [online] [Accessed 20th January 2015].
Zolfagharifard, Z (2015) Global warming believers are like a hysterical ‘cult’: MIT scientist compares ‘climate alarmists’ to religious fanatics [Accessed on 1st January 2015] http://www.dailymail.co.uk/sciencetech/article-2922553/Global-warming-believers-like-hysterical-cult-MIT-scientist-compares-climate-alarmists-religious-fanatics.html
45
5.0 Appendices
Appendix 1: Competitor data Deloitte Football Money League 2012/13 - 2008/09 (chosen competitors)
2012/13 'All to play for' Jan 2014 (Deloitte, 2014a)
ClubPosition in DMFL
Movement from
previous year
Position in
domestic
league
Total wages (Euros converted to GBP*)
Avg matchday attendance (domestic league ESPN*)
Stadium capacity
Attendance as a % of capacity
Real Madrid 1 0 2£209,335,00
0 68,640 85,454 80.32%FC Barcelona 2 0 1 £230,796,00 73,660 99,354 74.14%
46
0
Bayem Munich 3 +1 1£173,335,48
9 71,000 71,137 99.81%
Manchester United 4 -1 1£180,523,00
0 75,529 75,635 99.86%
Manchester City 6 +1 2£233,106,00
0 46,974 47,805 98.26%
Chelsea 7 -2 3£176,568,00
0 41,462 41,837 99.10%
Arsenal 8 -2 4£154,490,00
0 60,079 60,432 99.42%
Liverpool 12 -3 7£132,000,00
0 44,748 45,522 98.30%
Tottenham Hotspur 14 -1 5 £96,087,000 36,029 36,24099.42%
2011/12 'Captains of industry' Jan 2013 (Deloitte, 2013)
ClubPosition in DMFL
Movement from
previous year
Position in
domestic
league
Total wages (Euros converted to GBP*)
Avg matchday attendance (domestic league ESPN*)
Stadium capacity
Attendance as a % of capacity
Real Madrid 1 0 1£192,000,00
0 74,678 85,454 87.39%
FC Barcelona 2 0 2£210,022,24
0 84,119 99,354 84.67%
Manchester United 3 0 2£161,688,00
0 75,387 75,635 99.67%
Bayem Munich 4 0 2£133,324,66
3 69,000 71,137 97.00%
Chelsea 5 0 6£172,871,00
0 41,478 41,837 99.14%
Arsenal 6 0 3£143,488,00
0 60,000 60,432 99.29%47
Manchester City 7 +5 1£201,789,00
0 47,044 47,805 98.41%
Liverpool 9 0 8£118,671,00
0 44,253 45,522 97.21%Tottenham Hotspur 13 -2 4 £93,547,000 36,026 36,240 99.41%
2010/11 'Fan power' Feb 2012 (Deloitte, 2012)
ClubPosition in DMFL
Movement from
previous year
Position in
domestic
league
Total wages (Euros converted to GBP*)
Avg matchday attendance (domestic league ESPN*)
Stadium capacity
Attendance as a % of capacity
Real Madrid 1 0 2£195,000,00
0 70,736 85,454 82.78%
FC Barcelona 2 0 1£230,837,40
0 80,153 99,354 80.67%
Manchester United 3 0 1£152,915,00
0 75,109 75,635 99.30%
Bayem Munich 4 0 3£140,416,50
4 69,000 71,137 97.00%
Arsenal 5 0 4£124,401,00
0 60,025 60,432 99.33%
Chelsea 6 0 2£191,214,00
0 41,435 41,837 99.04%
Liverpool 9 -1 6£114,652,81
6 42,820 45,522 94.06%Tottenham Hotspur 10 +1 5 £91,255,000 35,703 36,240 98.52%
48
Manchester City 12 -1 3£173,977,00
0 45,880 47,805 95.97%
2009/10 'The untouchables' Feb 2011 (Deloitte, 2011)
ClubPosition in DMFL
Movement from
previous year
Position in
domestic
league
Total wages (Euros converted to GBP*)
Avg matchday attendance (domestic league ESPN*)
Stadium capacity
Attendance as a % of capacity
Real Madrid 1 0 2£155,000,00
0 70,947 85,454 83.02%
FC Barcelona 2 0 1£217,026,40
0 79,546 99,354 80.06%
Manchester United 3 0 2£131,689,00
0 74,864 75,635 98.98%
Bayem Munich 4 0 1£133,548,16
7 69,000 71,137 97.00%
Arsenal 5 0 3£110,733,00
0 59,927 60,432 99.16%
Chelsea 6 0 1£174,111,00
0 41,422 41,837 99.01%
Liverpool 8 -1 7£121,085,00
0 42,863 45,522 94.16%
Manchester City 11 +9 5£133,306,00
0 45,512 47,805 95.20%Tottenham Hotspur 12 +3 4 £67,203,000 35,794 36,240 98.77%
2008/09 'Spanish Masters' March 2010 (Deloitte, 2010)
ClubPosition in DMFL
Movement from
previous year
Position in
domestic
league
Total wages (Euros converted to GBP*)
Avg matchday attendance (domestic league ESPN*)
Stadium capacity
Attendance as a % of capacity
Real Madrid 1 0 2£158,000,00
0 73,157 85,454 85.61%
FC Barcelona 2 +1 1£188,788,80
0 74,433 99,354 74.92%
Manchester United 3 -1 1£123,120,00
0 75,304 75,635 99.56%
Bayem Munich 4 0 2£118,385,03
4 68,647 71,137 96.50%
Arsenal 5 +1 4£103,978,00
0 60,039 60,432 99.35%
Chelsea 6 -1 3£167,179,00
0 41,588 41,837 99.40%
Liverpool 7 +1 2£107,206,00
0 43,611 45,522 95.80%Tottenham Hotspur 15 -1 8 £62,567,000 35,928 36,240 99.14%
49
Manchester City 19 new 10 £82,633,000 42,900 47,805 89.74%
Year Ending Season €uro Average €uro 30th June
30th June 2013 2012/13 0.82476 0.854830th June 2012 2011/12 0.84545 0.805330th June 2011 2010/11 0.85672 0.898230th June 2010 2009/10 0.87930 0.809830th June 2009 2008/09 0.85553 0.8504
*Wages conversion Euros to GBP (conversion rate used by year end 30th June as above (Oanda, no date))Club Euros GBPBarcelona2012/13 € 270,000,000 £230,796,0002011/12 € 260,800,000 £210,022,2402010/11 € 257,000,000 £230,837,4002009/10 € 268,000,000 £217,026,4002008/09 € 222,000,000 £188,788,800Bayern Munich2012/13 € 202,779,000 £173,335,4892011/12 € 165,559,000 £133,324,6632010/11 € 156,331,000 £140,416,5042009/10 € 164,915,000 £133,548,1672008/09 € 139,211,000 £118,385,034
Average Domestic League Position by Club
Club 2012/13 2011/12 2010/11 2009/10 2008/09
Average Domestic League Position
Real Madrid 2 1 2 2 2 1.8FC Barcelona 1 2 1 1 1 1.2Bayem Munich 1 2 3 1 2 1.8
50
Manchester United 1 2 1 2 1 1.4Manchester City 2 1 3 5 10 4.2Chelsea 3 6 2 1 3 3Arsenal 4 3 4 3 4 3.6Liverpool 7 8 6 7 2 6Tottenham Hotspur 5 4 5 4 8 5.2
Average Deloitte Football Money League Position by Club
Club 2012/13 2011/12 2010/11 2009/10 2008/09
Average DFML Position
Real Madrid 1 1 1 1 1 1FC Barcelona 2 2 2 2 2 2Bayem Munich 3 4 4 4 4 3.8Manchester United 4 3 3 3 3 3.2Manchester City 6 7 12 11 19 11Chelsea 7 5 6 6 6 6Arsenal 8 6 5 5 5 5.8Liverpool 12 9 9 8 7 9Tottenham Hotspur 14 4 5 4 8 7
Average Revenue Per Seat
Club 2012/13 2011/12 2010/11 2009/10 2008/09
Average Revenue Per Seat
Real Madrid £1,486.01
£1,367.20
£1,577.70
£1,489.84
£1,181.02 £1,420.36
FC Barcelona £1,368.45
£1,118.65
£1,247.61
£1,006.96
£1,092.26 £1,166.79
Bayem Munich £1,052.11
£1,001.45 £942.03 £791.30 £751.67 £907.71
Manchester United £1,444.48
£1,309.24
£1,445.90
£1,338.43
£1,444.81 £1,396.57
Manchester City £843.02 £654.71 £579.77 £536.12 £484.85 £619.69
Chelsea £1,705.18
£1,873.28
£1,629.06
£1,622.33
£1,791.38 £1,724.24
Arsenal £1,544.63
£1,586.67
£1,551.02
£1,566.91
£1,667.25 £1,583.30
Liverpool £996.69£1,021.4
0 £955.16£1,000.8
6 £974.52 £989.73
Tottenham Hotspur£1,115.7
7£1,140.8
4£1,212.7
8£1,028.1
1£1,099.4
2 £1,119.38
Average Wages as a % Revenue
Club 2012/13 2011/12 2010/11 2009/10 2008/09
Average Wages as a % Revenue
Real Madrid 47.07% 46.30% 45.03% 43.16% 46.21% 45.56%FC Barcelona 55.80% 53.74% 56.72% 66.59% 60.57% 58.68%
51
Bayem Munich 46.90% 44.72% 48.37% 50.49% 48.01% 47.70%Manchester United 49.70% 50.48% 46.14% 45.98% 44.21% 47.30%Manchester City 75.29% 87.32% 113.56% 106.56% 94.98% 95.54%Chelsea 67.91% 66.23% 84.76% 83.11% 81.00% 76.60%Arsenal 63.42% 61.08% 54.85% 49.35% 46.42% 55.02%Liverpool 64.02% 62.89% 62.45% 65.63% 58.01% 62.60%Tottenham Hotspur 65.19% 64.87% 55.81% 56.10% 55.37% 59.47%
Average Matchday attendance
Club 2012/13 2011/12 2010/11 2009/10 2008/09
Average Matchday attendance
Real Madrid 68,640 74,678 70,736 70,947 73,157 71,632FC Barcelona 73,660 84,119 80,153 79,546 74,433 78,382Bayem Munich 71,000 69,000 69,000 69,000 68,647 69,329Manchester United 75,529 75,387 75,109 74,864 75,304 75,239Manchester City 46,974 47,044 45,880 45,512 42,900 45,662Chelsea 41,462 41,478 41,435 41,422 41,588 41,477Arsenal 60,079 60,000 60,025 59,927 60,039 60,014Liverpool 44,748 44,253 42,820 42,863 43,611 43,659Tottenham Hotspur 36,029 36,026 35,703 35,794 35,928 35,896
*Sources: ESPN FC ([no date]a), ESPN FC ([no date]b), ESPN FC ([no date]c), ESPN FC ([no date]d), ESPN FC ([no date]e), ESPN FC ([no date]f), ESPN FC ([no date]g), ESPN FC ([no date]h), ESPN FC ([no date]i),
Average Top 100 players (Sedghi and Arnett, 2014)
Club 2014 2013 2012Average Top 100 players
Real Madrid 9 9 10 9FC Barcelona 10 11 12 11Bayem Munich 12 11 10 11Manchester United 6 4 5 5Manchester City 6 6 8 7Chelsea 9 8 8 8Arsenal 4 4 1 3Liverpool 3 1 1 2Tottenham Hotspur 1 3 2 2
Average adult membership
52
Club Adult Membership
pricesAverage adult
membership price
Euro to GBP (conversion rate 0.781302 on 9th
Jan 2015)Real Madrid 30-65 euros € 47.50 £37.11FC Barcelona 177 euros € 177.00 £138.26Bayem Munich 40-60 euros € 50.00 £39.05Manchester United £32.00 £32.00 £32.00Manchester City £35.00 £35.00 £35.00Chelsea 25-45 £35.00 £35.00Arsenal 34-39 £36.50 £36.50Liverpool 26.99-43.99 £35.49 £35.49Tottenham Hotspur 42-57 £49.50 £49.50*Sources: Real Madrid ([no date]a), FC Barcelona ([no date]b), FC Bayern Forum (no date), Manchester United ([no date]b), Manchester City ([no date]b), Chelsea FC ([no date]b), Arsenal ([no date]b), Liverpool FC ([no date]g), Tottenham Hotspur ([no date]b).
Appendix 2: Club accessibility
ClubDomestic
TV subscripti
on
Domes-tic TV
subscr-iption rating
Overseas TV
subscription
Overs-eas TV subscr-iption rating
On-demand
subscription
On-deman
d subscri-ption rating
Free videos
and highlig
-hts
Free videos and highli-ghts rating
Total rates
Real Madrid Yes (price not known) 1 No 0 No 0 Yes 1 2
FC Barcelona Yes (price not known) 1 No 0 No 0 Yes 1 2
Bayem Munich No 0 No 0Yes - 4 EUR 1 Yes 1 2
Manchester UnitedYes - £6 1
Yes (some countries) 1 No 0 Yes 1 3
Manchester City No 0 No 0 No 0 Yes 1 1
ChelseaYes - £6 1
Yes (some countries) 1
Yes - £5.99 1 Yes 1 4
Arsenal No 0 No 0Yes - £3.99 1 Yes 1 2
Liverpool Yes - £7 1 No 0 Yes - 1 Yes 1 353
£4.99
Tottenham Hotspur No 0Yes (some countries) 1
Yes - FREE 2 Yes 1 4
*Sources: Real Madrid ([no date]b), Barca TV (no date), FC Bayern (no date), Manchester United ([no date]c), Manchester City ([no date]c), Chelsea FC ([no date]c), Arsenal (2011), Liverpool FC ([no date]h), Tottenham Hotspur ([no date]c)
Appendix 3: TripAdvisor ratings (stadium visits)- accessed 8th January 2015
Club and stadium
Total number
of reviews
Total number
of 'Excellent' reviews
Total number of 'Very good'
reviews
Total number
of 'Average' reviews
Total number of 'Poor' reviews
Total number
of 'Terrible' reviews
Percentage of
'excellent' ratings
Real Madrid (Bernabeu) 4,466 2,926 1,155 298 45 42 66%FC Barcelona (Camp Nou) 8,342 5,052 2,292 754 170 74 61%Bayem Munich (Allianz) 1,869 1,091 570 156 38 14 58%Manchester United (Old Trafford) 608 469 105 21 5 8 77%Manchester City (Etihad) 431 284 100 21 11 15 66%Chelsea (Stamford Bridge) 119 78 27 10 4 0 65%Arsenal (Emirates) 742 523 170 30 8 11 70%
Liverpool (Anfield) 1,526 1,202 222 55 18 29 79%
Tottenham Hotspur (White Hart Lane) 45 24 15 4 1 1 53%
54
*Sources: TripAdvisor ([no date]a), TripAdvisor ([no date]b), TripAdvisor ([no date]c), TripAdvisor ([no date]d), TripAdvisor ([no date]e), TripAdvisor ([no date]f), TripAdvisor ([no date]g), TripAdvisor ([no date]h), TripAdvisor ([no date]i)
55


![A New Delay Dependent Robust Fixed-Order Decentralized ... · LFC problem is discussed from different viewpoints in literature. In [4], a simple robust LFC is ... The case study is](https://static.fdocuments.us/doc/165x107/5f759c630baa7b11db1573b9/a-new-delay-dependent-robust-fixed-order-decentralized-lfc-problem-is-discussed.jpg)


