Levelised Cost of Electricity of Selected Renewable ...
88
Transcript of Levelised Cost of Electricity of Selected Renewable ...

..

3
DISCLAIMER
The views, opinions, and information expressed in this publication were compiled from sources believed to be reliable for information and sharing purposes only. They do not necessarily reflect the views or policies of individual ASEAN Member State nor the individuals and institutions that contributed to this report. Those individuals and institutions are not responsible for any opinions or judgements the report contains.

4
TABLE OF CONTENTS
EXECUTIVE SUMMARY 51. INTRODUCTION 13
Methodology 152. LEVELISED COST OF ELECTRICITY 193. SOLAR PV 27 3.1 Solar PV Deployment in ASEAN 29 3.2 Solar PV Projects 31 3.3 Installation Costs 32 3.4 O&M Costs 37 3.5 Capacity Factors 40 3.6 Levelised Cost 42 3.7 Sensitivity Analysis 444. BIOMASS 45 4.1 Biomass Power Deployment in ASEAN 47 4.2 Biomass Power Projects 49 4.3 Installation Costs 49 4.4 O&M Costs 52 4.5 Heat Rates and Fuel Costs 53 4.6 Capacity Factor 55 4.7 Levelised Cost 56 4.8 Sensitivity Analysis 575. HYDROPOWER 59 5.1 Hydropower Deployment in ASEAN 61 5.2 Hydropower Projects 62 5.3 Installation Costs 63 5.4 O&M Costs 65 5.5 Capacity Factor 66 5.6 Levelised Cost 67 5.7 Sensitivity Analysis 696. POLICY ANALYSIS 71 6.1 Baseline Project Parameters 72 6.2 Policy Impacts 727. CONCLUSION 75REFERENCES 78
I
5
Table 0-1. Number of RE projects included in the study 6Table 3-1. Number of projects by country by capacity size category 31Table 3-2. Solar PV Installation costs in selected AMS countries (USD per kWp) (2014 prices) 35Table 3-3. Solar PV O&M costs in selected AMS 37Table 3-4. Capacity factors for solar PV plants in selected AMS 40Table 3-5. Levelised cost of electricity for solar PV in selected AMS (USD per kWh) (2014 prices) 42Table 4-1. Biomass projects, capacity and fuel type by country 49Table 4-2. Biomass Power Installation costs (USD/W) (2014 prices) 51Table 4-3. O&M cost as percentage of capital cost 52Table 4-4. Biomass power heat rates and fuel costs 54Table 4-5. Biomass power plant capacity factors 55Table 4-6. Levelised cost of biomass electricity generation (USD per kWh) (2014 prices) 56Table 5-1. Hydropower projects from selected AMS 62Table 5-2. Hydropower installation costs (USD per W) (2014 prices) 65Table 5-3. Hydropower O&M costs as percentage of capital cost 66Table 5-4. Hydropower capacity factor (%) 67Table 5-5. Hydropower levelised cost (USD per kWh) (2014 prices) 68Table 6-1. Cost and financial parameters of a 5 MWp solar PV Project 72Table 6-2. Policy support mechanisms 73
EXECUTIVE SUMMARY 51. INTRODUCTION 13
Methodology 152. LEVELISED COST OF ELECTRICITY 193. SOLAR PV 27 3.1 Solar PV Deployment in ASEAN 29 3.2 Solar PV Projects 31 3.3 Installation Costs 32 3.4 O&M Costs 37 3.5 Capacity Factors 40 3.6 Levelised Cost 42 3.7 Sensitivity Analysis 444. BIOMASS 45 4.1 Biomass Power Deployment in ASEAN 47 4.2 Biomass Power Projects 49 4.3 Installation Costs 49 4.4 O&M Costs 52 4.5 Heat Rates and Fuel Costs 53 4.6 Capacity Factor 55 4.7 Levelised Cost 56 4.8 Sensitivity Analysis 575. HYDROPOWER 59 5.1 Hydropower Deployment in ASEAN 61 5.2 Hydropower Projects 62 5.3 Installation Costs 63 5.4 O&M Costs 65 5.5 Capacity Factor 66 5.6 Levelised Cost 67 5.7 Sensitivity Analysis 696. POLICY ANALYSIS 71 6.1 Baseline Project Parameters 72 6.2 Policy Impacts 727. CONCLUSION 75REFERENCES 78
LIST OF TABLES
II

6
Figure 0-1. Levelised cost of electricity (USD per kWh) (2014 prices) 7Figure 0-2. Impacts on biomass LCOE with ±50% change in values of key parameters (percent increase/decrease in LCOE) 8Figure 0-3. Levelised Costs and Generation Costs 9Figure 0-4. Levelised Costs and Average Residential Selling Price 10Figure 0-5. Impacts of fiscal and financial support mechanisms on LCOE 11Figure 0-6. Impacts of fiscal and financial support mechanisms on equity IRR 11Figure 2-1. Installation costs (USD per W) (2014 Prices) 20Figure 2-2. O&M Costs 21Figure 2-3. Capacity Factor 21Figure 2-4. Levelised Cost (USD per kWh) (2014 prices) 22Figure 2-5. Levelised Costs Compared with Generation Costs (2014 prices) 23Figure 2-6. Medium Solar PV LCOE compared with Average COMMERCIAL Selling Prices 24Figure 2-7. Small Solar PV LCOE compared with Average RESIDENTIAL Selling Price 25Figure 3-1. Solar PV Installed Capacity in the AMS 29Figure 3-2. Solar PV Electricity generation in the AMS 30Figure 3-3. Breakdown of costs for utility-scale solar PV projects in Indonesia 32Figure 3-4. Breakdown of cost for solar PV projects in Malaysia 33Figure 3-5. Breakdown of solar PV equipment cost in Malaysia 34Figure 3-6. Installation costs for small and medium sized systems (installed capacity below 1000 kWp) (2014 prices) 36Figure 3-7. Installation costs for large-scale systems (capacity higher than 1000 kWp) (2014 prices) 37Figure 3-8. O&M costs for selected small and medium scale projects (installed capacity below 1000 kWp) 39Figure 3-9. O&M costs for selected large scale projects (installed capacity above 1000 kWp) 39Figure 3-10. Capacity factors for selected small and medium scale projects (installed capacity below 1000 kWp) 41Figure 3-11. Capacity factors for selected large-scale projects (installed capacity above 1000 kWp) 41
LIST OF FIGURES
III

7
Figure 0-1. Levelised cost of electricity (USD per kWh) (2014 prices) 7Figure 0-2. Impacts on biomass LCOE with ±50% change in values of key parameters (percent increase/decrease in LCOE) 8Figure 0-3. Levelised Costs and Generation Costs 9Figure 0-4. Levelised Costs and Average Residential Selling Price 10Figure 0-5. Impacts of fiscal and financial support mechanisms on LCOE 11Figure 0-6. Impacts of fiscal and financial support mechanisms on equity IRR 11Figure 2-1. Installation costs (USD per W) (2014 Prices) 20Figure 2-2. O&M Costs 21Figure 2-3. Capacity Factor 21Figure 2-4. Levelised Cost (USD per kWh) (2014 prices) 22Figure 2-5. Levelised Costs Compared with Generation Costs (2014 prices) 23Figure 2-6. Medium Solar PV LCOE compared with Average COMMERCIAL Selling Prices 24Figure 2-7. Small Solar PV LCOE compared with Average RESIDENTIAL Selling Price 25Figure 3-1. Solar PV Installed Capacity in the AMS 29Figure 3-2. Solar PV Electricity generation in the AMS 30Figure 3-3. Breakdown of costs for utility-scale solar PV projects in Indonesia 32Figure 3-4. Breakdown of cost for solar PV projects in Malaysia 33Figure 3-5. Breakdown of solar PV equipment cost in Malaysia 34Figure 3-6. Installation costs for small and medium sized systems (installed capacity below 1000 kWp) (2014 prices) 36Figure 3-7. Installation costs for large-scale systems (capacity higher than 1000 kWp) (2014 prices) 37Figure 3-8. O&M costs for selected small and medium scale projects (installed capacity below 1000 kWp) 39Figure 3-9. O&M costs for selected large scale projects (installed capacity above 1000 kWp) 39Figure 3-10. Capacity factors for selected small and medium scale projects (installed capacity below 1000 kWp) 41Figure 3-11. Capacity factors for selected large-scale projects (installed capacity above 1000 kWp) 41
Figure 3-12. Levelised cost of electricity for selected small and medium scale projects (installed capacity below 1000 kWp) (2014 prices) 43Figure 3-13. Levelised cost of electricity for selected large scale projects (installed capacity above 1000 kWp) (2014 prices) 43Figure 3-14. Impacts on solar PV LCOE with ±50 change in values of key parameters (percent increase/decrease in LCOE) 44Figure 4-1. Biomass Power Installed Capacity in selected AMS 48Figure 4-2. Biomass Electricity generation in selected AMS 48Figure 4-3. Breakdown of Costs for Biomass Projects 50Figure 4-4. Breakdown of Equipment Costs for Biomass Projects in Malaysia 50Figure 4-5. Distribution of biomass power installation costs (2014 prices) 51Figure 4-6. Distribution of O&M costs 52Figure 4-7. Distribution of biomass power heat rates 53Figure 4-8. Distribution of biomass fuel prices 54Figure 4-9. Distribution of biomass power plant capacity factors 55Figure 4-10. Distribution of biomass power levelised cost (2014 prices) 56Figure 4-11. Impacts on biomass LCOE with ±50 change in values of key parameters (percent increase/decrease in LCOE) 58Figure 5-1. Hydropower Installed Capacity in the AMS 61Figure 5-2. Hydropower Generation in the AMS 62Figure 5-3. Breakdown of Costs for Hydropower Projects (average per country and regional average) 63Figure 5-4. Breakdown of Hydropower Equipment and Installation Costs for Malaysia 64Figure 5-5. Distribution of hydropower installation costs (2014 prices) 64Figure 5-6. Distribution of hydropower O&M costs 65Figure 5-7. Distribution of hydropower capacity factor 66Figure 5-8. Distribution of hydropower levelised cost (2014 prices) 68Figure 5-9. Impacts on hydropower LCOE with ±50 change in values of key parameters (percent increase/decrease in LCOE) 69Figure 6-1. Impacts of fiscal and financial support mechanisms on LCOE 73Figure 6-2. Impacts of fiscal and financial support mechanisms on equity IRR 74
IV
8
ACE ASEAN Centre for EnergyAMS ASEAN Member StateASEAN Association of Southeast Asian NationsEGAT Electricity Generating Authority of ThailandGIZ Gesellschaft für Internationale ZusammenarbeitGDP Gross domestic productGW GigawattIRR Internal rate of returnkWh Kilowatt-hourkWp Kilowatt-peakLCOE Levelised Cost of ElectricityMERALCO Manila Electric CompanyMW MegawattMWp Megawatt-peakO&M Operations and maintenancePLN Perusahaan Listrik NegaraPV PhotovoltaicRE Renewable energyROE Return on equityTNB Tenaga Nasional BerhadUSD United States DollarWACC Weighted average cost of capitalW Watt
LIST OF ABBREVIATIONS
V
9
ACE ASEAN Centre for EnergyAMS ASEAN Member StateASEAN Association of Southeast Asian NationsEGAT Electricity Generating Authority of ThailandGIZ Gesellschaft für Internationale ZusammenarbeitGDP Gross domestic productGW GigawattIRR Internal rate of returnkWh Kilowatt-hourkWp Kilowatt-peakLCOE Levelised Cost of ElectricityMERALCO Manila Electric CompanyMW MegawattMWp Megawatt-peakO&M Operations and maintenancePLN Perusahaan Listrik NegaraPV PhotovoltaicRE Renewable energyROE Return on equityTNB Tenaga Nasional BerhadUSD United States DollarWACC Weighted average cost of capitalW Watt
Energy Renewable Hybrid Solar Wind, Indonesia. Credit: ASEC

1
ASEAN as we see it is a region of opportunities where the economies of the ten ASEAN Member States (AMS) are growing rapidly, thus will see the highest energy demand up to the year 2035. It is recognised that to meet this demand, we must develop a variety of systems and technologies in parallel, as well as a range of strategies for the clean and sustainable generation of energy, which take the environmental, social and economic impacts into consideration. This has become a priority for the AMS, as asserted in the ASEAN Plan of Action for Energy Cooperation 2016-2025 with the aspirational target of 23% renewable energy (RE) in total primary energy supply in 2025.
The cost of renewables in the global market has declined rapidly over the past few years. The deployment of RE in ASEAN in the last eight years has shown significant increase with total additional capacity of 28 GW. However, the perception of high cost of renewable technologies still somehow exists among the Member States. This is mainly due to the cost figures oftentimes not being based on fact, since the costs will vary by projects, scales, locations and periods of development. Whilst recent studies by international agencies already exist to indicate the competitiveness potentials of several renewable technologies, this study did so in the context of the ASEAN region.
For that reason, the ASEAN Centre for Energy (ACE) under the Renewable Energy Support Programme for ASEAN (ASEAN-RESP) conducted a study on levelised cost of electricity (LCOE) for solar photovoltaic (PV), biomass and hydro from a total of 64 (sixty-four) projects in ASEAN. It is expected that the Study will offer a better understanding on LCOE of these three RE technologies in ASEAN, and further identify necessary policies to encourage fair competition between RE and conventional fossil fuel-based power plants in the AMS.
The Levelised Cost of Electricity of Selected Renewable Technologies in the ASEAN Member States is part of ACE’s efforts to fulfil its function as a regional energy centre of excellence that continues to initiate coherent, coordinated, focused and robust energy policy agenda and strategy for ASEAN. We hope that this publication could provide stakeholders with useful information on the current costs of RE technologies in ASEAN—especially solar PV, biomass and hydro—as well as enhance cooperation towards energy security in the region.
Dr. Sanjayan VelauthamExecutive DirectorASEAN Centre for Energy
FOREWORDACE

2
The Association of Southeast Asian Nations (ASEAN) is one dynamic and fast growing economy in the world. The economic growth brings both great challenges and opportunities to ensure that energy could be distributed and accessed from clean supplies with affordable prices. The ASEAN Member States (AMS) through the ASEAN Plan of Action for Energy Cooperation (APAEC) 2016-2025 realise the potentials of renewable energy (RE) and has set an aspirational target of 23% for RE in the total primary energy supply by the year 2025. RE could be one of the solutions for AMS to fulfil the theme of the APAEC in achieving energy security, accessibility, affordability and sustainability for all.
To support APAEC 2016-2025’s aims on enhancing energy connectivity and market integration in ASEAN, the Renewable Energy Support Programme for ASEAN (ASEAN-RESP) conducted a study to review the levelised cost of electricity (LCOE) of solar photovoltaic (PV), biomass and hydropower. The Study aims to give light to the current LCOE of the 3 RE technologies mentioned above, consequently helps to identify necessary policies to encourage fair competition between RE and fossil fuel-based power plants in the AMS. ASEAN-RESP is a jointly implemented project by the ASEAN Centre for Energy (ACE) and the Deutsche Gesellschaft für Internationale Zusammenarbeit (GIZ) GmbH on behalf of the Federal Ministry for Economic Cooperation and Development (BMZ).
LCOE is one of the measurements used as a basis to determine the least costly method or utility to generate electricity. The Levelised Cost of Electricity of Selected Renewable Technologies in the ASEAN Member States underlines the main parameters influencing the LCOE in the AMS. It also analyses the LCOE of selected RE technologies in AMS, and advices the necessary policies to reach a significant competitive level of certain RE technologies’ LCOE. The result reveals that RE technologies already contribute to reduce the costs to meet electricity demands in many AMS. The result also indicates which RE technologies require additional support from policymakers in order to make them further competitive with other electricity generating technologies, as well as to increase market deployment to meet their national and regional targets.
It took an extensive research and a lot of cooperation with the ASEAN Renewable Energy Sub-sector Network to develop this study. For that reason, we are very pleased to announce the completion of The Levelised Cost of Electricity of Selected Renewable Technologies in the ASEAN Member States, which is now available for all related stakeholders. We believe that this study will be helpful in giving an overview on the parameters that influence LCOE in ASEAN, so policymakers can take the necessary actions to support RE development, and stakeholders can see the benefit of investing in RE technologies.
Maria-José PoddeyPrincipal AdvisorASEAN-RESP, GIZ
FOREWORDGIZ

ACKNOWLEDGEMENTThe study on levelised cost of electricity (LCOE) was developed by ASEAN Centre for Energy (ACE) and Renewable Energy Sub-sector Network (RE-SSN), with the technical assistance of Brunei National Energy Research Institute (BNERI). The study was conducted under the Renewable Energy Support Programme for ASEAN (ASEAN-RESP), a jointly implemented project by ACE and Deutsche Gesellschaft für Internationale Zusammenarbeit (GIZ) GmbH on behalf of the Federal Ministry for Economic Cooperation and Development (BMZ).
Two regional workshops were held on 28 September 2015 in Jakarta, Indonesia and on 2-3 February 2016 in Bali, Indonesia, attended by RE-SSN’s representatives and RE project developers to validate data and verify findings and analysis prepared by ACE and the consultant.
The completion of the Study is made possible through cooperation and support of the RE-SSN Focal Points and other stakeholders from relevant ministries, institutions, and RE project developers that have provided the information. We would like to thank all those people, in particular those named below:
RE-SSN Focal Points and networks, as well as the workshops participants: Mr. Abdul Matiin Hj Muhd Kasim from Energy and Industry Department, Prime Minister’s Office of Brunei Darussalam; Dr. Bun Narith and Mr. Toch Sovanna from Ministry of Mines and Energy of Cambodia; Mr. Chantho Milattanapheng and Mr. Syvang Xayyavong from Ministry of Energy and Mines of Lao PDR; Ms. Maritje Hutapea, Mr. Abdi Dharma Saragih, Ms. Azizah Ayu Kartika, Mr. Benhur P. L. Tobing, Mr. Budi Santoso, Mr. Neilul Fikri, Mr. Munir Ahmad, Ms. Ilda Agnes, Mr. David F. Silalahi, and Mr. Daniel Prahara from Ministry of Energy and Mineral Resources of Indonesia; Mr. Ifnu Setyadi Gunawan from PT Bangun Nusantara Engineering; Mr. Wong Tin Song, and Mr. Law Yen Yang from Ministry of Energy, Green Technology and Water of Malaysia; Ms. Najihah Mohd. Ramli and Mr. Roslee bin Esman from Energy Commission of Malaysia; Ms. Catherine Ridu, Dr. Chen Wei Nee, Ms. Gladys Mak, Ms. Azah Ahmad, Mr. Mohd Hafiz Mohd Suib, Mr. Steve Anthony Lojuntin, Mr. CF Leong; Koh Keng Sen, Ir. Mohd Zamri Laton, Mr. Ahmad Syafiq Rosli and Ms. Nor Azaliza Damiri from Sustainable Energy Development Authority of Malaysia, Ms. Tai Ai Peng, Mr. Lim Chi Haur, and Mr. Adrian Goh from Matahari Kencana Sdn Bhd; Mr. Win Khaing Moe and Mr. Hla Myo Aung from Ministry of Education of Myanmar, Ms. Myint Myint Kyi Swe from Yangon Electricity Corporation; Ms. Marissa Cerezo, Ms. Gemma M. Villareal, and Ms. Mara Eloiza D. Esquilona from Department of Energy of the Philippines; Ms. Agnes Koh from Energy Market Authority of Singapore; Mr. Thammayot Srichuai, Mr. Yaowateera Achawangkul, and Ms. Patlada Sinsap from Department of Alternative Energy Development and Efficiency of Thailand; Mr. Anubut Sangarsari from Betong Green Power, Thailand; Mr. Nguyen Ninh Hai from Ministry of Industry and Trade of Vietnam; Dr. Vu Binh Duong from Institute of Energy Vietnam; Mr. Huynh Minh Quong from Power Engineering Consulting Joint Stock Company 4.
ACE - ASEAN-RESP team: Badariah Yosiyana, Lisa Tjandra, Nanda F. Moenandar, and Yudha Irmansyah Siregar.
ACE - APAEC and Policy Research & Analytics team: Beni Suryadi and Aloysius Damar Pranadi.
GIZ- ASEAN-RESP team: Rizky Fauzianto.
3

13
ACKNOWLEDGEMENTACKNOWLEDGEMENT
Energy Renewable Hybrid Solar Wind, IndonesiaCredit: ASEC


T he perception that renewable energy (RE) technologies are not competitive with conventional technologies is still prevalent in the ASEAN region. This constitutes a major barrier to the deployment of RE technologies. This study aims to contribute to the growing literature in raising awareness and highlighting that the cost of RE technologies since
the past decades have been declining and becoming competitive with conventional electricity generation technologies due to technological learning and increased market deployment.
The study is carried out with the objective of reviewing the levelised cost of electricity (LCOE) of RE technologies in the selected ASEAN Member States (AMS) based on the data from the actual projects and to identify necessary policies to improve the competitiveness of RE technologies. The study focused on solar PV, biomass for power and hydropower. These technologies were selected based on the selection criteria developed for this study, which are (i) resource potential; (ii) government targets; (iii) policy and regulatory frameworks, and (iv) installed power capacity in the past 3 (three) years.
The study assessed a total of 64 projects information on solar PV, biomass power and small hydropower from 6 (six) AMS. The breakdown of project by RE type and Member State is shown in Table 0-1.
Table 0-1. Number of RE projects included in the study
AMS Solar PVBiomass
Power Hydropower TOTAL
Indonesia 2 2 9 13Lao PDR - - 2 2Malaysia 21 5 5 31Myanmar - - 2 2Thailand 5 2 2 9Vietnam 4 - 3 7TOTAL 32 9 23 64
6

LEVELISED COST OF ELECTRICITYThe levelised cost of electricity (LCOE) is defined as the net present value of the unit-cost of electricity over the lifetime of a generating asset. This is roughly calculated by dividing the net present value of all costs over the lifetime of the project by the total electricity output of the project.
The Study shows that the average LCOE of solar PV projects is USD 0.22 per kWh, that of biomass projects is USD 0.092 per kWh and that of hydropower projects is USD 0.044 per kWh. It is interesting to note that some projects have already achieved a cost competitive level of electricity generation. The lowest LCOE values (minimum) are already relatively low. For solar PV projects, the minimum LCOE is USD 0.13 per kWh, that of biomass power at USD 0.057 per kWh while the lowest value for hydropower is USD 0.019 per kWh.
The sensitivity analysis shows that capital costs, capacity factors and discount rates are important parameters determining LCOE of solar PV, biomass power and hydropower. Variations of these values could yield a significant increase or decrease in LCOE. For biomass power projects, in addition to these, variations in plant heat rates and biomass fuel prices have also an important effect on the LCOE (Figure 0-2). The sensitivity analysis results also indicate that these parameters could be targeted for policy interventions to improve the competitiveness of RE technologies.
0.220
0.092
0.044
0.190
0.088 0.0450.130
0.0570.019
0.850
0.1250.085
0.000
0.100
0.200
0.300
0.400
0.500
0.600
0.700
0.800
0.900
Leve
lized
Cos
t (US
D p
er k
Wh)
Mean
Median
Min
Max
solar biomass hydropower
Figure 0-1. LCOE (USD per kWh) (2014 prices)
Leve
lised
Cos
t (US
D p
er k
Wh)
7

GRID AND SOCKET PARITYThe Study also compares the estimated LCOEs with the average generation costs (which covers all generation technologies) and for this part of the Study, LCOE results are considered representative for all AMS. In Indonesia, the Philippines and Thailand, hydropower generation have reached grid parity (the highest LCOE value is lower than the average generation costs for these countries). For Malaysia, most but not all hydropower projects have reached grid parity (the average generation cost of TNB is above the average LCOE but below the highest LCOE level). Similarly, most but not all biomass projects in Indonesia, the Philippines and Thailand have also reached grid parity (Figure 0-3). Grid parity is defined as the LCOE of a project equals to the average price the utility is paying to various generators or the average cost utilities are incurring from their own facilities.
Hydropower and biomass technologies are competitive with diesel generation and gas turbine generation (LCOE values of all projects in the study are lower than the
Figure 0-2. Impacts on biomass LCOE with ±50% change in values of key parameters (percent increase/decrease in LCOE)
Note: ±50% change in capital cost; ±50% change in O&M; ±50% change in capacity factor; ±50% change in fuel price; ±50% change in plant heat rate. *capacity factor and heat rate are inversely related to LCOE – an increase in capacity factor and/or heat rate results in a decrease in LCOE.
8
0
24%-24%
0
11%-12%
0
-24% 71%
14%-14%
0
-10% 29%
0
19%-16%
capacity factor*
heat rate*
discount rate
fuel price
O&M cost
capital cost

diesel and gas turbine generation costs). Most but not all solar PV projects are also competitive with diesel and gas turbine electricity generation. This means that, as shown in the same figure below, diesel and gas turbine generation costs are higher than the average LCOE, but below the highest LCOE values.
Medium and small-scale solar PV systems in general are most often installed at the rooftops of residential and commercial buildings. Therefore, it would be more appropriate to compare these technologies with commercial and residential selling prices (Figure 0-4). To some extent, small, medium and large scale solar PV technologies have reached socket parity in Malaysia, the Philippines and Singapore. The figure shows that the average residential selling price in these countries are higher than the average LCOE but below the highest LCOE levels. Socket parity is defined as the LCOE of small-scale solar PV is equal to the average price the consumer is paying to the distribution utility.
Figure 0-3. Levelised Costs and Generation Costs
Note: Darker shade–from minimum LCOE value to the mean value. Lighter shade–from mean value to the maximum value.
Levelised Cost (USD/kWh)
9
0 0.2 0.4 0.6 0.8 1 1.2
small solar PV
medium solar PV
large solar PV
biomass
hydropower
Levelised Cost (USD/kWh)
2014 (in USD/kWh)
TNB av erage gen cost: 0.073 (blue line)PLN av erage gen cost: 0.109 (green line)PLN diesel gen cost: 0.259 (red line)
PLN gas turbine gen cost: 0.244PLN CC gen cost: 0.113MERALCO average gen charge: 0.120EGAT av erage sales price: 0.096
FIGURE 0-3 & 2-5
FIGURE 0-4&2-7
0 0.2 0.4 0.6 0.8 1 1.2
small solar PV
medium solar PV
large solar PV
biomass
hydropower
Levelized Cost (USD/kWh)
2014 (in USD/kWh)
TNB average gen cost: 0.073 (blue line)PLN average gen cost: 0.109 (green line)PLN diesel gen cost: 0.259 (red line)
PLN gas turbine gen cost: 0.244PLN CC gen cost: 0.113MERALCO average gen charge: 0.120EGAT average sales price: 0.096
0 0.2 0.4 0.6 0.8 1 1.2
small solar PV
medium solar PV
large solar PV
biomass
hydropower
Levelized Cost (USD/kWh)
2014 average RESIDENTIAL selling price(USD/kWh)
PLN: 0.064 (dark blue line)TNB: 0.095 (green line)EGAT: 0.136 (red line)Singapore Power: 0.176 (orange line)MERALCO: 0.249 (light blue line)

POLICY IMPACTSThe Study evaluated the effect of policy support mechanisms that provide incentives to RE investments in the AMS. These are fiscal incentives (exemptions on import duties and taxes, low corporate taxes, income tax holidays) and financial mechanisms (low interest rate, longer loan terms, higher debts share, and low return on equity).
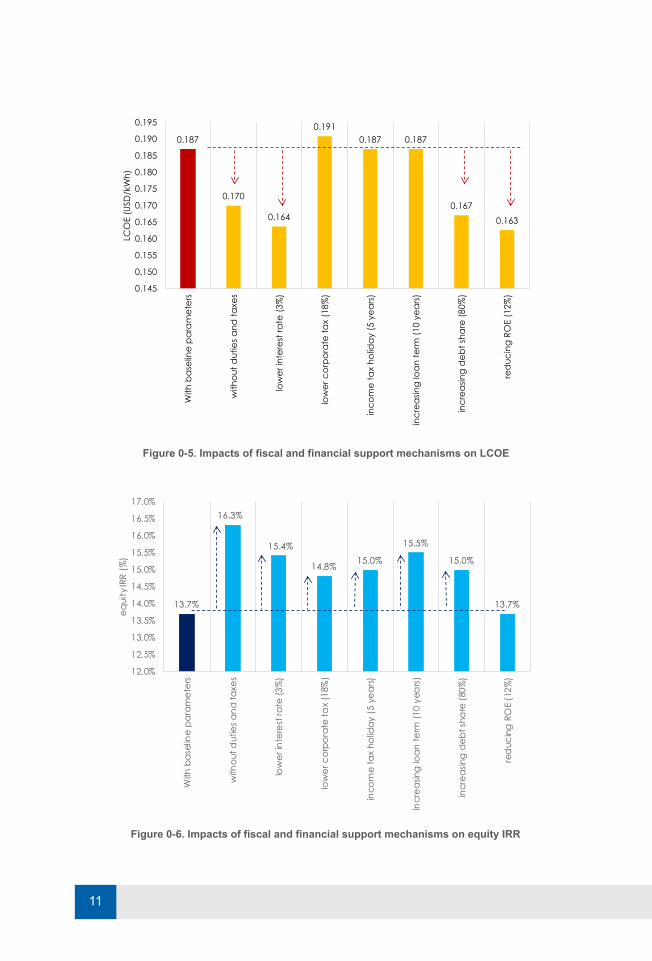
The analysis shows that there are measures that have direct impacts on LCOE. These are: exemptions from import duties and taxes, lowering of loan interest rate, increasing debt share and reducing ROE (Figure 0-5). These measures directly reduce either the capital or operating costs of the project. Policy measures that aim to reduce capital and operating costs will have positive effect on LCOE and improve the competitiveness of a specific RE technology project.
In addition, the Study also assessed the impact of these support mechanisms on the financial viability of an RE project. Using the equity internal rate of return (IRR) as the measure, the Study shows that almost all of these support mechanisms improve the project equity IRR (Figure 0-6). Any policy measure that positively impacts not only on project investment and operating costs but also on the equity cash flow would improve the attractiveness of the project from financing point of view.
Figure 0-4. Levelised Costs and Average Residential Selling Price
Note: Darker shade–from minimum LCOE value to the mean value. Lighter shade–from mean value to the maximum value.
10
0 0.2 0.4 0.6 0.8 1 1.2
small solar PV
medium solar PV
large solar PV
biomass
hydropower
Levelised Cost (USD/kWh)
2014 av erage RESIDENTIAL selling price(USD/kWh)
PLN: 0.064 (dark blue line)TNB: 0.095 (green line)EGAT: 0.136 (red line)Singapore Power: 0.176 (orange line)MERALCO: 0.249 (light blue line)
FIGURE 0-3 & 2-5
FIGURE 0-4&2-7
0 0.2 0.4 0.6 0.8 1 1.2
small solar PV
medium solar PV
large solar PV
biomass
hydropower
Levelized Cost (USD/kWh)
2014 (in USD/kWh)
TNB average gen cost: 0.073 (blue line)PLN average gen cost: 0.109 (green line)PLN diesel gen cost: 0.259 (red line)
PLN gas turbine gen cost: 0.244PLN CC gen cost: 0.113MERALCO average gen charge: 0.120EGAT average sales price: 0.096
0 0.2 0.4 0.6 0.8 1 1.2
small solar PV
medium solar PV
large solar PV
biomass
hydropower
Levelized Cost (USD/kWh)
2014 average RESIDENTIAL selling price(USD/kWh)
PLN: 0.064 (dark blue line)TNB: 0.095 (green line)EGAT: 0.136 (red line)Singapore Power: 0.176 (orange line)MERALCO: 0.249 (light blue line)
0.187
0.170
0.164
0.1910.187 0.187
0.1670.163
0.145
0.150
0.155
0.160
0.165
0.170
0.175
0.180
0.185
0.190
0.195
With
bas
elin
e p
ara
met
ers
with
out d
utie
s and
taxe
s
low
er in
tere
st ra
te (3
%)
low
er c
orpo
rate
tax
(18%
)
inco
me
tax
holid
ay (5
yea
rs)
incr
easin
g lo
an te
rm (1
0 ye
ars)
incr
easin
g de
bt sh
are
(80%
)
red
ucin
g RO
E (1
2%)
LCO
E (U
SD/k
Wh)
Figure 0-5. Impacts of fiscal and financial support mechanisms on LCOE
Figure 0-6. Impacts of fiscal and financial support mechanisms on equity IRR
11
13.7%
16.3%
15.4%
14.8% 15.0%
15.5%
15.0%
13.7%
12.0%
12.5%
13.0%
13.5%
14.0%
14.5%
15.0%
15.5%
16.0%
16.5%
17.0%
With
bas
elin
e pa
ram
eter
s
with
out d
utie
s and
taxe
s
low
er in
tere
st ra
te (3
%)
low
er c
orpo
rate
tax
(18%
)
inco
me
tax
holid
ay (5
yea
rs)
incr
easin
g lo
an te
rm (1
0 ye
ars)
incr
easin
g d
ebt s
hare
(80%
)
red
ucin
g RO
E (1
2%)
equi
ty IR
R (%
)

LCOE is a measure that is used as a basis in determining the least costly pathway in meeting electricity demand of a utility. The Study’s results reveal that RE technologies already contribute to reducing the costs in fulfilling electricity needs of many AMS. The LCOE study’s results also indicate which RE technologies that require additional support and level or type of support from policy makers in order to make them further competitive with other electricity generating technologies, and to increase market deployment to meet their national targets as well as the regional target of 23% as stipulated in the APAEC 2016-2025.
12

22

T he Association of Southeast Asian Nations (ASEAN)—which comprises Brunei Darussalam, Cambodia, Indonesia, Lao PDR, Malaysia, Myanmar, the Philippines, Singapore, Thailand and Vietnam—is now one of the most dynamic and fastest growing economic regions in the world. In 2014, ASEAN’s gross domestic (GDP) was around USD 2.57
trillion and inhibited by more than 622 million people, of which more than 50% is under 30 years old. This economic and population growth bring both great challenges and opportunities to ensure that energy could be distributed and accessed from clean supplies with affordable prices.
The AMS through the ASEAN Plan of Action for Energy Cooperation (APAEC) 2016-2025 realise the potential of RE and has set an aspirational target of 23% for RE in the Total Primary Energy Supply (TPES) by the year 2025. Renewable energy could be one of the solutions for AMS to fulfil the theme of the APAEC in achieving energy security, accessibility, affordability and sustainability for all. Many AMS have introduced comprehensive regulatory frameworks for renewable energy, including financial incentives such as feed in tariff, tax exemption, subsidies, and revolving fund.
ASEAN region is blessed with huge potential for the use of RE and hence the role of RE becomes more important in a diversified energy mix. However, only small fraction of renewable energy has been developed. In 2014, total installed power capacity of renewable energy in ASEAN, including large hydro power, reached around 51 GW or 26% of total around 197 GW installed power capacity. If the hydropower is excluded, the share of other renewable energy was only 5% in 2014.
The global market for renewable energy in the last decades has shown remarkable growth; one of them due to the significant drop of PV price. The RE deployment, especially in power sector is driven by several factors, including dedicated policy initiatives, the improving cost-competitiveness of renewable technologies, stable investment climate, energy security and environmental concerns, energy demand growing and the need to provide clean and sustainable energy access. The world now adds more renewable power capacity annually than it adds (net) capacity from all fossil fuels combined. By the end of 2015, renewable capacity in place was enough to supply an estimated 23.7% of global electricity, with hydropower providing about 16.6%.1
1 REN 21. Global Status Report 2016
14

Levelised Cost of Electricity, or LCOE, is well-known as one of the measurement tools of the competitiveness of different electricity generation technologies and represented by monetary currency of any costs related to the electricity generation (capital costs, fixed and variable operations and maintenance costs, etc) per 1 unit of electricity generation (USD or other monetary currency/kWh). Referring to recent studies done by other international agencies, there are several RE technologies in the respected countries/regions which now can compete with the conventional fossil fuel based power plants. However, this important study is still very limited in ASEAN region context.
This study is undertaken as one of the contributions of the Renewable Energy Support Programme for ASEAN (ASEAN-RESP), a cooperation between the ASEAN Centre for Energy (ACE) and the Deutsche Gesellschaft für Internationale Zusammenarbeit (GIZ) GmbH, to the achievement of APAEC 2016-2025 to enhance energy connectivity and market integration in ASEAN to achieve energy security, accessibility, affordability and sustainability for all.
The study aims to review the levelised cost of electricity (LCOE) of 3 RE technologies and to identify necessary policies to bring the fair competition between RE and conventional fossil fuel based power plants in the AMS. The specific objective of the study are the following:
a. To review the main parameters influencing the LCOE in AMS
b. To analyse and review on LCOE of RE technologies in AMS
c. To advice the necessary policies for obtaining significant competitive level of LCOE of RE technologies compared to conventional fossil fuel based power plant in AMS
METHODOLOGYSelection of RE Technologies
The study focuses on three RE technologies in the AMS: solar PV, biomass and hydropower. These technologies were selected based on a selection criteria that were specifically developed for this study.
To be relevant and inclusive, the study strives to, i) cover most recent projects that are implemented in the AMS, ii) comprise, as much as possible, most of the AMS, and iii) focus on emerging technologies that has potential for regional deployment.
15
2 IEA/NEA/OECD 2010
In selecting the priority technologies, 4 evaluation criteria were used and these are: i) resource potential, ii) government targets, iii) policy and regulatory frameworks, and iv) the total installed capacity in the past 3 years. In addition, a scoring scheme was established to rank candidate renewable energy projects.
The RE technology evaluation results ranked solar PV, biomass and small hydropower to be the priority projects for this study.
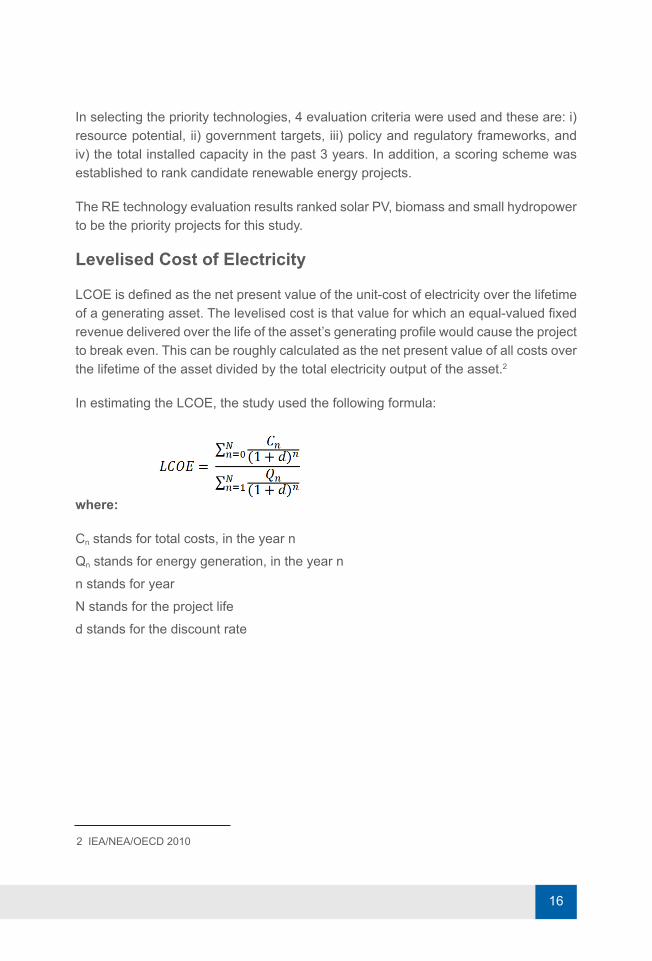
Levelised Cost of Electricity
LCOE is defined as the net present value of the unit-cost of electricity over the lifetime of a generating asset. The levelised cost is that value for which an equal-valued fixed revenue delivered over the life of the asset’s generating profile would cause the project to break even. This can be roughly calculated as the net present value of all costs over the lifetime of the asset divided by the total electricity output of the asset.2
In estimating the LCOE, the study used the following formula:
where:
Cn stands for total costs, in the year nQn stands for energy generation, in the year nn stands for yearN stands for the project lifed stands for the discount rate
16
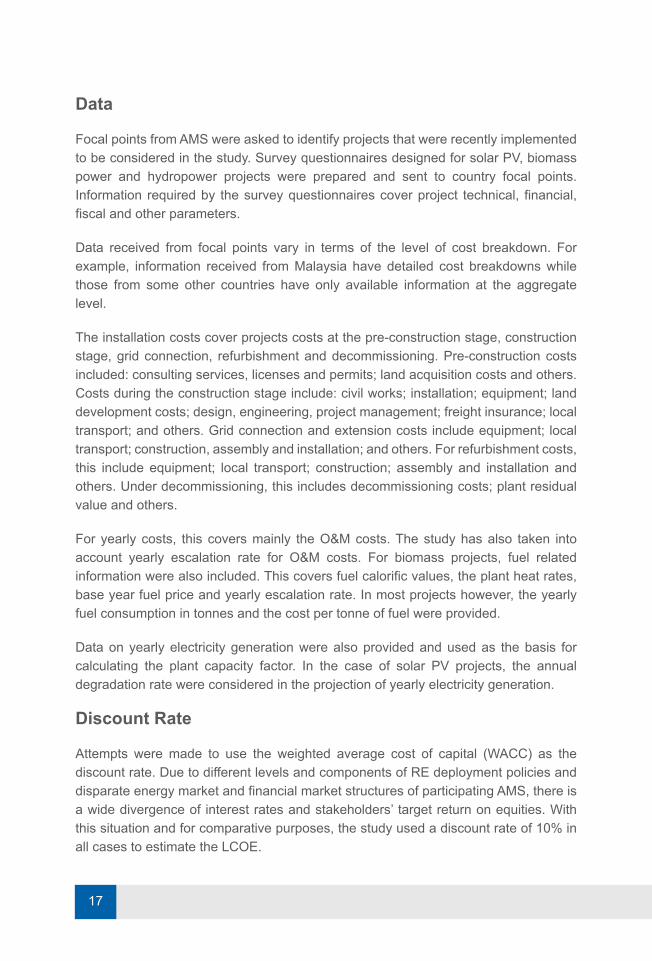
Data
Focal points from AMS were asked to identify projects that were recently implemented to be considered in the study. Survey questionnaires designed for solar PV, biomass power and hydropower projects were prepared and sent to country focal points. Information required by the survey questionnaires cover project technical, financial, fiscal and other parameters.
Data received from focal points vary in terms of the level of cost breakdown. For example, information received from Malaysia have detailed cost breakdowns while those from some other countries have only available information at the aggregate level.
The installation costs cover projects costs at the pre-construction stage, construction stage, grid connection, refurbishment and decommissioning. Pre-construction costs included: consulting services, licenses and permits; land acquisition costs and others. Costs during the construction stage include: civil works; installation; equipment; land development costs; design, engineering, project management; freight insurance; local transport; and others. Grid connection and extension costs include equipment; local transport; construction, assembly and installation; and others. For refurbishment costs, this include equipment; local transport; construction; assembly and installation and others. Under decommissioning, this includes decommissioning costs; plant residual value and others.
For yearly costs, this covers mainly the O&M costs. The study has also taken into account yearly escalation rate for O&M costs. For biomass projects, fuel related information were also included. This covers fuel calorific values, the plant heat rates, base year fuel price and yearly escalation rate. In most projects however, the yearly fuel consumption in tonnes and the cost per tonne of fuel were provided.
Data on yearly electricity generation were also provided and used as the basis for calculating the plant capacity factor. In the case of solar PV projects, the annual degradation rate were considered in the projection of yearly electricity generation.
Discount Rate
Attempts were made to use the weighted average cost of capital (WACC) as the discount rate. Due to different levels and components of RE deployment policies and disparate energy market and financial market structures of participating AMS, there is a wide divergence of interest rates and stakeholders’ target return on equities. With this situation and for comparative purposes, the study used a discount rate of 10% in all cases to estimate the LCOE.
17
27
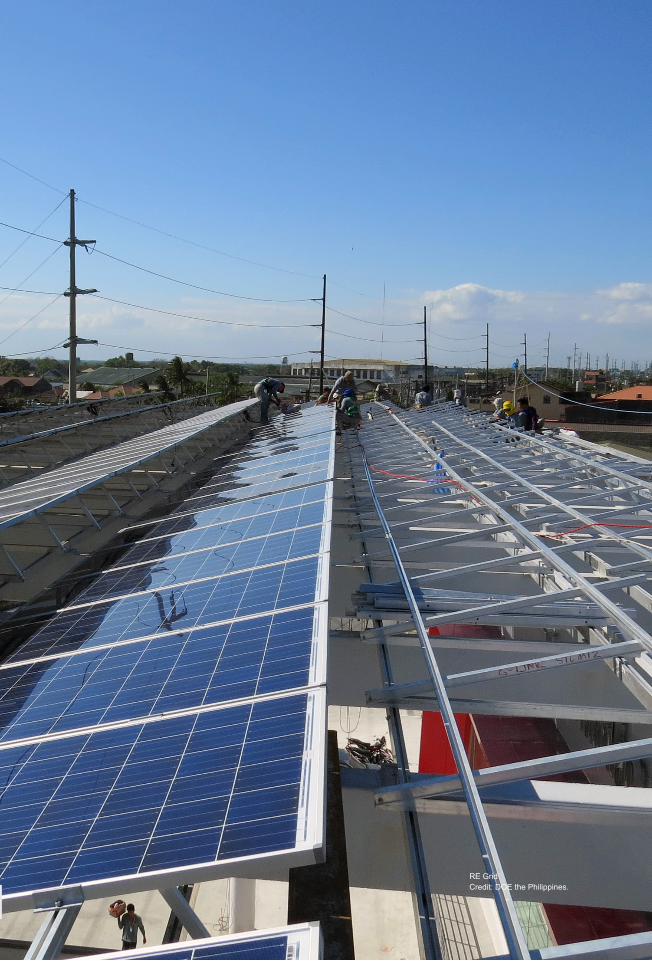
RE GridCredit: DOE the Philippines.

28

T he study evaluated the key costs and technical parameters used in estimating levelised costs of electricity for 32 solar PV projects, 9 biomass power projects and 23 hydropower projects from 6 AMS.
In terms of average installation costs (capital costs divided by installed capacity), solar PV has the highest mean value at USD 2.35 per W,
followed by biomass at USD 2.13 per W while hydropower has the lowest average at USD 2.14 per W. This is shown in Figure 2-1. There is a wide dispersion of values from the project samples from the AMS as also shown in the same Figure below. For solar PV for example, the highest installation costs from the set of projects is USD 7.14 per W. For biomass and hydropower projects, their lowest values are USD 0.10 per W and USD 0.85 per W, respectively. It is interesting to note that the average installed cost of solar PV is relatively closer to those of biomass and hydropower projects.
2.3482.14
2.132.096
2.36
1.841.433
0.1
0.85
7.143
4.02
4.68
0
1
2
3
4
5
6
7
8
Inst
alle
d C
osts
(USD
per
W)
Mean
Median
Min
Max
solar biomass hydropower
Figure 2-1. Installation costs (USD per W) (2014 Prices)
20
Leve
lised
Cos
t (US
D p
er W
)

For operations & maintenance (O&M) as percentage of the capital costs, solar PV has the lowest with an average of 1% while hydropower projects have an average value double of that of solar PV (1.7%). Biomass power has the highest share at 6.4%. This is shown in Figure 2-2.
Among the RE technologies considered, as expected, solar PV has the lowest capacity factor with an average value of 15.5% (Figure 2-3). The highest solar PV capacity factor value from the set of projects is 18.4%. On the other hand, biomass power has the highest average capacity factor of 80.1%. Its highest value is almost 92%. Hydropower projects considered in the Study have an average capacity factor of above 60%. One of the hydro projects in the sample has a capacity factor of 85%.
0.154
0.801
0.637
0.155
0.80.691
0.108
0.63
0.36
0.184
0.9170.85
0
0.1
0.2
0.3
0.4
0.5
0.6
0.7
0.8
0.9
1
Cap
acity
Fac
tor (
%)
Mean
Median
Min
Max
solar biomass hydropower
Figure 2-3. Capacity Factor
21
Figure 2-2. O&M Costs
1.0%
6.4%
1.7%1.0%
5.6%
1.5%0.0% 0.2% 0.9%
3.6%
19.4%
3.4%
0.0%
5.0%
10.0%
15.0%
20.0%
25.0%
O&
M C
ost (
% c
apita
l cos
t)
Mean
Median
Min
Max
solar biomass hydropower
0.02%
3.4%1.7%
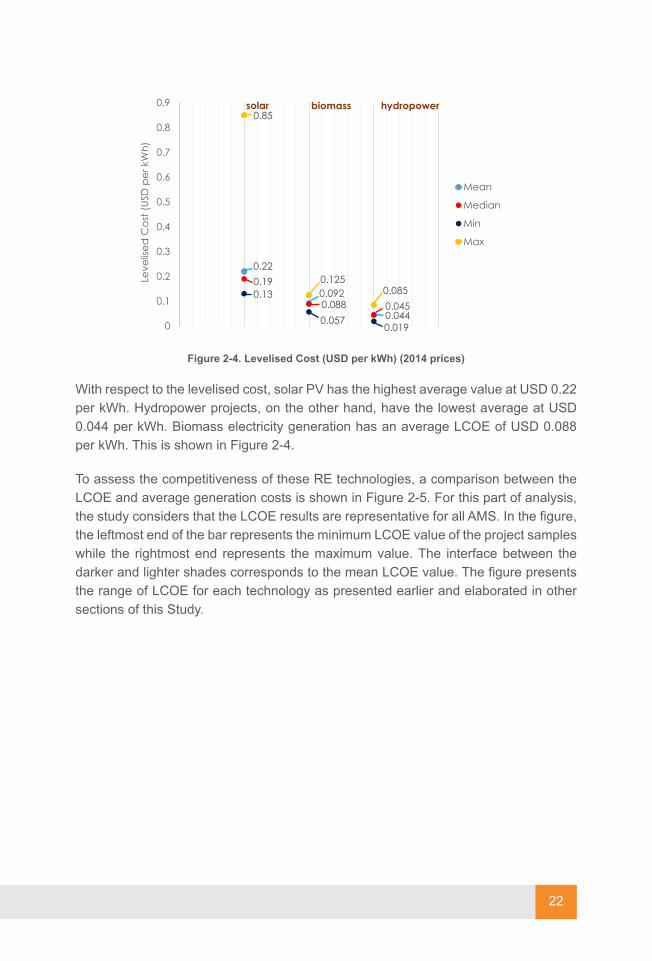
With respect to the levelised cost, solar PV has the highest average value at USD 0.22 per kWh. Hydropower projects, on the other hand, have the lowest average at USD 0.044 per kWh. Biomass electricity generation has an average LCOE of USD 0.088 per kWh. This is shown in Figure 2-4.
To assess the competitiveness of these RE technologies, a comparison between the LCOE and average generation costs is shown in Figure 2-5. For this part of analysis, the study considers that the LCOE results are representative for all AMS. In the figure, the leftmost end of the bar represents the minimum LCOE value of the project samples while the rightmost end represents the maximum value. The interface between the darker and lighter shades corresponds to the mean LCOE value. The figure presents the range of LCOE for each technology as presented earlier and elaborated in other sections of this Study.
22
Figure 2-4. Levelised Cost (USD per kWh) (2014 prices)
0.22
0.092
0.044
0.19
0.088 0.0450.13
0.0570.019
0.85
0.1250.085
0
0.1
0.2
0.3
0.4
0.5
0.6
0.7
0.8
0.9
Leve
lized
Cos
t (US
D p
er k
Wh)
Mean
Median
Min
Max
solar biomass hydropower
Leve
lised
Cos
t (US
D p
er k
Wh)

The average generation cost of Malaysia’s TNB in 2014 was USD 0.073 per kWh3 . This is the average cost of the portfolio of all electricity generation plants including those purchased from independent power producers (IPPs). Using this as the reference rate, only hydropower projects have LCOE values lower than this average. It must be noted however that Malaysia’s fuel supply cost is partly subsidised by the government hence TNB’s average generation cost does not represent a competitive market price.
Indonesia’s PLN (state owned utility) had an average generation cost of USD 0.109 per kWh in 2014. This is slightly higher than EGAT’s (Thailand’s state owned utility) average sales price of USD 0.096 per kWh. On the other hand, MERALCO’s (the Philippines) generation charge in 2014 amounted to USD 0.120 per kWh. Among these utilities, only in the Philippines that electricity generation is under a competitive market, and that fuel supplies are not subsidised. The average generation cost is
Figure 2-5. Levelised Costs Compared with Generation Costs (2014 prices)
Note: Darker shade–from minimum LCOE value to the mean value. Lighter shade–from mean value to the maximum value.Small-scale solar PV–installed capacity below 100 kWp; medium-scale solar PV–installed capacity between 100 kWp and 1000 kWp; large-scale solar PV–above 1000 kWp.TNB–Tenaga Nasional Berhad, Malaysia. PLN–Perusahaan Listrik Negara, Indonesia. MERALCO–Manila Electric Company, Philippines. EGAT–Electricity Generating Authority of Thailand.
23
3 displaced cost as declared by SEDA Malaysia – reference http://goo.gl/KoaW7P
0 0.2 0.4 0.6 0.8 1 1.2
small solar PV
medium solar PV
large solar PV
biomass
hydropower
Levelised Cost (USD/kWh)
2014 (in USD/kWh)
TNB av erage gen cost: 0.073 (blue line)PLN av erage gen cost: 0.109 (green line)PLN diesel gen cost: 0.259 (red line)
PLN gas turbine gen cost: 0.244PLN CC gen cost: 0.113MERALCO average gen charge: 0.120EGAT av erage sales price: 0.096
FIGURE 0-3 & 2-5
FIGURE 0-4&2-7
0 0.2 0.4 0.6 0.8 1 1.2
small solar PV
medium solar PV
large solar PV
biomass
hydropower
Levelized Cost (USD/kWh)
2014 (in USD/kWh)
TNB average gen cost: 0.073 (blue line)PLN average gen cost: 0.109 (green line)PLN diesel gen cost: 0.259 (red line)
PLN gas turbine gen cost: 0.244PLN CC gen cost: 0.113MERALCO average gen charge: 0.120EGAT average sales price: 0.096
0 0.2 0.4 0.6 0.8 1 1.2
small solar PV
medium solar PV
large solar PV
biomass
hydropower
Levelized Cost (USD/kWh)
2014 average RESIDENTIAL selling price(USD/kWh)
PLN: 0.064 (dark blue line)TNB: 0.095 (green line)EGAT: 0.136 (red line)Singapore Power: 0.176 (orange line)MERALCO: 0.249 (light blue line)

however not only influenced by fuel subsidies but also by electricity generation mix and whether the fuel is domestically sourced or imported. Nevertheless, taking the USD 0.120 per kWh as the average unsubsidised generation cost, as shown in Figure 2-5, only hydropower and some biomass electricity generation projects had reached ‘grid’ parity in ASEAN. In this context, grid parity is defined as the LCOE of an RE project equals the average price the utility is paying to various power generators or the average cost the utility is incurring from their own generating facilities.
The average generation cost of conventional power technologies of Indonesia’s PLN in 2014 is also shown in the above figure. Combined cycle power plants had an average generation cost of USD 0.113 per kWh while those from gas turbine and diesel electricity generation were USD 0.244 per kWh and USD 0.259 per kWh. With this, a number of solar PV generation projects from all capacity sizes were already competitive with gas turbine generation and diesel electricity generation.
Figure 2-6. Medium Solar PV LCOE compared with Average COMMERCIAL Selling Prices
Note: Darker shade–from minimum LCOE value to the mean value. Lighter shade–from mean value to the maximum value.Small-scale solar PV–installed capacity below 100 kWp; medium-scale solar PV–installed capacity between 100 kWp and 1000 kWp; large-scale solar PV–above 1000 kWp.
24
0 0.2 0.4 0.6 0.8 1 1.2
small solar PV
medium solar PV
large solar PV
biomass
hydropower
Levelised Cost (USD/kWh)
2014 av erage COMMERCIAL selling price(USD/kWh)
PLN: 0.095 (dark blue line)TNB: 0.137 (green line)EGAT: 0.126 (red line)Singapore Power: 0.161 (orange line)MERALCO: 0.220 (light blue line)
FIGURE 2-6
0 0.2 0.4 0.6 0.8 1 1.2
small solar PV
medium solar PV
large solar PV
biomass
hydropower
Levelized Cost (USD/kWh)
2014 average COMMERCIAL selling price(USD/kWh)
PLN: 0.095 (dark blue line)TNB: 0.137 (green line)EGAT: 0.126 (red line)Singapore Power: 0.161 (orange line)MERALCO: 0.220 (light blue line)

Figure 2-7. Small Solar PV LCOE compared with Average RESIDENTIAL Selling Price
Grid-tied medium-scale and small-scale solar PV projects are connected at the low voltage level (consumption level) as opposed to large-scale solar PV projects that are connected at high or medium voltage levels. It is therefore appropriate to compare these technologies with consumption costs rather than generation costs.
Figure 2-6 shows the average selling prices of electricity for the commercial sector by selected utilities in ASEAN. MERALCO has the highest average rate at USD 0.220 per kWh in 2014 while PLN has the lowest at USD 0.095 per kWh. TNB, EGAT and Singapore Power had average selling prices between USD 0.100 per kWh and USD 0.200 per kWh. To some extent, medium-scale projects had reached ‘socket’ parity in Malaysia, the Philippines and Singapore.
A similar comparison was carried out for small-scale solar PV projects with average residential selling prices in selected ASEAN utilities. As shown in Figure 2-7, PLN, TNB and EGAT had average selling prices for residential customers lower than the minimum LCOE in the project samples. On the other hand, the figure also shows that small-scale solar PV projects had reached ‘socket’ parity in Singapore and the Philippines. In this context, socket parity is defined as the LCOE of the small-scale systems. More specifically; solar PV equals the average price the consumer is paying to the distribution utility.
25
0 0.2 0.4 0.6 0.8 1 1.2
small solar PV
medium solar PV
large solar PV
biomass
hydropower
Levelised Cost (USD/kWh)
2014 av erage RESIDENTIAL selling price(USD/kWh)
PLN: 0.064 (dark blue line)TNB: 0.095 (green line)EGAT: 0.136 (red line)Singapore Power: 0.176 (orange line)MERALCO: 0.249 (light blue line)
FIGURE 0-3 & 2-5
FIGURE 0-4&2-7
0 0.2 0.4 0.6 0.8 1 1.2
small solar PV
medium solar PV
large solar PV
biomass
hydropower
Levelized Cost (USD/kWh)
2014 (in USD/kWh)
TNB average gen cost: 0.073 (blue line)PLN average gen cost: 0.109 (green line)PLN diesel gen cost: 0.259 (red line)
PLN gas turbine gen cost: 0.244PLN CC gen cost: 0.113MERALCO average gen charge: 0.120EGAT average sales price: 0.096
0 0.2 0.4 0.6 0.8 1 1.2
small solar PV
medium solar PV
large solar PV
biomass
hydropower
Levelized Cost (USD/kWh)
2014 average RESIDENTIAL selling price(USD/kWh)
PLN: 0.064 (dark blue line)TNB: 0.095 (green line)EGAT: 0.136 (red line)Singapore Power: 0.176 (orange line)MERALCO: 0.249 (light blue line)

Note: Darker shade–from minimum LCOE value to the mean value. Lighter shade–from mean value to the maximum value.Small-scale solar PV–installed capacity below 100 kWp; medium-scale solar PV–installed capacity between 100 kWp and 1000 kWp; large-scale solar PV–above 1000 kWp.TNB–Tenaga Nasional Berhad, Malaysia. PLN–Perusahaan Listrik Negara, Indonesia. MERALCO–Manila Electric Company, Philippines. EGAT–Electricity Generating Authority of Thailand.
26

36

In terms of installation costs, larger solar PV systems have lower installation costs (per kWp) than smaller systems due to econo-mies of scale. Solar PV systems with capacity of 1000 kWp and above have an average cost of USD 2,008 per kWp. Medium scale systems (capacity between 100 kWp and 1000 kWp) have an average installation cost of USD 2048 per kWp while the aver-age value for smaller systems (capacity below 1000 kWp) is USD 2576 per kWp.
There is no distinct pattern for O&M costs as percentage share of the capital cost by capacity size for the project samples from 4 (four) countries. The overall mean is 1.0% of the capital cost.
In a similar way, there is also no prominent pattern that can be observed for capacity factors and project sizes. Projects in Indonesia however have reported higher capacity factors with a mean value of 18.1%, followed by Thailand at 16.5% and Vietnam 15.3%. Malaysian projects have lower capacity factors with mean value of 14.8%.
The same pattern as in the installation costs can be observed for the levelised costs. For all projects analysed, large solar PV systems have the lowest average levelised cost at USD 0.18 per kWh. The average levelised cost for small systems is USD 0.25 per kWh while that of medium size systems is USD 0.20 per kWh.
Among the 4 countries, Vietnam has the highest levelised cost at USD 0.48 per kWh, while Indonesia has the lowest with USD 0.17 per kWh. Malaysia and Thailand have levelised costs of USD 0.18 per kWh and USD 0.21 per kWh respectively.
Solar PV’s LCOE is sensitive to capital cost, capacity factor and discount rate.
KEY FINDINGS
28

3.1 SOLAR PV DEPLOYMENT IN ASEANSolar energy is one of the RE resources that is common in all AMS. The level of solar PV technology deployment however varies from country to country. In the past, solar PV technologies have been mainly deployed in remote off-grid areas as a viable option to provide energy services in isolated communities. More recently, with technological advancement and learning that result in declining system costs and improved performance, coupled with supportive investment policies and regulatory frameworks, grid-tied solar PV electricity generation in the AMS has been increasing.
Solar PV deployment in the AMS has accelerated from 2010 until present. In the aggregate, the total installed capacity has grown from around 60 MW in 2010 to more than 1500 MW in 2014 (Figure 3-1).
The rapid increase in solar PV deployment in ASEAN can be mainly attributed to deployment in Malaysia and Thailand; the first two Member States that introduced solar PV feed-in tariff policies in the AMS. Installed capacities in Malaysia and Thailand alone represent around 95% of the total AMS solar PV capacities in 2014.
The Philippines has also recently introduced solar PV feed-in tariff and the increase in project deployment can be observed only in 2015 and early 2016. The deployment in Singapore has also increased rapidly since 2010 though the absolute volume is smaller compared to those in Malaysia and Thailand. Singapore has introduced non-tariff based incentive mechanisms for rooftop solar PV deployment. A significant increase in solar PV installed capacity between 2010 and 2014 can also be observed in Indonesia. Indonesia has introduced ceiling prices for solar PV electricity generation in 2013.
Figure 3-1. Solar PV Installed Capacity in the AMS
29
20060
200
400
600
800
1000
1200
1400
1600
1800
2007 2008
Inst
alle
d C
apac
ity (M
W)
2009 2010 2011 2012 2013 2014
Brunei DarussalamIndonesiaLao PDRMalaysiaMyanmarPhilippinesSingaporeThailand
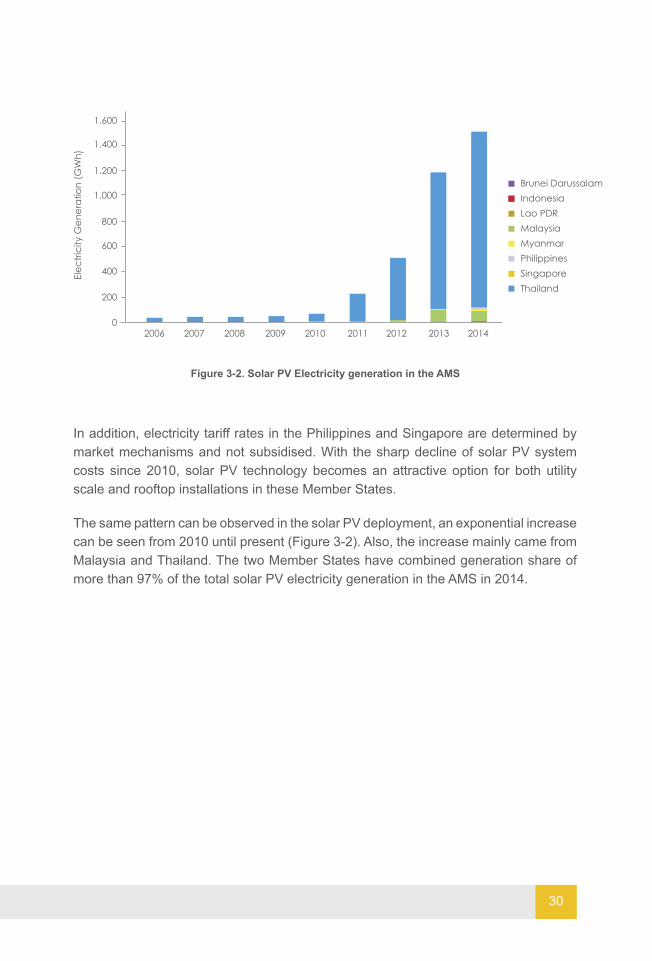
In addition, electricity tariff rates in the Philippines and Singapore are determined by market mechanisms and not subsidised. With the sharp decline of solar PV system costs since 2010, solar PV technology becomes an attractive option for both utility scale and rooftop installations in these Member States.
The same pattern can be observed in the solar PV deployment, an exponential increase can be seen from 2010 until present (Figure 3-2). Also, the increase mainly came from Malaysia and Thailand. The two Member States have combined generation share of more than 97% of the total solar PV electricity generation in the AMS in 2014.
Figure 3-2. Solar PV Electricity generation in the AMS
30
20060
200
400
600
800
1.000
1.200
1.400
1.600
2007 2008
Elec
trici
ty G
ener
atio
n (G
Wh)
2009 2010 2011 2012 2013 2014
Brunei DarussalamIndonesiaLao PDRMalaysiaMyanmarPhilippinesSingaporeThailand

3.2 SOLAR PV PROJECTSA total of 32 solar PV projects implemented in 4 participating AMS were analysed in the Study. Almost two-thirds of these projects are from Malaysia while the remaining share are from Indonesia, Thailand and Vietnam. Projects were classified into small (capacity below 100 kWp), medium (capacity above 100 kWp but below 1000 kWp) and large (capacity above 1000 kWp). In terms of capacity, more than one-half of the total samples are small while medium and large scale projects have almost the same number of samples. This is shown in Table 3-1.
Table 3-1. Number of projects by AMS, by capacity size category
31
AMS
Number of Projects Analysed
Below 100 kWp
Above 100 kWp but below 1000
kWp
1000 kWp and above Total
small medium largeIndonesia (ID) - - 2 2Malaysia (MY) 12 6 3 21Thailand (TH) 3 - 2 5Vietnam (VN) 2 1 1 4TOTAL 17 7 8 32

Figure 3-3. Breakdown of costs for utility-scale solar PV projects in Indonesia
32
3.3 INSTALLATION COSTSCost Breakdown
Installation costs cover project costs incurred from the pre-construction, installation and grid connection stages. Among the countries, only projects from Indonesia and Malaysia have provided detailed information of costs. Projects from Indonesia are utility-scale projects while those from Malaysia cover systems up to 1 MWp capacity.
The breakdown of costs for Indonesian projects are shown in Figure 3-3 while those for Malaysian projects in Figure 3-4. The comparison of smaller and larger projects in Indonesia shows that the share of grid-connection costs, transportation, installation and consulting services with respect to the total project costs are higher in larger projects. On the other hand, those of equipment (PV module, inverters, mounting structure and balance of system), civil works and land acquisition and development are higher in smaller projects. In general, the equipment cost represents the biggest share accounting between 60% and 75%.
2 MWp 5 MWp
1.1%7.7%4.3%
8.7%0.4%
0.9%
70.4%61.7%
4.3%7.1%9.3%4.0%
6.5% 4.5%3.7% 5.4%
Grid connection costsTransport and Freight InsuranceDesign, Engineering, Project ManagementEquipment (module + BOS + others)Installation (labor, electrical, PV system)Civil worksLand acquisition and developmentConsulting services, Licences and Permits

For the Malaysian projects, some of the trends in the Indonesian projects are similar such as the share of grid-connection costs and consulting services are higher in larger systems than those from roof-mounted smaller systems. Installation costs and design, engineering and project management costs have however higher shares in roof-mounted systems than in ground-mounted systems. In terms of the share of the equipment (PV module, inverters, mounting structure and balance of system), the comparison between large and small systems may not be appropriate and this may perhaps vary from project to project and that the equipment costs share may range between 65% to 80%. The data for Malaysia come from 21 sample projects.
The details of equipment costs are shown in Figure 3-5. PV modules account for the biggest share ranging from 55% to 65%. The shares of inverter cost, energy meters and protection systems are however declining as the system becomes larger. On the other hand, the shares of PV mounting structures and balance of system are increasing with increasing system sizes.
Figure 3- 4. Breakdown of costs for solar PV projects in Malaysia
Note: average of 3 projects for systems below 10 kWp; average of 9 projects for systems above 10 kWp and below 100 kWp; average of 6 projects for systems above 100 kWp and below 1000 kWp; average of 3 projects for 1000 kWp systems.
33
below10 kWp
above 10below
100 kWp
above 100below
1000 kWp
1000 kWp
1.6% 1.8% 4.8%
10.4%1.9% 3.3% 0.6%0.7%3.7% 5.0% 2.8%1.0%
72.4% 68.1% 74.9% 66.8%
18.1% 18.7%10.5%
4.5%
1.3%1.2%
1.0% 1.0% 0.03%1.9%
1.5% 2.3% 5.2%13.5%
Grid connection costsTransport and Freight InsuranceDesign, Engineering, Project ManagementEquipment (module + BOS + others)Installation (labor, electrical, PV system)Civil worksLand acquisition and developmentConsulting services, Licences and Permits

Installation Costs
The project installation costs were estimated by dividing the capital costs with the total installed capacity. Capital costs for ground mounted systems include land costs. For some countries, detailed breakdown of costs were provided but only total values were given for other countries. Hence, the total costs are all-in costs which directly take into account all the policy and fiscal incentives that were introduced to promote the deployment of renewable energies in each AMS. The results are shown in Table 3-2.
Figure 3-5. Breakdown of solar PV equipment cost in Malaysia
Note: average of 3 projects for systems below 10 kWp; average of 9 projects for systems above 10 kWp and below 100 kWp; average of 6 projects for systems above 100 kWp and below 1000 kWp; average of 3 projects for 1000 kWp systems.
1.2MW Tenaga Surya, Brunei Darussalam.Credit: EIDPMO
34
below10 kWp
above 10below
100 kWp
above 100below
1000 kWp
1000 kWp
2.3% 3.4% 3.4% 7.5%7.5% 4.2% 4.1% 2.2%3.8% 1.1% 0.8% 0.3%8.4%
7.5% 13.2%19.2%
21.9%20.7%
17.4%14.3%
56.0%63.1%
61.1% 56.6%
Balance of SystemElectrical Protection SystemEnergy MeterPV mounting structure/rool mountingInverterPV module

Country-wise, solar projects in Vietnam have the highest average installation costs. This could be partly explained that among the AMS participating in the Study, only Vietnam has no specific policy that provides incentives to private sector to invest in solar PV projects. The current projects are mostly demonstration projects. The costs for solar PV systems with capacity below 1 MWp is more than USD 5000 per kWp. This is shown in Figure 3-6. Installation costs in Thailand and Indonesia are within the comparable range of around USD 2000 per kWp though projects in Malaysia are in the lower end of this range. Projects in Malaysia, on average, have the lowest installation costs at lower than USD 2000 per kWp. This reflects the level of competitiveness in Malaysia as manifested by the current rates of feed-in tariff in the country.
Table 3-2. Solar PV installation costs in selected AMS countries (USD per kWp) (2014 prices)
35
AMS
Below 100 kWp
Above 100 kWp but
below 1000 kWp
1000 kWp and above Overall
small medium large Mean Values
Indonesia (ID) 2069 2069Malaysia (MY) 2104 1906 1682 1987Thailand (TH) 2301 2478 2372Vietnam (VN) 5821 5000 1926 4642
OVERALLMean 2576 2348 2008 2384Median 2168 2130 1963 2096Min 1750 1433 1465 1433Max 7143 5000 2957 7143

In terms of project sizes, the trend in general shows that smaller systems have higher installation costs than bigger systems in Indonesia, Malaysia and Vietnam. In the case of Thailand, due to limited number of samples, the average installed cost of large-scale projects is influenced by 1 sample with cost above the current normal range (see Figure 3-7).
For small scale systems (capacity below 100 kWp) the average installation cost is above USD 2500 per kWp, medium scale systems (capacity above 100 kWp but below 1000 kWp) have an average slightly higher than USD 2300 per kWp, while large scale systems (with installed capacity of more than 1 MWp) have costs higher than USD 2000 per kWp. This is shown in Table 3-2, Figure 3-6 and Figure 3-7.
This study also estimated the overall mean, median, minimum and maximum values of installation costs and these are shown in Table 3-2. The overall mean value is USD 2348 per kWp while the median value is USD 2096 per kWp. The minimum value is USD 1433 per kWpwhich is represented by one project in Malaysia and the maximum value is USD 7143 per kWp which is the value of one project in Vietnam. These are shown in the same table above.
Figure 3-6. Installation costs for small and medium sized systems (installed capacity below 1000 kWp) (2014 prices)
36
0
1000
2000
3000
4000
5000
6000
7000
8000
- 100 200 300 400 500
Inst
alle
d co
st (U
SD/k
Wp)
Capacity (kWp)
Indonesia
Thailand
Vietnam
MalaysiaVietnamThailandMalaysiaIndonesia
Inst
alla
tion
Cos
t (US
D/k
Wp)
(18 projects) (3 projects) (3 projects)

Figure 3-7. Installation costs for large-scale systems (capacity higher than 1000 kWp) (2014 prices)
3.4 O&M COSTSThe project O&M costs were estimated as the percentage of capital costs. The average and the median values for the O&M are both 1.0% of the capital cost as shown in Table 3-3. The minimum value is 0.02% while the maximum value is 3.6%.
Table 3-3. Solar PV O&M costs in selected AMS
37
0
500
1000
1500
2000
2500
3000
3500
0 5000 10000 15000 20000 25000
Inst
alle
d C
ost (
USD
/kW
p)
Capacity (kWp)
Indonesia
Thailand
Vietnam
Malaysia
VietnamThailandMalaysiaIndonesia
Inst
alla
tion
Cos
t (US
D/k
Wp)
AMS
Below 100 kWp
Above 100 kWp but
below 1000 kWp
1000 kWp and above Overall
small medium large Mean Values
Indonesia (ID) 1.2% 1.2%Malaysia (MY) 1.1% 0.5% 1.5% 0.9%Thailand (TH) 1.0% 1.3% 1.2%Vietnam (VN) 2.6% 0.5% 0.5% 1.7%
OVERALLMean 1.3% 0.5% 1.1% 1.0%Median 1.0% 0.4% 1.1% 1.0%Min 0.4% 0.02% 0.1% 0.02%Max 3.6% 1.15% 2.1% 3.6%

Environment Energy Solar, the Philippines.Credit: ASEC
38

Unlike installation costs, there is no pronounced pattern that can be observed in solar PV O&M costs in selected projects from AMS. In Vietnam, small systems (below 100 kWp) have higher average O&M costs than larger systems while it appears to be the reverse for Malaysia and Thailand. Vietnam has the highest average of O&M costs at 1.7%, followed by both Indonesia and Thailand with 1.2%. Malaysia has the lowest average O&M costs at 0.9%.
The minimum O&M costs are registered in one medium-scale project in Malaysia. On the other hand, the highest O&M costs are recorded in projects in Vietnam as well as in Malaysia. Both projects have capacities below 100 kWp. This can be observed in Figure 3-8.
Figure 3-8. O&M costs for selected small and medium scale projects (installed capacity below 1000 kWp)
Figure 3-9. O&M costs for selected large scale projects (installed capacity above 1000 kWp)
39
0,0%
0,5%
1,0%
1,5%
2,0%
2,5%
3,0%
3,5%
4,0%
- 100 200 300 400 500
O&
M C
ost (
%of
CA
PEX)
Installed Capacity (kWp)
Indonesia
Thailand
Vietnam
MalaysiaVietnamThailandMalaysiaIndonesia
0,0%
0,5%
1,0%
1,5%
2,0%
2,5%
0 5000 10000 15000 20000 25000
O&
M C
ost (
%of
CA
PEX)
Installed Capacity (kWp)
Indonesia
Thailand
Vietnam
MalaysiaVietnamThailandMalaysiaIndonesia
(18 projects) (3 projects) (3 projects)

3.5 CAPACITY FACTORSThe capacity factor represents the ratio of the solar PV power plant’s actual electricity generation over a period of time, to the potential output if the power plant were to operate at full nameplate capacity. There are various parameters therefore that can affect the capacity factor of the solar PV power plant such as the average annual irradiation, installation of tracking systems, tilt angle for fixed systems, etc. The projects analysed in this study are however fixed mounted systems.
The average capacity factor for projects analysed in this study amounts to 15.4%, while the median value is 15.5%. The minimum recorded value is 10.8% while the maximum value is 18.4%.
Cross-country comparisons could have limitations since capacity factors could be influenced by microclimates. The Study’s data however show that projects from Indonesia have the highest capacity factors with an average of 18.1%. This is followed by Thailand with an average value of 16.5% and Vietnam with 15.3%. Malaysia recorded the lowest average capacity factor of 14.8%. This is shown in Table 3-4. This could be partly explained that most projects in Malaysia are roof-mounted systems and that there are limitations in installing the systems into their optimal tilt angles.
Table 3-4. Capacity factors for solar PV plants in selected AMS
40
AMS
Below 100 kWp
Above 100 kWp but
below 1000 kWp
1000 kWp and above Overall
small medium large Mean Values
Indonesia (ID) 18.1% 18.1%Malaysia (MY) 14.8% 14.6% 15.5% 14.8%Thailand (TH) 17.1% 15.5% 16.5%Vietnam (VN) 14.3% 16.7% 16.0% 15.3%
OVERALLMean 15.1% 14.9% 16.3% 15.4%Median 15.7% 15.0% 16.0% 15.5%Min 10.8% 13.8% 13.8% 10.8%Max 17.5% 16.7% 18.4% 18.4%

Due to limited number of samples, a prominent pattern for capacity factors by project size could not be observed. Data from Malaysia which has a better representation of project sizes indicate that smaller systems (below 1000 kWp) have lower capacity factors than larger systems (above 1000 kWp). This can be directly observed in Figure 3-10 and Figure 3-11.
Figure 3-10. Capacity factors for selected small and medium scale projects (installed capacity below 1000 kWp)
Figure 3-11. Capacity factors for selected large-scale projects (installed capacity above 1000 kWp)
41
0,0%2,0%4,0%6,0%8,0%
10,0%12,0%14,0%16,0%18,0%20,0%
- 100 200 300 400 500
Cap
acity
Fac
tor (
%)
Installed Capacity (kWp)
Indonesia
Thailand
Vietnam
Malaysia
VietnamThailandMalaysiaIndonesia
0,0%2,0%4,0%6,0%8,0%
10,0%12,0%14,0%16,0%18,0%20,0%
0 5000 10000 15000 20000 25000
Cap
acity
Fac
tor (
%)
Installed Capacity (kWp)
Indonesia
Thailand
Vietnam
MalaysiaVietnamThailandMalaysiaIndonesia
(18 projects) (3 projects) (3 projects)

3.6 LEVELISED COSTThe levelised cost of electricity was estimated by dividing the present value of project costs with the present value of electricity generation. For all the projects analysed under this study, the average levelised cost is USD 0.22 per kWh with median value of USD 0.19 per kWh. The minimum value of levelised cost is calculated to be USD 0.13 per kWh while the maximum value is USD 0.85 per kWh. These are shown in Table 3-5.
The Study’s results show that small systems have higher levelised costs than bigger systems. This is consistent with results from international studies which could be attributed to PV system’s economies of scale. The results show that small systems have an average levelised cost of USD 0.25 per kWh, medium systems have USD 0.20 per kWh, while large systems have an average levelised cost of USD 0.18 per kWh.
Table 3-5. Levelised cost of electricity for solar PV in selected AMS (USD per kWh) (2014 prices)
The above results also show the regional variations of average LCOE for solar PV systems. Levelised costs of small and medium-sized systems in Vietnam are the highest in the sample. This could be explained that these projects are the first projects in the country and could be considered as pilot demonstration projects. The absence of industry learning and market economies of scale are reflected in these values.
42
AMS
Below 100 kWp
Above 100 kWp but
below 1000 kWp
1000 kWp and above Overall
small medium large Mean Values
Indonesia (ID) 0.17 0.17Malaysia (MY) 0.20 0.17 0.15 0.18Thailand (TH) 0.19 0.24 0.21Vietnam (VN) 0.66 0.41 0.19 0.48
OVERALLMean 0.25 0.20 0.18 0.22Median 0.20 0.17 0.17 0.19Min 0.14 0.13 0.13 0.13Max 0.85 0.41 0.28 0.85

For large-scale projects, Thailand has the highest levelised costs with USD 0.24 per kWh followed by Vietnam with USD 0.19 per kWh and Indonesia with USD 0.17 per kWh. Malaysia has the lowest levelised costs for large systems at USD 0.15 per kWh. This is also shown in Table 3-5. The distribution of levelised costs by project size are shown in Figure 3-12 and Figure 3-13. The lower values in Malaysia also reflects effective feed-in tariff adjustments through the tariff digression rate.
Figure 3-12. Levelised cost of electricity for selected small and medium scale projects (installed capacity below 1000 kWp) (2014 prices)
Figure 3-13. Levelised cost of electricity for selected large scale projects (installed capacity above 1000 kWp) (2014 prices)
43
0,00
0,05
0,10
0,15
0,20
0,25
0,30
0 5000 10000 15000 20000 25000
Leve
lized
Cos
t (US
D/k
Wh)
Installed Capacity (kWp)
Indonesia
Thailand
Vietnam
MalaysiaVietnamThailandMalaysiaIndonesia
Leve
lised
Cos
t (US
D/k
Wh)
0
0,1
0,2
0,3
0,4
0,5
0,6
0,7
0,8
0,9
- 100 200 300 400 500
Leve
lized
Cos
t (US
D/k
Wh)
Installed Capacity (kWp)
Indonesia
Thailand
Vietnam
MalaysiaVietnamThailandMalaysiaIndonesia
Leve
lised
Cos
t (US
D/k
Wh)
(18 projects) (3 projects) (3 projects)

Figure 3-14. Impacts on solar PV LCOE with ±50% change in values of key parameters (percent increase/decrease in LCOE)
Note: 100% increase in annual degradation; ±50% change in capital cost; ±50% change in O&M; ±50% change in capacity factor; ±50% change in discount rate. *capacity factor and LCOE are inversely related – an increase in capacity factor results in a decrease in LCOE.
3.7 SENSITIVITY ANALYSISThe Study carried out a sensitivity analysis to assess the impact of changes in key project parameters to the LCOE. The large-scale system median values for Installation capacity, installation costs, O&M and capacity factors were used in the Study. Around 50% variation in values of key parameters such as capital costs, O&M costs and capacity factor were simulated and the LCOE results were compared for with and without parameter variation cases. The impact is measured as the percentages change in the LCOE.
Figure 3-14 presents the impacts of key changes in the identified project parameters to the LCOE. A 50% increase in capital costs results in 42% increase in LCOE; the same increase in O&M costs results in 5% increase in LCOE, while a 50% increase in capacity factor generates a 32% decline in the LCOE. For annual module degradation, a 100% increase in the reference value results in an increase of 5% in LCOE.
Variations in capital costs, capacity factors and discount rate have bigger impacts on the LCOE among the key parameters, as also shown in Figure 3-14. These parameters are important targets for policy making. Technical and policy measures that reduce capital costs and increase project capacity factors should be pursued with greater priority to improve competitiveness of solar PV projects.
44
0
42%-47%
0
5%-5%
0
-32% 100%
5%
0
37%-32%
capacity factor*
capital cost
annual degradation
O&M cost
discount rate

54

KEY FINDINGSA total of 9 (nine) biomass projects from 5 (five) ASEAN Member States were analysed in the Study.
The average installation costs of the 9 projects is USD 2.14 per W. Indonesia has the lowest installation costs at USD 0.39 per W, while Malaysia has the highest at USD 2.74 per W. Thailand’s installation costs average is USD 2.39 per W.
The average of O&M costs is 6.4% of the capital cost. Projects in Malaysia and Thailand are hovering around this average.
Biomass prices vary from country to country and by type of biomass resource. Prices in Indonesia are relatively high at the range of more than USD 40 per tonne, those in Thailand are above USD 10 per tonne while those in Malaysia ranges between USD 2 to 12 per tonne.
Plant capacity factors slightly vary by country. Projects in Thailand have the lowest capacity factors from 70% below, those in Indonesia have capacity factors between 70% and 80%, and projects in Malaysia have more than 80%. The mean capacity factor is 80%.
The mean LCOE for biomass electricity generation for all the projects is USD 0.092 per kWh. Indonesia has the lowest levelised cost at USD 0.072 per kWh while that of Thailand is USD 0.087 per kWh.
The LCOE of biomass power is sensitive not only to capital costs, discount rate and capacity factors, but also to O&M costs, fuel price and heat rate.
46

4.1 BIOMASS POWER DEPLOYMENT IN ASEANBiomass electricity generations are common in countries with large agricultural and forestry industries. Biomass electricity generation capacity in the 5 (five) AMS has been increasing rapidly during the past 9 (nine) years. The total installed capacity has more than doubled, from 1465 MW to 3481 MW, between 2006 and 2014 (Figure 4-1).
Thailand and Malaysia are the 2 (two) mainstay Member States for biomass electricity generation. In 2014, these 2 Member States accounted for 94% of the total installed biomass electricity generation in the 5 AMS4. An emerging trend can also be observed in the case of the Philippines with biomass electricity generation capacities significantly increasing since 2009.
Rapid deployment of biomass electricity generation technologies could be observed from 2010 until present in Malaysia and Thailand. It is during this period that favourable feed-in tariff rates were introduced in these Member States. In the case of the Philippines, it is only after 2012 that the feed-in tariff rates were set. This could be explained by the biomass resources and biomass electricity generation being competitive with conventional power since the power rates in the Philippines are not subsidised.
The same pattern can be observed in the total biomass electricity generation (Figure 4-2). Malaysia and Thailand accounted for around 99% of the total electricity generation in the 5 AMS in 2014.
47
4 Most existing biomass power plants in Indonesia are utilised for cogeneration on agro-industries (sugar and palm oil mills) to cover their own energy needs. Official data for electricity generation is not available. Therefore, in this report, biomass data for Indonesia is not included

Figure 4-1. Biomass Power Installed Capacity in selected AMS
Figure 4-2. Biomass Electricity generation in selected AMS
48
20060
500,00
1.000,00
1.500,00
2.000,00
2.500,00
3.000,00
3.500,00
4.000,00
2007 2008
Inst
alle
d C
apac
ity (M
W)
2009 2010 2011 2012 2013 2014
CambodiaLao PDRMalaysiaPhilippinesThailand
20060
2.000,00
4.000,00
6.000,00
8.000,00
10.000,00
12.000,00
14.000,00
16.000,00
2007 2008
Elec
trici
ty G
ener
atio
n (G
Wh)
2009 2010 2011 2012 2013 2014
CambodiaLao PDRMalaysiaPhilippinesThailand

4.2 BIOMASS POWER PROJECTSNine biomass power projects were analysed in the Study. Of these, 5 (five) are from Malaysia while Indonesia and Thailand have 2 (two) projects each. The smallest project has the capacity of 1 MW (Indonesia, Thailand) while the biggest has an installed capacity of 15 MW (Indonesia). The installed capacities and biomass fuel types are shown in Table 4-1.
Projects from Indonesia are mainly using oil palm shell as fuel. Various fuel types such as oil palm empty fruit bunch and briquettes, rice husks, municipal garden wastes are used by projects in Malaysia. In Thailand, one project is using oil palm empty fruit bunch and cassava rhizome.
Table 4-1. Biomass projects, capacity and fuel type by country
4.3 INSTALLATION COSTSCosts Breakdown
The total project costs include pre-construction, construction (equipment and installation) and grid connection costs. The cost breakdown for biomass projects in Malaysia and Thailand is shown in Figure 4-3. The figure shows that equipment and installation costs represent the biggest share in the total project costs. In average, equipment costs represent 65% of the total costs while installation costs represent almost 23% of the total.
49
AMS No Capacity (MW) Technology Fuel Type
Indonesia (ID)1 1.0 Oil palm shell2 15.0 Oil palm shell
Malaysia (MY) 1 3.94 Gasifier, generator Oil palm empty fruit bunch briquettes
2 12.0 Boiler, steam turbine Oil palm empty fruit bunch
3 9.95 Boiler, steam turbine Rice husk, wood chips and rice straw
4 12.5 Boiler, steam turbine Oil palm empty fruit bunch5 2.2 Gasifier, generator Municipal garden waste
Thailand (TH) 1 9.9 Boiler, steam turbine, co-generation Oil palm empty fruit bunch
2 1.0 Cassava rhizome
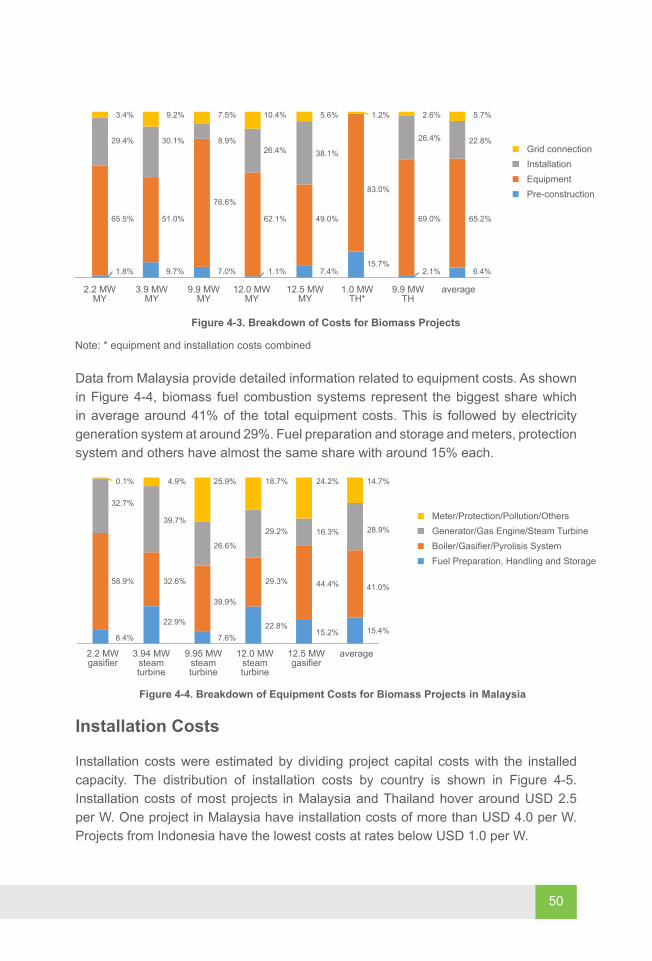
Figure 4-3. Breakdown of Costs for Biomass Projects
Note: * equipment and installation costs combined
Data from Malaysia provide detailed information related to equipment costs. As shown in Figure 4-4, biomass fuel combustion systems represent the biggest share which in average around 41% of the total equipment costs. This is followed by electricity generation system at around 29%. Fuel preparation and storage and meters, protection system and others have almost the same share with around 15% each.
Installation Costs
Installation costs were estimated by dividing project capital costs with the installed capacity. The distribution of installation costs by country is shown in Figure 4-5. Installation costs of most projects in Malaysia and Thailand hover around USD 2.5 per W. One project in Malaysia have installation costs of more than USD 4.0 per W. Projects from Indonesia have the lowest costs at rates below USD 1.0 per W.
Figure 4-4. Breakdown of Equipment Costs for Biomass Projects in Malaysia
50
Grid connectionInstallationEquipmentPre-construction
3.4% 9.2% 7.5% 10.4% 5.6% 1.2% 2.6% 5.7%
29.4% 30.1% 8.9%26.4% 38.1%
26.4% 22.8%
65.5% 51.0%
76.6%
62.1% 49.0%
83.0%
69.0% 65.2%
1.8% 9.7% 7.0% 1.1% 7.4%15.7%
2.1% 6.4%
2.2 MWMY
12.0 MWMY
3.9 MWMY
12.5 MWMY
9.9 MWTH
9.9 MWMY
1.0 MWTH*
average
Meter/Protection/Pollution/OthersGenerator/Gas Engine/Steam TurbineBoiler/Gasifier/Pyrolisis SystemFuel Preparation, Handling and Storage
0.1% 4.9% 25.9% 18.7% 24.2% 14.7%
32.7%
39.7%
26.6%
29.2% 16.3%
58.9% 32.6%
39.9%
29.3% 44.4%
28.9%
8.4%
22.9%
7.6%22.8%
15.2% 15.4%
41.0%
3.94 MWsteamturbine
9.95 MWsteamturbine
12.5 MWgasifier
2.2 MWgasifier
12.0 MWsteamturbine
average

Figure 4-5. Distribution of biomass power installation costs (2014 prices)
On average, Indonesia has the lowest installation costs at USD 0.39 per W, followed by Thailand at USD 2.39 per W, while Malaysia has recorded the highest average at USD 2.74 per W.
The overall average for projects from the 3 (three) AMS is USD 2.14 per W. The median value is USD 2.36 per W. The lowest value is USD 0.10 per W from Indonesia, while the highest installation cost is USD 4.02 per W from a project in Malaysia. This is shown in Table 4-2.
Table 4-2. Biomass Power Installation costs (USD/W) (2014 prices)
51
0,00
0,50
1,00
1,50
2,00
2,50
3,00
3,50
4,00
4,50
0 5 10 15 20
Inst
alle
d co
st (U
SD/W
)
Installed Capacity (MW)
Thailand
Malaysia
IndonesiaThailandMalaysiaIndonesia
Inst
alla
tion
Cos
t (US
D/W
)
Indonesia Malaysia Thailand OVERALLMean 0.39 2.74 2.39 2.14Median 2.36Min 0.10Max 4.02

4.4 O&M COSTSIn this study, the O&M costs were taken as the ratio of the reported annual O&M costs to the project capital costs. The estimated project O&M costs from the 3 AMS are shown in Figure 4-6. The O&M costs of projects in Thailand and Malaysia are within the comparative range hovering around 5% while those of the two projects from Indonesia occupy both the upper and lower extremes.
Malaysia has the lowest average of O&M costs at 5.0% followed by Thailand at 6.5%. Indonesia on the other hand has an average O&M costs of 9.8%. The average of the project samples from the 3 countries is 6.4% while the median is 5.6%. The samples in Indonesia represent the minimum and maximum values at 0.2% and 19.4%, respectively (Table 4-3).
Table 4-3. O&M cost as percentage of capital cost
Figure 4-6. Distribution of O&M costs
52
0,0%
5,0%
10,0%
15,0%
20,0%
25,0%
0 5 10 15 20
O&
M c
ost (
% o
f CA
PEX)
Installed Capacity (MW)
Thailand
Malaysia
IndonesiaThailandMalaysiaIndonesia
Indonesia Malaysia Thailand OVERALLMean 9.8% 5.0% 6.5% 6.4%Median 5.6%Min 0.2%Max 19.4%

4.5 HEAT RATES AND FUEL COSTS
Due to unavailability of individual power plant heat rate, the Study used a proxy indicator to represent the power plant heat rate and captured to some extent power plant efficiency. In this study, this proxy heat rate indicator was estimated as the ratio of fuel consumption in kilograms to net electricity generation in kWh. The distribution of these proxy values are shown in Figure 4-7.
The average heat rate of sample projects from Thailand is 0.53 kg per kWh, Indonesia’s average heat rate is 1.21 kg per kWh while Malaysian projects have an average of 2.11 kg per kWh. The mean value of the total sample projects is 1.56 kg per kWh. The highest value is from Malaysia with 3.70 kg per kWh while the lowest value is from Thailand at 0.50 kg per kWh. This is shown in Table 4 4. It is difficult to compare plant efficiencies from these proxy heat rates since the technologies, fuel types and the physical properties of fuels are disparate.
Fuel prices vary by type of biomass fuel. Oil palm empty shells that are used in Indonesian sample projects cost above USD 44 per tonne. Biomass fuel prices in Thailand are above USD 10 per tonne while those in Malaysia vary widely from as low as USD 2 per tonne for oil palm empty fruit bunch briquettes to almost USD 13 per tonne for municipal garden waste. This is also shown in Table 4 4 and Figure 4-8.
Country variations of fuel prices are also observed in the Study. The cost of oil palm empty fruit bunch for electricity generation in Malaysia is USD 6.41 per tonne while that of Thailand is almost USD 12 per tonne.
Figure 4-7. Distribution of biomass power heat rates
53
0,00
0,50
1,00
1,50
2,00
2,50
3,00
3,50
4,00
0 5 10 15 20
Heat
rate
(kg/
kWh)
Installed Capacity (MW)
Thailand
Malaysia
IndonesiaThailandMalaysiaIndonesia

Table 4-4. Biomass power heat rates and fuel costs
54
0,00
10,00
20,00
30,00
40,00
50,00
60,00
0 5 10 15 20
Biom
ass F
uel P
rice
(USD
/ton
)
Installed Capacity (MW)
Thailand
Malaysia
IndonesiaThailandMalaysiaIndonesia
Figure 4-8. Distribution of biomass fuel prices
AMS No Fuel TypeProxy Heat Rate
Indicator(kg/kWh)
Fuel Price per Tonne
(USD/tonne)
Indonesia (ID)
1 Oil palm shell 1.23 44.122 Oil palm shell 1.23 47.79
Average 1.21 45.96
Malaysia (MY)
1 Oil palm empty fruit bunch briquettes 1.06 2.05
2 Oil palm empty fruit bunch 2.86 6.413 Rice husk, wood chips and
rice straw 1.59 6.41
4 Oil palm empty fruit bunch 3.70 6.415 Municipal garden waste 1.33 12.82
Average 2.11 6.82
Thailand (TH)
1 Oil palm empty fruit bunch 0.56 11.672 Cassava rhizome 0.50 13.22
Average 0.53 12.45
OVERALL
Mean 1.56 16.77Median 1.23 11.67Minimum 0.50 2.05Maximum 3.70 47.79

4.6 CAPACITY FACTORCapacity factors of the biomass power plant projects from the 3 (three) AMS are shown in Figure 4-9. A distinct pattern of capacity factors can be observed from the project samples. Projects in Malaysia have capacity factors between 80% and 90%. Those in Indonesia are between 70% and 80%, while projects in Thailand have capacity factors between 60% and 70%.
Malaysia has the highest average capacity factor at 87.1%, followed by Indonesia at 76.0%, while Thailand’s average is the lowest at 66.5% (Table 4-5). The average capacity factor of all projects from the AMS is 80.1%, while the median value is 80.0%. The lowest value is represented by a project in Thailand at 63.0%, while the highest rate is 91.7% from a project in Malaysia.
Table 4-5. Biomass power plant capacity factors
Figure 4-9. Distribution of biomass power plant capacity factors
55
0,0%
10,0%
20,0%
30,0%
40,0%
50,0%
60,0%
70,0%
80,0%
90,0%
100,0%
0 5 10 15 20
Cap
acity
Fac
tor (
%)
Installed Capacity (%)
Thailand
Malaysia
IndonesiaThailandMalaysiaIndonesia
0,000
0,020
0,040
0,060
0,080
0,100
0,120
0,140
0 5 10 15 20
Leve
lized
Cos
t (US
D/k
Wh)
Installed Capacity (MW)
Thailand
Malaysia
IndonesiaThailandMalaysiaIndonesia
Indonesia Malaysia Thailand OVERALLMean 76.0% 87.1% 66.5% 80.1%Median 80.0%Min 63.0%Max 91.7%

4.7 LEVELISED COSTSThe levelised costs of the analysed projects from the 3 AMS are shown in Figure 4-10. The distribution shows that, except for an outlier sample from Indonesia, levelised costs of biomass power range between USD 0.080 per kWh and USD 0.120 per kWh. Levelised costs of project samples from Malaysia are spread within this range while those from Thailand are within the band of USD 0.080 per kWh and USD 0.100 per kWh. The variation of levelised costs from projects in Indonesia is wide from slightly below USD 0.060 per kWh to slightly below USD 0.100 per kWh.
Malaysia’s average production cost is the highest at USD 0.101 per kWh, followed by Thailand at USD 0.087 per kWh, while Indonesia has the lowest with USD 0.079 per kWh. This is shown in Table 4-6. The production cost average for all the project samples is USD 0.092 per kWh, while the median value is USD 0.088 per kWh. The minimum value is USD 0.057 per kWh from one project in Indonesia, while the highest value is USD 0.125 per kWh from a project in Malaysia.
Table 4-6. Levelised cost of biomass electricity generation (USD per kWh) (2014 prices)
Figure 4-10. Distribution of biomass power levelised cost (2014 prices)
56
0,000
0,020
0,040
0,060
0,080
0,100
0,120
0,140
0 5 10 15 20
Leve
lized
Cos
t (US
D/k
Wh)
Installed Capacity (MW)
Thailand
Malaysia
IndonesiaThailandMalaysiaIndonesia
Leve
lised
Cos
t (US
D/k
Wh)
Indonesia Malaysia Thailand OVERALLMean 0.076 0.101 0.087 0.092Median 0.088Min 0.057Max 0.125

4.8 SENSITIVITY ANALYSISA sensitivity analysis was carried out to assess the impacts of the variations of key parameters on LCOE. A representative biomass electricity generation plant was established using the median values for the installed capacity, installation cost, capacity factor, O&M cost, heat rate, fuel price and fuel price escalation rate. A ±50% variation in values of key parameters such as capital cost, O&M cost, capacity factor, fuel price, heat rate and discount rate were simulated and the LCOE results were compared for with and without parameter variation cases. The impact is measured as the percentage change in the LCOE.
The impacts of the variation of each parameter on LCOE are shown in Figure 4-11. Similar to solar PV projects discussed in the previous section, capital cost, capacity factors and discount rates are important parameters that influence the value of LCOE. In addition, the analysis also shows that O&M cost, fuel price and heat rates are similarly important parameters that have bigger impacts in the calculation of the LCOE.
Capacity factor and heat rate are inversely related to LCOE. A 50% increase in capacity factor reduces the LCOE by 24%. The same level of increase in heat rate value generates a 10% decline in LCOE. On the other hand, capital costs, O&M and fuel price are directly related to LCOE. A 50% increase in capital cost results an increase of 24% in LCOE. A similar percentage increase in fuel price gives rise to LCOE by 14%.
Tapioca Starch PlantCredit: GIZ Indonesia
57
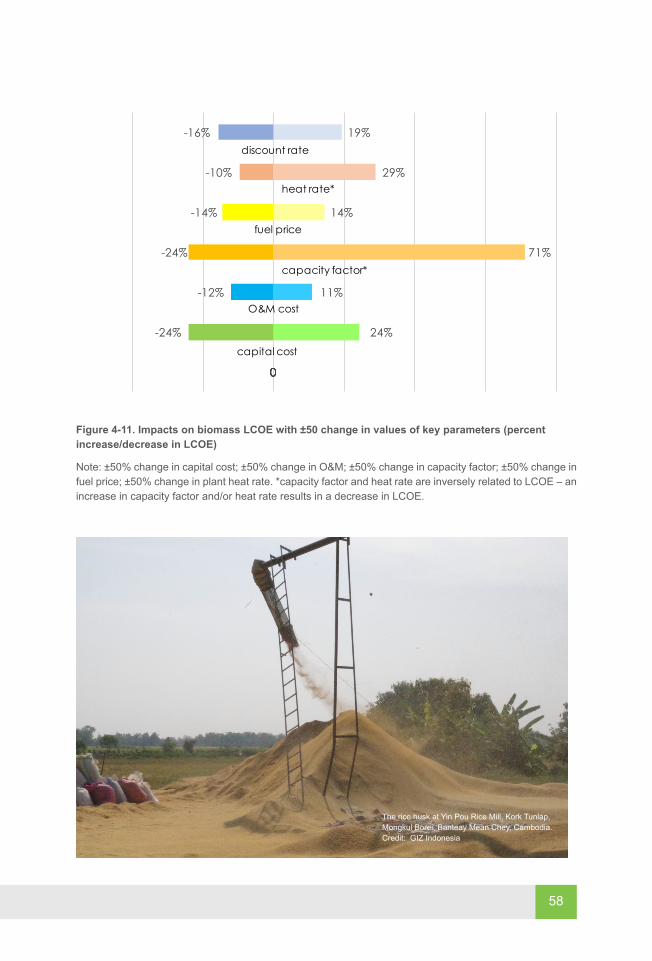
Figure 4-11. Impacts on biomass LCOE with ±50 change in values of key parameters (percent increase/decrease in LCOE)
Note: ±50% change in capital cost; ±50% change in O&M; ±50% change in capacity factor; ±50% change in fuel price; ±50% change in plant heat rate. *capacity factor and heat rate are inversely related to LCOE – an increase in capacity factor and/or heat rate results in a decrease in LCOE.
The rice husk at Yin Pou Rice Mill, Kork Tunlap, Mongkul Borei, Banteay Mean Chey, Cambodia.Credit: GIZ Indonesia
58
0
24%-24%
0
11%-12%
0
-24% 71%
14%-14%
0
-10% 29%
0
19%-16%
capacity factor*
heat rate*
discount rate
fuel price
O&M cost
capital cost

68
KEY FINDINGSA total of 23 small hydropower projects from 6 AMS were analysed in the study.
Installation costs of most of these projects range between USD 1.0 – 3.5 per kW. The average installation cost is USD 2.13 per kW. Vietnam has the lowest average installation cost at USD 1.51 per kW while Thailand has the highest at USD 4.06 per kW. Average installation costs in Myanmar, Lao PDR and Indonesia are below USD 2.0 per kW while Malaysia has an average value of USD 2.64 per kW.
O&M cost of most projects hover between 1% and 3.5% with an average value of 1.7%. O&M costs of projects from Indonesia and Malaysia hovers at the upper range with mean values of 2.7% and 2.1% respectively. Those in Vietnam, Lao PDR, Myanmar and Thailand are within the lower range with country mean values of 1.4%, 1.6%, 1.1% and 1.1% respectively.
Capacity factors of the projects range between 30% and 90% with mean value of 63.7%. Projects in Myanmar, Malaysia and Thailand have capacity factors above 65%. Those in Lao PDR and Vietnam have capacity factors below 50%. Projects in Indonesia have a wide range between 50% and 85%.
Levelised costs of the projects range between USD 0.020 per kWh and USD 0.090 per kWh with a mean value of USD 0.044 per kWh. The highest levelised cost average is from Thailand at USD 0.071 per kWh while the lowest is from Myanmar at USD 0.029 per kWh. Malaysia and Vietnam have the same average cost of USD 0.050 per kWh. Indonesia has also one of the lowest values at USD 0.033 per kWh while Lao PDR has one of the highest with mean value of USD 0.061 per kWh.
Hydropower LCOE is sensitive to capital costs, discount rate and capacity factor.
60

5.1 HYDROPOWER DEPLOYMENT IN ASEANHydropower resources is one of the most common RE resources in ASEAN. Almost all countries have developed their hydropower resources for electricity generation.
In the past decade, widespread hydropower development were implemented in Indonesia, Malaysia, the Philippines, Thailand and Vietnam. In 2006, these countries accounted for around 92% of the total installed generation in the AMS. Vietnam accounted for 27% of the total capacity while Indonesia, the Philippines and Thailand had shares slightly below 20% each. Malaysia accounted for around 11% of the total installed capacity during that period.
In the past 5 (five) years, deployment in Malaysia and Vietnam had accelerated. Installed capacity in Malaysia and Vietnam had more than doubled during the period of 2010 and 2014. In addition, significant hydropower development had been recorded in Cambodia, Lao PDR and Myanmar (Figure 5-1). These 3 (three) Member States had increased their installed capacities more than 5 (five) times between 2006 and 2014. Overall, the total installed hydropower capacity in the AMS had more than doubled between 2006 and 2014, from 19,047 MW to 41,586 MW.
A similar pattern can be observed in hydropower generation in the AMS. Hydropower generation had also more than doubled between 2006 and 2014, from 61,389 GWh to 129,040 GWh in 2014. The rapid increase in the generation occurred between 2009 and 2014 (Figure 5-2).
Figure 5-1. Hydropower Installed Capacity in the AMS
61
20060
5000
10000
15000
20000
25000
30000
35000
40000
45000
2007 2008
Elec
trici
ty C
apac
ity (M
W)
2009 2010 2011 2012 2013 2014
CambodiaIndonesiaLao PDRMalaysiaMyanmarPhilippinesThailandVietnam

5.2 HYDROPOWER PROJECTSA total of 23 (twenty-three) hydropower projects from 6 (six) AMS were analysed in the Study. Of these, 9 (nine) projects are from Indonesia, 5 (five) projects from Malaysia, 3 (three) from Vietnam while Lao PDR, Myanmar and Thailand have each 2 projects.
The lowest installed capacity size is 0.5 MW from Indonesia while the biggest is 52 MW from Myanmar. The simple average of the project capacities is 9 MW. Excluding the project with the biggest capacity size, the average is only 6.95 MW.
Table 5-1. Hydropower projects from selected AMS
Figure 5-2. Hydropower Generation in the AMS
62
Project No
Indonesia Lao PDR Malaysia Myanmar Thailand VietnamInstalled Capacity (MW)
1 6.0 1.52 6.6 0.6 1.38 122 10.0 2.14 8.01 52 1.81 73 11.0 14 8.54 3.0 195 2.0 5.256 3.127 4.28 15.09 0.5
20060
20.000
40.000
60.000
80.000
100.000
120.000
140.000
2007 2008
Elec
trici
ty G
ener
atio
n (G
Wh)
2009 2010 2011 2012 2013 2014
CambodiaIndonesiaLao PDRMalaysiaMyanmarPhilippinesThailandVietnam

5.3 INSTALLATION COSTSCost Breakdown
The average breakdown of hydropower project costs per Member State and the regional average are shown Figure 5-3. Civil works represent the biggest share of the project cost and followed by electromechanical equipment. The regional average shows that civil works account for almost 49% of the total project costs while the equipment costs represent around 31%. Individual project data from each Member State show that the relative share of project components are project specific.
Detailed breakdown of equipment and installation costs for Malaysia is shown in Figure 5-4. The conveyance and piping systems represent the biggest share with an average of 42%. Turbine and generator on the other hand account for almost 34%.
Figure 5-3. Breakdown of Costs for Hydropower Projects (average per AMS and regional average)
63
5.2%2.4%1.2%3.3%2.0%
0.03%0.1%1.1%11.0%5.3%
1.2%4.7%32.4%
0.2%
37.9% 23.8% 30.6%28.5%
3.5%18.6%
10.4%8.1%
59.6%55.5%39.3%39.5%
48.5%
1.3%5.6%7.0%7.0% 5.2%
Grid connectionTransport and othersDesign, Engineering, Project ManagementLand development costsEquipment (turbine, generator, others)Installation (labor, electrical, mechanical)Civil worksPre-construction
Malaysia Indonesia averageThailand Lao PDR

Installation Costs
For each project, the installation cost was calculated as the ratio of the capital cost to the installed capacity. The installation cost distribution is shown in Figure 5-5. Projects in Thailand have the highest installation costs, followed by Malaysia. For Indonesia, due to its higher number of samples, has wide variation of costs while projects from Lao PDR and Myanmar have costs distribution in the middle range of the distribution. Projects from Vietnam have installation costs at the lower range of overall costs distribution.
Figure 5-4. Breakdown of Hydropower Equipment and Installation Costs for Malaysia
Figure 5-5. Distribution of hydropower installation costs (2014 prices)
64
0,00
0,50
1,00
1,50
2,00
2,50
3,00
3,50
4,00
4,50
5,00
0 10 20 30 40 50 60
Inst
alle
d C
ost (
USD
/W)
Installed Capacity (MW)
Vietnam
Thailand
Malaysia
Myanmar
Indonesia
Lao PDR
MalaysiaLao PDRIndonesia
VietnamThailandMyanmar
Inst
alla
tion
Cos
t (US
D/W
)
15.4%2.9%
0.5%2.5%4.4%9.9%
1.7%
0.1%
0.4%
4.9%
6.2%
33.5%
26.8%39.2%21.7%
4.0%
72.2%
42.4%
56.1%54.7%63.5%
52.1%
37.7%
27.8%
3.3%5.1%1.7%4.9%4.6%
OthersElectrical Protection SystemEnergy MeterPower HouseTurbine and GeneratorConveyance System (piping, tunnel, etc)Headworks (dam, weir, etc)
14 MW 19 MW average8.01 MW6.6 MW 5.25 MW

The average installation costs in Thailand is USD 4.06 per W, followed by Malaysia at USD 2.64 per W, Lao PDR at USD 1.83 per W, Indonesia at USD 1.79 and Myanmar at USD 1.69 per W. Vietnam has the lowest installation cost average at USD 1.51 per W (Table 5-1).
The overall project average is USD 2.13 per W while the median value is USD 1.84 per W. The minimum installation cost is registered in Indonesia at USD 0.85 per W, while the highest is USD 4.68 per W from a project in Thailand.
Table 5-2. Hydropower installation costs (USD per W) (2014 prices)
5.4 O&M COSTSProject O&M costs were estimated as percentage of the capital costs. The distribution of O&M costs is shown in Figure 5 6. As shown in the said Figure, except for an outlier from Indonesia, O&M costs hover between 1% and 4%. Most projects from Indonesia and Malaysia settle at the upper level of this range while those from Vietnam, Lao PDR, Myanmar and Thailand are on the lower range.
Indonesia has the highest average O&M cost at 2.7%, followed by Malaysia at 2.1%, Lao PDR at 1.6% while Vietnam has an average of 1.4%. Both Myanmar and Thailand have the same average at 1.1% (Table 5-3).
Figure 5-6. Distribution of hydropower O&M costs
65
0,0%
0,5%
1,0%
1,5%
2,0%
2,5%
3,0%
3,5%
4,0%
0 10 20 30 40 50 60
O&
M C
ost (
% o
f cap
ital c
ost)
Installed Capacity (MW)
Vietnam
Thailand
Malaysia
Myanmar
Indonesia
Lao PDR
MalaysiaLao PDRIndonesia
VietnamThailandMyanmar
Indonesia Lao PDR Malaysia Myanmar Thailand Vietnam OVERALLMean 1.79 1.83 2.64 1.69 4.06 1.51 2.13Median 1.84Minimum 0.85Maximum 4.68

Table 5-3. Hydropower O&M costs as percentage of capital costs
5.5 CAPACITY FACTORCapacity factor is defined as the ratio of actual generation to the maximum potential project generation. Capacity factor distribution of the analysed hydropower projects is shown in Figure 5-7. Capacity factors of projects in Myanmar, Malaysia and Thailand are above 65%. Capacity factors of projects in Indonesia stay between 50% and 85% while those of Lao PDR and Vietnam are below 50%.
The average capacity factors in Myanmar, Malaysia and Thailand are within a close range at 75.6%, 77.1% and 74.6%, respectively. Indonesia’s sampled projects has an average factor of 65.5%. Lao PDR and Vietnam are on the lower range with average values of 38.7% and 39.3% respectively. This is shown in Table 5-4.
The overall capacity factor average is 63.7% while the median value is 69.0%. The minimum value is from a project in Vietnam at 36.0%, while the highest value is from a project in Indonesia at 85.0%. This is also shown in the said Table below.
Figure 5-7. Distribution of hydropower capacity factor
66
0%
10%
20%
30%
40%
50%
60%
70%
80%
90%
0 10 20 30 40 50 60
Cap
acity
Fac
tor (
%)
Installed Capacity (MW)
Vietnam
Thailand
Malaysia
Myanmar
Indonesia
Lao PDR
MalaysiaLao PDRIndonesia
VietnamThailandMyanmar
Indonesia Lao PDR Malaysia Myanmar Thailand Vietnam OVERALLMean 2.7% 1.6% 2.1% 1.1% 1.1% 1.4% 1.7%Median 1.5%Minimum 0.9%Maximum 3.4%

Table 5-4. Hydropower capacity factor (%)
5.6 LEVELISED COSTThe levelised cost of projects from each AMS are shown in Figure 5-8. The pattern closely follows the installation cost distribution pattern. Overall, except for an outlier project in Thailand, the levelised cost of hydropower generation lies between USD 0.020 per kWh and USD 0.070 per kWh.
The said Figure also shows that Thailand has the highest cost of hydropower electricity generation, followed by Lao PDR, Malaysia and Vietnam. Myanmar occupies the lower range while Indonesia at the lower middle range of the overall cost distribution.
Thailand has the highest average levelised cost at USD 0.071 per kWh and followed by Lao PDR at USD 0.061 per kWh. Malaysia and Vietnam have the same average production cost of USD 0.050 per kWh. Indonesia’s average levelised cost is USD 0.033 per kWh while Myanmar has the lowest cost at USD 0.029 per kWh (Table 5-5).
The average cost of production and the median value from 21 (twenty-one) project samples in the AMS are USD 0.044 per kWh and USD 0.045 per kWh. The lowest value is USD 0.019 per kWh from a project in Myanmar while the highest value is USD 0.085 per kWh from a project in Thailand.
67
Indonesia Lao PDR Malaysia Myanmar Thailand Vietnam OVERALLMean 65.5% 38.7 75.6% 77.1% 74.6% 39.3% 63.7%Median 69.0%Minimum 36.0%Maximum 85.0%

Figure 5-8. Distribution of hydropower levelised cost (2014 prices)
Table 5-5. Hydropower levelised cost (USD per kWh) (2014 prices)
68
Hydropower, IndonesiaCredit: ASEC
0,000
0,010
0,020
0,030
0,040
0,050
0,060
0,070
0,080
0,090
0 10 20 30 40 50 60
Leve
lized
Cos
t (US
D/k
Wh)
Installed Capacity (MW)
Vietnam
Thailand
Malaysia
Myanmar
Indonesia
Lao PDR
MalaysiaLao PDRIndonesia
VietnamThailandMyanmar
Leve
lised
Cos
t (US
D/k
Wh)
Indonesia Lao PDR Malaysia Myanmar Thailand Vietnam OVERALLMean 0.033 0.061 0.050 0.029 0.071 0.050 0.044Median 0.045Minimum 0.019Maximum 0.085

5.7 SENSITIVITY ANALYSISThe sensitivity of hydropower LCOE to several project parameters was also assessed in this study. Median values for installed capacity, installation cost, O&M cost and capacity factor were used to simulate the impact of variation of key parameters value on LCOE.
The parameters evaluated were capital costs, O&M costs and capacity factors. Of these, the analysis shows (Figure 5-9) that variations in capital costs, capacity factors and discount rates have large impacts on LCOE. A 50% increase in capital costs would yield a 44% increase in LCOE. Conversely, a 50% increase in capacity factor results in a 33% decrease in LCOE. The impact of O&M costs is relatively small.
Figure 5-9. The impacts of ±50% change in key parameters value on hydropower’s LCOE (percentage increase/decrease in LCOE)
Note: ±50% change in capital cost; ±50% change in O&M; ±50% change in capacity factor. *capacity factor and LCOE are inversely related – an increase in capacity factor results in a decrease of LCOE.
69
0
44%-44%
0
5%-5%
0
-33% 100%
0
44%-36%
capacity factor*
discount rate
capital cost
O&M cost

70
Micro hydro in Mekarsari Village, Indonesia. Credit: GEF SGP Indonesia.

80
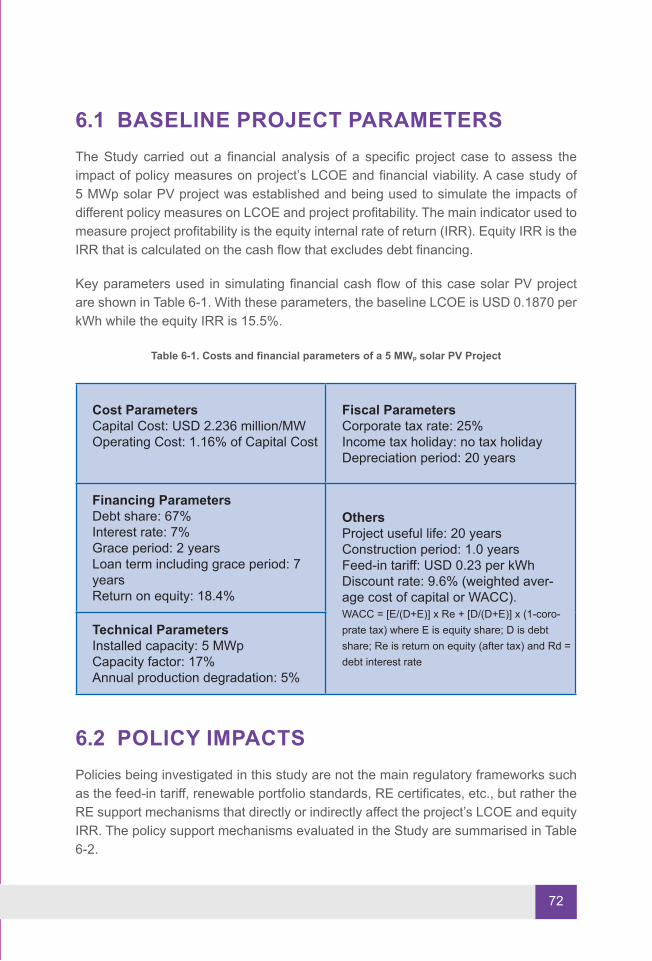
6.1 BASELINE PROJECT PARAMETERSThe Study carried out a financial analysis of a specific project case to assess the impact of policy measures on project’s LCOE and financial viability. A case study of 5 MWp solar PV project was established and being used to simulate the impacts of different policy measures on LCOE and project profitability. The main indicator used to measure project profitability is the equity internal rate of return (IRR). Equity IRR is the IRR that is calculated on the cash flow that excludes debt financing.
Key parameters used in simulating financial cash flow of this case solar PV project are shown in Table 6-1. With these parameters, the baseline LCOE is USD 0.1870 per kWh while the equity IRR is 15.5%.
Table 6-1. Costs and financial parameters of a 5 MWp solar PV Project
6.2 POLICY IMPACTSPolicies being investigated in this study are not the main regulatory frameworks such as the feed-in tariff, renewable portfolio standards, RE certificates, etc., but rather the RE support mechanisms that directly or indirectly affect the project’s LCOE and equity IRR. The policy support mechanisms evaluated in the Study are summarised in Table 6-2.
72
Cost ParametersCapital Cost: USD 2.236 million/MWOperating Cost: 1.16% of Capital Cost
Fiscal ParametersCorporate tax rate: 25%Income tax holiday: no tax holidayDepreciation period: 20 years
Financing ParametersDebt share: 67%Interest rate: 7%Grace period: 2 yearsLoan term including grace period: 7 yearsReturn on equity: 18.4%
OthersProject useful life: 20 yearsConstruction period: 1.0 yearsFeed-in tariff: USD 0.23 per kWhDiscount rate: 9.6% (weighted aver-age cost of capital or WACC).WACC = [E/(D+E)] x Re + [D/(D+E)] x (1-coro-prate tax) where E is equity share; D is debt share; Re is return on equity (after tax) and Rd = debt interest rate
Technical ParametersInstalled capacity: 5 MWpCapacity factor: 17%Annual production degradation: 5%
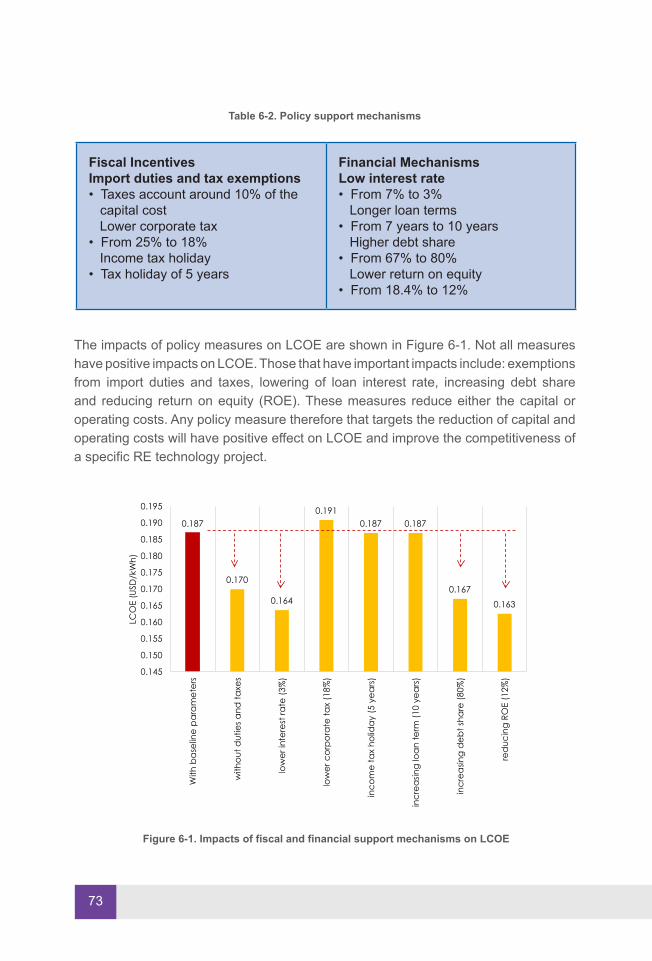
Figure 6-1. Impacts of fiscal and financial support mechanisms on LCOE
Table 6-2. Policy support mechanisms
The impacts of policy measures on LCOE are shown in Figure 6-1. Not all measures have positive impacts on LCOE. Those that have important impacts include: exemptions from import duties and taxes, lowering of loan interest rate, increasing debt share and reducing return on equity (ROE). These measures reduce either the capital or operating costs. Any policy measure therefore that targets the reduction of capital and operating costs will have positive effect on LCOE and improve the competitiveness of a specific RE technology project.
73
0.187
0.170
0.164
0.1910.187 0.187
0.1670.163
0.145
0.150
0.155
0.160
0.165
0.170
0.175
0.180
0.185
0.190
0.195
With
bas
elin
e p
ara
met
ers
with
out d
utie
s and
taxe
s
low
er in
tere
st ra
te (3
%)
low
er c
orpo
rate
tax
(18%
)
inco
me
tax
holid
ay (5
yea
rs)
incr
easin
g lo
an te
rm (1
0 ye
ars)
incr
easin
g de
bt sh
are
(80%
)
red
ucin
g RO
E (1
2%)
LCO
E (U
SD/k
Wh)
Fiscal IncentivesImport duties and tax exemptions• Taxes account around 10% of the
capital cost Lower corporate tax• From 25% to 18% Income tax holiday• Tax holiday of 5 years
Financial MechanismsLow interest rate• From 7% to 3% Longer loan terms• From 7 years to 10 years Higher debt share• From 67% to 80% Lower return on equity • From 18.4% to 12%

Improving project competitiveness with respect to conventional energy technologies represent only one aspect in the deployment of RE technologies. An equally important factor is the financial attractiveness of the project. The impacts of the identified policy measures to equity IRR were also evaluated in the study.
Figure 6-2 shows that almost all of the policy measures have positive and significant impacts on equity IRR. Equity IRR is calculated based on the equity cash flow. Thus any policy measure that positively impacts not only on project investment and operating costs but also on the financial bottom line improves the attractiveness of the project from financing point of view.
Figure 6-2. Impacts of fiscal and financial support mechanisms on equity IRR
74
13.7%
16.3%
15.4%
14.8% 15.0%
15.5%
15.0%
13.7%
12.0%
12.5%
13.0%
13.5%
14.0%
14.5%
15.0%
15.5%
16.0%
16.5%
17.0%
With
bas
elin
e pa
ram
eter
s
with
out d
utie
s and
taxe
s
low
er in
tere
st ra
te (3
%)
low
er c
orpo
rate
tax
(18%
)
inco
me
tax
holid
ay (5
yea
rs)
incr
easin
g lo
an te
rm (1
0 ye
ars)
incr
easin
g d
ebt s
hare
(80%
)
red
ucin
g RO
E (1
2%)
equi
ty IR
R (%
)

84

LEVELISED COSTIn estimating the levelised cost of electricity (LCOE) of solar PV, biomass and hydropower projects in the AMS, the Study evaluated key project costs and technical parameters such as the installation costs, O&M costs and capacity factors.
The overall trend is that at the regional level, the installation costs of solar PV projects are the highest compared with those of biomass and hydropower projects. For O&M costs (as percentage of the capital costs), biomass power projects have the highest regional average value, while solar PV projects have the lowest. Hydropower projects have an average value twice that of solar PV. With respect to capacity factors, solar PV have the lowest regional average capacity factor while biomass power projects have the highest.
Among the 3 technologies evaluated in the study, solar PV has the highest LCOE with a regional mean value of USD 0.22 per kWh, while hydropower projects have the lowest mean value at USD 0.044 per kWh. The LCOE of biomass power project is USD 0.088 per kWh.
The Study also carried a sensitivity analysis and the results show that capital costs, capacity factors and discount rates are important parameters in determining the LCOE of solar PV, biomass power and hydropower. Variations of these values could yield a significant increase or decrease in LCOE. For biomass power projects, in addition to these, variations in plant heat rates and biomass fuel prices have also an important effect on the LCOE. The sensitivity analysis results also indicate that these parameters could be targeted for policy intervention to improve the competitiveness of RE technologies.
GRID AND SOCKET PARITYLCOE results were also compared with generation costs of 2014 from Indonesia, Malaysia, the Philippines and Thailand. Malaysia’s TNB had the lowest average generation cost of USD 0.073 per kWh, Thailand’s EGAT had USD 0.096 per kWh, Indonesia’s PLN had 0.109 per kWh, while the Philippines’ MERALCO had 0.120 per kWh. Taking the Philippines’ average generation cost as the representative unsubsidised price and comparing with the estimated LCOEs, only hydropower and biomass electricity generation have reached ‘grid’ parity. Grid parity in this context is defined as the LCOE of an RE project equals the average price the utility is paying to various power generators or the average cost utilities are incurring from their own generating facilities.
76

On the other hand, comparing the LCOE results with PLN’s diesel electricity generation (USD 0.259 per kWh) and gas turbine generation costs (USD 0.244 per kWh), the solar PV (all capacity sizes), biomass power and hydropower generation were competitive with these technologies.
Roof-mounted solar PV systems are however connected near the consumption level, hence it would be more appropriate to compare their LCOEs with commercial and residential selling prices. Medium-scale and rooftop mounted PV systems had already reached ‘socket’ parity in Malaysia, Thailand and the Philippines. On the other hand, small-scale roof mounted systems had also reached socket parity in Singapore and the Philippines. Socket parity in this context is defined as the LCOE of small-scale solar PV systems equals the average price the consumer is paying to the distribution utility.
POLICY IMPACTSThe Study evaluated the effect of policy support mechanisms which provide additional incentives to RE investments that are widely introduced in the AMS. These are fiscal incentives (exemptions from import duties and taxes, low corporate taxes and income tax holidays) and financial mechanisms (low interest rate, longer loan terms, higher debts share, and low return on equity).
The analysis shows that not all measures have positive effect on LCOE. Measures that have positive impacts are: exemptions from import duties and taxes, lowering of loan interest rate, increasing debt share and reducing ROE. These measures directly reduce either the capital or operating costs of the project. Policy measures that aim to reduce capital and operating costs will have positive effect on LCOE and improve the competitiveness of a specific RE technology project.
In addition, the Study also assessed the impact of these support mechanisms on the financial viability of an RE project. Using the equity IRR as the measure, the Study shows that almost all of these support mechanisms improve the project equity IRR. Any policy measure that positively impacts not only on project investment and operating costs but also on the equity cash flow, would improve the attractiveness of the project from financing point of view.
77