Lesson 19 Part 1
11
Lesson 19 Charts and Design Elements
description
Part 1 of Excel Lesson 19
Transcript of Lesson 19 Part 1

Lesson 19Charts and Design
Elements

Charts and Design Elements
A chart is a graphical representation of worksheet information
Charts show you what the numbers in your worksheet mean
You can use charts to identify trends and patterns in your worksheet data
Charts add visual interest to your worksheets
They make the information easier to understand
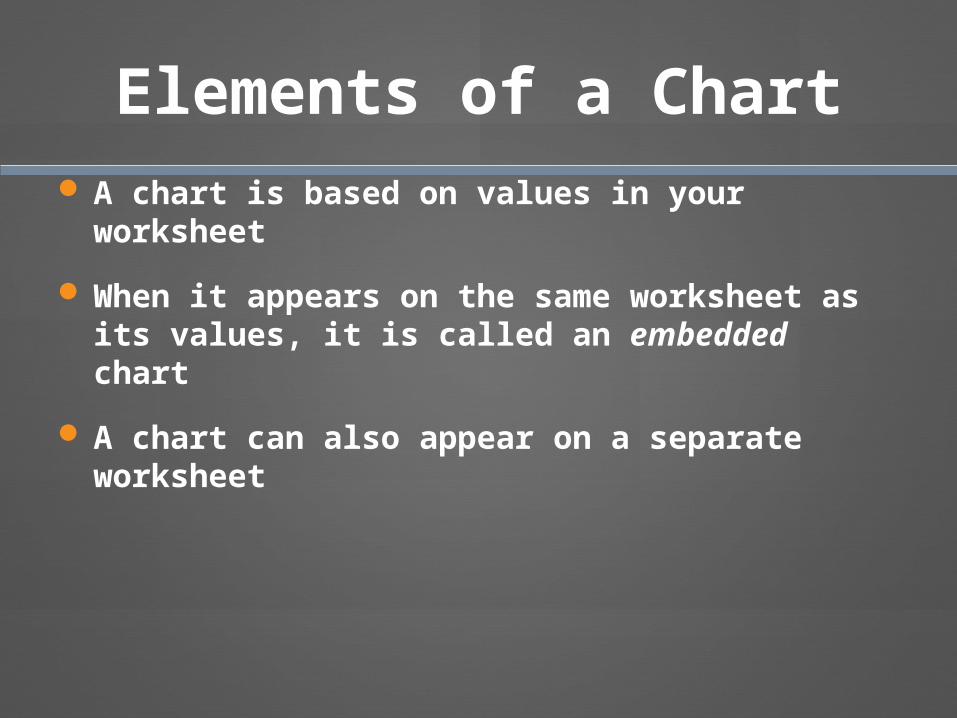
Elements of a Chart A chart is based on values in your
worksheet
When it appears on the same worksheet as its values, it is called an embedded chart
A chart can also appear on a separate worksheet

Elements of a Chart
Worksheet data plotted in the chart
Value Axis
Chart Title
Data Series
Legend
Plot Area
Category Axis

Practice—Together
Complete Practice 19-1 to create a column chart
Complete Practice 19-2 to create a pie chart
Use the file SS-Books

Editing a Chart
Double-click in the chart area of the chart (white space)—a box will appear around the chart and
The Chart Toolbar tabs will show up

Chart Tools Design Tab
Chart Tools Layout Tab
Chart Tools Format Tab

Practice—Together
Using the file from Practice 19-2, complete Practice 19-3

On Your Own
Complete Test Yourself 19-1 Use the file SS-107thCongress
Complete Test Yourself 19-2 Use the file SS-Exercise
Submit both files
Print BOTH

Lesson 19
Complete Practice 19-1, 19-2, 19-3 Save as directed Submit Practice 19-3 Print the worksheet from Practice 19-3 as
directed

Lesson 19
Complete Practice 19-1, 19-2, 19-3 Save as directed Submit Practice 19-3 Print the worksheet from Practice 19-3 as
directed Complete Test Yourself 19-1 & 19-2 Save as directed and submit both Test Yourself
19-1 & 19-2 Print both worksheets for Test Yourself 19-1 &
19-2