Uploaded by Samy Salah...2016/06/24 · Uploaded by Samy SalahUploaded by Samy Salah
Upload
brynn-landryCategory
view
30download
1description
Leila Samy, MPHRural Health IT CoordinatorOffice of the National Coordinator for Health IT
Hometown Health: Health IT and HIPAA WorkshopSeptember 26, 2014Macon, Georgia
Rural Health and Veteran Health

Office of the National Coordinator for Health IT 2
Leila SamyHHS Office of the
National Coordinator for Health IT
Within an agency charged with promoting nationwide adoption of technology in healthcare to transform healthcare delivery, my efforts are centered on ensuring that rural communities are not left behind.

What We’ll Cover Here
1. Data and trends in Health IT and eHealth• National• Georgia• Rural• CAH
2. White House Rural Council initiatives • rural health • veteran health
3. Links to resources• What ONC has done to support rural health and Veterans• Tools and resources for CAHs/rural hospitals adopting health IT• Federal financing programs• Privacy and Security resources
Office of the National Coordinator for Health IT 3
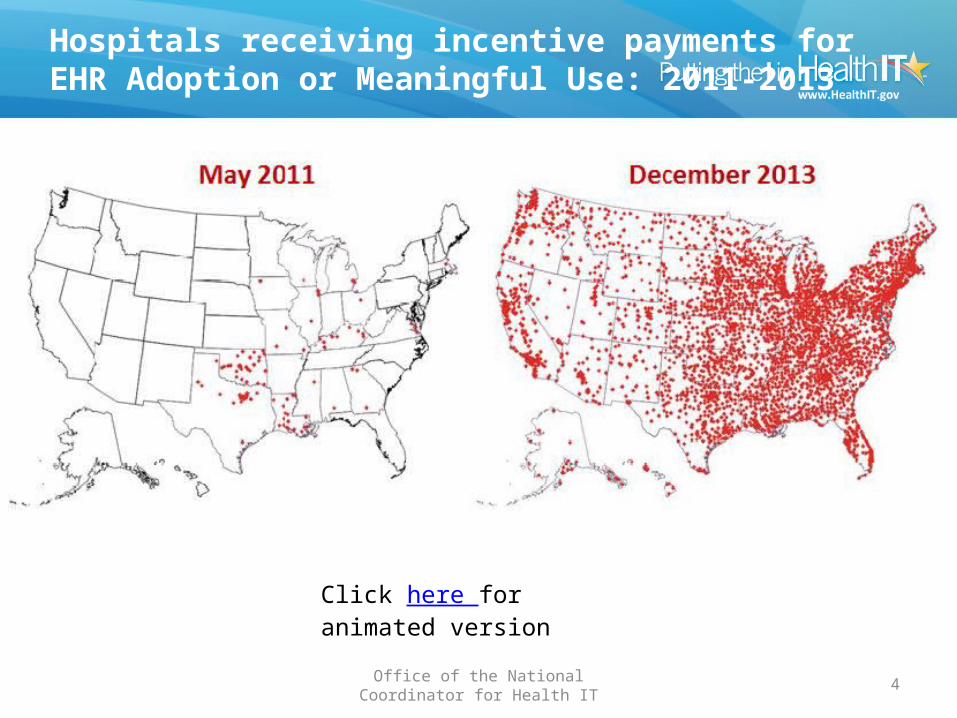
Hospitals receiving incentive payments for EHR Adoption or Meaningful Use: 2011-2013
Office of the National Coordinator for Health IT 4
Click here for animated version

Percent of Physicians e-Prescribing through an Electronic Health Record: 2008-2013
Office of the National Coordinator for Health IT 5
Click here for animated version

6
Created by HHS Office of the National Coordinator for Health IT, Office of Economic Analysis, Evaluation, and Modeling
2008 20102009 2011 2012 2013
Percent of Physicians e-Prescribing through an Electronic Health RecordLocal Area Trends of EHR Adoption, 2008-2013

2008 20102009 2011 2012 2013
Created by HHS Office of the National Coordinator for Health IT, Office of Economic Analysis, Evaluation, and Modeling
Percent of Physicians e-Prescribing through an Electronic Health RecordLocal Area Trends of EHR Adoption, 2008-2013
7

2008 20102009 2011 2012 2013
Created by HHS Office of the National Coordinator for Health IT, Office of Economic Analysis, Evaluation, and Modeling
Percent of Physicians e-Prescribing through an Electronic Health RecordLocal Area Trends of EHR Adoption, 2008-2013
8

2008 20102009 2011 2012 2013
Created by HHS Office of the National Coordinator for Health IT, Office of Economic Analysis, Evaluation, and Modeling
Percent of Physicians e-Prescribing through an Electronic Health RecordLocal Area Trends of EHR Adoption, 2008-2013
9

2008 20102009 2011 2012 2013
Created by HHS Office of the National Coordinator for Health IT, Office of Economic Analysis, Evaluation, and Modeling
Percent of Physicians e-Prescribing through an Electronic Health RecordLocal Area Trends of EHR Adoption, 2008-2013
10

2008 20102009 2011 2012 2013
Created by HHS Office of the National Coordinator for Health IT, Office of Economic Analysis, Evaluation, and Modeling
Percent of Physicians e-Prescribing through an Electronic Health RecordLocal Area Trends of EHR Adoption, 2008-2013
11

Office of the National Coordinator for Health Information Technology 12
Note: Payments for May 2012 and June 2013 include payments to Medicare Advantage providers.
Jan-11
Feb-11
Mar-11
Apr-11
May-11
Jun-11Jul-1
1
Aug-11
Sep-11
Oct-11
Nov-11
Dec-11Jan
-12
Feb-12
Mar-12
Apr-12
May-12
Jun-12Jul-1
2
Aug-12
Sep-12
Oct-12
Nov-12
Dec-12Jan
-13
Feb-13
Mar-13
Apr-13
May-13
Jun-13Jul-1
3
Aug-13
Sep-13
Oct-13
Nov-13
Dec-13Jan
-14
Feb-14
Mar-14
0
5,000
10,000
15,000
20,000
25,000
30,000
35,000
40,000
0
50,000
100,000
150,000
200,000
250,000
300,000
350,000
400,000
38.0131.0463.0346.0872.01063.01631.02738.0
3524.04445.0
7274.09152.0
11890.0
18241.0
15386.017332.018055.0
9167.09341.0
11427.012831.0
9480.0
11996.0
13967.0
19938.0
23342.0
25653.0
35575.0
2296.0
6796.0
10738.0
4116.04883.04564.04393.05965.0
7184.08327.0
16116.0
Monthly Total
Cumulative Total
Num
ber o
f Uni
que
Prov
ider
s Pa
id M
onth
ly (t
hous
ands
)
Cum
ulati
ve U
niqu
e Pr
ovid
ers
Paid
Cumulative Providers Paid
371,673
Source: CMS EHR Incentive Program Data as of 03/31/2014
Eligible Professionals and Hospitals Paid under the Medicare or Medicaid EHR Incentive Program
371,673 unique eligible professionals and hospitals (7 out of 10 of all eligible providers) have received a payment under the Medicare or Medicaid EHR Incentive Program

13Office of the National Coordinator for Health Information Technology
Jan-11
Feb-11
Mar-11
Apr-11
May-11
Jun-11Jul-1
1
Aug-11
Sep-11
Oct-11
Nov-11
Dec-11Jan
-12
Feb-12
Mar-12
Apr-12
May-12
Jun-12Jul-1
2
Aug-12
Sep-12
Oct-12
Nov-12
Dec-12Jan
-13
Feb-13
Mar-13
Apr-13
May-13
Jun-13Jul-1
3
Aug-13
Sep-13
Oct-13
Nov-13
Dec-13Jan
-14
Feb-14
Mar-14
$0
$200
$400
$600
$800
$1,000
$1,200
$1,400
$1,600
$1,800
$0
$5,000
$10,000
$15,000
$20,000
$25,000Cumulative Total
$22,904
Monthly Total
Cumulative Total
Amou
nt P
aid
per M
onth
(Mill
ions
)
Cum
ulati
ve A
mou
nt P
aid
(Mill
ions
)
$1,254.5
Source: CMS EHR Incentive Program Data as of 03/31/2014
Payments under the Medicare or Medicaid EHR Incentive ProgramEligible Professionals and Hospitals
The Medicare and Medicaid EHR Incentive Programs have cumulatively paid $22.9 billion in incentive payments as of March 2014
Note: Payments for May 2012 and June 2013 include payments to Medicare Advantage providers.

HOW ARE WE DOING IN GEORGIA?Progress with Health IT Adoption and eHealth in Georgia
Office of the National Coordinator for Health IT 14
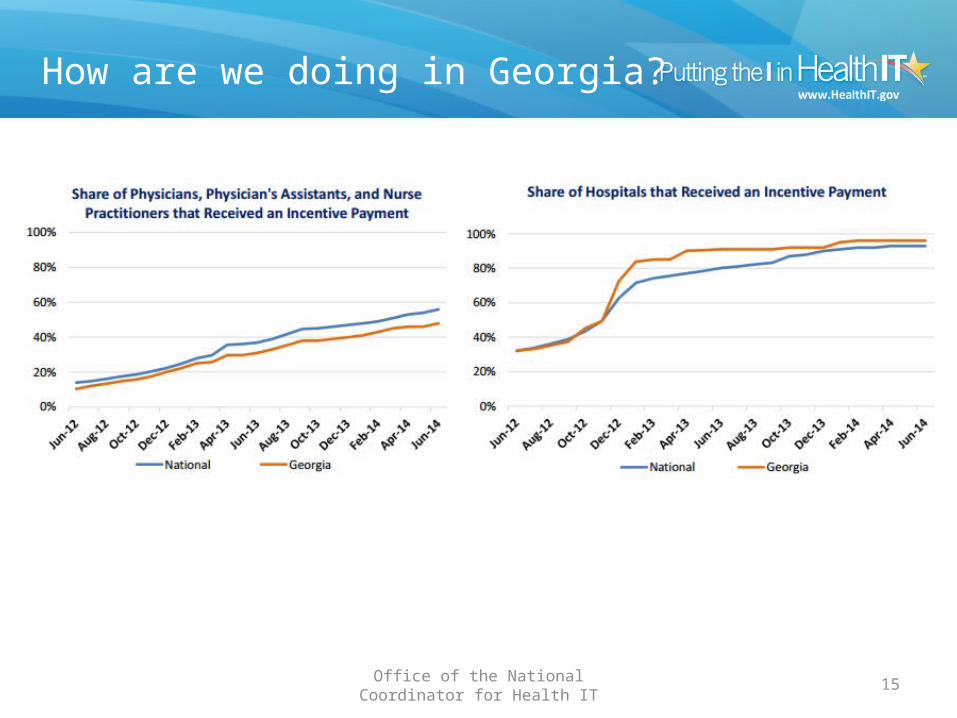
How are we doing in Georgia?
Office of the National Coordinator for Health IT 15

How are we doing in Georgia?
Office of the National Coordinator for Health IT 16

HOW ARE WE DOING IN RURAL?Progress with Adoption of Health IT and eHealth
Office of the National Coordinator for Health IT 17
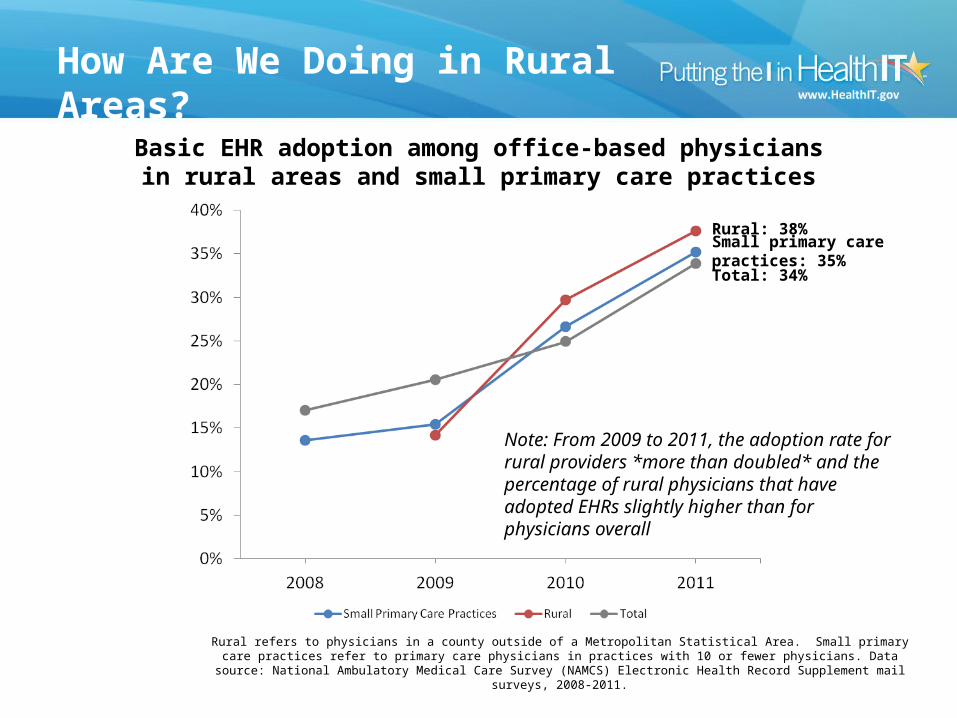
Rural: 38%
Total: 34%Small primary care practices: 35%
Note: From 2009 to 2011, the adoption rate for rural providers *more than doubled* and the percentage of rural physicians that have adopted EHRs slightly higher than for physicians overall
Basic EHR adoption among office-based physiciansin rural areas and small primary care practices
Rural refers to physicians in a county outside of a Metropolitan Statistical Area. Small primary care practices refer to primary care physicians in practices with 10 or fewer physicians. Data source: National Ambulatory Medical Care Survey (NAMCS) Electronic Health Record Supplement mail
surveys, 2008-2011.
How Are We Doing in Rural Areas?

Dec-08Jan
-09
Feb-09
Mar-09
Apr-09
May-09
Jun-09Jul-0
9
Aug-09
Sep-09
Oct-09
Nov-09
Dec-09Jan
-10
Feb-10
Mar-10
Apr-10
May-10
Jun-10Jul-1
0
Aug-10
Sep-10
Oct-10
Nov-10
Dec-10Jan
-11
Feb-11
Mar-11
Apr-11
May-11
Jun-11Jul-1
1
Aug-11
Sep-11
Oct-11
Nov-11
Dec-11Jan
-12
Feb-12
Mar-12
Apr-12
0%
1000%
2000%
3000%
4000%
5000%
6000%
7000%
8000%
9000%
10000% 94%
92%
Percent of Pharmacies in Urban and Rural CountiesEnabled on the Surescripts Network
Percent Enabled (Urban) Percent Enabled (Rural)
Percent Active December 2008: Urban 75%, Rural 61%Percent Active April 2012: Urban 93%, Rural 91%
Note: From 2009 to 2012, rural pharmacies actively prescribing medication electronically *in-creased by 50%*
19Office of the National Coordinator for Health IT
How Are We Doing in Rural Areas?

Rural Overall0%
10%
20%
30%
40%
50%
60%
70%
80%
90%
100%
82%
94%
Hospitals
Payment Rates of Rural and Overall for Hospitals and ProfessionalsNovember 2013
Rural professionals are participating in the
EHR Incentive Programs at roughly the same rate as the
national trend.
However, rural hospitals are lagging
behind the overall trend.
Rural Overall
46% 46%
Professionals
Office of the National Coordinator for Health IT

04/11/2013 Attested Not Attested
from the HHS Office of the National Coordinator for Health IT
87 Percent of CAHs/SRHs Attested to MU Stage 1
Map identifies SRHs and CAHs (n=1.772) from the
American Hospital Association and determines attestation status based on
CMS EHR Incentive Program.
Location of Small Rural Hospitals (SRH) and Critical Access Hospitals (CAH) by Attestation Status
February 2014