Legal Trends Report - Legal Evolution › ... › 2020 › 03 › 2017-Legal-Trends-Re… · Key...
49
2017 Legal Trends Report
Transcript of Legal Trends Report - Legal Evolution › ... › 2020 › 03 › 2017-Legal-Trends-Re… · Key...

2017
Legal Trends Report

Table of ContentsIntroduction: A deeper analysis of the legal industry 3
Methodology: New in-depth analysis 7
Key performance indicators: Unpacking law firm KPIs 9How did law firms perform in 2016? 10How do lawyers spend their non-billable time? 12Interruptions are killing productivity 14How do consumers find a lawyer? 16
Growth benchmarks: What gets measured gets managed 19How much is a case worth? 21Planning for seasonality 2214% of bills go uncollected 23How do trust accounts affect collection rates? 25
Legal service rates: The billable hour is alive and well 26Lawyer versus non-lawyer hourly rates 29Average hourly rates by state 30How urban locales affect lawyer and non-lawyer hourly rates 31Hourly rates in greater metropolitan areas 33
Appendix 35Appendix A: Law firm KPIs 36Appendix B: Case values 41Appendix C: Billable hour index 42Appendix D: Detailed methodology 46
2 LEGAL TRENDS REPORT 2017

A deeper analysis of the legal industryData is now considered the world’s most valuable commodity, one that has become a requirement for firms both small and large. In the 4,000-year history of the legal profession, however, law firms have been left in the dark when it comes to understanding their business—and their clients.
→ INTRODUCTION

Instead, firms have relied on inconsistent industry reporting or informal peer discussions, both of which offer limited context and insight. Looking at these data sources from a more objective point of view, they also suffer from two inherent problems:
The Legal Trends Report offers the first-ever data-driven study of the legal industry. In compiling the report, we’ve used aggregated and anonymized data from more than 60,000 Clio users to offer the most comprehensive analysis of the legal industry to date.
This data-driven approach reduces the impact that social desirability biases can have on self-reported billing information and other income-related questions—while preserving anonymity among sample sets. Working from such a large sample size also provides more reliable data for more stable, informed insights.
+ Small sample sizes. When dealing with small sample sets, outliers and skewed results can offer misleading information.
+ Self-reporting biases. A phenomenon known to social science researchers for decades, social desirability biases* influence responses related to socially sensitive issues such as income and the profitability of one’s business.
Data-driven approach
Access to consistent, reliable data is rare in the legal industry, which has made it difficult for firms to make smart decisions about the future of their practice.
*Lavrakas, Paul J. Encyclopedia of Survey Research Methods. 2008.
4 LEGAL TRENDS REPORT 2017
Introduction

What’s new in 2017?
One of the most important—and most discussed—findings from last year’s report was the discovery that lawyers spend only a fraction of their workday on billable tasks. When factoring how much billable time actually gets invoiced and collected, we concluded the average law firm was missing out on approximately 6 hours of billable time every day.
To learn more about what was taking lawyers away from their billable work, we conducted a comprehensive survey of nearly 3,000 legal professionals, including both Clio users and non-Clio users, to learn more about how they spend their day—something that couldn’t be identified from Clio’s data alone.
Our research shows that finding new clients is a major concern for lawyers, who, on average, spend nearly a third of their day on business development. To help lawyers improve their client acquisition, we also surveyed more than 2,000 consumers on how they seek legal representation, and what ultimately makes them choose one lawyer over another.
In search of the missing 6 hours
By using multiple data sources, this year’s Legal Trends Report offers the most comprehensive, in-depth analysis of the legal industry to date.
5 LEGAL TRENDS REPORT 2017
Introduction

+ Redefined practice areas. We conducted an exhaustive review of legal citation indices, bar association data, and Clio’s own survey data to redefine the list of practice areas examined in the Legal Trends Report. With 30 practice areas, our list is the only one of its kind that takes into account the scope and diversity of law firms in the United States, while being refined enough to offer relevant insights.
+ Average case values and seasonality. Using our new practice area list, we looked at the range of average collections per case to offer better insight into how firms can set their financial objectives and plan to acquire clients.
+ Lawyer and non-lawyer rates. We’ve updated and expanded the scope of the Billable Hour Index to include lawyer and non-lawyer rates. Last year’s benchmark rate is now the “Law Firm” rate.
+ Urban, rural, and metropolitan areas. We looked at how hourly rates differ between urban and rural areas, while also comparing the 10 largest metropolitan areas in the United States.
To increase the scope of this year’s report, we expanded our analysis of the legal industry to uncover new insights:
Expanded legal trends
6 LEGAL TRENDS REPORT 2017
Introduction
*For more information on the methodology for this report, refer to Appendix D: Detailed methodology.
→ METHODOLOGY
New in-depth analysisBy using multiple data sources, we’ve created the most comprehensive, in-depth analysis of the legal industry to date. As a result, we’re able to spur a richer, more informed discussion on how law firms should plan their business.*
→ METHODOLOGY
7 LEGAL TRENDS REPORT 2017

+ Clio data. The Legal Trends Report uses aggregated and anonymized data collected from more than 60,000 Clio users. By synthesizing actual usage data, we identify trends that would otherwise be invisible to law firms.
+ Law firm survey. We surveyed 2,915 legal professionals, representing both Clio users and non-Clio users. By undertaking one of the largest survey investigations conducted in the legal industry, we can better understand how law firms operate.
+ Consumer survey. We surveyed 2,002 consumers, comprising respondents who have hired a lawyer in the past and those who have not. Data from this survey offers insight into how consumers seek legal services and what factors into their decision to hire a lawyer.
Data sources
8 LEGAL TRENDS REPORT 2017
Methodology

+ Utilization rate + Realization rate + Collection rate
→ KEY PERFORMANCE INDICATORS
Unpacking law firm KPIsWe use three key performance indicators (KPIs) to measure how effective law firms are at achieving their core business objectives:
9 LEGAL TRENDS REPORT 2017
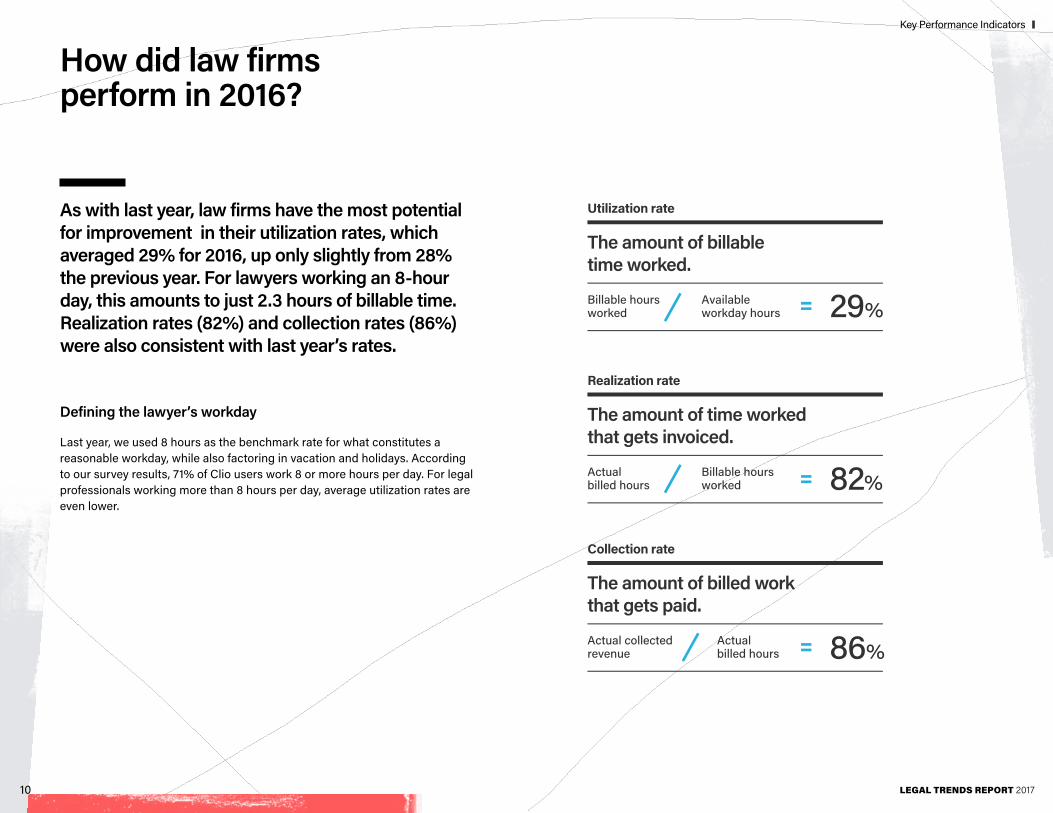
Last year, we used 8 hours as the benchmark rate for what constitutes a reasonable workday, while also factoring in vacation and holidays. According to our survey results, 71% of Clio users work 8 or more hours per day. For legal professionals working more than 8 hours per day, average utilization rates are even lower.
Defining the lawyer’s workday
As with last year, law firms have the most potential for improvement in their utilization rates, which averaged 29% for 2016, up only slightly from 28% the previous year. For lawyers working an 8-hour day, this amounts to just 2.3 hours of billable time. Realization rates (82%) and collection rates (86%) were also consistent with last year’s rates.
How did law firms perform in 2016?
10 LEGAL TRENDS REPORT 2017
Key Performance Indicators

The missing 6 hours
When factoring utilization, realization, and collection rates into an 8-hour day, we see the average lawyer only collects 1.6 hours of billable time per day, which leaves us with the same critical question from last year’s report: What happens to the remaining 6 hours?
11 LEGAL TRENDS REPORT 2017
Key Performance Indicators

To get more insight into how lawyers spend their day, we conducted an extensive survey of both Clio users and non-Clio users. We discovered business development requires a major investment of non-billable time for most law firms. Generating and sending bills, licensing and continuing education, and office administration were also significant factors.
These results suggest both hypotheses from last year’s report are in fact key factors affecting law firm utilization rates.
How do lawyers spend their non-billable time?
Last year, we hypothesized there were two critical factors limiting the average lawyer’s ability to spend time on billable work:
+ Too much time was being eaten away by non-billable administrative tasks.
+ Law firms didn’t have enough clients to support their billable targets.
12 LEGAL TRENDS REPORT 2017
Key Performance Indicators

16% 15%
11%
6%Collections
Configuringtechnology
Generating andsending bills
Licensing andcontinuing education
16%
+ Office administration, generating and sending bills, configuring technology, and collections are all tasks that, combined, eat away 48% of time that could otherwise be spent on billable tasks.
+ The fact that so much non-billable time is dedicated to business development (33%) suggests earning new clients is a constant concern for most law firms.
Administrative tasks and finding clients takes time
*Average percentages calculated from rounded values given by survey respondents for each category. Individual responses add up to 100%.
13 LEGAL TRENDS REPORT 2017
Key Performance Indicators

Interruptions are killing productivity
According to our survey, 68% of legal professionals agree there are not enough hours in a day, and 28% report they struggle to keep track of tasks and deadlines. Underlying these problems may be the issue of how often lawyers are interrupted from their work.
Our survey data shows that 25% of legal professionals are interrupted more than 10 times per day, and 30% are interrupted between 6 and 10 times per day. Interruptions are especially counterproductive when they require shifting attention to different tasks on unrelated topics. For example, taking a call from a client or prospect not associated with the matter at hand forces a shift in cognitive resources that makes it more difficult to resume the original work.
Research shows that resuming work after being interrupted by an unrelated task takes an average of 23 minutes.*
*Gloria Mark, Professor in the Department of Informatics at the University of California, Irvine. Interview: “Worker, Interrupted: The Cost of Task Switching.” Fast Company. 2008.
14 LEGAL TRENDS REPORT 2017
Key Performance Indicators
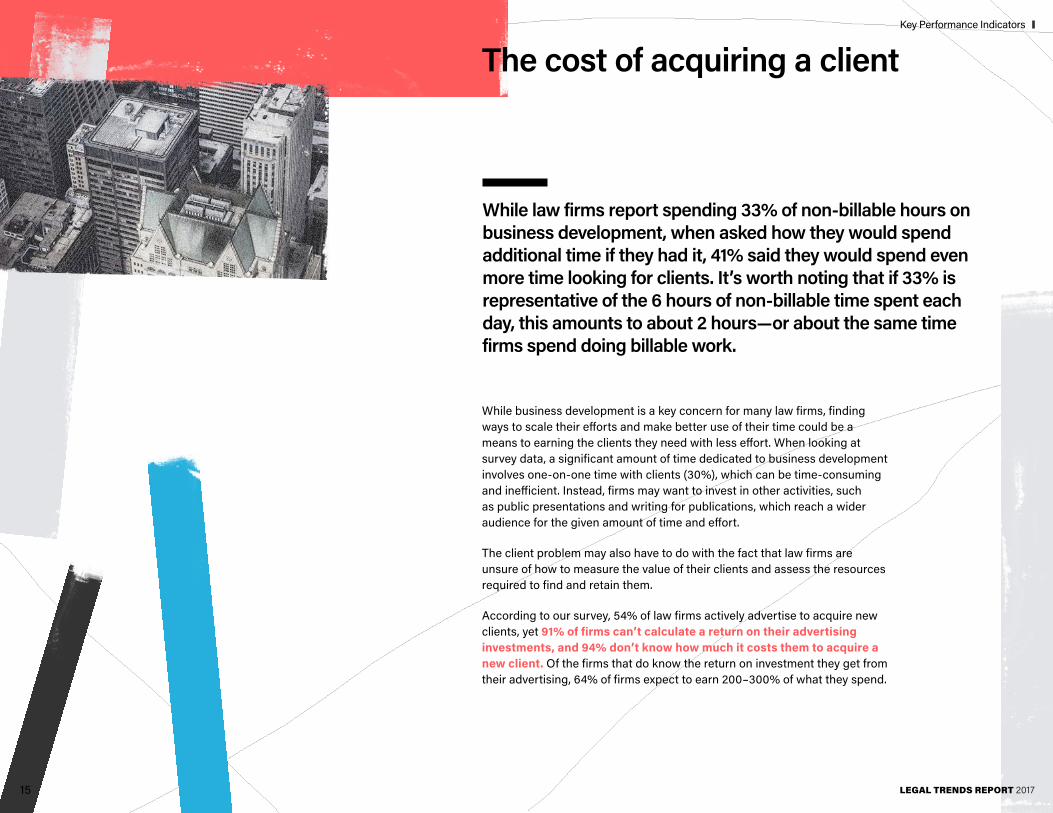
The cost of acquiring a client
While business development is a key concern for many law firms, finding ways to scale their efforts and make better use of their time could be a means to earning the clients they need with less effort. When looking at survey data, a significant amount of time dedicated to business development involves one-on-one time with clients (30%), which can be time-consuming and inefficient. Instead, firms may want to invest in other activities, such as public presentations and writing for publications, which reach a wider audience for the given amount of time and effort.
The client problem may also have to do with the fact that law firms are unsure of how to measure the value of their clients and assess the resources required to find and retain them.
According to our survey, 54% of law firms actively advertise to acquire new clients, yet 91% of firms can’t calculate a return on their advertising investments, and 94% don’t know how much it costs them to acquire a new client. Of the firms that do know the return on investment they get from their advertising, 64% of firms expect to earn 200–300% of what they spend.
While law firms report spending 33% of non-billable hours on business development, when asked how they would spend additional time if they had it, 41% said they would spend even more time looking for clients. It’s worth noting that if 33% is representative of the 6 hours of non-billable time spent each day, this amounts to about 2 hours—or about the same time firms spend doing billable work.
15 LEGAL TRENDS REPORT 2017
Key Performance Indicators

How do consumers find a lawyer?
To learn more about how clients seek legal representation and what affects their decision to hire a law firm, we conducted a survey of consumers who have hired and who have yet to hire a lawyer.When looking to acquire new clients, our consumer study suggests traditional advertising is less effective than building a referral network and investing in online marketing.
16 LEGAL TRENDS REPORT 2017
Key Performance Indicators
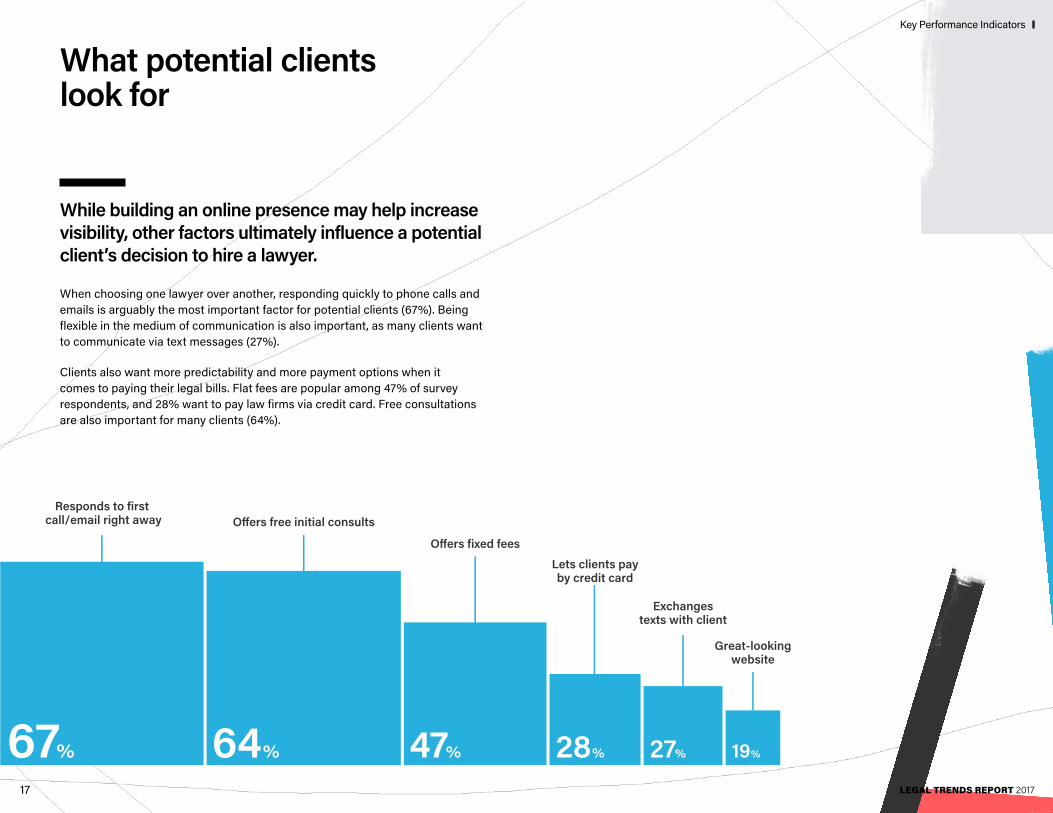
When choosing one lawyer over another, responding quickly to phone calls and emails is arguably the most important factor for potential clients (67%). Being flexible in the medium of communication is also important, as many clients want to communicate via text messages (27%).
Clients also want more predictability and more payment options when it comes to paying their legal bills. Flat fees are popular among 47% of survey respondents, and 28% want to pay law firms via credit card. Free consultations are also important for many clients (64%).
While building an online presence may help increase visibility, other factors ultimately influence a potential client’s decision to hire a lawyer.
What potential clients look for
17 LEGAL TRENDS REPORT 2017
Key Performance Indicators

Future client expectations
Looking specifically at millennials gives us insight into where consumer expectations will trend as a whole over time. As the millennial generation grows older and comes to rely more on legal services, their expectations should determine how law firms seek their future clients.
+ Text and email communications. 19% of millennials who have ever had a legal issue say that they’d rather text or email their lawyer than talk on the phone or face-to-face, compared to 14% of Americans.
+ Document sharing. 30% of millennials say they’d prefer to use technology to share legal documents with their lawyer, compared to 23% of Americans.
+ Online payments. 18% of millennials say they’d prefer to use PayPal or similar platforms to pay their lawyers, compared to 11% of Americans.
+ Credit cards. 24% of millennials who have ever had a legal issue say they’d rather pay their lawyer by credit card than any other payment method, compared to 20% of Americans.
18 LEGAL TRENDS REPORT 2017
Key Performance Indicators

→ GROWTH BENCHMARKS
What gets measured gets managedManaging a law firm is about managing a business as much as it is about managing cases. More importantly, firms that don’t set targets don’t perform.

*Discussion on Barney and Griffen. Dan Feliciano. “Why are Goals and Objectives Important?” Fast Company. September 2009.
+ Only 54% of legal professionals can estimate their annual billings for 2017, which suggests many law firms can’t predict how much they will make in a year.
+ Only 40% of firms that track time have hourly billing targets, which suggests the majority of firms don’t have goals for how much they should work in a given year.
+ Only 50% of legal professionals can bill a case based on a set budget, which suggests a lack of transparency and expectations for both the lawyer and their client.
When looking into areas that firms struggle with, we see many legal professionals work without daily or annual targets. From our law firm survey data, we see:
Setting business goals can help firms in a number of ways:
+ They offer guidance and direction to inform strategic decision-making.
+ They encourage planning to determine how they will be achieved.
+ They help motivate performance and focus efforts.
+ They facilitate evaluation and improvement.*
Law firms need targets
20 LEGAL TRENDS REPORT 2017
Growth Benchmarks

How much is a case worth?
One of the most significant developments in this year’s report is that we can estimate the average value for a case based on practice area.
To see how they compare between practice areas, we can look at a distribution of case values with a minimum of $100 in billable value.*
*For a complete list of case values, see Appendix B: Case values.
Using these metrics, firms can better determine:
+ How much to charge for certain case types.
+ How much time to estimate and spend working individual cases.
+ How many cases are necessary to achieve a firm’s financial goals.
+ How much to spend on acquiring cases.
21 LEGAL TRENDS REPORT 2017
Growth Benchmarks

Insurance Tax
Matter seasonality for Criminal, Civil Litigation, Wills and Estates, and Real Estate law
Increase in cases at the end of the year
Increase in cases at the beginning of the year
Civil LitigationReal Estate
Wills & Estates
Criminal
Planning for seasonality
There are many factors that can influence when clients seek legal counsel throughout the year.
Estimating client demand can help firms plan how and when they seek new clients—and how they allocate resources or coordinate time off among staff.
When looking at the number of cases opened throughout the year, we see most practice areas experience a small surge in the fall and a dip during the winter holidays. Exceptions include: Insurance, which sees an increase in cases at the end of the year, and Tax, which sees the bulk of its cases at the beginning of the year.
22 LEGAL TRENDS REPORT 2017
Growth Benchmarks

14% of bills go uncollected
Based on our look at law firm KPIs, law firms collect an average of 86% of what they bill their clients, which means 14% goes unearned. For a firm that does $4 million in billable work annually, that amounts to a $560,000 forfeit every year.When we look at specific practice areas, we see Bankruptcy (74%), Civil rights (82%), Criminal (83%), Family (82%), Immigration (78%), Insurance (72%), and Small Claims (79%) have lower collection rates than other practice areas.*
*For a full comparison of collection rates by practice area, see “Collection rate (for hourly fees) by practice area” (Appendix A).
23 LEGAL TRENDS REPORT 2017
Growth Benchmarks

Law firms report the most common reason for clients not paying their bills is that they lack the funds to pay a bill all at once (44%). Firms also say 31% of late payments are late even when clients have adequate funds.
It’s also worth noting 25% of firms still mail bills and 29% rely on clients to pay bills by check, both of which create higher barriers to payment than faster, more convenient electronic methods.
Based on Clio payment data we see that when collecting fees via secure online credit card payment platform, firms get paid 39% faster than by other means.
According to our survey, 59% of firms deal regularly with late payments.
Dealing with late payments
24 LEGAL TRENDS REPORT 2017
Growth Benchmarks

Family Law firms typically have higher realization rates (92%) but lower collection rates (82%) compared to other practice areas. However, for Family Law clients who have associated trust accounts, their matters have a realization rate that is much higher (96%) than those who don’t (78%). These matters also have a higher collection rate (85% compared to 70%).
It’s worth noting that reducing the number of unpaid bills also has a dramatic effect on the average amount collected per matter. For Family Law firms, when comparing matters with trust accounts to those without, average collections per matter jump from $1,499 per matter to $2,823.
How do trust accounts affect collection rates?
When looking at factors that affect law firm realization and collection rates, we can count the number of clients with associated trust accounts to create anonymized insights. We can also look at specific practice areas that are likely to use trust accounts as a means for collecting fees.
25 LEGAL TRENDS REPORT 2017
Growth Benchmarks

→ LEGAL SERVICE RATES
The billable hour is alive and wellLast year, we created the Billable Hour Index to estimate the average cost of one hour of legal service in the United States. This year, we’ve deepened our analysis to look at individual roles and how urban locales can influence hourly rates.

Despite growing discussions on flat fees and other value-based billing structures in the legal profession, one of the most important insights to glean from Clio’s user data is that the billable hour is still by far the most common method for tracking work and billing clients.
When we look at historical data over the past several years, we also see the proportion of hourly fees (about 81–86%) billed compared to flat fees has remained virtually unchanged.
Billable hour versus flat fees
Hourly versus flat fee billings
27 LEGAL TRENDS REPORT 2017
Legal service rates

When looking at practice areas most likely to bill using flat fees, Traffic (90%), Immigration (72%), and Criminal (59%) showed the highest rates. But flat fees were also common in other areas, including Elder Law (30%), Bankruptcy (29%), and Wills and Estates (25%).*
Where flat fees have taken hold
*For a full comparison of practice areas, see “Fee type by practice area” (Appendix C).
28 LEGAL TRENDS REPORT 2017
Legal service rates

Non-lawyer rate
US CPI
Law firm rate
Lawyer rateWe can map each insight to the Consumer Price Index (CPI) to see how they align with the overall cost of goods and services in the United States over time, painting a fuller picture of how a lawyer’s, or non-lawyer’s, hourly billings correspond to actual purchasing power and the ability to earn a living wage.
Lawyer versus non-lawyer hourly rates
This year, we’ve distinguished lawyer and non-lawyer roles from last year’s single benchmark rate, which we now call the “Law Firm” rate. We can now segment the Billable Hour Index into three key insights:
+ Law firm rate. Average billing rate across the whole law firm.
+ Lawyer rate. Average billing rate for lawyers.
+ Non-lawyer rate. Average billing rate for non-lawyer staff.*
*Non-lawyer rates may include non-lawyer staff such as paralegals, legal assistants, firm managers, or other administrative staff.
29 LEGAL TRENDS REPORT 2017
Legal service rates

Highest and lowest difference between lawyers and non-lawyers
Highest versus lowest lawyer hourly rates
Highest versus lowest non-lawyer hourly rates
May 2017Index Rate
May 2017Index Rate
Average hourly rates by state
Law firm rates have stayed relatively consistent with last year, especially when comparing rates between states. Now, however, we can also distinguish between lawyer and non-lawyer roles in each state.*
*For a complete list of lawyer and non-lawyer hourly rates, see “Hourly rates by state: Law firms, lawyers, non-lawyers” (Appendix C).
30 LEGAL TRENDS REPORT 2017
Legal service rates

Lawyer (urban)
Lawyer (rural)
Non-lawyer (urban)
Non-lawyer (rural)
How urban locales affect lawyer and non-lawyer hourly rates
+ Lawyers in urban areas earn more than their rural counterparts, and the difference in billable rates has been increasing over time.
+ Non-lawyers working in urban areas don’t bill significantly higher rates than their rural counterparts.
Using geographical classifications defined by the United States Census Bureau, we can compare hourly rates between urban and rural areas. We also see that, over time, the following insights have remained consistent:
Hourly rates for lawyers and non-lawyers, urban vs. rural
31 LEGAL TRENDS REPORT 2017
Legal service rates

Hourly rates for lawyers are increasing
Hourly rates for non-lawyers are increasing
2016 urban versus non-urban comparison
+ Urban lawyers +$31 per hour.
+ Rural lawyers +$17 per hour.
+ Urban non-lawyers +$9 per hour.
+ Rural non-lawyers +$1 per hour.
+ Urban lawyers made 25% more than rural lawyers in 2016.
+ Urban non-lawyers made 14% more than rural non-lawyers in 2016.
What we’ve seen for urban and rural professionals since 2012
32 LEGAL TRENDS REPORT 2017
Legal service rates

Hourly rates in greater metropolitan areas
Based on our aggregated and anonymized location data, we can look at hourly rates in America’s largest metropolitan areas.
Lawyer rates by metropolitan area
33 LEGAL TRENDS REPORT 2017
Legal service rates

Hourly rates by practice area
Our newly created list of practice areas gives us better insight into rates in different areas of law. These rates take into account the scope and diversity of law firms across the United States while being refined enough to offer relevant insights.*
*For a full list of practice areas see “Lawyer hourly rates by practice area” (Appendix C).
34 LEGAL TRENDS REPORT 2017
Legal service rates

Appendix

Utilization rate by state: lawyers, and non-lawyersUtilization rates show how much of an 8-hour day is put toward billable work.
36 LEGAL TRENDS REPORT 2017
Appendix A: Law firm KPIs
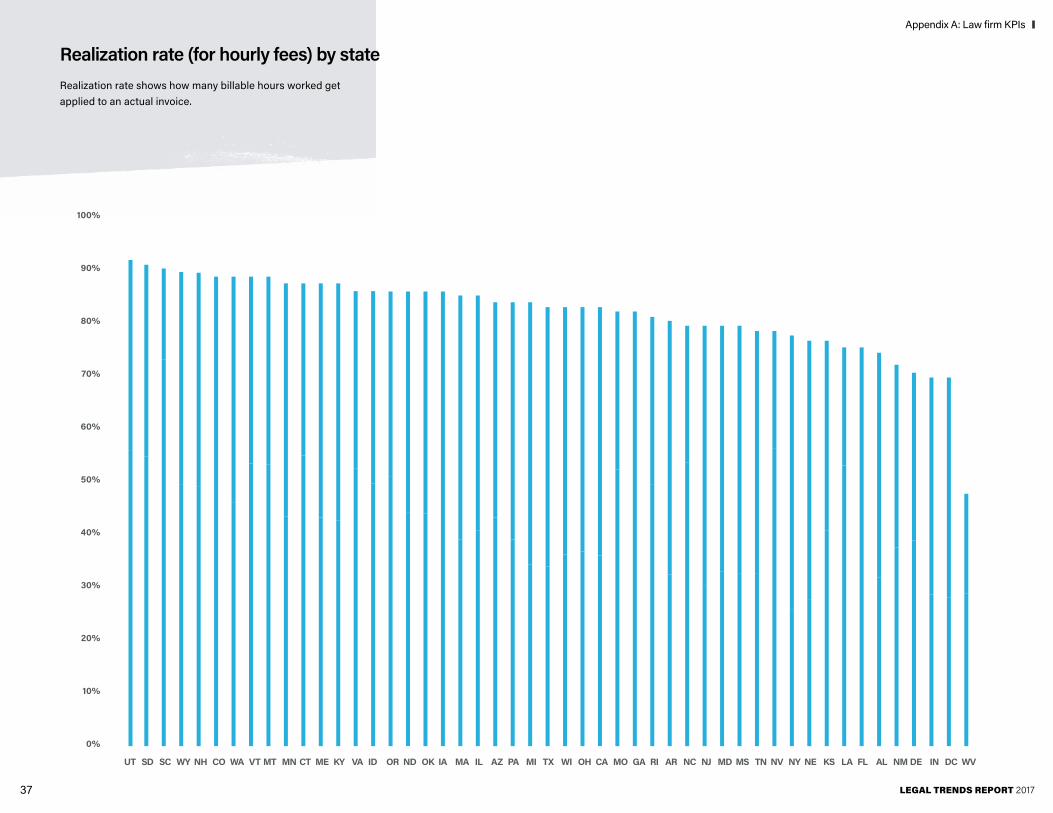
Realization rate (for hourly fees) by stateRealization rate shows how many billable hours worked get applied to an actual invoice.
37 LEGAL TRENDS REPORT 2017
Appendix A: Law firm KPIs

Realization rate (for hourly fees) by practice area
38 LEGAL TRENDS REPORT 2017
Appendix A: Law firm KPIs

Collection rate (for hourly fees) by stateCollection rate shows how many billed hours are actually paid by clients.
39 LEGAL TRENDS REPORT 2017
Appendix A: Law firm KPIs

Collection rate (for hourly fees) by practice area
40 LEGAL TRENDS REPORT 2017
Appendix A: Law firm KPIs

PRACTICE AREA P10 P50 P90 MEAN
Administrative $150 $813 $6,220 $3,023
Bankruptcy $390 $1,200 $3,500 $2,204
Business $180 $663 $3,566 $1,801
Civil Litigation $210 $1,208 $9,375 $4,535
Collections $150 $450 $2,453 $1,125
Commercial/Sale of Goods $200 $900 $5,994 $3,110
Construction $300 $1,328 $9,189 $4,154
Contracts $180 $600 $2,993 $1,502
Corporate $175 $800 $4,750 $2,460
Criminal $150 $750 $3,500 $1,482
Elder Law $165 $788 $6,950 $2,298
Employment/Labor $205 $1,170 $8,880 $3,925
Family $280 $1,538 $7,145 $3,165
Government $150 $500 $3,150 $1,767
PRACTICE AREA P10 P50 P90 MEAN
Immigration $150 $950 $3,500 $1,492
Insurance $300 $1,868 $9,900 $4,181
Intellectual Property $200 $750 $2,925 $1,973
Juvenile $158 $538 $2,330 $1,067
Mediation/Arbitration $175 $600 $2,505 $1,334
Personal Injury $250 $1,500 $7,500 $3,334
Real Estate $165 $595 $3,380 $1,537
Small Claims $150 $478 $1,589 $712
Tax $145 $550 $4,000 $1,733
Traffic Offenses $110 $300 $2,000 $708
Trusts $250 $1,304 $5,885 $2,854
Wills & Estates $200 $750 $3,015 $1,461
Worker's Compensation $380 $1,944 $8,766 $3,680
Case value by practice area
41 LEGAL TRENDS REPORT 2017
Appendix B: Case values

Fee type by practice area
42 LEGAL TRENDS REPORT 2017
Appendix C: Billable hour index

Hourly rates by state: law firms, lawyers, and non-lawyers
43 LEGAL TRENDS REPORT 2017
Appendix C: Billable hour index

Real hourly rates by state: law firms, lawyers, non-lawyersWhen comparing average billing rates to the estimated cost of living in each state, we can derive a “real” billable rate that reflects actual purchasing power.
44 LEGAL TRENDS REPORT 2017
Appendix C: Billable hour index

Hourly rates by practice area: law firms, lawyers, non-lawyers
45 LEGAL TRENDS REPORT 2017
Appendix C: Billable hour index

The Legal Trends Report has been prepared using data aggregated and anonymized from the usage activity of approximately 60,000 Clio customers. These customers were identified using the following criteria:
The Legal Trends Report uses aggregated and anonymized data collected from the Clio platform, which gives us the foundation to identify informative and interesting patterns to observe and investigate. By synthesizing actual usage data, we’re able to identify trends that would be otherwise invisible to most firms.
Defining our data set
Appendix D: Detailed methodology
+ They were paid subscribers to Clio, meaning customers who were evaluating the product via a free trial, or were using Clio as part of our Academic Access Program were not included in this data set.
+ They were located in the contiguous United States, thus including the District of Columbia but excluding Hawaii and Alaska. No customers in other countries were included in our data set.
+ For 2016 key performance indicators, only customers who created matter and billing data in 2016 were included.
+ Any data from customers who opted out of aggregate reporting were excluded.
+ Outlier detection measures were implemented to systematically remove statistical anomalies from the data set.
46 LEGAL TRENDS REPORT 2017
Appendix D: Methodology

The security and privacy of customer data is our top priority at Clio. In preparing the Legal Trends Report, Clio’s data operations team observed the highest standard of data collection and reporting.
Data usage and privacy
DATA COLLECTION
REPORTING
+ All data insights were obtained in strict accordance with Clio’s Terms of Service (section 2.12).
+ All extracted data was aggregated and anonymized.
+ No personally identifiable information was used.
+ No data belonging to any law firm’s clients was used.
Aggregate data has been generalized where necessary to avoid instances where individual firm data could be identified. For example, to avoid reporting data on a small town with only one law firm (which would implicate all of this town’s data to this firm), we only report at country, state, and metropolitan levels. Additionally, raw data sets will never be shared externally.
Clio is effectively a tally counter for user interactions—much like stadiums use turnstiles to count visitors without collecting any personally identifiable information. Similarly, as users interact with the Clio platform they trigger usage signals we can count and aggregate into data sets. We can identify trends without collecting information that reveals anything specific about individual customers.
47 LEGAL TRENDS REPORT 2017
Appendix D: Methodology

Survey data
+ Law firm survey. We surveyed 2,915 legal professionals, representing both Clio users and non-Clio users.
+ Consumer survey. We surveyed 2,002 consumers, representing both those who have had a legal issue in the past and those who have not.
We've used key findings from these surveys to supplement our data analyses throughout the report. With input from legal professionals across the industry, we've been able to generate better insight into how lawyers are meeting the needs of their clients and supporting the future of their business.
To explore the underlying causalities that influence trends presented in this report, we conducted our own surveys to supplement our data analysis:
48 LEGAL TRENDS REPORT 2017

© 2017 Themis Solutions Inc.
Founded in 2008, Clio is the most comprehensive cloud-based practice management platform for the legal industry. With the help of the cloud, Clio eases the processes of time tracking, billing, administration, and collaboration for law firms of all sizes. One of Canada’s fastest-growing companies with international reach, Clio employs over 240 individuals with a rapidly growing customer base spanning 90 countries. For the last two years, Clio’s growth has been recognized by Deloitte on both the Fast50 and the Fast500 lists.
Learn more at clio.com.
49 LEGAL TRENDS REPORT 2017