Lecture7 Topic1: Graph spectral analysis/Graph spectral clustering and its application to metabolic...
29
Lecture7 Topic1: Graph spectral analysis/Graph spectral clustering and its application to metabolic networks Topic 2: Concept of Line Graphs Topic 3: Introduction to Cytoscape
-
Upload
amanda-reeves -
Category
Documents
-
view
234 -
download
0
Transcript of Lecture7 Topic1: Graph spectral analysis/Graph spectral clustering and its application to metabolic...
Lecture7Topic1: Graph spectral analysis/Graph spectral clustering and its application to metabolic networksTopic 2: Concept of Line GraphsTopic 3: Introduction to Cytoscape

Graph spectral analysis/
Graph spectral clustering

PROTEIN STRUCTURE: INSIGHTS FROM GRAPH THEORY
bySARASWATHI VISHVESHWARA, K. V. BRINDA and N. KANNANy
Molecular Biophysics Unit, Indian Institute of ScienceBangalore 560012, India

Laplacian matrix L=D-A
Adjacency Matrix Degree Matrix

Eigenvalues of a matrix A are the roots of the following equation
|A-λI|=0, where I is an identity matrix
Let λ is an eigenvalue of A and x is a vector such that
then x is an eigenvector of A corresponding to λ .
-----(1)N×N N×1 N×1
Eigenvalues and eigenvectors
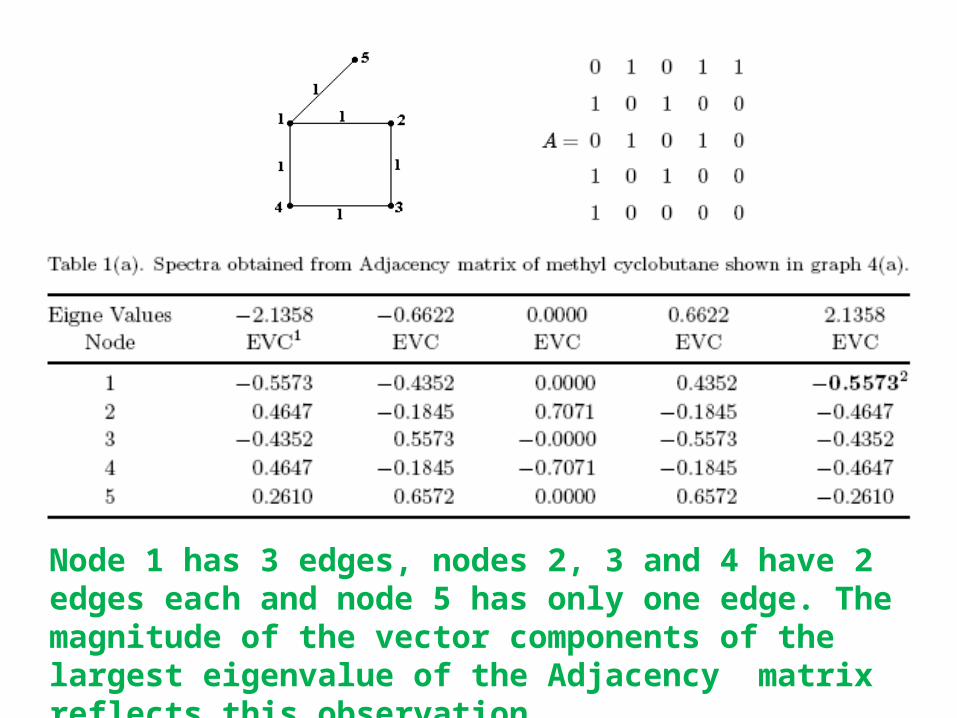
Node 1 has 3 edges, nodes 2, 3 and 4 have 2 edges each and node 5 has only one edge. The magnitude of the vector components of the largest eigenvalue of the Adjacency matrix reflects this observation.

Node 1 has 3 edges, nodes 2, 3 and 4 have 2 edges each and node 5 has only one edge. Also the magnitude of the vector components of the largest eigenvalue of the Laplacian matrix reflects this observation.

The largest eigenvalue (lev) depends upon the highest degree in the graph. For any k regular graph G (a graph with k degree on all the vertices), the eigenvalue with the largest absolute value is k. A corollary to this theorem is that the lev of a clique of n verticesis n − 1. In a general connected graph, the lev is always less than or equal to (≤ ) to the largest degree in the graph. In a graph with n vertices, the absolute value of lev decreasesas the degree of vertices decreases. The lev of a clique with 11 vertices is 10 and that of a linearchain with 11 vertices is 1.932
a linear chain with 11 vertices

In graphs 5(a)-5(e), the highest degree is 6. In graphs 5(f)-5(i), the highest degree is 5, 4, 3 and 2 respectively.

It can be noticed that the lev is generally higher if the graph contains vertices of high degree. The lev decreases gradually from the graph with highest degree 6 to the one with highest degree 2. In case of graphs 5(a)-5(e), where there is one common vertex with degree 6 (highest degree) and the degrees of the other vertices are different (less than 6 in all cases), the lev differs i.e. the lev also depends on the degree of the vertices adjoining the highest degree vertex.

This paper combines graph 4(a) and graph 4(b) and constructs a Laplacian matrix with edge weights (1/dij ), where dij is the distance between vertices i and j. The distances between the vertices of graph 4(a) and graph 4(b) are considered to be very large (say 100) and thus the matrix elements corresponding to a vertex from graph 4(a) and the other from graph 4(b) is considered to have a very small value of 0.01. The Laplacian matrix of 8 vertices thus considered is diagonalized and their eigenvalues and corresponding vector components are given in Table 3.
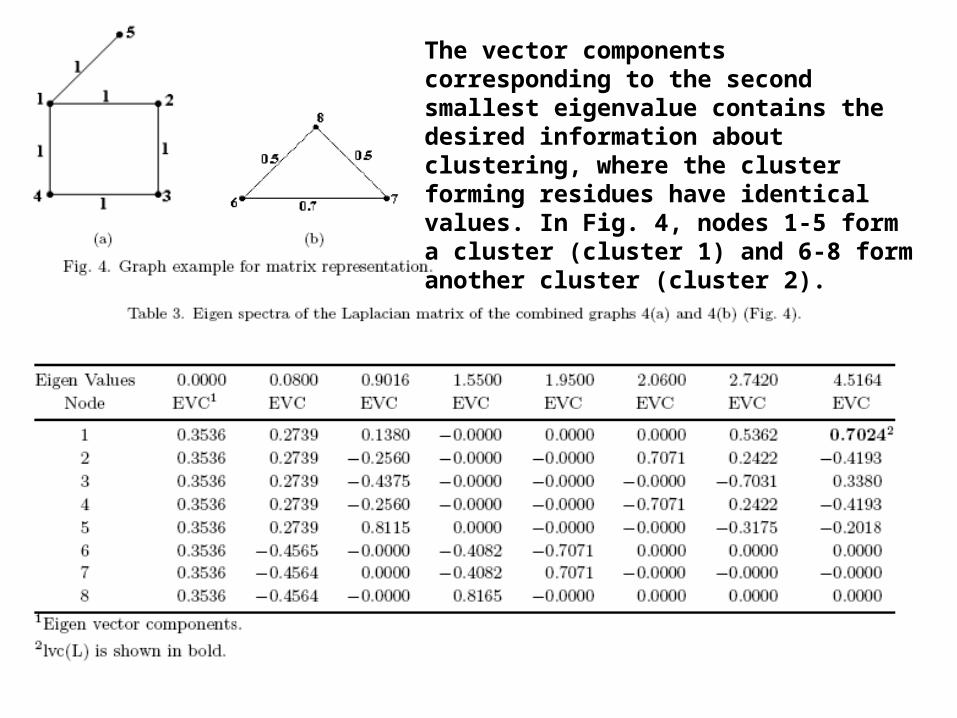
The vector components corresponding to the second smallest eigenvalue contains the desired information about clustering, where the cluster forming residues have identical values. In Fig. 4, nodes 1-5 form a cluster (cluster 1) and 6-8 form another cluster (cluster 2).

Metabolome Based Reaction Graphs of M. tuberculosis and M. leprae: A Comparative Network Analysisby
Ketki D. Verkhedkar1, Karthik Raman2, Nagasuma R. Chandra2, Saraswathi Vishveshwara1*1 Molecular Biophysics Unit, Indian Institute of Science, Bangalore, India, 2 Bioinformatics Centre, Supercomputer Education and Research Centre, Indian Institute of Science, Bangalore, IndiaPLoS ONE | www.plosone.org September 2007 | Issue 9 | e881
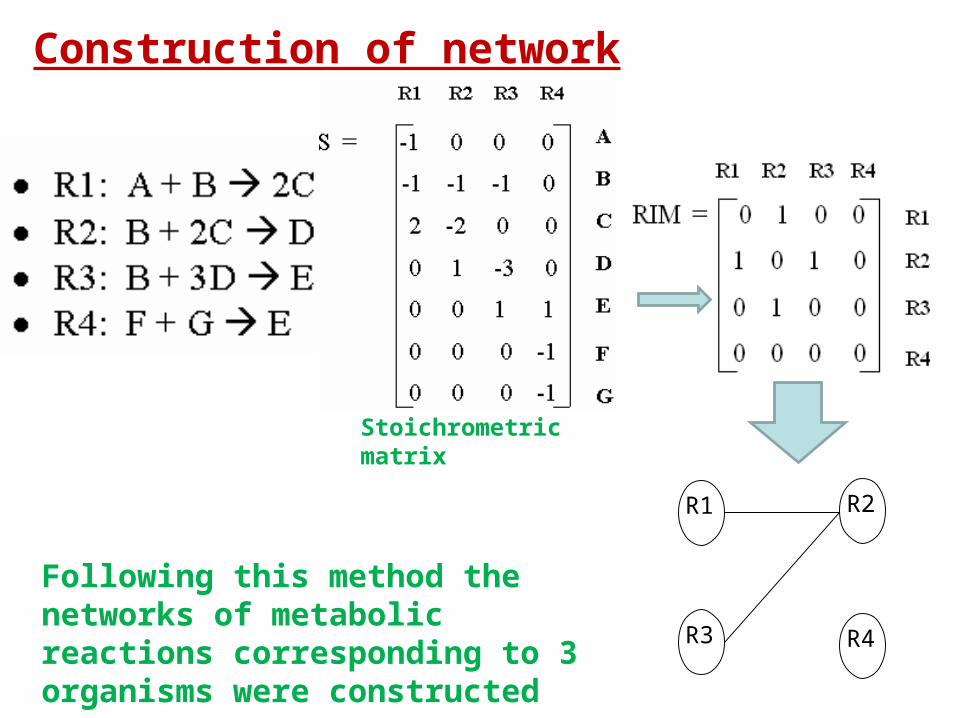
Construction of network
R1 R2
R3 R4
Stoichrometric matrix
Following this method the networks of metabolic reactions corresponding to 3 organisms were constructed


Analysis of network parameters
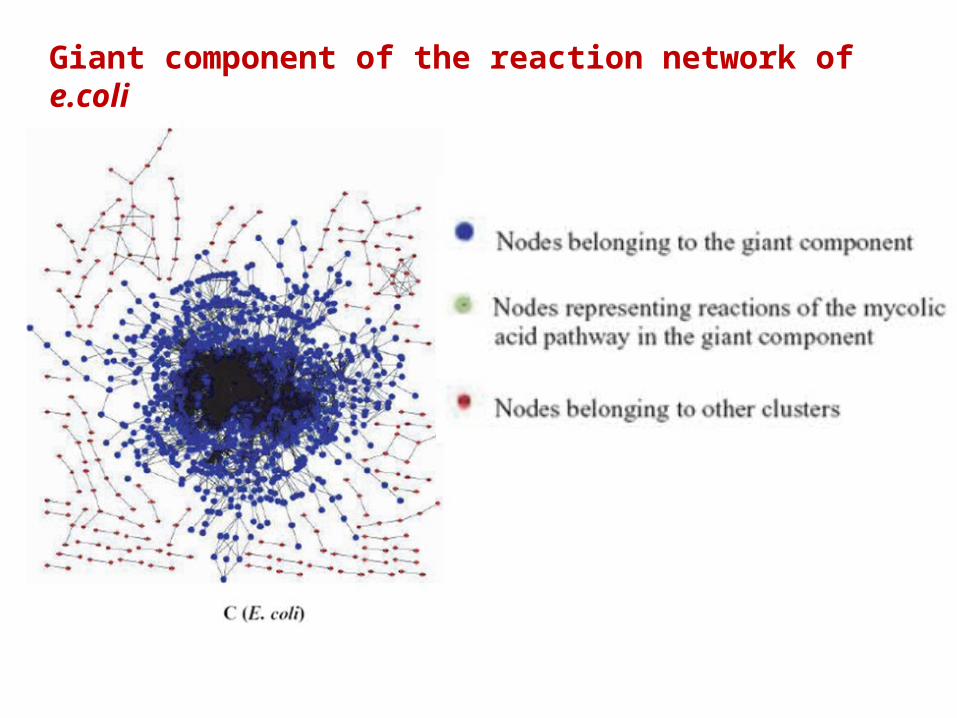
Giant component of the reaction network of e.coli

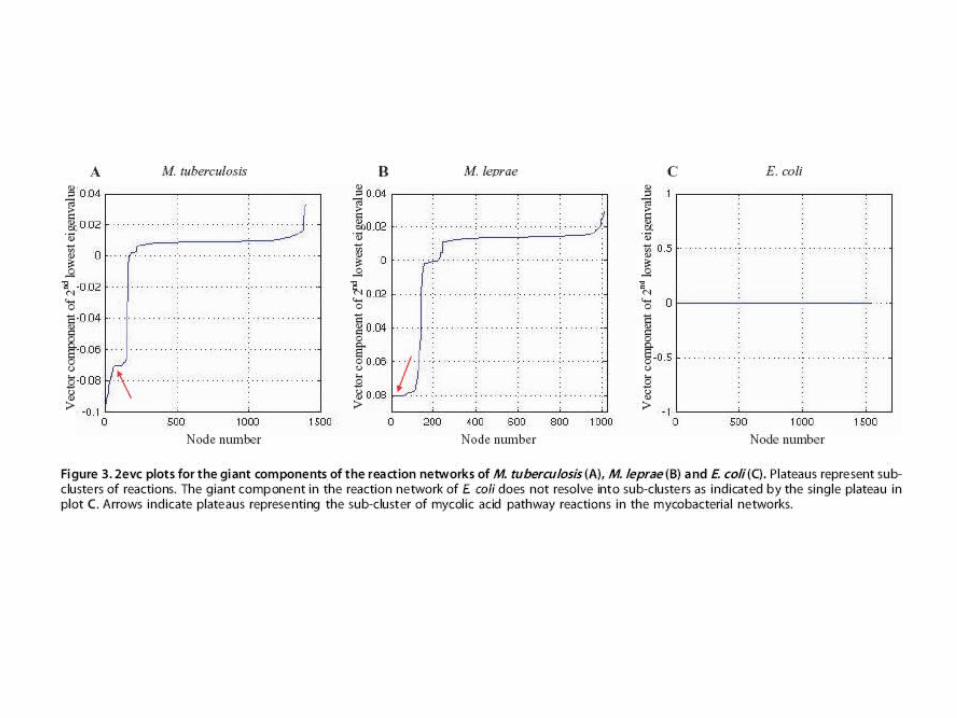
Giant components of the reaction networks of M. tuberculosis and M. leprae
Analyses of sub-clusters in the giant componentGraph spectral analysis was performed to detect sub-clusters of reactions in the giant component.To obtain the eigenvalue spectra of the graph, the adjacency matrix of the graph is converted to a Laplacian matrix (L), by the equation:L=D-Awhere D, the degree matrix of the graph, is a diagonal matrix in which the ith element on the diagonal is equal to the number of connections that the ith node makes in the graph.
It is observed that reactions belonging to fatty acid biosynthesis and the FAS-II cycle of the mycolic acid pathway in M. tuberculosis form distinct, tightly connected sub-clusters.


Identification of hubs in the reaction networksIn biological networks, the hubs are thought to be functionally important and phylogenetically oldest.
The largest vector component of the highest eigenvalue of the Laplacian matrix of the graph corresponds to the node with high degree as well as low eccentricity. Two parameters, degree and eccentricity, are involved in the identification of graph spectral (GS) hubs.

Identification of hubs in the reaction networks
Alternatively, hubs can be ranked based on their connectivity alone (degree hubs).
It was observed that the top 50 degree hubs in the reaction networks of the three organisms comprised reactions involving the metabolite L-glutamate as well as reactions involving pyruvate. However, the top 50 GS hubs of M. tuberculosis and M. leprae exclusively comprised reactions involving L-glutamate while the top GS hubs in E. coli only consisted of reactions involving pyruvate.
The difference in the degree and GS hubs suggests that the most highly connected reactions are not necessarily the most central reactions in the metabolome of the organism


Line Graphs
Given a graph G, its line graph L(G) is a graph such thateach vertex of L(G) represents an edge of G; and two vertices of L(G) are adjacent if and only if their corresponding edges share a common endpoint ("are adjacent") in G.
Graph G Vertices in L(G) constructed from edges in G
Added edges in L(G)
The line graph L(G)
http://en.wikipedia.org/wiki/Line_graph

Line Graphs
RASCAL: Calculation of Graph Similarity using Maximum Common Edge SubgraphsBy JOHN W. RAYMOND1, ELEANOR J. GARDINER2 AND PETER WILLETT2
THE COMPUTER JOURNAL, Vol. 45, No. 6, 2002
The above paper has introduced a new graph similarity calculation procedure for comparing labeled graphs.
The chemical graphs G1 and G2 are shown in Figure a,and their respective line graphs are depicted in Figure b.

Line GraphsDetection of Functional Modules FromProtein Interaction NetworksBy Jose B. Pereira-Leal,1 Anton J. Enright,2 and Christos A. Ouzounis1
PROTEINS: Structure, Function, and Bioinformatics 54:49–57 (2004)
Transforming a network of proteins to a network of interactions. a) Schematic representation illustrating a graph representation of protein interactions: nodes correspond to proteins and edges to interactions. b) Schematic representation illustrating the transformation of the protein graph connected by interactions to an interaction graph connected by proteins. Each node represents a binary interaction and edges represent shared proteins. Note that labels that are not shared correspond to terminal nodes in (a)
A star is transformed into a clique

Download Cytoscape from
http://cytoscape.org/
Read more about NetworkAnalyzer
http://med.bioinf.mpi-inf.mpg.de/netanalyzer/