Lecture Metrics & Risks Risk Exposure = Prob(failure) x Cost of Failure CS 551.
39
Lecture Metrics & Risks Risk Exposure = Prob(failure) x Cost of Failure CS 551
-
date post
21-Dec-2015 -
Category
Documents
-
view
218 -
download
0
Transcript of Lecture Metrics & Risks Risk Exposure = Prob(failure) x Cost of Failure CS 551.

Lecture Metrics & Risks Risk Exposure = Prob(failure) x Cost of Failure
CS 551

Technical Metrics
Halstead McCabe Fan-in/Fan-out

Halstead -”software science”
Stresses syntactic units rather than LOC Model components:
• Operators - actions: +, -, *, /, if-then-else,…• Operands - data: variables and constants• 4 basic entities (used in a bunch of equations)
» n1 - # of different operators
» n2 - # of different operands
» N1 - total occurrences of operators
» N2 - total occurrences of operands
• Length of Program for Halstead: N = N1 + N2

Halstead use
Simple to calculate, no in-depth examination of structure Measure of overall quality of modules Helpful to program designers and to maintainers Substantial literature Requires coding of modules Automatic feedback to program developers Does not account for complexity of interfaces

McCabe’s Cyclomatic Complexity
Based on a directed graph showing control flow of program thereby showing the number of independent paths in the program
Cyclomatic Complexity, CV= e - n + p + 1 where:• e = # of edges (path links)• n = # of nodes• p = # of connected modules or code segments (1 for
main program and 1 for each procedure) ’10’ is the upper limit of McCabe complexity

McCabe use
Great for testing because it uncovers all linearly independent paths
Does not add more complexity to nested loops and in general does not consider context
Unlike Halstead. McCabe does account for control flow complexity, but not data flow
Useful for individual developer feedback and during maintenance
Fan In/Fan Out
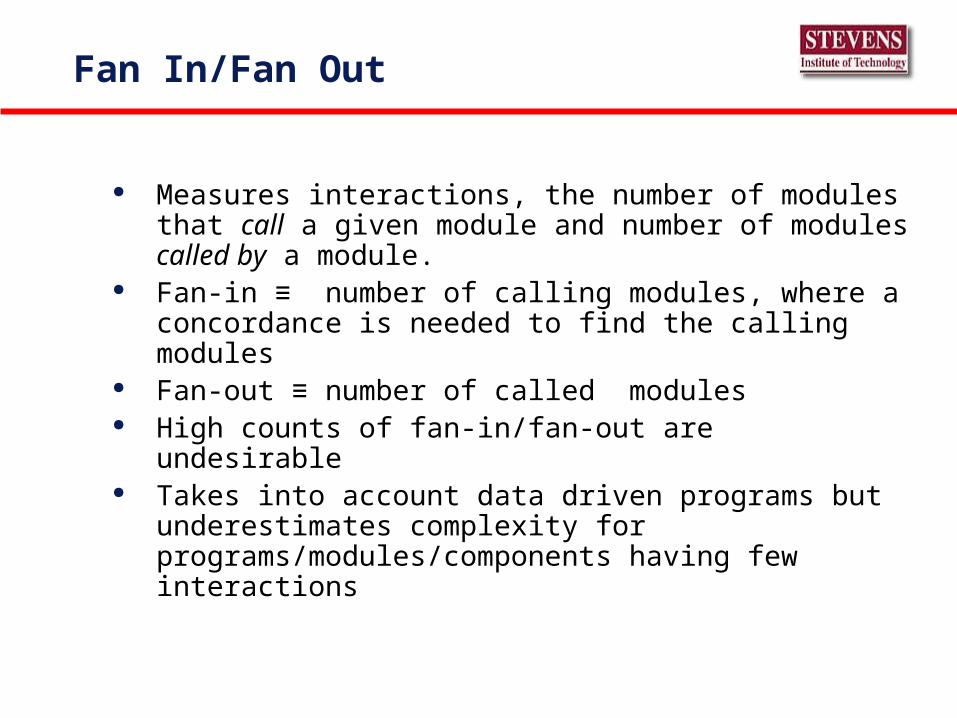
Measures interactions, the number of modules that call a given module and number of modules called by a module.
Fan-in ≡ number of calling modules, where a concordance is needed to find the calling modules
Fan-out ≡ number of called modules High counts of fan-in/fan-out are undesirable Takes into account data driven programs but
underestimates complexity for programs/modules/components having few interactions

Interesting combined metric
Complexity ≈ [CV/NCSLOC][(Fan-in)(Fan-out)]2 ,where CV = e - n + p + 1 and dividing by NCSLOC provides a measure of the density of loops in a component and50< NCSLOC < 1000
Alternative: Complexity ≈ [CV*NCSLOC][(Fan-in)(Fan-out)]2 here size increases complexity number
Problem: This metric in not well calibrated and Pfleeger claims that the goal for a component is to have high fan in and low fan out.
Try it, you’ll like it

Risk event is undesired a possible project impacting event
Activity Activity
Impacting Event with Probability and Cost
X
ContingencyActivity

What makes a project risky ?
Structure Technology Size Risk (if well managed)
High Low Small Low
High Low Big Low to Medium
High High Big Medium
Low High Big Huge
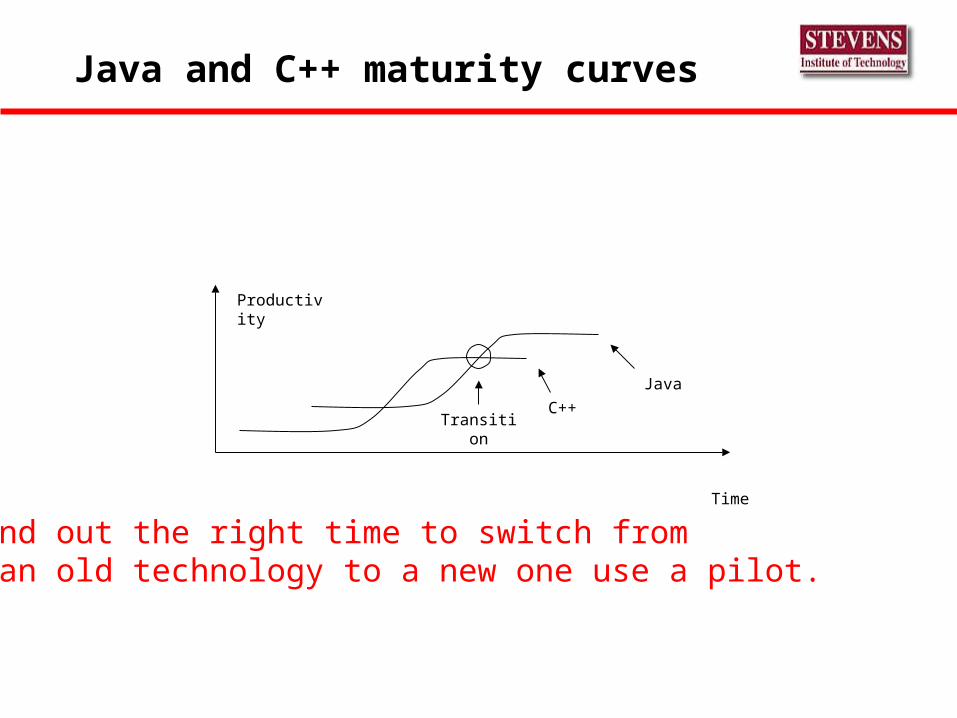
Java and C++ maturity curves
Productivity
Time
TransitionC++
Java
To find out the right time to switch from an old technology to a new one use a pilot.

Factors that increase risk
Management Malpractice Excessive Schedule Pressure (65% of projects) Creeping Featurism Silver Bullet Syndrome with wandering technologists Inaccurate and Inadequate Metrics Poor cost Estimates Quality shortfalls, buggy code Size

Common telecommunications software risks (Capers Jones view 1992)
Excessive paperwork Lack of reusable components Poor management tools Aging software Security and viral protection Corporate hardware focus with inferior status of
software people Inadequate specialization

Risk do’s and don’ts
Do Deal only with the top 10 risks at a time Don’t overestimate the risks Don’t do too much contingency planning Don’t underestimate the risks, this leads to panic
management later Don’t look for scapegoats Do be the ‘blame engineer’

Typical Risks
Problem Vulnerable Project Phase
Unrealistic or unarticulated project goals – No MOV
Requirements
Inaccurate estimates of needed resources Architecture
Incomplete or inconsistent feature definitions Requirements
Sugar coating project status All
Unmanaged risks All
Poor communication among customers, developers, and users
Requirements
Use of immature technology Implementation
Inability to handle the project's complexity Implementation
Sloppy development practices All
Poor project management All
Stakeholder politics Requirements
Commercial pressures Requirements

Twenty Project Study- Risk Histogram

Omission vs. Commission

Risk Analysis
Let Prob (E) be the probability of a favorable outcome that can be any one of m events. The risk of E happening is:
Prob (E) = m/n,Where m is the number of favorable events
n is the total number of possible events.
Let RE be the risk exposure. RE = Prob (E not happening) x Loss = [1-Prob (E)] x Loss
Recall that the Win-Win Spiral Model makes a risk exposure evaluation for every cycle.

Uniform Loss
Uniform Loss = loss/day x (days late),
For a project employing 100 people,
Loss =[cost of retaining 100 people per day + daily project overhead + daily opportunity cost of savings or profits from this and other projects] [days late]
Loss vs. Time
Committed operational date

Taguchi Loss
Loss = Loss (Budget) + [daily opportunity cost of savings or profits from this and other projects] [days late], where
Loss (budget)=M[incurred cost-budget]2, and
budget= (cost per day) (estimated days)M = Maximum acceptable loss/ Maximum over budget
For a project employing 100 people,
Loss vs. Time
Committed operational date
Problem
Suppose you have analyzed the system development process, and you know you are working under tight deadlines for delivery. You will be building the system in a series of releases, where each release has more functionality than the one that preceded it. Because the system is designed so that functions are relatively independent, you are considering testing only the new functions for a release, and assuming that the existing functions still work as they did before. Thus, you may decide that there are risks associated with not performing regression testing: the assurance that existing functionality still works correctly.

Risk Management

Risk Exposure Calculation
© Assessing Project RiskShari Lawrence Pfleeger - University of Maryland

Problem Solution
For each possible outcome, you estimate two quantities: the probability of an unwanted outcome, P(UO), and the loss associated with the unwanted outcome, L(UO). For instance, there are three possible consequences of performing regression testing: finding a critical fault if one exists, not finding the critical fault (even though it exists), or deciding (correctly) that there is no critical fault. As the figure illustrates, we have estimated the probability of the first case to be 0.75, of the second to be 0.05, and of the third to be 0.20. The likelihood of an unwanted outcome is estimated to be $0.5 million if a critical fault is found, so that the risk exposure is $0.375 million. Similarly, we calculate the risk exposure for the other branches of this decision tree, and we find that our risk exposure if we perform regression testing is almost $2 million. However, the same kind of analysis shows us that the risk exposure if we do not perform regression testing is almost $17 million. Thus, we say (loosely) that more is at risk if we do not perform regression testing.
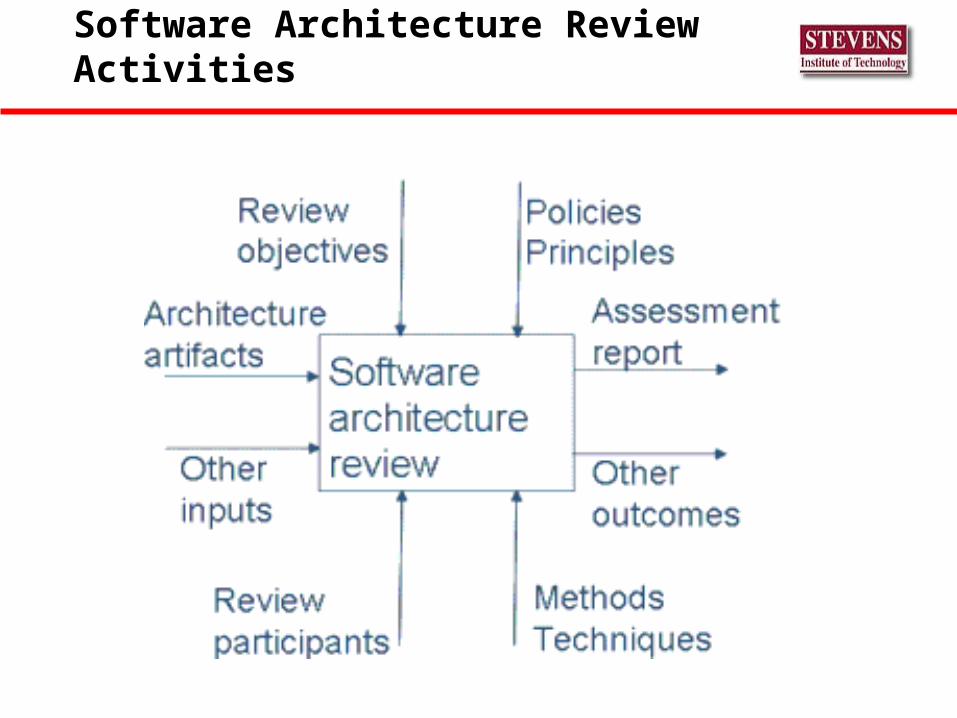
Software Architecture Review Activities
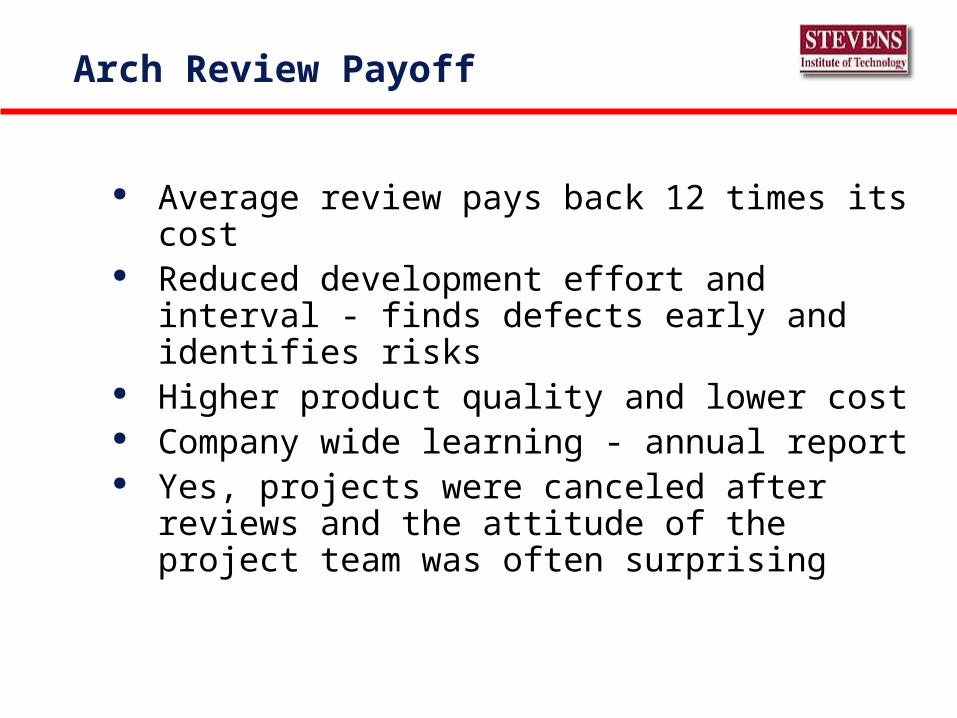
Arch Review Payoff
Average review pays back 12 times its cost Reduced development effort and interval - finds
defects early and identifies risks Higher product quality and lower cost Company wide learning - annual report Yes, projects were canceled after reviews and the
attitude of the project team was often surprising

Ten deadly estimation sins
1. Confusing targets with estimates.2. Saying “yes” when you really mean “no.”3. Committing to estimates too early.4. Underestimating 5. Estimating in the “impossible zone”6. Overestimating savings from new tools or methods7. Using only one estimation technique8. Not using estimation software9. Not including risk impacts in estimates10. Providing off-the-cuff estimates

Specification for Development Plan
Project Feature List Development Process Size Estimates Staff Estimates Schedule Estimates Organization Gantt Chart

Contingency Planning
Contingency is the resources needed to reduce the probability of a risk to 0.2
Risk Reduction leverage (RE Lev) RE Lev = RE (nominal) – RE (at
contingency) (Risk reduction Cost)

Risk Exposure Sweet Spot

Risk Heuristics
Unrealistic schedule is a common project risk. Schedule slip rates remain the same throughout a project
unless steps are taken to change the causes of slippage Contingency funding should bring the risk probability to
0.2 Periodically and quantitatively evaluate risks- project
meeting are the place to consider the ‘top-ten.’ Minimize risks by doing the hard part first. Human Interfaces and customer acceptance are major
risks to most projects.

Analyze Risk
Probability of risk, USAF Handbook categories are very low, low, medium, high and very high
Impact of risk, USAF Handbook categories are negligible, marginal, critical and catastrophic
Risks are rarely independent A matrix is used to determine overall risk for different
categories (e.g., effort, performance, schedule, cost, support)
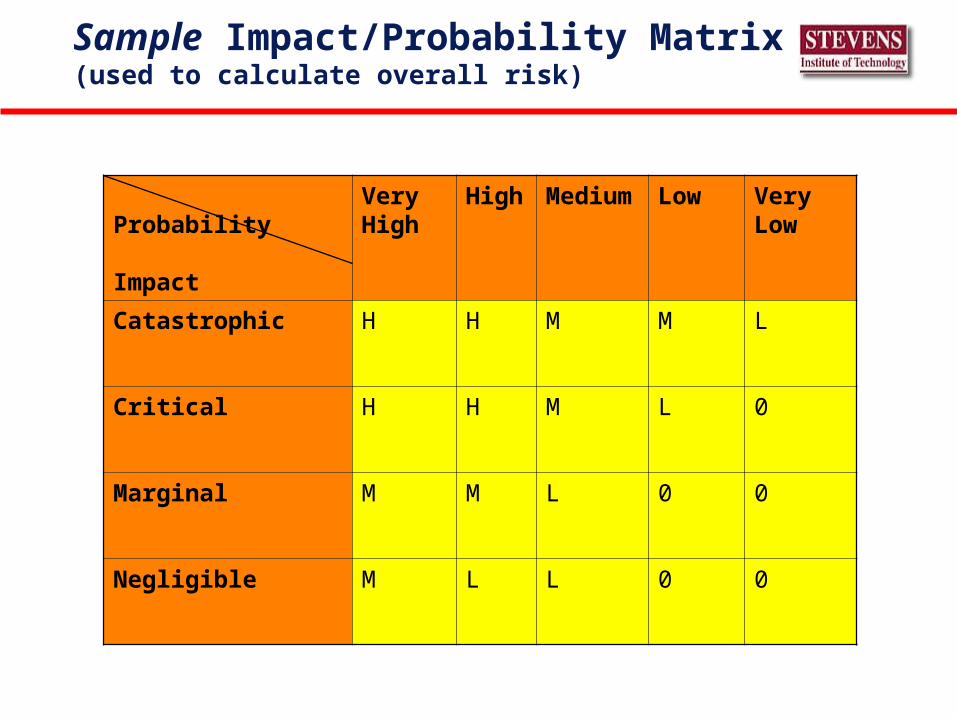
Sample Impact/Probability Matrix(used to calculate overall risk)
Probability
Impact
Very High
High Medium Low Very Low
Catastrophic H H M M L
Critical H H M L 0
Marginal M M L 0 0
Negligible M L L 0 0

Risk Tracking and Control
Use Action Item system Track status of risks and actions taken to address them Define Risk Exposure
RE = Prob(risk) x Cost(risk)
Review ten risks with highest RE at every project meeting
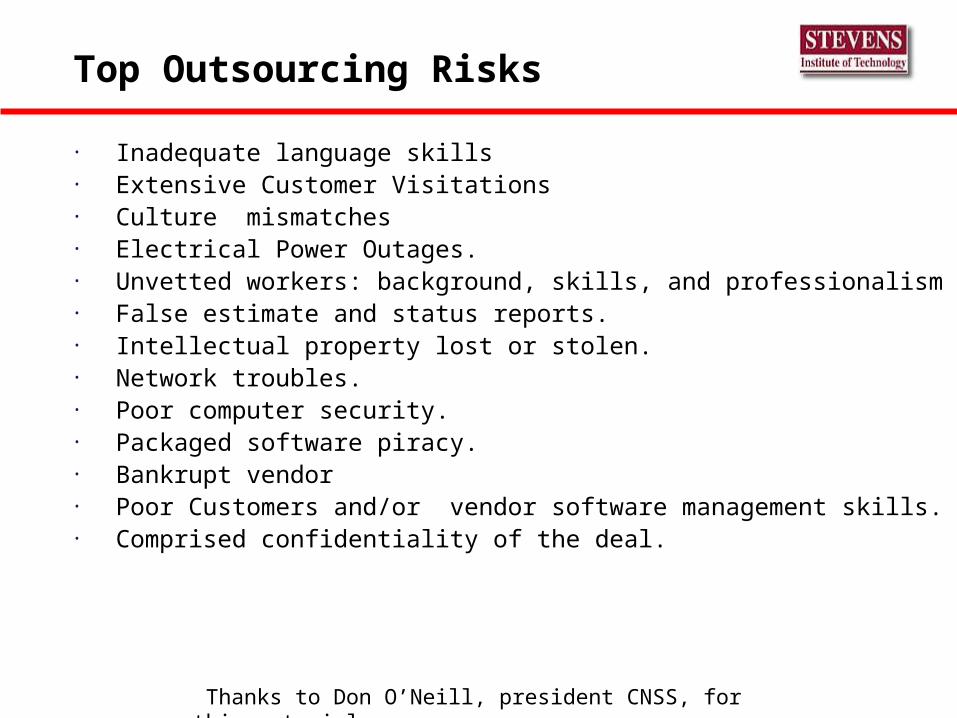
Top Outsourcing Risks
• Inadequate language skills• Extensive Customer Visitations• Culture mismatches • Electrical Power Outages.• Unvetted workers: background, skills, and professionalism • False estimate and status reports.• Intellectual property lost or stolen.• Network troubles.• Poor computer security.• Packaged software piracy.• Bankrupt vendor• Poor Customers and/or vendor software management skills.• Comprised confidentiality of the deal.
Thanks to Don O’Neill, president CNSS, for this material.

Low Wages
Average Annual Salary: Programmer
$0
$10,000
$20,000
$30,000
$40,000
$50,000
$60,000
$70,000
Vietn
am
Indi
a
China
Philipp
ines
Russia
Mal
aysia
Brazil
Mex
ico
Irela
nd
Sing
apor
e
Canad
a
Unite
d St
ates
Source: neoIT
@Copyright Don O'Neill, 2005

Tracing the Offshore Delta
Development Activities Onshore Offshore Inhouse Offshore Base Delta Portion Portion
Planning 10 5 10 5Requirements Determination 20 20Offshore Vendor Selection 2 2Transition Offshore 8 4 4Specification/Design 20 20Code 20 20Test 20 5 5 20Transition Inhouse 8 4 4Oversight 10 5 10 5
100 33 55 78
@Copyright Don O'Neill, 2005

Outsourcing Demographics
A US software project requires about 1 high value for ever 2 low value job.
Outsourcing software increases project effort to 130%.- High value jobs (business, legal, and program management) remain in the US. - Low value jobs (software implementation) move offshore.
The added 30% created by off shoring are medium value jobs evenly split between US (process functions) and offshore (software management and culture mediation functions).
Rate US work at full cost; then offshore work is 1/6 to 1/3 of US full cost.
- US workers perform 48% (33% + 15%) of workload in high and medium value jobs.- Offshore workers performs 82% (67% + 15%) of workload in medium and low value jobs.
Outsourcing results in 22% cost reduction at lowest labor rate and US workers assigned to new projects or laid off.
Thanks to Don O’Neill, president CNSS, for this material.

Outsourcing Enablers
Educated workforce. Local government incentives. Inexpensive telecommunications. Defined software development life cycle processes.
» SEI Capability Maturity Model Commoditization of software skills
» Low service role, first: code, test, and maintenance role
» Higher value role, second: next: design, code, and test Low wages
Thanks to Don O’Neill, president CNSS, for this material.