Lecture 8 Risks & Metrics Risk Exposure = Prob(failure) x Cost of Failure CS 540 – Quantitative...
40
Lecture 8 Risks & Metrics Risk Exposure = Prob(failure) x Cost of Failure CS 540 – Quantitative Software Engineering
-
date post
19-Dec-2015 -
Category
Documents
-
view
215 -
download
1
Transcript of Lecture 8 Risks & Metrics Risk Exposure = Prob(failure) x Cost of Failure CS 540 – Quantitative...

Lecture 8 Risks & Metrics Risk Exposure = Prob(failure) x Cost of Failure
CS 540 – Quantitative Software Engineering

Software Risk
Risk is the possibility that an undesirable event in the life of a software project can happen• Requires uncertainty and loss
Project Risk: cost, schedule, completion Technical Risk: feasibility, viability, etc. Business Risk: contractual compliance, payment, Legal Risk: damages, liability

Risk event is undesired a possible project impacting event
Activity Activity
Impacting Event with Probability and Cost
X
ContingencyActivity

What makes a project risky ?
Structure Technology Size Risk (if well managed)
High Low Small Low
High Low Big Low to Medium
High High Big Medium
Low High Big Huge

Software Engineering Institute (SEI) Risk Analysis
Incomplete requirements Tight schedule Understaffed Staff morale Design problems Feature set too large Technology immature Late planned deliveries of OS/3PS SOX compliance procedures

Factors that increase risk
Excessive Schedule Pressure (65% of projects) Management Malpractice Inaccurate and Inadequate Metrics Poor cost Estimates Silver Bullet Syndrome Creeping Featurism Quality shortfalls Size growth

Risk do’s and don’ts
1. Don’t overestimate the risks
2. Don’t do too much contingency planning
3. Don’t underestimate the risks, this leads to panic management later
4. Don’t look for scapegoats
5. Deal only with the top 10 risks at a time

Boehm’s Risk Management Taxonomy
*

Software Intensive Systems-of-Systems Risks- Boehm CrossTalk, May 2004
1. Acquisition management and staffing2. Requirements/architecture feasibility3. Achievable software schedules4. Supplier integration5. Adaptation to rapid change6. Quality factor achievability and tradeoffs7. Product integration and electronic upgrade8. Software COTS and reuse feasibility9. External interoperability10. Technology readiness
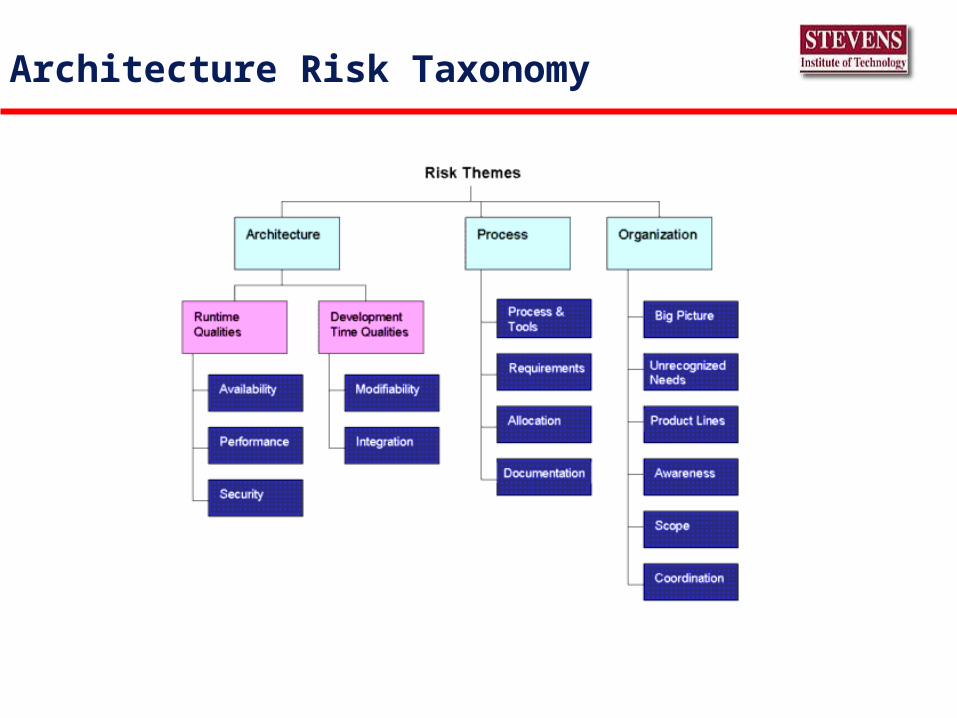
Architecture Risk Taxonomy
.

Risk Taxonomy(adapted from CMU/SEI-93-TR-6)
SEI RISK TAXONOMY
Stability Scale
Requirements Engineering Specialties
Product Engineering
Formality Product Control
Development Process Work Environment
Development Environment
Schedule Facilities
Resource Program Interfaces
Program Constraints
Software Development Risks

Ten most software serious risks (Capers Jones view 1992)
1. Schedule pressure2. Malpractice3. Creeping requirements4. Low quality5. Low productivity6. Silver Bullet syndrome7. Inaccurate metrics8. Inadequate measurement9. Inaccurate estimating10. Canceled projects

Common telecommunications software risks (Capers Jones view 1992)
Excessive paperwork Lack of reusable components Poor Management tools Aging software Security and viral protection Corporate hardware focus Low status of software staff Inadequate specialization

Risk Determination from
Historical Data Project and Customers experience with Wide-
band Delphi. Business plan assumptions Expert opinions

Typical Risks
Problem Vulnerable Project Phase
Unrealistic or unarticulated project goals – No MOV
Requirements
Inaccurate estimates of needed resources Architecture
Poor system requirements Requirements
Sugar coating project status All
Unmanaged risks All
Poor communication among customers, developers, and users
Requirements
Use of immature technology Implementation
Inability to handle the project's complexity Implementation
Sloppy development practices All
Poor project management All
Stakeholder politics Requirements
Commercial pressures Requirements

Risk Histogram

Omission vs. Commission

Risk Analysis
Let Prob (E) be the probability of a favorable outcome that can be any one of m events. The risk of E happening is:
Prob (E) = m/n,Where m is the number of favorable events
n is the total number of possible events.
Let RE be the risk exposure. RE = Prob (E not happening) x Loss = [1-Prob (E)] x Loss
Recall that the Win-Win Spiral Model makes a risk exposure evaluation for every cycle.

Uniform Loss
Uniform Loss = loss/day x (days late),
For a project employing 100 people,
Loss =[cost of retaining 100 people per day + daily project overhead + daily opportunity cost of savings or profits from this and other projects] [days late]
Loss vs. Time

Taguchi Loss
Loss (budget)=Max [incurred cost-budget]2, where
budget= (cost per day) (estimated days)Max = Maximum acceptable loss/ Maximum over budget
For a project employing 100 people,
Loss = Loss Budget) + [daily opportunity cost of savings or profits from this and other projects] [days late]
Loss vs. Time
Schedule Risks
Tight Schedules Estimation Errors Feature Creep

Gamma Function model for schedule slipsIEEE Software 9/97 pp 740-745
Prob. of delay
0.0005
0.0035

Estimation Accuracy International Software Benchmarking Standards Group 2000 project study
2000 projects completed within past decade 25% met both schedule and effort estimates 11% better than expected 40% met only one estimate 35% met neither estimate

Estimation Process
40% use only decomposition 15% use Function Points 30% use both 20% use estimation models 20% had dictated schedules

Ten deadly estimation sins
1. Confusing targets with estimates.2. Saying “yes” when you really mean “no.”3. Committing to estimates too early.4. Underestimating 5. Estimating in the “impossible zone”6. Overestimating savings from new tools or methods7. Using only one estimation technique8. Not using estimation software9. Not including risk impacts in estimates10. Providing off-the-cuff estimates
Specification for Development Plan
Project Feature List Development Process Size Estimates Staff Estimates Schedule Estimates Organization Gantt Chart

Architecture Reviews
These reviews have been around for at least 11 years/ 500+ reviews at AT&T and Lucent (SARB, Systems Architecture review Board)
Stresses architecture and evaluating it early in the project Architecture in this context is viewed as a solution to a
problem for a client and should cover a broad range from cost to client needs
After you establish an architecture:• Decide what and when to test• Establish success criteria• Make decisions based on your findings

Arch Review Payoff
Average review pays back 12 times its cost Reduced development effort and interval - finds
defects early and identifies risks Higher product quality and lower cost Company wide learning - annual report Yes, projects were canceled after reviews and the
attitude of the project team was often surprising

Contingency Planning
Contingency is the resources needed to reduce the probability of a risk to 0.2
Risk Reduction leverage (RE Lev) RE Lev = RE (nominal) – RE (at
contingency) (Risk reduction Cost)

Risk Exposure Sweet Spot

Boehm

Risk Heuristics
Unrealistic schedule is a common project risk. Schedule slip rates remain the same throughout a project
unless steps are taken to change the causes of slippage Contingency funding should bring the risk probability to
0.2 Periodically and quantitatively evaluate risks- project
meeting are the place to consider the ‘top-ten.’ Minimize risks by doing the hard part first. Human Interfaces and customer acceptance are major
risks to most projects.

Software Risk Analysis
• Identify• Communicate• Analyze• Plan • Track• Control

SEI risk assumptions
• Risks are often known but rarely discussed.• Management attitudes must be non-judgmental
and supportive so that controversial views can be heard
• Project success is not based solely on risk management

Analyze Risk
Probability of risk, USAF Handbook categories are very low, low, medium, high and very high
Impact of risk, USAF Handbook categories are negligible, marginal, critical and catastrophic
Risks are rarely independent A matrix is used to determine overall risk for different
categories (e.g., effort, performance, schedule, cost, support)

Sample Impact/Probability Matrix(used to calculate overall risk)
Components
Impact
Performance Support Cost Schedule Effort
Catastrophic H H M M L
Critical H H M L 0
Marginal M M L 0 0
Negligible M L L 0 0

Plan for the Risks
What can you do:
• Mitigate with contingency plans and triggers• Avoid the risk by changing something• Accept the risks and the consequences if it occurs• Study the risk further so that you can decide on one
of the above• Specify risk importance• Define data needed to track risk status• Define who is responsible for Risk Management and
what is the cost

Risk Tracking and Control
Use Action Item system Track status of risks and actions taken to address them Define Risk Exposure
RE = Prob(risk) x Cost(risk)
Review ten risks with highest RE at every project meeting

Software Risk Summary
Risk is the possibility that an undesirable event in the life of a software project can happen• Requires uncertainty and loss
Project Risk: cost, schedule, completion Technical Risk: feasibility, viability, etc. Business Risk: contractual compliance, payment, Legal Risk: damages, liability

Software Risk Mitigation Summary
Project Risk: cost, schedule, completion• Estimation, simplifications, staffing changes
Technical Risk: feasibility, viability, etc.• Prototyping, experimentation, invention, multiple path
Business Risk: contractual compliance, payment,• Contractual mitigation: time and materials,
Legal Risk: damages, liability• Limitations of liability, termination for convenience